Embed Size (px)
Citation preview
Piccinin, A.M., Muniz, G., Clouston, S., Reynolds, C.A., Thorvaldsson, V., Deary, I.J., Deeg, D., Johansson, B., Mackinnon, A., Spiro, A., Starr, J.M., Skoog, I., Hofer, S.M., (2012). Coordinated analysis of age, sex, and education effects on change in MMSE scores. Journals of Gerontology Series B: Psychological Sciences and Social Sciences, doi:10.1093/geronb/gbs077
© The Author 2012. Published by Oxford University Press on behalf of The Gerontological Society of America.All rights reserved. For permissions, please e-mail: [email protected] May 27, 2011; Accepted July 13, 2012Decision Editor: Robert West, PhD
Coordinated Analysis of Age, Sex, and Education Effects on Change in MMSE Scores
Andrea M. Piccinin,1 Graciela Muniz-Terrera,2 Sean Clouston,1 Chandra A. Reynolds,3 Valgeir Thorvaldsson,4 Ian J. Deary,5 Dorly J.H. Deeg,6 Boo Johansson,4 Andrew Mackinnon,7
Avron Spiro, III,8 John M. Starr,9 Ingmar Skoog,10 and Scott M. Hofer1
1Department of Psychology, University of Victoria, British Columbia, Canada. 2MRC Unit for Lifelong Health and Ageing, London.
3Department of Psychology, University of California, Riverside. 4Department of Psychology, University of Gothenburg, Sweden.
5Department of Psychology, University of Edinburgh. 6EMGO Institute for Health and Care Research, VU University Medical Centre/LASA, Amsterdam, The Netherlands.
7Centre for Youth Mental Health Research, University of Melbourne, Australia. 8Normative Aging Study, VA Boston Healthcare System, Boston, MA.
9Alzheimer Scotland Dementia Research Centre, University of Edinburgh. 10Neuropsychiatric Epidemiology, University of Gothenburg, Sweden.
Objectives. We describe and compare the expected performance trajectories of older adults on the Mini-Mental Status Examination (MMSE) across six independent studies from four countries in the context of a collaborative network of longitudinal studies of aging. A coordinated analysis approach is used to compare patterns of change conditional on sample composition differences related to age, sex, and education. Such coordination accelerates evaluation of particular hypotheses. In particular, we focus on the effect of educational attainment on cognitive decline.
Method. Regular and Tobit mixed models were fit to MMSE scores from each study separately. The effects of age, sex, and education were examined based on more than one centering point.
Results. Findings were relatively consistent across studies. On average, MMSE scores were lower for older individu-als and declined over time. Education predicted MMSE score, but, with two exceptions, was not associated with decline in MMSE over time.
Conclusion. A straightforward association between educational attainment and rate of cognitive decline was not sup-ported. Thoughtful consideration is needed when synthesizing evidence across studies, as methodologies adopted and sample characteristics, such as educational attainment, invariably differ.
Key Words: Cognitive— Coordinated Analysis— Education—Longitudinal—Mental Status Exam— Meta-analysis— Mixed Model.
ALTHOUGH the number of longitudinal studies of aging is rapidly growing, there are still few in existence rela-
tive to those with cross-sectional designs. Combined with the broad multidisciplinary range of research on aging and the complexity of longitudinal analyses, the ensuing litera-ture has been distributed in such a way that it is often dif-ficult to compare results and conclusions across published reports.
In response to this situation, the Integrative Analysis of Longitudinal Studies on Aging (IALSA) network (http://web.uvic.ca/~ilife) was established as an international collaborative of researchers, data, and methods focused on the simultaneous evaluation of longitudinal data. Of the more than 30 studies currently in the network, some offer public access data and most include direct involvement of the principal investigator. The network objective is to test new hypotheses (and settle old debates), with coordinated
replications, and to extend prior findings from both the cross-sectional and longitudinal literatures. Rather than pooling data to obtain a single result, the IALSA research process emphasizes replication of research and the comparability of results across samples (e.g., countries, birth cohorts, selection strategies), variables (within and across constructs), designs (e.g., length and spacing of follow-up), and analyses (Hofer & Piccinin, 2009, 2010; Piccinin & Hofer, 2008). This approach involves interactive development of the research protocol, with the aim of maximizing each study’s data value while enhancing the comparability of results across a variety of samples and designs. In addition to including the same predictors in the same analysis for each study, these predictors are centered at a common value across studies so that interpretation of the parameter estimates is conditional on the same level of the predictor (i.e., the “centercept”; Wainer, 2000). Centering
Page 1 of 17
at Goteborgs U
niversitet on October 3, 2012
http://psychsocgerontology.oxfordjournals.org/D
ownloaded from
of this type has attracted significant attention in multilevel models, due to their necessary involvement in interaction terms (Enders & Tofighi, 2007). Thorough reporting of results permits direct comparison across studies and variations in models.
An underlying goal of this article is to report initial proof-of-concept work to demonstrate implementation of the coordinated approach described in Hofer and Piccinin (2009). Although not ideal as a measure of cognitive function, the Folstein Mini-Mental Status Examination (MMSE; Folstein, Folstein, & McHugh, 1975) was chosen for this initial analysis because it is available in many of the IALSA-affiliated studies. A small number of additional measures are relatively common across studies, but much of the coordination will occur at the construct level, which will be demonstrated in a subsequent article.
Given the MMSE’s status as a screening measure, it has been used in both clinical and research settings, includ-ing longitudinal evaluation of cognitive change. Its wide-spread use facilitates comparability across studies and can provide a consistent proxy indicator for dementia when formal diagnostic information is not available. Since diag-nosis of dementia is predicated on decline in functioning from a previous level, there is substantial interest in the extent to which MMSE scores decline in older adults, and particularly whether individuals with fewer years of formal education are likely to decline more rapidly (e.g., Muniz-Terrera et al., 2009). In a study of normative cogni-tive aging, it would be reasonable to expect little decline on this measure—between the maximum score of 30 and around Folstein’s suggested cutoff of 24 to indicate impair-ment—and for those of above-average ability declines may be obscured by ceiling effects, which we address with a Tobit model, described later.
Analysis of Change in the MMSEGiven recent interest in cognitive reserve (Stern, 2002,
2009), a second goal is to address, using similar methods and covariates in multiple studies, the question of whether education is related to rate of decline in cognitive function, as measured by the MMSE. Extensive discussions of longi-tudinal research on cognitive reserve based on other meas-ures of cognition are available elsewhere (e.g., Christensen et al., 2007; Tucker-Drob, Johnson & Jones, 2009; Zahodne et al., 2011).
In their review addressing the effect of a number of predictors, including education, on cognitive change, Anstey and Christensen (2000) point to difficulties in making direct comparisons across studies, due to the use of different designs, measures, and methods of analysis, but report that education generally appears to protect against declines in mental status scores over time despite the fact that mental status measures are not intended to measure cognitive function at the upper end of the distribution. Except for Jacqmin-Gadda, Fabrigoule, Commenges, and
Dartigues (1997), however, reports from prior to 2006 modeled change in MMSE over only two occasions. In addition, many of these adjusted for baseline cognitive status, a practice that can seriously bias results (Glymour, Weuve, Berkman, Kawachi, & Robins, 2005). More recent publications, employing growth models based on 3–5 occasions of measurement have, with some exceptions (Muniz-Terrera, Brayne, & Matthews, 2010; Wilson et al., 2009), more often found that change in MMSE is not related to education (Muniz-Terrera et al., 2009; Laukka, MacDonald, & Bäckman, 2006; Van Dijk, Van Gerven, Van Boxtel, Van der Elst, & Jolles, 2008).
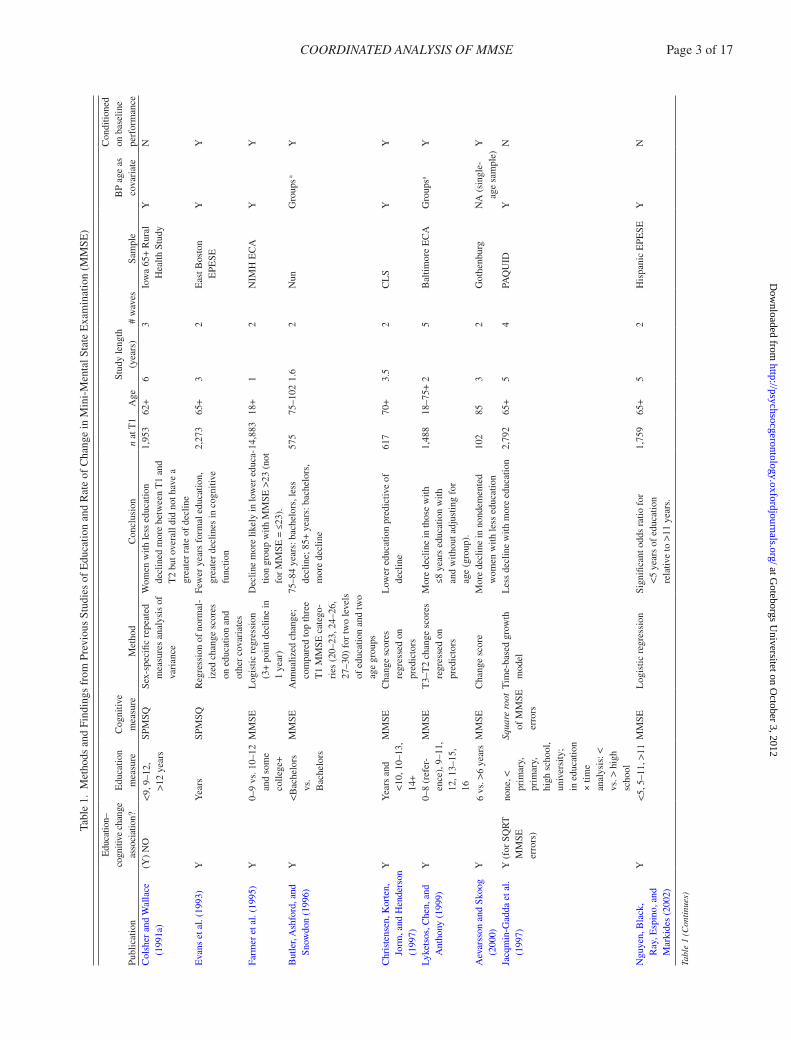
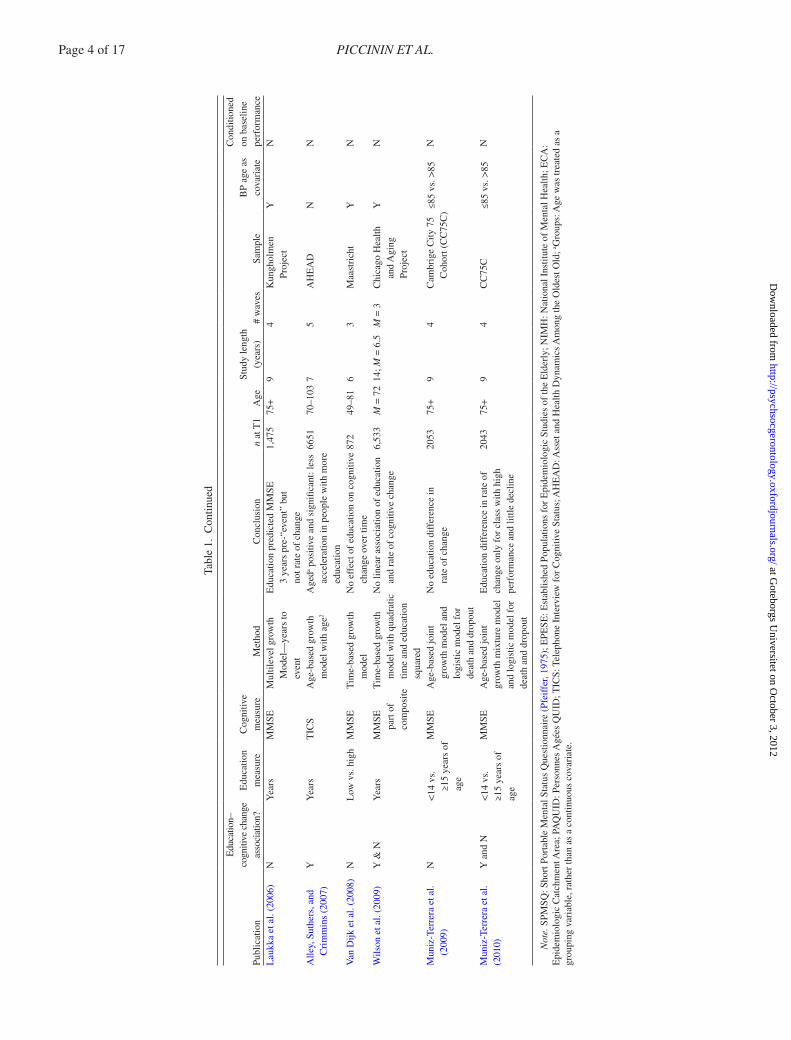
Table 1 lists details regarding previous studies address-ing the association between education and MMSE perfor-mance. As with the publications reviewed by Anstey and Christensen (2000), it is worth considering implementation differences in these models.
One characteristic of most gerontological research is a heterogeneous initial age range. As a result, informa-tion is available on both (cross-sectional) age differences between persons and (longitudinal) age changes within persons. Depending on the type of analysis used, estimates of average change in scores over time may be confounded by this baseline age heterogeneity. To focus on longitudi-nal changes, it is essential that initial between-person (BP) age differences are accounted for. This can be accomplished by including baseline age as a covariate of both the inter-cept and the slope of the estimated outcome trajectories. Different BP and within-person (WP) slopes are expected, and can result from cohort differences and population selec-tion and mortality. The older individuals in a sample are no longer representative of the entire birth cohort from which they originate but are an increasingly select subset of survi-vors (Hofer & Sliwinski, 2006). This is a key methodologi-cal issue in the developmental aging literature. In addition to demonstrating the feasibility and utility of coordinated analysis and evaluating the association between education and change in MMSE, a third goal of this article is, there-fore, to explicitly evaluate the similarity of initial BP age differences and subsequent WP age changes (Sliwinski, Hoffman, & Hofer, 2010).
Another feature complicating research is the inclusion of different predictors in the various reports in the litera-ture. Reported associations between education and change in MMSE represent values conditional on the included covariates. To the extent that these additional covariates are correlated with the predictors of interest, the meanings of parameter estimates from models containing different sets of covariates are not necessarily comparable.
In addition, different model specifications produce differ-ent conditional estimates of change in MMSE and associa-tions of this change with covariates such as education. For example, Van Dijk and colleagues (2008) found a nonsignifi-cant linear rate of change in MMSE over 6 years in a linear mixed-model analysis of three waves of data with a time in
Page 2 of 17 PICCININ ET AL.
at Goteborgs U
niversitet on October 3, 2012
http://psychsocgerontology.oxfordjournals.org/D
ownloaded from
Tabl
e 1.
Met
hods
and
Fin
ding
s fr
om P
revi
ous
Stud
ies
of E
duca
tion
and
Rat
e of
Cha
nge
in M
ini-
Men
tal S
tate
Exa
min
atio
n (M
MSE
)
Publ
icat
ion
Edu
catio
n–co
gniti
ve c
hang
e as
soci
atio
n?E
duca
tion
mea
sure
Cog
nitiv
e m
easu
reM
etho
dC
oncl
usio
nn
at T
1A
geSt
udy
leng
th
(yea
rs)
# w
aves
Sam
ple
BP
age
as
cova
riat
e
Con
ditio
ned
on b
asel
ine
perf
orm
ance
Col
sher
and
Wal
lace
(1
991a
)(Y
) N
O<9
, 9–1
2,
>12
year
s
SPM
SQSe
x-sp
ecifi
c re
peat
ed
mea
sure
s an
alys
is o
f va
rian
ce
Wom
en w
ith le
ss e
duca
tion
decl
ined
mor
e be
twee
n T
1 an
d T
2 bu
t ove
rall
did
not h
ave
a gr
eate
r ra
te o
f de
clin
e
1,95
362
+6
3Io
wa
65+
Rur
al
Hea
lth S
tudy
YN
Eva
ns e
t al.
(199
3)Y
Yea
rsSP
MSQ
Reg
ress
ion
of n
orm
al-
ized
cha
nge
scor
es
on e
duca
tion
and
othe
r co
vari
ates
Few
er y
ears
for
mal
edu
catio
n,
grea
ter
decl
ines
in c
ogni
tive
func
tion
2,27
365
+3
2E
ast B
osto
n
EPE
SEY
Y
Farm
er e
t al.
(199
5)Y
0–9
vs. 1
0–12
an
d so
me
colle
ge+
MM
SEL
ogis
tic r
egre
ssio
n (3
+ p
oint
dec
line
in
1 ye
ar)
Dec
line
mor
e lik
ely
in lo
wer
edu
ca-
tion
grou
p w
ith M
MSE
>23
(no
t fo
r M
MSE
= ≤
23).
14,8
8318
+1
2N
IMH
EC
AY
Y
But
ler,
Ash
ford
, and
Sn
owdo
n (1
996)
Y<B
ache
lors
vs
. B
ache
lors
MM
SEA
nnua
lized
cha
nge;
co
mpa
red
top
thre
e T
1 M
MSE
cat
ego-
ries
(20
–23,
24–
26,
27–3
0) f
or tw
o le
vels
of
edu
catio
n an
d tw
o ag
e gr
oups
75–8
4 ye
ars:
bac
helo
rs, l
ess
decl
ine;
85+
yea
rs: b
ache
lors
, m
ore
decl
ine
575
75–1
021.
62
Nun
Gro
ups a
Y
Chr
iste
nsen
, Kor
ten,
Jo
rm, a
nd H
ende
rson
(1
997)
YY
ears
and
<1
0, 1
0–13
, 14
+
MM
SEC
hang
e sc
ores
re
gres
sed
on
pred
icto
rs
Low
er e
duca
tion
pred
ictiv
e of
de
clin
e61
770
+3.
52
CL
SY
Y
Lyke
tsos
, Che
n, a
nd
Ant
hony
(19
99)
Y0–
8 (r
efer
-en
ce),
9–1
1,
12, 1
3–15
, 16
MM
SET
3–T
2 ch
ange
sco
res
regr
esse
d on
pr
edic
tors
Mor
e de
clin
e in
thos
e w
ith
≤8 y
ears
edu
catio
n w
ith
and
with
out a
djus
ting
for
ag
e (g
roup
).
1,48
818
–75+
25
Bal
timor
e E
CA
Gro
upsa
Y
Aev
arss
on a
nd S
koog
(2
000)
Y6
vs. >
6 ye
ars
MM
SEC
hang
e sc
ore
Mor
e de
clin
e in
non
dem
ente
d w
omen
with
less
edu
catio
n10
285
32
Got
henb
urg
NA
(si
ngle
- ag
e sa
mpl
e)Y
Jacq
min
-Gad
da e
t al.
(199
7)Y
(fo
r SQ
RT
M
MSE
er
rors
)
none
, <
prim
ary,
pr
imar
y,
high
sch
ool,
univ
ersi
ty;
in e
duca
tion
× tim
e an
alys
is: <
vs
. > h
igh
scho
ol
Squa
re r
oot
of M
MSE
er
rors
Tim
e-ba
sed
grow
th
mod
elL
ess
decl
ine
with
mor
e ed
ucat
ion
2,79
265
+5
4PA
QU
IDY
N
Ngu
yen,
Bla
ck,
Ray
, Esp
ino,
and
M
arki
des
(200
2)
Y<5
, 5–1
1, >
11M
MSE
Log
istic
reg
ress
ion
Sign
ifica
nt o
dds
ratio
for
<5
yea
rs o
f ed
ucat
ion
re
lativ
e to
>11
yea
rs.
1,75
965
+5
2H
ispa
nic
EPE
SEY
N
Tabl
e 1
(Con
tinu
es)
COORDINATED ANALYSIS OF MMSE Page 3 of 17
at Goteborgs U
niversitet on October 3, 2012
http://psychsocgerontology.oxfordjournals.org/D
ownloaded from
Publ
icat
ion
Edu
catio
n–co
gniti
ve c
hang
e as
soci
atio
n?E
duca
tion
mea
sure
Cog
nitiv
e m
easu
reM
etho
dC
oncl
usio
nn
at T
1A
geSt
udy
leng
th
(yea
rs)
# w
aves
Sam
ple
BP
age
as
cova
riat
e
Con
ditio
ned
on b
asel
ine
perf
orm
ance
Lau
kka
et a
l. (2
006)
NY
ears
MM
SEM
ultil
evel
gro
wth
M
odel
—ye
ars
to
even
t
Edu
catio
n pr
edic
ted
MM
SE
3 ye
ars
pre-
“eve
nt”
but
not r
ate
of c
hang
e
1,47
575
+9
4K
ungh
olm
en
Proj
ect
YN
Alle
y, S
uthe
rs, a
nd
Cri
mm
ins
(200
7)Y
Yea
rsT
ICS
Age
-bas
ed g
row
th
mod
el w
ith a
ge2
Age
da pos
itive
and
sig
nific
ant:
less
ac
cele
ratio
n in
peo
ple
with
mor
e ed
ucat
ion
6651
70–1
037
5A
HE
AD
NN
Van
Dijk
et a
l. (2
008)
NL
ow v
s. h
igh
MM
SET
ime-
base
d gr
owth
m
odel
No
effe
ct o
f ed
ucat
ion
on c
ogni
tive
chan
ge o
ver
time
872
49–8
16
3M
aast
rich
t Y
N
Wils
on e
t al.
(200
9)Y
& N
Yea
rsM
MSE
pa
rt o
f co
mpo
site
Tim
e-ba
sed
grow
th
mod
el w
ith q
uadr
atic
tim
e an
d ed
ucat
ion
squa
red
No
linea
r as
soci
atio
n of
edu
catio
n an
d ra
te o
f co
gniti
ve c
hang
e6,
533
M =
72
14; M
= 6
.5M
= 3
Chi
cago
Hea
lth
and
Agi
ng
Proj
ect
YN
Mun
iz-T
erre
ra e
t al.
(200
9)N
<14
vs.
≥15
year
s of
ag
e
MM
SEA
ge-b
ased
join
t gr
owth
mod
el a
nd
logi
stic
mod
el f
or
deat
h an
d dr
opou
t
No
educ
atio
n di
ffer
ence
in
rate
of
chan
ge20
5375
+9
4C
ambr
ige
City
75
Coh
ort (
CC
75C
)≤8
5 vs
. >85
N
Mun
iz-T
erre
ra e
t al.
(201
0)Y
and
N<1
4 vs
. ≥1
5 ye
ars
of
age
MM
SEA
ge-b
ased
join
t gr
owth
mix
ture
mod
el
and
logi
stic
mod
el f
or
deat
h an
d dr
opou
t
Edu
catio
n di
ffer
ence
in r
ate
of
chan
ge o
nly
for
clas
s w
ith h
igh
perf
orm
ance
and
littl
e de
clin
e
2043
75+
94
CC
75C
≤85
vs. >
85N
Not
e. S
PMSQ
: Sho
rt P
orta
ble
Men
tal S
tatu
s Q
uest
ionn
aire
(Pf
eiff
er, 1
975)
; EPE
SE: E
stab
lishe
d Po
pula
tions
for
Epi
dem
iolo
gic
Stud
ies
of th
e E
lder
ly; N
IMH
: Nat
iona
l Ins
titut
e of
Men
tal H
ealth
; EC
A:
Epi
dem
iolo
gic
Cat
chm
ent A
rea;
PA
QU
ID: P
erso
nnes
Agé
es Q
UID
; TIC
S: T
elep
hone
Int
ervi
ew f
or C
ogni
tive
Stat
us; A
HE
AD
: Ass
et a
nd H
ealth
Dyn
amic
s A
mon
g th
e O
ldes
t Old
; a Gro
ups:
Age
was
trea
ted
as a
gr
oupi
ng v
aria
ble,
rat
her
than
as
a co
ntin
uous
cov
aria
te.
Tabl
e 1.
Con
tinue
d
Page 4 of 17 PICCININ ET AL.
at Goteborgs U
niversitet on October 3, 2012
http://psychsocgerontology.oxfordjournals.org/D
ownloaded from
study metric and age, sex, education, and indices of mental and physical health as covariates. They also reported a nonsig-nificant education by (linear) time interaction and concluded that education did not protect against cognitive decline in the MMSE. Both of these findings (no decline and no association with education), however, must be interpreted in the context of a (nonsignificant) quadratic time term that was included in the model: they are based on relations with the instantaneous rate of change at baseline, rather than an index of the overall rate of change during the data collection period.
It is relevant to consider that, as a screening measure, the purpose of the MMSE is to identify individuals with cog-nitive impairment, and so it contains items focused at the lower end of cognitive function. A score of 30/30, therefore, should be attainable by any nonimpaired adult of average intelligence across most of the lifespan (Colsher & Wallace, 1991b). As a result, true cognitive ability for a large por-tion of a population is at a level above the ceiling for this measure, and the earliest stages of a dementing illness are inevitably hidden for these individuals. This may relate to the findings of faster decline in demented individuals with higher education (e.g., Farmer, Kittner, Rae, Bartko, & Regier, 1995; Geerlings et al., 2000; Hall et al., 2007). By the time the MMSE registers decline in these individuals (i.e., their scores have dropped below the maximum score of 30), they may be much farther along in the dementia process. This has led to attempts to develop MMSE-based tests with a higher ceiling (e.g., the CAMCOG [Roth et al., 1986] and 3MS [Teng & Chui, 1987]).
In studying rate of change in MMSE over time, it is advisable to address the fact that some individuals exceed the ceiling of the test. One strategy for dealing with this artifact may be a recently described Tobit growth curve model (Glymour et al., 2005; Wang, Zhang, McArdle, & Salthouse, 2008), designed to address the analysis of cen-sored data. This may, in particular, be relevant to estima-tion of the association of education with cognitive change, which may have been underestimated due to ceiling effects.
Given the differences in modeling strategies, includ-ing baseline adjustment and choice of covariates across
published results, it is difficult to determine whether pre-vious results are consistent. Implementing a common ana-lytic protocol across studies from the Integrative Analysis of Longitudinal Studies on Aging (Hofer & Piccinin, 2009) network, this article compares associations between educa-tion and change in MMSE across six studies, adjusting for ceiling effects, and obtaining parameter estimates based on the same model and covariates.
Method
SamplesFor the current set of analyses, participating studies from
the IALSA network are the Canberra Longitudinal Study (CLS), the Gerontological and Geriatric Population Studies in Gothenburg, Sweden (H-70), The Healthy Older Person Edinburgh (HOPE), the Origins of Variance in the Oldest-Old (OCTO-Twin) study, the Longitudinal Aging Study Amsterdam (LASA), and the Swedish Adoption/Twin Study of Aging (SATSA). Geographically, one is Australian, three Swedish, one Dutch, and one British.
These studies were mainly initiated in the early 1990s except for SATSA, initiated in 1984, and H-70, started in 1971, but in which MMSE collection did not begin until 1986 (MMSE was not yet published in 1971). Age differ-ences across the samples, therefore, mainly represent cohort differences, and period differences might be minimal.
H-70 has both the oldest (age 85) and earliest measured (1986) sample, representing the 1901–1902 birth cohort. Within sample, birth cohort differences also exist (except for H-70, which is single aged), and these range mainly from 1901 to 1936. OCTO-Twin and H-70 samples are the oldest and also have the lowest median education level. SATSA, also Swedish, has the youngest sample, on aver-age, but an education distribution similar to OCTO-Twin and H-70.
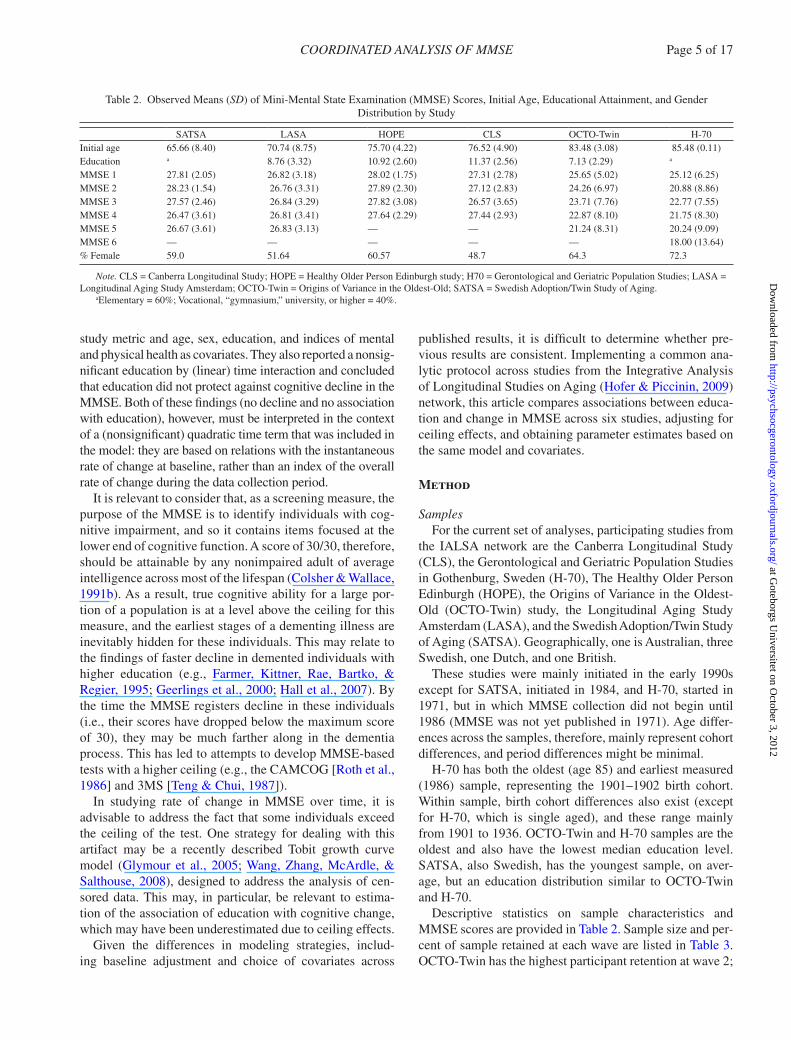
Descriptive statistics on sample characteristics and MMSE scores are provided in Table 2. Sample size and per-cent of sample retained at each wave are listed in Table 3. OCTO-Twin has the highest participant retention at wave 2;
Table 2. Observed Means (SD) of Mini-Mental State Examination (MMSE) Scores, Initial Age, Educational Attainment, and Gender Distribution by Study
SATSA LASA HOPE CLS OCTO-Twin H-70Initial age 65.66 (8.40) 70.74 (8.75) 75.70 (4.22) 76.52 (4.90) 83.48 (3.08) 85.48 (0.11)Education a 8.76 (3.32) 10.92 (2.60) 11.37 (2.56) 7.13 (2.29) a
MMSE 1 27.81 (2.05) 26.82 (3.18) 28.02 (1.75) 27.31 (2.78) 25.65 (5.02) 25.12 (6.25)MMSE 2 28.23 (1.54) 26.76 (3.31) 27.89 (2.30) 27.12 (2.83) 24.26 (6.97) 20.88 (8.86)MMSE 3 27.57 (2.46) 26.84 (3.29) 27.82 (3.08) 26.57 (3.65) 23.71 (7.76) 22.77 (7.55)MMSE 4 26.47 (3.61) 26.81 (3.41) 27.64 (2.29) 27.44 (2.93) 22.87 (8.10) 21.75 (8.30)MMSE 5 26.67 (3.61) 26.83 (3.13) — — 21.24 (8.31) 20.24 (9.09)MMSE 6 — — — — — 18.00 (13.64)% Female 59.0 51.64 60.57 48.7 64.3 72.3
Note. CLS = Canberra Longitudinal Study; HOPE = Healthy Older Person Edinburgh study; H70 = Gerontological and Geriatric Population Studies; LASA = Longitudinal Aging Study Amsterdam; OCTO-Twin = Origins of Variance in the Oldest-Old; SATSA = Swedish Adoption/Twin Study of Aging.
aElementary = 60%; Vocational, “gymnasium,” university, or higher = 40%.
COORDINATED ANALYSIS OF MMSE Page 5 of 17
at Goteborgs U
niversitet on October 3, 2012
http://psychsocgerontology.oxfordjournals.org/D
ownloaded from
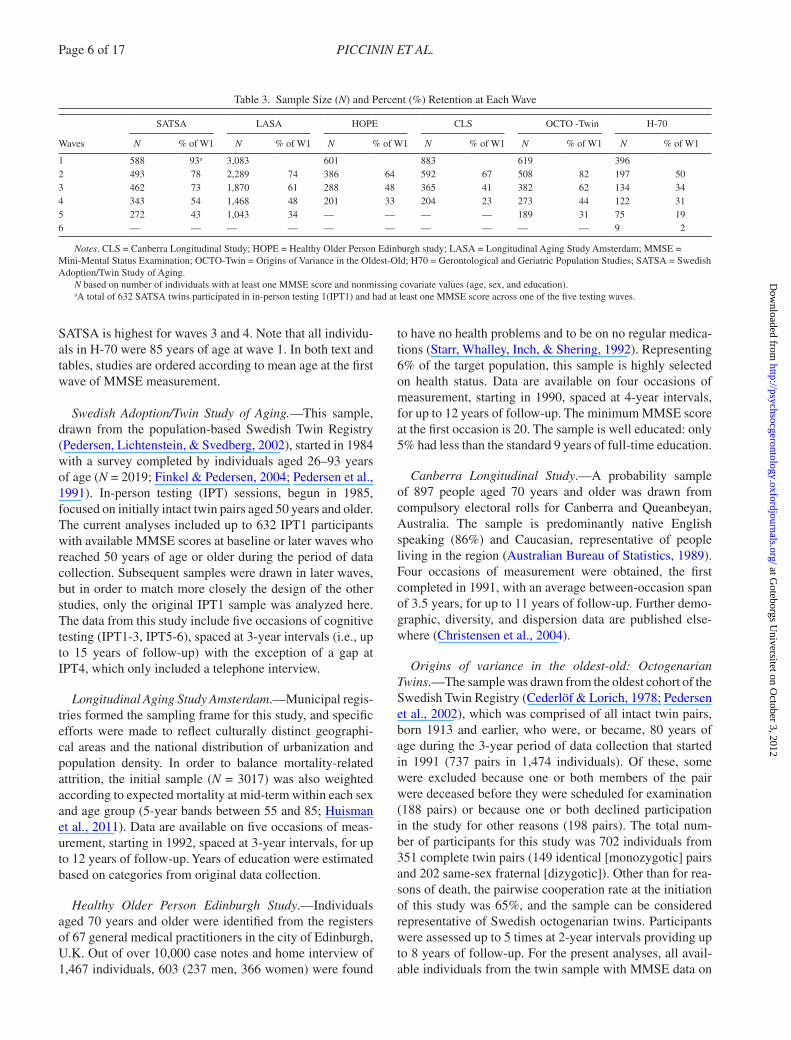
SATSA is highest for waves 3 and 4. Note that all individu-als in H-70 were 85 years of age at wave 1. In both text and tables, studies are ordered according to mean age at the first wave of MMSE measurement.
Swedish Adoption/Twin Study of Aging.—This sample, drawn from the population-based Swedish Twin Registry (Pedersen, Lichtenstein, & Svedberg, 2002), started in 1984 with a survey completed by individuals aged 26–93 years of age (N = 2019; Finkel & Pedersen, 2004; Pedersen et al., 1991). In-person testing (IPT) sessions, begun in 1985, focused on initially intact twin pairs aged 50 years and older. The current analyses included up to 632 IPT1 participants with available MMSE scores at baseline or later waves who reached 50 years of age or older during the period of data collection. Subsequent samples were drawn in later waves, but in order to match more closely the design of the other studies, only the original IPT1 sample was analyzed here. The data from this study include five occasions of cognitive testing (IPT1-3, IPT5-6), spaced at 3-year intervals (i.e., up to 15 years of follow-up) with the exception of a gap at IPT4, which only included a telephone interview.
Longitudinal Aging Study Amsterdam.—Municipal regis-tries formed the sampling frame for this study, and specific efforts were made to reflect culturally distinct geographi-cal areas and the national distribution of urbanization and population density. In order to balance mortality-related attrition, the initial sample (N = 3017) was also weighted according to expected mortality at mid-term within each sex and age group (5-year bands between 55 and 85; Huisman et al., 2011). Data are available on five occasions of meas-urement, starting in 1992, spaced at 3-year intervals, for up to 12 years of follow-up. Years of education were estimated based on categories from original data collection.
Healthy Older Person Edinburgh Study.—Individuals aged 70 years and older were identified from the registers of 67 general medical practitioners in the city of Edinburgh, U.K. Out of over 10,000 case notes and home interview of 1,467 individuals, 603 (237 men, 366 women) were found
to have no health problems and to be on no regular medica-tions (Starr, Whalley, Inch, & Shering, 1992). Representing 6% of the target population, this sample is highly selected on health status. Data are available on four occasions of measurement, starting in 1990, spaced at 4-year intervals, for up to 12 years of follow-up. The minimum MMSE score at the first occasion is 20. The sample is well educated: only 5% had less than the standard 9 years of full-time education.
Canberra Longitudinal Study.—A probability sample of 897 people aged 70 years and older was drawn from compulsory electoral rolls for Canberra and Queanbeyan, Australia. The sample is predominantly native English speaking (86%) and Caucasian, representative of people living in the region (Australian Bureau of Statistics, 1989). Four occasions of measurement were obtained, the first completed in 1991, with an average between-occasion span of 3.5 years, for up to 11 years of follow-up. Further demo-graphic, diversity, and dispersion data are published else-where (Christensen et al., 2004).
Origins of variance in the oldest-old: Octogenarian Twins.—The sample was drawn from the oldest cohort of the Swedish Twin Registry (Cederlöf & Lorich, 1978; Pedersen et al., 2002), which was comprised of all intact twin pairs, born 1913 and earlier, who were, or became, 80 years of age during the 3-year period of data collection that started in 1991 (737 pairs in 1,474 individuals). Of these, some were excluded because one or both members of the pair were deceased before they were scheduled for examination (188 pairs) or because one or both declined participation in the study for other reasons (198 pairs). The total num-ber of participants for this study was 702 individuals from 351 complete twin pairs (149 identical [monozygotic] pairs and 202 same-sex fraternal [dizygotic]). Other than for rea-sons of death, the pairwise cooperation rate at the initiation of this study was 65%, and the sample can be considered representative of Swedish octogenarian twins. Participants were assessed up to 5 times at 2-year intervals providing up to 8 years of follow-up. For the present analyses, all avail-able individuals from the twin sample with MMSE data on
Table 3. Sample Size (N) and Percent (%) Retention at Each Wave
Waves
SATSA LASA HOPE CLS OCTO -Twin H-70
N % of W1 N % of W1 N % of W1 N % of W1 N % of W1 N % of W1
1 588 93a 3,083 601 883 619 3962 493 78 2,289 74 386 64 592 67 508 82 197 503 462 73 1,870 61 288 48 365 41 382 62 134 344 343 54 1,468 48 201 33 204 23 273 44 122 315 272 43 1,043 34 — — — — 189 31 75 196 — — — — — — — — — — 9 2
Notes. CLS = Canberra Longitudinal Study; HOPE = Healthy Older Person Edinburgh study; LASA = Longitudinal Aging Study Amsterdam; MMSE = Mini-Mental Status Examination; OCTO-Twin = Origins of Variance in the Oldest-Old; H70 = Gerontological and Geriatric Population Studies; SATSA = Swedish Adoption/Twin Study of Aging.
N based on number of individuals with at least one MMSE score and nonmissing covariate values (age, sex, and education).aA total of 632 SATSA twins participated in in-person testing 1(IPT1) and had at least one MMSE score across one of the five testing waves.
Page 6 of 17 PICCININ ET AL.
at Goteborgs U
niversitet on October 3, 2012
http://psychsocgerontology.oxfordjournals.org/D
ownloaded from
one or more occasions were included. Substantial efforts were made to retain demented and dementing individuals in this sample.
Gerontological and Geriatric Population Studies in Gothenburg (H-70).—A representative sample of individu-als aged 70 years (both community residing and institution-alized, born July 1, 1901 through June 30, 1902), living and registered for census purposes in Gothenburg, Sweden, was recruited in 1971 (85% response rate; Rinder, Roupe, Steen, & Svanborg, 1975; Svanborg, 1977). A second rep-resentative sample of the same cohort was added in 1986 (Skoog, Nilsson, Palmertz, Andreasson, & Svanborg, 1993) and since that date both samples have been examined at 2- or 3-year intervals (earlier intervals were either 2, 3, or 5 years). MMSE administration began on a systematic sub-sample in 1986, when all participants were 85 years of age (Aevarsson & Skoog, 2000). The current analyses include 396 individuals. Data are available for up to six waves, however, N = 9 at the sixth wave of MMSE data collection, as this wave represents 99 years of age for this cohort. The average age of death was 91.93 (SD = 3.93).
MeasuresMMSE (Folstein et al., 1975) is a measure of global
mental status consisting of 11 (mainly multipart) questions
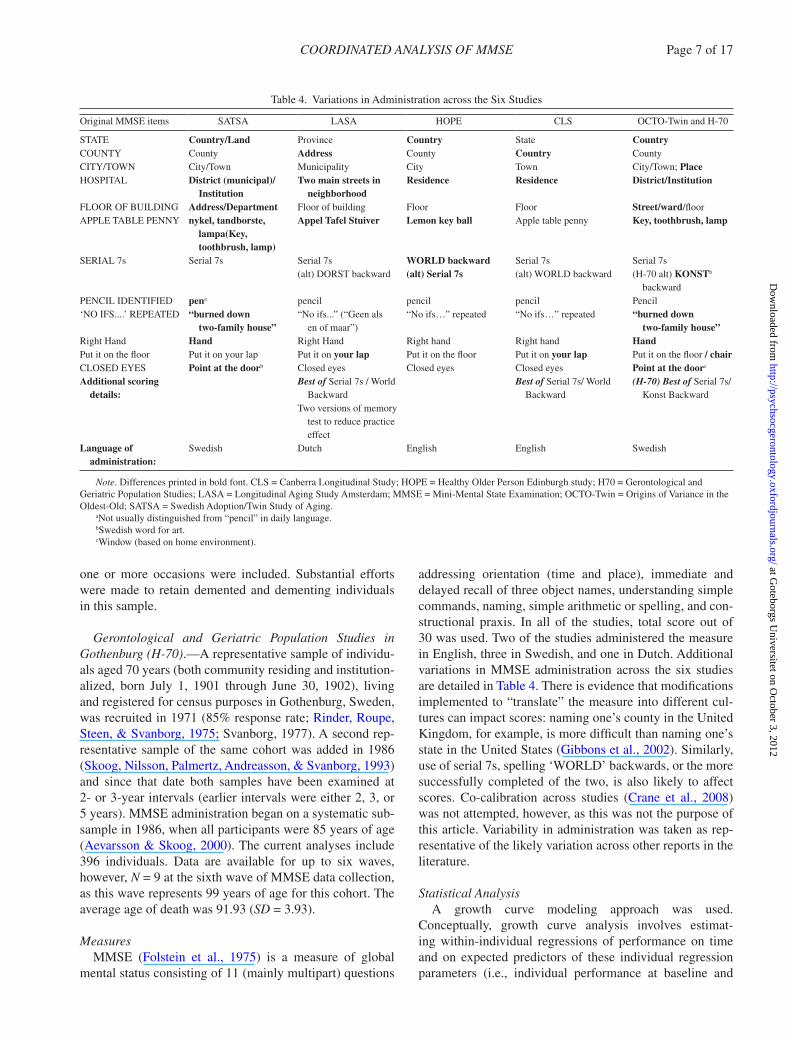
addressing orientation (time and place), immediate and delayed recall of three object names, understanding simple commands, naming, simple arithmetic or spelling, and con-structional praxis. In all of the studies, total score out of 30 was used. Two of the studies administered the measure in English, three in Swedish, and one in Dutch. Additional variations in MMSE administration across the six studies are detailed in Table 4. There is evidence that modifications implemented to “translate” the measure into different cul-tures can impact scores: naming one’s county in the United Kingdom, for example, is more difficult than naming one’s state in the United States (Gibbons et al., 2002). Similarly, use of serial 7s, spelling ‘WORLD’ backwards, or the more successfully completed of the two, is also likely to affect scores. Co-calibration across studies (Crane et al., 2008) was not attempted, however, as this was not the purpose of this article. Variability in administration was taken as rep-resentative of the likely variation across other reports in the literature.
Statistical AnalysisA growth curve modeling approach was used.
Conceptually, growth curve analysis involves estimat-ing within-individual regressions of performance on time and on expected predictors of these individual regression parameters (i.e., individual performance at baseline and
Table 4. Variations in Administration across the Six Studies
Original MMSE items SATSA LASA HOPE CLS OCTO-Twin and H-70
STATE Country/Land Province Country State CountryCOUNTY County Address County Country CountyCITY/TOWN City/Town Municipality City Town City/Town; PlaceHOSPITAL District (municipal)/
InstitutionTwo main streets in
neighborhoodResidence Residence District/Institution
FLOOR OF BUILDING Address/Department Floor of building Floor Floor Street/ward/floorAPPLE TABLE PENNY nykel, tandborste,
lampa(Key, toothbrush, lamp)
Appel Tafel Stuiver Lemon key ball Apple table penny Key, toothbrush, lamp
SERIAL 7s Serial 7s Serial 7s WORLD backward Serial 7s Serial 7s(alt) DORST backward (alt) Serial 7s (alt) WORLD backward (H-70 alt) KONSTb
backwardPENCIL IDENTIFIED pena pencil pencil pencil Pencil‘NO IFS....’ REPEATED “burned down
two-family house”“No ifs...” (“Geen als
en of maar”)“No ifs…” repeated “No ifs…” repeated “burned down
two-family house”Right Hand Hand Right Hand Right hand Right hand HandPut it on the floor Put it on your lap Put it on your lap Put it on the floor Put it on your lap Put it on the floor / chairCLOSED EYES Point at the doorb Closed eyes Closed eyes Closed eyes Point at the doorc
Additional scoring details:
Best of Serial 7s / World Backward
Best of Serial 7s/ World Backward
(H-70) Best of Serial 7s/ Konst Backward
Two versions of memory test to reduce practice effect
Language of administration:
Swedish Dutch English English Swedish
Note. Differences printed in bold font. CLS = Canberra Longitudinal Study; HOPE = Healthy Older Person Edinburgh study; H70 = Gerontological and Geriatric Population Studies; LASA = Longitudinal Aging Study Amsterdam; MMSE = Mini-Mental State Examination; OCTO-Twin = Origins of Variance in the Oldest-Old; SATSA = Swedish Adoption/Twin Study of Aging.
aNot usually distinguished from “pencil” in daily language.bSwedish word for art.cWindow (based on home environment).
COORDINATED ANALYSIS OF MMSE Page 7 of 17
at Goteborgs U
niversitet on October 3, 2012
http://psychsocgerontology.oxfordjournals.org/D
ownloaded from
change over time). All models were estimated using Mplus (version 5.21; Muthén & Muthén, 2009).
Time was specified as “individual specific time since base-line,” and baseline age was included as a covariate to clearly separate the effects of age (BP age differences) and time (WP age changes; Ware, 1985). All covariates were incorpo-rated for both level (intercept) and linear slope regressions using simultaneous entry. For each study, in addition to the unconditional model, a model regressing longitudinal trajec-tory intercept and linear slope on main effects of baseline age, sex, and education and a model adding interaction terms among these three covariates were estimated. Specifically, the conditional model fit to the data was
Y age sex educ u
age sex
it i i i i
i i
= + + + +( )+ + +
α β β β
α β β
00 00
01
02
0
11 10
11 ++ +( ) +β1
21educ u Timei i it itε .
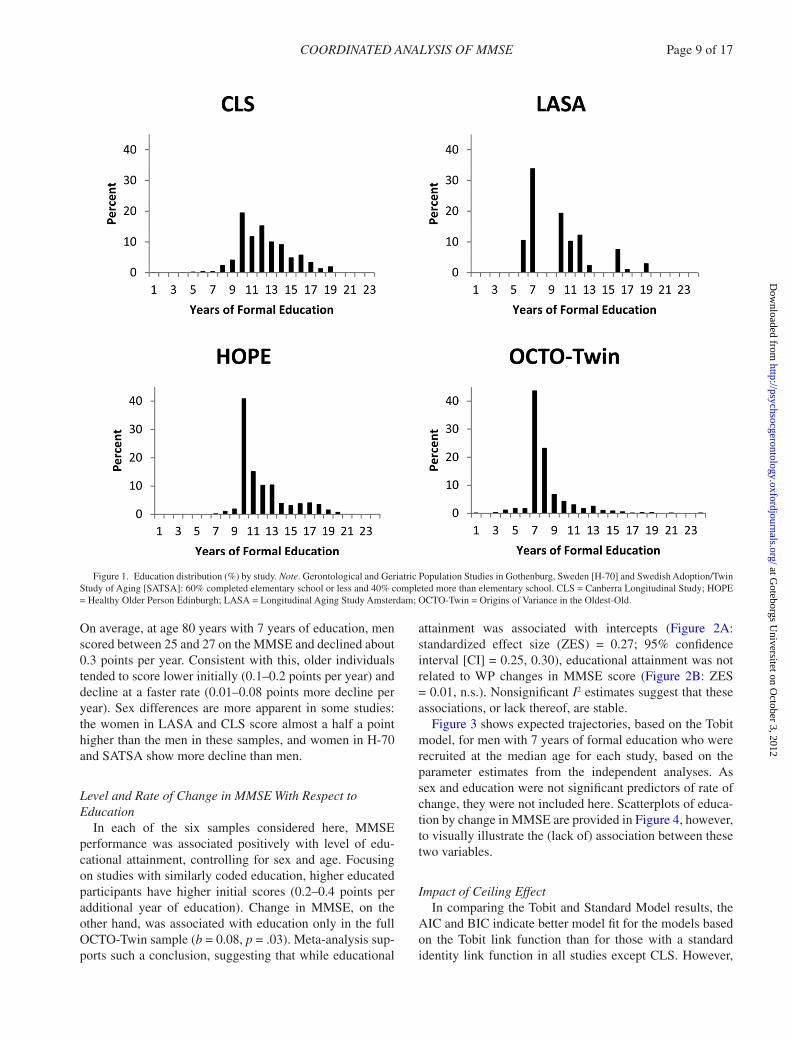
Coding of education variable.—There were marked country and birth cohort differences in educational attain-ment. In the HOPE sample, 9 years of education was the median value, as many people left school at age 14. In the Swedish studies with older birth cohorts (e.g., H-70, OCTO-Twin, SATSA), it was common for young people to get only the basic 6 years of “folkskola.” LASA study participants also had a median of 6 years of education. CLS, consisting largely of public servants in the capital region of Canberra in the mid-1900s, had a median education of 11 years.
Other population comparison studies (Huisman et al., 2004) have categorized education into low, middle, and high following the conventions described by the International Standard Classification of Education (ISCED; UNESCO, 1997). These categories correspond to ISCED 0–2 (prep-rimary, primary, and lower secondary education), 3 (upper secondary education), and 4–6 (postsecondary education). However, this classification standard was developed for comparing current educational attainment and does not map as directly on to the educational systems for birth cohorts ranging from the early 1900s to the mid-1930s. Considering the median and range for each study, the approach here was to code education as a continuous variable, with the excep-tion of H-70 (already coded 6 vs. >6 years) and SATSA (with four categories, rescored to match H-70). Mean edu-cation is reported in Table 2, and Figure 1 contains the distribution of education for the studies with education measured in years.
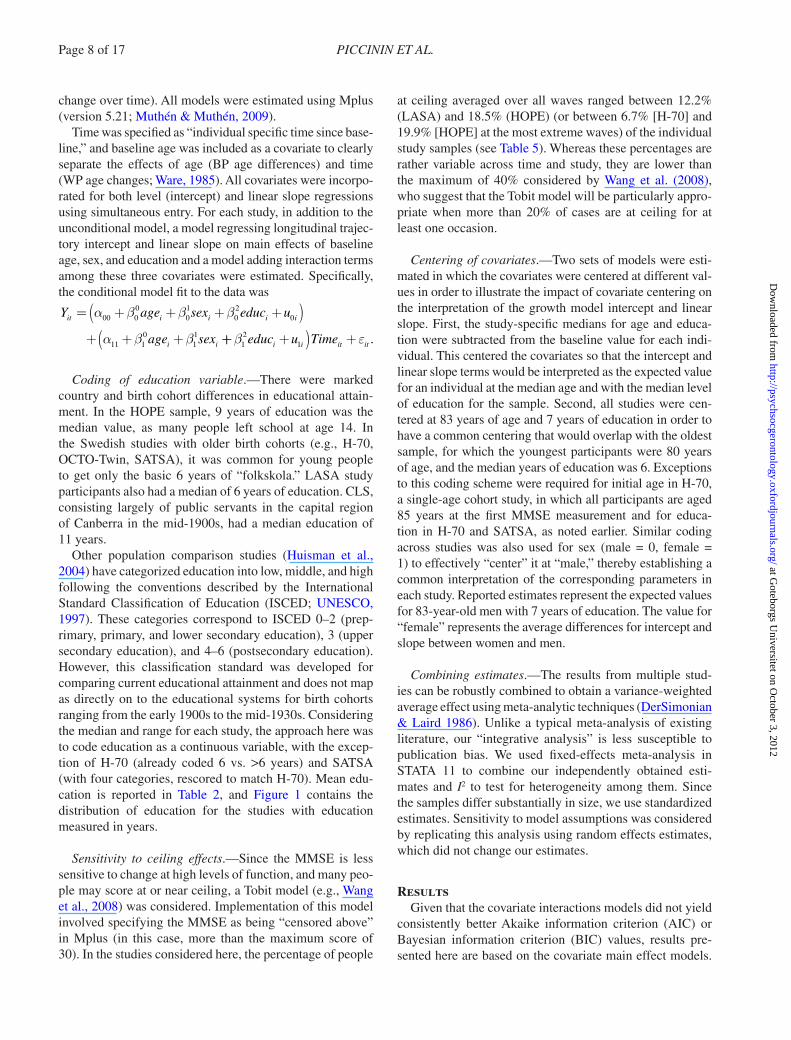
Sensitivity to ceiling effects.—Since the MMSE is less sensitive to change at high levels of function, and many peo-ple may score at or near ceiling, a Tobit model (e.g., Wang et al., 2008) was considered. Implementation of this model involved specifying the MMSE as being “censored above” in Mplus (in this case, more than the maximum score of 30). In the studies considered here, the percentage of people
at ceiling averaged over all waves ranged between 12.2% (LASA) and 18.5% (HOPE) (or between 6.7% [H-70] and 19.9% [HOPE] at the most extreme waves) of the individual study samples (see Table 5). Whereas these percentages are rather variable across time and study, they are lower than the maximum of 40% considered by Wang et al. (2008), who suggest that the Tobit model will be particularly appro-priate when more than 20% of cases are at ceiling for at least one occasion.
Centering of covariates.—Two sets of models were esti-mated in which the covariates were centered at different val-ues in order to illustrate the impact of covariate centering on the interpretation of the growth model intercept and linear slope. First, the study-specific medians for age and educa-tion were subtracted from the baseline value for each indi-vidual. This centered the covariates so that the intercept and linear slope terms would be interpreted as the expected value for an individual at the median age and with the median level of education for the sample. Second, all studies were cen-tered at 83 years of age and 7 years of education in order to have a common centering that would overlap with the oldest sample, for which the youngest participants were 80 years of age, and the median years of education was 6. Exceptions to this coding scheme were required for initial age in H-70, a single-age cohort study, in which all participants are aged 85 years at the first MMSE measurement and for educa-tion in H-70 and SATSA, as noted earlier. Similar coding across studies was also used for sex (male = 0, female = 1) to effectively “center” it at “male,” thereby establishing a common interpretation of the corresponding parameters in each study. Reported estimates represent the expected values for 83-year-old men with 7 years of education. The value for “female” represents the average differences for intercept and slope between women and men.
Combining estimates.—The results from multiple stud-ies can be robustly combined to obtain a variance-weighted average effect using meta-analytic techniques (DerSimonian & Laird 1986). Unlike a typical meta-analysis of existing literature, our “integrative analysis” is less susceptible to publication bias. We used fixed-effects meta-analysis in STATA 11 to combine our independently obtained esti-mates and I2 to test for heterogeneity among them. Since the samples differ substantially in size, we use standardized estimates. Sensitivity to model assumptions was considered by replicating this analysis using random effects estimates, which did not change our estimates.
ResultsGiven that the covariate interactions models did not yield
consistently better Akaike information criterion (AIC) or Bayesian information criterion (BIC) values, results pre-sented here are based on the covariate main effect models.
Page 8 of 17 PICCININ ET AL.
at Goteborgs U
niversitet on October 3, 2012
http://psychsocgerontology.oxfordjournals.org/D
ownloaded from
On average, at age 80 years with 7 years of education, men scored between 25 and 27 on the MMSE and declined about 0.3 points per year. Consistent with this, older individuals tended to score lower initially (0.1–0.2 points per year) and decline at a faster rate (0.01–0.08 points more decline per year). Sex differences are more apparent in some studies: the women in LASA and CLS score almost a half a point higher than the men in these samples, and women in H-70 and SATSA show more decline than men.
Level and Rate of Change in MMSE With Respect to Education
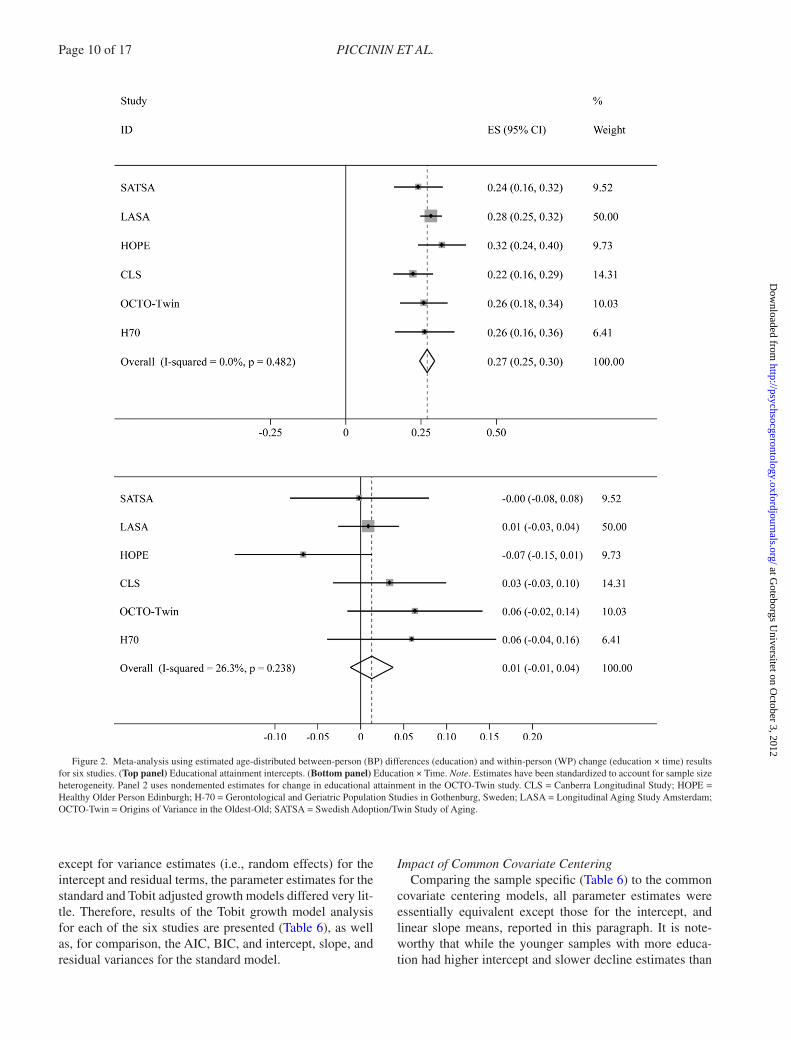
In each of the six samples considered here, MMSE performance was associated positively with level of edu-cational attainment, controlling for sex and age. Focusing on studies with similarly coded education, higher educated participants have higher initial scores (0.2–0.4 points per additional year of education). Change in MMSE, on the other hand, was associated with education only in the full OCTO-Twin sample (b = 0.08, p = .03). Meta-analysis sup-ports such a conclusion, suggesting that while educational
attainment was associated with intercepts (Figure 2A: standardized effect size (ZES) = 0.27; 95% confidence interval [CI] = 0.25, 0.30), educational attainment was not related to WP changes in MMSE score (Figure 2B: ZES = 0.01, n.s.). Nonsignificant I2 estimates suggest that these associations, or lack thereof, are stable.
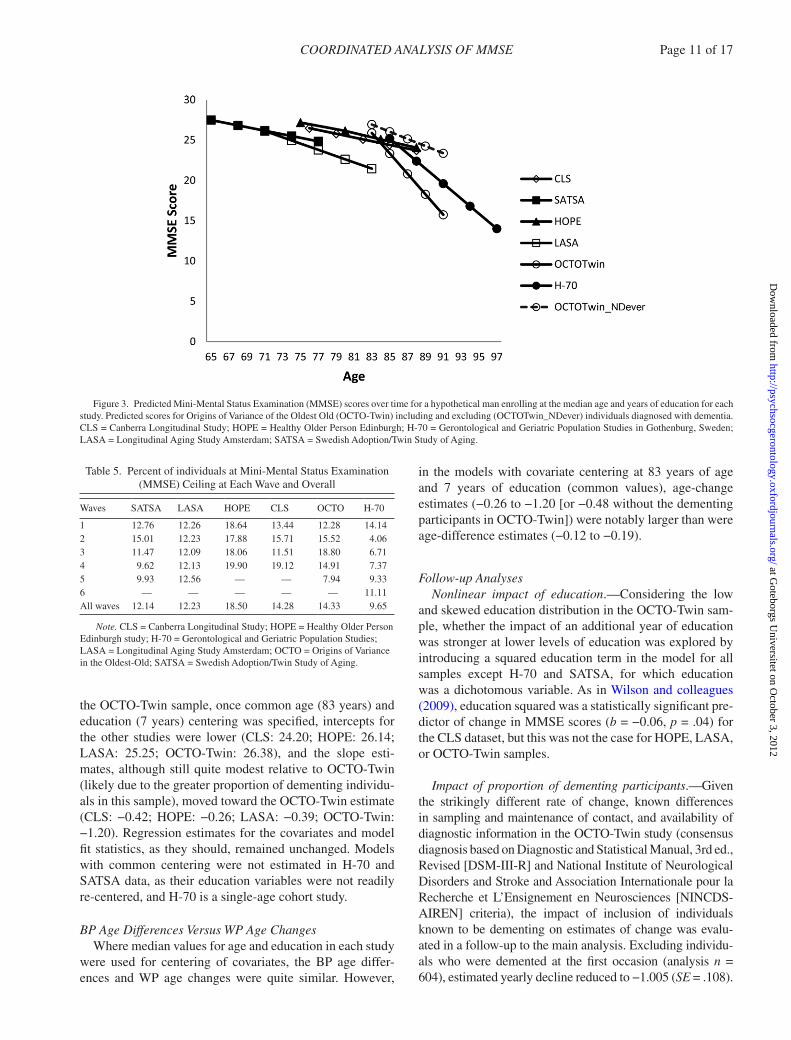
Figure 3 shows expected trajectories, based on the Tobit model, for men with 7 years of formal education who were recruited at the median age for each study, based on the parameter estimates from the independent analyses. As sex and education were not significant predictors of rate of change, they were not included here. Scatterplots of educa-tion by change in MMSE are provided in Figure 4, however, to visually illustrate the (lack of) association between these two variables.
Impact of Ceiling EffectIn comparing the Tobit and Standard Model results, the
AIC and BIC indicate better model fit for the models based on the Tobit link function than for those with a standard identity link function in all studies except CLS. However,
Figure 1. Education distribution (%) by study. Note. Gerontological and Geriatric Population Studies in Gothenburg, Sweden [H-70] and Swedish Adoption/Twin Study of Aging [SATSA]: 60% completed elementary school or less and 40% completed more than elementary school. CLS = Canberra Longitudinal Study; HOPE = Healthy Older Person Edinburgh; LASA = Longitudinal Aging Study Amsterdam; OCTO-Twin = Origins of Variance in the Oldest-Old.
COORDINATED ANALYSIS OF MMSE Page 9 of 17
at Goteborgs U
niversitet on October 3, 2012
http://psychsocgerontology.oxfordjournals.org/D
ownloaded from
except for variance estimates (i.e., random effects) for the intercept and residual terms, the parameter estimates for the standard and Tobit adjusted growth models differed very lit-tle. Therefore, results of the Tobit growth model analysis for each of the six studies are presented (Table 6), as well as, for comparison, the AIC, BIC, and intercept, slope, and residual variances for the standard model.
Impact of Common Covariate CenteringComparing the sample specific (Table 6) to the common
covariate centering models, all parameter estimates were essentially equivalent except those for the intercept, and linear slope means, reported in this paragraph. It is note-worthy that while the younger samples with more educa-tion had higher intercept and slower decline estimates than
Figure 2. Meta-analysis using estimated age-distributed between-person (BP) differences (education) and within-person (WP) change (education × time) results for six studies. (Top panel) Educational attainment intercepts. (Bottom panel) Education × Time. Note. Estimates have been standardized to account for sample size heterogeneity. Panel 2 uses nondemented estimates for change in educational attainment in the OCTO-Twin study. CLS = Canberra Longitudinal Study; HOPE = Healthy Older Person Edinburgh; H-70 = Gerontological and Geriatric Population Studies in Gothenburg, Sweden; LASA = Longitudinal Aging Study Amsterdam; OCTO-Twin = Origins of Variance in the Oldest-Old; SATSA = Swedish Adoption/Twin Study of Aging.
Page 10 of 17 PICCININ ET AL.
at Goteborgs U
niversitet on October 3, 2012
http://psychsocgerontology.oxfordjournals.org/D
ownloaded from
the OCTO-Twin sample, once common age (83 years) and education (7 years) centering was specified, intercepts for the other studies were lower (CLS: 24.20; HOPE: 26.14; LASA: 25.25; OCTO-Twin: 26.38), and the slope esti-mates, although still quite modest relative to OCTO-Twin (likely due to the greater proportion of dementing individu-als in this sample), moved toward the OCTO-Twin estimate (CLS: −0.42; HOPE: −0.26; LASA: −0.39; OCTO-Twin: −1.20). Regression estimates for the covariates and model fit statistics, as they should, remained unchanged. Models with common centering were not estimated in H-70 and SATSA data, as their education variables were not readily re-centered, and H-70 is a single-age cohort study.
BP Age Differences Versus WP Age ChangesWhere median values for age and education in each study
were used for centering of covariates, the BP age differ-ences and WP age changes were quite similar. However,
in the models with covariate centering at 83 years of age and 7 years of education (common values), age-change estimates (−0.26 to −1.20 [or −0.48 without the dementing participants in OCTO-Twin]) were notably larger than were age-difference estimates (−0.12 to −0.19).
Follow-up AnalysesNonlinear impact of education.—Considering the low
and skewed education distribution in the OCTO-Twin sam-ple, whether the impact of an additional year of education was stronger at lower levels of education was explored by introducing a squared education term in the model for all samples except H-70 and SATSA, for which education was a dichotomous variable. As in Wilson and colleagues (2009), education squared was a statistically significant pre-dictor of change in MMSE scores (b = −0.06, p = .04) for the CLS dataset, but this was not the case for HOPE, LASA, or OCTO-Twin samples.
Impact of proportion of dementing participants.—Given the strikingly different rate of change, known differences in sampling and maintenance of contact, and availability of diagnostic information in the OCTO-Twin study (consensus diagnosis based on Diagnostic and Statistical Manual, 3rd ed., Revised [DSM-III-R] and National Institute of Neurological Disorders and Stroke and Association Internationale pour la Recherche et L’Ensignement en Neurosciences [NINCDS-AIREN] criteria), the impact of inclusion of individuals known to be dementing on estimates of change was evalu-ated in a follow-up to the main analysis. Excluding individu-als who were demented at the first occasion (analysis n = 604), estimated yearly decline reduced to −1.005 (SE = .108).
Table 5. Percent of individuals at Mini-Mental Status Examination (MMSE) Ceiling at Each Wave and Overall
Waves SATSA LASA HOPE CLS OCTO H-70
1 12.76 12.26 18.64 13.44 12.28 14.142 15.01 12.23 17.88 15.71 15.52 4.063 11.47 12.09 18.06 11.51 18.80 6.714 9.62 12.13 19.90 19.12 14.91 7.375 9.93 12.56 — — 7.94 9.336 — — — — — 11.11All waves 12.14 12.23 18.50 14.28 14.33 9.65
Note. CLS = Canberra Longitudinal Study; HOPE = Healthy Older Person Edinburgh study; H-70 = Gerontological and Geriatric Population Studies; LASA = Longitudinal Aging Study Amsterdam; OCTO = Origins of Variance in the Oldest-Old; SATSA = Swedish Adoption/Twin Study of Aging.
Figure 3. Predicted Mini-Mental Status Examination (MMSE) scores over time for a hypothetical man enrolling at the median age and years of education for each study. Predicted scores for Origins of Variance of the Oldest Old (OCTO-Twin) including and excluding (OCTOTwin_NDever) individuals diagnosed with dementia. CLS = Canberra Longitudinal Study; HOPE = Healthy Older Person Edinburgh; H-70 = Gerontological and Geriatric Population Studies in Gothenburg, Sweden; LASA = Longitudinal Aging Study Amsterdam; SATSA = Swedish Adoption/Twin Study of Aging.
COORDINATED ANALYSIS OF MMSE Page 11 of 17
at Goteborgs U
niversitet on October 3, 2012
http://psychsocgerontology.oxfordjournals.org/D
ownloaded from
Excluding both demented and dementing individuals from the OCTO-Twin analysis (analysis n = 477) resulted in an estimated yearly change of −0.447 (SE = .088), much less than in the full sample. In addition, education-related differ-ences in rate of change became nonsignificant (0.033 [SE = .021]).
DiscussionThis article is a demonstration of the coordinated analysis
approach advocated by Piccinin and Hofer (2008) and Hofer and Piccinin (2009, 2010). Based on a measure commonly available in longitudinal studies of aging and the cogni-tive reserve hypothesis, we implemented parallel models in six longitudinal studies to demonstrate a way to assess the consistency of findings relating to the association between education and cognitive decline, for which comparable anal-yses in the literature are few. We found relative consistency across the available studies, with greater average declines in the older samples that may, as our follow-up analyses sug-gest, reflect greater prevalence of dementia at the older ages. Although this consistency is visible in the raw estimates, in the conclusions based on significance levels, and in the plot of average trajectories by study, we demonstrate that it can also be summarized using meta-analytic methods.
It is important to consider the role of operational defini-tions in such replications. Although, at the conceptual level, similar predictors were used in these analyses, differences in
information collected across the studies required that educa-tion was coded dichotomously for some of the analyses. Had we conducted a pooled analysis, it would have been neces-sary to either drop the studies that did not have age/year of completion or to dichotomize education in the same way for all of the studies. The coordinated approach allows flexible use of a mix of measures and models to address the ques-tions of interest and to follow up on hypotheses generated in the initial analyses.
Level and Rate of Change in MMSE With Respect to Education
In general, we observed an absence of association between education and change in MMSE. This is generally in agreement with recent growth curve analyses of multi-occasion data rather than the earlier two-occasion change score analyses. With respect to discrepancies in the previ-ous literature, therefore, the current analyses do not pro-vide evidence to support the cognitive reserve hypothesis, at least as indexed by years of education.
However, there were two hints that education-related dif-ferences may have more effect at lower as compared with higher levels of education. A positive time × education term was observed in the OCTO-Twin sample, which had lower average education, though this association disappeared once demented and dementing individuals were excluded in a follow-up analysis. Also in follow-up analyses, a positive
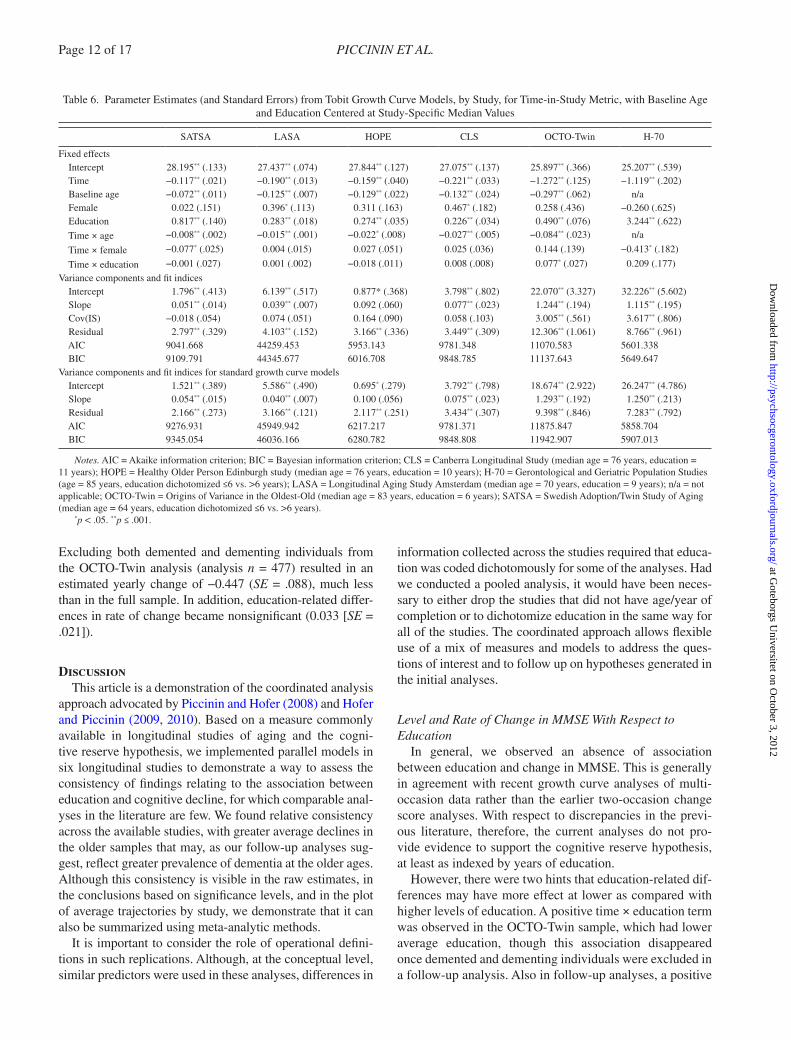
Table 6. Parameter Estimates (and Standard Errors) from Tobit Growth Curve Models, by Study, for Time-in-Study Metric, with Baseline Age and Education Centered at Study-Specific Median Values
SATSA LASA HOPE CLS OCTO-Twin H-70
Fixed effects Intercept 28.195** (.133) 27.437** (.074) 27.844** (.127) 27.075** (.137) 25.897** (.366) 25.207** (.539) Time −0.117** (.021) −0.190** (.013) −0.159** (.040) −0.221** (.033) −1.272** (.125) −1.119** (.202) Baseline age −0.072** (.011) −0.125** (.007) −0.129** (.022) −0.132** (.024) −0.297** (.062) n/a Female 0.022 (.151) 0.396* (.113) 0.311 (.163) 0.467* (.182) 0.258 (.436) −0.260 (.625) Education 0.817** (.140) 0.283** (.018) 0.274** (.035) 0.226** (.034) 0.490** (.076) 3.244** (.622)
Time × age −0.008** (.002) −0.015** (.001) −0.022* (.008) −0.027** (.005) −0.084** (.023) n/a
Time × female −0.077* (.025) 0.004 (.015) 0.027 (.051) 0.025 (.036) 0.144 (.139) −0.413* (.182)
Time × education −0.001 (.027) 0.001 (.002) −0.018 (.011) 0.008 (.008) 0.077* (.027) 0.209 (.177)
Variance components and fit indices Intercept 1.796** (.413) 6.139** (.517) 0.877* (.368) 3.798** (.802) 22.070** (3.327) 32.226** (5.602) Slope 0.051** (.014) 0.039** (.007) 0.092 (.060) 0.077** (.023) 1.244** (.194) 1.115** (.195) Cov(IS) −0.018 (.054) 0.074 (.051) 0.164 (.090) 0.058 (.103) 3.005** (.561) 3.617** (.806) Residual 2.797** (.329) 4.103** (.152) 3.166** (.336) 3.449** (.309) 12.306** (1.061) 8.766** (.961) AIC 9041.668 44259.453 5953.143 9781.348 11070.583 5601.338 BIC 9109.791 44345.677 6016.708 9848.785 11137.643 5649.647Variance components and fit indices for standard growth curve models Intercept 1.521** (.389) 5.586** (.490) 0.695* (.279) 3.792** (.798) 18.674** (2.922) 26.247** (4.786) Slope 0.054** (.015) 0.040** (.007) 0.100 (.056) 0.075** (.023) 1.293** (.192) 1.250** (.213) Residual 2.166** (.273) 3.166** (.121) 2.117** (.251) 3.434** (.307) 9.398** (.846) 7.283** (.792) AIC 9276.931 45949.942 6217.217 9781.371 11875.847 5858.704 BIC 9345.054 46036.166 6280.782 9848.808 11942.907 5907.013
Notes. AIC = Akaike information criterion; BIC = Bayesian information criterion; CLS = Canberra Longitudinal Study (median age = 76 years, education = 11 years); HOPE = Healthy Older Person Edinburgh study (median age = 76 years, education = 10 years); H-70 = Gerontological and Geriatric Population Studies (age = 85 years, education dichotomized ≤6 vs. >6 years); LASA = Longitudinal Aging Study Amsterdam (median age = 70 years, education = 9 years); n/a = not applicable; OCTO-Twin = Origins of Variance in the Oldest-Old (median age = 83 years, education = 6 years); SATSA = Swedish Adoption/Twin Study of Aging (median age = 64 years, education dichotomized ≤6 vs. >6 years).
*p < .05. **p ≤ .001.
Page 12 of 17 PICCININ ET AL.
at Goteborgs U
niversitet on October 3, 2012
http://psychsocgerontology.oxfordjournals.org/D
ownloaded from
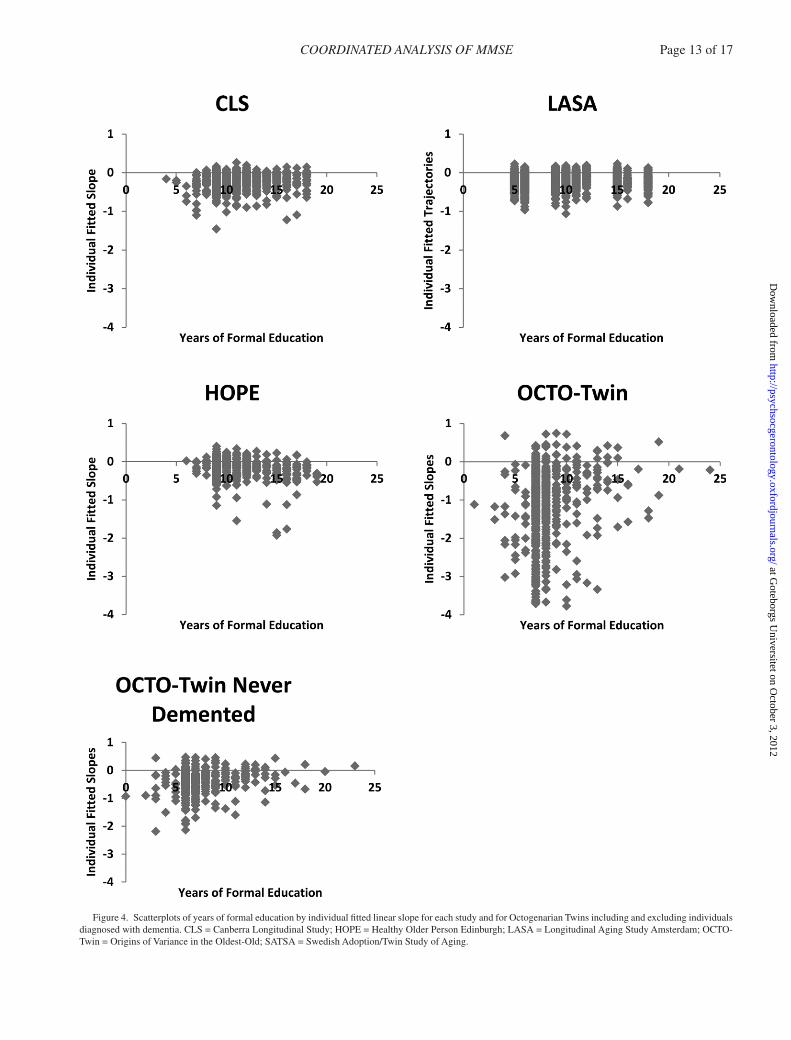
Figure 4. Scatterplots of years of formal education by individual fitted linear slope for each study and for Octogenarian Twins including and excluding individuals diagnosed with dementia. CLS = Canberra Longitudinal Study; HOPE = Healthy Older Person Edinburgh; LASA = Longitudinal Aging Study Amsterdam; OCTO-Twin = Origins of Variance in the Oldest-Old; SATSA = Swedish Adoption/Twin Study of Aging.
COORDINATED ANALYSIS OF MMSE Page 13 of 17
at Goteborgs U
niversitet on October 3, 2012
http://psychsocgerontology.oxfordjournals.org/D
ownloaded from
time × education term, paired with a significant negative time × education2 term was observed in CLS (but not in the other samples), indicating less decline with additional years of education near the median (11 years) but diminish-ing returns for additional years.
It may be that the critical aspect of education is comple-tion of the minimum mandatory standard. Although in older birth cohorts, lack of school completion may be related to family needs for an additional breadwinner, if students with below-average school performance are more likely to drop out of school early, lacking the minimum standard may represent lifelong limitations in cognitive function or poor development of cognitive reserve (Mehta et al., 2009). Minimum mandatory schooling standards have also increased markedly over the range of birth cohorts studied here. Careful cross-referencing of age by such standards may allow more appropriate operationalization of educa-tion in the future (Glymour, Kawachi, Jencks, & Berkman, 2008). Measures of education quality (e.g., Glymour & Manly, 2008; Manly, Jacobs, Touradji, Small, & Stern, 2002; Richards & Hatch, 2011), unavailable for our analy-ses, would further enhance research on the role of education in cognitive aging.
Self-rating of literacy (e.g., Kave, Shrira, Palgi, Palter, Ben-Ezra & Shmotkin, 2012) and self-evaluation of school performance (Mehta et al., 2009) are additional measures of “education” that have recently been associated with late-life cognition and Alzheimer’s disease. Although also not avail-able for the current analyses, they may provide a reason-ably straightforward addition to the complicated processes of gauging schooling quality and standards.
It is also likely that associations between educational attainment and declines in cognitive functioning, if they exist, are more complex. Higher education may result in reduced (or delayed) decline in the preclinical stages (or absence) of dementia, but it accelerated decline once pathology has advanced beyond the level at which higher education/ability individuals are able to compensate (Hall et al., 2007). It may also interact with other characteristics such as declining health (Meijer, van Boxtel, Van Gerven, van Hooren, & Jolles, 2009; Piccinin, Muniz, Sparks, & Bontempo, 2011).
Impact of Ceiling EffectGiven that ceiling effects may bias results when demen-
tia screening measures are used as an index of cognitive function, it was important to first evaluate the potential effect on the conclusions of having used the MMSE. In this case, based on the comparison of typical versus Tobit mod-els, it seems that our results were not markedly affected. In terms of deciding to specify a Tobit model, the percent of individuals at ceiling is a relevant factor. In the sam-ples studied here, between 4.1% and 19.9% of individuals scored at ceiling at any one occasion, considerably fewer
than the maximum of 40% considered by Wang and col-leagues (2008), who suggested that the Tobit model will be particularly appropriate when more than 20% of cases are at ceiling for at least one occasion. Although the AIC suggested that the Tobit models fit better than the stand-ard models, and the estimated variance components were larger for these models, the Tobit model estimates did not result in different conclusions regarding the trajectories or the covariates. In particular, it had no effect on estimates of the association between education and cognitive decline.
Impact of Common Covariate CenteringIncluding the same set of covariates across analysis of
the different samples is a first step toward obtaining equiva-lent interpretations for the parameter estimates conditioned upon them. Although sampling differences may in some cases suggest, or require, inclusion of additional covariates in order to compare results, including the same covariates in this way is a straightforward approach to maximize the utility of comparisons. The coordinated analysis approach employed here facilitated this comparability.
A further step toward comparability of parameter esti-mates can be attained through centering predictors at the same value so that the parameter estimates represent the expected values at the same, meaningful, value of the pre-dictors. In the analysis of these six studies, different cen-tering of the covariates influenced the trajectory parameter estimates but not their estimated associations with the covar-iates themselves. In other words, interpretation of the aver-age level and rate of change in performance was affected (e.g., average decline was greater for older reference ages and the estimates were more similar when the same refer-ence age was used), but, again, not the conclusions regard-ing the covariates such as the association between education and cognitive decline, at least for the centering choices con-sidered here. Attention to such differences, through either pre- or postanalysis centering is recommended as a way of appropriately comparing results across studies.
BP Age Differences Versus WP Age ChangesOn average, in all the samples, MMSE scores were
lower in older individuals, they declined over time, and the BP and WP effects were similar at the sample age medi-ans. However, larger age changes than age differences were generally observed by the ninth decade. This discrepancy points to the likely existence of selection or healthy par-ticipant (Mendes de Leon, 2007) effects in studies of aging with age heterogeneous initial samples, where initial per-formance may be overestimated at older ages due to the lower probability of enrollment of ill or frail individuals. In this situation, longitudinal declines may also be over-estimated due to regression to the mean or to capturing change associated with changes in health that did not lead to attrition.
Page 14 of 17 PICCININ ET AL.
at Goteborgs U
niversitet on October 3, 2012
http://psychsocgerontology.oxfordjournals.org/D
ownloaded from
Impact of Proportion of Dementing ParticipantsThe impact of dementia was not a specific focus in this study, but the very different sampling strategies across the samples are likely to have resulted in distinct selection patterns. For example, HOPE participants were limited to healthy individuals with a minimum MMSE score of more than 19 at baseline. OCTO-Twin, on the other hand, although limited to intact twin pairs (i.e., both twins alive), made a special effort to retain demented individuals. These differences may be reflected in the generally lower age difference and age change estimates for HOPE and gener-ally higher estimates for OCTO-Twin, relative to the other studies. HOPE had similar change versus difference esti-mates, but OCTO-Twin change estimates were strikingly larger. When dementing individuals were omitted from the OCTO-Twin analysis, estimates of change in MMSE were much reduced (b = −0.479). When the sample was restricted to individuals who were not demented at the first measure-ment, estimated change in MMSE fell between the other two estimates (b = −1.005). Accounting for dementia will be an important additional factor relevant to both estimat-ing rate of change and characterizing the role of education and other interindividual covariates in cognitive change in late life. In this regard, it is interesting to note the trajec-tory similarity between studies with more similarly aged participants and to consider the extent to which dementia incidence may influence estimates of rate of decline.
Summary and ConclusionsCoordinated analysis is a collaborative approach for
estimating parallel models in multiple datasets. We find a general lack of linear association between reported years of education in nondementing individuals and their change in MMSE performance over time. We also find similar age and time effects (accounting for age) across the different studies, including similar WP age declines and BP age dif-ferences until after 80 years of age.
Understanding the generalizability of the impact of birth cohort and national differences in education, socioeco-nomic status, and health gradients motivated this coordi-nated analysis of longitudinal studies on aging, providing an opportunity for simultaneous evaluation of longitudinal data to test, replicate, and extend prior findings on aging-related change (Hofer & Piccinin, 2009, 2010). A coordi-nated approach for cross-study comparison of results using identical statistical models permits direct comparison of results and opportunities to understand why results might differ. Attention to sampling differences may play a key role in such endeavors.
Funding
This work was supported by the National Institute on Aging at the National Institutes of Health (grant number AG026453) in support of the Integrative Analysis of Longitudinal Studies of Aging (IALSA) research network. Swedish Adoption/Twin Study of Aging (SATSA) has
been funded by the National Institute on Aging (AG04563, AG10175), the MacArthur Foundation Research Network on Successful Aging, the Swedish Council for Social Research (97:0147:1B), and the Swedish Research Council (2007–2722). Longitudinal Aging Study Amsterdam (LASA) is largely supported by the Netherlands Ministry of Health Welfare and Sports. Healthy Older Person Edinburgh (HOPE) was funded by the Chief Scientist Office, U.K. Canberra Longitudinal Study (CLS) was funded by the Australian National Health and Medical Research Council. Origins of Variance in the Oldest-Old (OCTO-Twin) data collection was funded by the National Institute on Aging at the National Institutes of Health (grant number AG08861), the Swedish Council for Working Life and Social Research, the Adlerbertska Foundation, the Hjalmar Svensson Foundation, the Knut and Alice Wallenberg Foundation, the Wenner-Gren Foundations, and the Wilhelm and Martina Lundgrens Foundation. Current work on Gerontological and Geriatric Population Studies in Gothenburg, Sweden (H70) and OCTO-Twin was supported by the Swedish Research Council, Swedish Council for Working Life and Social Research, Swedish Brain Power, and Epilife. H-70 was funded by the Swedish Research Council. Support was provided to S. Clouston by the Canadian Institutes for Health Research (CUK-103284) and to A. Spiro by Merit Review and Research Career Scientist Awards from the U.S. Department of Veterans Affairs. This article, however, does not represent the views of the U.S. Department of Veterans Affairs.
ReferencesAevarsson, Ó., & Skoog, I. (2000). A longitudinal population study of the
mini-mental state examination in the very old: Relation to demen-tia and education. Dementia and Geriatric Cognitive Disorders, 11, 166–175. doi:10.1159/000017231
Alley, D., Suthers, K., & Crimmins, E. (2007). Education and cogni-tive decline in older Americans: Results from the AHEAD sample. Research on Aging, 29, 73–94. doi:10.1177/0164027506294245
American Psychiatric Association. (1987). Diagnostic and statistical man-ual of mental disorders (3rd ed., revised). Washington, DC: Author.
Anstey, K., & Christensen, H. (2000). Education, activity, health, blood pressure and apolipoprotein E as predictors of cognitive change in old age: A review. Gerontology, 46, 163–177. doi:10.1159/000022153
Australian Bureau of Statistics. (1989). Australian Capital Territory statis-tical summary. Australia: Australian Government Printer.
Butler, S. M., Ashford, J. W., & Snowdon, D. A. (1996). Age, education, and changes in the Mini-Mental State Exam scores of older women: Findings from the Nun Study. Journal of the American Geriatrics Society, 44, 675–681.
Cederlöf, R., Lorich, U. (1978). The Swedish Twin Registry. In W. E. Nance, G. Allen, & P. Parisi (Eds.), Twin research: Part C, biology and epidemiology (pp. 189–195). New York: Alan R. Liss.
Christensen, H., Anstey, K. J., Parslow, R. A., Maller, J., Mackinnon, A., & Sachdev, P. (2007). The brain reserve hypothesis, brain atrophy and aging. Gerontology, 53, 82–95. doi:10.1159/000096482
Christensen, H., Korten, A. E., Jorm, A. F., Henderson, A. S., Jacomb, P. A., Rodgers, B., & Mackinnon, A. J. (1997). Education and decline in cognitive performance: compensatory but not protec-tive. International Journal of Geriatric Psychiatry, 12, 323–330. doi:10.1002/(SICI)1099–1166(199703)
Christensen, H., Mackinnon, A., Jorm, A. F., Korten, A., Jacomb, P., Hofer, S. M., & Henderson, S. (2004). The Canberra Longitudinal Study: Design, aims, methodology, outcomes and recent empirical inves-tigations. Aging, Neuropsychology, and Cognition, 11, 169–195. doi:10.1080/13825580490511053
Colsher, P. L., & Wallace, R. B. (1991a). Longitudinal applica-tion of cognitive function measures in a defined population of community-dwelling elders. Annals of Epidemiology, 1, 215–230. doi:10.1016/1047–2797(91)90001-s
Colsher, P. L., & Wallace, R. B. (1991b). Epidemiologic considerations in studies of cognitive function in the elderly: Methodology and non-dementing acquired dysfunction. Epidemiologic Reviews, 13, 1–27.
Crane, P. K., Narasimhalu, K., Gibbons, L. E., Mungas, D. M., Haneuse, S., Larson, E. B., … van Belle, G. (2008). Item response theory
COORDINATED ANALYSIS OF MMSE Page 15 of 17
at Goteborgs U
niversitet on October 3, 2012
http://psychsocgerontology.oxfordjournals.org/D
ownloaded from
facilitated cocalibrating cognitive tests and reduced bias in estimated rates of decline. Journal of Clinical Epidemiology, 61, 1018–1027.e1019. doi:10.1016/j.jclinepi.2007.11.011
DerSimonian, R., & Laird, N. (1986). Meta-analysis in clinical trials. Controlled Clinical Trials, 7, 177–188.
Enders, C. K., & Tofighi, D. (2007). Centering predictor variables in cross-sectional multilevel models: A new look at an old issue. Psychological Methods, 12, 121–138.
Evans, D. A., Beckett, L. A., Albert, M. S., Hebert, L. E., Scherr, P. A., Funkenstein, H. H., & Taylor, J. O. (1993). Level of educa-tion and change in cognitive function in a community popu-lation of older persons. Annals of Epidemiology, 3, 71–77. doi:10.1016/1047–2797(93)90012-s
Farmer, M. E., Kittner, S. J., Rae, D. S., Bartko, J. J., & Regier, D. A. (1995). Education and change in cognitive function. The Epidemiologic Catchment Area Study. Annals of Epidemiology, 5, 1–7. doi:10.1016/1047–2797(94)00047-W
Finkel, D., & Pedersen, N. L. (2004). Processing speed and longitudinal trajectories of change for cognitive abilities: The Swedish Adoption/Twin Study of Aging. Aging, Neuropsychology, and Cognition, 11(2–3), 325–345.
Folstein, M. F., Folstein, S. E., & McHugh, P. R. (1975). “Mini-mental state”. A practical method for grading the cognitive state of patients for the clinician. Journal of Psychiatric Research, 12, 189–198. doi:10.1016/0022-3956(75)90026-6
Geerlings, M. I., Schoevers, R. A., Beekman, A. T., Jonker, C., Deeg, D.J.H., Schmand, B., … Van Tilburg, W. (2000). Depression and risk of cognitive decline and Alzheimer’s disease. Results of two prospective community-based studies in The Netherlands. The British Journal of Psychiatry: The Journal of Mental Science, 176, 568–575.
Gibbons, L. E., van Belle, G., Yang, M., Gill, C., Brayne, C., Huppert, F. A., … Larson, E. (2002). Cross-cultural comparison of the Mini-Mental State Examination in United Kingdom and United States partici-pants with Alzheimer’s disease. International Journal of Geriatric Psychiatry, 17, 723–728. doi:10.1002/gps.683
Glymour, M. M., Kawachi, I., Jencks, C. S., & Berkman, L. F. (2008). Does childhood schooling affect old age memory or mental sta-tus? Using state schooling laws as natural experiments. Journal of Epidemiology and Community Health, 62, 532–537. doi:10.1136/jech.2006.059469
Glymour, M. M., & Manly, J. J. (2008). Lifecourse social conditions and racial and ethnic patterns of cognitive aging. Neuropsychology Review, 18, 223–254. doi:10.1136/jech.2006.059469
Glymour, M. M., Weuve, J., Berkman, L. F., Kawachi, I., & Robins, J. M. (2005). When is baseline adjustment useful in analyses of change? An example with education and cognitive change. American Journal of Epidemiology, 162, 267–278. doi:10.1093/aje/kwi187
Hall, C. B., Derby, C., LeValley, A., Katz, M. J., Verghese, J., & Lipton, R. B. (2007). Education delays accelerated decline on a memory test in persons who develop dementia. Neurology, 69, 1657–1664. doi:10.1212/01.wnl.0000278163.82636.30
Hofer, S. M., & Piccinin, A. M. (2009). Integrative data analysis through coordination of measurement and analysis protocol across inde-pendent longitudinal studies. Psychological Methods, 14, 150–164. doi:10.1037/a0015566
Hofer, S. M., & Piccinin, A. M. (2010). Toward an integrative science of life-span development and aging. Journals of Gerontology. Series B, Psychological Sciences and Social Sciences, 65B, 269–278. doi:10.1093/geronb/gbq017
Hofer, S. M. & Sliwinski, M. J. (2006). Design and analysis of longitudinal studies on aging. In J. E. Birren & K. W. Schaie (Eds.), Handbook of the psychology of aging, 6th ed. San Diego, CA: Elsevier Academic Press.
Huisman, M., Kunst, A. E., Andersen, O., Bopp, M., Borgan, J.-K., Borrell, C., … Mackenbach, J. P. (2004). Socioeconomic inequalities in
mortality among elderly people in 11 European populations. Journal of Epidemiology and Community Health, 58, 468–475. doi:10.1136/jech.2003.010496
Huisman, M., Poppelaars, J., van der Horst, M., Beekman, A. T., Brug, J., van Tilburg, T. G., & Deeg, D. J. (2011). Cohort profile: the Longitudinal Aging Study Amsterdam. International Journal of Epidemiology, 40, 868–876.
Jacqmin-Gadda, H., Fabrigoule, C., Commenges, D., & Dartigues, J. F. (1997). A 5-year longitudinal study of the Mini-Mental State Examination in normal aging. American Journal of Epidemiology, 145, 498–506.
Kave, G., Shrira, A., Palgi, Y., Palter, T., Ben-Ezra, M., & Shmotkin, D. (2012). Formal education level versus self-rated literacy as pre-dictors of cognitive aging. Journals of Gerontology. Series B, Psychological Sciences and Social Sciences. Advance online publi-cation. doi:10.1093/geronb/gbs031
Laukka, E. J., MacDonald, S. W., & Bäckman, L. (2006). Contrasting cognitive trajectories of impending death and preclinical demen-tia in the very old. Neurology, 66, 833–838. doi:10.1212/01.wnl.0000203112.12554.f4
Lyketsos, C. G., Chen, L. S., & Anthony, J. C. (1999). Cognitive decline in adulthood: An 11.5-year follow-up of the Baltimore Epidemiologic Catchment Area study. American Journal of Psychiatry, 156, 58–65.
Manly, J. J., Jacobs, D. M., Touradji, P., Small, S. A., & Stern, Y. (2002). Reading level attenuates differences in neuropsychological test per-formance between African American and White elders. Journal of the International Neuropsychological Society, 8, 341–348. doi:10.1017.S135561770102015X
Mehta, K. M., Stewart, A. L., Langa, K. M., Yaffe, K., Moody-Ayers, S., Williams, B. A., & Covinsky, K. E. (2009). “Below aver-age” self-assessed school performance and Alzheimer’s disease in the Aging, Demographics, and Memory Study. Alzheimer’s & Dementia: The Journal of the Alzheimer’s Association, 5, 380–387. doi:10.1016/j.jalz.2009.07.039
Meijer, W. A., van Boxtel, M. P., Van Gerven, P. W., van Hooren, S. A., & Jolles, J. (2009). Interaction effects of education and health status on cognitive change: a 6-year follow-up of the Maastricht Aging Study. Aging & Mental Health, 13, 521–529. doi:10.1080/13607860902860821
Mendes de Leon, C. F. (2007). Aging and the elapse of time: A com-ment on the analysis of change. Journal of Gerontology Series B: Psychological Sciences, 62, S198–S202.
Muniz-Terrera, G., Brayne, C., & Matthews, F.; CC75C Study Collaboration Group. (2010). One size fits all? Why we need more sophisticated analytical methods in the explanation of trajectories of cognition in older age and their potential risk factors. International Psychogeriatrics, 22, 291–299. doi:10.1017/S1041610209990937
Muniz-Terrera, G., Matthews, F., Dening, T., Huppert, F. A., & Brayne, C.; CC75C Group. (2009). Education and trajectories of cognitive decline over 9 years in very old people: Methods and risk analysis. Age and Ageing, 38, 277–282. doi:10.1093/ageing/afp004
Muthén, B. & Muthén, L. (2009). Mplus Version 5.21. Los Angeles: Author [computer software].
Nguyen, H. T., Black, S. A., Ray, L. A., Espino, D. V., & Markides, K. S. (2002). Predictors of decline in MMSE scores among older Mexican Americans. Journals of Gerontology. Series A, Biological Sciences and Medical Sciences, 57, M181–M185. doi:10.1093/gerona/57.3.M181
Pedersen, N. L., Lichtenstein, P., & Svedberg, P. (2002). The Swedish Twin Registry in the Third Millenium. Twin Research, 5(5), 427–432.
Pedersen, N. L., McClearn, G. E., Plomin, R., Nesselroade, J. R., Berg, S., & de Faire, U. (1991). The Swedish Adoption Twin Study of Aging: An update. Acta Geneticae Medicae et Gemellologiae (Roma), 40, 7–20.
Pfeiffer, E. (1975). A short portable mental status questionnaire for the assessment of organic brain deficit in elderly patients. Journal of American Geriatrics Society, 23, 433–441.
Page 16 of 17 PICCININ ET AL.
at Goteborgs U
niversitet on October 3, 2012
http://psychsocgerontology.oxfordjournals.org/D
ownloaded from
Piccinin, A. M., & Hofer, S. M. (2008). Integrative analysis of longitudinal studies on aging: Collaborative research networks, meta-analysis, and optimizing future studies. In S. M. Hofer & D. F. Alwin (Eds.), Handbook on cognitive aging: Interdisciplinary perspectives (pp. 446–476). Thousand Oaks, CA: Sage Publications.
Piccinin, A. M., Muniz, G., Sparks, C., & Bontempo, D. E. (2011). An evaluation of analytical approaches for understanding change in cog-nition in the context of aging and health. Journals of Gerontology. Series B, Psychological Sciences and Social Sciences, 66(Suppl 1), i36–i49. doi:10.1093/geronb/gbr038
Richards, M., & Hatch, S. (2011). A life course approach to the development of mental skills. Journals of Gerontology, Series B: Psychological Sciences and Social Sciences, 66B, i26–i35, doi:10.1093/geronb/gbr038
Rinder, L., Roupe, S., Steen, B., & Svanborg, A. (1975). Seventy-year-old people in Gothenburg. A population study in an industrialized Swedish city. Acta Medica Scandinavica, 198, 397–407. doi:10.1111/ j.0954–6820.1975.tb19563.x
Roth, M., Tym, E., Mountjoy, C. Q., Huppert, F. A., Hendrie, H., Verma, S., & Goddard, R. (1986). CAMDEX. A standardised instrument for the diagnosis of mental disorder in the elderly with special reference to the early detection of dementia. British Journal of Psychiatry: The Journal of Mental Science, 149, 698–709. doi:10.1192/bjp.149.6.698
Skoog, I., Nilsson, L., Palmertz, B., Andreasson, L. A., & Svanborg, A. (1993). A population-based study of dementia in 85-year-olds. New England Journal of Medicine, 328, 153–158.
Sliwinski, M. J., Hoffman, L.R. & Hofer, S.M. (2010). Evaluating con-vergence of within-person change and between-person age differ-ences in age-heterogeneous longitudinal studies. Research in Human Development, 7, 45–60.
Starr, J. M., Whalley, L. J., Inch, S., & Shering, P. A. (1992). The quan-tification of the relative effects of age and NART-predicted IQ on cognitive function in healthy old people. International Journal of Geriatric Psychiatry, 7, 153–157. doi:10.1002/gps.930070303
Svanborg, A., Shibata, H., Hatano, S., & Matsuzaki, T. (1985). Comparison of ecology, ageing and state of health in Japan and Sweden, the
present and previous leaders in longevity. Acta Medica Scandinavica, 218, 5–17. doi:10.1111/j.0954–6820.1977.tb18068.x
Stern, Y. (2002). What is cognitive reserve? Theory and research application of the reserve concept. Journal of the International Neuropsychological Society, 8, 448–460. doi:10.1017.S1355617701020240
Stern, Y. (2009). Cognitive reserve. Neuropsychologia, 47, 2015–2028. doi:10.1016/j.neuropsychologia.2009.03.004
Teng, E. L., & Chui, H. C. (1987). The Modified Mini-Mental State (3MS) examination. Journal of Clinical Psychiatry, 48, 314–318.
Tucker-Drob, E.M., Johnson, K.E. & Jones, R.N. (2009). The cognitive reserve hypothesis: A longitudinal examination of age-associated declines in reasoning and processing speed. Developmental Psychology, 45, 431–446. doi:10.1037/a0014012
UNESCO. (1997). International Standard Classification of Education. Paris: UNESCO Press.
Van Dijk, K. R. A., Van Gerven, P. W. M., Van Boxtel, M. P. J., Van der Elst, W., & Jolles, J. (2008). No protective effects of education dur-ing normal cognitive aging: Results from the 6-year follow-up of the Maastricht Aging Study. Psychology and Aging, 23, 119–130. doi:10.1037/0882-7974.23.1.119
Wainer, H. (2000). The centercept: An estimable and meaningful regres-sion parameter. Psychological Science, 11, 434–436.
Wang, L., Zhang, Z., McArdle, J. J., & Salthouse, T. A. (2008). Investigating ceiling effects in longitudinal data analysis. Multivariate Behavioral Research, 43, 476–496. doi:10.1080/00273170802285941
Ware, J. H. (1985). Linear models for the analysis of longitudinal studies. American Statistician, 39, 95–101. doi:10.2307/2682803
Wilson, R. S., Hebert, L. E., Scherr, P. A., Barnes, L. L., Mendes de Leon, C. F., & Evans, D. A. (2009). Educational attainment and cogni-tive decline in old age. Neurology, 72, 460–465. doi:10.1212/01.wnl.0000341782.71418.6c
Zahodne, L. B., Glymour, M. M., Sparks, C., Bontempo, D., Dixon, R. A., MacDonald, S. W., & Manly, J. J. (2011). Education does not slow cognitive decline with aging: 12-year evidence from the victoria longitudinal study. Journal of the International Neuropsychological Society, 17, 1039–1046. doi:10.1017/S1355617711001044
COORDINATED ANALYSIS OF MMSE Page 17 of 17
at Goteborgs U
niversitet on October 3, 2012
http://psychsocgerontology.oxfordjournals.org/D
ownloaded from


