Embed Size (px)
Citation preview
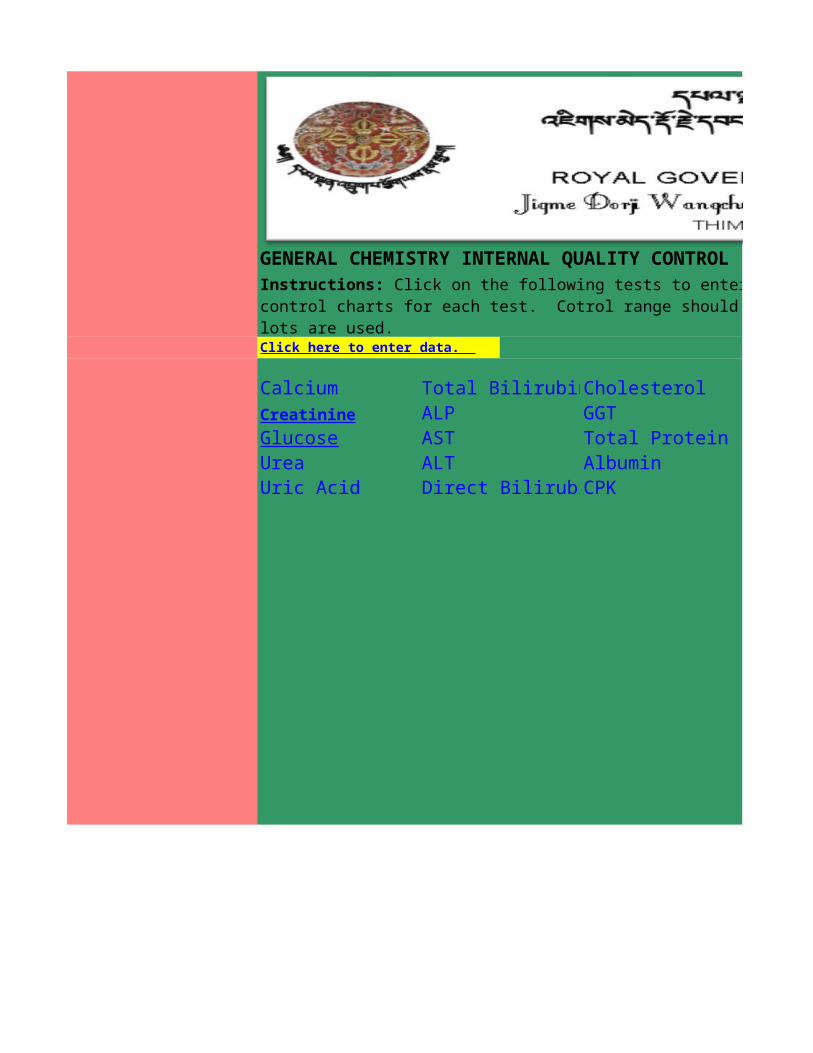
GENERAL CHEMISTRY INTERNAL QUALITY CONTROLInstructions: Click on the following tests to enter the daily results and to view and modify the control charts for each test. Cotrol range should be changed when the new reagents and the control lots are used. Click here to enter data.
Calcium Total BilirubinCholesterolCreatinine ALP GGTGlucose AST Total ProteinUrea ALT AlbuminUric Acid Direct BilirubinCPK
Click on the following tests to enter the daily results and to view and modify the control charts for each test. Cotrol range should be changed when the new reagents and the control
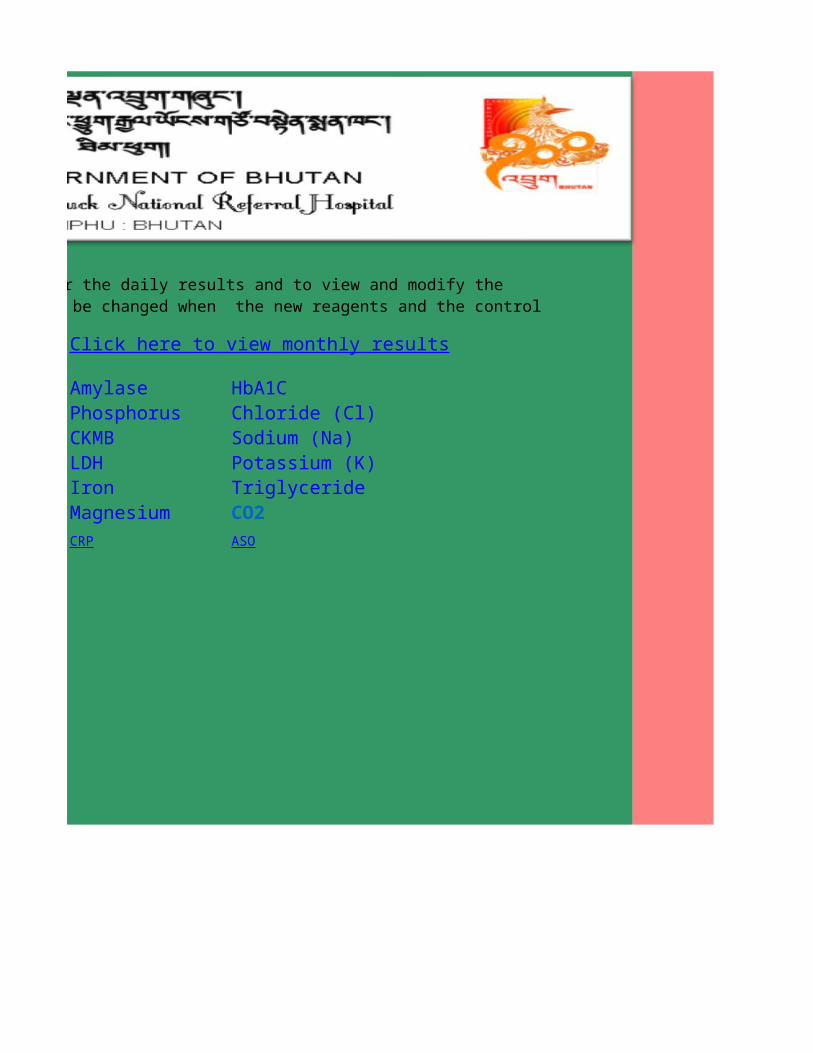
Click here to view monthly results
Amylase HbA1CPhosphorus Chloride (Cl)CKMB Sodium (Na)LDH Potassium (K)Iron TriglycerideMagnesium CO2CRP ASO
ac
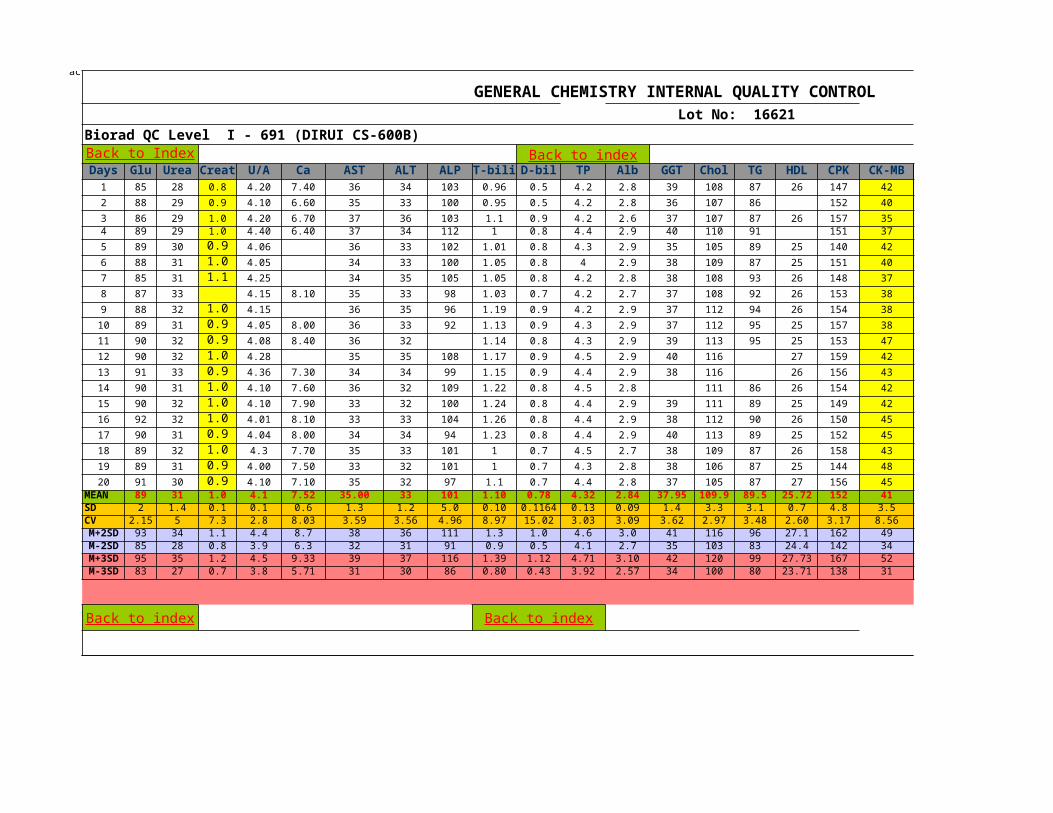
GENERAL CHEMISTRY INTERNAL QUALITY CONTROL Lot No: 16621
Biorad QC Level I - 691 (DIRUI CS-600B)
Days Glu Urea Creat U/A Ca AST ALT ALP T-bili D-bil TP Alb GGT Chol TG HDL CPK CK-MB1 85 28 0.8 4.20 7.40 36 34 103 0.96 0.5 4.2 2.8 39 108 87 26 147 422 88 29 0.9 4.10 6.60 35 33 100 0.95 0.5 4.2 2.8 36 107 86 152 403 86 29 1.0 4.20 6.70 37 36 103 1.1 0.9 4.2 2.6 37 107 87 26 157 354 89 29 1.0 4.40 6.40 37 34 112 1 0.8 4.4 2.9 40 110 91 151 375 89 30 0.9 4.06 36 33 102 1.01 0.8 4.3 2.9 35 105 89 25 140 426 88 31 1.0 4.05 34 33 100 1.05 0.8 4 2.9 38 109 87 25 151 407 85 31 1.1 4.25 34 35 105 1.05 0.8 4.2 2.8 38 108 93 26 148 378 87 33 4.15 8.10 35 33 98 1.03 0.7 4.2 2.7 37 108 92 26 153 389 88 32 1.0 4.15 36 35 96 1.19 0.9 4.2 2.9 37 112 94 26 154 3810 89 31 0.9 4.05 8.00 36 33 92 1.13 0.9 4.3 2.9 37 112 95 25 157 3811 90 32 0.9 4.08 8.40 36 32 1.14 0.8 4.3 2.9 39 113 95 25 153 4712 90 32 1.0 4.28 35 35 108 1.17 0.9 4.5 2.9 40 116 27 159 4213 91 33 0.9 4.36 7.30 34 34 99 1.15 0.9 4.4 2.9 38 116 26 156 4314 90 31 1.0 4.10 7.60 36 32 109 1.22 0.8 4.5 2.8 111 86 26 154 4215 90 32 1.0 4.10 7.90 33 32 100 1.24 0.8 4.4 2.9 39 111 89 25 149 4216 92 32 1.0 4.01 8.10 33 33 104 1.26 0.8 4.4 2.9 38 112 90 26 150 4517 90 31 0.9 4.04 8.00 34 34 94 1.23 0.8 4.4 2.9 40 113 89 25 152 4518 89 32 1.0 4.3 7.70 35 33 101 1 0.7 4.5 2.7 38 109 87 26 158 4319 89 31 0.9 4.00 7.50 33 32 101 1 0.7 4.3 2.8 38 106 87 25 144 4820 91 30 0.9 4.10 7.10 35 32 97 1.1 0.7 4.4 2.8 37 105 87 27 156 45
MEAN 89 31 1.0 4.1 7.52 35.00 33 101 1.10 0.78 4.32 2.84 37.95 109.9 89.5 25.72 152 41SD 2 1.4 0.1 0.1 0.6 1.3 1.2 5.0 0.10 0.1164 0.13 0.09 1.4 3.3 3.1 0.7 4.8 3.5CV 2.15 5 7.3 2.8 8.03 3.59 3.56 4.96 8.97 15.02 3.03 3.09 3.62 2.97 3.48 2.60 3.17 8.56M+2SD 93 34 1.1 4.4 8.7 38 36 111 1.3 1.0 4.6 3.0 41 116 96 27.1 162 49M-2SD 85 28 0.8 3.9 6.3 32 31 91 0.9 0.5 4.1 2.7 35 103 83 24.4 142 34M+3SD 95 35 1.2 4.5 9.33 39 37 116 1.39 1.12 4.71 3.10 42 120 99 27.73 167 52M-3SD 83 27 0.7 3.8 5.71 31 30 86 0.80 0.43 3.92 2.57 34 100 80 23.71 138 31
Back to Index Back to index
Back to index Back to index
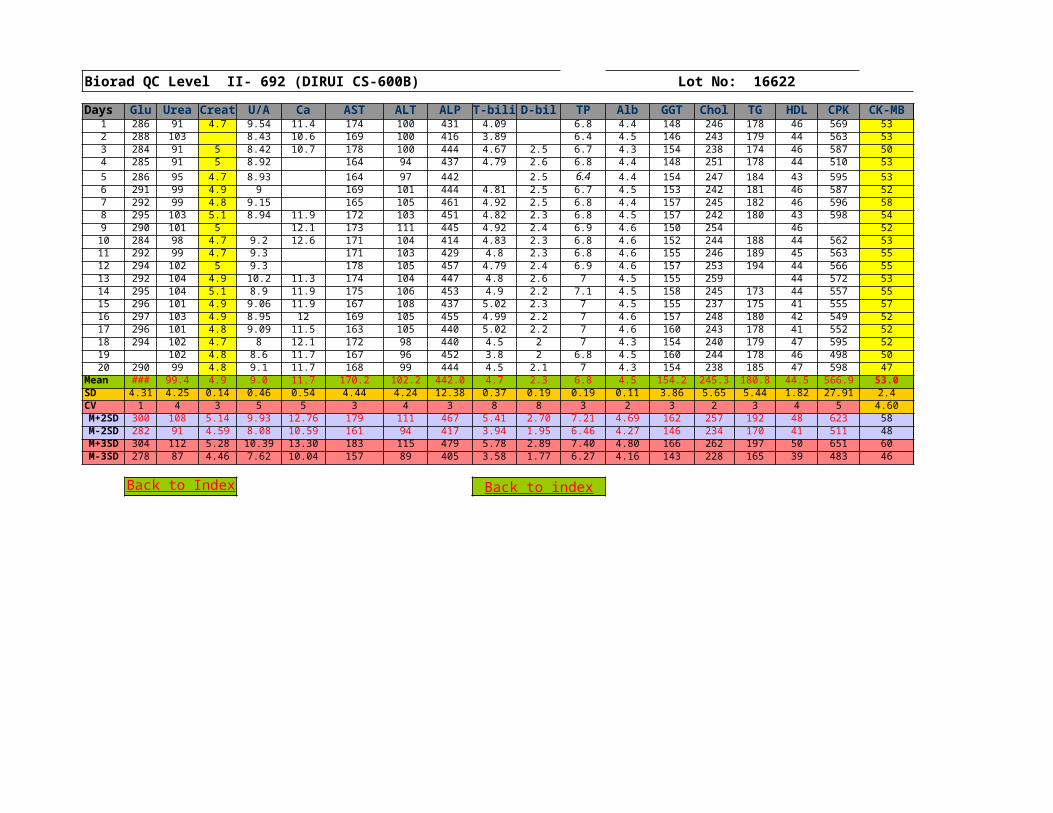
Biorad QC Level II- 692 (DIRUI CS-600B) Lot No: 16622Days Glu Urea Creat U/A Ca AST ALT ALP T-bili D-bil TP Alb GGT Chol TG HDL CPK CK-MB
1 286 91 4.7 9.54 11.4 174 100 431 4.09 6.8 4.4 148 246 178 46 569 532 288 103 8.43 10.6 169 100 416 3.89 6.4 4.5 146 243 179 44 563 533 284 91 5 8.42 10.7 178 100 444 4.67 2.5 6.7 4.3 154 238 174 46 587 504 285 91 5 8.92 164 94 437 4.79 2.6 6.8 4.4 148 251 178 44 510 535 286 95 4.7 8.93 164 97 442 2.5 6.4 4.4 154 247 184 43 595 536 291 99 4.9 9 169 101 444 4.81 2.5 6.7 4.5 153 242 181 46 587 527 292 99 4.8 9.15 165 105 461 4.92 2.5 6.8 4.4 157 245 182 46 596 588 295 103 5.1 8.94 11.9 172 103 451 4.82 2.3 6.8 4.5 157 242 180 43 598 549 290 101 5 12.1 173 111 445 4.92 2.4 6.9 4.6 150 254 46 5210 284 98 4.7 9.2 12.6 171 104 414 4.83 2.3 6.8 4.6 152 244 188 44 562 5311 292 99 4.7 9.3 171 103 429 4.8 2.3 6.8 4.6 155 246 189 45 563 5512 294 102 5 9.3 178 105 457 4.79 2.4 6.9 4.6 157 253 194 44 566 5513 292 104 4.9 10.2 11.3 174 104 447 4.8 2.6 7 4.5 155 259 44 572 5314 295 104 5.1 8.9 11.9 175 106 453 4.9 2.2 7.1 4.5 158 245 173 44 557 5515 296 101 4.9 9.06 11.9 167 108 437 5.02 2.3 7 4.5 155 237 175 41 555 5716 297 103 4.9 8.95 12 169 105 455 4.99 2.2 7 4.6 157 248 180 42 549 5217 296 101 4.8 9.09 11.5 163 105 440 5.02 2.2 7 4.6 160 243 178 41 552 5218 294 102 4.7 8 12.1 172 98 440 4.5 2 7 4.3 154 240 179 47 595 5219 102 4.8 8.6 11.7 167 96 452 3.8 2 6.8 4.5 160 244 178 46 498 5020 290 99 4.8 9.1 11.7 168 99 444 4.5 2.1 7 4.3 154 238 185 47 598 47
Mean ### 99.4 4.9 9.0 11.7 170.2 102.2 442.0 4.7 2.3 6.8 4.5 154.2 245.3 180.8 44.5 566.9 53.0SD 4.31 4.25 0.14 0.46 0.54 4.44 4.24 12.38 0.37 0.19 0.19 0.11 3.86 5.65 5.44 1.82 27.91 2.4CV 1 4 3 5 5 3 4 3 8 8 3 2 3 2 3 4 5 4.60M+2SD 300 108 5.14 9.93 12.76 179 111 467 5.41 2.70 7.21 4.69 162 257 192 48 623 58M-2SD 282 91 4.59 8.08 10.59 161 94 417 3.94 1.95 6.46 4.27 146 234 170 41 511 48M+3SD 304 112 5.28 10.39 13.30 183 115 479 5.78 2.89 7.40 4.80 166 262 197 50 651 60M-3SD 278 87 4.46 7.62 10.04 157 89 405 3.58 1.77 6.27 4.16 143 228 165 39 483 46
Back to Index Back to index
GENERAL CHEMISTRY INTERNAL QUALITY CONTROL
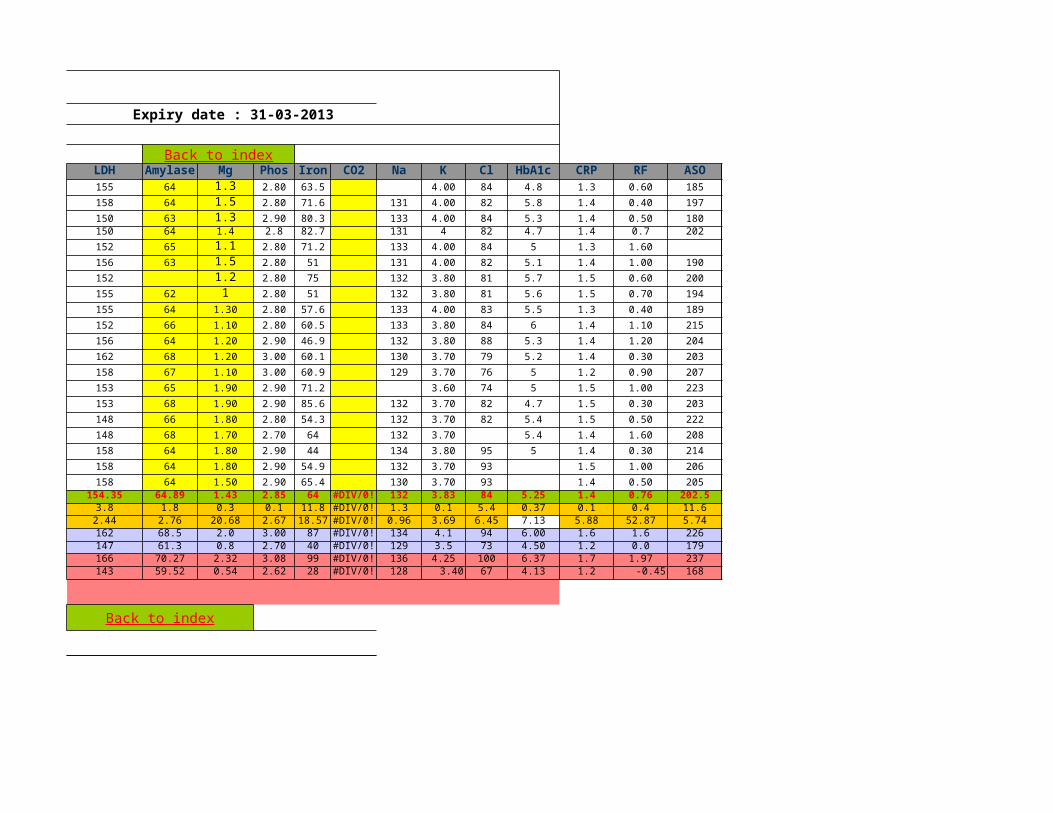
LDH Amylase Mg Phos Iron CO2 Na K Cl HbA1c CRP RF ASO155 64 1.3 2.80 63.5 4.00 84 4.8 1.3 0.60 185158 64 1.5 2.80 71.6 131 4.00 82 5.8 1.4 0.40 197150 63 1.3 2.90 80.3 133 4.00 84 5.3 1.4 0.50 180150 64 1.4 2.8 82.7 131 4 82 4.7 1.4 0.7 202152 65 1.1 2.80 71.2 133 4.00 84 5 1.3 1.60156 63 1.5 2.80 51 131 4.00 82 5.1 1.4 1.00 190152 1.2 2.80 75 132 3.80 81 5.7 1.5 0.60 200155 62 1 2.80 51 132 3.80 81 5.6 1.5 0.70 194155 64 1.30 2.80 57.6 133 4.00 83 5.5 1.3 0.40 189152 66 1.10 2.80 60.5 133 3.80 84 6 1.4 1.10 215156 64 1.20 2.90 46.9 132 3.80 88 5.3 1.4 1.20 204162 68 1.20 3.00 60.1 130 3.70 79 5.2 1.4 0.30 203158 67 1.10 3.00 60.9 129 3.70 76 5 1.2 0.90 207153 65 1.90 2.90 71.2 3.60 74 5 1.5 1.00 223153 68 1.90 2.90 85.6 132 3.70 82 4.7 1.5 0.30 203148 66 1.80 2.80 54.3 132 3.70 82 5.4 1.5 0.50 222148 68 1.70 2.70 64 132 3.70 5.4 1.4 1.60 208158 64 1.80 2.90 44 134 3.80 95 5 1.4 0.30 214158 64 1.80 2.90 54.9 132 3.70 93 1.5 1.00 206158 64 1.50 2.90 65.4 130 3.70 93 1.4 0.50 205
154.35 64.89 1.43 2.85 64 #DIV/0! 132 3.83 84 5.25 1.4 0.76 202.53.8 1.8 0.3 0.1 11.8 #DIV/0! 1.3 0.1 5.4 0.37 0.1 0.4 11.62.44 2.76 20.68 2.67 18.57 #DIV/0! 0.96 3.69 6.45 7.13 5.88 52.87 5.74162 68.5 2.0 3.00 87 #DIV/0! 134 4.1 94 6.00 1.6 1.6 226147 61.3 0.8 2.70 40 #DIV/0! 129 3.5 73 4.50 1.2 0.0 179166 70.27 2.32 3.08 99 #DIV/0! 136 4.25 100 6.37 1.7 1.97 237143 59.52 0.54 2.62 28 #DIV/0! 128 3.40 67 4.13 1.2 -0.45 168
Expiry date : 31-03-2013
Back to index
Back to index
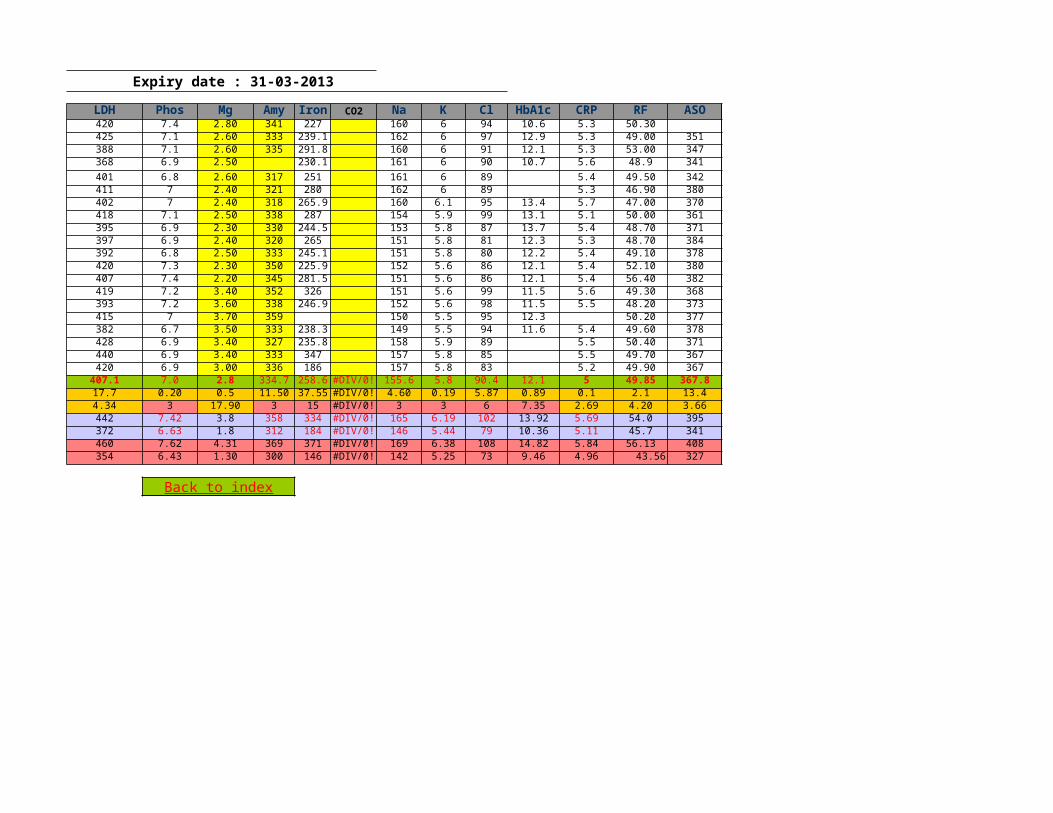
LDH Phos Mg Amy Iron CO2 Na K Cl HbA1c CRP RF ASO420 7.4 2.80 341 227 160 6 94 10.6 5.3 50.30425 7.1 2.60 333 239.1 162 6 97 12.9 5.3 49.00 351388 7.1 2.60 335 291.8 160 6 91 12.1 5.3 53.00 347368 6.9 2.50 230.1 161 6 90 10.7 5.6 48.9 341401 6.8 2.60 317 251 161 6 89 5.4 49.50 342411 7 2.40 321 280 162 6 89 5.3 46.90 380402 7 2.40 318 265.9 160 6.1 95 13.4 5.7 47.00 370418 7.1 2.50 338 287 154 5.9 99 13.1 5.1 50.00 361395 6.9 2.30 330 244.5 153 5.8 87 13.7 5.4 48.70 371397 6.9 2.40 320 265 151 5.8 81 12.3 5.3 48.70 384392 6.8 2.50 333 245.1 151 5.8 80 12.2 5.4 49.10 378420 7.3 2.30 350 225.9 152 5.6 86 12.1 5.4 52.10 380407 7.4 2.20 345 281.5 151 5.6 86 12.1 5.4 56.40 382419 7.2 3.40 352 326 151 5.6 99 11.5 5.6 49.30 368393 7.2 3.60 338 246.9 152 5.6 98 11.5 5.5 48.20 373415 7 3.70 359 150 5.5 95 12.3 50.20 377382 6.7 3.50 333 238.3 149 5.5 94 11.6 5.4 49.60 378428 6.9 3.40 327 235.8 158 5.9 89 5.5 50.40 371440 6.9 3.40 333 347 157 5.8 85 5.5 49.70 367420 6.9 3.00 336 186 157 5.8 83 5.2 49.90 367
407.1 7.0 2.8 334.7 258.6 #DIV/0! 155.6 5.8 90.4 12.1 5 49.85 367.817.7 0.20 0.5 11.50 37.55 #DIV/0! 4.60 0.19 5.87 0.89 0.1 2.1 13.44.34 3 17.90 3 15 #DIV/0! 3 3 6 7.35 2.69 4.20 3.66442 7.42 3.8 358 334 #DIV/0! 165 6.19 102 13.92 5.69 54.0 395372 6.63 1.8 312 184 #DIV/0! 146 5.44 79 10.36 5.11 45.7 341460 7.62 4.31 369 371 #DIV/0! 169 6.38 108 14.82 5.84 56.13 408354 6.43 1.30 300 146 #DIV/0! 142 5.25 73 9.46 4.96 43.56 327
Expiry date : 31-03-2013
Back to index
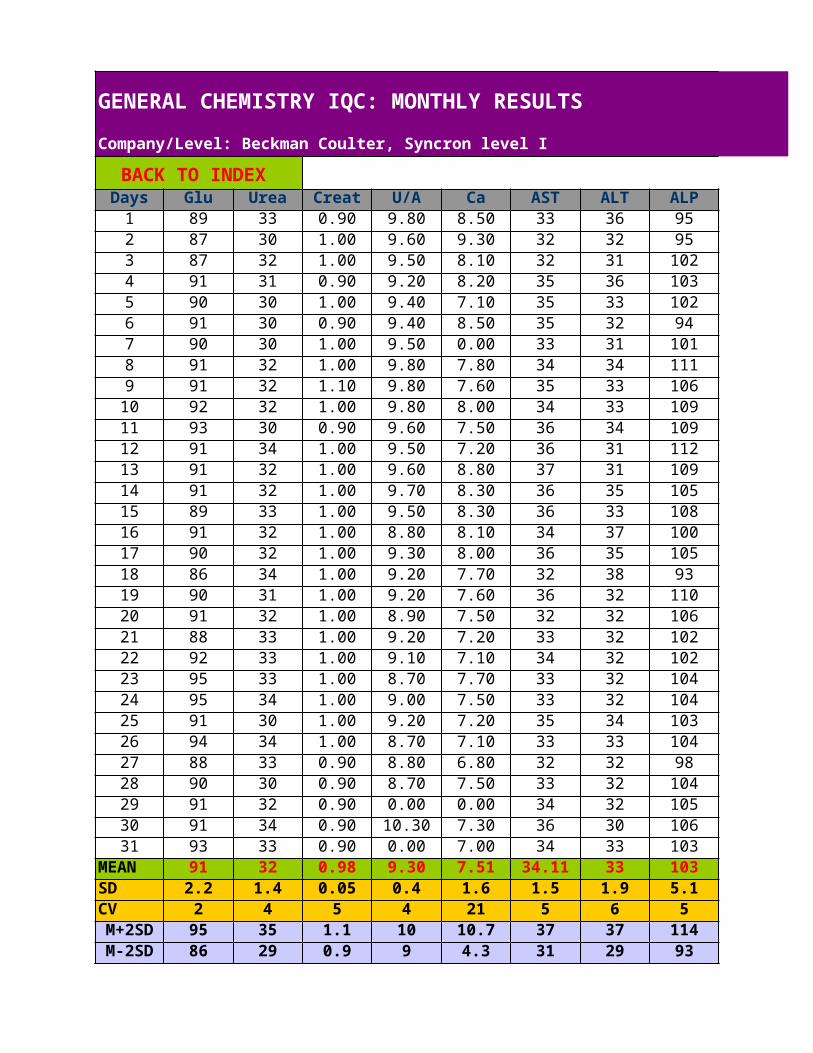
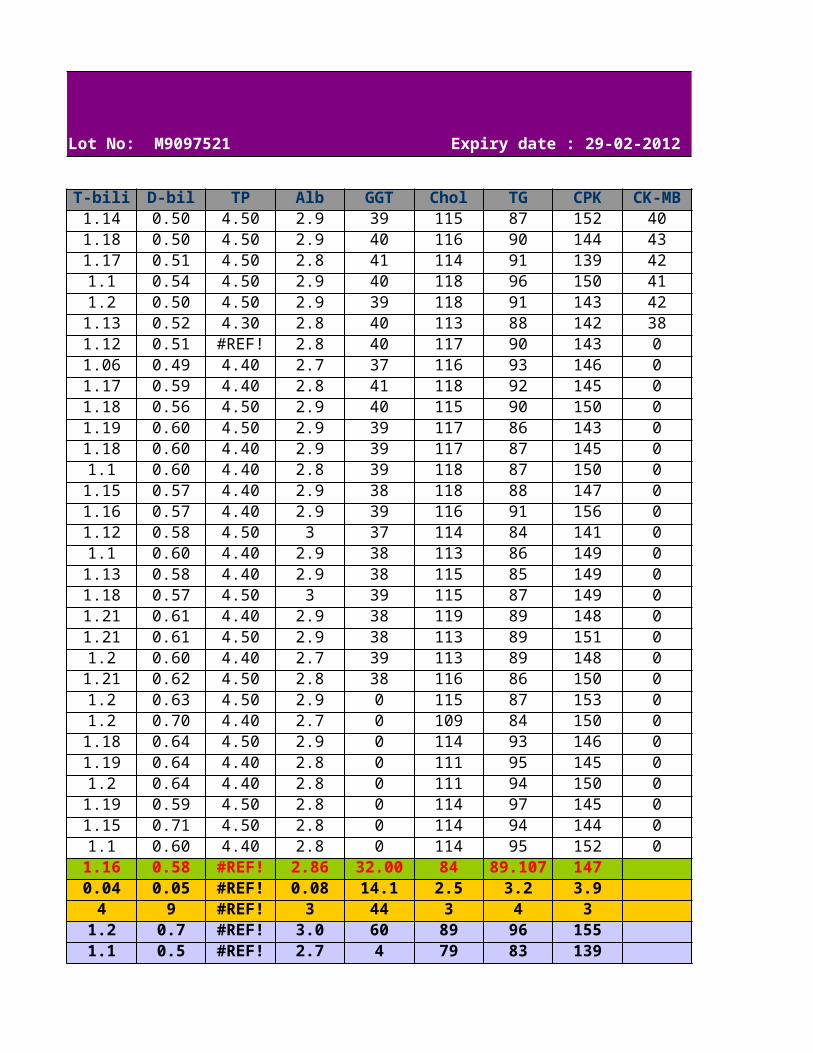
GENERAL CHEMISTRY IQC: MONTHLY RESULTSCompany/Level: Beckman Coulter, Syncron level I Lot No: M9097521 Expiry date : 29-02-2012
Days Glu Urea Creat U/A Ca AST ALT ALP1 89 33 0.90 9.80 8.50 33 36 952 87 30 1.00 9.60 9.30 32 32 953 87 32 1.00 9.50 8.10 32 31 1024 91 31 0.90 9.20 8.20 35 36 1035 90 30 1.00 9.40 7.10 35 33 1026 91 30 0.90 9.40 8.50 35 32 947 90 30 1.00 9.50 0.00 33 31 1018 91 32 1.00 9.80 7.80 34 34 1119 91 32 1.10 9.80 7.60 35 33 10610 92 32 1.00 9.80 8.00 34 33 10911 93 30 0.90 9.60 7.50 36 34 10912 91 34 1.00 9.50 7.20 36 31 11213 91 32 1.00 9.60 8.80 37 31 10914 91 32 1.00 9.70 8.30 36 35 10515 89 33 1.00 9.50 8.30 36 33 10816 91 32 1.00 8.80 8.10 34 37 10017 90 32 1.00 9.30 8.00 36 35 10518 86 34 1.00 9.20 7.70 32 38 9319 90 31 1.00 9.20 7.60 36 32 11020 91 32 1.00 8.90 7.50 32 32 10621 88 33 1.00 9.20 7.20 33 32 10222 92 33 1.00 9.10 7.10 34 32 10223 95 33 1.00 8.70 7.70 33 32 10424 95 34 1.00 9.00 7.50 33 32 10425 91 30 1.00 9.20 7.20 35 34 10326 94 34 1.00 8.70 7.10 33 33 10427 88 33 0.90 8.80 6.80 32 32 9828 90 30 0.90 8.70 7.50 33 32 10429 91 32 0.90 0.00 0.00 34 32 10530 91 34 0.90 10.30 7.30 36 30 10631 93 33 0.90 0.00 7.00 34 33 103
MEAN 91 32 0.98 9.30 7.51 34.11 33 103SD 2.2 1.4 0.05 0.4 1.6 1.5 1.9 5.1CV 2 4 5 4 21 5 6 5M+2SD 95 35 1.1 10 10.7 37 37 114M-2SD 86 29 0.9 9 4.3 31 29 93
BACK TO INDEX
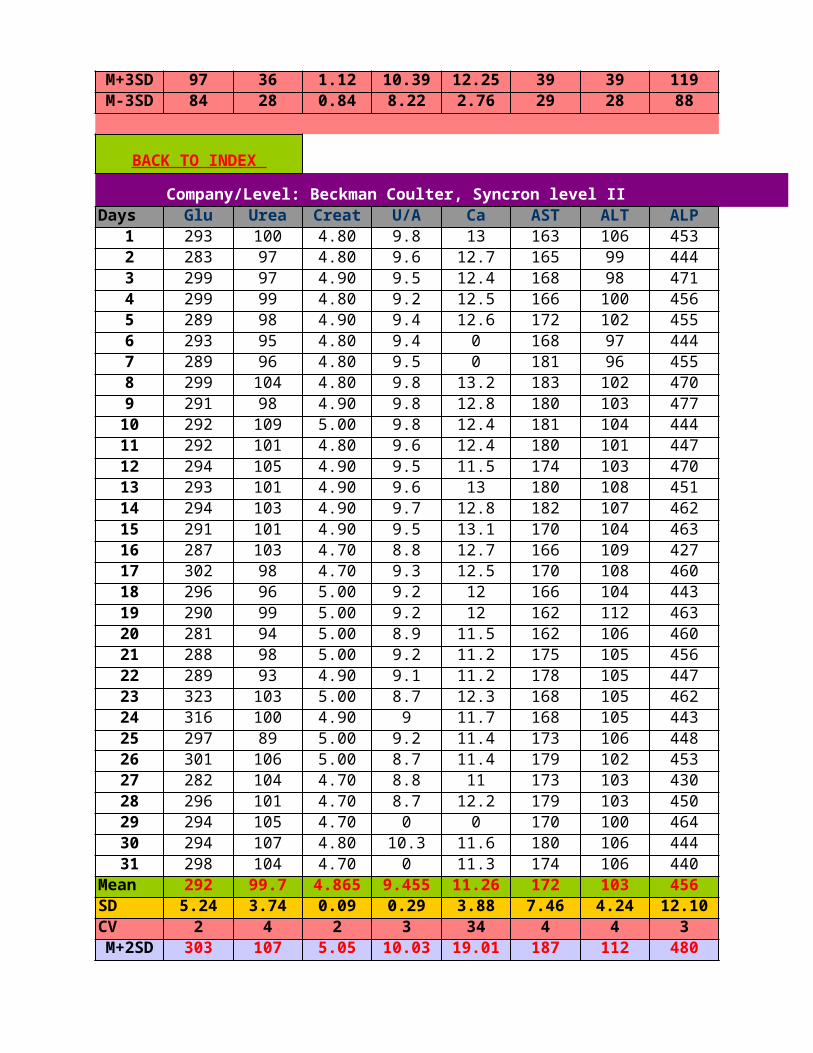
M+3SD 97 36 1.12 10.39 12.25 39 39 119M-3SD 84 28 0.84 8.22 2.76 29 28 88
BACK TO INDEX
Company/Level: Beckman Coulter, Syncron level II Lot No: M909752 Expiry date : 29-02-2012 Days Glu Urea Creat U/A Ca AST ALT ALP
1 293 100 4.80 9.8 13 163 106 4532 283 97 4.80 9.6 12.7 165 99 4443 299 97 4.90 9.5 12.4 168 98 4714 299 99 4.80 9.2 12.5 166 100 4565 289 98 4.90 9.4 12.6 172 102 4556 293 95 4.80 9.4 0 168 97 4447 289 96 4.80 9.5 0 181 96 4558 299 104 4.80 9.8 13.2 183 102 4709 291 98 4.90 9.8 12.8 180 103 47710 292 109 5.00 9.8 12.4 181 104 44411 292 101 4.80 9.6 12.4 180 101 44712 294 105 4.90 9.5 11.5 174 103 47013 293 101 4.90 9.6 13 180 108 45114 294 103 4.90 9.7 12.8 182 107 46215 291 101 4.90 9.5 13.1 170 104 46316 287 103 4.70 8.8 12.7 166 109 42717 302 98 4.70 9.3 12.5 170 108 46018 296 96 5.00 9.2 12 166 104 44319 290 99 5.00 9.2 12 162 112 46320 281 94 5.00 8.9 11.5 162 106 46021 288 98 5.00 9.2 11.2 175 105 45622 289 93 4.90 9.1 11.2 178 105 44723 323 103 5.00 8.7 12.3 168 105 46224 316 100 4.90 9 11.7 168 105 44325 297 89 5.00 9.2 11.4 173 106 44826 301 106 5.00 8.7 11.4 179 102 45327 282 104 4.70 8.8 11 173 103 43028 296 101 4.70 8.7 12.2 179 103 45029 294 105 4.70 0 0 170 100 46430 294 107 4.80 10.3 11.6 180 106 44431 298 104 4.70 0 11.3 174 106 440
Mean 292 99.7 4.865 9.455 11.26 172 103 456SD 5.24 3.74 0.09 0.29 3.88 7.46 4.24 12.10CV 2 4 2 3 34 4 4 3M+2SD 303 107 5.05 10.03 19.01 187 112 480
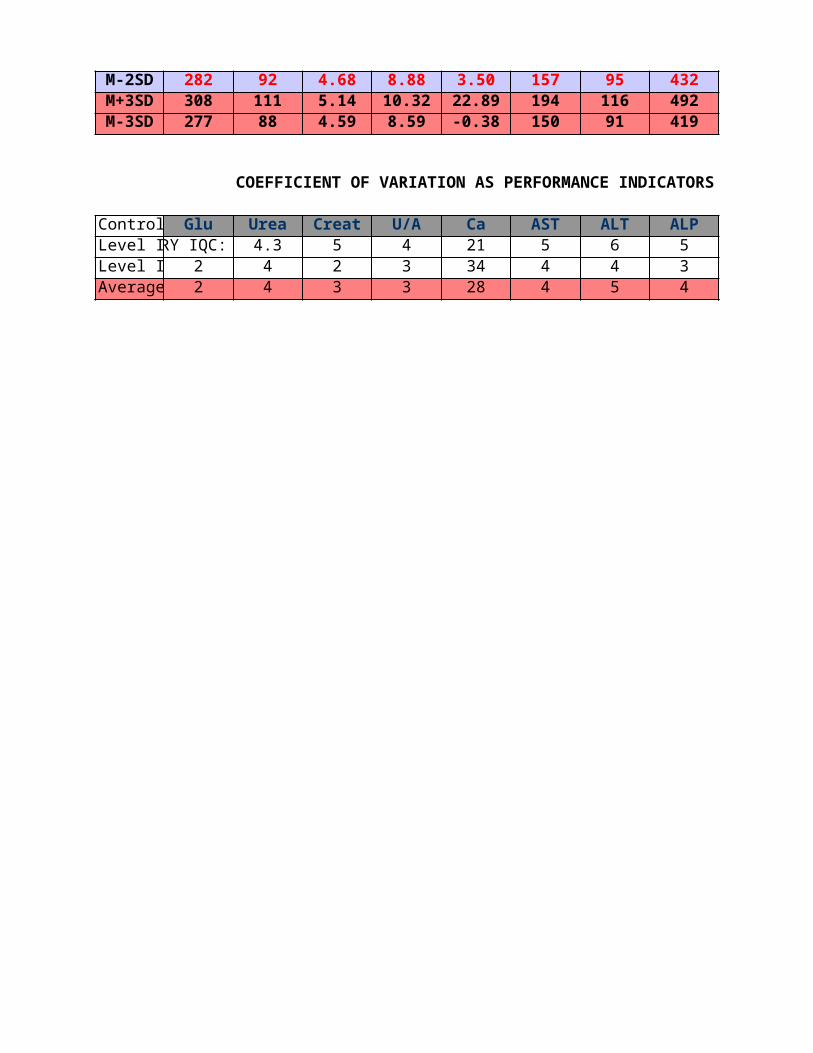
M-2SD 282 92 4.68 8.88 3.50 157 95 432M+3SD 308 111 5.14 10.32 22.89 194 116 492M-3SD 277 88 4.59 8.59 -0.38 150 91 419
COEFFICIENT OF VARIATION AS PERFORMANCE INDICATORS
Control Glu Urea Creat U/A Ca AST ALT ALPLevel IGENERAL CHEMISTRY IQC: MONTHLY RESULTS4.3 5 4 21 5 6 5Level I 2 4 2 3 34 4 4 3Average 2 4 3 3 28 4 5 4
GENERAL CHEMISTRY IQC: MONTHLY RESULTSCompany/Level: Beckman Coulter, Syncron level I Lot No: M9097521 Expiry date : 29-02-2012
T-bili D-bil TP Alb GGT Chol TG CPK CK-MB1.14 0.50 4.50 2.9 39 115 87 152 401.18 0.50 4.50 2.9 40 116 90 144 431.17 0.51 4.50 2.8 41 114 91 139 421.1 0.54 4.50 2.9 40 118 96 150 411.2 0.50 4.50 2.9 39 118 91 143 421.13 0.52 4.30 2.8 40 113 88 142 381.12 0.51 #REF! 2.8 40 117 90 143 01.06 0.49 4.40 2.7 37 116 93 146 01.17 0.59 4.40 2.8 41 118 92 145 01.18 0.56 4.50 2.9 40 115 90 150 01.19 0.60 4.50 2.9 39 117 86 143 01.18 0.60 4.40 2.9 39 117 87 145 01.1 0.60 4.40 2.8 39 118 87 150 01.15 0.57 4.40 2.9 38 118 88 147 01.16 0.57 4.40 2.9 39 116 91 156 01.12 0.58 4.50 3 37 114 84 141 01.1 0.60 4.40 2.9 38 113 86 149 01.13 0.58 4.40 2.9 38 115 85 149 01.18 0.57 4.50 3 39 115 87 149 01.21 0.61 4.40 2.9 38 119 89 148 01.21 0.61 4.50 2.9 38 113 89 151 01.2 0.60 4.40 2.7 39 113 89 148 01.21 0.62 4.50 2.8 38 116 86 150 01.2 0.63 4.50 2.9 0 115 87 153 01.2 0.70 4.40 2.7 0 109 84 150 01.18 0.64 4.50 2.9 0 114 93 146 01.19 0.64 4.40 2.8 0 111 95 145 01.2 0.64 4.40 2.8 0 111 94 150 01.19 0.59 4.50 2.8 0 114 97 145 01.15 0.71 4.50 2.8 0 114 94 144 01.1 0.60 4.40 2.8 0 114 95 152 01.16 0.58 #REF! 2.86 32.00 84 89.107 1470.04 0.05 #REF! 0.08 14.1 2.5 3.2 3.94 9 #REF! 3 44 3 4 3
1.2 0.7 #REF! 3.0 60 89 96 1551.1 0.5 #REF! 2.7 4 79 83 139
1.29 0.74 #REF! 3.09 74 91 99 1591.04 0.42 #REF! 2.62 -10 77 79 135
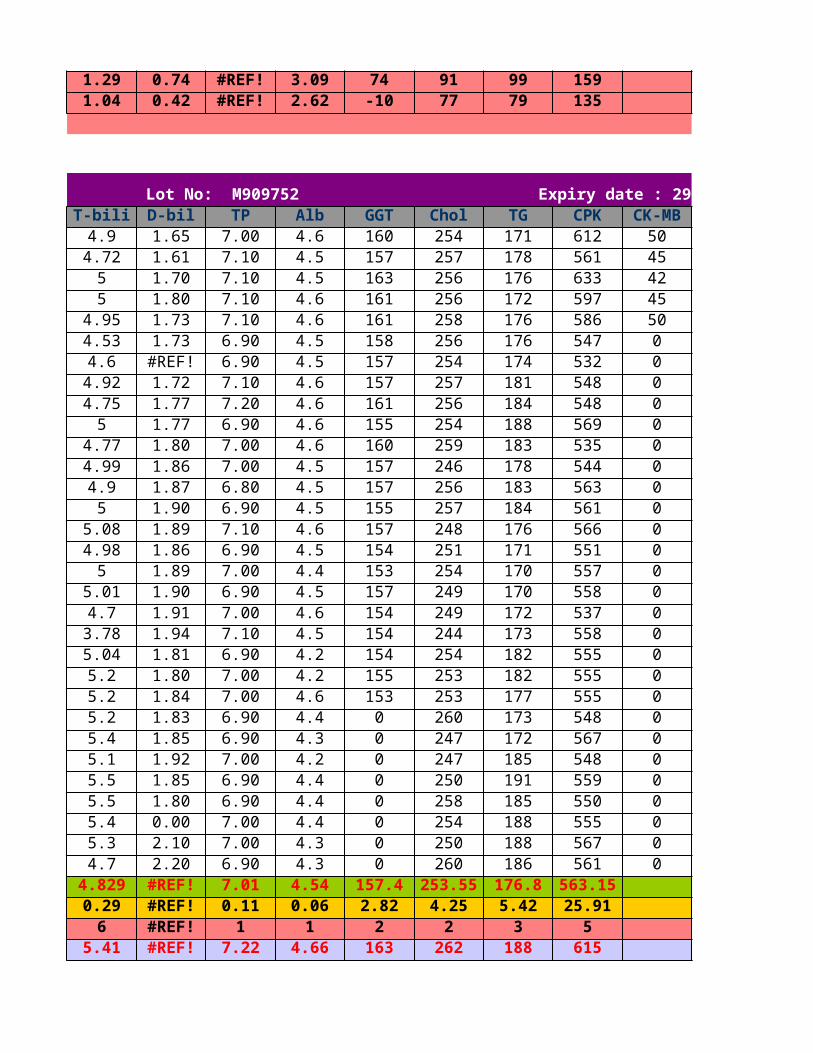
Company/Level: Beckman Coulter, Syncron level II Lot No: M909752 Expiry date : 29-02-2012 T-bili D-bil TP Alb GGT Chol TG CPK CK-MB4.9 1.65 7.00 4.6 160 254 171 612 504.72 1.61 7.10 4.5 157 257 178 561 455 1.70 7.10 4.5 163 256 176 633 425 1.80 7.10 4.6 161 256 172 597 45
4.95 1.73 7.10 4.6 161 258 176 586 504.53 1.73 6.90 4.5 158 256 176 547 04.6 #REF! 6.90 4.5 157 254 174 532 04.92 1.72 7.10 4.6 157 257 181 548 04.75 1.77 7.20 4.6 161 256 184 548 05 1.77 6.90 4.6 155 254 188 569 0
4.77 1.80 7.00 4.6 160 259 183 535 04.99 1.86 7.00 4.5 157 246 178 544 04.9 1.87 6.80 4.5 157 256 183 563 05 1.90 6.90 4.5 155 257 184 561 0
5.08 1.89 7.10 4.6 157 248 176 566 04.98 1.86 6.90 4.5 154 251 171 551 05 1.89 7.00 4.4 153 254 170 557 0
5.01 1.90 6.90 4.5 157 249 170 558 04.7 1.91 7.00 4.6 154 249 172 537 03.78 1.94 7.10 4.5 154 244 173 558 05.04 1.81 6.90 4.2 154 254 182 555 05.2 1.80 7.00 4.2 155 253 182 555 05.2 1.84 7.00 4.6 153 253 177 555 05.2 1.83 6.90 4.4 0 260 173 548 05.4 1.85 6.90 4.3 0 247 172 567 05.1 1.92 7.00 4.2 0 247 185 548 05.5 1.85 6.90 4.4 0 250 191 559 05.5 1.80 6.90 4.4 0 258 185 550 05.4 0.00 7.00 4.4 0 254 188 555 05.3 2.10 7.00 4.3 0 250 188 567 04.7 2.20 6.90 4.3 0 260 186 561 0
4.829 #REF! 7.01 4.54 157.4 253.55 176.8 563.150.29 #REF! 0.11 0.06 2.82 4.25 5.42 25.916 #REF! 1 1 2 2 3 5
5.41 #REF! 7.22 4.66 163 262 188 615
4.25 #REF! 6.79 4.42 152 245 166 5115.70 #REF! 7.32 4.72 166 266 193 6413.96 #REF! 6.69 4.36 149 241 161 485
COEFFICIENT OF VARIATION AS PERFORMANCE INDICATORS
T-bili D-bil TP Alb GGT Chol TG CPK CK-MB4 9 #REF! 3 44 3 4 3 06 #REF! 1 1 2 2 3 5 05 #REF! #REF! 2 23 2 3 4 0
GENERAL CHEMISTRY IQC: MONTHLY RESULTSCompany/Level: Beckman Coulter, Syncron level I Lot No: M9097521 Expiry date : 29-02-2012
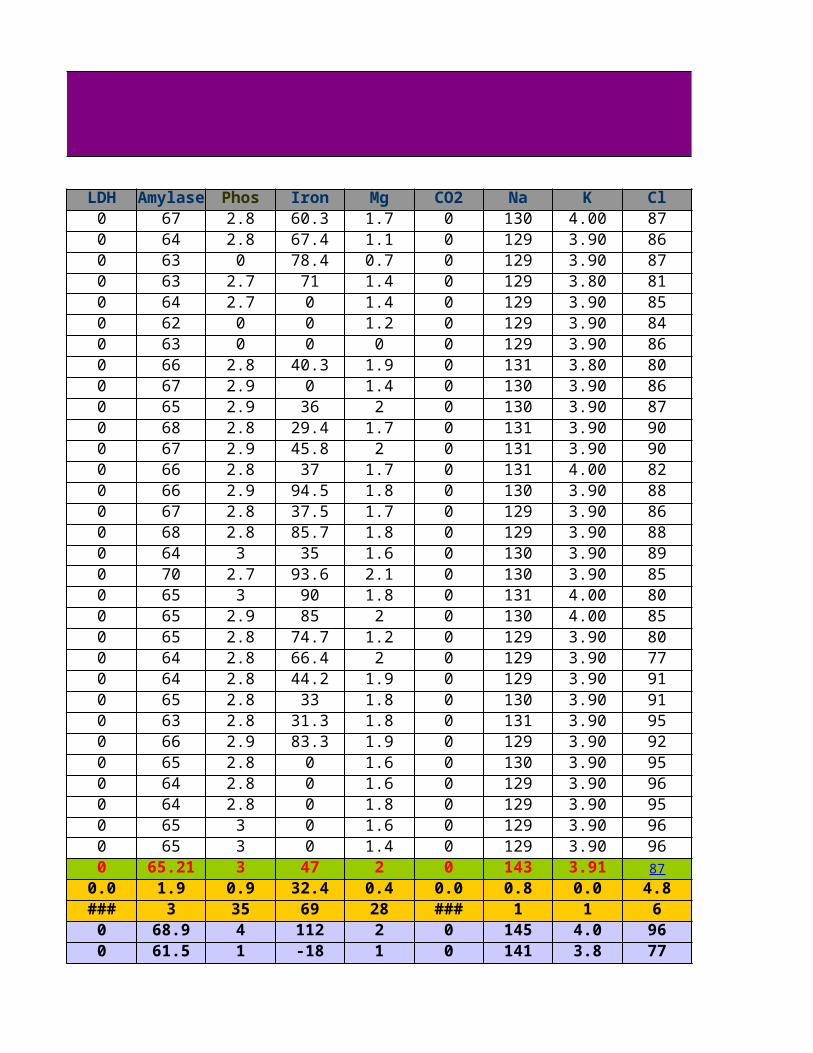
LDH Amylase Phos Iron Mg CO2 Na K Cl0 67 2.8 60.3 1.7 0 130 4.00 870 64 2.8 67.4 1.1 0 129 3.90 860 63 0 78.4 0.7 0 129 3.90 870 63 2.7 71 1.4 0 129 3.80 810 64 2.7 0 1.4 0 129 3.90 850 62 0 0 1.2 0 129 3.90 840 63 0 0 0 0 129 3.90 860 66 2.8 40.3 1.9 0 131 3.80 800 67 2.9 0 1.4 0 130 3.90 860 65 2.9 36 2 0 130 3.90 870 68 2.8 29.4 1.7 0 131 3.90 900 67 2.9 45.8 2 0 131 3.90 900 66 2.8 37 1.7 0 131 4.00 820 66 2.9 94.5 1.8 0 130 3.90 880 67 2.8 37.5 1.7 0 129 3.90 860 68 2.8 85.7 1.8 0 129 3.90 880 64 3 35 1.6 0 130 3.90 890 70 2.7 93.6 2.1 0 130 3.90 850 65 3 90 1.8 0 131 4.00 800 65 2.9 85 2 0 130 4.00 850 65 2.8 74.7 1.2 0 129 3.90 800 64 2.8 66.4 2 0 129 3.90 770 64 2.8 44.2 1.9 0 129 3.90 910 65 2.8 33 1.8 0 130 3.90 910 63 2.8 31.3 1.8 0 131 3.90 950 66 2.9 83.3 1.9 0 129 3.90 920 65 2.8 0 1.6 0 130 3.90 950 64 2.8 0 1.6 0 129 3.90 960 64 2.8 0 1.8 0 129 3.90 950 65 3 0 1.6 0 129 3.90 960 65 3 0 1.4 0 129 3.90 960 65.21 3 47 2 0 143 3.91 87
0.0 1.9 0.9 32.4 0.4 0.0 0.8 0.0 4.8### 3 35 69 28 ### 1 1 60 68.9 4 112 2 0 145 4.0 960 61.5 1 -18 1 0 141 3.8 77
0 70.77 5 144 3 0 145 4.05 1010 59.66 0 -50 0 0 141 3.77 72
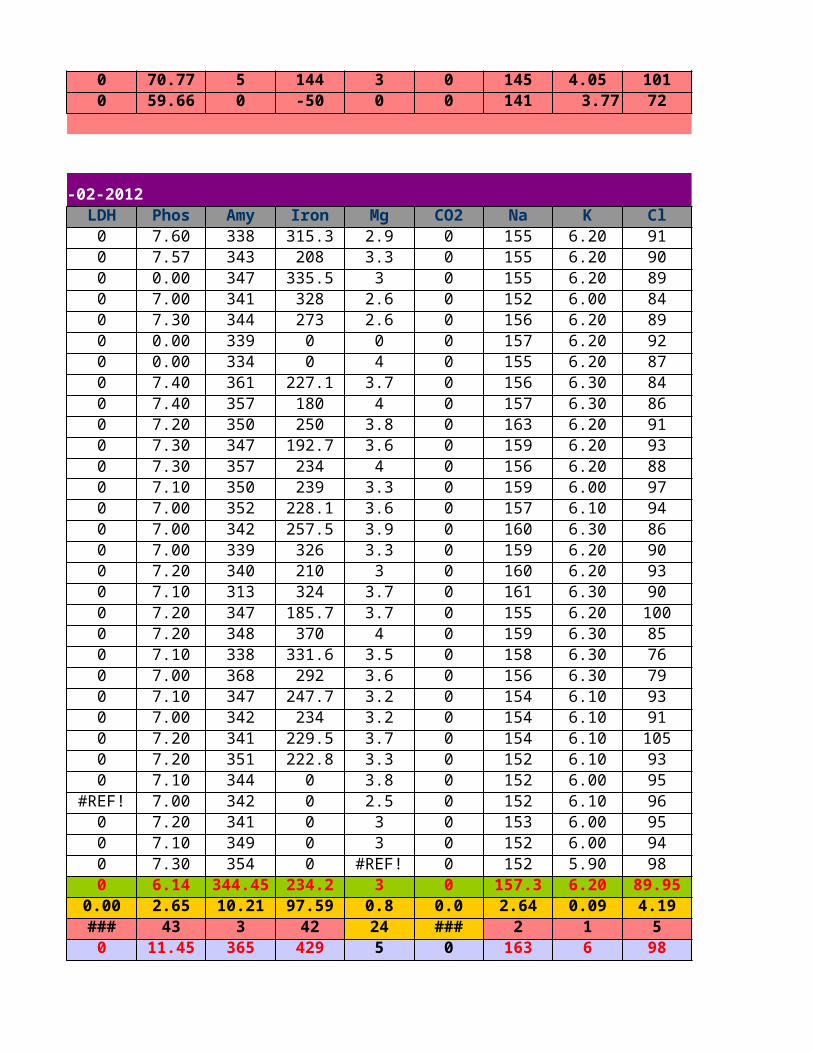
Company/Level: Beckman Coulter, Syncron level II Lot No: M909752 Expiry date : 29-02-2012 LDH Phos Amy Iron Mg CO2 Na K Cl0 7.60 338 315.3 2.9 0 155 6.20 910 7.57 343 208 3.3 0 155 6.20 900 0.00 347 335.5 3 0 155 6.20 890 7.00 341 328 2.6 0 152 6.00 840 7.30 344 273 2.6 0 156 6.20 890 0.00 339 0 0 0 157 6.20 920 0.00 334 0 4 0 155 6.20 870 7.40 361 227.1 3.7 0 156 6.30 840 7.40 357 180 4 0 157 6.30 860 7.20 350 250 3.8 0 163 6.20 910 7.30 347 192.7 3.6 0 159 6.20 930 7.30 357 234 4 0 156 6.20 880 7.10 350 239 3.3 0 159 6.00 970 7.00 352 228.1 3.6 0 157 6.10 940 7.00 342 257.5 3.9 0 160 6.30 860 7.00 339 326 3.3 0 159 6.20 900 7.20 340 210 3 0 160 6.20 930 7.10 313 324 3.7 0 161 6.30 900 7.20 347 185.7 3.7 0 155 6.20 1000 7.20 348 370 4 0 159 6.30 850 7.10 338 331.6 3.5 0 158 6.30 760 7.00 368 292 3.6 0 156 6.30 790 7.10 347 247.7 3.2 0 154 6.10 930 7.00 342 234 3.2 0 154 6.10 910 7.20 341 229.5 3.7 0 154 6.10 1050 7.20 351 222.8 3.3 0 152 6.10 930 7.10 344 0 3.8 0 152 6.00 95
#REF! 7.00 342 0 2.5 0 152 6.10 960 7.20 341 0 3 0 153 6.00 950 7.10 349 0 3 0 152 6.00 940 7.30 354 0 #REF! 0 152 5.90 980 6.14 344.45 234.2 3 0 157.3 6.20 89.95
0.00 2.65 10.21 97.59 0.8 0.0 2.64 0.09 4.19### 43 3 42 24 ### 2 1 50 11.45 365 429 5 0 163 6 98
0 0.84 324 39 2 0 152 6 820 14.10 375 527 6 0 165 6.46 1030 -1.82 314 -59 1 0 149 5.94 77
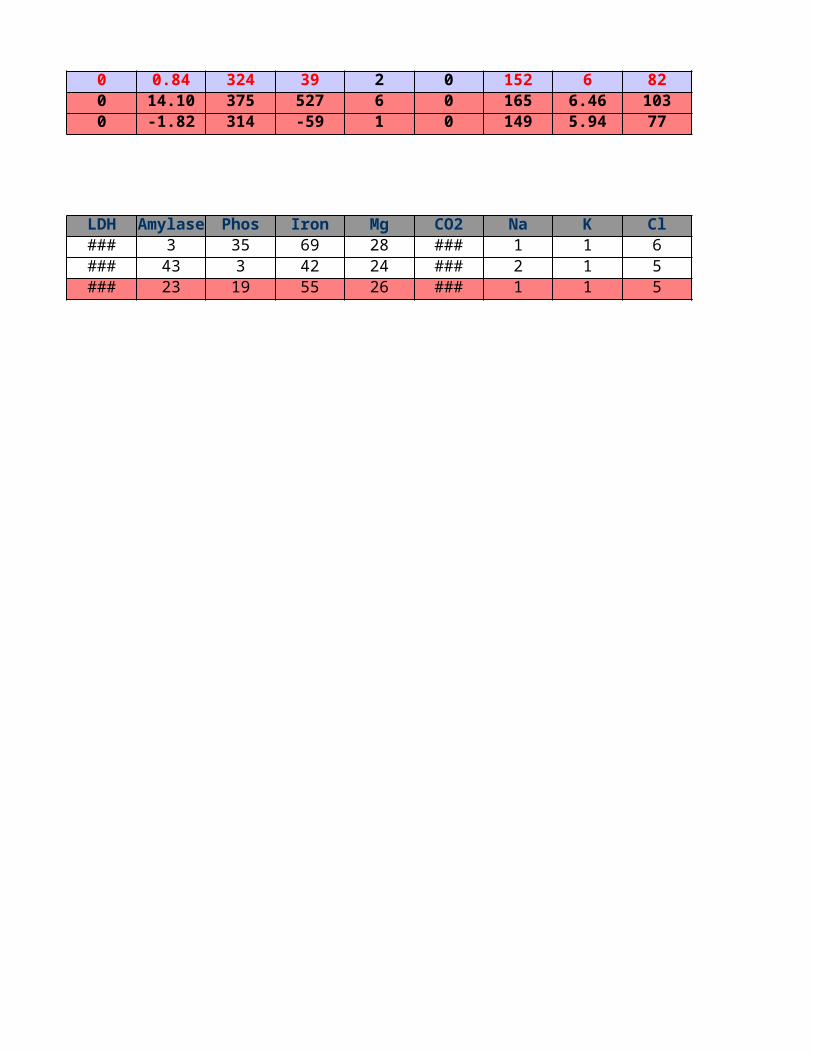
LDH Amylase Phos Iron Mg CO2 Na K Cl### 3 35 69 28 ### 1 1 6### 43 3 42 24 ### 2 1 5### 23 19 55 26 ### 1 1 5
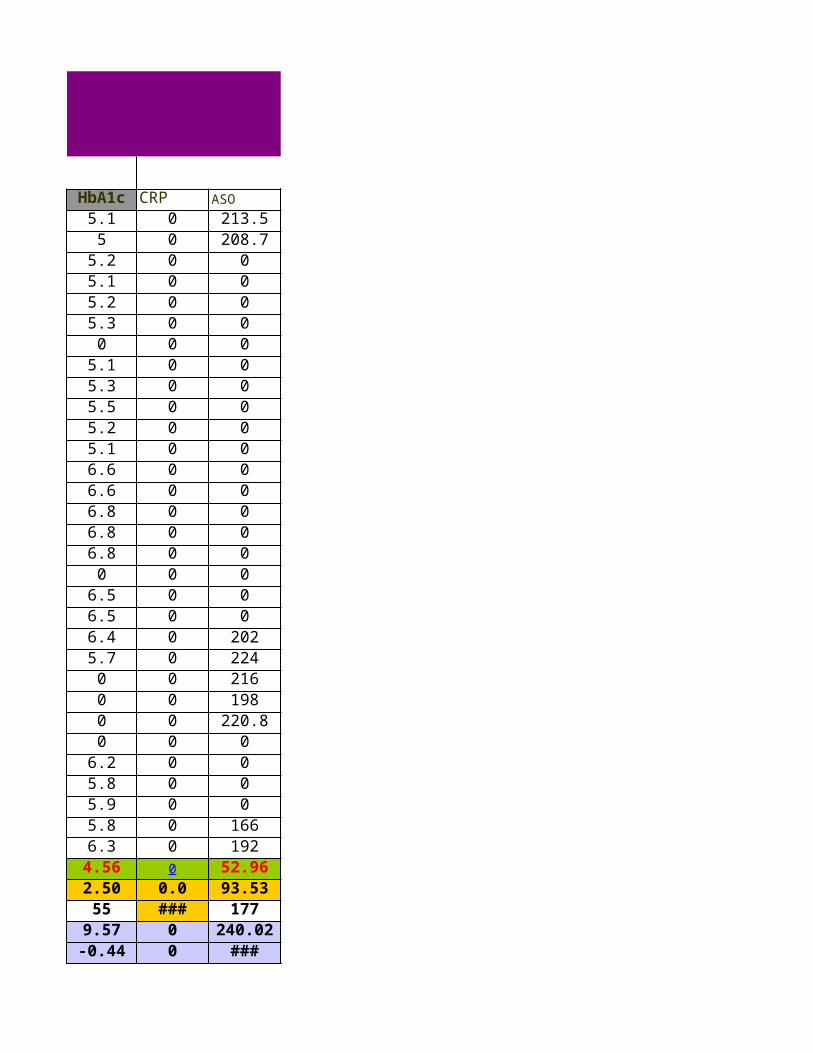
HbA1c CRP ASO5.1 0 213.55 0 208.7
5.2 0 05.1 0 05.2 0 05.3 0 00 0 0
5.1 0 05.3 0 05.5 0 05.2 0 05.1 0 06.6 0 06.6 0 06.8 0 06.8 0 06.8 0 00 0 0
6.5 0 06.5 0 06.4 0 2025.7 0 2240 0 2160 0 1980 0 220.80 0 0
6.2 0 05.8 0 05.9 0 05.8 0 1666.3 0 1924.56 0 52.962.50 0.0 93.5355 ### 177
9.57 0 240.02-0.44 0 ###
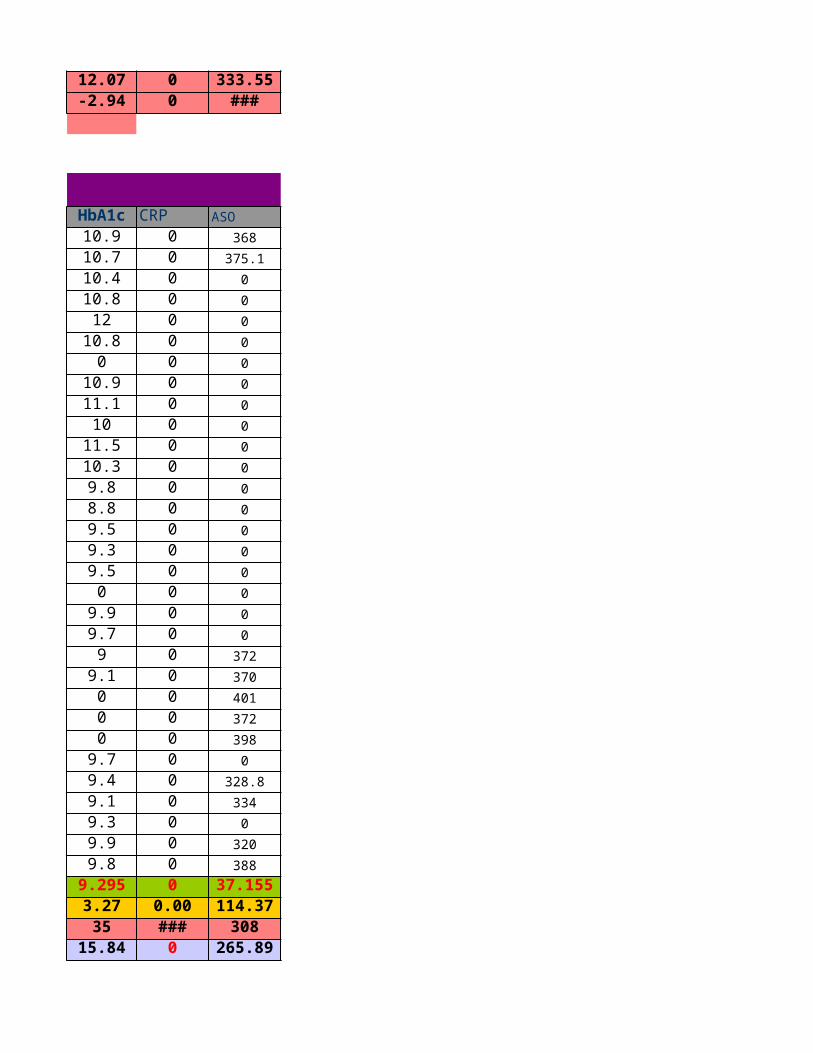
12.07 0 333.55-2.94 0 ###
HbA1c CRP ASO10.9 0 36810.7 0 375.110.4 0 010.8 0 012 0 0
10.8 0 00 0 0
10.9 0 011.1 0 010 0 0
11.5 0 010.3 0 09.8 0 08.8 0 09.5 0 09.3 0 09.5 0 00 0 0
9.9 0 09.7 0 09 0 372
9.1 0 3700 0 4010 0 3720 0 398
9.7 0 09.4 0 328.89.1 0 3349.3 0 09.9 0 3209.8 0 388
9.295 0 37.1553.27 0.00 114.3735 ### 308
15.84 0 265.89
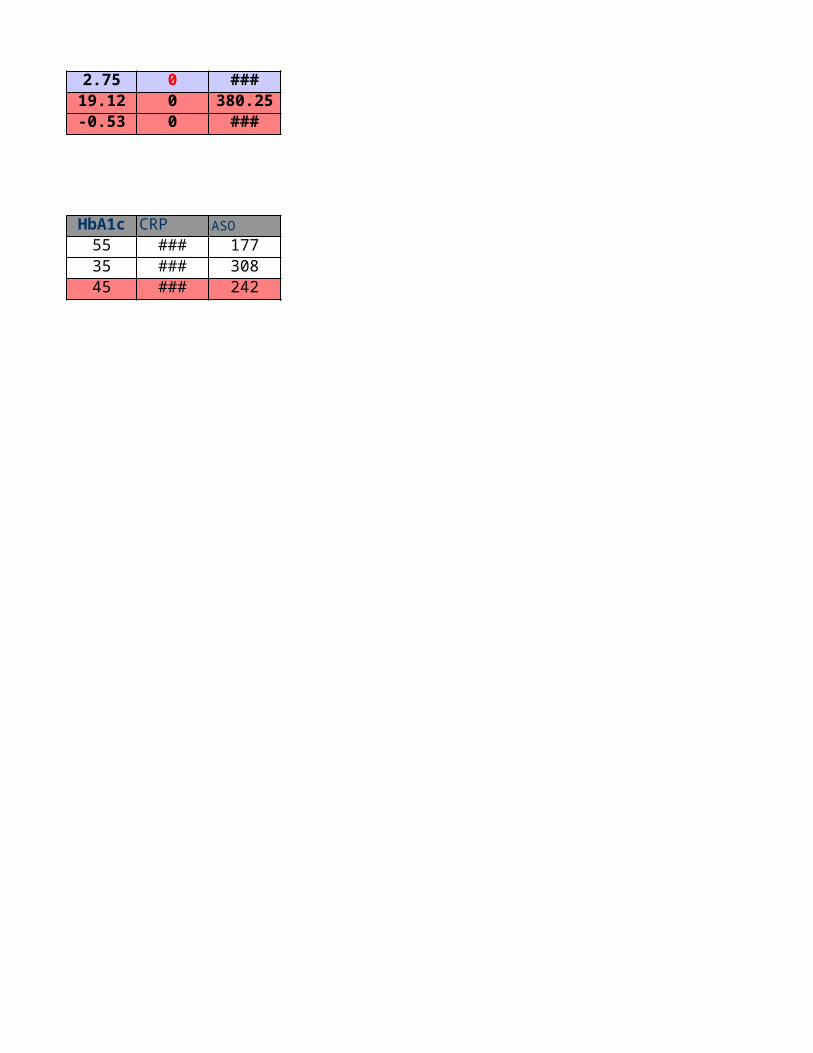
2.75 0 ###19.12 0 380.25-0.53 0 ###
HbA1c CRP ASO55 ### 17735 ### 30845 ### 242
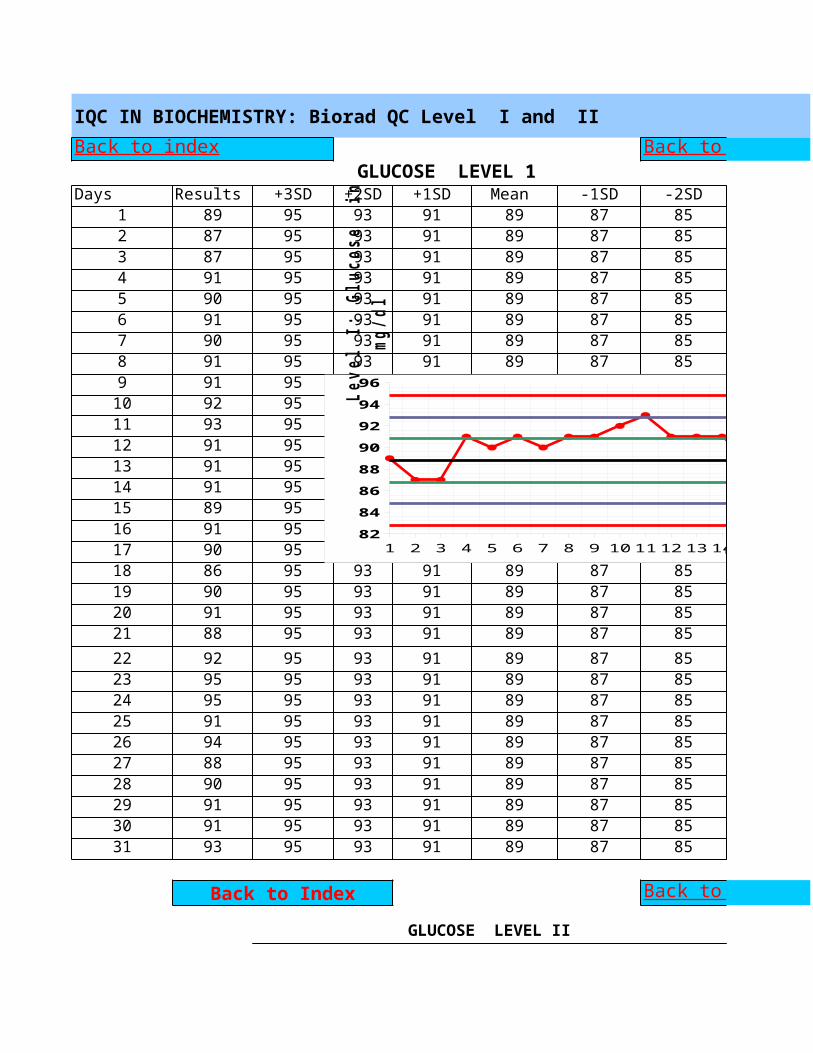
IQC IN BIOCHEMISTRY: Biorad QC Level I and II
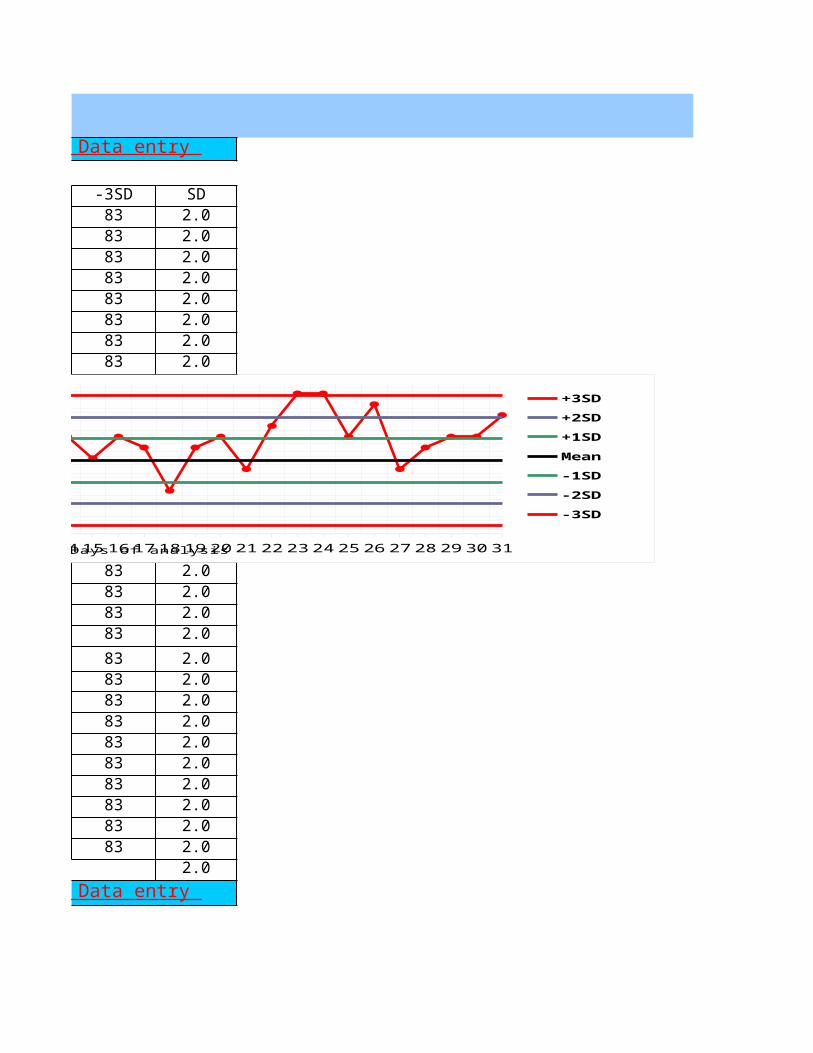
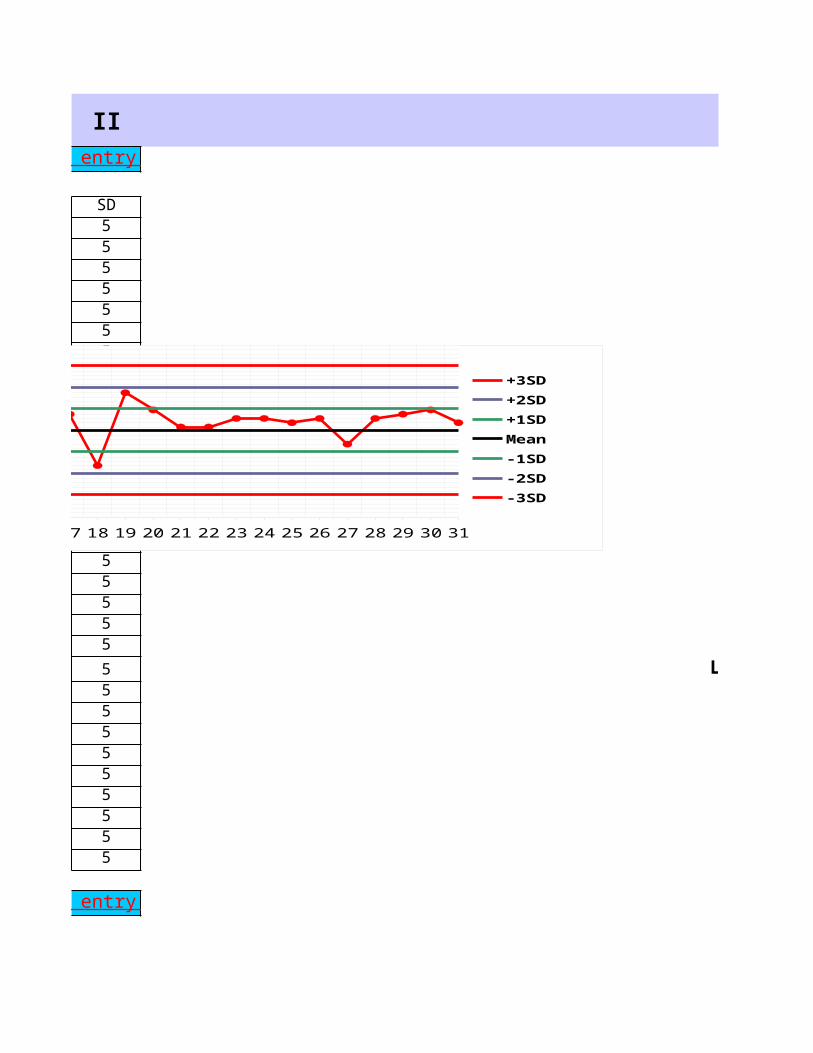
GLUCOSE LEVEL 1Days Results +3SD +2SD +1SD Mean -1SD -2SD
1 89 95 93 91 89 87 852 87 95 93 91 89 87 853 87 95 93 91 89 87 854 91 95 93 91 89 87 855 90 95 93 91 89 87 856 91 95 93 91 89 87 857 90 95 93 91 89 87 858 91 95 93 91 89 87 859 91 95 93 91 89 87 8510 92 95 93 91 89 87 8511 93 95 93 91 89 87 8512 91 95 93 91 89 87 8513 91 95 93 91 89 87 8514 91 95 93 91 89 87 8515 89 95 93 91 89 87 8516 91 95 93 91 89 87 8517 90 95 93 91 89 87 8518 86 95 93 91 89 87 8519 90 95 93 91 89 87 8520 91 95 93 91 89 87 8521 88 95 93 91 89 87 8522 92 95 93 91 89 87 8523 95 95 93 91 89 87 8524 95 95 93 91 89 87 8525 91 95 93 91 89 87 8526 94 95 93 91 89 87 8527 88 95 93 91 89 87 8528 90 95 93 91 89 87 8529 91 95 93 91 89 87 8530 91 95 93 91 89 87 8531 93 95 93 91 89 87 85
Back to IndexGLUCOSE LEVEL II
Back to index Back to Data entry
Back to Data entry
1 2 3 4 5 6 7 8 9 10 1112 13 141516 17 18 1920 2122 23 24 25 26 2728 29 30 318284868890929496
+3SD+2SD+1SDMean -1SD-2SD-3SD
Days of analysis
Leve
l I:
Glu
cose
in
mg
/dl
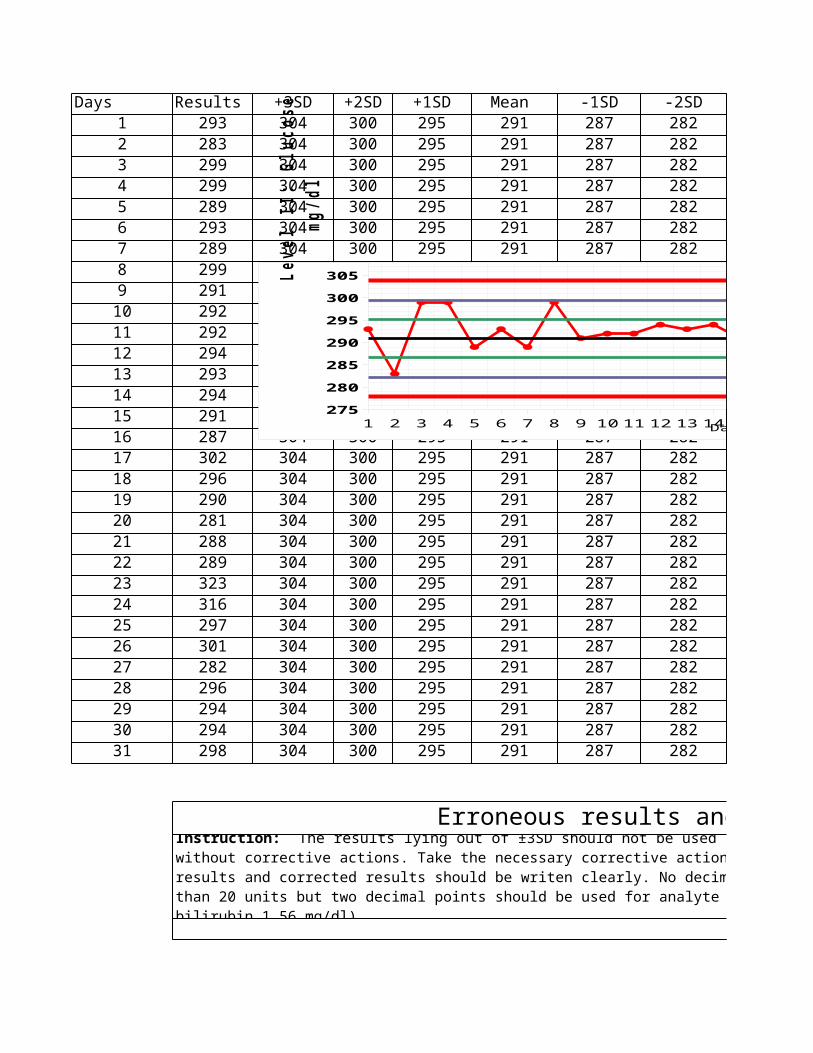
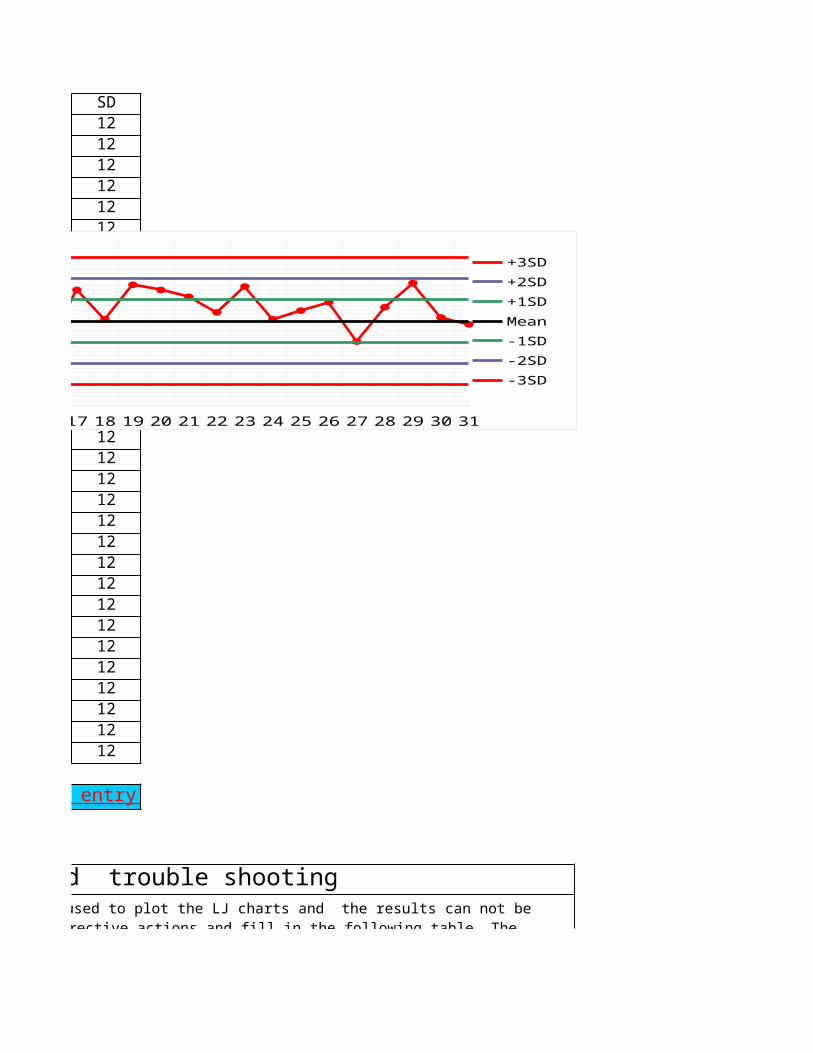
Days Results +3SD +2SD +1SD Mean -1SD -2SD1 293 304 300 295 291 287 2822 283 304 300 295 291 287 2823 299 304 300 295 291 287 2824 299 304 300 295 291 287 2825 289 304 300 295 291 287 2826 293 304 300 295 291 287 2827 289 304 300 295 291 287 2828 299 304 300 295 291 287 2829 291 304 300 295 291 287 28210 292 304 300 295 291 287 28211 292 304 300 295 291 287 28212 294 304 300 295 291 287 28213 293 304 300 295 291 287 28214 294 304 300 295 291 287 28215 291 304 300 295 291 287 28216 287 304 300 295 291 287 28217 302 304 300 295 291 287 28218 296 304 300 295 291 287 28219 290 304 300 295 291 287 28220 281 304 300 295 291 287 28221 288 304 300 295 291 287 28222 289 304 300 295 291 287 28223 323 304 300 295 291 287 28224 316 304 300 295 291 287 28225 297 304 300 295 291 287 28226 301 304 300 295 291 287 28227 282 304 300 295 291 287 28228 296 304 300 295 291 287 28229 294 304 300 295 291 287 28230 294 304 300 295 291 287 28231 298 304 300 295 291 287 282
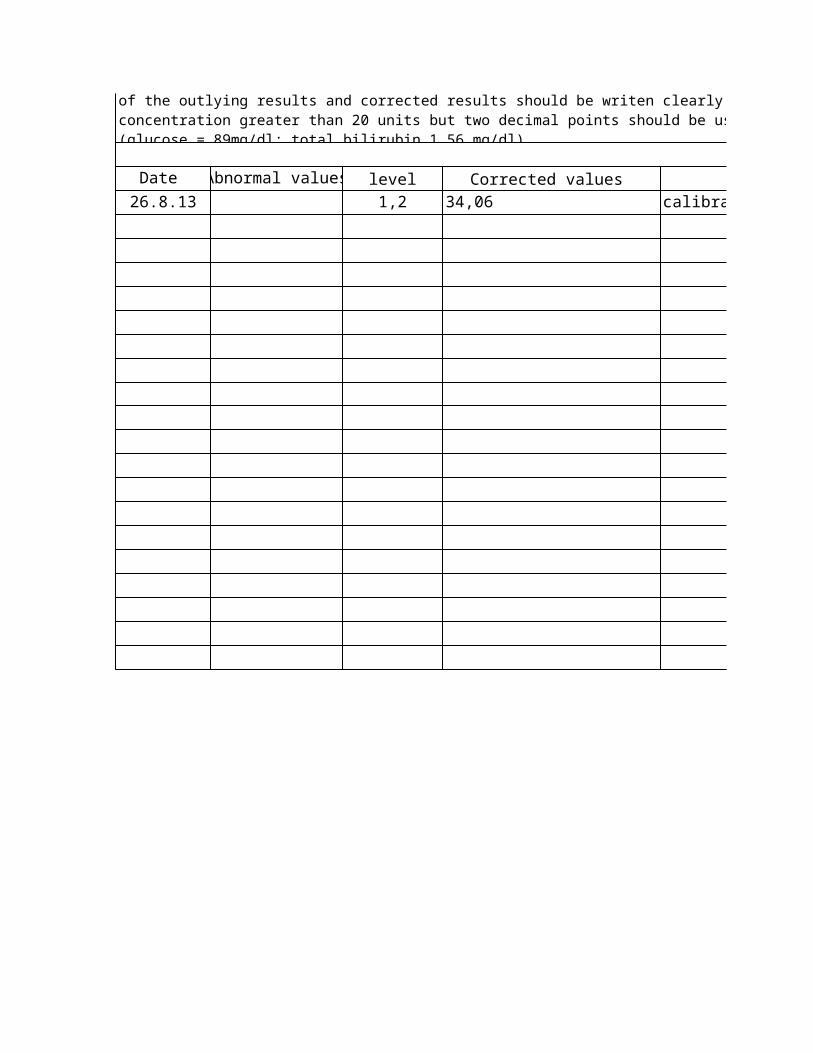
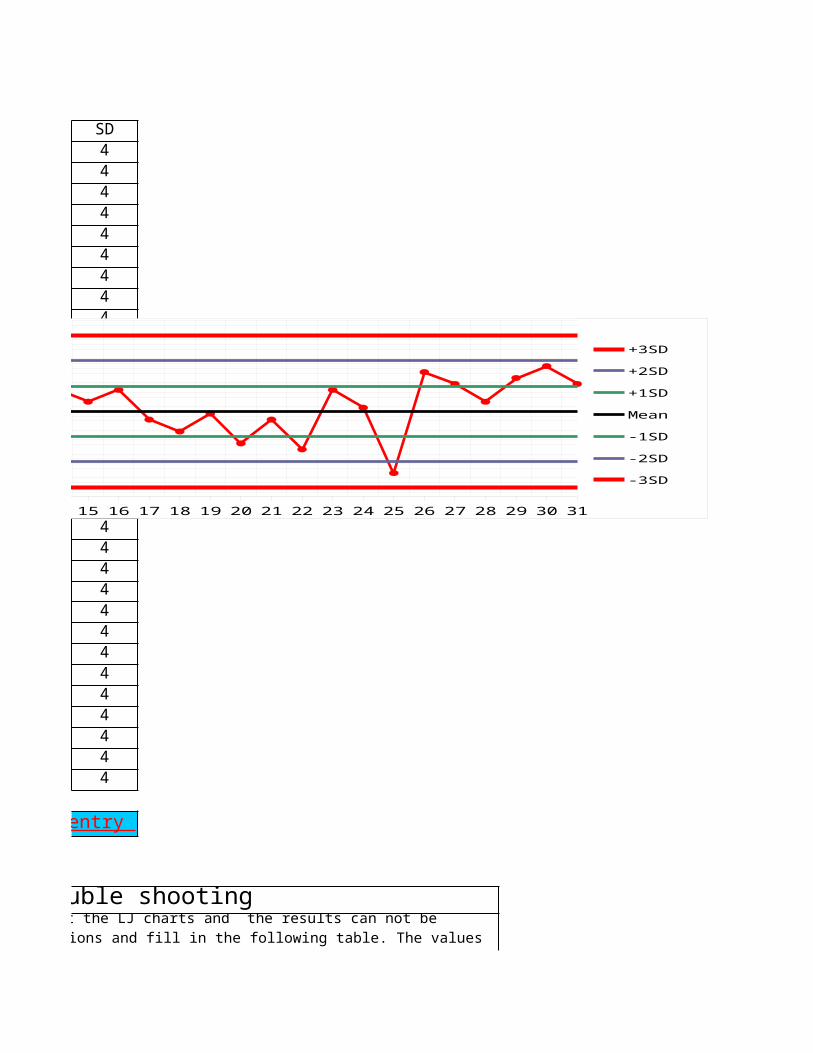
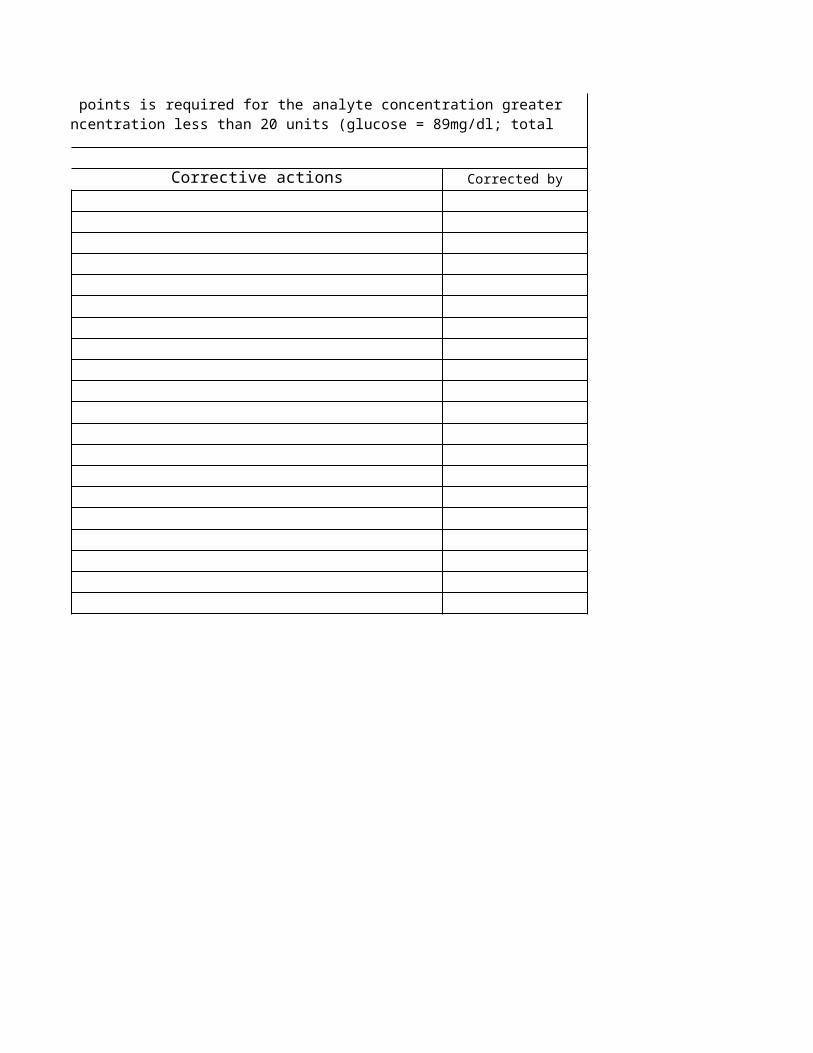
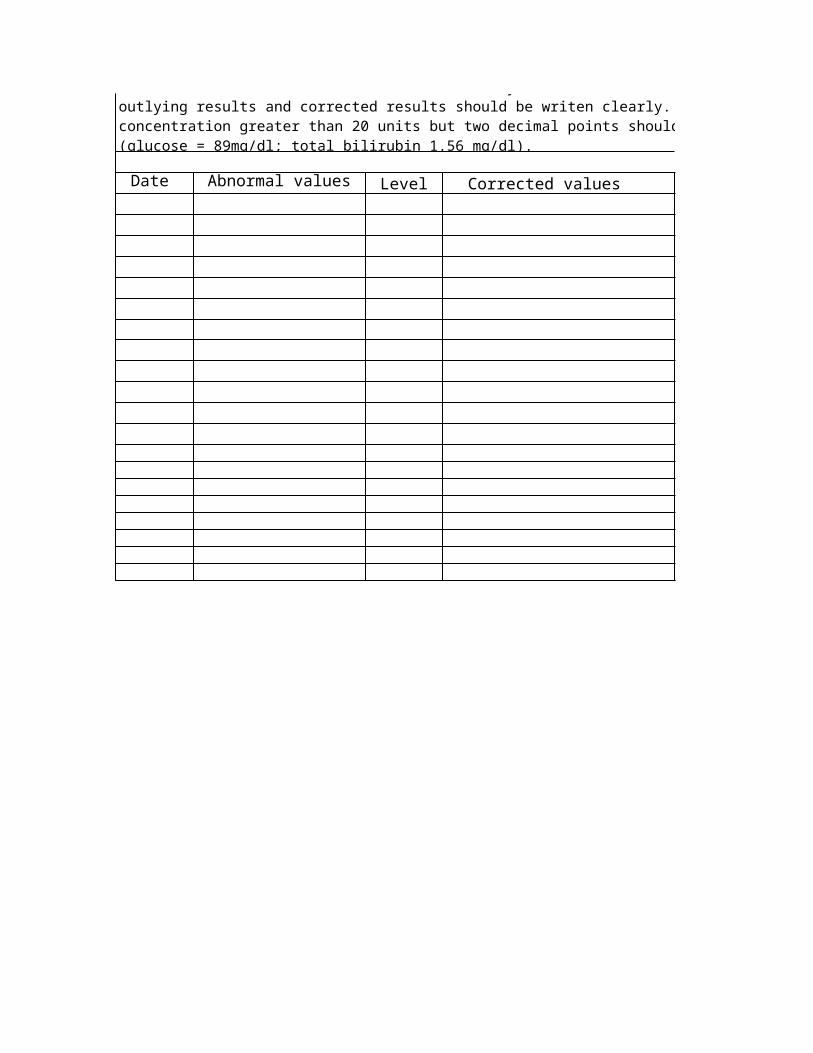
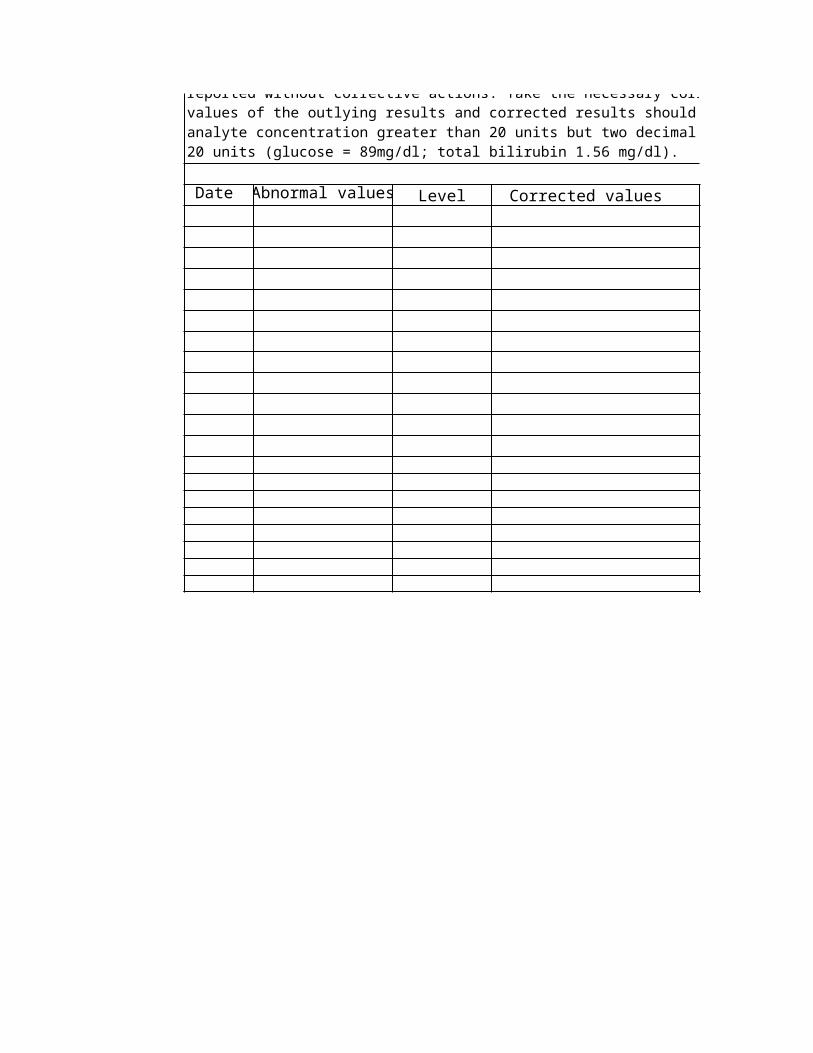
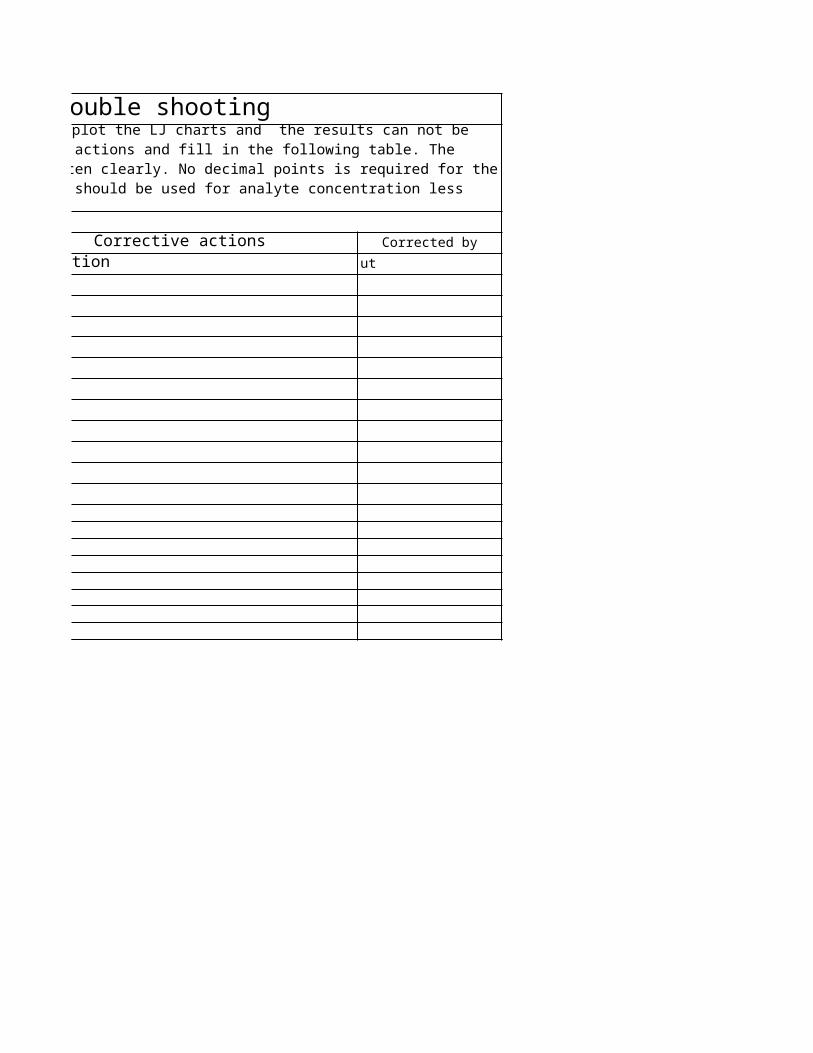
Erroneous results and trouble shooting Instruction: The results lying out of ±3SD should not be used to plot the LJ charts and the results can not be reported without corrective actions. Take the necessary corrective actions and fill in the following table. The values of the outlying results and corrected results should be writen clearly. No decimal points is required for the analyte concentration greater than 20 units but two decimal points should be used for analyte concentration less than 20 units (glucose = 89mg/dl; total bilirubin 1.56 mg/dl).
1 2 3 4 5 6 7 8 9 10 11 12 13 14 15 16 17 18 19 20 21 22 23 24 25 26 27 28 29 30 31275280285290295300305
+3SD+2SD+1SDMean -1SD-2SD-3SD
Days of analysis
Leve
l II
: Gl
ucos
e in
mg
/dl
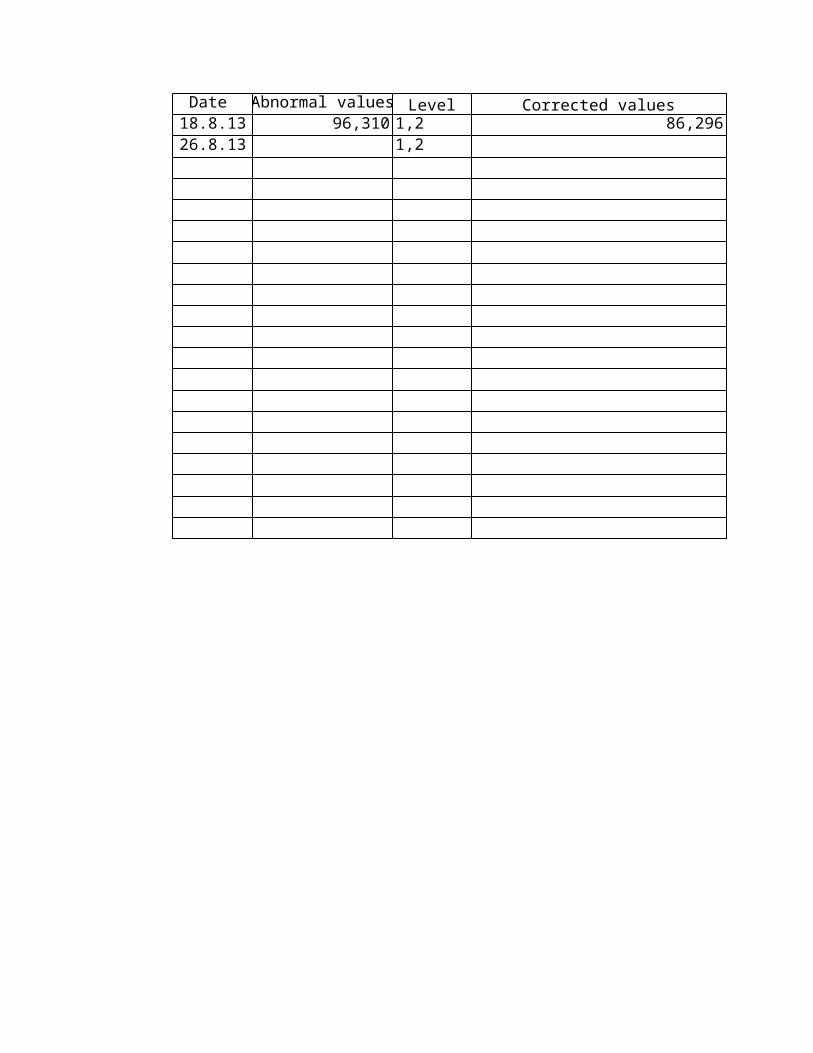
Date Abnormal values Level Corrected values18.8.13 96,310 1,2 86,29626.8.13 1,2
IQC IN BIOCHEMISTRY: Biorad QC Level I and II
-3SD SD83 2.083 2.083 2.083 2.083 2.083 2.083 2.083 2.083 2.083 2.083 2.083 2.083 2.083 2.083 2.083 2.083 2.083 2.083 2.083 2.083 2.083 2.083 2.083 2.083 2.083 2.083 2.083 2.083 2.083 2.083 2.0
2.0
Back to Data entry
Back to Data entry
1 2 3 4 5 6 7 8 9 10 1112 13 1415 1617 18 19 2021 22 23242526 27 28 29 30 318284868890929496
+3SD+2SD+1SDMean -1SD-2SD-3SD
Days of analysis
Leve
l I:
Glu
cose
in
mg
/dl
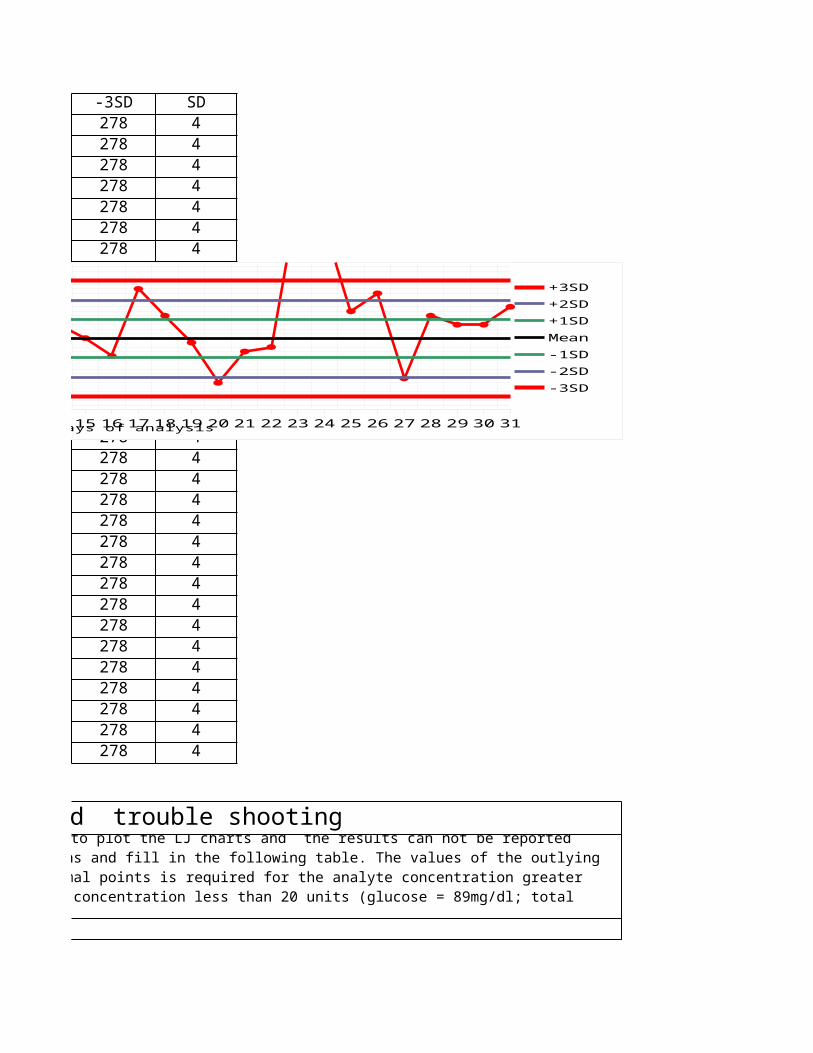
-3SD SD278 4278 4278 4278 4278 4278 4278 4278 4278 4278 4278 4278 4278 4278 4278 4278 4278 4278 4278 4278 4278 4278 4278 4278 4278 4278 4278 4278 4278 4278 4278 4
Erroneous results and trouble shooting 3SD should not be used to plot the LJ charts and the results can not be reported
without corrective actions. Take the necessary corrective actions and fill in the following table. The values of the outlying results and corrected results should be writen clearly. No decimal points is required for the analyte concentration greater than 20 units but two decimal points should be used for analyte concentration less than 20 units (glucose = 89mg/dl; total
1 2 3 4 5 6 7 8 9 10 11 12 13 14 15 16 17 18 19 20 21 22 23 24 25 26 27 28 29 30 31275280285290295300305
+3SD+2SD+1SDMean -1SD-2SD-3SD
Days of analysis
Leve
l II
: Gl
ucos
e in
mg
/dl
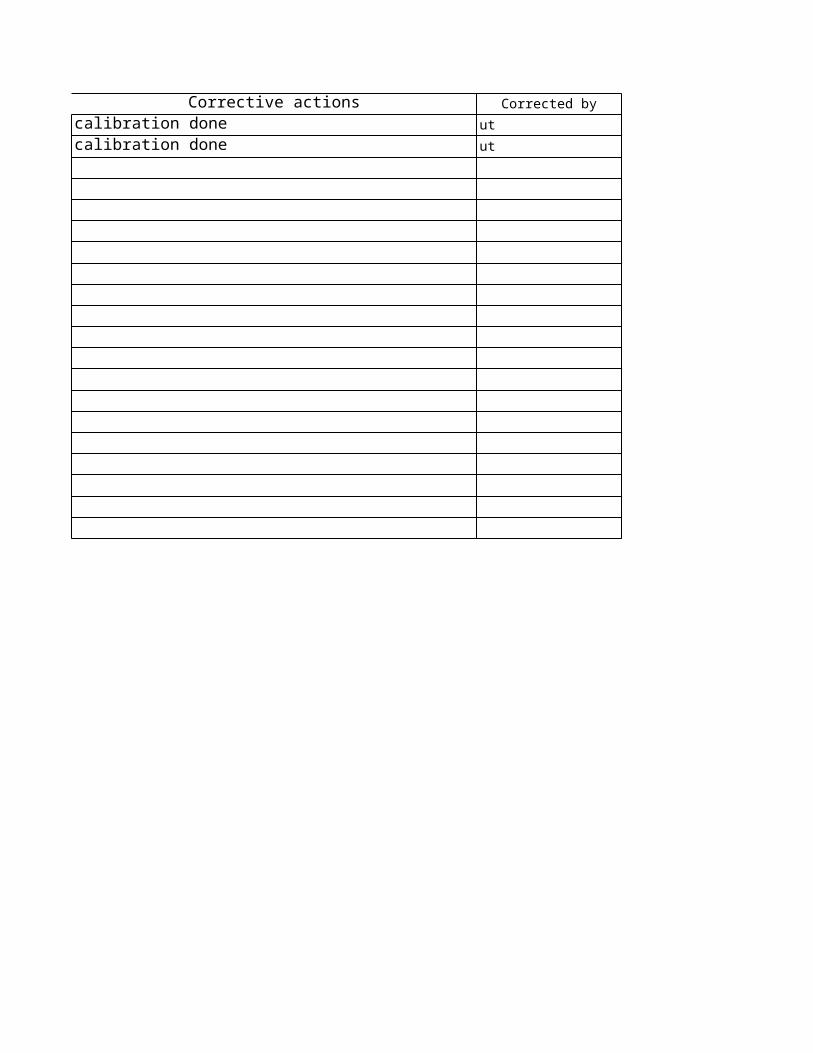
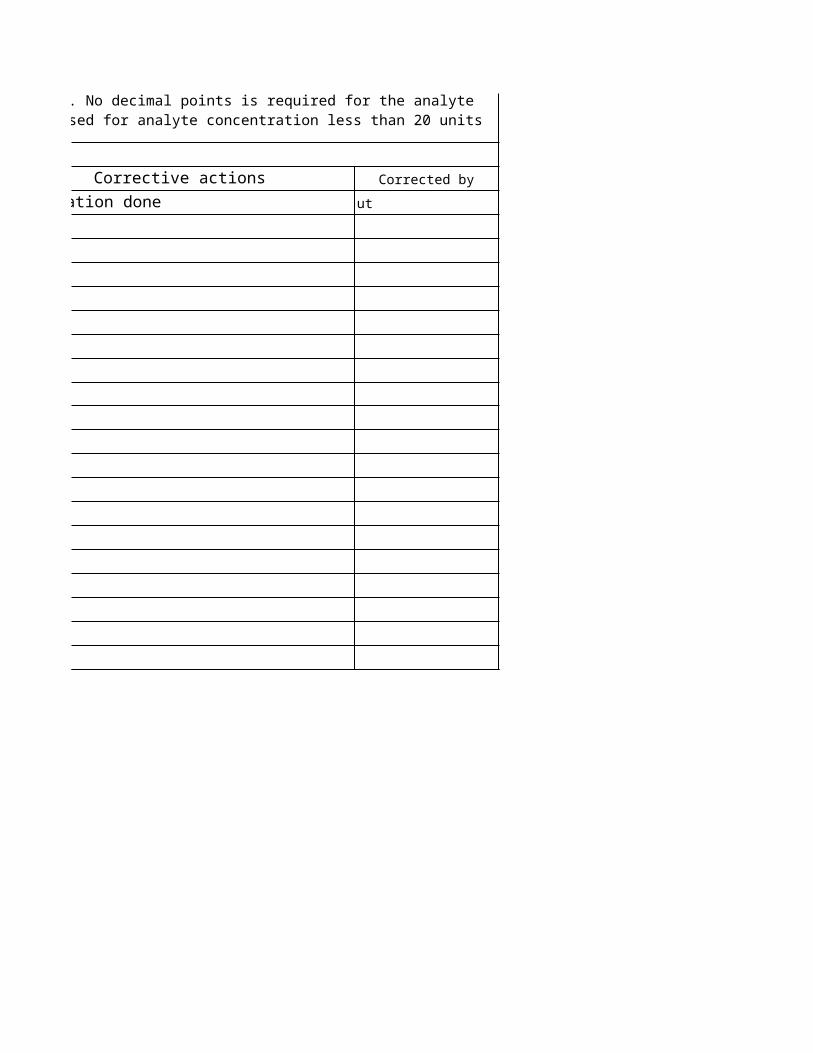
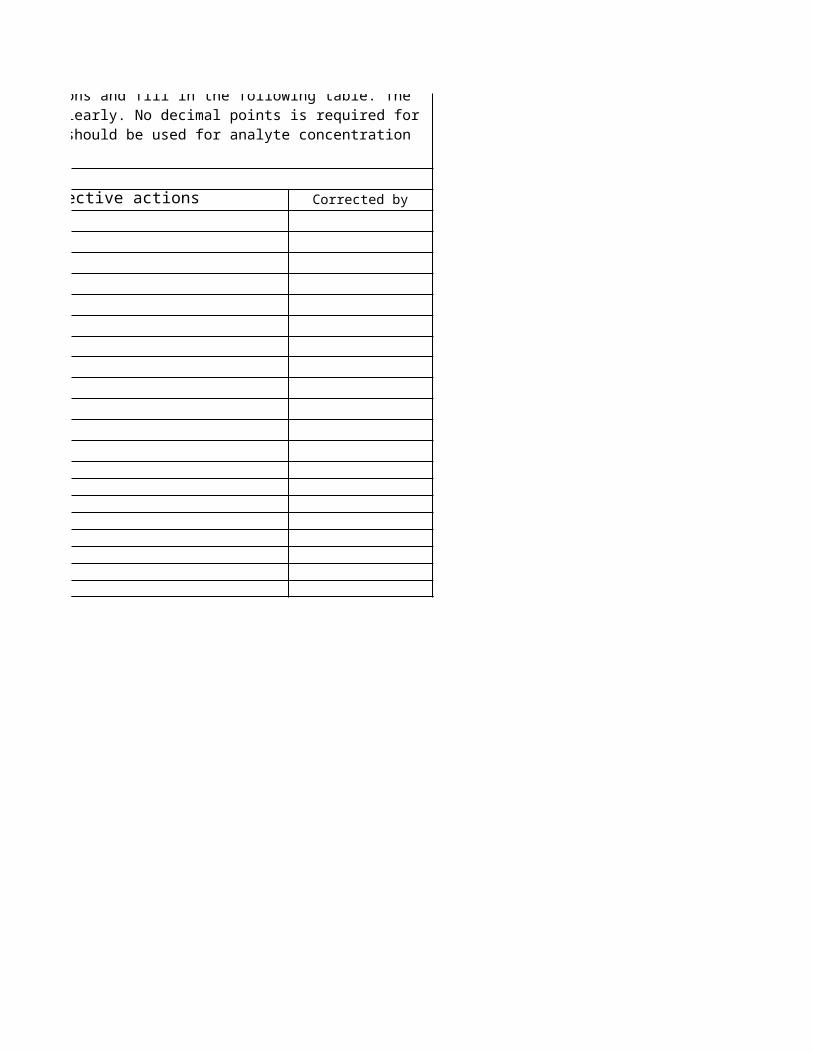
Corrective actions Corrected bycalibration done utcalibration done ut

IQC IN BIOCHEMISTRY: Biorad QC Level I and II
IQC IN BIOCHEMISTRY: Biorad QC Level I and II
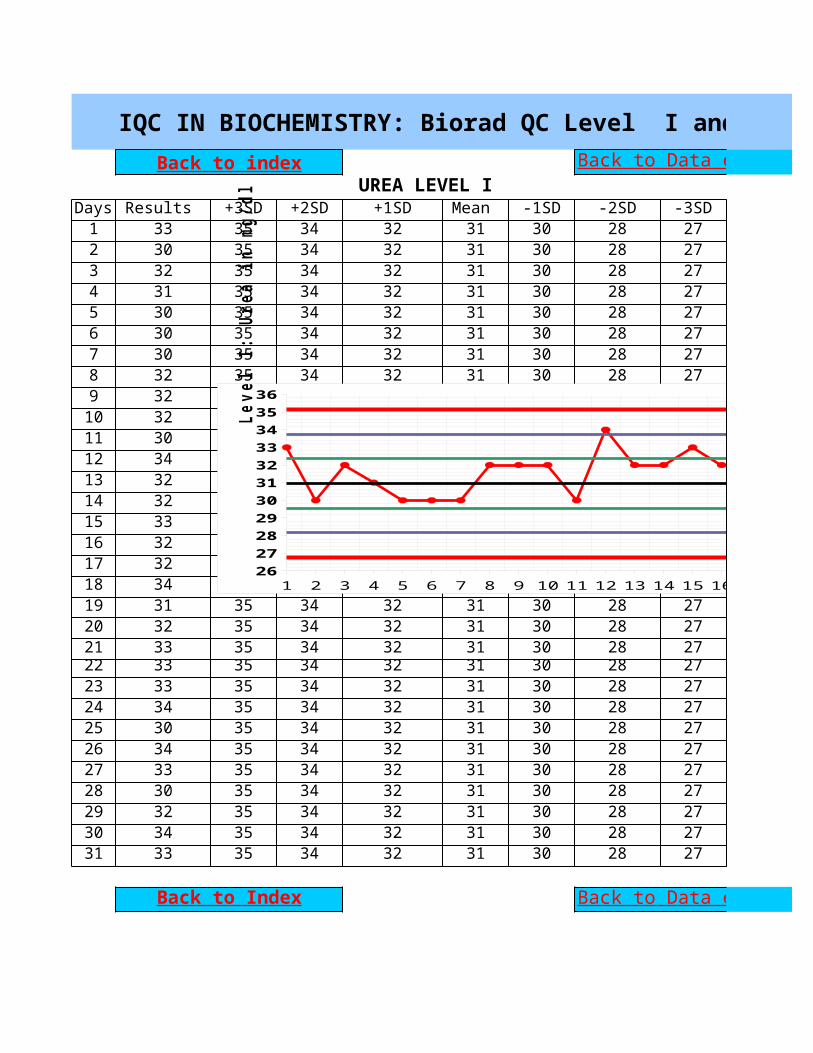
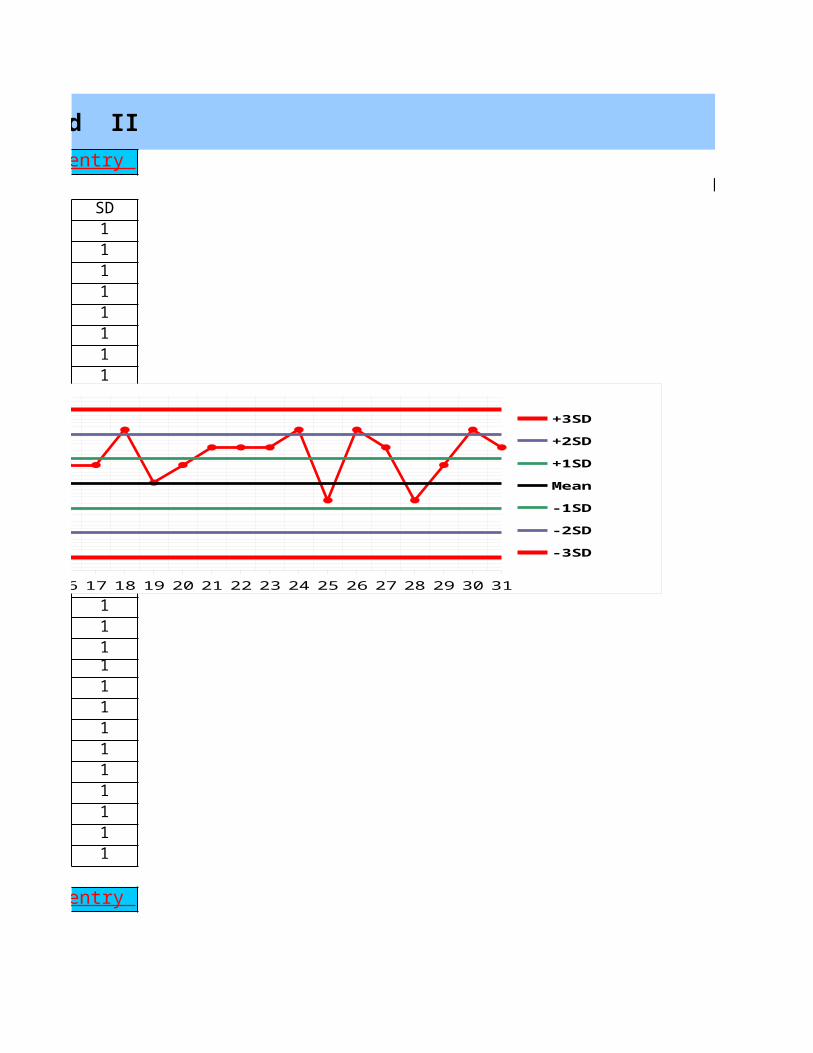
UREA LEVEL IDays Results +3SD +2SD +1SD Mean -1SD -2SD -3SD1 33 35 34 32 31 30 28 272 30 35 34 32 31 30 28 273 32 35 34 32 31 30 28 274 31 35 34 32 31 30 28 275 30 35 34 32 31 30 28 276 30 35 34 32 31 30 28 277 30 35 34 32 31 30 28 278 32 35 34 32 31 30 28 279 32 35 34 32 31 30 28 2710 32 35 34 32 31 30 28 2711 30 35 34 32 31 30 28 2712 34 35 34 32 31 30 28 2713 32 35 34 32 31 30 28 2714 32 35 34 32 31 30 28 2715 33 35 34 32 31 30 28 2716 32 35 34 32 31 30 28 2717 32 35 34 32 31 30 28 2718 34 35 34 32 31 30 28 2719 31 35 34 32 31 30 28 2720 32 35 34 32 31 30 28 2721 33 35 34 32 31 30 28 2722 33 35 34 32 31 30 28 2723 33 35 34 32 31 30 28 2724 34 35 34 32 31 30 28 2725 30 35 34 32 31 30 28 2726 34 35 34 32 31 30 28 2727 33 35 34 32 31 30 28 2728 30 35 34 32 31 30 28 2729 32 35 34 32 31 30 28 2730 34 35 34 32 31 30 28 2731 33 35 34 32 31 30 28 27
Back to index Back to Data entry
Back to Index Back to Data entry
1 2 3 4 5 6 7 8 9 10 11 12 13 14 15 16 17 18 19 20 21 22 23 24 25 26 27 28 29 30 312627282930313233343536
+3SD
+2SD
+1SD
Mean
-1SD
-2SD
-3SD
Leve
l I:
Ure
a in
mg/
dl
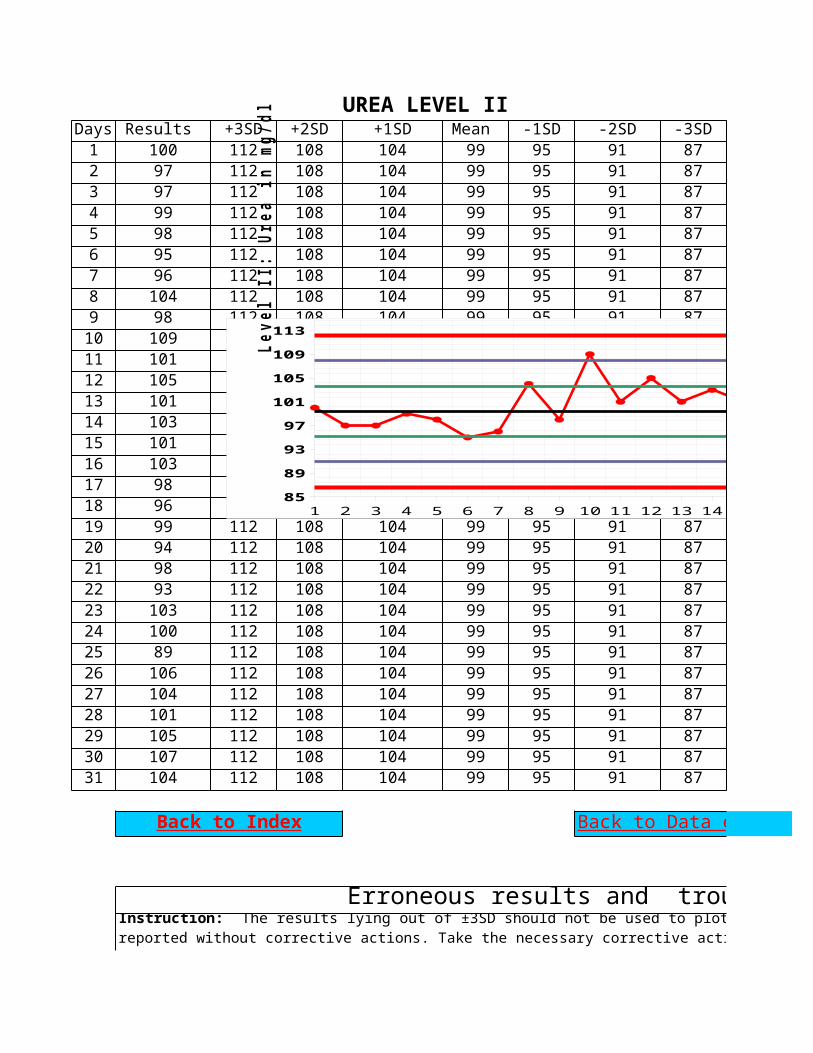
UREA LEVEL IIDays Results +3SD +2SD +1SD Mean -1SD -2SD -3SD1 100 112 108 104 99 95 91 872 97 112 108 104 99 95 91 873 97 112 108 104 99 95 91 874 99 112 108 104 99 95 91 875 98 112 108 104 99 95 91 876 95 112 108 104 99 95 91 877 96 112 108 104 99 95 91 878 104 112 108 104 99 95 91 879 98 112 108 104 99 95 91 8710 109 112 108 104 99 95 91 8711 101 112 108 104 99 95 91 8712 105 112 108 104 99 95 91 8713 101 112 108 104 99 95 91 8714 103 112 108 104 99 95 91 8715 101 112 108 104 99 95 91 8716 103 112 108 104 99 95 91 8717 98 112 108 104 99 95 91 8718 96 112 108 104 99 95 91 8719 99 112 108 104 99 95 91 8720 94 112 108 104 99 95 91 8721 98 112 108 104 99 95 91 8722 93 112 108 104 99 95 91 8723 103 112 108 104 99 95 91 8724 100 112 108 104 99 95 91 8725 89 112 108 104 99 95 91 8726 106 112 108 104 99 95 91 8727 104 112 108 104 99 95 91 8728 101 112 108 104 99 95 91 8729 105 112 108 104 99 95 91 8730 107 112 108 104 99 95 91 8731 104 112 108 104 99 95 91 87
Erroneous results and trouble shooting
Back to Index Back to Data entry
Instruction: The results lying out of ±3SD should not be used to plot the LJ charts and the results can not be reported without corrective actions. Take the necessary corrective actions and fill in the following table. The values of the outlying results and corrected results should be writen clearly. No decimal points is required for the analyte concentration greater than 20 units but two decimal points should be used for analyte concentration less than 20 units (glucose = 89mg/dl; total bilirubin 1.56 mg/dl).
1 2 3 4 5 6 7 8 9 10 11 12 13 14 15 16 17 18 19 20 21 22 23 24 25 26 27 28 29 30 3185
89
93
97
101
105
109
113+3SD
+2SD
+1SD
Mean
-1SD
-2SD
-3SD
Leve
l II
: Ur
ea i
n mg
/dl
Date Abnormal values level Corrected values Corrective actions26.8.13 1,2 34,06 calibration done
Instruction: The results lying out of ±3SD should not be used to plot the LJ charts and the results can not be reported without corrective actions. Take the necessary corrective actions and fill in the following table. The values of the outlying results and corrected results should be writen clearly. No decimal points is required for the analyte concentration greater than 20 units but two decimal points should be used for analyte concentration less than 20 units (glucose = 89mg/dl; total bilirubin 1.56 mg/dl).
IQC IN BIOCHEMISTRY: Biorad QC Level I and II
LEVEL ISD1111111111111111111111111111111
Back to Data entry
Back to Data entry
1 2 3 4 5 6 7 8 9 10 11 12 13 14 15 16 17 18 19 20 21 22 23 24 25 26 27 28 29 30 312627282930313233343536
+3SD
+2SD
+1SD
Mean
-1SD
-2SD
-3SD
Leve
l I:
Ure
a in
mg/
dl
SD4444444444444444444444444444444
Erroneous results and trouble shooting
Back to Data entry
3SD should not be used to plot the LJ charts and the results can not be reported without corrective actions. Take the necessary corrective actions and fill in the following table. The values of the outlying results and corrected results should be writen clearly. No decimal points is required for the analyte concentration greater than 20 units but two decimal points should be used for analyte concentration less than 20 units
1 2 3 4 5 6 7 8 9 10 11 12 13 14 15 16 17 18 19 20 21 22 23 24 25 26 27 28 29 30 3185
89
93
97
101
105
109
113+3SD
+2SD
+1SD
Mean
-1SD
-2SD
-3SD
Leve
l II
: Ur
ea i
n mg
/dl
Corrective actions Corrected bycalibration done ut
3SD should not be used to plot the LJ charts and the results can not be reported without corrective actions. Take the necessary corrective actions and fill in the following table. The values of the outlying results and corrected results should be writen clearly. No decimal points is required for the analyte concentration greater than 20 units but two decimal points should be used for analyte concentration less than 20 units

IQC IN BIOCHEMISTRY: Biorad QC Level I and II
LEVEL I
IQC IN BIOCHEMISTRY: Biorad QC Level I and II
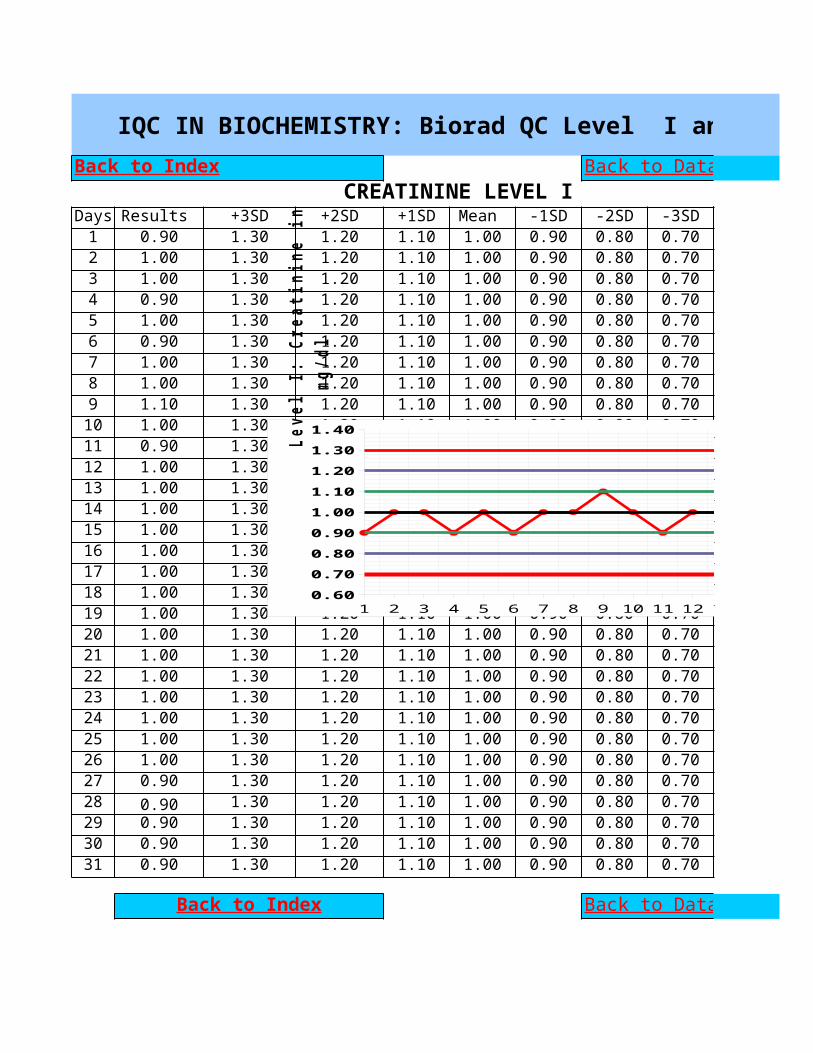
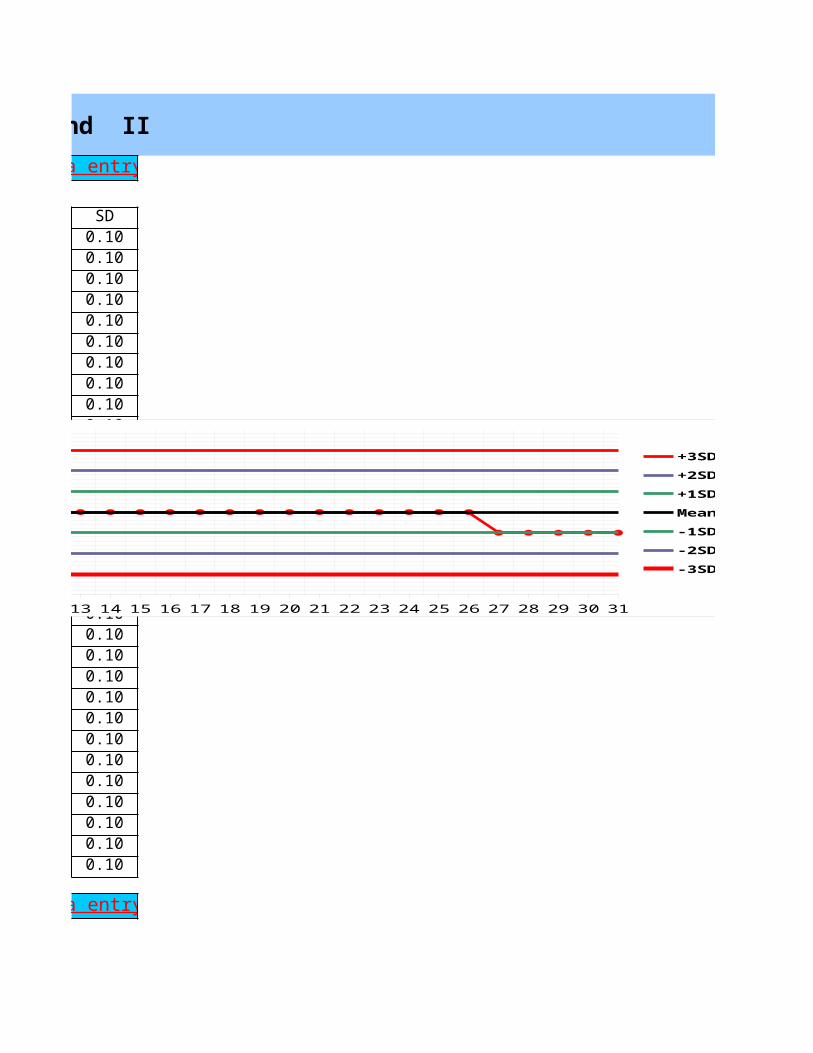
CREATININE LEVEL IDays Results +3SD +2SD +1SD Mean -1SD -2SD -3SD1 0.90 1.30 1.20 1.10 1.00 0.90 0.80 0.702 1.00 1.30 1.20 1.10 1.00 0.90 0.80 0.703 1.00 1.30 1.20 1.10 1.00 0.90 0.80 0.704 0.90 1.30 1.20 1.10 1.00 0.90 0.80 0.705 1.00 1.30 1.20 1.10 1.00 0.90 0.80 0.706 0.90 1.30 1.20 1.10 1.00 0.90 0.80 0.707 1.00 1.30 1.20 1.10 1.00 0.90 0.80 0.708 1.00 1.30 1.20 1.10 1.00 0.90 0.80 0.709 1.10 1.30 1.20 1.10 1.00 0.90 0.80 0.7010 1.00 1.30 1.20 1.10 1.00 0.90 0.80 0.7011 0.90 1.30 1.20 1.10 1.00 0.90 0.80 0.7012 1.00 1.30 1.20 1.10 1.00 0.90 0.80 0.7013 1.00 1.30 1.20 1.10 1.00 0.90 0.80 0.7014 1.00 1.30 1.20 1.10 1.00 0.90 0.80 0.7015 1.00 1.30 1.20 1.10 1.00 0.90 0.80 0.7016 1.00 1.30 1.20 1.10 1.00 0.90 0.80 0.7017 1.00 1.30 1.20 1.10 1.00 0.90 0.80 0.7018 1.00 1.30 1.20 1.10 1.00 0.90 0.80 0.7019 1.00 1.30 1.20 1.10 1.00 0.90 0.80 0.7020 1.00 1.30 1.20 1.10 1.00 0.90 0.80 0.7021 1.00 1.30 1.20 1.10 1.00 0.90 0.80 0.7022 1.00 1.30 1.20 1.10 1.00 0.90 0.80 0.7023 1.00 1.30 1.20 1.10 1.00 0.90 0.80 0.7024 1.00 1.30 1.20 1.10 1.00 0.90 0.80 0.7025 1.00 1.30 1.20 1.10 1.00 0.90 0.80 0.7026 1.00 1.30 1.20 1.10 1.00 0.90 0.80 0.7027 0.90 1.30 1.20 1.10 1.00 0.90 0.80 0.7028 0.90 1.30 1.20 1.10 1.00 0.90 0.80 0.7029 0.90 1.30 1.20 1.10 1.00 0.90 0.80 0.7030 0.90 1.30 1.20 1.10 1.00 0.90 0.80 0.7031 0.90 1.30 1.20 1.10 1.00 0.90 0.80 0.70
Back to Index Back to Data entry
Back to Index Back to Data entry
1 2 3 4 5 6 7 8 9 10 11 12 13 14 15 16 17 18 19 20 21 22 23 24 25 26 27 28 29 30 310.600.700.800.901.001.101.201.301.40
+3SD+2SD+1SDMean -1SD-2SD-3SD
Leve
l I:
Cre
atin
ine
in
mg/d
l
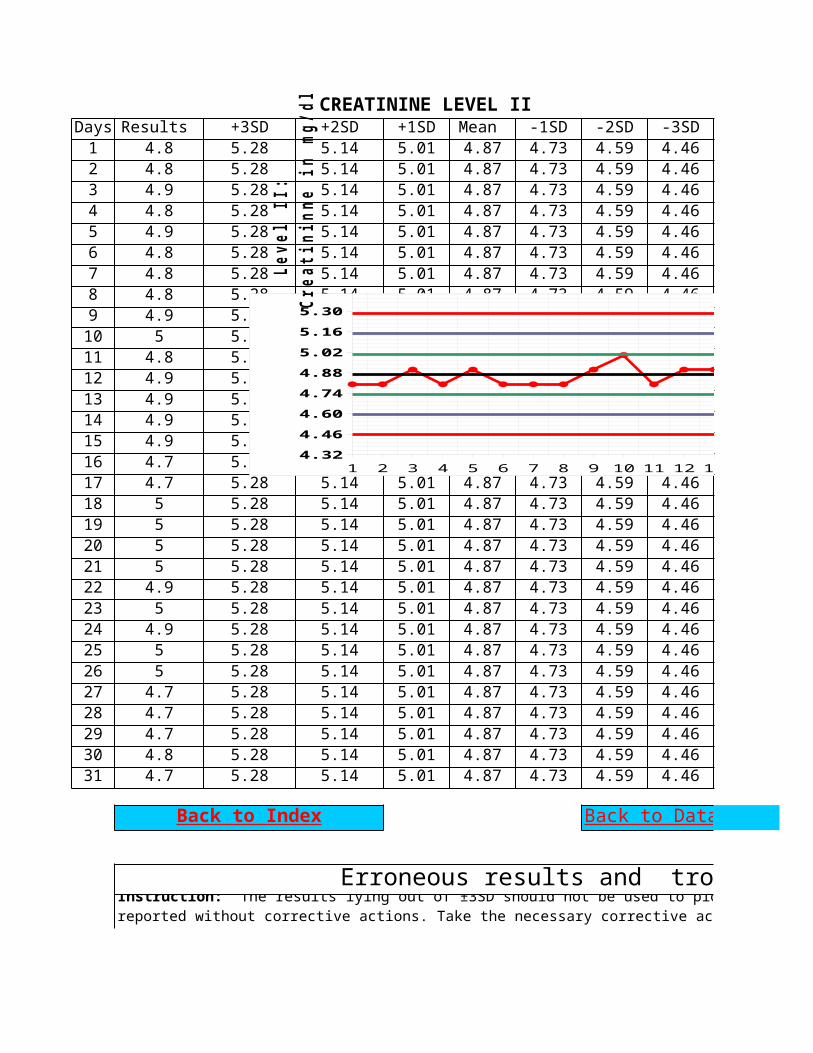
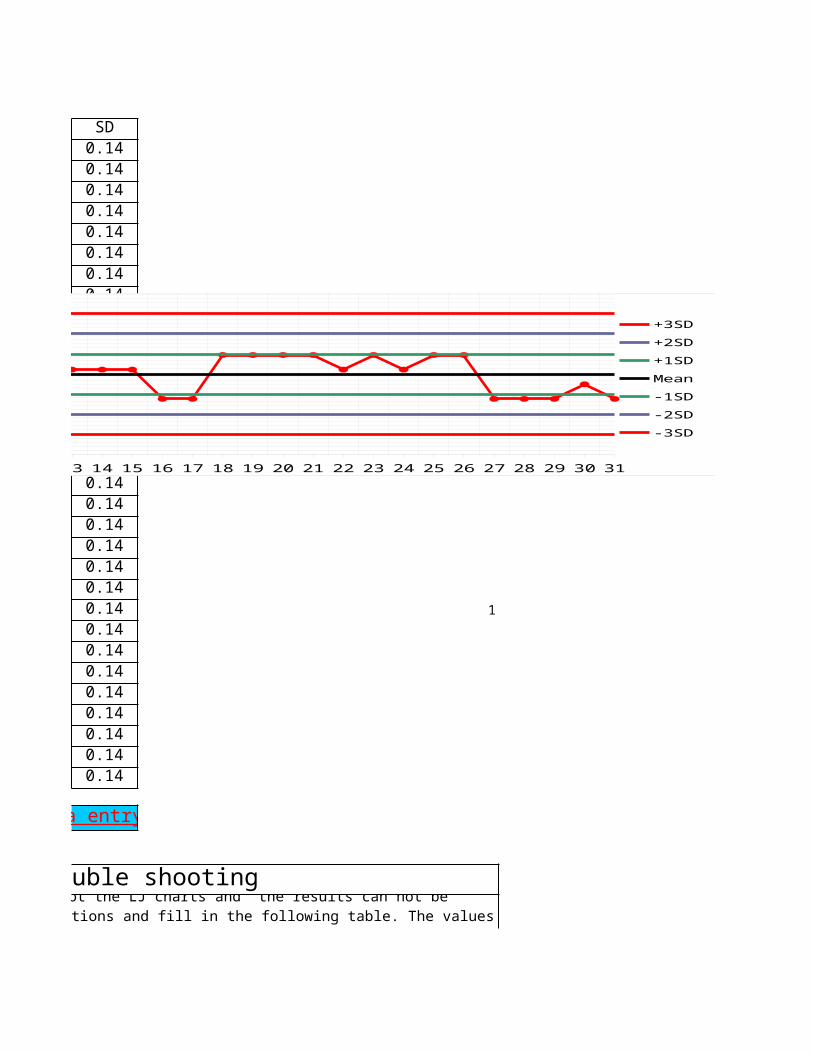
CREATININE LEVEL IIDays Results +3SD +2SD +1SD Mean -1SD -2SD -3SD1 4.8 5.28 5.14 5.01 4.87 4.73 4.59 4.462 4.8 5.28 5.14 5.01 4.87 4.73 4.59 4.463 4.9 5.28 5.14 5.01 4.87 4.73 4.59 4.464 4.8 5.28 5.14 5.01 4.87 4.73 4.59 4.465 4.9 5.28 5.14 5.01 4.87 4.73 4.59 4.466 4.8 5.28 5.14 5.01 4.87 4.73 4.59 4.467 4.8 5.28 5.14 5.01 4.87 4.73 4.59 4.468 4.8 5.28 5.14 5.01 4.87 4.73 4.59 4.469 4.9 5.28 5.14 5.01 4.87 4.73 4.59 4.4610 5 5.28 5.14 5.01 4.87 4.73 4.59 4.4611 4.8 5.28 5.14 5.01 4.87 4.73 4.59 4.4612 4.9 5.28 5.14 5.01 4.87 4.73 4.59 4.4613 4.9 5.28 5.14 5.01 4.87 4.73 4.59 4.4614 4.9 5.28 5.14 5.01 4.87 4.73 4.59 4.4615 4.9 5.28 5.14 5.01 4.87 4.73 4.59 4.4616 4.7 5.28 5.14 5.01 4.87 4.73 4.59 4.4617 4.7 5.28 5.14 5.01 4.87 4.73 4.59 4.4618 5 5.28 5.14 5.01 4.87 4.73 4.59 4.4619 5 5.28 5.14 5.01 4.87 4.73 4.59 4.4620 5 5.28 5.14 5.01 4.87 4.73 4.59 4.4621 5 5.28 5.14 5.01 4.87 4.73 4.59 4.4622 4.9 5.28 5.14 5.01 4.87 4.73 4.59 4.4623 5 5.28 5.14 5.01 4.87 4.73 4.59 4.4624 4.9 5.28 5.14 5.01 4.87 4.73 4.59 4.4625 5 5.28 5.14 5.01 4.87 4.73 4.59 4.4626 5 5.28 5.14 5.01 4.87 4.73 4.59 4.4627 4.7 5.28 5.14 5.01 4.87 4.73 4.59 4.4628 4.7 5.28 5.14 5.01 4.87 4.73 4.59 4.4629 4.7 5.28 5.14 5.01 4.87 4.73 4.59 4.4630 4.8 5.28 5.14 5.01 4.87 4.73 4.59 4.4631 4.7 5.28 5.14 5.01 4.87 4.73 4.59 4.46
Erroneous results and trouble shooting
Back to Index Back to Data entry
Instruction: The results lying out of ±3SD should not be used to plot the LJ charts and the results can not be reported without corrective actions. Take the necessary corrective actions and fill in the following table. The values of the outlying results and corrected results should be writen clearly. No decimal points is required for the analyte
1 2 3 4 5 6 7 8 9 10 11 12 13 14 15 16 17 18 19 20 21 22 23 24 25 26 27 28 29 30 314.324.464.604.744.885.025.165.30
+3SD+2SD+1SDMean -1SD-2SD-3SD
Leve
l II
:
Crea
tini
nne
in m
g/dl
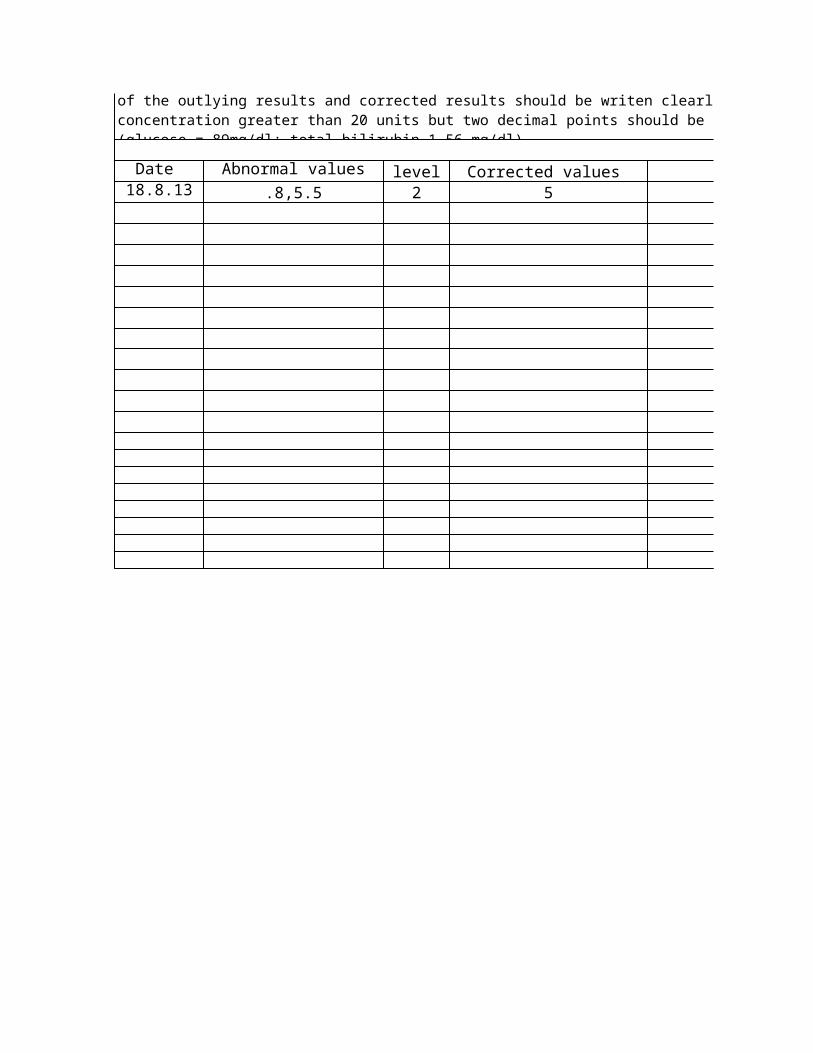
Date Abnormal values level Corrected values Corrective actions18.8.13 .8,5.5 2 5 calibration done
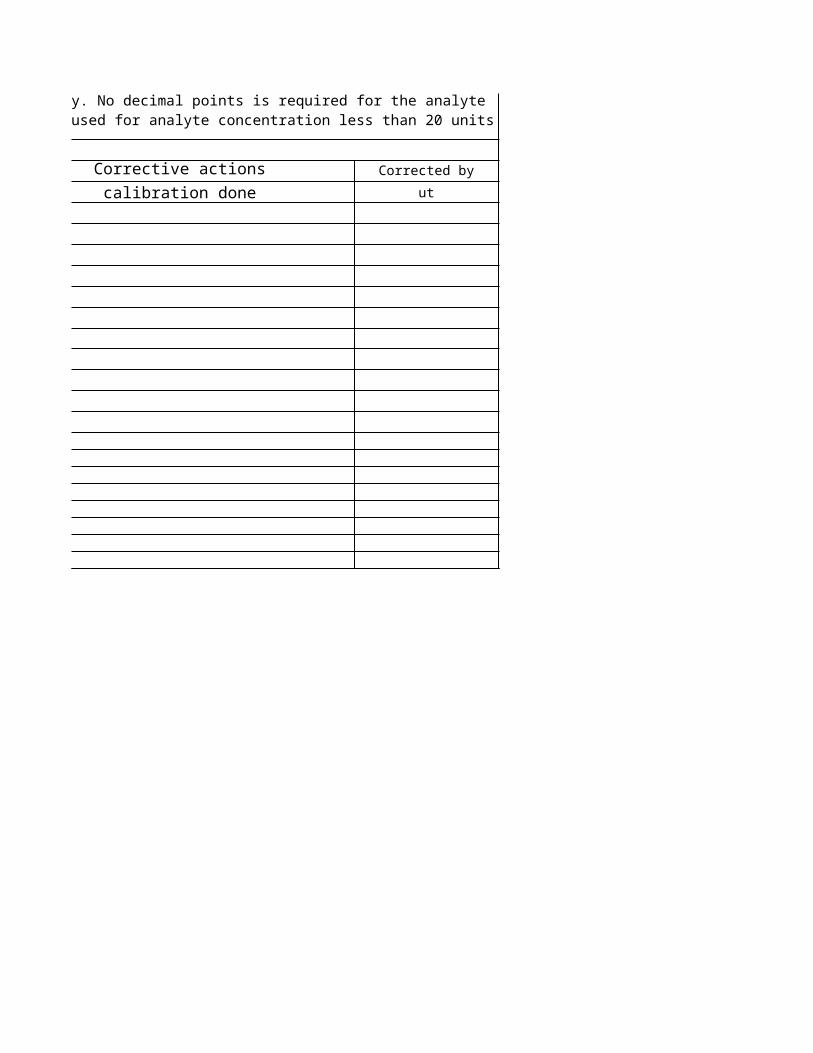
of the outlying results and corrected results should be writen clearly. No decimal points is required for the analyte concentration greater than 20 units but two decimal points should be used for analyte concentration less than 20 units (glucose = 89mg/dl; total bilirubin 1.56 mg/dl).
IQC IN BIOCHEMISTRY: Biorad QC Level I and II
SD0.100.100.100.100.100.100.100.100.100.100.100.100.100.100.100.100.100.100.100.100.100.100.100.100.100.100.100.100.100.100.10
Back to Data entry
Back to Data entry
1 2 3 4 5 6 7 8 9 10 11 12 13 14 15 16 17 18 19 20 21 22 23 24 25 26 27 28 29 30 310.600.700.800.901.001.101.201.301.40
+3SD+2SD+1SDMean -1SD-2SD-3SD
Leve
l I:
Cre
atin
ine
in
mg/d
l
SD0.140.140.140.140.140.140.140.140.140.140.140.140.140.140.140.140.140.140.140.140.140.140.14 10.140.140.140.140.140.140.140.14
Erroneous results and trouble shooting
Back to Data entry
3SD should not be used to plot the LJ charts and the results can not be reported without corrective actions. Take the necessary corrective actions and fill in the following table. The values of the outlying results and corrected results should be writen clearly. No decimal points is required for the analyte
1 2 3 4 5 6 7 8 9 10 11 12 13 14 15 16 17 18 19 20 21 22 23 24 25 26 27 28 29 30 314.324.464.604.744.885.025.165.30
+3SD+2SD+1SDMean -1SD-2SD-3SD
Leve
l II
:
Crea
tini
nne
in m
g/dl
Corrective actions Corrected bycalibration done ut
of the outlying results and corrected results should be writen clearly. No decimal points is required for the analyte concentration greater than 20 units but two decimal points should be used for analyte concentration less than 20 units

IQC IN BIOCHEMISTRY: Biorad QC Level I and II
1 2 3 4 5 6 7 8 9 10 11 12 13 14 15 16 17 18 19 20 21 22 23 24 25 26 27 28 29 30 310.600.700.800.901.001.101.201.301.40
+3SD+2SD+1SDMean -1SD-2SD-3SD
Leve
l I:
Cre
atin
ine
in
mg/d
l

1 2 3 4 5 6 7 8 9 10 11 12 13 14 15 16 17 18 19 20 21 22 23 24 25 26 27 28 29 30 314.324.464.604.744.885.025.165.30
+3SD+2SD+1SDMean -1SD-2SD-3SD
Leve
l II
:
Crea
tini
nne
in m
g/dl
IQC IN BIOCHEMISTRY: Biorad QC Level I and II
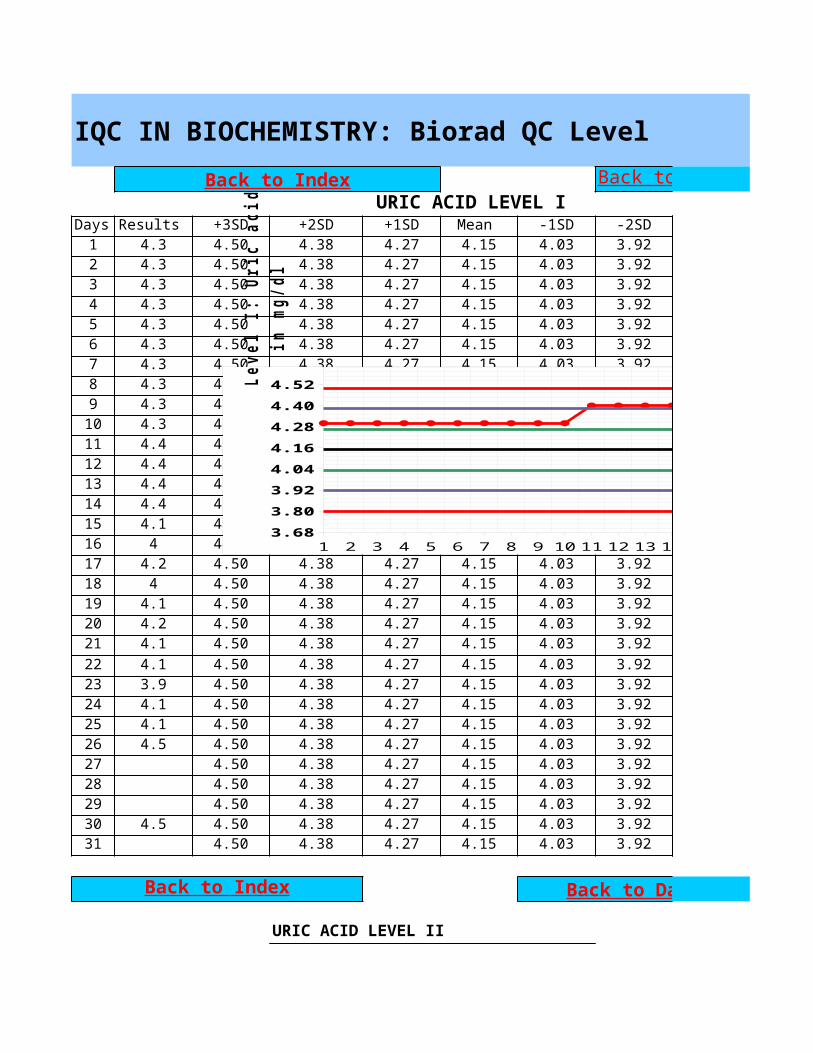
URIC ACID LEVEL IDays Results +3SD +2SD +1SD Mean -1SD -2SD1 4.3 4.50 4.38 4.27 4.15 4.03 3.922 4.3 4.50 4.38 4.27 4.15 4.03 3.923 4.3 4.50 4.38 4.27 4.15 4.03 3.924 4.3 4.50 4.38 4.27 4.15 4.03 3.925 4.3 4.50 4.38 4.27 4.15 4.03 3.926 4.3 4.50 4.38 4.27 4.15 4.03 3.927 4.3 4.50 4.38 4.27 4.15 4.03 3.928 4.3 4.50 4.38 4.27 4.15 4.03 3.929 4.3 4.50 4.38 4.27 4.15 4.03 3.9210 4.3 4.50 4.38 4.27 4.15 4.03 3.9211 4.4 4.50 4.38 4.27 4.15 4.03 3.9212 4.4 4.50 4.38 4.27 4.15 4.03 3.9213 4.4 4.50 4.38 4.27 4.15 4.03 3.9214 4.4 4.50 4.38 4.27 4.15 4.03 3.9215 4.1 4.50 4.38 4.27 4.15 4.03 3.9216 4 4.50 4.38 4.27 4.15 4.03 3.9217 4.2 4.50 4.38 4.27 4.15 4.03 3.9218 4 4.50 4.38 4.27 4.15 4.03 3.9219 4.1 4.50 4.38 4.27 4.15 4.03 3.9220 4.2 4.50 4.38 4.27 4.15 4.03 3.9221 4.1 4.50 4.38 4.27 4.15 4.03 3.9222 4.1 4.50 4.38 4.27 4.15 4.03 3.9223 3.9 4.50 4.38 4.27 4.15 4.03 3.9224 4.1 4.50 4.38 4.27 4.15 4.03 3.9225 4.1 4.50 4.38 4.27 4.15 4.03 3.9226 4.5 4.50 4.38 4.27 4.15 4.03 3.9227 4.50 4.38 4.27 4.15 4.03 3.9228 4.50 4.38 4.27 4.15 4.03 3.9229 4.50 4.38 4.27 4.15 4.03 3.9230 4.5 4.50 4.38 4.27 4.15 4.03 3.9231 4.50 4.38 4.27 4.15 4.03 3.92
Back to Data entry
URIC ACID LEVEL II
Back to Index Back to Data entry
Back to Index
1 2 3 4 5 6 7 8 9 10 11 12 13 14 15 16 17 18 19 20 21 22 23 24 25 26 27 28 29 30 313.683.803.924.044.164.284.404.52
+3SD+2SD+1SDMean -1SD-2SD-3SD
Leve
l I:
Uri
c ac
id
in m
g/dl
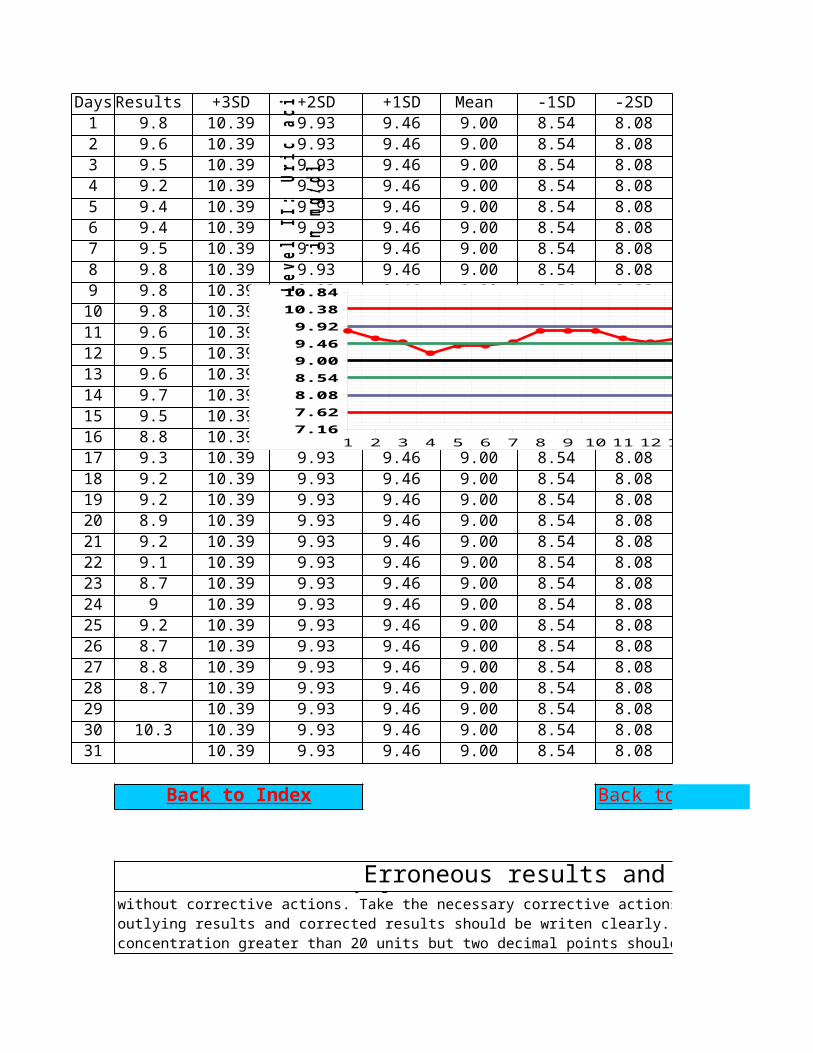
DaysResults +3SD +2SD +1SD Mean -1SD -2SD1 9.8 10.39 9.93 9.46 9.00 8.54 8.082 9.6 10.39 9.93 9.46 9.00 8.54 8.083 9.5 10.39 9.93 9.46 9.00 8.54 8.084 9.2 10.39 9.93 9.46 9.00 8.54 8.085 9.4 10.39 9.93 9.46 9.00 8.54 8.086 9.4 10.39 9.93 9.46 9.00 8.54 8.087 9.5 10.39 9.93 9.46 9.00 8.54 8.088 9.8 10.39 9.93 9.46 9.00 8.54 8.089 9.8 10.39 9.93 9.46 9.00 8.54 8.0810 9.8 10.39 9.93 9.46 9.00 8.54 8.0811 9.6 10.39 9.93 9.46 9.00 8.54 8.0812 9.5 10.39 9.93 9.46 9.00 8.54 8.0813 9.6 10.39 9.93 9.46 9.00 8.54 8.0814 9.7 10.39 9.93 9.46 9.00 8.54 8.0815 9.5 10.39 9.93 9.46 9.00 8.54 8.0816 8.8 10.39 9.93 9.46 9.00 8.54 8.0817 9.3 10.39 9.93 9.46 9.00 8.54 8.0818 9.2 10.39 9.93 9.46 9.00 8.54 8.0819 9.2 10.39 9.93 9.46 9.00 8.54 8.0820 8.9 10.39 9.93 9.46 9.00 8.54 8.0821 9.2 10.39 9.93 9.46 9.00 8.54 8.0822 9.1 10.39 9.93 9.46 9.00 8.54 8.0823 8.7 10.39 9.93 9.46 9.00 8.54 8.0824 9 10.39 9.93 9.46 9.00 8.54 8.0825 9.2 10.39 9.93 9.46 9.00 8.54 8.0826 8.7 10.39 9.93 9.46 9.00 8.54 8.0827 8.8 10.39 9.93 9.46 9.00 8.54 8.0828 8.7 10.39 9.93 9.46 9.00 8.54 8.0829 10.39 9.93 9.46 9.00 8.54 8.0830 10.3 10.39 9.93 9.46 9.00 8.54 8.0831 10.39 9.93 9.46 9.00 8.54 8.08
Erroneous results and trouble shooting
Back to Index Back to Data entry
Instruction: The results lying out of ±3SD should not be used to plot the LJ charts and the results can not be reported without corrective actions. Take the necessary corrective actions and fill in the following table. The values of the outlying results and corrected results should be writen clearly. No decimal points is required for the analyte concentration greater than 20 units but two decimal points should be used for analyte concentration less than 20 units (glucose = 89mg/dl; total bilirubin 1.56 mg/dl).
1 2 3 4 5 6 7 8 9 10 11 12 13 14 15 16 17 18 19 20 21 22 23 24 25 26 27 28 29 30 317.167.628.088.549.009.469.9210.3810.84
+3SD+2SD+1SDMean -1SD-2SD-3SD
Leve
l II
: Ur
ic a
cid
in
mg/d
l
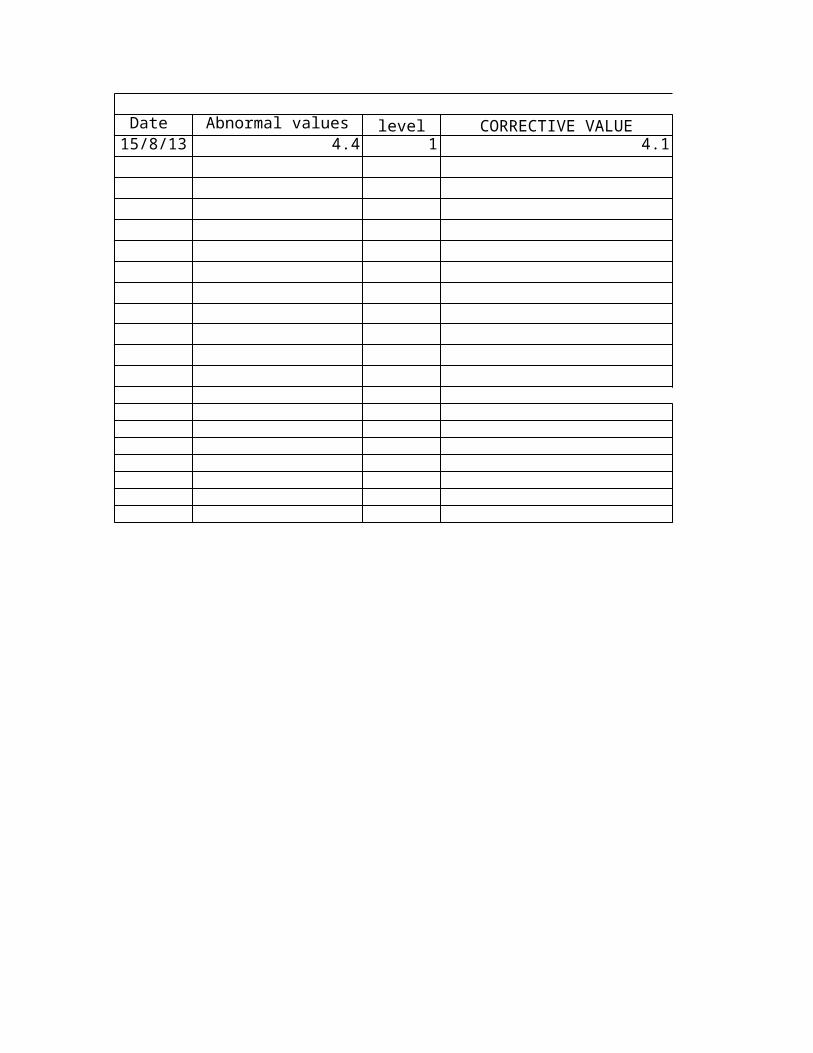
Date Abnormal values level CORRECTIVE VALUE15/8/13 4.4 1 4.1
IQC IN BIOCHEMISTRY: Biorad QC Level I and II
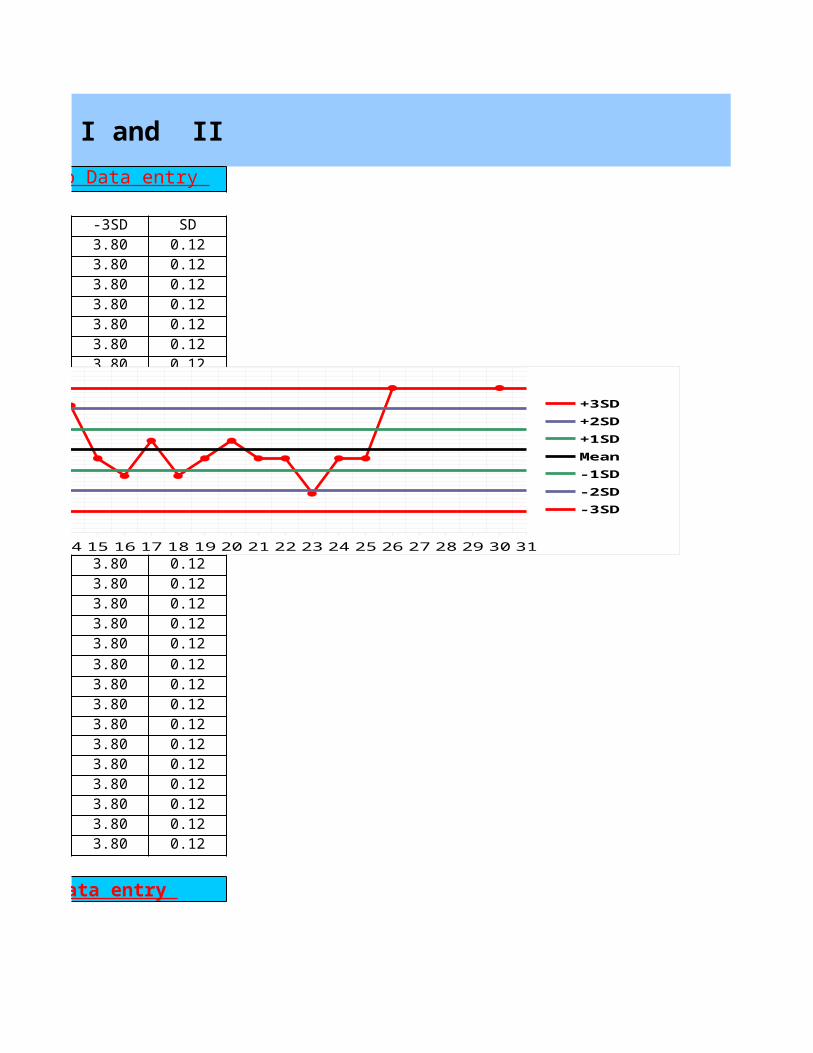
URIC ACID LEVEL I-3SD SD3.80 0.123.80 0.123.80 0.123.80 0.123.80 0.123.80 0.123.80 0.123.80 0.123.80 0.123.80 0.123.80 0.123.80 0.123.80 0.123.80 0.123.80 0.123.80 0.123.80 0.123.80 0.123.80 0.123.80 0.123.80 0.123.80 0.123.80 0.123.80 0.123.80 0.123.80 0.123.80 0.123.80 0.123.80 0.123.80 0.123.80 0.12
Back to Data entry
Back to Data entry
1 2 3 4 5 6 7 8 9 10 11 12 13 14 15 16 17 18 19 20 21 22 23 24 25 26 27 28 29 30 313.683.803.924.044.164.284.404.52
+3SD+2SD+1SDMean -1SD-2SD-3SD
Leve
l I:
Uri
c ac
id
in m
g/dl
-3SD SD7.62 0.467.62 0.467.62 0.467.62 0.467.62 0.467.62 0.467.62 0.467.62 0.467.62 0.467.62 0.467.62 0.467.62 0.467.62 0.467.62 0.467.62 0.467.62 0.467.62 0.467.62 0.467.62 0.467.62 0.467.62 0.467.62 0.467.62 0.467.62 0.467.62 0.467.62 0.467.62 0.467.62 0.467.62 0.467.62 0.467.62 0.46
Erroneous results and trouble shooting
Back to Data entry
3SD should not be used to plot the LJ charts and the results can not be reported without corrective actions. Take the necessary corrective actions and fill in the following table. The values of the outlying results and corrected results should be writen clearly. No decimal points is required for the analyte concentration greater than 20 units but two decimal points should be used for analyte concentration less than 20 units
1 2 3 4 5 6 7 8 9 10 11 12 13 14 15 16 17 18 19 20 21 22 23 24 25 26 27 28 29 30 317.167.628.088.549.009.469.9210.3810.84
+3SD+2SD+1SDMean -1SD-2SD-3SD
Leve
l II
: Ur
ic a
cid
in
mg/d
l
Corrective actions Corrected byCALIBRATED KN
IQC IN BIOCHEMISTRY: Biorad QC Level I and II
LEVEL I
LEVEL II
IQC IN BIOCHEMISTRY: Biorad QC Level I and II
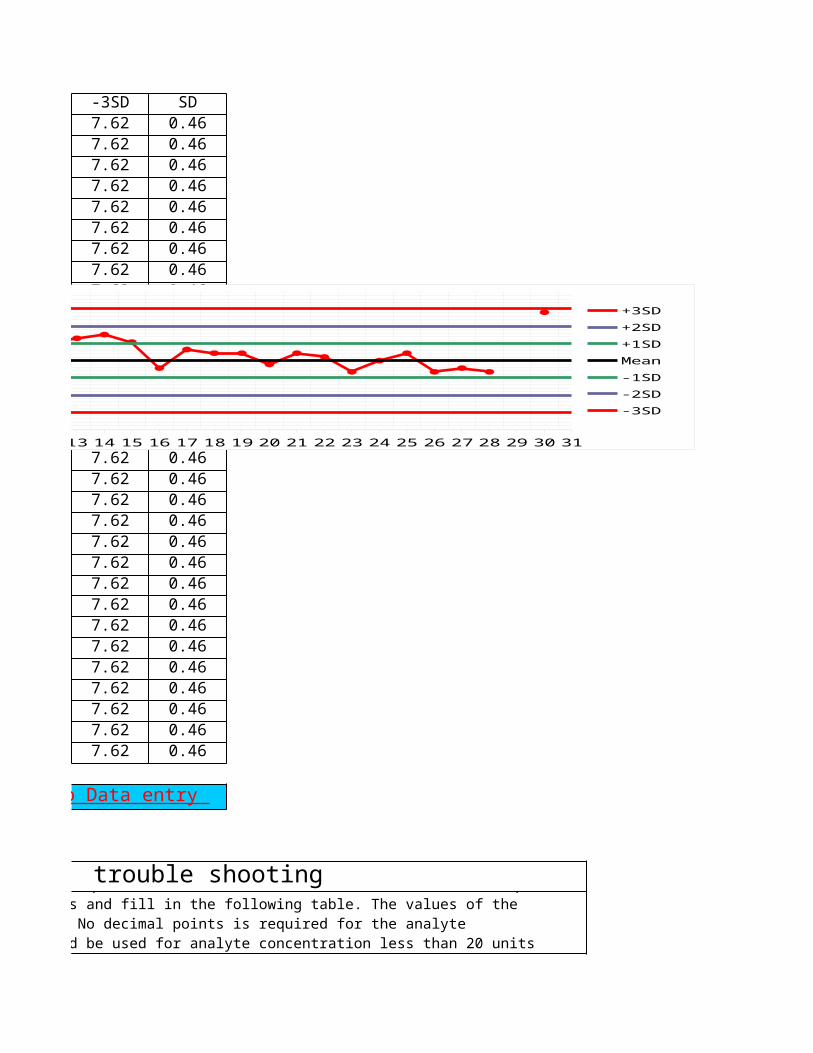
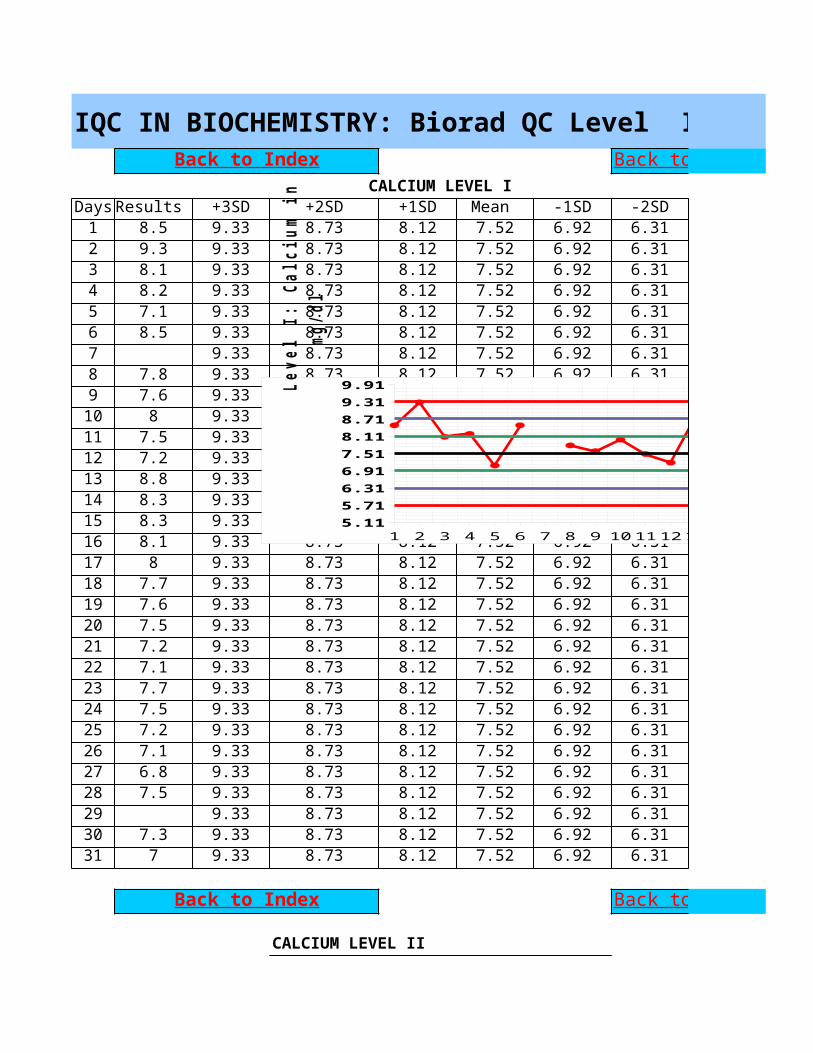
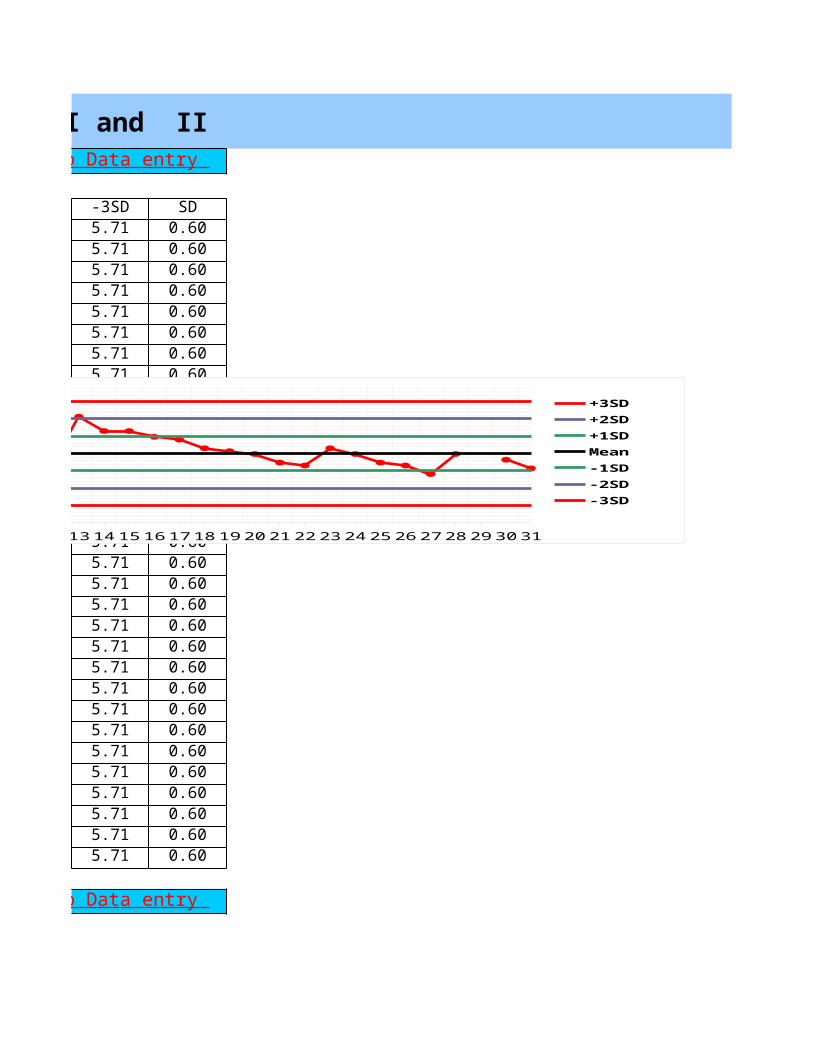
CALCIUM LEVEL IDaysResults +3SD +2SD +1SD Mean -1SD -2SD1 8.5 9.33 8.73 8.12 7.52 6.92 6.312 9.3 9.33 8.73 8.12 7.52 6.92 6.313 8.1 9.33 8.73 8.12 7.52 6.92 6.314 8.2 9.33 8.73 8.12 7.52 6.92 6.315 7.1 9.33 8.73 8.12 7.52 6.92 6.316 8.5 9.33 8.73 8.12 7.52 6.92 6.317 9.33 8.73 8.12 7.52 6.92 6.318 7.8 9.33 8.73 8.12 7.52 6.92 6.319 7.6 9.33 8.73 8.12 7.52 6.92 6.3110 8 9.33 8.73 8.12 7.52 6.92 6.3111 7.5 9.33 8.73 8.12 7.52 6.92 6.3112 7.2 9.33 8.73 8.12 7.52 6.92 6.3113 8.8 9.33 8.73 8.12 7.52 6.92 6.3114 8.3 9.33 8.73 8.12 7.52 6.92 6.3115 8.3 9.33 8.73 8.12 7.52 6.92 6.3116 8.1 9.33 8.73 8.12 7.52 6.92 6.3117 8 9.33 8.73 8.12 7.52 6.92 6.3118 7.7 9.33 8.73 8.12 7.52 6.92 6.3119 7.6 9.33 8.73 8.12 7.52 6.92 6.3120 7.5 9.33 8.73 8.12 7.52 6.92 6.3121 7.2 9.33 8.73 8.12 7.52 6.92 6.3122 7.1 9.33 8.73 8.12 7.52 6.92 6.3123 7.7 9.33 8.73 8.12 7.52 6.92 6.3124 7.5 9.33 8.73 8.12 7.52 6.92 6.3125 7.2 9.33 8.73 8.12 7.52 6.92 6.3126 7.1 9.33 8.73 8.12 7.52 6.92 6.3127 6.8 9.33 8.73 8.12 7.52 6.92 6.3128 7.5 9.33 8.73 8.12 7.52 6.92 6.3129 9.33 8.73 8.12 7.52 6.92 6.3130 7.3 9.33 8.73 8.12 7.52 6.92 6.3131 7 9.33 8.73 8.12 7.52 6.92 6.31
CALCIUM LEVEL II
Back to Index Back to Data entry
Back to Index Back to Data entry
1 2 3 4 5 6 7 8 9 101112131415161718192021222324252627282930315.115.716.316.917.518.118.719.319.91
+3SD+2SD+1SDMean -1SD-2SD-3SD
Leve
l I:
Cal
cium
in
mg/d
l
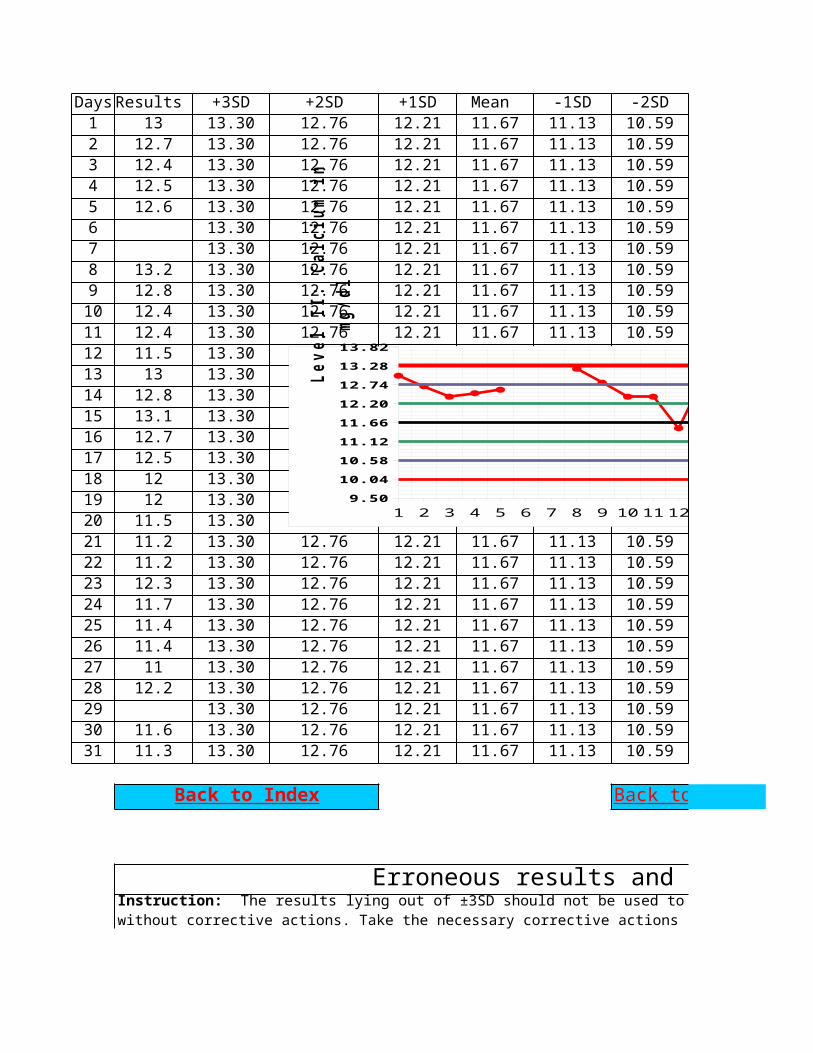
DaysResults +3SD +2SD +1SD Mean -1SD -2SD1 13 13.30 12.76 12.21 11.67 11.13 10.592 12.7 13.30 12.76 12.21 11.67 11.13 10.593 12.4 13.30 12.76 12.21 11.67 11.13 10.594 12.5 13.30 12.76 12.21 11.67 11.13 10.595 12.6 13.30 12.76 12.21 11.67 11.13 10.596 13.30 12.76 12.21 11.67 11.13 10.597 13.30 12.76 12.21 11.67 11.13 10.598 13.2 13.30 12.76 12.21 11.67 11.13 10.599 12.8 13.30 12.76 12.21 11.67 11.13 10.5910 12.4 13.30 12.76 12.21 11.67 11.13 10.5911 12.4 13.30 12.76 12.21 11.67 11.13 10.5912 11.5 13.30 12.76 12.21 11.67 11.13 10.5913 13 13.30 12.76 12.21 11.67 11.13 10.5914 12.8 13.30 12.76 12.21 11.67 11.13 10.5915 13.1 13.30 12.76 12.21 11.67 11.13 10.5916 12.7 13.30 12.76 12.21 11.67 11.13 10.5917 12.5 13.30 12.76 12.21 11.67 11.13 10.5918 12 13.30 12.76 12.21 11.67 11.13 10.5919 12 13.30 12.76 12.21 11.67 11.13 10.5920 11.5 13.30 12.76 12.21 11.67 11.13 10.5921 11.2 13.30 12.76 12.21 11.67 11.13 10.5922 11.2 13.30 12.76 12.21 11.67 11.13 10.5923 12.3 13.30 12.76 12.21 11.67 11.13 10.5924 11.7 13.30 12.76 12.21 11.67 11.13 10.5925 11.4 13.30 12.76 12.21 11.67 11.13 10.5926 11.4 13.30 12.76 12.21 11.67 11.13 10.5927 11 13.30 12.76 12.21 11.67 11.13 10.5928 12.2 13.30 12.76 12.21 11.67 11.13 10.5929 13.30 12.76 12.21 11.67 11.13 10.5930 11.6 13.30 12.76 12.21 11.67 11.13 10.5931 11.3 13.30 12.76 12.21 11.67 11.13 10.59
Erroneous results and trouble shooting
Back to Index Back to Data entry
Instruction: The results lying out of ±3SD should not be used to plot the LJ charts and the results can not be reported without corrective actions. Take the necessary corrective actions and fill in the following table. The values of the outlying
1 2 3 4 5 6 7 8 9 10 11 12131415 1617 18 192021 22 232425 26 272829 30319.50
10.0410.5811.1211.6612.2012.7413.2813.82
+3SD+2SD+1SDMean -1SD-2SD-3SD
Leve
l II
: Ca
lciu
m in
mg
/dl
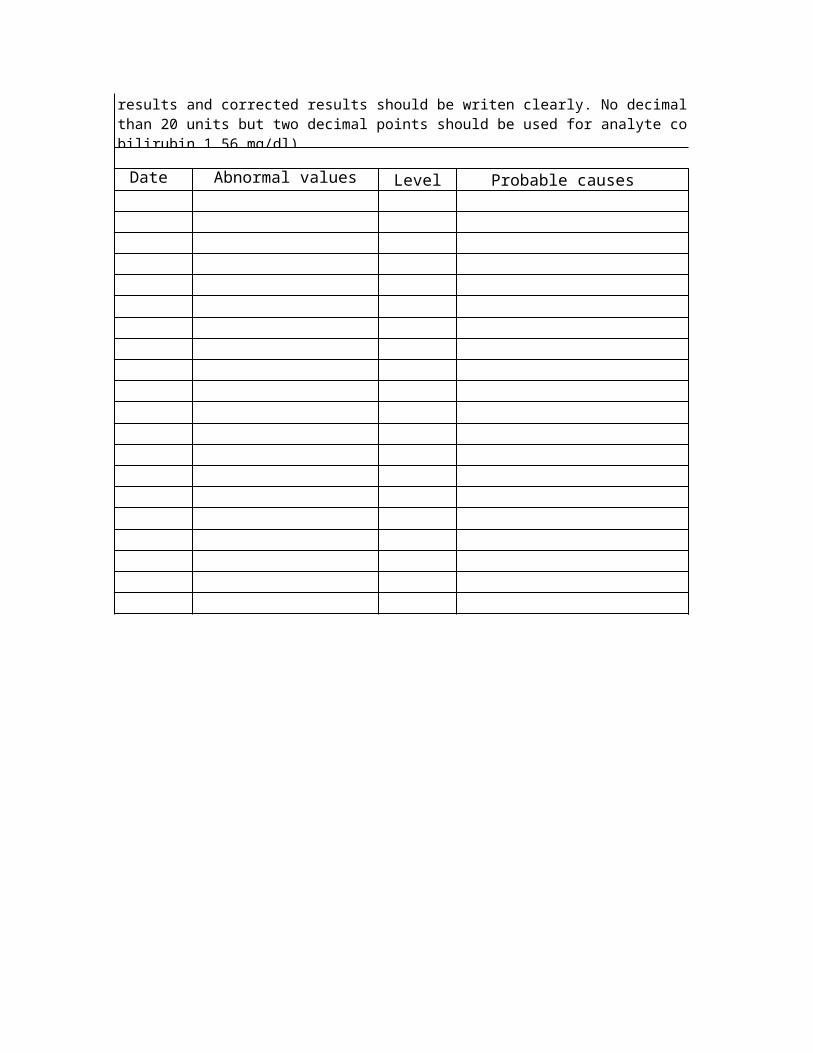
Date Abnormal values Level Probable causes
without corrective actions. Take the necessary corrective actions and fill in the following table. The values of the outlying results and corrected results should be writen clearly. No decimal points is required for the analyte concentration greater than 20 units but two decimal points should be used for analyte concentration less than 20 units (glucose = 89mg/dl; total bilirubin 1.56 mg/dl).
IQC IN BIOCHEMISTRY: Biorad QC Level I and II
-3SD SD5.71 0.605.71 0.605.71 0.605.71 0.605.71 0.605.71 0.605.71 0.605.71 0.605.71 0.605.71 0.605.71 0.605.71 0.605.71 0.605.71 0.605.71 0.605.71 0.605.71 0.605.71 0.605.71 0.605.71 0.605.71 0.605.71 0.605.71 0.605.71 0.605.71 0.605.71 0.605.71 0.605.71 0.605.71 0.605.71 0.605.71 0.60
Back to Data entry
Back to Data entry
1 2 3 4 5 6 7 8 9 101112131415161718192021222324252627282930315.115.716.316.917.518.118.719.319.91
+3SD+2SD+1SDMean -1SD-2SD-3SD
Leve
l I:
Cal
cium
in
mg/d
l
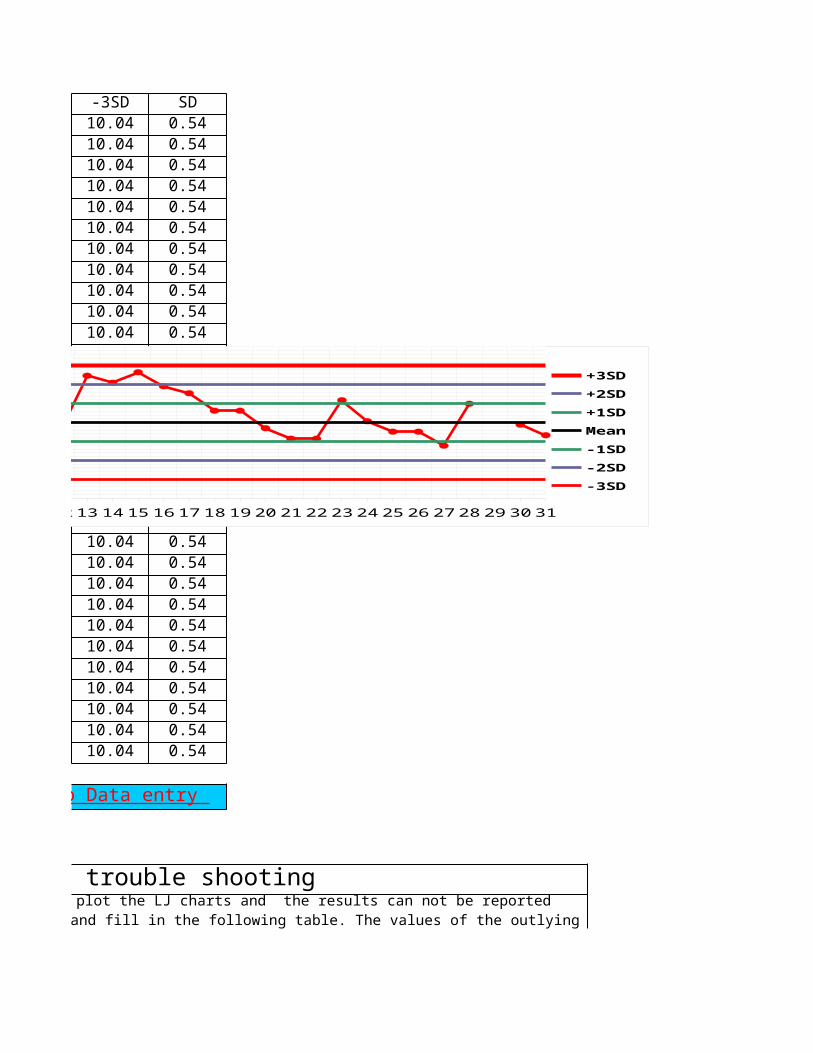
-3SD SD10.04 0.5410.04 0.5410.04 0.5410.04 0.5410.04 0.5410.04 0.5410.04 0.5410.04 0.5410.04 0.5410.04 0.5410.04 0.5410.04 0.5410.04 0.5410.04 0.5410.04 0.5410.04 0.5410.04 0.5410.04 0.5410.04 0.5410.04 0.5410.04 0.5410.04 0.5410.04 0.5410.04 0.5410.04 0.5410.04 0.5410.04 0.5410.04 0.5410.04 0.5410.04 0.5410.04 0.54
Erroneous results and trouble shooting
Back to Data entry
3SD should not be used to plot the LJ charts and the results can not be reported without corrective actions. Take the necessary corrective actions and fill in the following table. The values of the outlying
1 2 3 4 5 6 7 8 9 10 11 1213 1415 1617181920 2122 2324 25 26 272829 30319.50
10.0410.5811.1211.6612.2012.7413.2813.82
+3SD+2SD+1SDMean -1SD-2SD-3SD
Leve
l II
: Ca
lciu
m in
mg
/dl
Corrective actions Corrected by
without corrective actions. Take the necessary corrective actions and fill in the following table. The values of the outlying results and corrected results should be writen clearly. No decimal points is required for the analyte concentration greater than 20 units but two decimal points should be used for analyte concentration less than 20 units (glucose = 89mg/dl; total

IQC IN BIOCHEMISTRY: Biorad QC Level I and II
LEVEL I
LEVEL II
IQC IN BIOCHEMISTRY: Biorad QC Level I and II
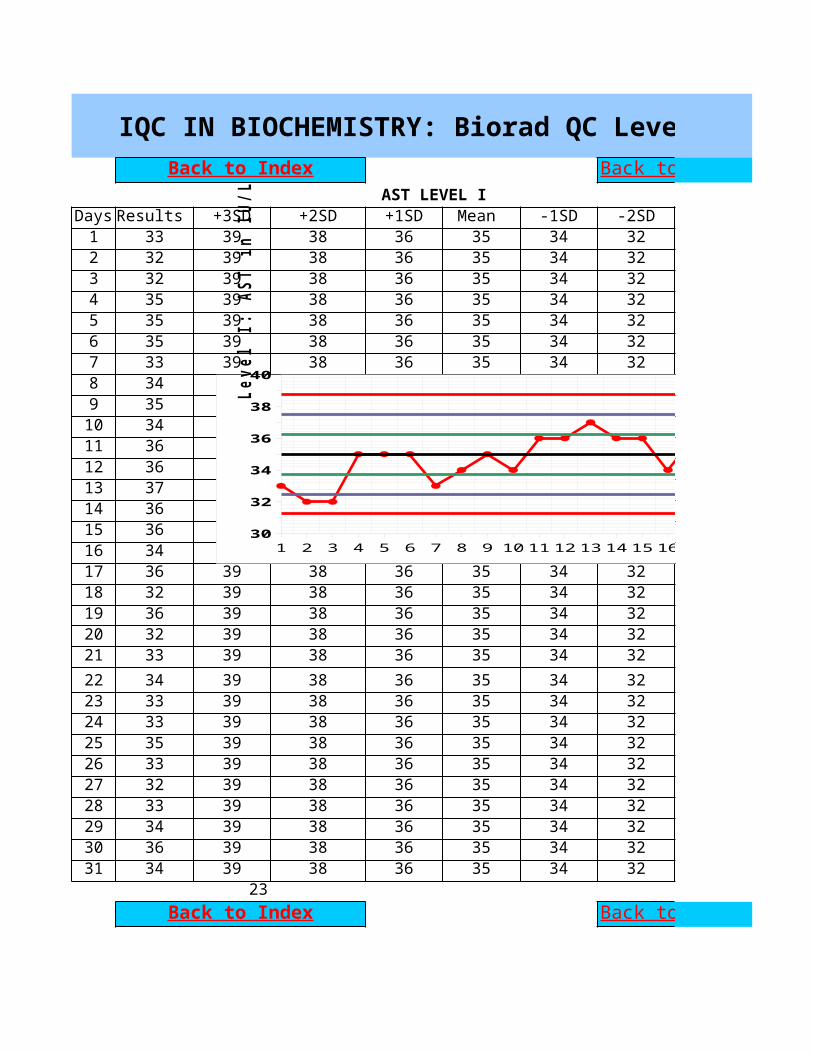
AST LEVEL IDays Results +3SD +2SD +1SD Mean -1SD -2SD1 33 39 38 36 35 34 322 32 39 38 36 35 34 323 32 39 38 36 35 34 324 35 39 38 36 35 34 325 35 39 38 36 35 34 326 35 39 38 36 35 34 327 33 39 38 36 35 34 328 34 39 38 36 35 34 329 35 39 38 36 35 34 3210 34 39 38 36 35 34 3211 36 39 38 36 35 34 3212 36 39 38 36 35 34 3213 37 39 38 36 35 34 3214 36 39 38 36 35 34 3215 36 39 38 36 35 34 3216 34 39 38 36 35 34 3217 36 39 38 36 35 34 3218 32 39 38 36 35 34 3219 36 39 38 36 35 34 3220 32 39 38 36 35 34 3221 33 39 38 36 35 34 3222 34 39 38 36 35 34 3223 33 39 38 36 35 34 3224 33 39 38 36 35 34 3225 35 39 38 36 35 34 3226 33 39 38 36 35 34 3227 32 39 38 36 35 34 3228 33 39 38 36 35 34 3229 34 39 38 36 35 34 3230 36 39 38 36 35 34 3231 34 39 38 36 35 34 32
23
Back to Index Back to Data entry
Back to Index Back to Data entry
1 2 3 4 5 6 7 8 9 10 11 12 13 14 15 16 17 18 19 20 21 22 23 24 25 26 27 28 29 30 3130
32
34
36
38
40
+3SD+2SD+1SDMean -1SD-2SD-3SD
Leve
l I:
AST
in
IU/L
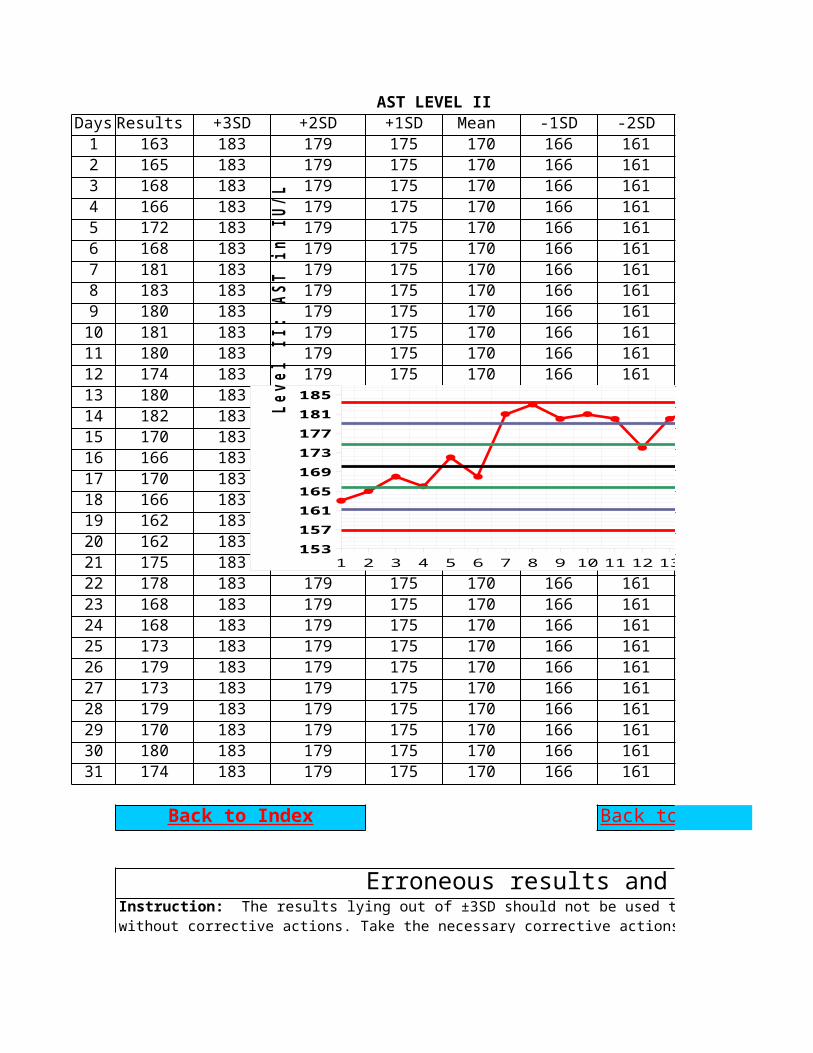
AST LEVEL IIDays Results +3SD +2SD +1SD Mean -1SD -2SD1 163 183 179 175 170 166 1612 165 183 179 175 170 166 1613 168 183 179 175 170 166 1614 166 183 179 175 170 166 1615 172 183 179 175 170 166 1616 168 183 179 175 170 166 1617 181 183 179 175 170 166 1618 183 183 179 175 170 166 1619 180 183 179 175 170 166 16110 181 183 179 175 170 166 16111 180 183 179 175 170 166 16112 174 183 179 175 170 166 16113 180 183 179 175 170 166 16114 182 183 179 175 170 166 16115 170 183 179 175 170 166 16116 166 183 179 175 170 166 16117 170 183 179 175 170 166 16118 166 183 179 175 170 166 16119 162 183 179 175 170 166 16120 162 183 179 175 170 166 16121 175 183 179 175 170 166 16122 178 183 179 175 170 166 16123 168 183 179 175 170 166 16124 168 183 179 175 170 166 16125 173 183 179 175 170 166 16126 179 183 179 175 170 166 16127 173 183 179 175 170 166 16128 179 183 179 175 170 166 16129 170 183 179 175 170 166 16130 180 183 179 175 170 166 16131 174 183 179 175 170 166 161
Erroneous results and trouble shooting
Back to Index Back to Data entry
Instruction: The results lying out of ±3SD should not be used to plot the LJ charts and the results can not be reported without corrective actions. Take the necessary corrective actions and fill in the following table. The values of the
1 2 3 4 5 6 7 8 9 10 11 12 13 14 15 16 17 18 19 20 21 22 23 24 25 26 27 28 29 30 31153157161165169173177181185
+3SD+2SD+1SDMean -1SD-2SD-3SD
Leve
l II
: AS
T in
IU/
L
Date Abnormal values Level Corrected values
without corrective actions. Take the necessary corrective actions and fill in the following table. The values of the outlying results and corrected results should be writen clearly. No decimal points is required for the analyte concentration greater than 20 units but two decimal points should be used for analyte concentration less than 20 units (glucose = 89mg/dl; total bilirubin 1.56 mg/dl).
IQC IN BIOCHEMISTRY: Biorad QC Level I and II
-3SD SD31 131 131 131 131 131 131 131 131 131 131 131 131 131 131 131 131 131 131 131 131 131 131 131 131 131 131 131 131 131 131 1
Back to Data entry
Back to Data entry
1 2 3 4 5 6 7 8 9 10 11 12 13 14 15 16 17 18 19 20 21 22 23 24 25 26 27 28 29 30 3130
32
34
36
38
40
+3SD+2SD+1SDMean -1SD-2SD-3SD
Leve
l I:
AST
in
IU/L
-3SD SD157 4157 4157 4157 4157 4157 4157 4157 4157 4157 4157 4157 4157 4157 4157 4157 4157 4157 4157 4157 4157 4157 4157 4157 4157 4157 4157 4157 4157 4157 4157 4
Erroneous results and trouble shooting
Back to Data entry
3SD should not be used to plot the LJ charts and the results can not be reported without corrective actions. Take the necessary corrective actions and fill in the following table. The values of the
1 2 3 4 5 6 7 8 9 10 11 12 13 14 15 16 17 18 19 20 21 22 23 24 25 26 27 28 29 30 31153157161165169173177181185
+3SD+2SD+1SDMean -1SD-2SD-3SD
Leve
l II
: AS
T in
IU/
L
Corrective actions Corrected by
without corrective actions. Take the necessary corrective actions and fill in the following table. The values of the outlying results and corrected results should be writen clearly. No decimal points is required for the analyte concentration greater than 20 units but two decimal points should be used for analyte concentration less than 20 units
IQC IN BIOCHEMISTRY: Biorad QC Level I and II
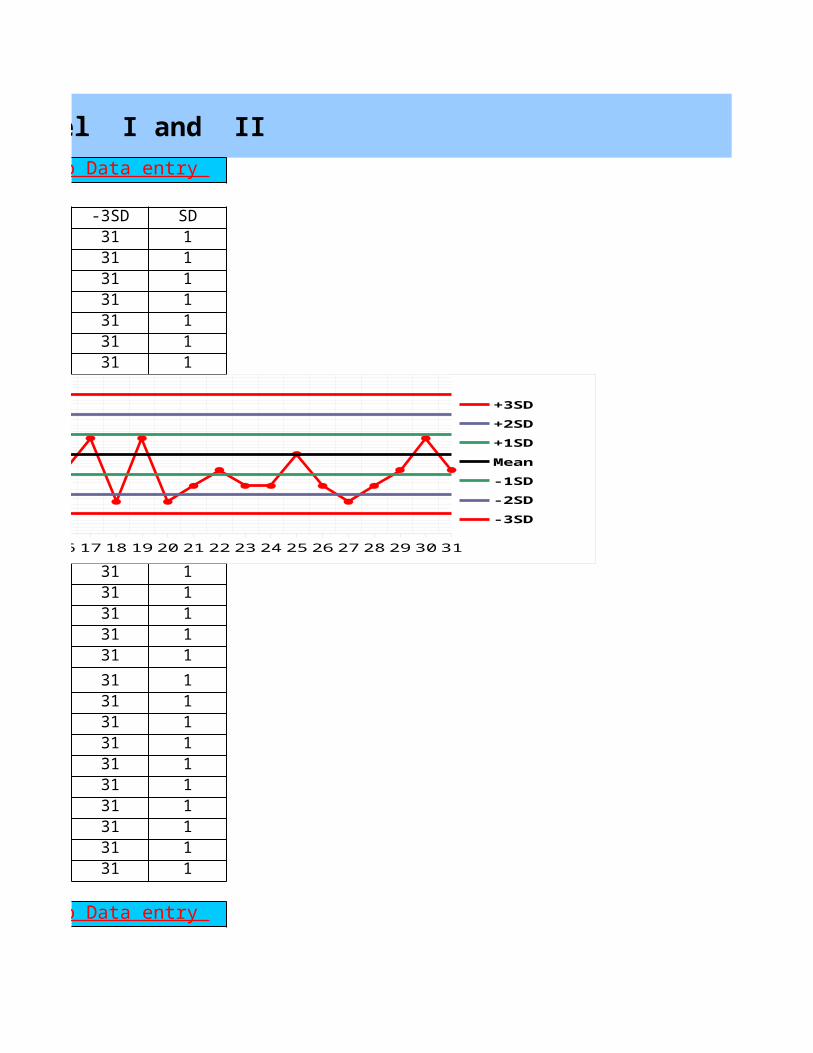
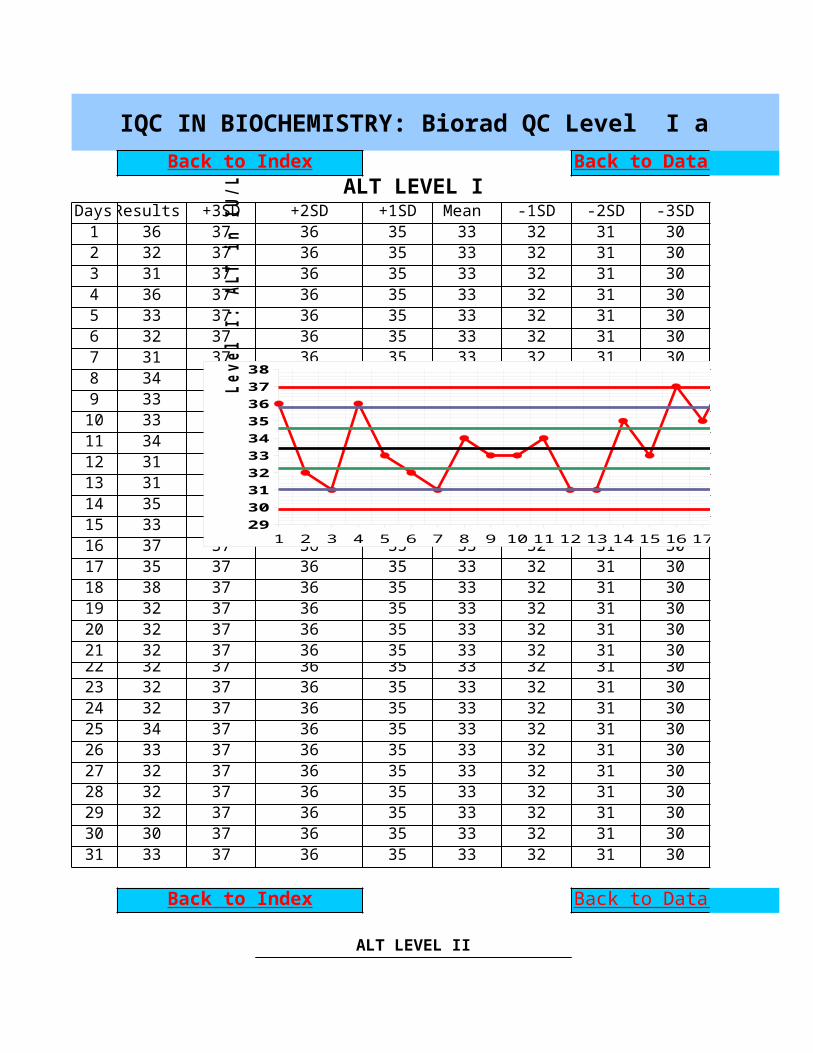
ALT LEVEL IDaysResults +3SD +2SD +1SD Mean -1SD -2SD -3SD1 36 37 36 35 33 32 31 302 32 37 36 35 33 32 31 303 31 37 36 35 33 32 31 304 36 37 36 35 33 32 31 305 33 37 36 35 33 32 31 306 32 37 36 35 33 32 31 307 31 37 36 35 33 32 31 308 34 37 36 35 33 32 31 309 33 37 36 35 33 32 31 3010 33 37 36 35 33 32 31 3011 34 37 36 35 33 32 31 3012 31 37 36 35 33 32 31 3013 31 37 36 35 33 32 31 3014 35 37 36 35 33 32 31 3015 33 37 36 35 33 32 31 3016 37 37 36 35 33 32 31 3017 35 37 36 35 33 32 31 3018 38 37 36 35 33 32 31 3019 32 37 36 35 33 32 31 3020 32 37 36 35 33 32 31 3021 32 37 36 35 33 32 31 3022 32 37 36 35 33 32 31 3023 32 37 36 35 33 32 31 3024 32 37 36 35 33 32 31 3025 34 37 36 35 33 32 31 3026 33 37 36 35 33 32 31 3027 32 37 36 35 33 32 31 3028 32 37 36 35 33 32 31 3029 32 37 36 35 33 32 31 3030 30 37 36 35 33 32 31 3031 33 37 36 35 33 32 31 30
ALT LEVEL II
Back to Index Back to Data entry
Back to Index Back to Data entry
1 2 3 4 5 6 7 8 9 10 11 12 13 14 15 16 17 18 19 20 21 22 23 24 25 26 27 28 29 30 3129303132333435363738
+3SD+2SD+1SDMean -1SD-2SD-3SD
Leve
l I:
ALT
in
IU/L
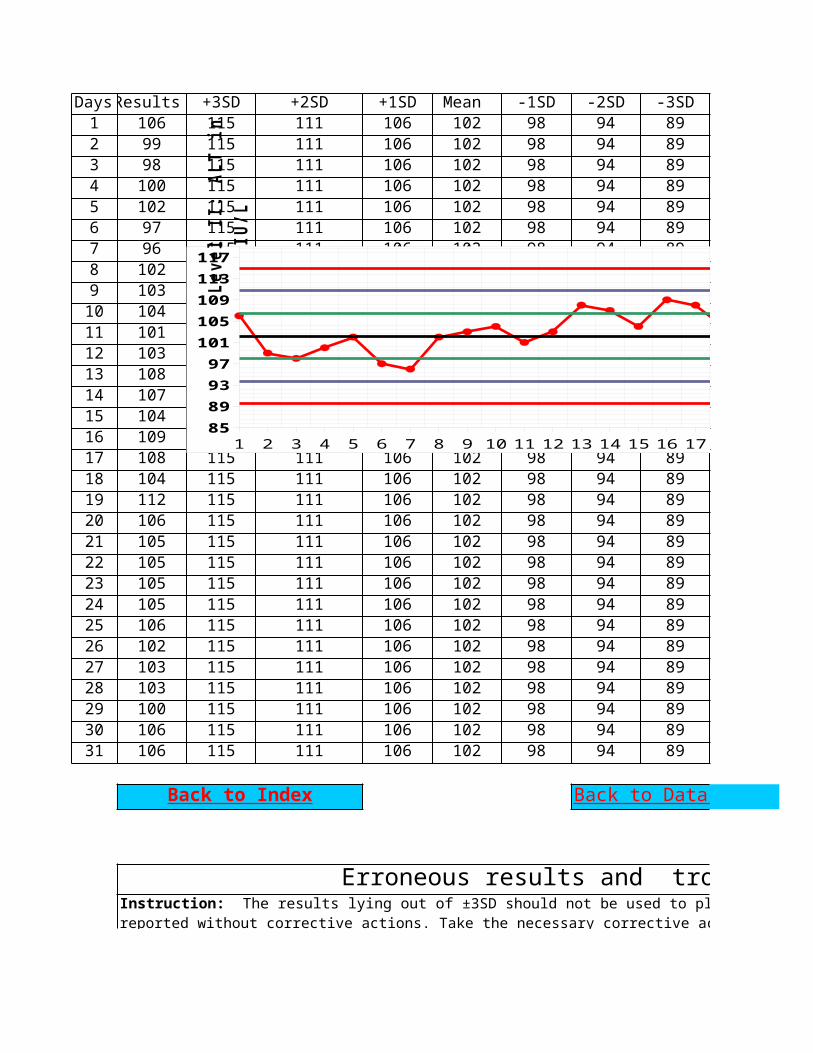
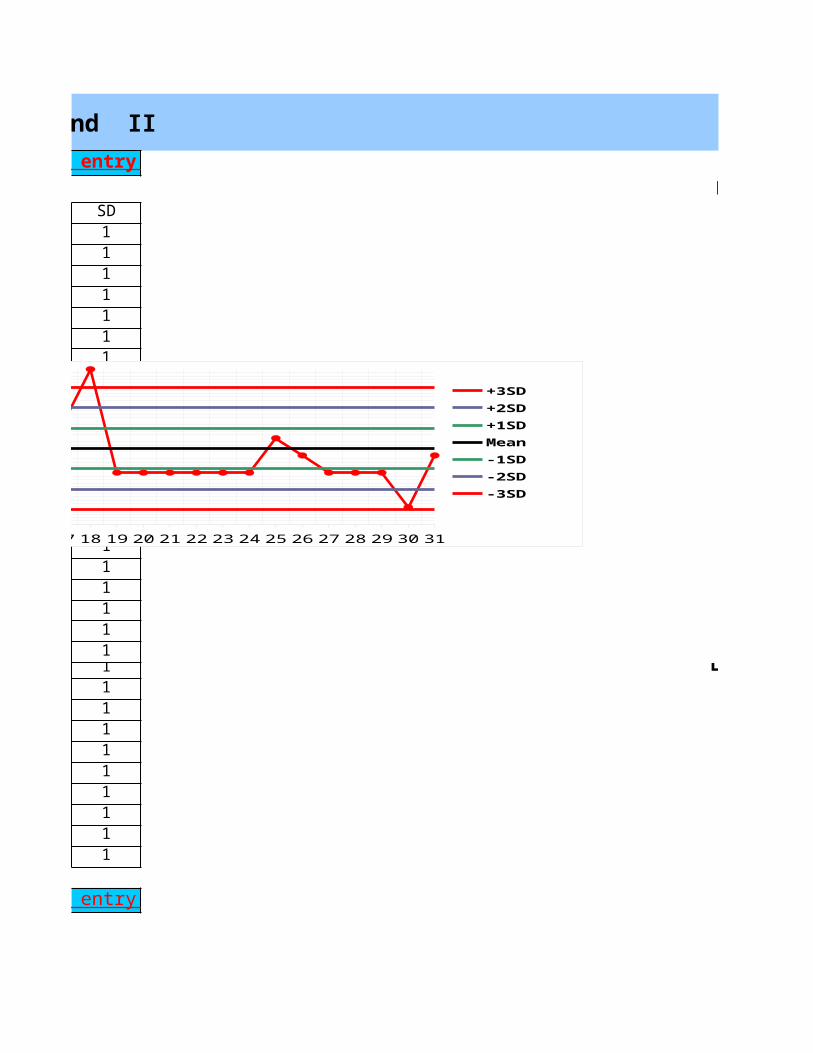
DaysResults +3SD +2SD +1SD Mean -1SD -2SD -3SD1 106 115 111 106 102 98 94 892 99 115 111 106 102 98 94 893 98 115 111 106 102 98 94 894 100 115 111 106 102 98 94 895 102 115 111 106 102 98 94 896 97 115 111 106 102 98 94 897 96 115 111 106 102 98 94 898 102 115 111 106 102 98 94 899 103 115 111 106 102 98 94 8910 104 115 111 106 102 98 94 8911 101 115 111 106 102 98 94 8912 103 115 111 106 102 98 94 8913 108 115 111 106 102 98 94 8914 107 115 111 106 102 98 94 8915 104 115 111 106 102 98 94 8916 109 115 111 106 102 98 94 8917 108 115 111 106 102 98 94 8918 104 115 111 106 102 98 94 8919 112 115 111 106 102 98 94 8920 106 115 111 106 102 98 94 8921 105 115 111 106 102 98 94 8922 105 115 111 106 102 98 94 8923 105 115 111 106 102 98 94 8924 105 115 111 106 102 98 94 8925 106 115 111 106 102 98 94 8926 102 115 111 106 102 98 94 8927 103 115 111 106 102 98 94 8928 103 115 111 106 102 98 94 8929 100 115 111 106 102 98 94 8930 106 115 111 106 102 98 94 8931 106 115 111 106 102 98 94 89
Erroneous results and trouble shooting
Back to Index Back to Data entry
Instruction: The results lying out of ±3SD should not be used to plot the LJ charts and the results can not be reported without corrective actions. Take the necessary corrective actions and fill in the following table. The
1 2 3 4 5 6 7 8 9 10 11 12 13 14 15 16 17 18 19 20 21 22 23 24 25 26 27 28 29 30 3185899397101105109113117
+3SD+2SD+1SDMean -1SD-2SD-3SD
Leve
l II
: AL
T in
IU
/L
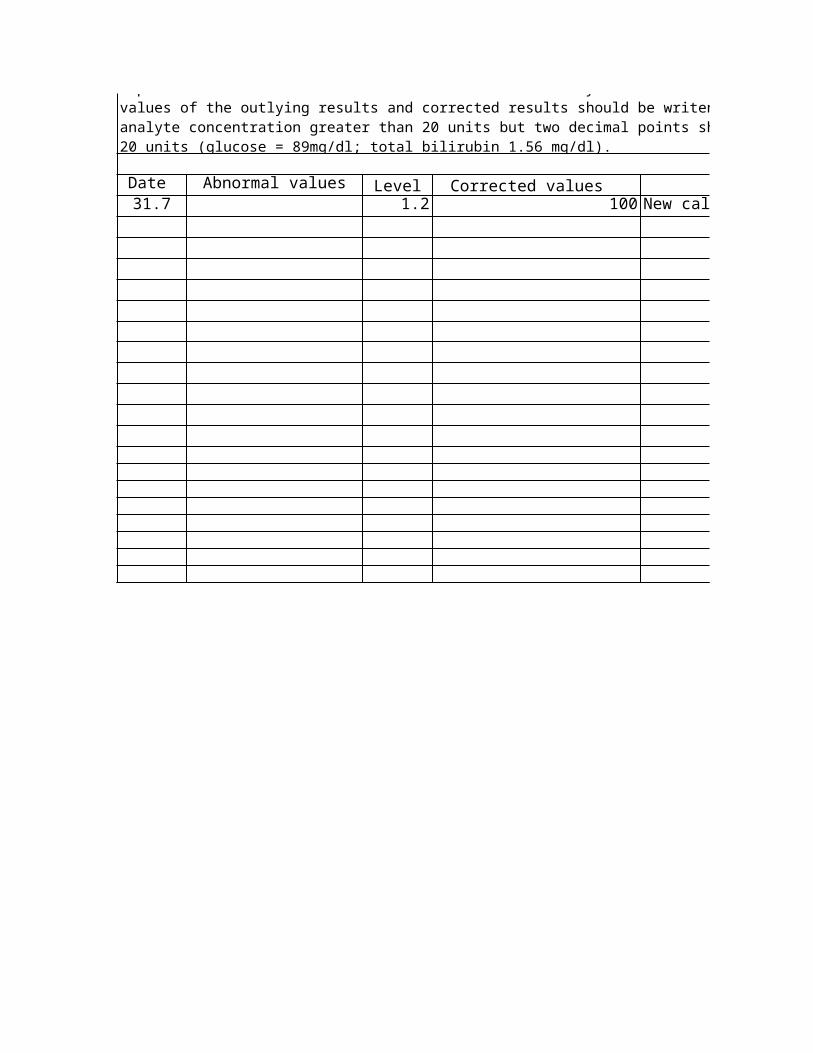
Date Abnormal values Level Corrected values Corrective actions31.7 1.2 100 New calibrator
reported without corrective actions. Take the necessary corrective actions and fill in the following table. The values of the outlying results and corrected results should be writen clearly. No decimal points is required for the analyte concentration greater than 20 units but two decimal points should be used for analyte concentration less than 20 units (glucose = 89mg/dl; total bilirubin 1.56 mg/dl).
IQC IN BIOCHEMISTRY: Biorad QC Level I and II
LEVEL ISD1111111111111111111111 LEVEL II111111111
Back to Data entry
Back to Data entry
1 2 3 4 5 6 7 8 9 10 11 12 13 14 15 16 17 18 19 20 21 22 23 24 25 26 27 28 29 30 3129303132333435363738
+3SD+2SD+1SDMean -1SD-2SD-3SD
Leve
l I:
ALT
in
IU/L
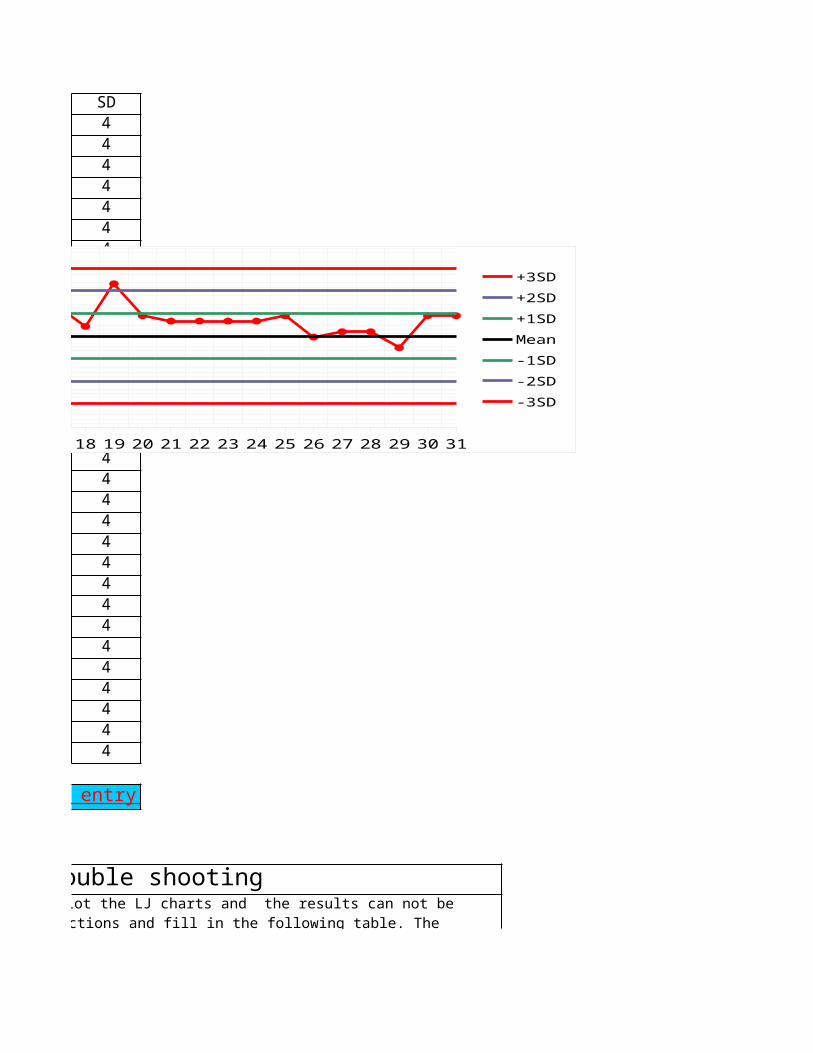
SD4444444444444444444444444444444
Erroneous results and trouble shooting
Back to Data entry
3SD should not be used to plot the LJ charts and the results can not be reported without corrective actions. Take the necessary corrective actions and fill in the following table. The
1 2 3 4 5 6 7 8 9 10 11 12 13 14 15 16 17 18 19 20 21 22 23 24 25 26 27 28 29 30 3185899397101105109113117
+3SD+2SD+1SDMean -1SD-2SD-3SD
Leve
l II
: AL
T in
IU
/L
Corrective actions Corrected byNew calibrator Thubten
reported without corrective actions. Take the necessary corrective actions and fill in the following table. The values of the outlying results and corrected results should be writen clearly. No decimal points is required for the analyte concentration greater than 20 units but two decimal points should be used for analyte concentration less than
IQC IN BIOCHEMISTRY: Biorad QC Level I and II
LEVEL I
LEVEL II
IQC IN BIOCHEMISTRY: Biorad QC Level I and II
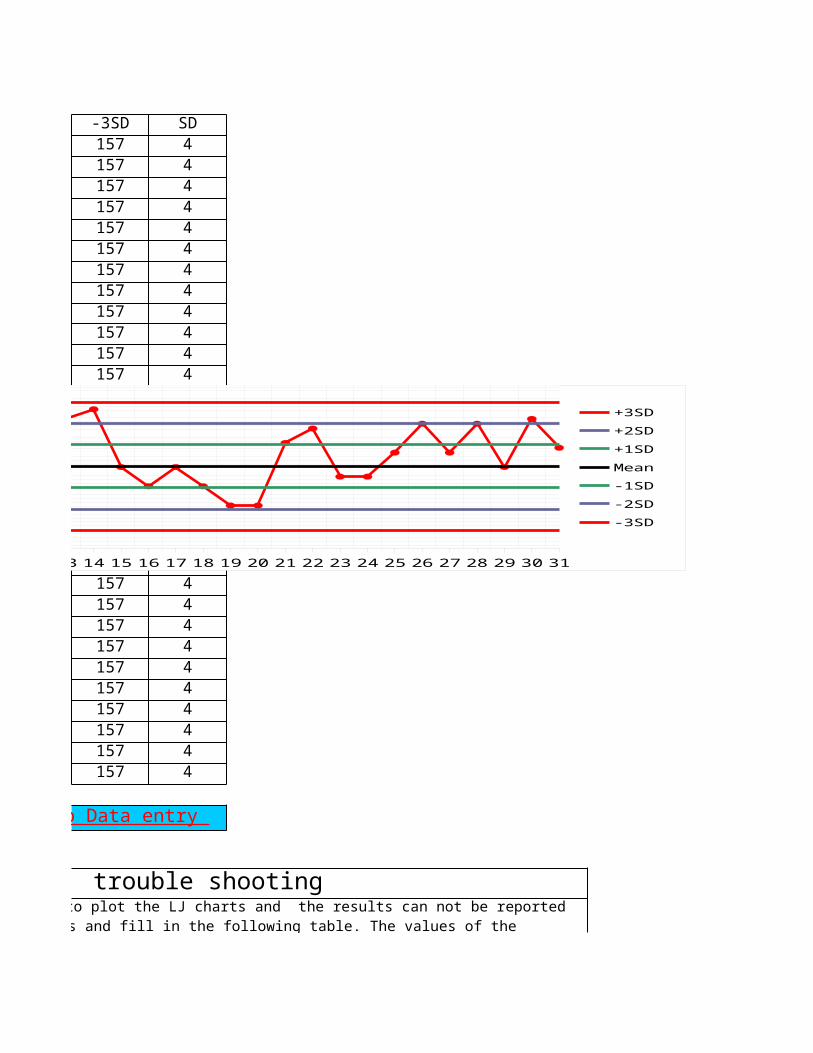
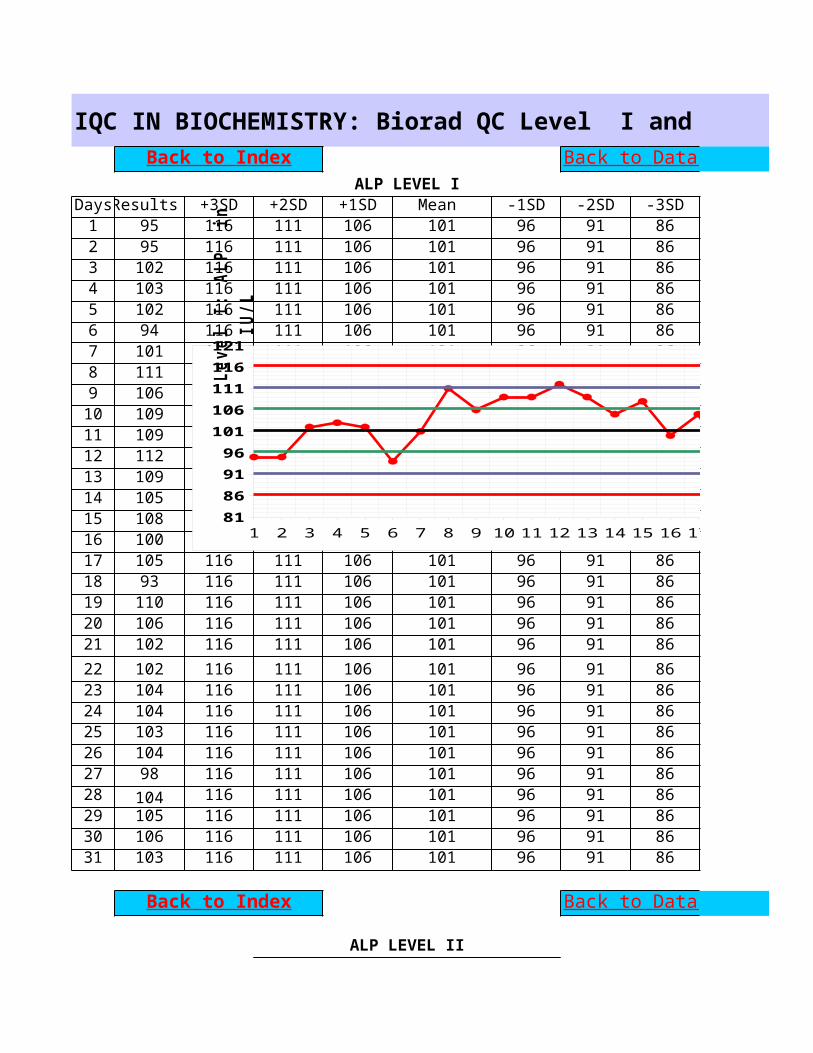
ALP LEVEL IDaysResults +3SD +2SD +1SD Mean -1SD -2SD -3SD1 95 116 111 106 101 96 91 862 95 116 111 106 101 96 91 863 102 116 111 106 101 96 91 864 103 116 111 106 101 96 91 865 102 116 111 106 101 96 91 866 94 116 111 106 101 96 91 867 101 116 111 106 101 96 91 868 111 116 111 106 101 96 91 869 106 116 111 106 101 96 91 8610 109 116 111 106 101 96 91 8611 109 116 111 106 101 96 91 8612 112 116 111 106 101 96 91 8613 109 116 111 106 101 96 91 8614 105 116 111 106 101 96 91 8615 108 116 111 106 101 96 91 8616 100 116 111 106 101 96 91 8617 105 116 111 106 101 96 91 8618 93 116 111 106 101 96 91 8619 110 116 111 106 101 96 91 8620 106 116 111 106 101 96 91 8621 102 116 111 106 101 96 91 8622 102 116 111 106 101 96 91 8623 104 116 111 106 101 96 91 8624 104 116 111 106 101 96 91 8625 103 116 111 106 101 96 91 8626 104 116 111 106 101 96 91 8627 98 116 111 106 101 96 91 8628 104 116 111 106 101 96 91 8629 105 116 111 106 101 96 91 8630 106 116 111 106 101 96 91 8631 103 116 111 106 101 96 91 86
ALP LEVEL II
Back to Index Back to Data entry
Back to Index Back to Data entry
1 2 3 4 5 6 7 8 9 10 11 12 13 14 15 16 17 18 19 20 21 22 23 24 25 26 27 28 29 30 3181869196101106111116121
+3SD+2SD+1SDMean -1SD-2SD-3SD
Leve
l I:
ALP
in
IU
/L
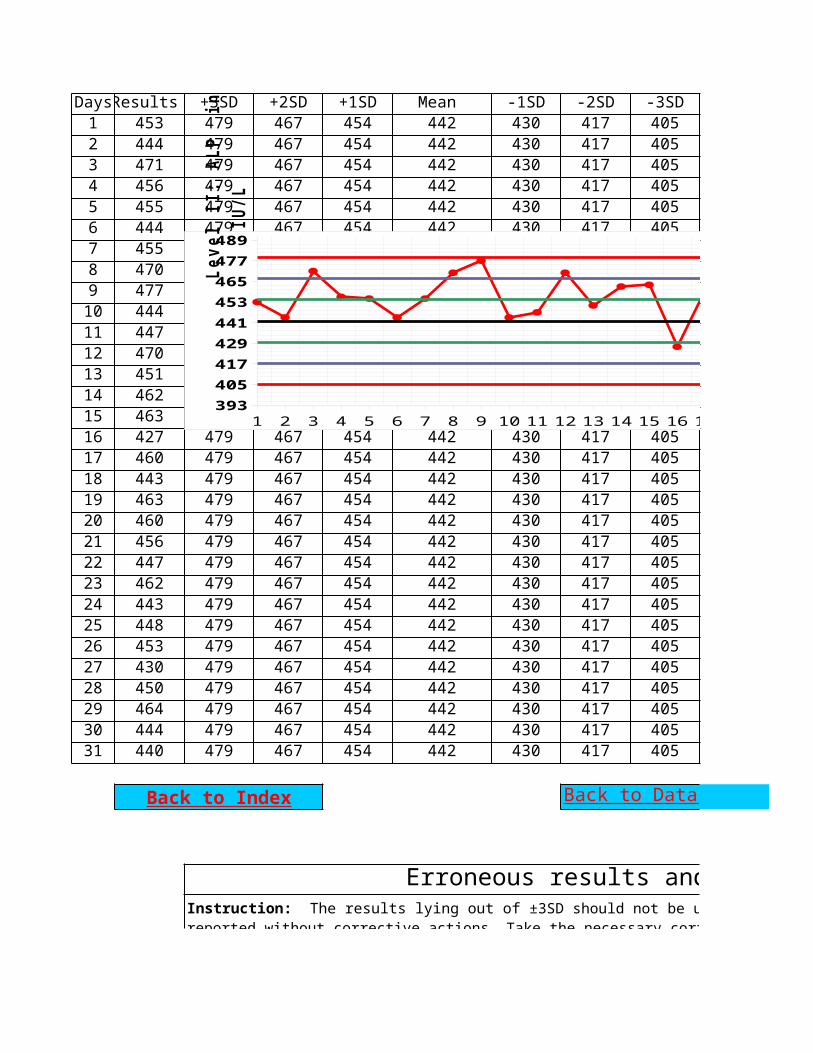
DaysResults +3SD +2SD +1SD Mean -1SD -2SD -3SD1 453 479 467 454 442 430 417 4052 444 479 467 454 442 430 417 4053 471 479 467 454 442 430 417 4054 456 479 467 454 442 430 417 4055 455 479 467 454 442 430 417 4056 444 479 467 454 442 430 417 4057 455 479 467 454 442 430 417 4058 470 479 467 454 442 430 417 4059 477 479 467 454 442 430 417 40510 444 479 467 454 442 430 417 40511 447 479 467 454 442 430 417 40512 470 479 467 454 442 430 417 40513 451 479 467 454 442 430 417 40514 462 479 467 454 442 430 417 40515 463 479 467 454 442 430 417 40516 427 479 467 454 442 430 417 40517 460 479 467 454 442 430 417 40518 443 479 467 454 442 430 417 40519 463 479 467 454 442 430 417 40520 460 479 467 454 442 430 417 40521 456 479 467 454 442 430 417 40522 447 479 467 454 442 430 417 40523 462 479 467 454 442 430 417 40524 443 479 467 454 442 430 417 40525 448 479 467 454 442 430 417 40526 453 479 467 454 442 430 417 40527 430 479 467 454 442 430 417 40528 450 479 467 454 442 430 417 40529 464 479 467 454 442 430 417 40530 444 479 467 454 442 430 417 40531 440 479 467 454 442 430 417 405
Erroneous results and trouble shooting
Back to Index Back to Data entry
Instruction: The results lying out of ±3SD should not be used to plot the LJ charts and the results can not be reported without corrective actions. Take the necessary corrective actions and fill in the following table. The values of the outlying results and corrected results should be writen clearly. No decimal points is required for the analyte concentration greater than 20 units but two decimal points should be used for analyte concentration less than 20 units (glucose = 89mg/dl; total bilirubin 1.56 mg/dl).
1 2 3 4 5 6 7 8 9 10 11 12 13 14 15 16 17 18 19 20 21 22 23 24 25 26 27 28 29 30 31393405417429441453465477489
+3SD+2SD+1SDMean -1SD-2SD-3SD
Leve
l II
: AL
P i
n IU
/L
Date Abnormal values Level Corrected values
Instruction: The results lying out of ±3SD should not be used to plot the LJ charts and the results can not be reported without corrective actions. Take the necessary corrective actions and fill in the following table. The values of the outlying results and corrected results should be writen clearly. No decimal points is required for the analyte concentration greater than 20 units but two decimal points should be used for analyte concentration less than 20 units (glucose = 89mg/dl; total bilirubin 1.56 mg/dl).
IQC IN BIOCHEMISTRY: Biorad QC Level I and II
SD5555555555555555555555 LEVEL II555555555
Back to Data entry
Back to Data entry
1 2 3 4 5 6 7 8 9 10 11 12 13 14 15 16 17 18 19 20 21 22 23 24 25 26 27 28 29 30 3181869196101106111116121
+3SD+2SD+1SDMean -1SD-2SD-3SD
Leve
l I:
ALP
in
IU
/L
SD12121212121212121212121212121212121212121212121212121212121212
Erroneous results and trouble shooting
Back to Data entry
3SD should not be used to plot the LJ charts and the results can not be reported without corrective actions. Take the necessary corrective actions and fill in the following table. The values of the outlying results and corrected results should be writen clearly. No decimal points is required for the analyte concentration greater than 20 units but two decimal points should be used for analyte concentration less than 20 units (glucose = 89mg/dl; total bilirubin 1.56 mg/dl).
1 2 3 4 5 6 7 8 9 10 11 12 13 14 15 16 17 18 19 20 21 22 23 24 25 26 27 28 29 30 31393405417429441453465477489
+3SD+2SD+1SDMean -1SD-2SD-3SD
Leve
l II
: AL
P i
n IU
/L
Corrective actions Corrected by
3SD should not be used to plot the LJ charts and the results can not be reported without corrective actions. Take the necessary corrective actions and fill in the following table. The values of the outlying results and corrected results should be writen clearly. No decimal points is required for the analyte concentration greater than 20 units but two decimal points should be used for analyte concentration less than 20 units (glucose = 89mg/dl; total bilirubin 1.56 mg/dl).
IQC IN BIOCHEMISTRY: Biorad QC Level I and II
LEVEL II
IQC IN BIOCHEMISTRY: Biorad QC Level I and II
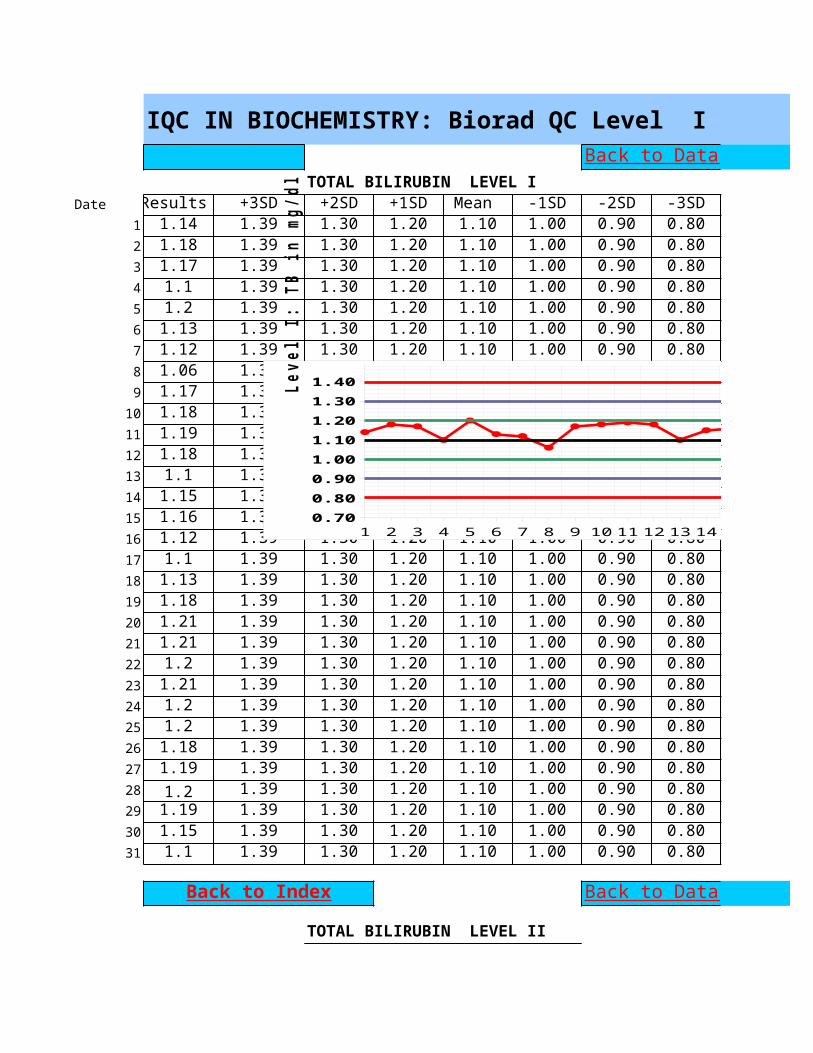
TOTAL BILIRUBIN LEVEL IDate Results +3SD +2SD +1SD Mean -1SD -2SD -3SD
1 1.14 1.39 1.30 1.20 1.10 1.00 0.90 0.802 1.18 1.39 1.30 1.20 1.10 1.00 0.90 0.803 1.17 1.39 1.30 1.20 1.10 1.00 0.90 0.804 1.1 1.39 1.30 1.20 1.10 1.00 0.90 0.805 1.2 1.39 1.30 1.20 1.10 1.00 0.90 0.806 1.13 1.39 1.30 1.20 1.10 1.00 0.90 0.807 1.12 1.39 1.30 1.20 1.10 1.00 0.90 0.808 1.06 1.39 1.30 1.20 1.10 1.00 0.90 0.809 1.17 1.39 1.30 1.20 1.10 1.00 0.90 0.8010 1.18 1.39 1.30 1.20 1.10 1.00 0.90 0.8011 1.19 1.39 1.30 1.20 1.10 1.00 0.90 0.8012 1.18 1.39 1.30 1.20 1.10 1.00 0.90 0.8013 1.1 1.39 1.30 1.20 1.10 1.00 0.90 0.8014 1.15 1.39 1.30 1.20 1.10 1.00 0.90 0.8015 1.16 1.39 1.30 1.20 1.10 1.00 0.90 0.8016 1.12 1.39 1.30 1.20 1.10 1.00 0.90 0.8017 1.1 1.39 1.30 1.20 1.10 1.00 0.90 0.8018 1.13 1.39 1.30 1.20 1.10 1.00 0.90 0.8019 1.18 1.39 1.30 1.20 1.10 1.00 0.90 0.8020 1.21 1.39 1.30 1.20 1.10 1.00 0.90 0.8021 1.21 1.39 1.30 1.20 1.10 1.00 0.90 0.8022 1.2 1.39 1.30 1.20 1.10 1.00 0.90 0.8023 1.21 1.39 1.30 1.20 1.10 1.00 0.90 0.8024 1.2 1.39 1.30 1.20 1.10 1.00 0.90 0.8025 1.2 1.39 1.30 1.20 1.10 1.00 0.90 0.8026 1.18 1.39 1.30 1.20 1.10 1.00 0.90 0.8027 1.19 1.39 1.30 1.20 1.10 1.00 0.90 0.8028 1.2 1.39 1.30 1.20 1.10 1.00 0.90 0.8029 1.19 1.39 1.30 1.20 1.10 1.00 0.90 0.8030 1.15 1.39 1.30 1.20 1.10 1.00 0.90 0.8031 1.1 1.39 1.30 1.20 1.10 1.00 0.90 0.80
TOTAL BILIRUBIN LEVEL II
Back to Data entry
Back to Index Back to Data entry
1 2 3 4 5 6 7 8 9 10 11 12 13 14 15 16 17 18 19 20 21 22 23 24 25 26 27 28 29 30 310.700.800.901.001.101.201.301.40
+3SD+2SD+1SDMean -1SD-2SD-3SD
Leve
l I:
TB
in m
g/dl
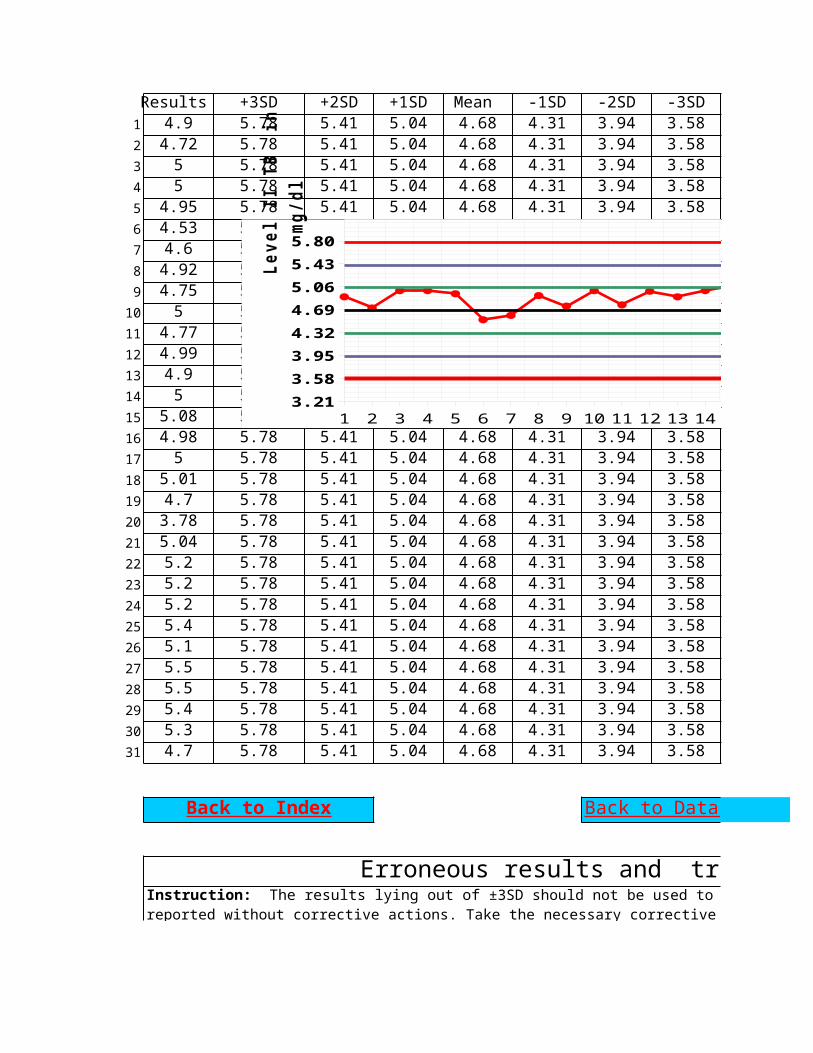
Results +3SD +2SD +1SD Mean -1SD -2SD -3SD1 4.9 5.78 5.41 5.04 4.68 4.31 3.94 3.582 4.72 5.78 5.41 5.04 4.68 4.31 3.94 3.583 5 5.78 5.41 5.04 4.68 4.31 3.94 3.584 5 5.78 5.41 5.04 4.68 4.31 3.94 3.585 4.95 5.78 5.41 5.04 4.68 4.31 3.94 3.586 4.53 5.78 5.41 5.04 4.68 4.31 3.94 3.587 4.6 5.78 5.41 5.04 4.68 4.31 3.94 3.588 4.92 5.78 5.41 5.04 4.68 4.31 3.94 3.589 4.75 5.78 5.41 5.04 4.68 4.31 3.94 3.5810 5 5.78 5.41 5.04 4.68 4.31 3.94 3.5811 4.77 5.78 5.41 5.04 4.68 4.31 3.94 3.5812 4.99 5.78 5.41 5.04 4.68 4.31 3.94 3.5813 4.9 5.78 5.41 5.04 4.68 4.31 3.94 3.5814 5 5.78 5.41 5.04 4.68 4.31 3.94 3.5815 5.08 5.78 5.41 5.04 4.68 4.31 3.94 3.5816 4.98 5.78 5.41 5.04 4.68 4.31 3.94 3.5817 5 5.78 5.41 5.04 4.68 4.31 3.94 3.5818 5.01 5.78 5.41 5.04 4.68 4.31 3.94 3.5819 4.7 5.78 5.41 5.04 4.68 4.31 3.94 3.5820 3.78 5.78 5.41 5.04 4.68 4.31 3.94 3.5821 5.04 5.78 5.41 5.04 4.68 4.31 3.94 3.5822 5.2 5.78 5.41 5.04 4.68 4.31 3.94 3.5823 5.2 5.78 5.41 5.04 4.68 4.31 3.94 3.5824 5.2 5.78 5.41 5.04 4.68 4.31 3.94 3.5825 5.4 5.78 5.41 5.04 4.68 4.31 3.94 3.5826 5.1 5.78 5.41 5.04 4.68 4.31 3.94 3.5827 5.5 5.78 5.41 5.04 4.68 4.31 3.94 3.5828 5.5 5.78 5.41 5.04 4.68 4.31 3.94 3.5829 5.4 5.78 5.41 5.04 4.68 4.31 3.94 3.5830 5.3 5.78 5.41 5.04 4.68 4.31 3.94 3.5831 4.7 5.78 5.41 5.04 4.68 4.31 3.94 3.58
Erroneous results and trouble shooting
Back to Index Back to Data entry
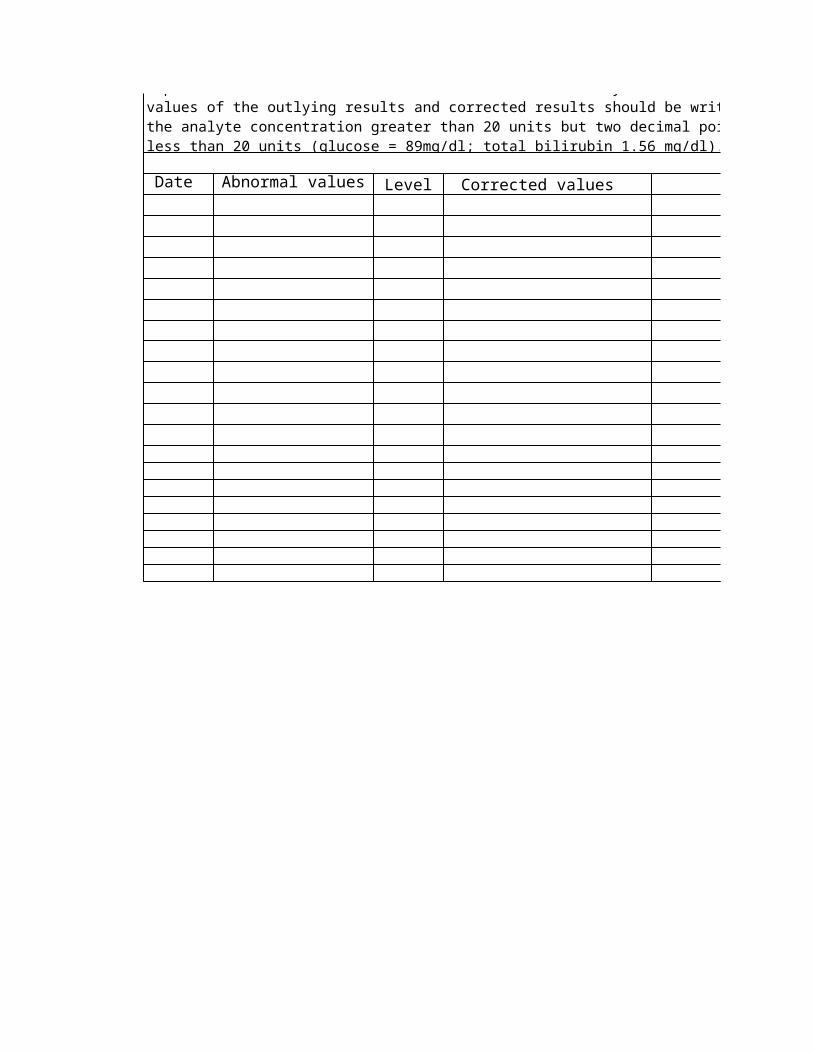
Instruction: The results lying out of ±3SD should not be used to plot the LJ charts and the results can not be reported without corrective actions. Take the necessary corrective actions and fill in the following table. The
1 2 3 4 5 6 7 8 9 10 11 12 13 14 15 16 17 18 19 20 21 22 23 24 25 26 27 28 29 30 313.213.583.954.324.695.065.435.80
+3SD+2SD+1SDMean -1SD-2SD-3SD
Leve
l II
TB
in
mg/d
l
Date Abnormal values Level Corrected values Corrective actions
reported without corrective actions. Take the necessary corrective actions and fill in the following table. The values of the outlying results and corrected results should be writen clearly. No decimal points is required for the analyte concentration greater than 20 units but two decimal points should be used for analyte concentration less than 20 units (glucose = 89mg/dl; total bilirubin 1.56 mg/dl).
IQC IN BIOCHEMISTRY: Biorad QC Level I and II
LEVEL ISD
0.100.100.100.100.100.100.100.100.100.100.100.100.100.100.100.100.100.100.100.100.100.100.100.100.100.100.100.100.100.100.10
Back to Data entry
Back to Data entry
1 2 3 4 5 6 7 8 9 10 11 12 13 14 15 16 17 18 19 20 21 22 23 24 25 26 27 28 29 30 310.700.800.901.001.101.201.301.40
+3SD+2SD+1SDMean -1SD-2SD-3SD
Leve
l I:
TB
in m
g/dl
SD0.370.370.370.370.370.370.370.370.370.370.370.370.370.370.370.370.370.370.370.370.370.370.370.370.370.370.370.370.370.370.37
Erroneous results and trouble shooting
Back to Data entry
3SD should not be used to plot the LJ charts and the results can not be reported without corrective actions. Take the necessary corrective actions and fill in the following table. The
1 2 3 4 5 6 7 8 9 10 11 12 13 14 15 16 17 18 19 20 21 22 23 24 25 26 27 28 29 30 313.213.583.954.324.695.065.435.80
+3SD+2SD+1SDMean -1SD-2SD-3SD
Leve
l II
TB
in
mg/d
l
Corrective actions Corrected by
reported without corrective actions. Take the necessary corrective actions and fill in the following table. The values of the outlying results and corrected results should be writen clearly. No decimal points is required for the analyte concentration greater than 20 units but two decimal points should be used for analyte concentration less than 20 units (glucose = 89mg/dl; total bilirubin 1.56 mg/dl).

IQC IN BIOCHEMISTRY: Biorad QC Level I and II
LEVEL I
IQC IN BIOCHEMISTRY: Biorad QC Level I and II
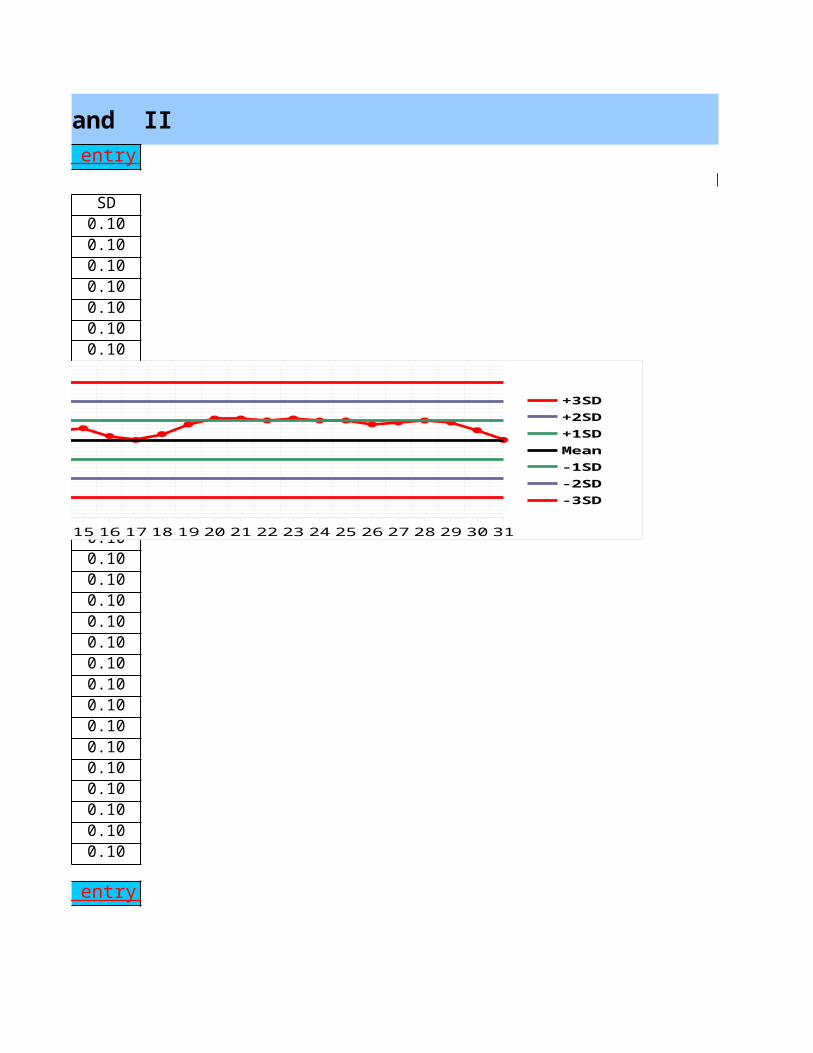
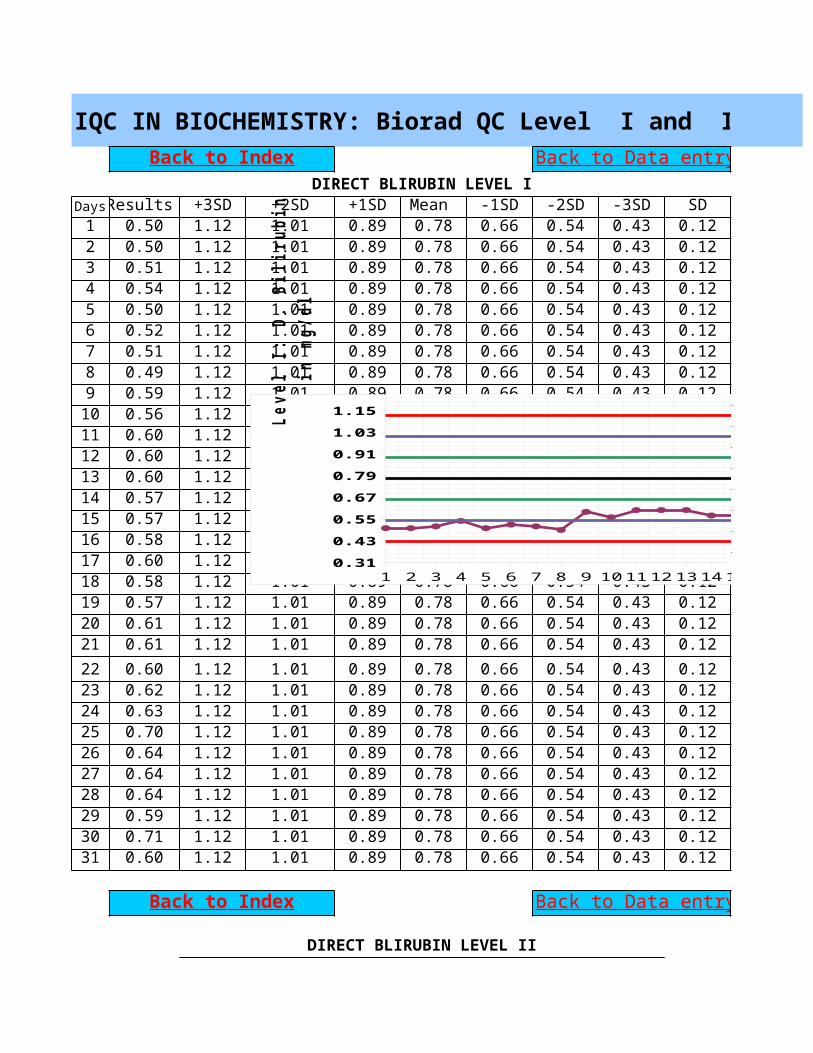
DIRECT BLIRUBIN LEVEL IDaysResults +3SD +2SD +1SD Mean -1SD -2SD -3SD SD1 0.50 1.12 1.01 0.89 0.78 0.66 0.54 0.43 0.122 0.50 1.12 1.01 0.89 0.78 0.66 0.54 0.43 0.123 0.51 1.12 1.01 0.89 0.78 0.66 0.54 0.43 0.124 0.54 1.12 1.01 0.89 0.78 0.66 0.54 0.43 0.125 0.50 1.12 1.01 0.89 0.78 0.66 0.54 0.43 0.126 0.52 1.12 1.01 0.89 0.78 0.66 0.54 0.43 0.127 0.51 1.12 1.01 0.89 0.78 0.66 0.54 0.43 0.128 0.49 1.12 1.01 0.89 0.78 0.66 0.54 0.43 0.129 0.59 1.12 1.01 0.89 0.78 0.66 0.54 0.43 0.1210 0.56 1.12 1.01 0.89 0.78 0.66 0.54 0.43 0.1211 0.60 1.12 1.01 0.89 0.78 0.66 0.54 0.43 0.1212 0.60 1.12 1.01 0.89 0.78 0.66 0.54 0.43 0.1213 0.60 1.12 1.01 0.89 0.78 0.66 0.54 0.43 0.1214 0.57 1.12 1.01 0.89 0.78 0.66 0.54 0.43 0.1215 0.57 1.12 1.01 0.89 0.78 0.66 0.54 0.43 0.1216 0.58 1.12 1.01 0.89 0.78 0.66 0.54 0.43 0.1217 0.60 1.12 1.01 0.89 0.78 0.66 0.54 0.43 0.1218 0.58 1.12 1.01 0.89 0.78 0.66 0.54 0.43 0.1219 0.57 1.12 1.01 0.89 0.78 0.66 0.54 0.43 0.1220 0.61 1.12 1.01 0.89 0.78 0.66 0.54 0.43 0.1221 0.61 1.12 1.01 0.89 0.78 0.66 0.54 0.43 0.1222 0.60 1.12 1.01 0.89 0.78 0.66 0.54 0.43 0.1223 0.62 1.12 1.01 0.89 0.78 0.66 0.54 0.43 0.1224 0.63 1.12 1.01 0.89 0.78 0.66 0.54 0.43 0.1225 0.70 1.12 1.01 0.89 0.78 0.66 0.54 0.43 0.1226 0.64 1.12 1.01 0.89 0.78 0.66 0.54 0.43 0.1227 0.64 1.12 1.01 0.89 0.78 0.66 0.54 0.43 0.1228 0.64 1.12 1.01 0.89 0.78 0.66 0.54 0.43 0.1229 0.59 1.12 1.01 0.89 0.78 0.66 0.54 0.43 0.1230 0.71 1.12 1.01 0.89 0.78 0.66 0.54 0.43 0.1231 0.60 1.12 1.01 0.89 0.78 0.66 0.54 0.43 0.12
DIRECT BLIRUBIN LEVEL II
Back to Index Back to Data entry
Back to Index Back to Data entry
1 2 3 4 5 6 7 8 9 101112131415161718192021222324252627282930310.310.430.550.670.790.911.031.15
+3SD+2SD+1SDMean -1SD-2SD-3SD
Leve
l I:
D.
Bili
rubi
n in
mg/
dl
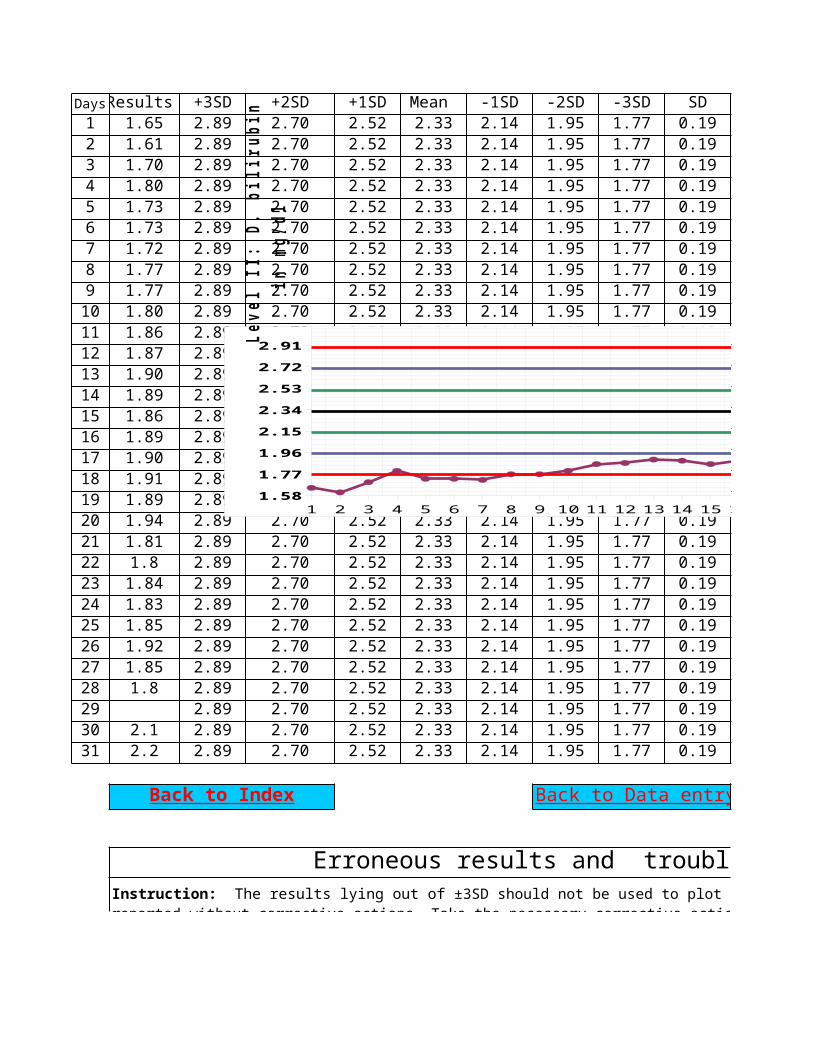
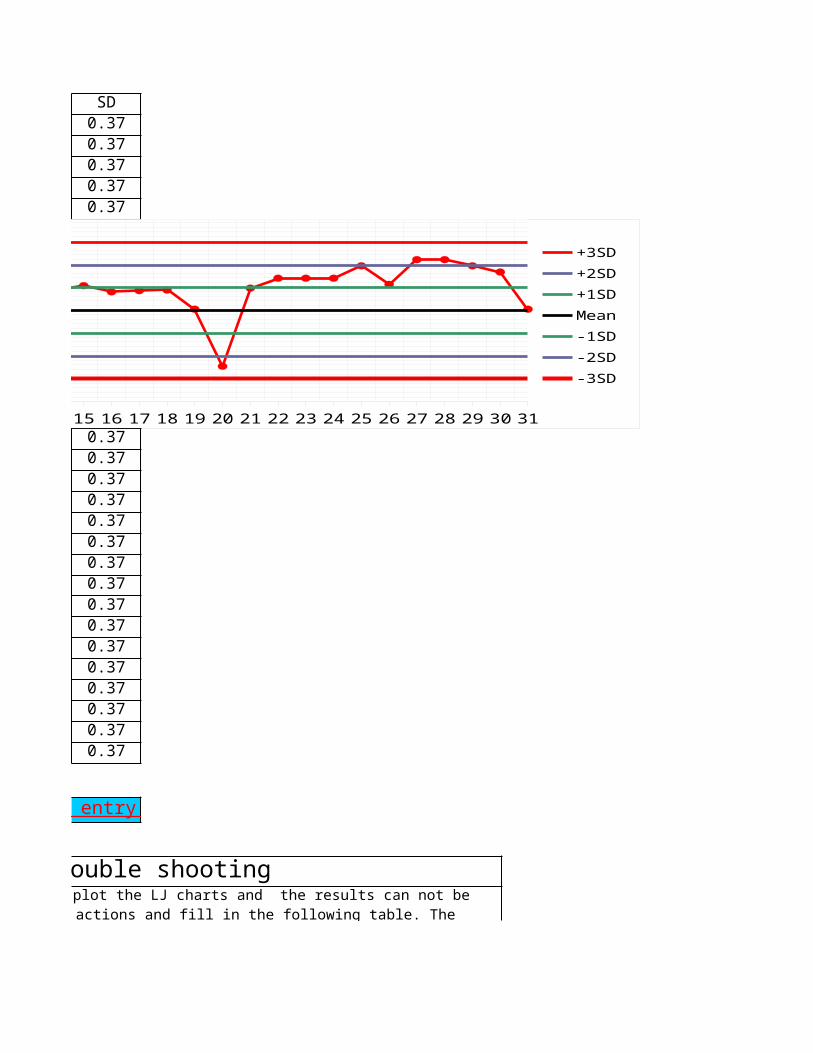
DaysResults +3SD +2SD +1SD Mean -1SD -2SD -3SD SD1 1.65 2.89 2.70 2.52 2.33 2.14 1.95 1.77 0.192 1.61 2.89 2.70 2.52 2.33 2.14 1.95 1.77 0.193 1.70 2.89 2.70 2.52 2.33 2.14 1.95 1.77 0.194 1.80 2.89 2.70 2.52 2.33 2.14 1.95 1.77 0.195 1.73 2.89 2.70 2.52 2.33 2.14 1.95 1.77 0.196 1.73 2.89 2.70 2.52 2.33 2.14 1.95 1.77 0.197 1.72 2.89 2.70 2.52 2.33 2.14 1.95 1.77 0.198 1.77 2.89 2.70 2.52 2.33 2.14 1.95 1.77 0.199 1.77 2.89 2.70 2.52 2.33 2.14 1.95 1.77 0.1910 1.80 2.89 2.70 2.52 2.33 2.14 1.95 1.77 0.1911 1.86 2.89 2.70 2.52 2.33 2.14 1.95 1.77 0.1912 1.87 2.89 2.70 2.52 2.33 2.14 1.95 1.77 0.1913 1.90 2.89 2.70 2.52 2.33 2.14 1.95 1.77 0.1914 1.89 2.89 2.70 2.52 2.33 2.14 1.95 1.77 0.1915 1.86 2.89 2.70 2.52 2.33 2.14 1.95 1.77 0.1916 1.89 2.89 2.70 2.52 2.33 2.14 1.95 1.77 0.1917 1.90 2.89 2.70 2.52 2.33 2.14 1.95 1.77 0.1918 1.91 2.89 2.70 2.52 2.33 2.14 1.95 1.77 0.1919 1.89 2.89 2.70 2.52 2.33 2.14 1.95 1.77 0.1920 1.94 2.89 2.70 2.52 2.33 2.14 1.95 1.77 0.1921 1.81 2.89 2.70 2.52 2.33 2.14 1.95 1.77 0.1922 1.8 2.89 2.70 2.52 2.33 2.14 1.95 1.77 0.1923 1.84 2.89 2.70 2.52 2.33 2.14 1.95 1.77 0.1924 1.83 2.89 2.70 2.52 2.33 2.14 1.95 1.77 0.1925 1.85 2.89 2.70 2.52 2.33 2.14 1.95 1.77 0.1926 1.92 2.89 2.70 2.52 2.33 2.14 1.95 1.77 0.1927 1.85 2.89 2.70 2.52 2.33 2.14 1.95 1.77 0.1928 1.8 2.89 2.70 2.52 2.33 2.14 1.95 1.77 0.1929 2.89 2.70 2.52 2.33 2.14 1.95 1.77 0.1930 2.1 2.89 2.70 2.52 2.33 2.14 1.95 1.77 0.1931 2.2 2.89 2.70 2.52 2.33 2.14 1.95 1.77 0.19
Erroneous results and trouble shooting
Back to Index Back to Data entry
Instruction: The results lying out of ±3SD should not be used to plot the LJ charts and the results can not be reported without corrective actions. Take the necessary corrective actions and fill in the following table. The values of the outlying results and corrected results should be writen clearly. No decimal points is required for the analyte concentration greater than 20 units but two decimal points should be used for analyte concentration less than 20 units (glucose = 89mg/dl; total bilirubin 1.56 mg/dl).
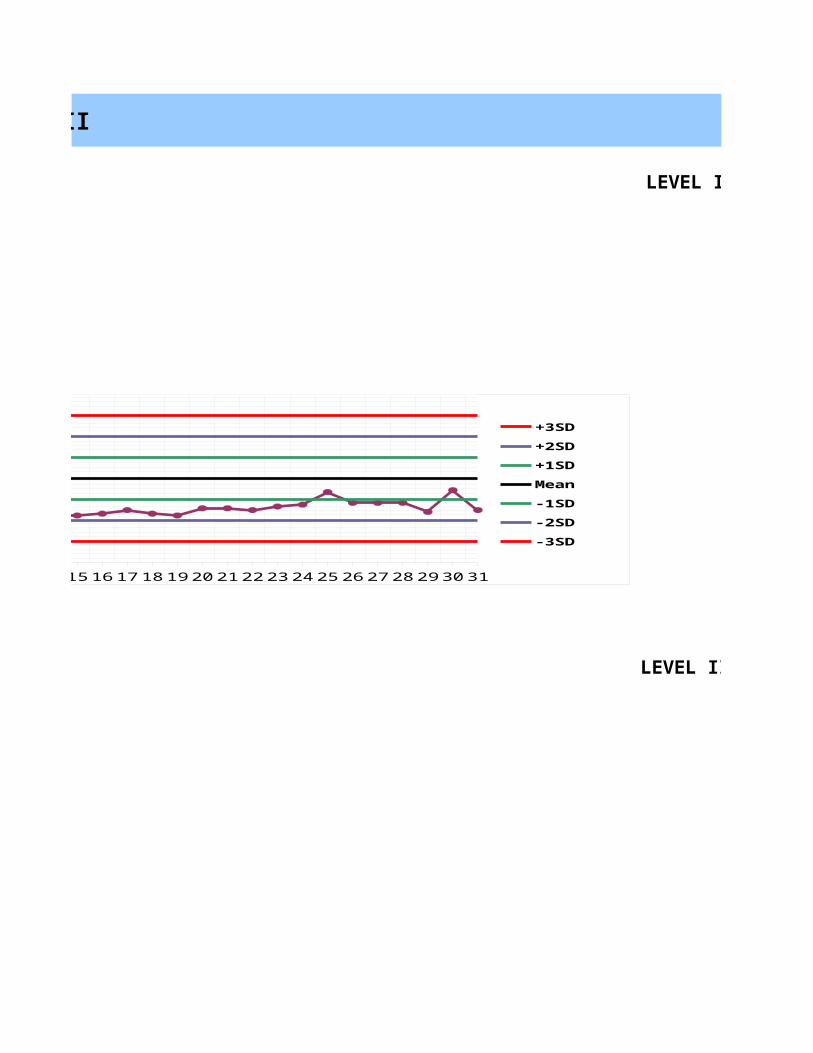
1 2 3 4 5 6 7 8 9 10 11 12 13 14 15 16 17 18 19 20 21 22 23 24 25 26 27 28 29 30 311.581.771.962.152.342.532.722.91
+3SD+2SD+1SDMean -1SD-2SD-3SD
Leve
l II
: D.
bil
irub
in
in
mg/d
l
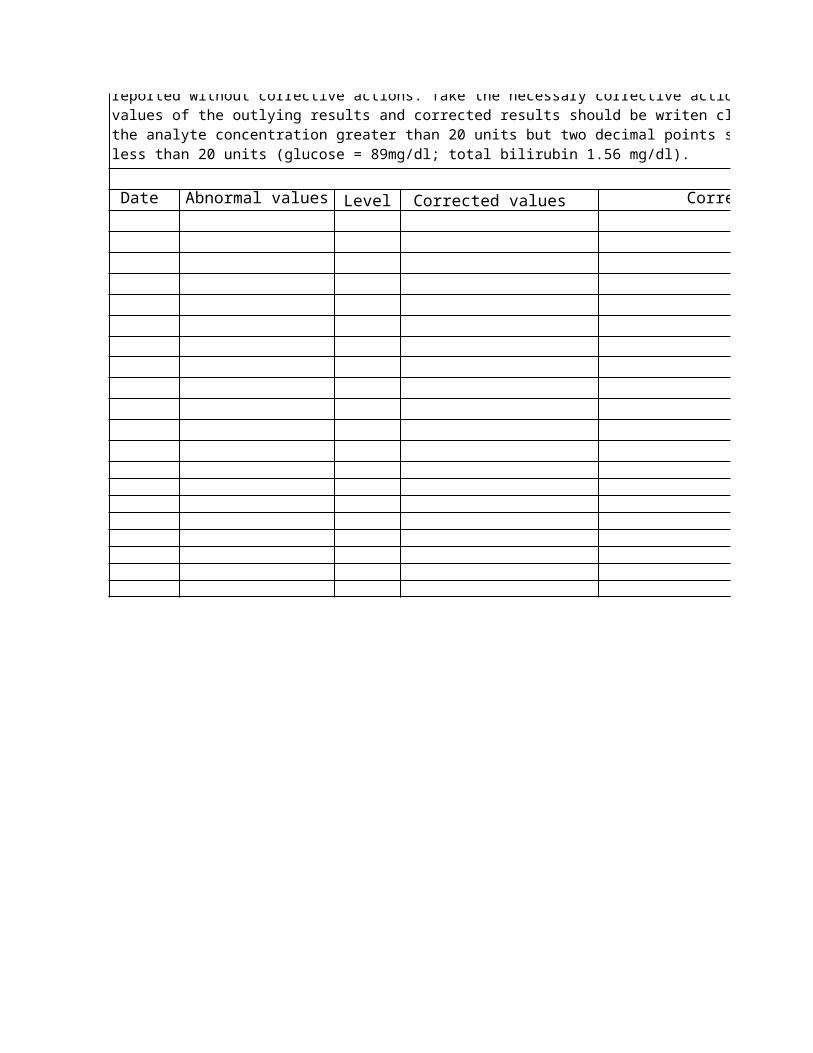
Date Abnormal values Level Corrected values Corrective actions
Instruction: The results lying out of ±3SD should not be used to plot the LJ charts and the results can not be reported without corrective actions. Take the necessary corrective actions and fill in the following table. The values of the outlying results and corrected results should be writen clearly. No decimal points is required for the analyte concentration greater than 20 units but two decimal points should be used for analyte concentration less than 20 units (glucose = 89mg/dl; total bilirubin 1.56 mg/dl).
IQC IN BIOCHEMISTRY: Biorad QC Level I and II
LEVEL I
LEVEL II
1 2 3 4 5 6 7 8 9 101112131415161718192021222324252627282930310.310.430.550.670.790.911.031.15
+3SD+2SD+1SDMean -1SD-2SD-3SD
Leve
l I:
D.
Bili
rubi
n in
mg/
dl
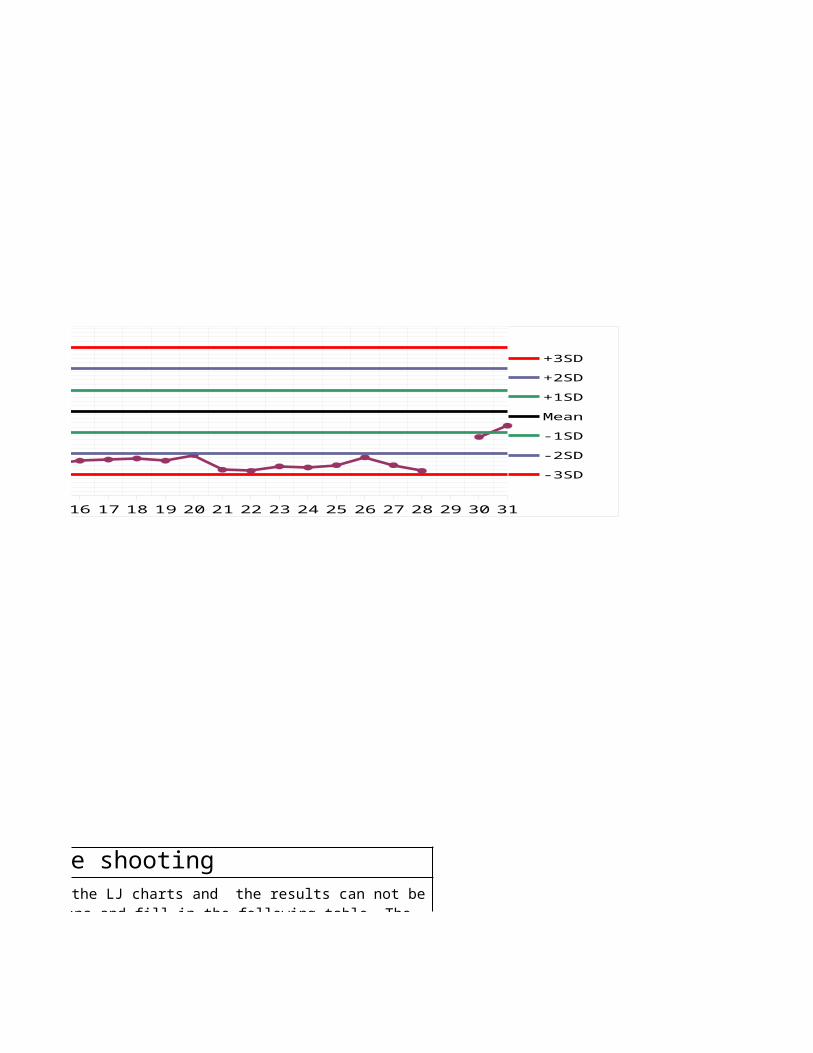
Erroneous results and trouble shooting 3SD should not be used to plot the LJ charts and the results can not be
reported without corrective actions. Take the necessary corrective actions and fill in the following table. The values of the outlying results and corrected results should be writen clearly. No decimal points is required for the analyte concentration greater than 20 units but two decimal points should be used for analyte concentration less than 20 units (glucose = 89mg/dl; total bilirubin 1.56 mg/dl).
1 2 3 4 5 6 7 8 9 10 11 12 13 14 15 16 17 18 19 20 21 22 23 24 25 26 27 28 29 30 311.581.771.962.152.342.532.722.91
+3SD+2SD+1SDMean -1SD-2SD-3SD
Leve
l II
: D.
bil
irub
in
in
mg/d
l
Corrective actions Corrected by
3SD should not be used to plot the LJ charts and the results can not be reported without corrective actions. Take the necessary corrective actions and fill in the following table. The values of the outlying results and corrected results should be writen clearly. No decimal points is required for the analyte concentration greater than 20 units but two decimal points should be used for analyte concentration less than 20 units (glucose = 89mg/dl; total bilirubin 1.56 mg/dl).

IQC IN BIOCHEMISTRY: Biorad QC Level I and II
LEVEL I
LEVEL II
IQC IN BIOCHEMISTRY: Biorad QC Level I and II
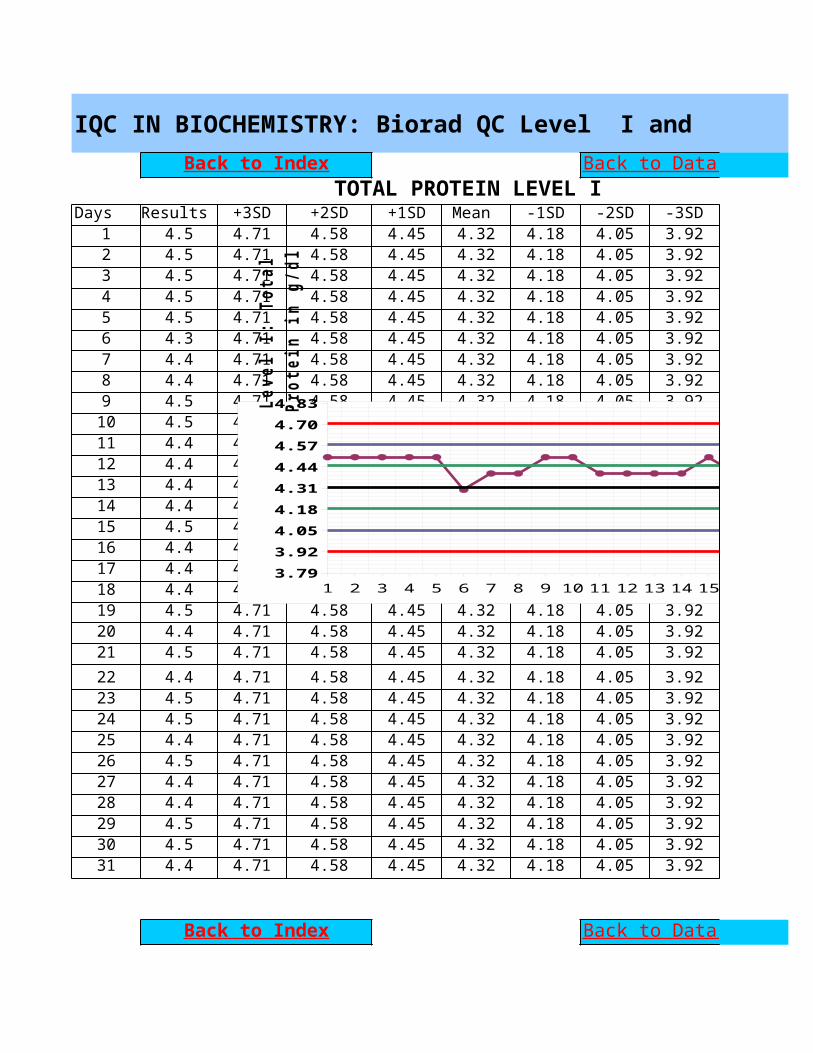
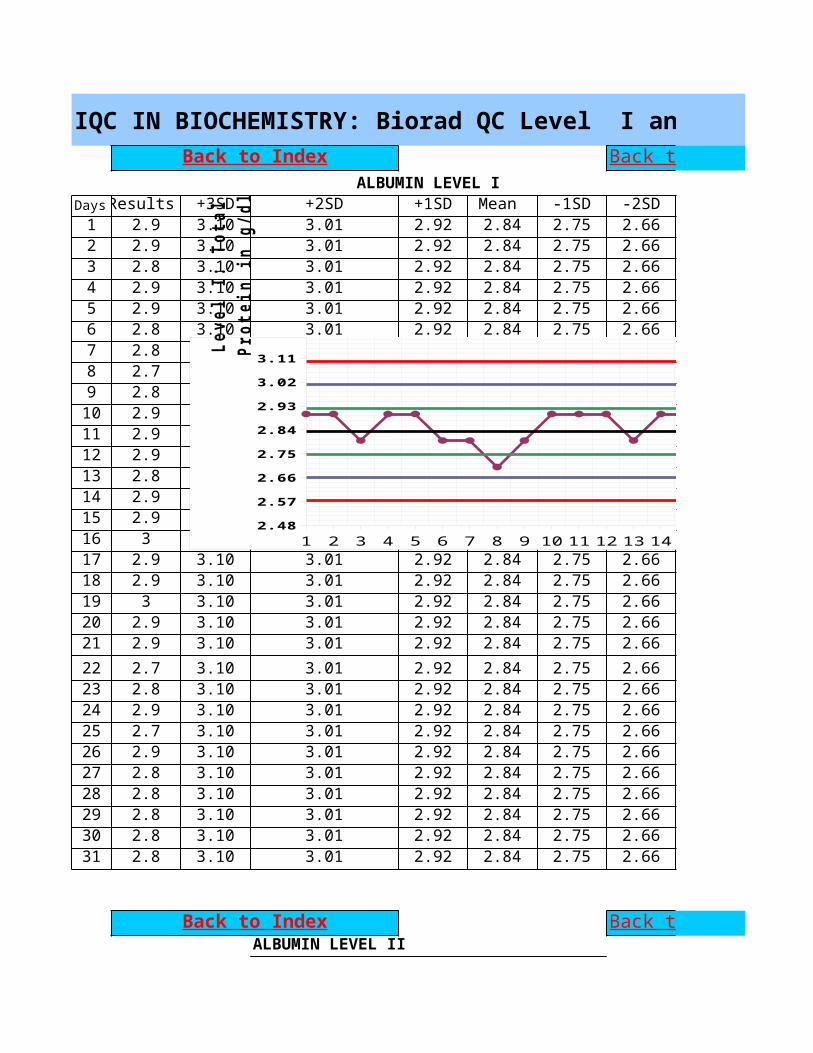
TOTAL PROTEIN LEVEL IDays Results +3SD +2SD +1SD Mean -1SD -2SD -3SD
1 4.5 4.71 4.58 4.45 4.32 4.18 4.05 3.922 4.5 4.71 4.58 4.45 4.32 4.18 4.05 3.923 4.5 4.71 4.58 4.45 4.32 4.18 4.05 3.924 4.5 4.71 4.58 4.45 4.32 4.18 4.05 3.925 4.5 4.71 4.58 4.45 4.32 4.18 4.05 3.926 4.3 4.71 4.58 4.45 4.32 4.18 4.05 3.927 4.4 4.71 4.58 4.45 4.32 4.18 4.05 3.928 4.4 4.71 4.58 4.45 4.32 4.18 4.05 3.929 4.5 4.71 4.58 4.45 4.32 4.18 4.05 3.9210 4.5 4.71 4.58 4.45 4.32 4.18 4.05 3.9211 4.4 4.71 4.58 4.45 4.32 4.18 4.05 3.9212 4.4 4.71 4.58 4.45 4.32 4.18 4.05 3.9213 4.4 4.71 4.58 4.45 4.32 4.18 4.05 3.9214 4.4 4.71 4.58 4.45 4.32 4.18 4.05 3.9215 4.5 4.71 4.58 4.45 4.32 4.18 4.05 3.9216 4.4 4.71 4.58 4.45 4.32 4.18 4.05 3.9217 4.4 4.71 4.58 4.45 4.32 4.18 4.05 3.9218 4.4 4.71 4.58 4.45 4.32 4.18 4.05 3.9219 4.5 4.71 4.58 4.45 4.32 4.18 4.05 3.9220 4.4 4.71 4.58 4.45 4.32 4.18 4.05 3.9221 4.5 4.71 4.58 4.45 4.32 4.18 4.05 3.9222 4.4 4.71 4.58 4.45 4.32 4.18 4.05 3.9223 4.5 4.71 4.58 4.45 4.32 4.18 4.05 3.9224 4.5 4.71 4.58 4.45 4.32 4.18 4.05 3.9225 4.4 4.71 4.58 4.45 4.32 4.18 4.05 3.9226 4.5 4.71 4.58 4.45 4.32 4.18 4.05 3.9227 4.4 4.71 4.58 4.45 4.32 4.18 4.05 3.9228 4.4 4.71 4.58 4.45 4.32 4.18 4.05 3.9229 4.5 4.71 4.58 4.45 4.32 4.18 4.05 3.9230 4.5 4.71 4.58 4.45 4.32 4.18 4.05 3.9231 4.4 4.71 4.58 4.45 4.32 4.18 4.05 3.92
Back to Index Back to Data entry
Back to Index Back to Data entry
1 2 3 4 5 6 7 8 9 10 11 12 13 14 15 16 17 18 19 20 21 22 23 24 25 26 27 28 29 30 313.793.924.054.184.314.444.574.704.83
+3SD+2SD+1SDMean -1SD-2SD-3SD
Leve
l I:
Tot
al
Prot
ein
in g
/dl

TOTAL PROTEIN LEVEL IIDays Results +3SD +2SD +1SD Mean -1SD -2SD -3SD
1 7 7.40 7.21 7.02 6.84 6.65 6.46 6.272 7.1 7.40 7.21 7.02 6.84 6.65 6.46 6.273 7.1 7.40 7.21 7.02 6.84 6.65 6.46 6.274 7.1 7.40 7.21 7.02 6.84 6.65 6.46 6.275 7.1 7.40 7.21 7.02 6.84 6.65 6.46 6.276 6.9 7.40 7.21 7.02 6.84 6.65 6.46 6.277 6.9 7.40 7.21 7.02 6.84 6.65 6.46 6.278 7.1 7.40 7.21 7.02 6.84 6.65 6.46 6.279 7.2 7.40 7.21 7.02 6.84 6.65 6.46 6.2710 6.9 7.40 7.21 7.02 6.84 6.65 6.46 6.2711 7 7.40 7.21 7.02 6.84 6.65 6.46 6.2712 7 7.40 7.21 7.02 6.84 6.65 6.46 6.2713 6.8 7.40 7.21 7.02 6.84 6.65 6.46 6.2714 6.9 7.40 7.21 7.02 6.84 6.65 6.46 6.2715 7.1 7.40 7.21 7.02 6.84 6.65 6.46 6.2716 6.9 7.40 7.21 7.02 6.84 6.65 6.46 6.2717 7 7.40 7.21 7.02 6.84 6.65 6.46 6.2718 6.9 7.40 7.21 7.02 6.84 6.65 6.46 6.2719 7 7.40 7.21 7.02 6.84 6.65 6.46 6.2720 7.1 7.40 7.21 7.02 6.84 6.65 6.46 6.2721 6.9 7.40 7.21 7.02 6.84 6.65 6.46 6.2722 7 7.40 7.21 7.02 6.84 6.65 6.46 6.2723 7 7.40 7.21 7.02 6.84 6.65 6.46 6.2724 6.9 7.40 7.21 7.02 6.84 6.65 6.46 6.2725 6.9 7.40 7.21 7.02 6.84 6.65 6.46 6.2726 7 7.40 7.21 7.02 6.84 6.65 6.46 6.2727 6.9 7.40 7.21 7.02 6.84 6.65 6.46 6.2728 6.9 7.40 7.21 7.02 6.84 6.65 6.46 6.2729 7 7.40 7.21 7.02 6.84 6.65 6.46 6.2730 7 7.40 7.21 7.02 6.84 6.65 6.46 6.2731 6.9 7.40 7.21 7.02 6.84 6.65 6.46 6.27
Back to Index Back to Data entry
1 2 3 4 5 6 7 8 9 10 11 12 13 14 15 16 17 18 19 20 21 22 23 24 25 26 27 28 29 30 316.086.276.466.656.847.037.227.41
+3SD+2SD+1SDMean -1SD-2SD-3SD
Leve
l II
: To
tal
prot
ein
in
g/dl
Erroneous results and trouble shooting
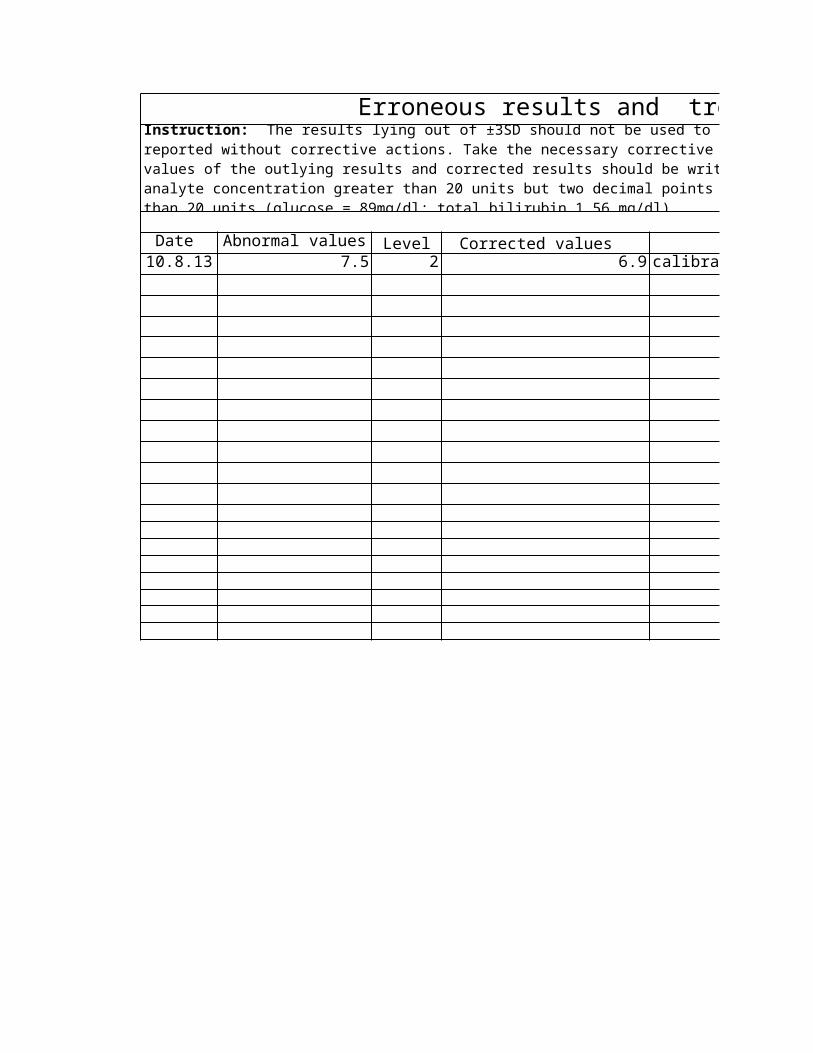
Date Abnormal values Level Corrected values Corrective actions10.8.13 7.5 2 6.9 calibration
Instruction: The results lying out of ±3SD should not be used to plot the LJ charts and the results can not be reported without corrective actions. Take the necessary corrective actions and fill in the following table. The values of the outlying results and corrected results should be writen clearly. No decimal points is required for the analyte concentration greater than 20 units but two decimal points should be used for analyte concentration less than 20 units (glucose = 89mg/dl; total bilirubin 1.56 mg/dl).
IQC IN BIOCHEMISTRY: Biorad QC Level I and II
LEVEL ISD
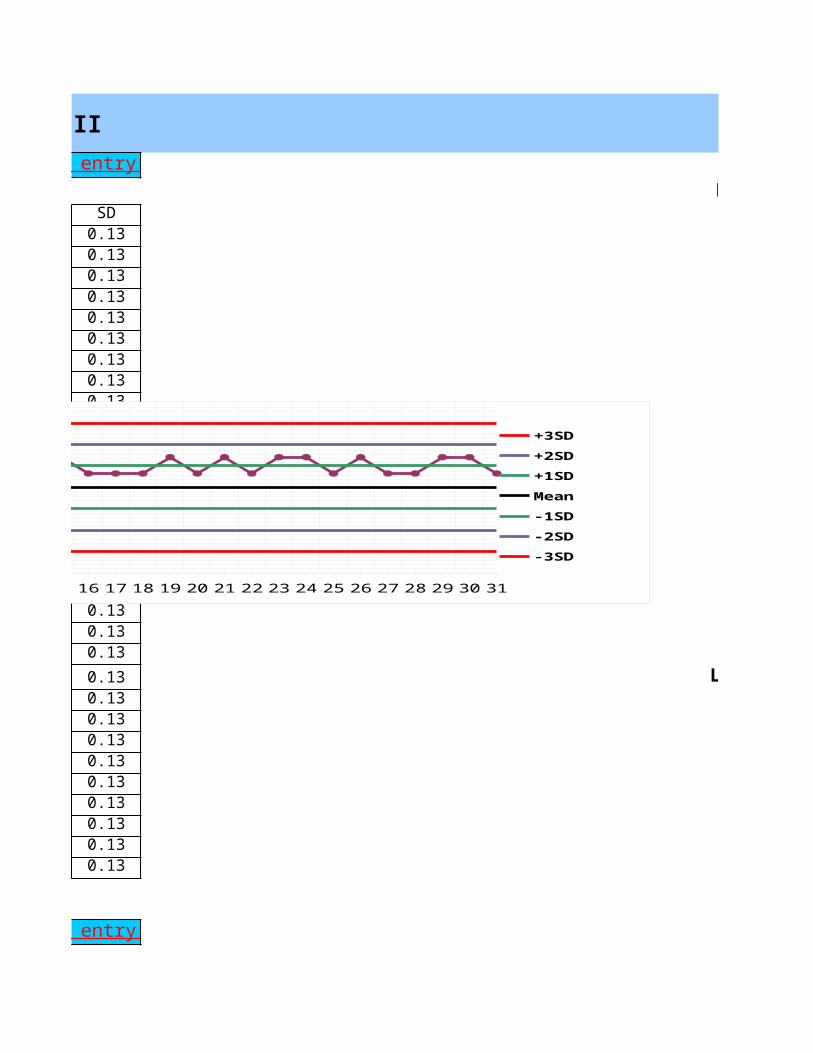
0.130.130.130.130.130.130.130.130.130.130.130.130.130.130.130.130.130.130.130.130.130.13 LEVEL II0.130.130.130.130.130.130.130.130.13
Back to Data entry
Back to Data entry
1 2 3 4 5 6 7 8 9 10 11 12 13 14 15 16 17 18 19 20 21 22 23 24 25 26 27 28 29 30 313.793.924.054.184.314.444.574.704.83
+3SD+2SD+1SDMean -1SD-2SD-3SD
Leve
l I:
Tot
al
Prot
ein
in g
/dl
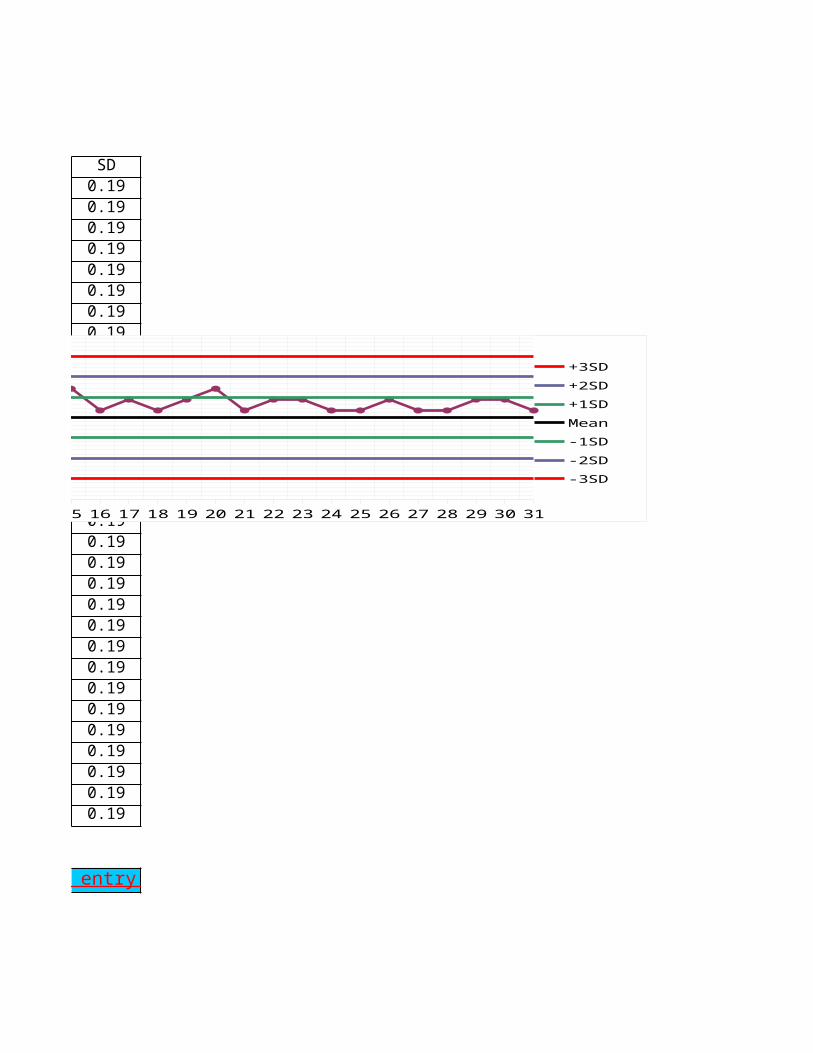
SD0.190.190.190.190.190.190.190.190.190.190.190.190.190.190.190.190.190.190.190.190.190.190.190.190.190.190.190.190.190.190.19
Back to Data entry
1 2 3 4 5 6 7 8 9 10 11 12 13 14 15 16 17 18 19 20 21 22 23 24 25 26 27 28 29 30 316.086.276.466.656.847.037.227.41
+3SD+2SD+1SDMean -1SD-2SD-3SD
Leve
l II
: To
tal
prot
ein
in
g/dl
Erroneous results and trouble shooting
Corrective actions Corrected bycalibration ut
3SD should not be used to plot the LJ charts and the results can not be reported without corrective actions. Take the necessary corrective actions and fill in the following table. The values of the outlying results and corrected results should be writen clearly. No decimal points is required for the analyte concentration greater than 20 units but two decimal points should be used for analyte concentration less than 20 units (glucose = 89mg/dl; total bilirubin 1.56 mg/dl).
IQC IN BIOCHEMISTRY: Biorad QC Level I and II
LEVEL I
LEVEL II
IQC IN BIOCHEMISTRY: Biorad QC Level I and II
ALBUMIN LEVEL IDaysResults +3SD +2SD +1SD Mean -1SD -2SD1 2.9 3.10 3.01 2.92 2.84 2.75 2.662 2.9 3.10 3.01 2.92 2.84 2.75 2.663 2.8 3.10 3.01 2.92 2.84 2.75 2.664 2.9 3.10 3.01 2.92 2.84 2.75 2.665 2.9 3.10 3.01 2.92 2.84 2.75 2.666 2.8 3.10 3.01 2.92 2.84 2.75 2.667 2.8 3.10 3.01 2.92 2.84 2.75 2.668 2.7 3.10 3.01 2.92 2.84 2.75 2.669 2.8 3.10 3.01 2.92 2.84 2.75 2.6610 2.9 3.10 3.01 2.92 2.84 2.75 2.6611 2.9 3.10 3.01 2.92 2.84 2.75 2.6612 2.9 3.10 3.01 2.92 2.84 2.75 2.6613 2.8 3.10 3.01 2.92 2.84 2.75 2.6614 2.9 3.10 3.01 2.92 2.84 2.75 2.6615 2.9 3.10 3.01 2.92 2.84 2.75 2.6616 3 3.10 3.01 2.92 2.84 2.75 2.6617 2.9 3.10 3.01 2.92 2.84 2.75 2.6618 2.9 3.10 3.01 2.92 2.84 2.75 2.6619 3 3.10 3.01 2.92 2.84 2.75 2.6620 2.9 3.10 3.01 2.92 2.84 2.75 2.6621 2.9 3.10 3.01 2.92 2.84 2.75 2.6622 2.7 3.10 3.01 2.92 2.84 2.75 2.6623 2.8 3.10 3.01 2.92 2.84 2.75 2.6624 2.9 3.10 3.01 2.92 2.84 2.75 2.6625 2.7 3.10 3.01 2.92 2.84 2.75 2.6626 2.9 3.10 3.01 2.92 2.84 2.75 2.6627 2.8 3.10 3.01 2.92 2.84 2.75 2.6628 2.8 3.10 3.01 2.92 2.84 2.75 2.6629 2.8 3.10 3.01 2.92 2.84 2.75 2.6630 2.8 3.10 3.01 2.92 2.84 2.75 2.6631 2.8 3.10 3.01 2.92 2.84 2.75 2.66
ALBUMIN LEVEL II
Back to Index Back to Data entry
Back to Index Back to Data entry
1 2 3 4 5 6 7 8 9 10 11 12 13 14 15 16 17 18 19 20 21 22 23 24 25 26 27 28 29 30 312.48
2.57
2.66
2.75
2.84
2.93
3.02
3.11+3SD+2SD+1SDMean -1SD-2SD-3SD
Leve
l I:
Tot
al
Prot
ein
in g
/dl
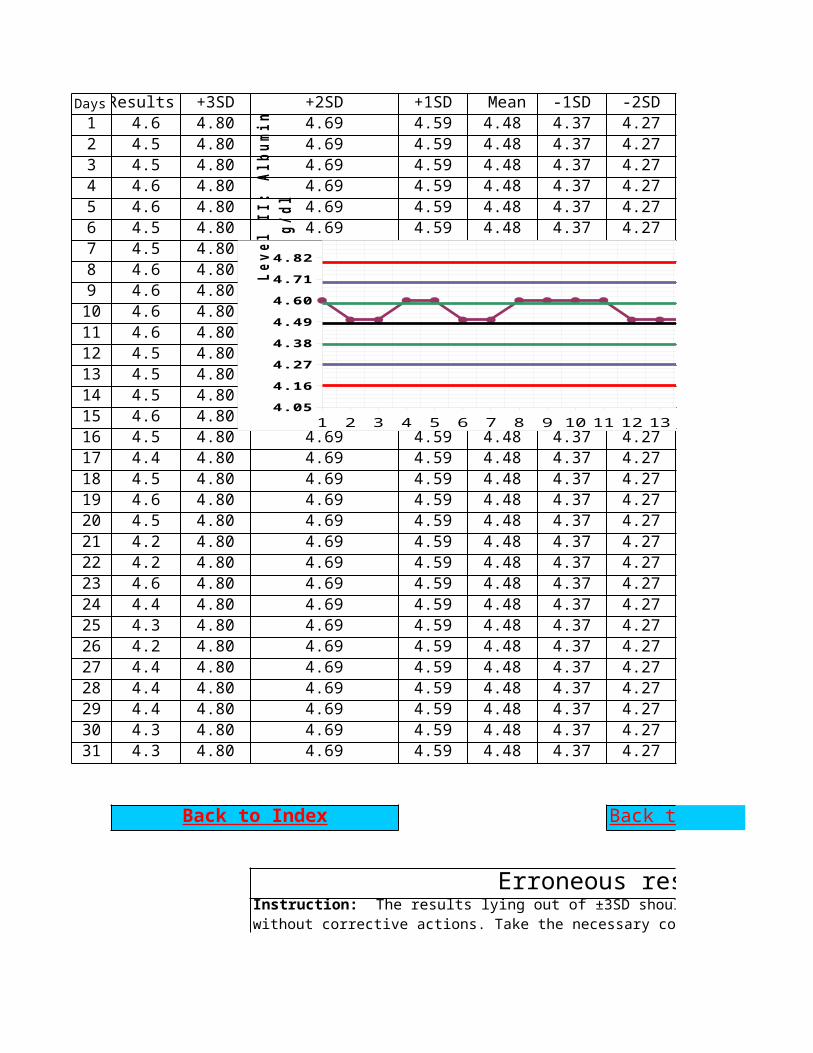
DaysResults +3SD +2SD +1SD Mean -1SD -2SD1 4.6 4.80 4.69 4.59 4.48 4.37 4.272 4.5 4.80 4.69 4.59 4.48 4.37 4.273 4.5 4.80 4.69 4.59 4.48 4.37 4.274 4.6 4.80 4.69 4.59 4.48 4.37 4.275 4.6 4.80 4.69 4.59 4.48 4.37 4.276 4.5 4.80 4.69 4.59 4.48 4.37 4.277 4.5 4.80 4.69 4.59 4.48 4.37 4.278 4.6 4.80 4.69 4.59 4.48 4.37 4.279 4.6 4.80 4.69 4.59 4.48 4.37 4.2710 4.6 4.80 4.69 4.59 4.48 4.37 4.2711 4.6 4.80 4.69 4.59 4.48 4.37 4.2712 4.5 4.80 4.69 4.59 4.48 4.37 4.2713 4.5 4.80 4.69 4.59 4.48 4.37 4.2714 4.5 4.80 4.69 4.59 4.48 4.37 4.2715 4.6 4.80 4.69 4.59 4.48 4.37 4.2716 4.5 4.80 4.69 4.59 4.48 4.37 4.2717 4.4 4.80 4.69 4.59 4.48 4.37 4.2718 4.5 4.80 4.69 4.59 4.48 4.37 4.2719 4.6 4.80 4.69 4.59 4.48 4.37 4.2720 4.5 4.80 4.69 4.59 4.48 4.37 4.2721 4.2 4.80 4.69 4.59 4.48 4.37 4.2722 4.2 4.80 4.69 4.59 4.48 4.37 4.2723 4.6 4.80 4.69 4.59 4.48 4.37 4.2724 4.4 4.80 4.69 4.59 4.48 4.37 4.2725 4.3 4.80 4.69 4.59 4.48 4.37 4.2726 4.2 4.80 4.69 4.59 4.48 4.37 4.2727 4.4 4.80 4.69 4.59 4.48 4.37 4.2728 4.4 4.80 4.69 4.59 4.48 4.37 4.2729 4.4 4.80 4.69 4.59 4.48 4.37 4.2730 4.3 4.80 4.69 4.59 4.48 4.37 4.2731 4.3 4.80 4.69 4.59 4.48 4.37 4.27
Erroneous results and trouble shooting
Back to Index Back to Data entry
Instruction: The results lying out of ±3SD should not be used to plot the LJ charts and the results can not be reported without corrective actions. Take the necessary corrective actions and fill in the following table. The values of the
1 2 3 4 5 6 7 8 9 10 11 12 13 14 15 16 17 18 19 20 21 22 23 24 25 26 27 28 29 30 314.054.164.274.384.494.604.714.82
+3SD+2SD+1SD Mean-1SD-2SD-3SD
Leve
l II
: Al
bumi
n
g/dl
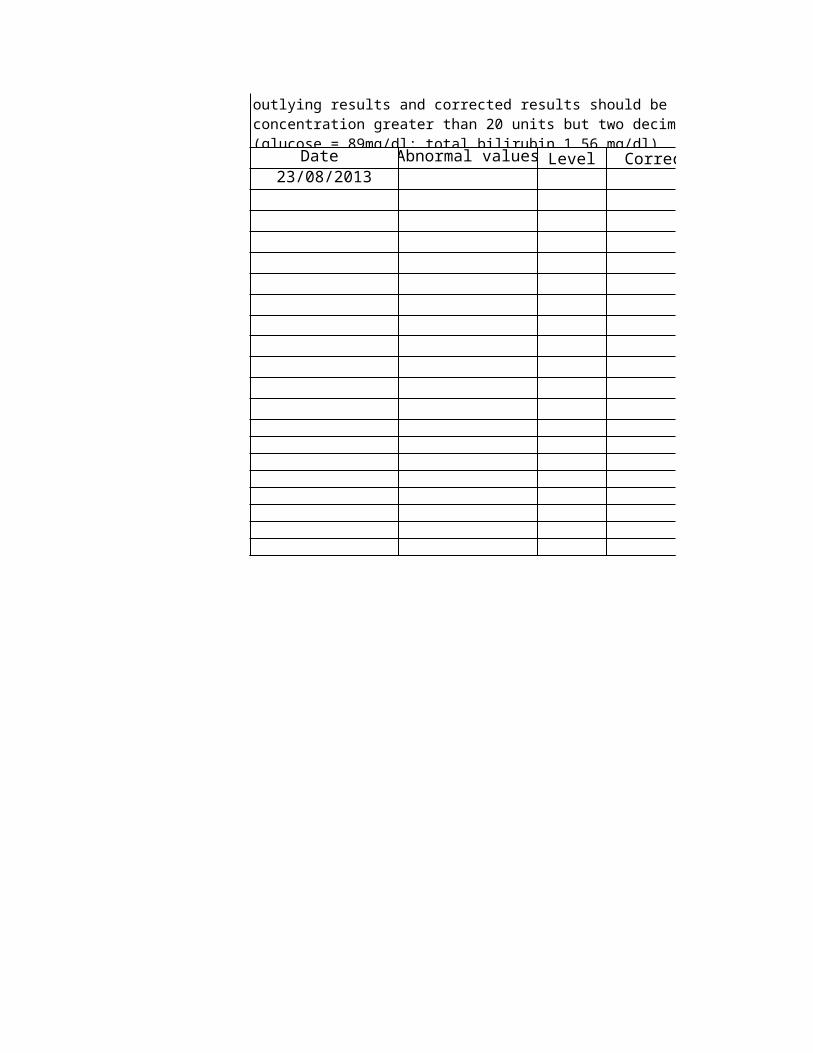
Date Abnormal values Level Corrected values 23/08/2013
without corrective actions. Take the necessary corrective actions and fill in the following table. The values of the outlying results and corrected results should be writen clearly. No decimal points is required for the analyte concentration greater than 20 units but two decimal points should be used for analyte concentration less than 20 units (glucose = 89mg/dl; total bilirubin 1.56 mg/dl).
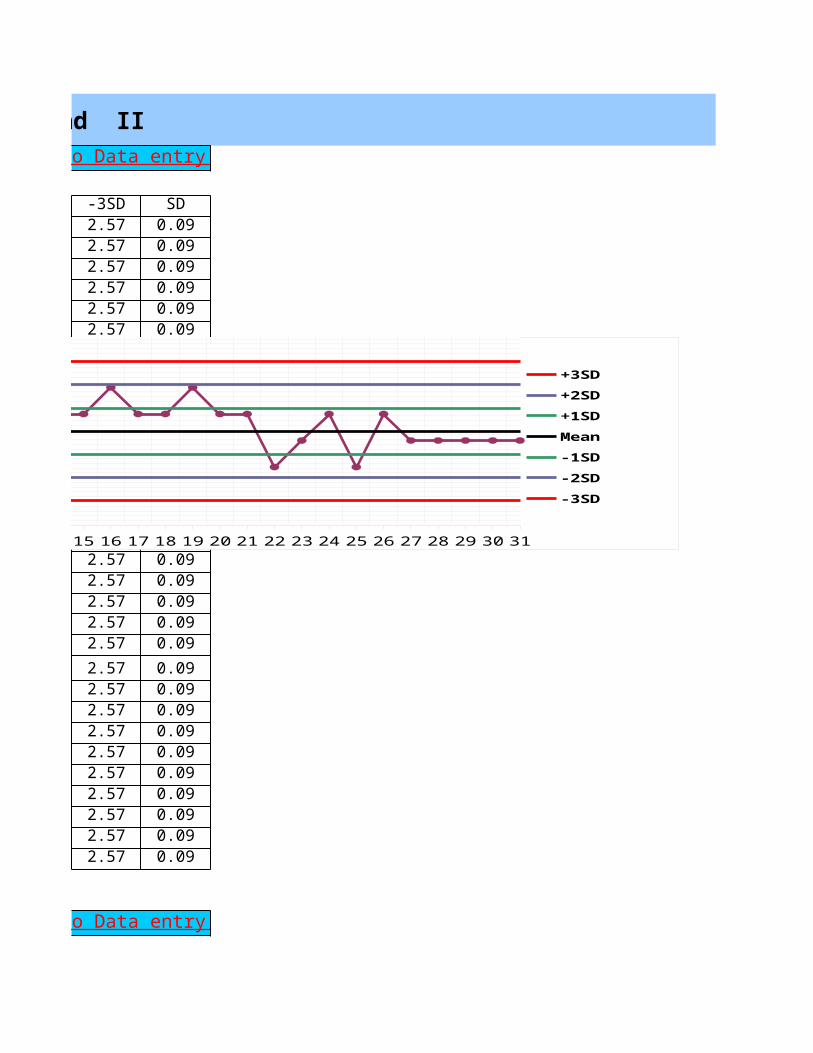
IQC IN BIOCHEMISTRY: Biorad QC Level I and II
-3SD SD2.57 0.092.57 0.092.57 0.092.57 0.092.57 0.092.57 0.092.57 0.092.57 0.092.57 0.092.57 0.092.57 0.092.57 0.092.57 0.092.57 0.092.57 0.092.57 0.092.57 0.092.57 0.092.57 0.092.57 0.092.57 0.092.57 0.092.57 0.092.57 0.092.57 0.092.57 0.092.57 0.092.57 0.092.57 0.092.57 0.092.57 0.09
Back to Data entry
Back to Data entry
1 2 3 4 5 6 7 8 9 10 11 12 13 14 15 16 17 18 19 20 21 22 23 24 25 26 27 28 29 30 312.48
2.57
2.66
2.75
2.84
2.93
3.02
3.11+3SD+2SD+1SDMean -1SD-2SD-3SD
Leve
l I:
Tot
al
Prot
ein
in g
/dl
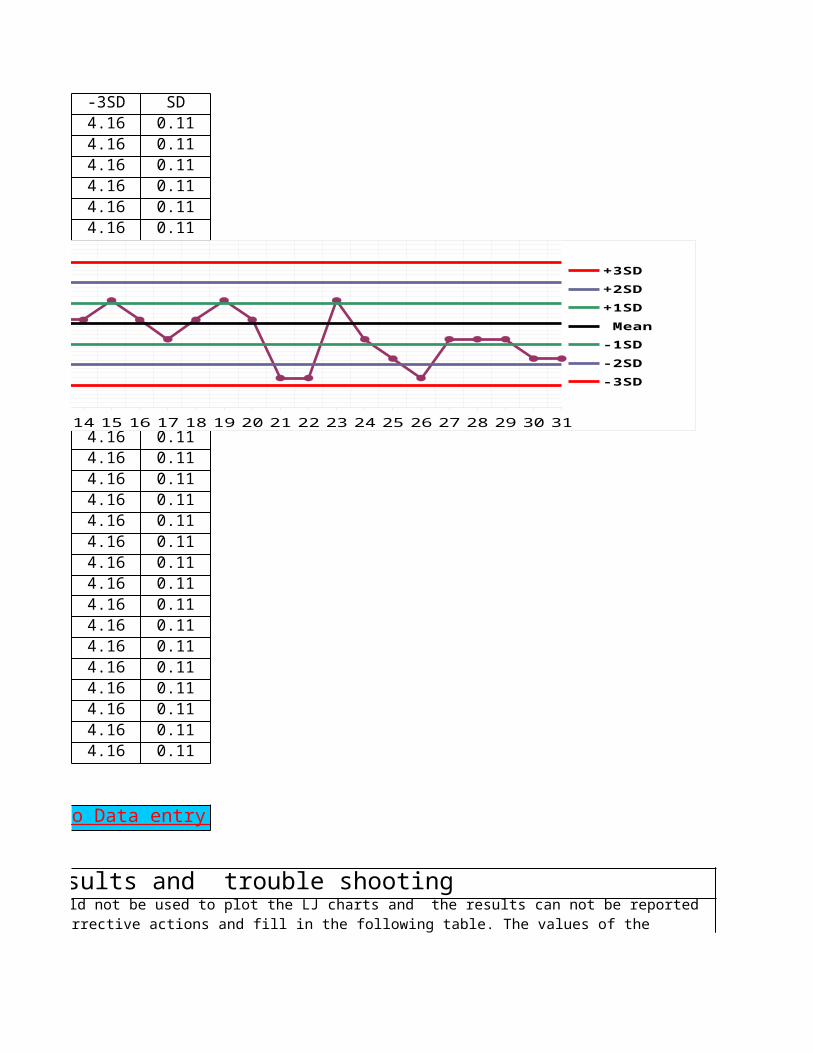
-3SD SD4.16 0.114.16 0.114.16 0.114.16 0.114.16 0.114.16 0.114.16 0.114.16 0.114.16 0.114.16 0.114.16 0.114.16 0.114.16 0.114.16 0.114.16 0.114.16 0.114.16 0.114.16 0.114.16 0.114.16 0.114.16 0.114.16 0.114.16 0.114.16 0.114.16 0.114.16 0.114.16 0.114.16 0.114.16 0.114.16 0.114.16 0.11
Erroneous results and trouble shooting
Back to Data entry
3SD should not be used to plot the LJ charts and the results can not be reported without corrective actions. Take the necessary corrective actions and fill in the following table. The values of the
1 2 3 4 5 6 7 8 9 10 11 12 13 14 15 16 17 18 19 20 21 22 23 24 25 26 27 28 29 30 314.054.164.274.384.494.604.714.82
+3SD+2SD+1SD Mean-1SD-2SD-3SD
Leve
l II
: Al
bumi
n
g/dl
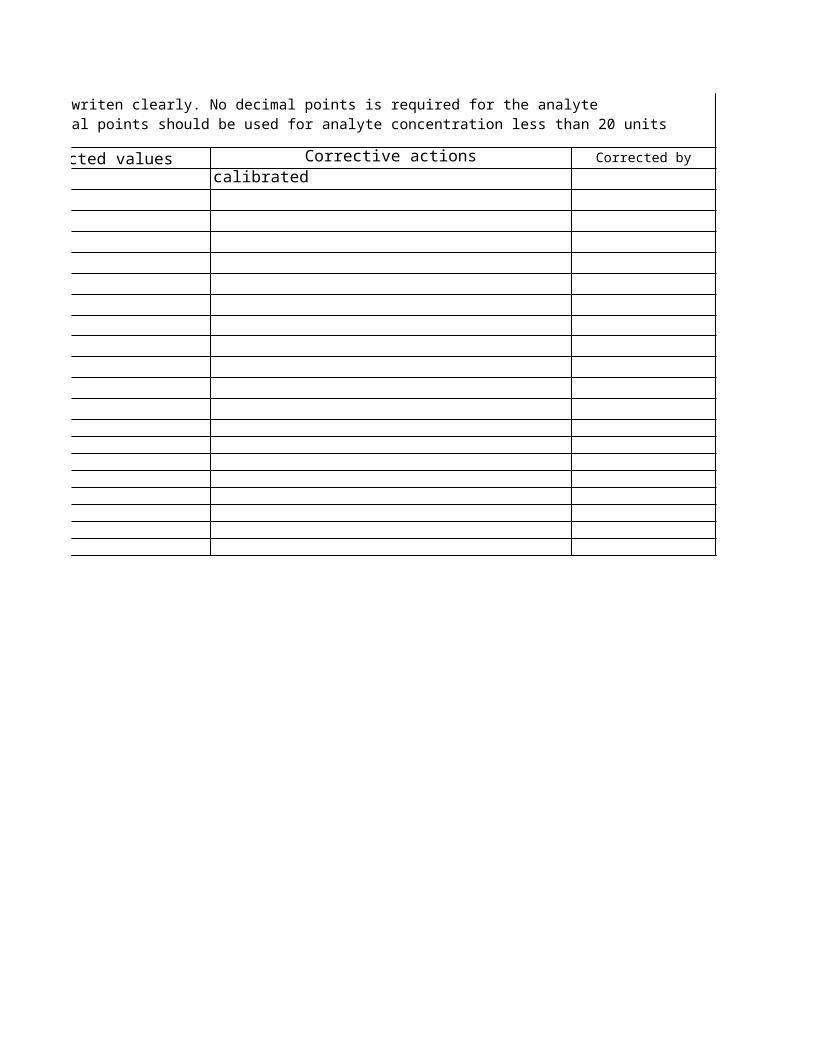
Corrected values Corrective actions Corrected bycalibrated
without corrective actions. Take the necessary corrective actions and fill in the following table. The values of the outlying results and corrected results should be writen clearly. No decimal points is required for the analyte concentration greater than 20 units but two decimal points should be used for analyte concentration less than 20 units (glucose = 89mg/dl; total bilirubin 1.56 mg/dl).
IQC IN BIOCHEMISTRY: Biorad QC Level I and II
LEVEL I
LEVEL II
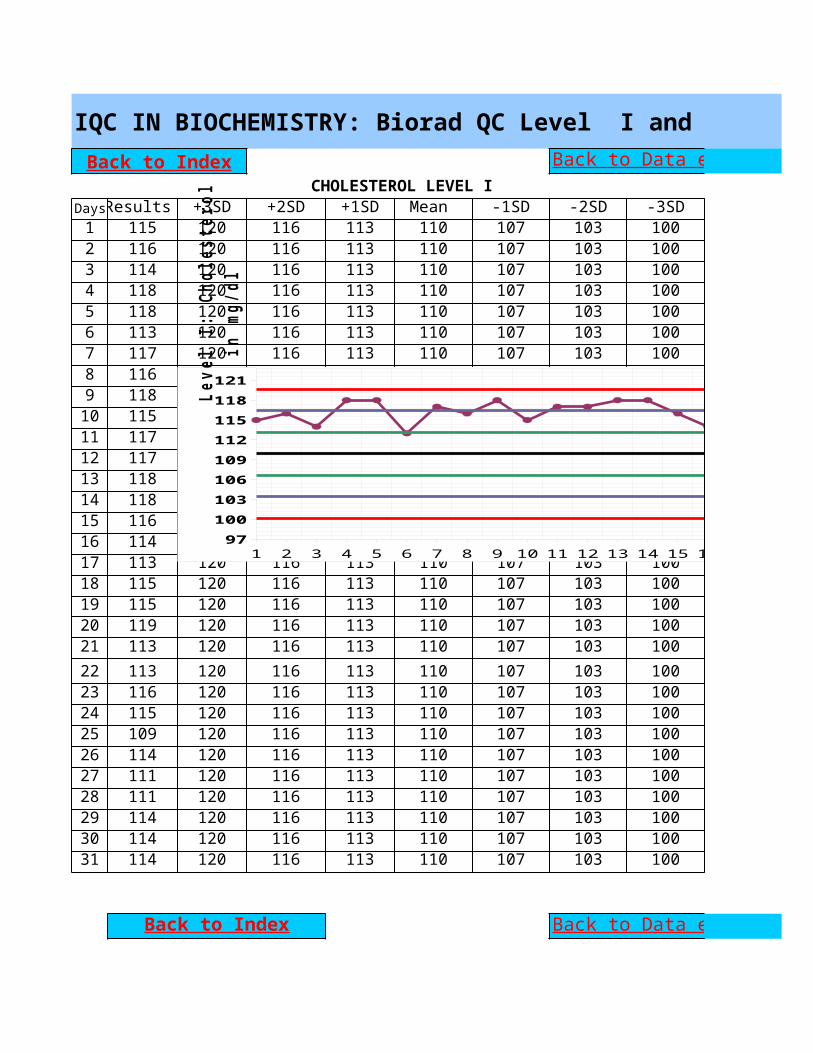
IQC IN BIOCHEMISTRY: Biorad QC Level I and II Back to Index
CHOLESTEROL LEVEL IDaysResults +3SD +2SD +1SD Mean -1SD -2SD -3SD1 115 120 116 113 110 107 103 1002 116 120 116 113 110 107 103 1003 114 120 116 113 110 107 103 1004 118 120 116 113 110 107 103 1005 118 120 116 113 110 107 103 1006 113 120 116 113 110 107 103 1007 117 120 116 113 110 107 103 1008 116 120 116 113 110 107 103 1009 118 120 116 113 110 107 103 10010 115 120 116 113 110 107 103 10011 117 120 116 113 110 107 103 10012 117 120 116 113 110 107 103 10013 118 120 116 113 110 107 103 10014 118 120 116 113 110 107 103 10015 116 120 116 113 110 107 103 10016 114 120 116 113 110 107 103 10017 113 120 116 113 110 107 103 10018 115 120 116 113 110 107 103 10019 115 120 116 113 110 107 103 10020 119 120 116 113 110 107 103 10021 113 120 116 113 110 107 103 10022 113 120 116 113 110 107 103 10023 116 120 116 113 110 107 103 10024 115 120 116 113 110 107 103 10025 109 120 116 113 110 107 103 10026 114 120 116 113 110 107 103 10027 111 120 116 113 110 107 103 10028 111 120 116 113 110 107 103 10029 114 120 116 113 110 107 103 10030 114 120 116 113 110 107 103 10031 114 120 116 113 110 107 103 100
Back to Data entry
Back to Index Back to Data entry
1 2 3 4 5 6 7 8 9 10 11 12 13 14 15 16 17 18 19 20 21 22 23 24 25 26 27 28 29 30 3197100103106109112115118121
+3SD+2SD+1SDMean -1SD-2SD-3SD
Leve
l I:
Cho
lest
erol
in
mg/
dl
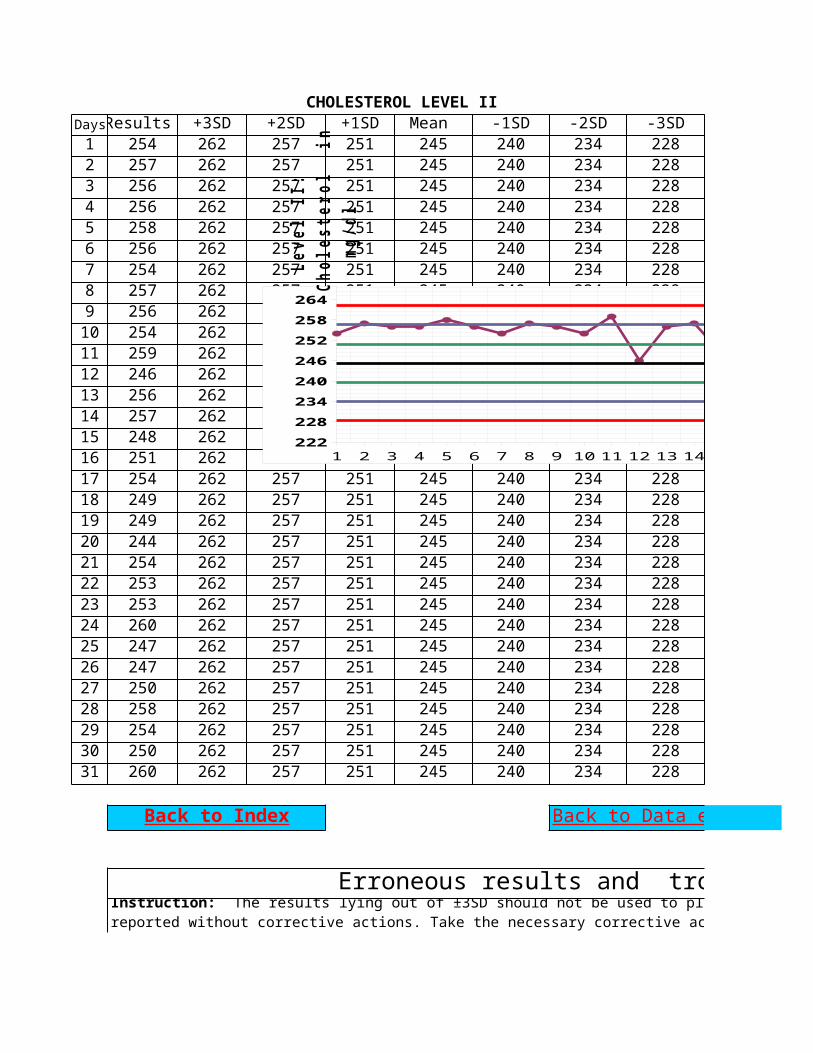
CHOLESTEROL LEVEL IIDaysResults +3SD +2SD +1SD Mean -1SD -2SD -3SD1 254 262 257 251 245 240 234 2282 257 262 257 251 245 240 234 2283 256 262 257 251 245 240 234 2284 256 262 257 251 245 240 234 2285 258 262 257 251 245 240 234 2286 256 262 257 251 245 240 234 2287 254 262 257 251 245 240 234 2288 257 262 257 251 245 240 234 2289 256 262 257 251 245 240 234 22810 254 262 257 251 245 240 234 22811 259 262 257 251 245 240 234 22812 246 262 257 251 245 240 234 22813 256 262 257 251 245 240 234 22814 257 262 257 251 245 240 234 22815 248 262 257 251 245 240 234 22816 251 262 257 251 245 240 234 22817 254 262 257 251 245 240 234 22818 249 262 257 251 245 240 234 22819 249 262 257 251 245 240 234 22820 244 262 257 251 245 240 234 22821 254 262 257 251 245 240 234 22822 253 262 257 251 245 240 234 22823 253 262 257 251 245 240 234 22824 260 262 257 251 245 240 234 22825 247 262 257 251 245 240 234 22826 247 262 257 251 245 240 234 22827 250 262 257 251 245 240 234 22828 258 262 257 251 245 240 234 22829 254 262 257 251 245 240 234 22830 250 262 257 251 245 240 234 22831 260 262 257 251 245 240 234 228
Erroneous results and trouble shooting
Back to Index Back to Data entry
Instruction: The results lying out of ±3SD should not be used to plot the LJ charts and the results can not be reported without corrective actions. Take the necessary corrective actions and fill in the following table. The values of the outlying results and corrected results should be writen clearly. No decimal points is required for the analyte
1 2 3 4 5 6 7 8 9 10 11 12 13 14 15 16 17 18 19 20 21 22 23 24 25 26 27 28 29 30 31 32 33222228234240246252258264
+3SD+2SD+1SDMean -1SD-2SD-3SD
Leve
l II
: Ch
oles
tero
l i
n mg
/dl
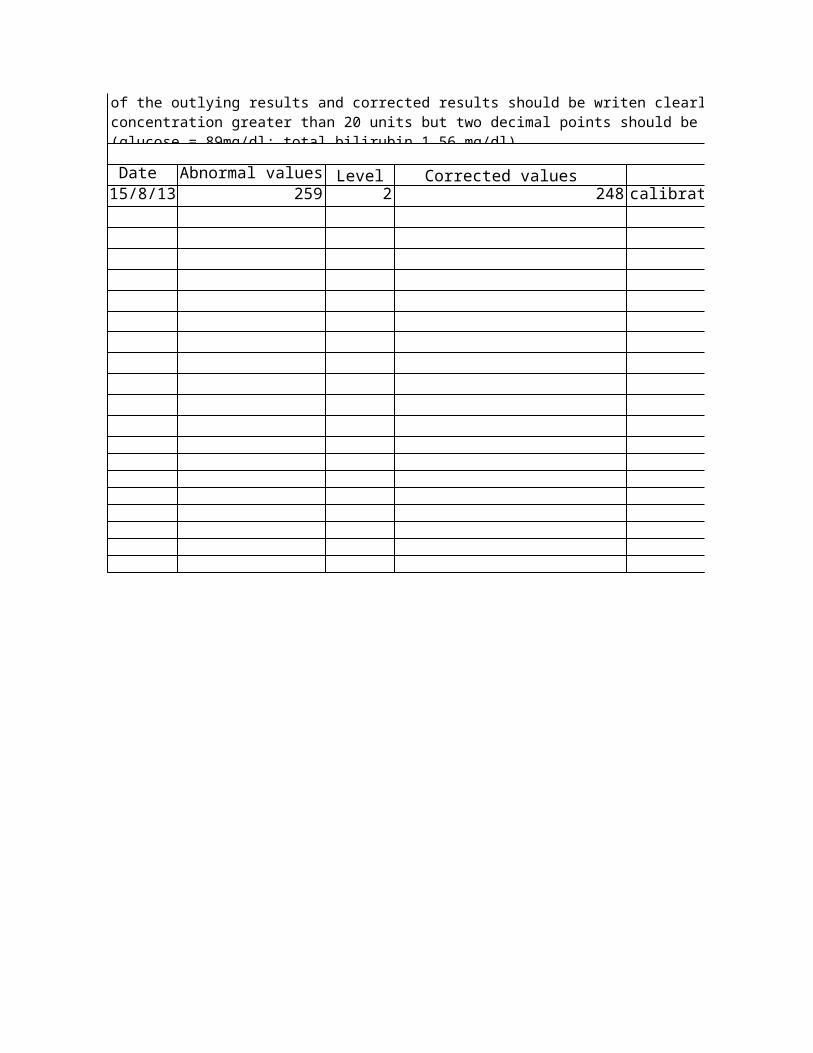
Date Abnormal values Level Corrected values Corrective actions15/8/13 259 2 248 calibrated
of the outlying results and corrected results should be writen clearly. No decimal points is required for the analyte concentration greater than 20 units but two decimal points should be used for analyte concentration less than 20 units (glucose = 89mg/dl; total bilirubin 1.56 mg/dl).
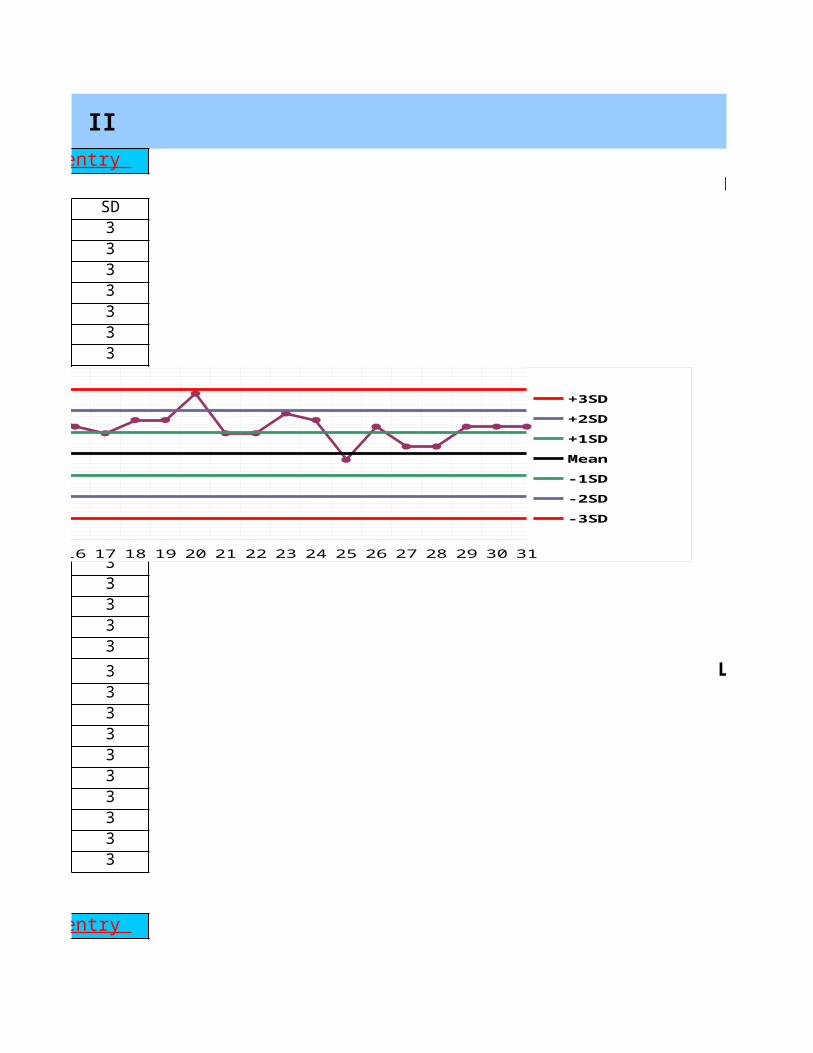
IQC IN BIOCHEMISTRY: Biorad QC Level I and II
LEVEL ISD3333333333333333333333 LEVEL II333333333
Back to Data entry
Back to Data entry
1 2 3 4 5 6 7 8 9 10 11 12 13 14 15 16 17 18 19 20 21 22 23 24 25 26 27 28 29 30 3197100103106109112115118121
+3SD+2SD+1SDMean -1SD-2SD-3SD
Leve
l I:
Cho
lest
erol
in
mg/
dl
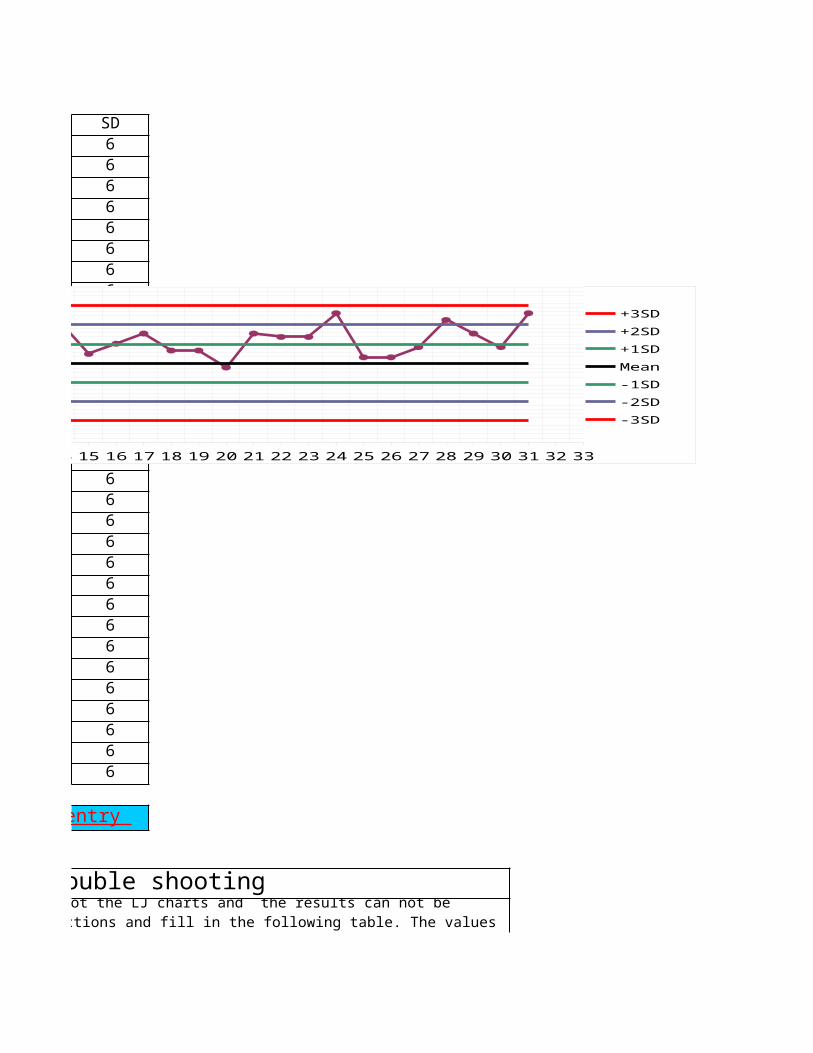
SD6666666666666666666666666666666
Erroneous results and trouble shooting
Back to Data entry
3SD should not be used to plot the LJ charts and the results can not be reported without corrective actions. Take the necessary corrective actions and fill in the following table. The values of the outlying results and corrected results should be writen clearly. No decimal points is required for the analyte
1 2 3 4 5 6 7 8 9 10 11 12 13 14 15 16 17 18 19 20 21 22 23 24 25 26 27 28 29 30 31 32 33222228234240246252258264
+3SD+2SD+1SDMean -1SD-2SD-3SD
Leve
l II
: Ch
oles
tero
l i
n mg
/dl
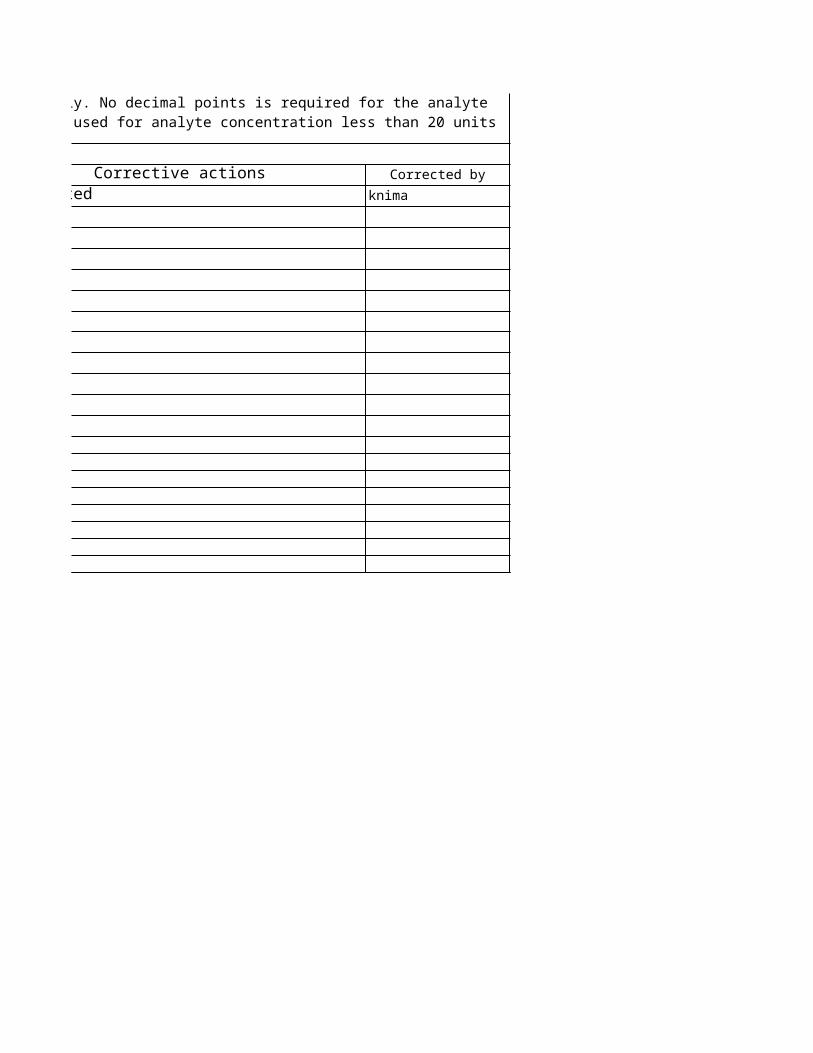
Corrective actions Corrected bycalibrated knima
of the outlying results and corrected results should be writen clearly. No decimal points is required for the analyte concentration greater than 20 units but two decimal points should be used for analyte concentration less than 20 units
IQC IN BIOCHEMISTRY: Biorad QC Level I and II
LEVEL I
LEVEL II
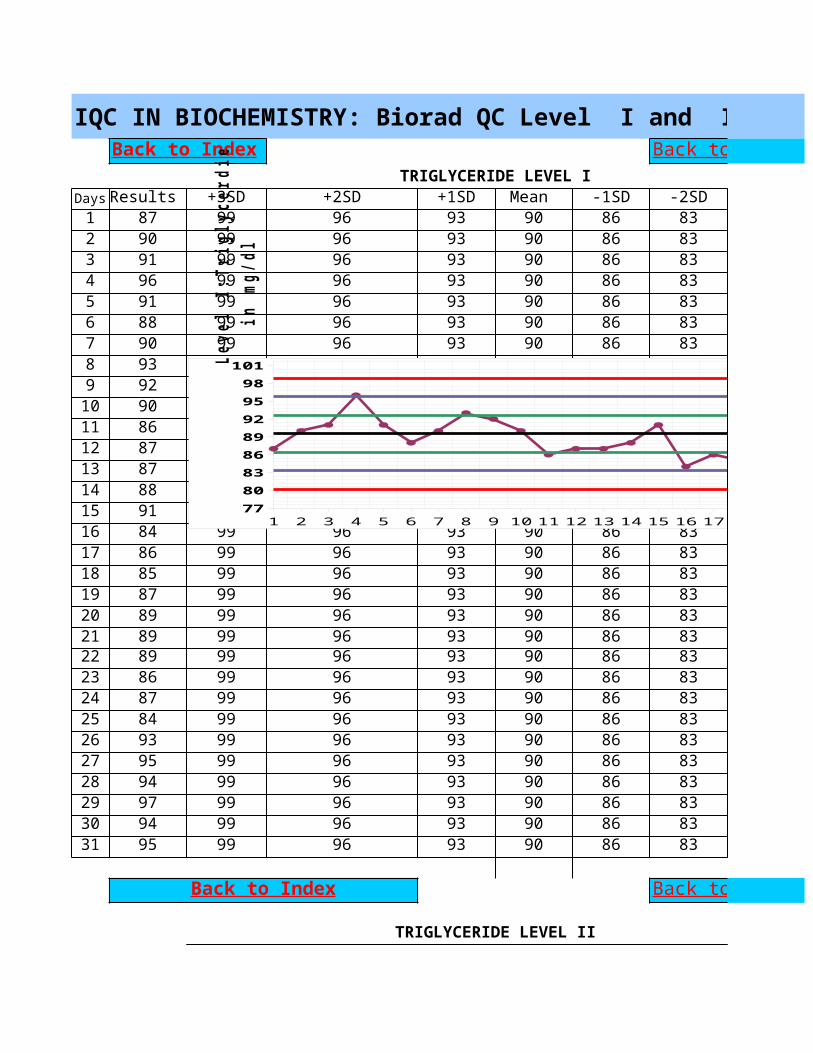
IQC IN BIOCHEMISTRY: Biorad QC Level I and II
TRIGLYCERIDE LEVEL IDays Results +3SD +2SD +1SD Mean -1SD -2SD1 87 99 96 93 90 86 832 90 99 96 93 90 86 833 91 99 96 93 90 86 834 96 99 96 93 90 86 835 91 99 96 93 90 86 836 88 99 96 93 90 86 837 90 99 96 93 90 86 838 93 99 96 93 90 86 839 92 99 96 93 90 86 8310 90 99 96 93 90 86 8311 86 99 96 93 90 86 8312 87 99 96 93 90 86 8313 87 99 96 93 90 86 8314 88 99 96 93 90 86 8315 91 99 96 93 90 86 8316 84 99 96 93 90 86 8317 86 99 96 93 90 86 8318 85 99 96 93 90 86 8319 87 99 96 93 90 86 8320 89 99 96 93 90 86 8321 89 99 96 93 90 86 8322 89 99 96 93 90 86 8323 86 99 96 93 90 86 8324 87 99 96 93 90 86 8325 84 99 96 93 90 86 8326 93 99 96 93 90 86 8327 95 99 96 93 90 86 8328 94 99 96 93 90 86 8329 97 99 96 93 90 86 8330 94 99 96 93 90 86 8331 95 99 96 93 90 86 83
TRIGLYCERIDE LEVEL II
Back to Index Back to Data entry
Back to Index Back to Data entry
1 2 3 4 5 6 7 8 9 10 11 12 13 14 15 16 17 18 19 20 21 22 23 24 25 26 27 28 29 30 317780838689929598101
+3SD+2SD+1SDMean -1SD-2SD-3SD
Leve
l I:
Trig
lyce
rdie
in
mg/
dl
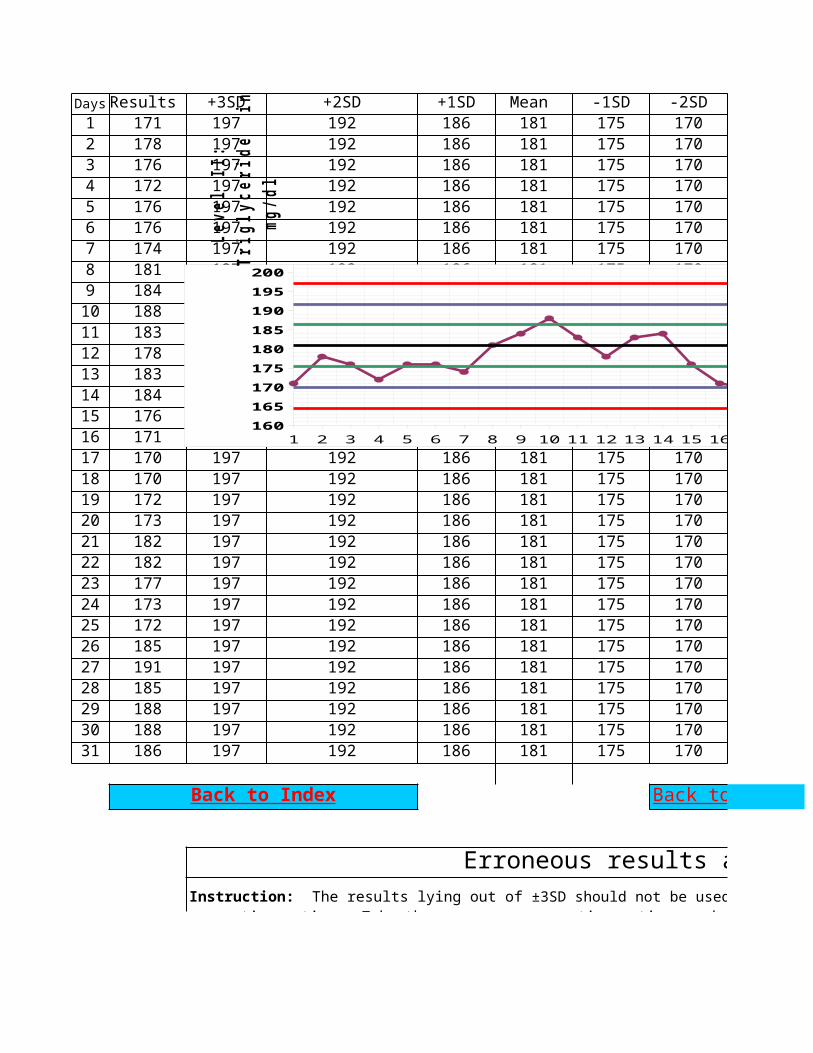
Days Results +3SD +2SD +1SD Mean -1SD -2SD1 171 197 192 186 181 175 1702 178 197 192 186 181 175 1703 176 197 192 186 181 175 1704 172 197 192 186 181 175 1705 176 197 192 186 181 175 1706 176 197 192 186 181 175 1707 174 197 192 186 181 175 1708 181 197 192 186 181 175 1709 184 197 192 186 181 175 17010 188 197 192 186 181 175 17011 183 197 192 186 181 175 17012 178 197 192 186 181 175 17013 183 197 192 186 181 175 17014 184 197 192 186 181 175 17015 176 197 192 186 181 175 17016 171 197 192 186 181 175 17017 170 197 192 186 181 175 17018 170 197 192 186 181 175 17019 172 197 192 186 181 175 17020 173 197 192 186 181 175 17021 182 197 192 186 181 175 17022 182 197 192 186 181 175 17023 177 197 192 186 181 175 17024 173 197 192 186 181 175 17025 172 197 192 186 181 175 17026 185 197 192 186 181 175 17027 191 197 192 186 181 175 17028 185 197 192 186 181 175 17029 188 197 192 186 181 175 17030 188 197 192 186 181 175 17031 186 197 192 186 181 175 170
Erroneous results and trouble shooting
Back to Index Back to Data entry
Instruction: The results lying out of ±3SD should not be used to plot the LJ charts and the results can not be reported without corrective actions. Take the necessary corrective actions and fill in the following table. The values of the outlying results and corrected results should be writen clearly. No decimal points is required for the analyte concentration greater than 20 units but two decimal points should be used for analyte concentration less than 20 units (glucose = 89mg/dl; total bilirubin 1.56 mg/dl).
1 2 3 4 5 6 7 8 9 10 11 12 13 14 15 16 17 18 19 20 21 22 23 24 25 26 27 28 29 30 31160165170175180185190195200
+3SD+2SD+1SDMean -1SD-2SD-3SD
Leve
l II
: Tr
igly
ceri
de
in
mg/d
l
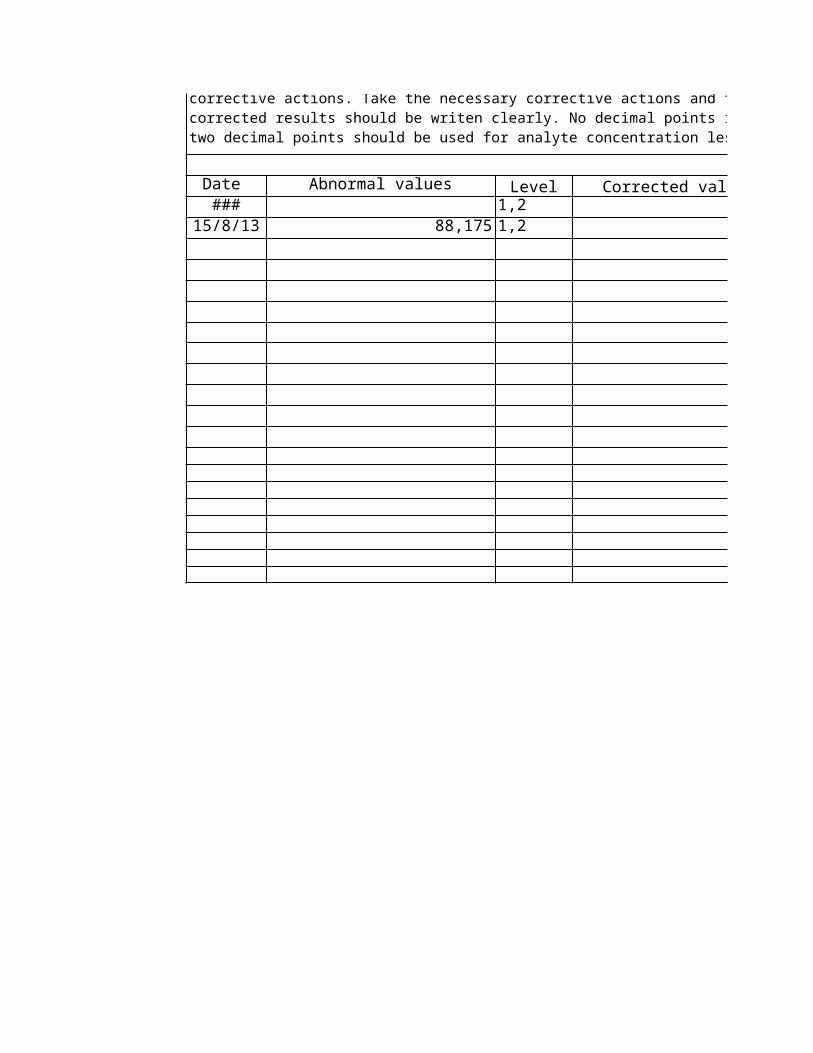
Date Abnormal values Level Corrected values ### 1,2
15/8/13 88,175 1,2 91,176
Instruction: The results lying out of ±3SD should not be used to plot the LJ charts and the results can not be reported without corrective actions. Take the necessary corrective actions and fill in the following table. The values of the outlying results and corrected results should be writen clearly. No decimal points is required for the analyte concentration greater than 20 units but two decimal points should be used for analyte concentration less than 20 units (glucose = 89mg/dl; total bilirubin 1.56 mg/dl).
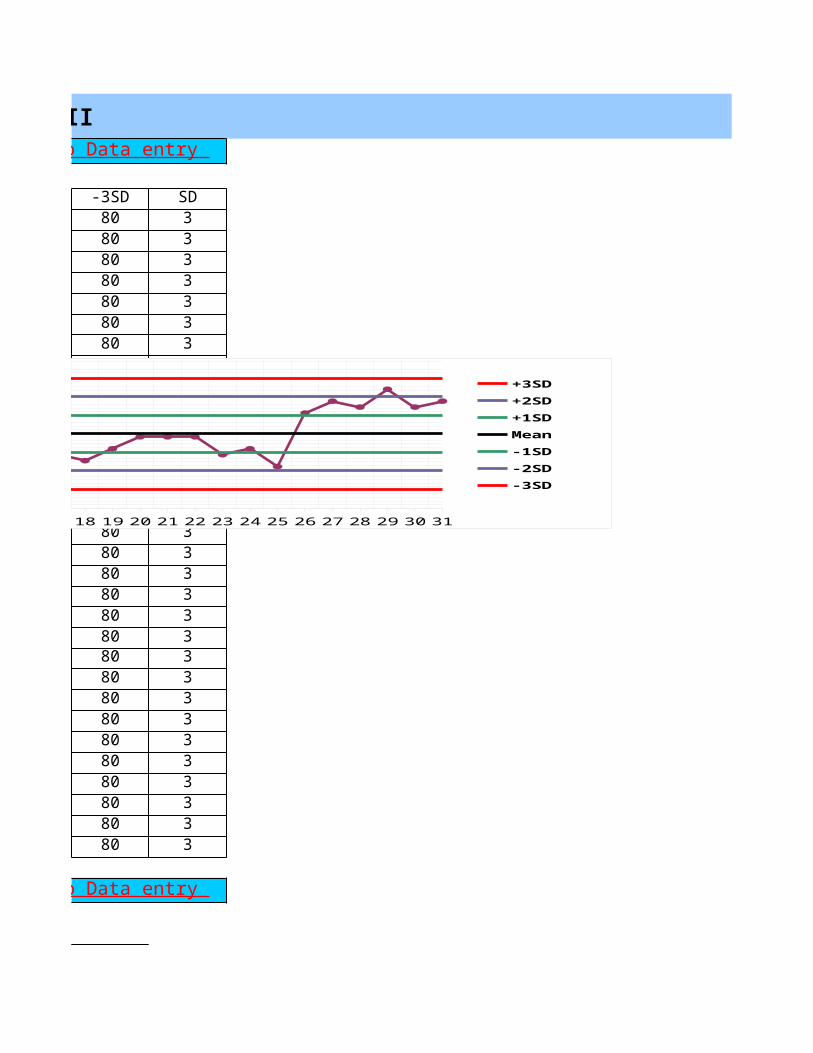
IQC IN BIOCHEMISTRY: Biorad QC Level I and II
TRIGLYCERIDE LEVEL I-3SD SD80 380 380 380 380 380 380 380 380 380 380 380 380 380 380 380 380 380 380 380 380 380 380 380 380 380 380 380 380 380 380 3
TRIGLYCERIDE LEVEL II
Back to Data entry
Back to Data entry
1 2 3 4 5 6 7 8 9 10 11 12 13 14 15 16 17 18 19 20 21 22 23 24 25 26 27 28 29 30 317780838689929598101
+3SD+2SD+1SDMean -1SD-2SD-3SD
Leve
l I:
Trig
lyce
rdie
in
mg/
dl
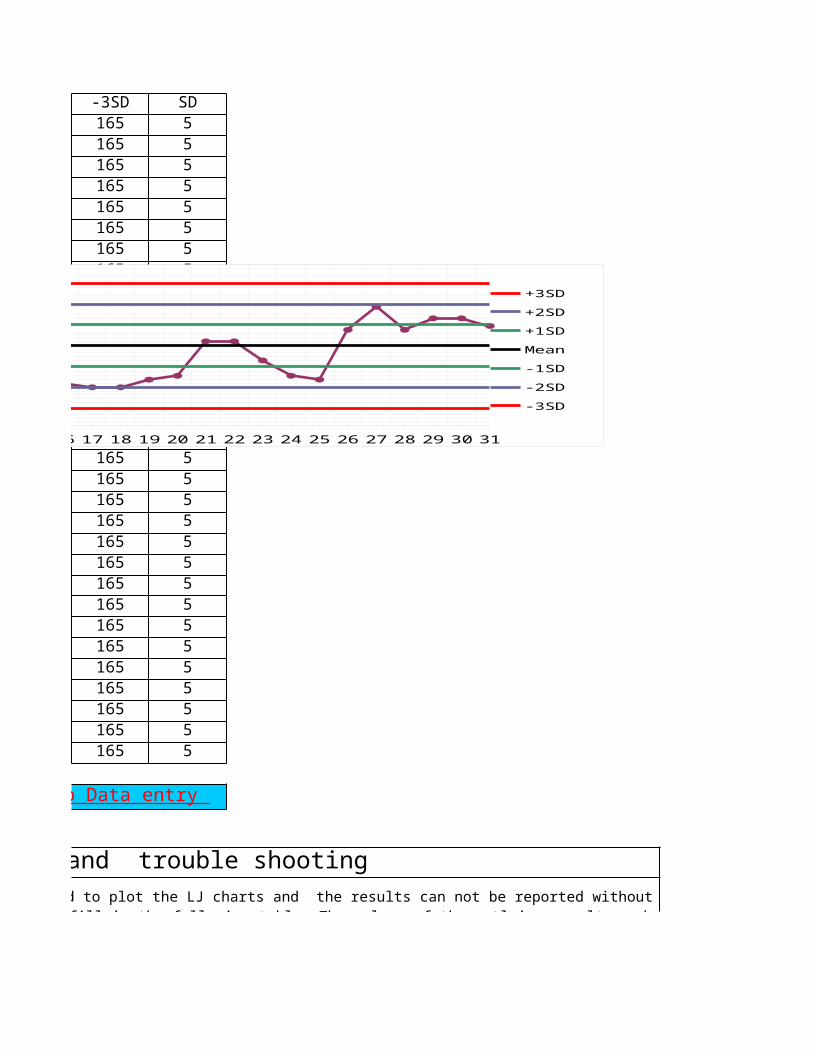
-3SD SD165 5165 5165 5165 5165 5165 5165 5165 5165 5165 5165 5165 5165 5165 5165 5165 5165 5165 5165 5165 5165 5165 5165 5165 5165 5165 5165 5165 5165 5165 5165 5
Erroneous results and trouble shooting
Back to Data entry
3SD should not be used to plot the LJ charts and the results can not be reported without corrective actions. Take the necessary corrective actions and fill in the following table. The values of the outlying results and corrected results should be writen clearly. No decimal points is required for the analyte concentration greater than 20 units but two decimal points should be used for analyte concentration less than 20 units (glucose = 89mg/dl; total bilirubin 1.56 mg/dl).
1 2 3 4 5 6 7 8 9 10 11 12 13 14 15 16 17 18 19 20 21 22 23 24 25 26 27 28 29 30 31160165170175180185190195200
+3SD+2SD+1SDMean -1SD-2SD-3SD
Leve
l II
: Tr
igly
ceri
de
in
mg/d
l
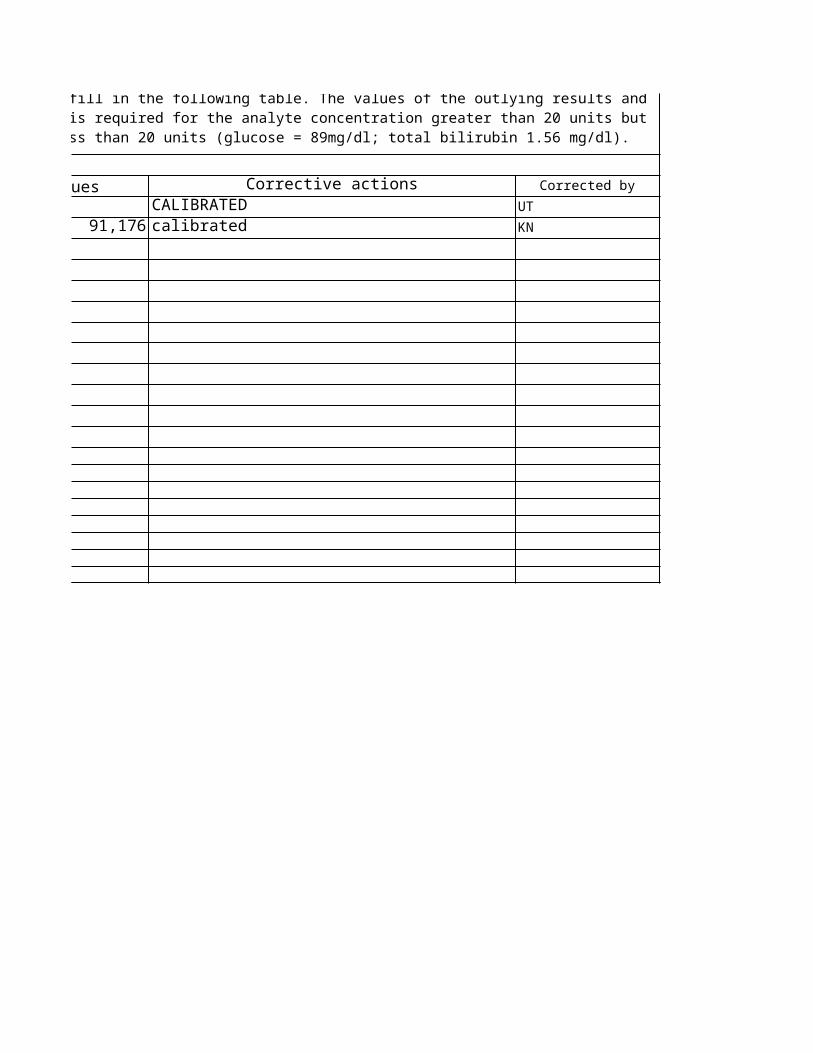
Corrected values Corrective actions Corrected byCALIBRATED UT
91,176 calibrated KN
3SD should not be used to plot the LJ charts and the results can not be reported without corrective actions. Take the necessary corrective actions and fill in the following table. The values of the outlying results and corrected results should be writen clearly. No decimal points is required for the analyte concentration greater than 20 units but two decimal points should be used for analyte concentration less than 20 units (glucose = 89mg/dl; total bilirubin 1.56 mg/dl).
IQC IN BIOCHEMISTRY: Biorad QC Level I and II
LEVEL I
LEVEL II
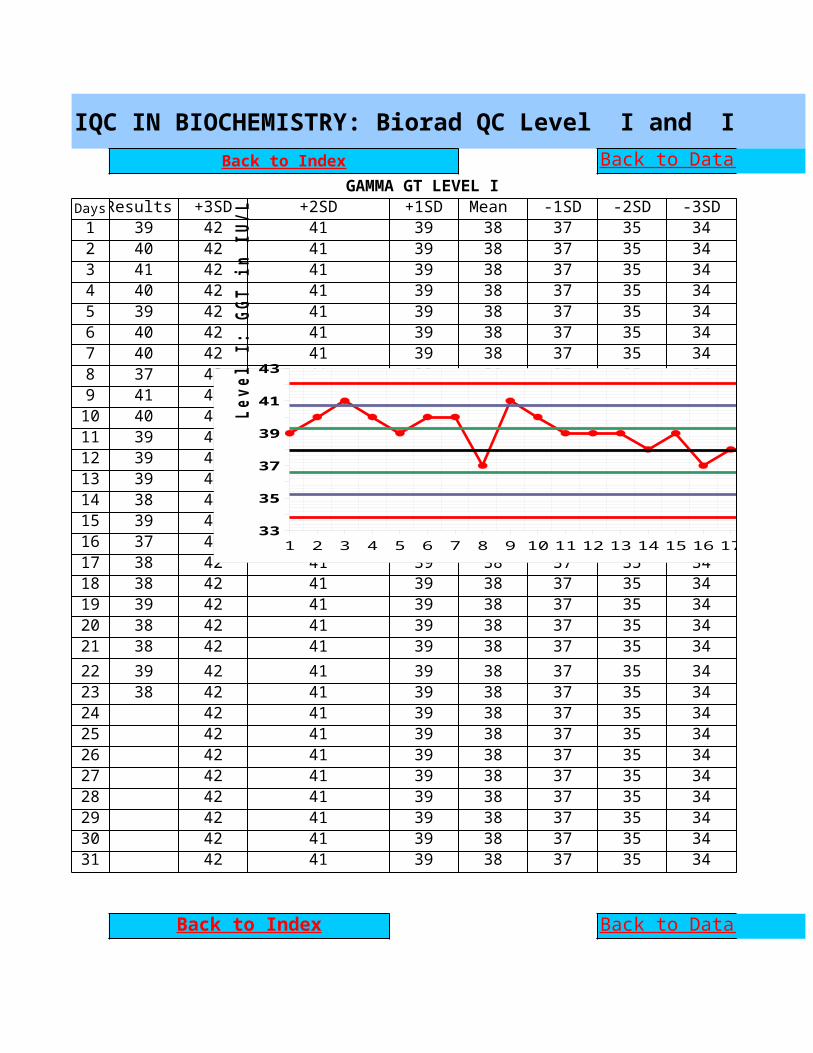
IQC IN BIOCHEMISTRY: Biorad QC Level I and II
GAMMA GT LEVEL IDaysResults +3SD +2SD +1SD Mean -1SD -2SD -3SD1 39 42 41 39 38 37 35 342 40 42 41 39 38 37 35 343 41 42 41 39 38 37 35 344 40 42 41 39 38 37 35 345 39 42 41 39 38 37 35 346 40 42 41 39 38 37 35 347 40 42 41 39 38 37 35 348 37 42 41 39 38 37 35 349 41 42 41 39 38 37 35 3410 40 42 41 39 38 37 35 3411 39 42 41 39 38 37 35 3412 39 42 41 39 38 37 35 3413 39 42 41 39 38 37 35 3414 38 42 41 39 38 37 35 3415 39 42 41 39 38 37 35 3416 37 42 41 39 38 37 35 3417 38 42 41 39 38 37 35 3418 38 42 41 39 38 37 35 3419 39 42 41 39 38 37 35 3420 38 42 41 39 38 37 35 3421 38 42 41 39 38 37 35 3422 39 42 41 39 38 37 35 3423 38 42 41 39 38 37 35 3424 42 41 39 38 37 35 3425 42 41 39 38 37 35 3426 42 41 39 38 37 35 3427 42 41 39 38 37 35 3428 42 41 39 38 37 35 3429 42 41 39 38 37 35 3430 42 41 39 38 37 35 3431 42 41 39 38 37 35 34
Back to Index Back to Data entry
Back to Index Back to Data entry
1 2 3 4 5 6 7 8 9 10 11 12 13 14 15 16 17 18 19 20 21 22 23 24 25 26 27 28 29 30 3133
35
37
39
41
43
+3SD+2SD+1SDMean -1SD-2SD-3SD
Leve
l I:
GGT
in
IU/L
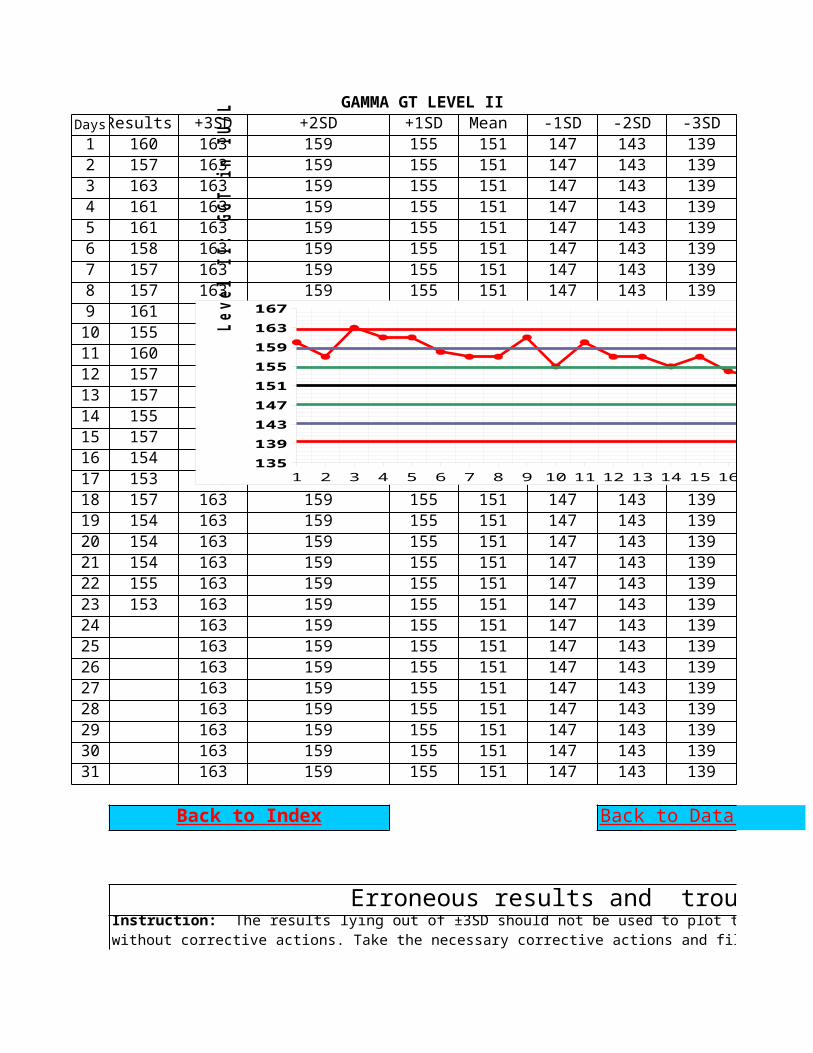
GAMMA GT LEVEL IIDaysResults +3SD +2SD +1SD Mean -1SD -2SD -3SD1 160 163 159 155 151 147 143 1392 157 163 159 155 151 147 143 1393 163 163 159 155 151 147 143 1394 161 163 159 155 151 147 143 1395 161 163 159 155 151 147 143 1396 158 163 159 155 151 147 143 1397 157 163 159 155 151 147 143 1398 157 163 159 155 151 147 143 1399 161 163 159 155 151 147 143 13910 155 163 159 155 151 147 143 13911 160 163 159 155 151 147 143 13912 157 163 159 155 151 147 143 13913 157 163 159 155 151 147 143 13914 155 163 159 155 151 147 143 13915 157 163 159 155 151 147 143 13916 154 163 159 155 151 147 143 13917 153 163 159 155 151 147 143 13918 157 163 159 155 151 147 143 13919 154 163 159 155 151 147 143 13920 154 163 159 155 151 147 143 13921 154 163 159 155 151 147 143 13922 155 163 159 155 151 147 143 13923 153 163 159 155 151 147 143 13924 163 159 155 151 147 143 13925 163 159 155 151 147 143 13926 163 159 155 151 147 143 13927 163 159 155 151 147 143 13928 163 159 155 151 147 143 13929 163 159 155 151 147 143 13930 163 159 155 151 147 143 13931 163 159 155 151 147 143 139
Erroneous results and trouble shooting
Back to Index Back to Data entry
Instruction: The results lying out of ±3SD should not be used to plot the LJ charts and the results can not be reported without corrective actions. Take the necessary corrective actions and fill in the following table. The values of the outlying results and corrected results should be writen clearly. No decimal points is required for the analyte
1 2 3 4 5 6 7 8 9 10 11 12 13 14 15 16 17 18 19 20 21 22 23 24 25 26 27 28 29 30 31135139143147151155159163167
+3SD+2SD+1SDMean -1SD-2SD-3SD
Leve
l II
: GG
T in
IU/
L
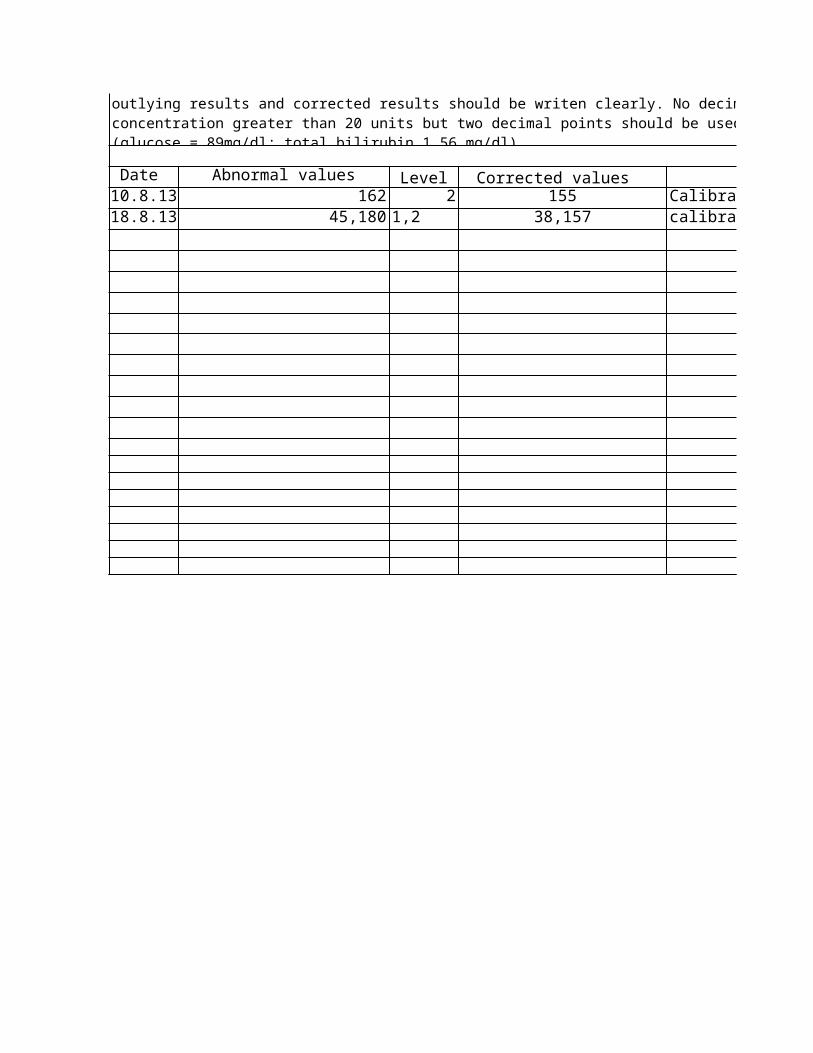
Date Abnormal values Level Corrected values Corrective actions10.8.13 162 2 155 Calibrated, QC change18.8.13 45,180 1,2 38,157 calibration done
outlying results and corrected results should be writen clearly. No decimal points is required for the analyte concentration greater than 20 units but two decimal points should be used for analyte concentration less than 20 units (glucose = 89mg/dl; total bilirubin 1.56 mg/dl).
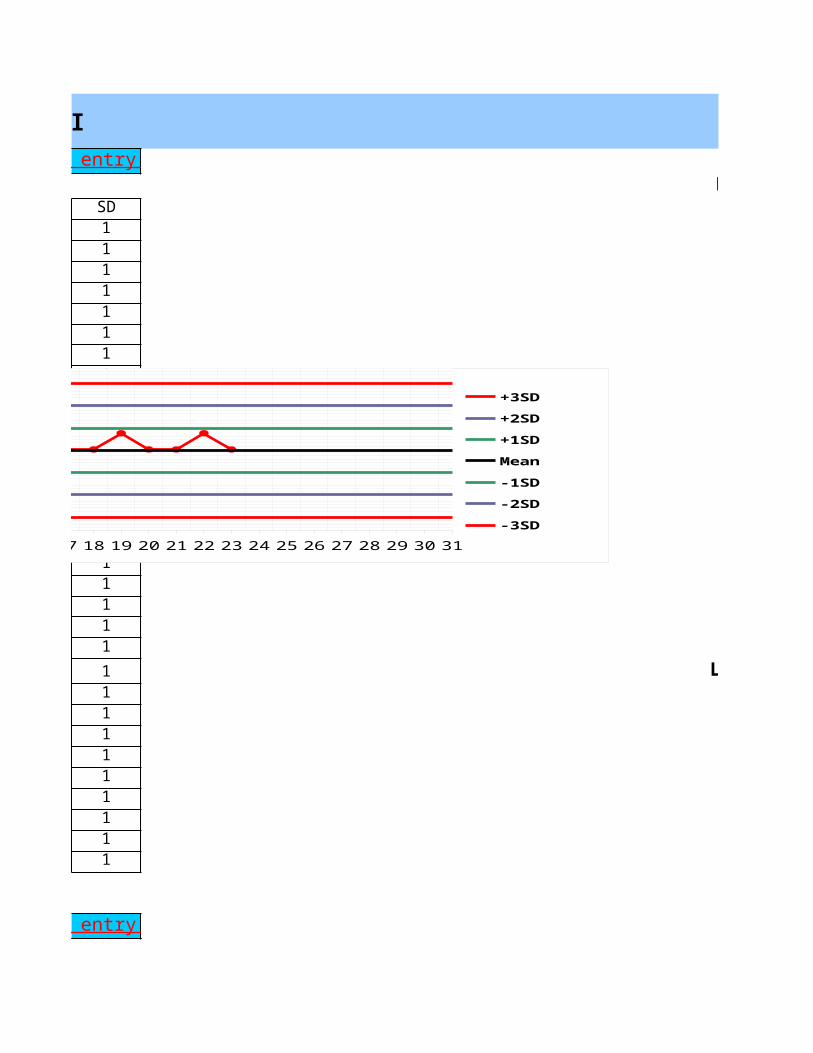
IQC IN BIOCHEMISTRY: Biorad QC Level I and II
LEVEL ISD1111111111111111111111 LEVEL II111111111
Back to Data entry
Back to Data entry
1 2 3 4 5 6 7 8 9 10 11 12 13 14 15 16 17 18 19 20 21 22 23 24 25 26 27 28 29 30 3133
35
37
39
41
43
+3SD+2SD+1SDMean -1SD-2SD-3SD
Leve
l I:
GGT
in
IU/L
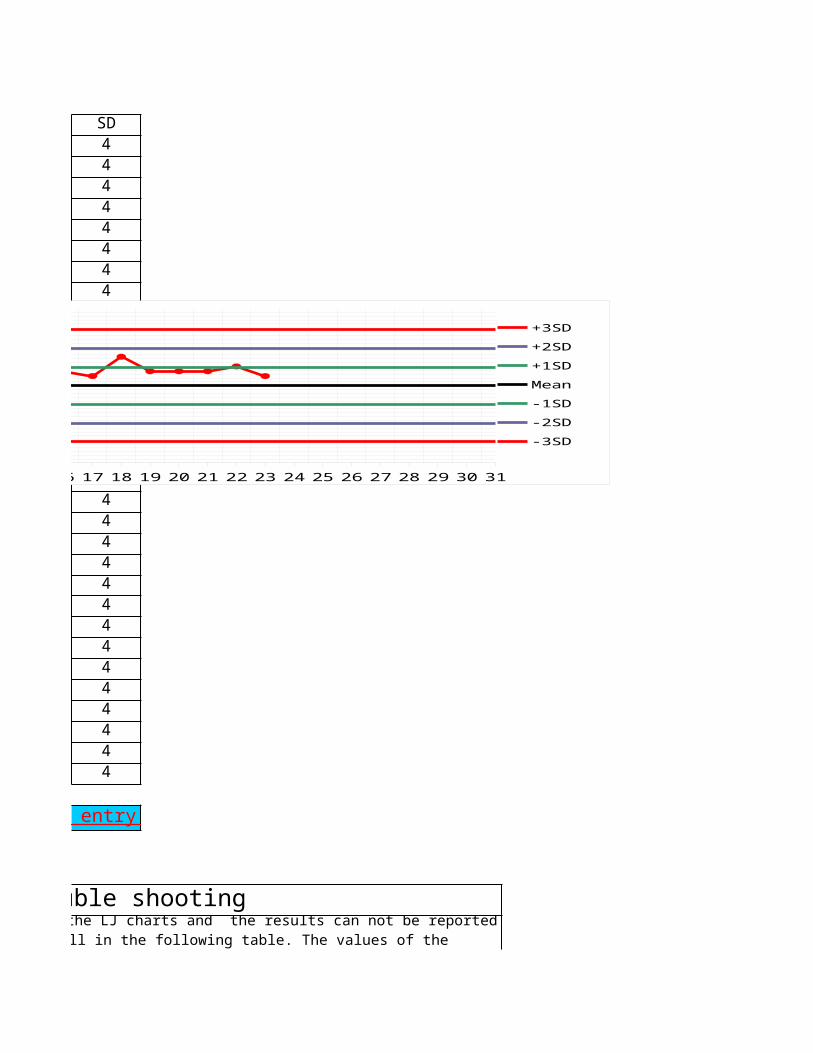
SD4444444444444444444444444444444
Erroneous results and trouble shooting
Back to Data entry
3SD should not be used to plot the LJ charts and the results can not be reported without corrective actions. Take the necessary corrective actions and fill in the following table. The values of the outlying results and corrected results should be writen clearly. No decimal points is required for the analyte
1 2 3 4 5 6 7 8 9 10 11 12 13 14 15 16 17 18 19 20 21 22 23 24 25 26 27 28 29 30 31135139143147151155159163167
+3SD+2SD+1SDMean -1SD-2SD-3SD
Leve
l II
: GG
T in
IU/
L
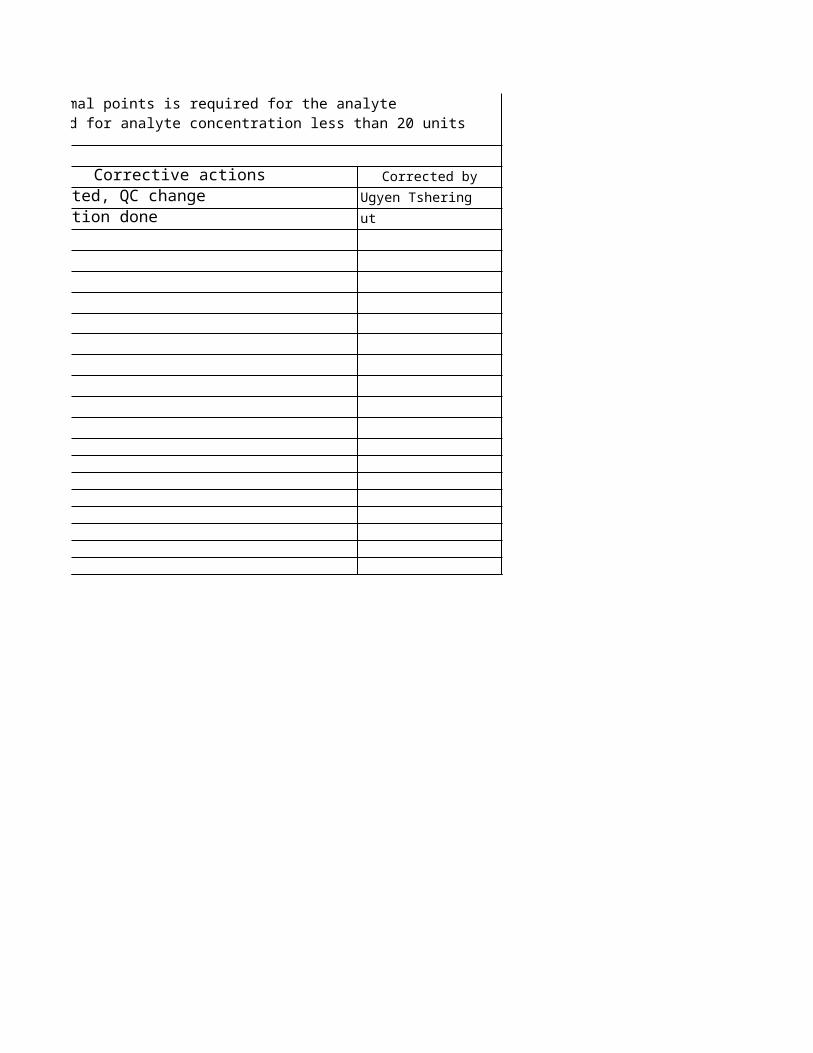
Corrective actions Corrected byCalibrated, QC change Ugyen Tsheringcalibration done ut
outlying results and corrected results should be writen clearly. No decimal points is required for the analyte concentration greater than 20 units but two decimal points should be used for analyte concentration less than 20 units

IQC IN BIOCHEMISTRY: Biorad QC Level I and II
LEVEL I
LEVEL II
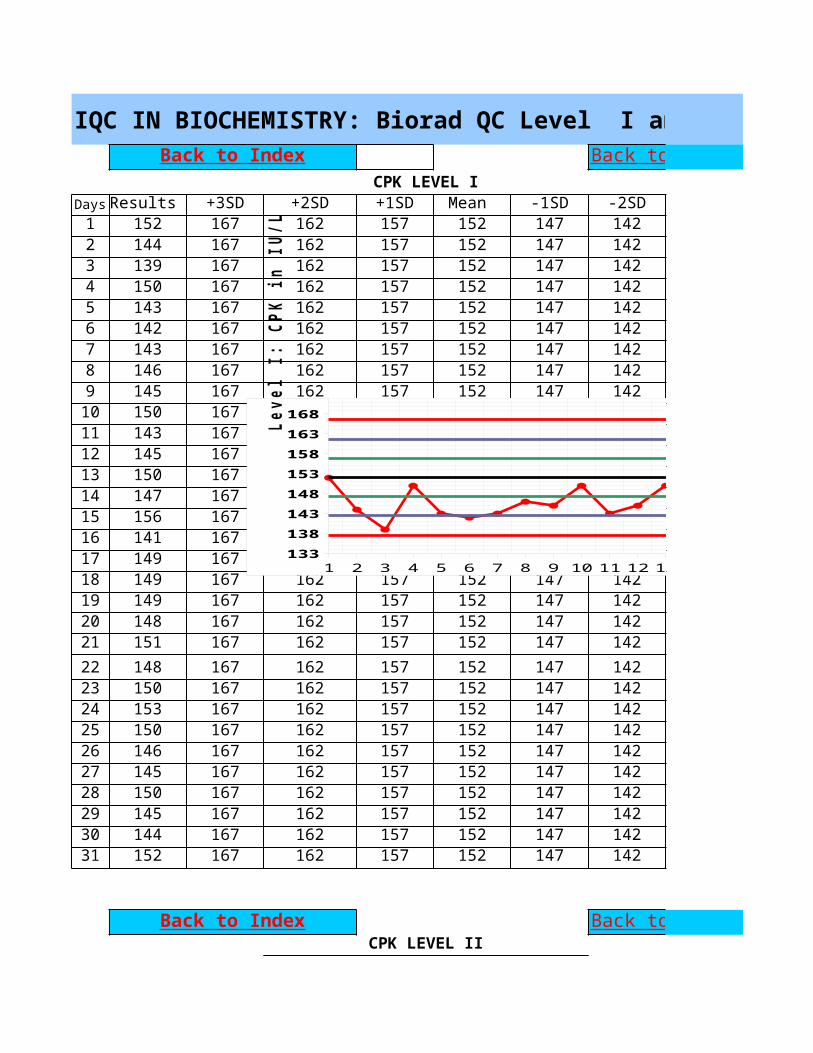
IQC IN BIOCHEMISTRY: Biorad QC Level I and II
CPK LEVEL IDays Results +3SD +2SD +1SD Mean -1SD -2SD1 152 167 162 157 152 147 1422 144 167 162 157 152 147 1423 139 167 162 157 152 147 1424 150 167 162 157 152 147 1425 143 167 162 157 152 147 1426 142 167 162 157 152 147 1427 143 167 162 157 152 147 1428 146 167 162 157 152 147 1429 145 167 162 157 152 147 14210 150 167 162 157 152 147 14211 143 167 162 157 152 147 14212 145 167 162 157 152 147 14213 150 167 162 157 152 147 14214 147 167 162 157 152 147 14215 156 167 162 157 152 147 14216 141 167 162 157 152 147 14217 149 167 162 157 152 147 14218 149 167 162 157 152 147 14219 149 167 162 157 152 147 14220 148 167 162 157 152 147 14221 151 167 162 157 152 147 14222 148 167 162 157 152 147 14223 150 167 162 157 152 147 14224 153 167 162 157 152 147 14225 150 167 162 157 152 147 14226 146 167 162 157 152 147 14227 145 167 162 157 152 147 14228 150 167 162 157 152 147 14229 145 167 162 157 152 147 14230 144 167 162 157 152 147 14231 152 167 162 157 152 147 142
CPK LEVEL II
Back to Index Back to Data entry
Back to Index Back to Data entry
1 2 3 4 5 6 7 8 9 10 11 12 13 14 15 16 17 18 19 20 21 22 23 24 25 26 27 28 29 30 31133138143148153158163168
+3SD+2SD+1SDMean -1SD-2SD-3SD
Leve
l I:
CPK
in
IU/L
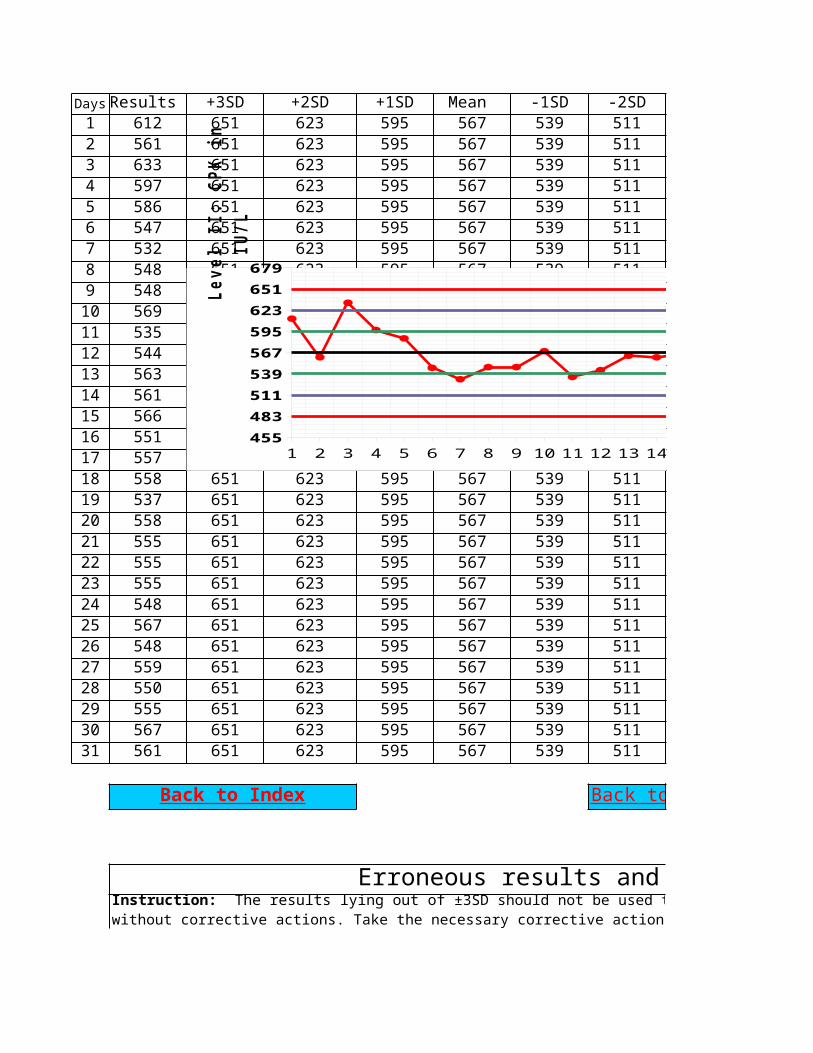
Days Results +3SD +2SD +1SD Mean -1SD -2SD1 612 651 623 595 567 539 5112 561 651 623 595 567 539 5113 633 651 623 595 567 539 5114 597 651 623 595 567 539 5115 586 651 623 595 567 539 5116 547 651 623 595 567 539 5117 532 651 623 595 567 539 5118 548 651 623 595 567 539 5119 548 651 623 595 567 539 51110 569 651 623 595 567 539 51111 535 651 623 595 567 539 51112 544 651 623 595 567 539 51113 563 651 623 595 567 539 51114 561 651 623 595 567 539 51115 566 651 623 595 567 539 51116 551 651 623 595 567 539 51117 557 651 623 595 567 539 51118 558 651 623 595 567 539 51119 537 651 623 595 567 539 51120 558 651 623 595 567 539 51121 555 651 623 595 567 539 51122 555 651 623 595 567 539 51123 555 651 623 595 567 539 51124 548 651 623 595 567 539 51125 567 651 623 595 567 539 51126 548 651 623 595 567 539 51127 559 651 623 595 567 539 51128 550 651 623 595 567 539 51129 555 651 623 595 567 539 51130 567 651 623 595 567 539 51131 561 651 623 595 567 539 511
Erroneous results and trouble shooting
Back to Index Back to Data entry
Instruction: The results lying out of ±3SD should not be used to plot the LJ charts and the results can not be reported without corrective actions. Take the necessary corrective actions and fill in the following table. The values of the outlying results and corrected results should be writen clearly. No decimal points is required for the analyte
1 2 3 4 5 6 7 8 9 10 11 12 13 14 15 16 17 18 19 20 21 22 23 24 25 26 27 28 29 30 31455483511539567595623651679
+3SD+2SD+1SDMean -1SD-2SD-3SD
Leve
l II
: CP
K in
IU
/L

Date Abnormal values Level Corrected values
outlying results and corrected results should be writen clearly. No decimal points is required for the analyte concentration greater than 20 units but two decimal points should be used for analyte concentration less than 20 units (glucose = 89mg/dl; total bilirubin 1.56 mg/dl).
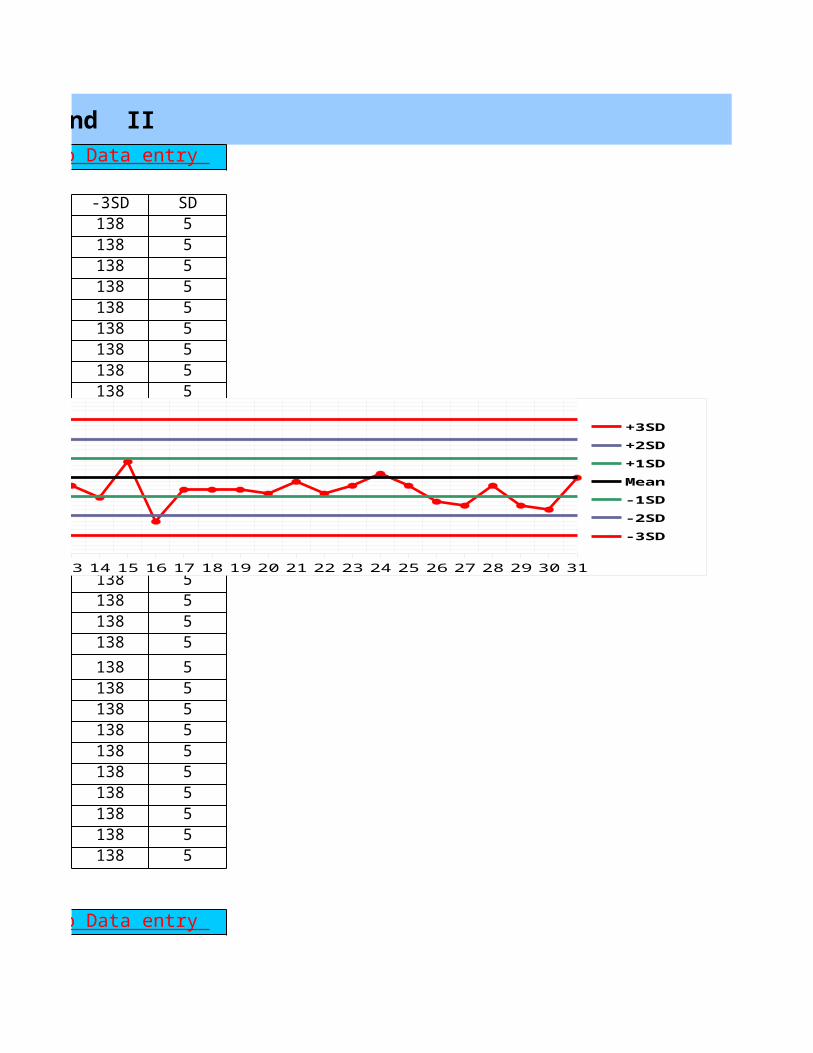
IQC IN BIOCHEMISTRY: Biorad QC Level I and II
-3SD SD138 5138 5138 5138 5138 5138 5138 5138 5138 5138 5138 5138 5138 5138 5138 5138 5138 5138 5138 5138 5138 5138 5138 5138 5138 5138 5138 5138 5138 5138 5138 5
Back to Data entry
Back to Data entry
1 2 3 4 5 6 7 8 9 10 11 12 13 14 15 16 17 18 19 20 21 22 23 24 25 26 27 28 29 30 31133138143148153158163168
+3SD+2SD+1SDMean -1SD-2SD-3SD
Leve
l I:
CPK
in
IU/L
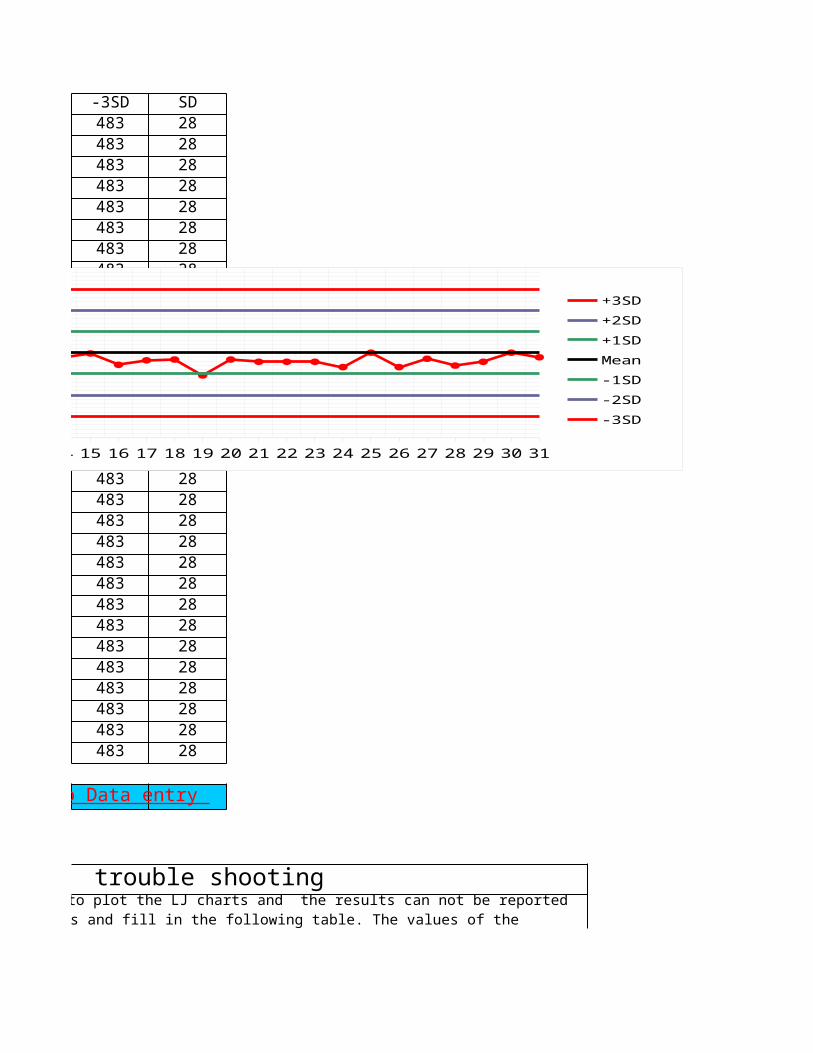
-3SD SD483 28483 28483 28483 28483 28483 28483 28483 28483 28483 28483 28483 28483 28483 28483 28483 28483 28483 28483 28483 28483 28483 28483 28483 28483 28483 28483 28483 28483 28483 28483 28
Erroneous results and trouble shooting
Back to Data entry
3SD should not be used to plot the LJ charts and the results can not be reported without corrective actions. Take the necessary corrective actions and fill in the following table. The values of the outlying results and corrected results should be writen clearly. No decimal points is required for the analyte
1 2 3 4 5 6 7 8 9 10 11 12 13 14 15 16 17 18 19 20 21 22 23 24 25 26 27 28 29 30 31455483511539567595623651679
+3SD+2SD+1SDMean -1SD-2SD-3SD
Leve
l II
: CP
K in
IU
/L

Corrective actions Corrected by
outlying results and corrected results should be writen clearly. No decimal points is required for the analyte concentration greater than 20 units but two decimal points should be used for analyte concentration less than 20 units

IQC IN BIOCHEMISTRY: Biorad QC Level I and II
LEVEL I
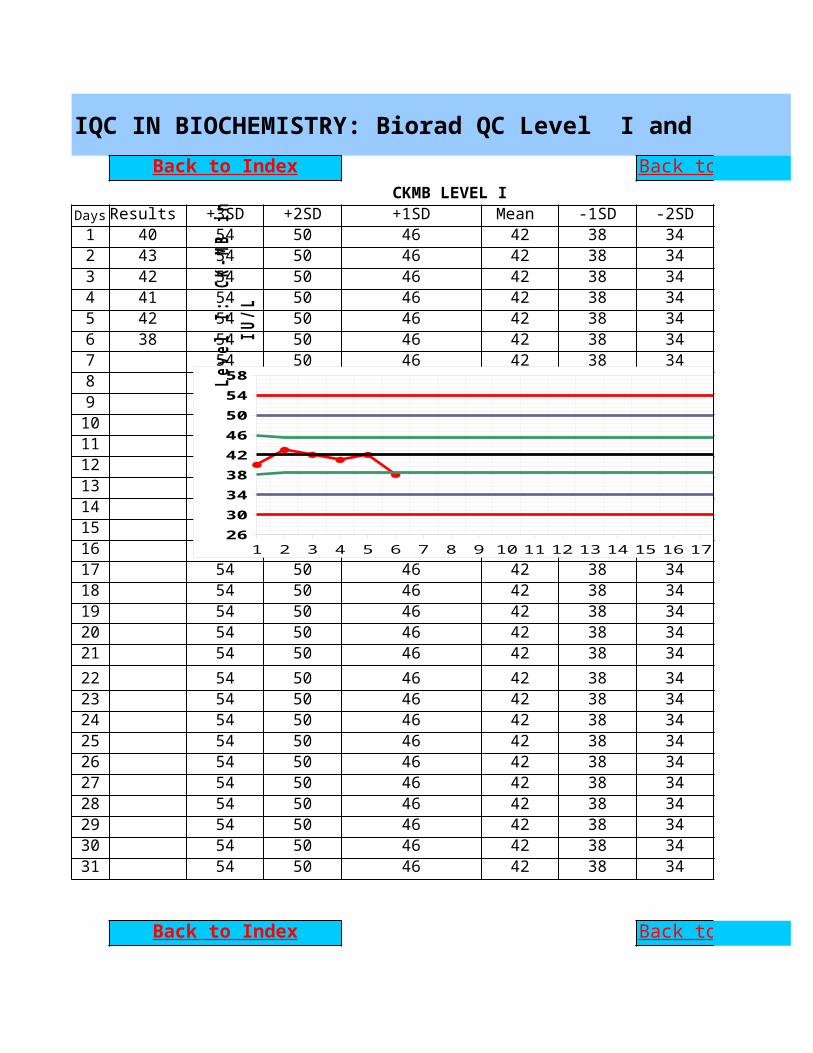
IQC IN BIOCHEMISTRY: Biorad QC Level I and II
CKMB LEVEL IDays Results +3SD +2SD +1SD Mean -1SD -2SD1 40 54 50 46 42 38 342 43 54 50 46 42 38 343 42 54 50 46 42 38 344 41 54 50 46 42 38 345 42 54 50 46 42 38 346 38 54 50 46 42 38 347 54 50 46 42 38 348 54 50 46 42 38 349 54 50 46 42 38 3410 54 50 46 42 38 3411 54 50 46 42 38 3412 54 50 46 42 38 3413 54 50 46 42 38 3414 54 50 46 42 38 3415 54 50 46 42 38 3416 54 50 46 42 38 3417 54 50 46 42 38 3418 54 50 46 42 38 3419 54 50 46 42 38 3420 54 50 46 42 38 3421 54 50 46 42 38 3422 54 50 46 42 38 3423 54 50 46 42 38 3424 54 50 46 42 38 3425 54 50 46 42 38 3426 54 50 46 42 38 3427 54 50 46 42 38 3428 54 50 46 42 38 3429 54 50 46 42 38 3430 54 50 46 42 38 3431 54 50 46 42 38 34
Back to Index Back to Data entry
Back to Index Back to Data entry
1 2 3 4 5 6 7 8 9 10 11 12 13 14 15 16 17 18 19 20 21 22 23 24 25 26 27 28 29 30 31263034384246505458
+3SD+2SD+1SDMean -1SD-2SD-3SD
Leve
l I:
CK-
MB i
n IU
/L
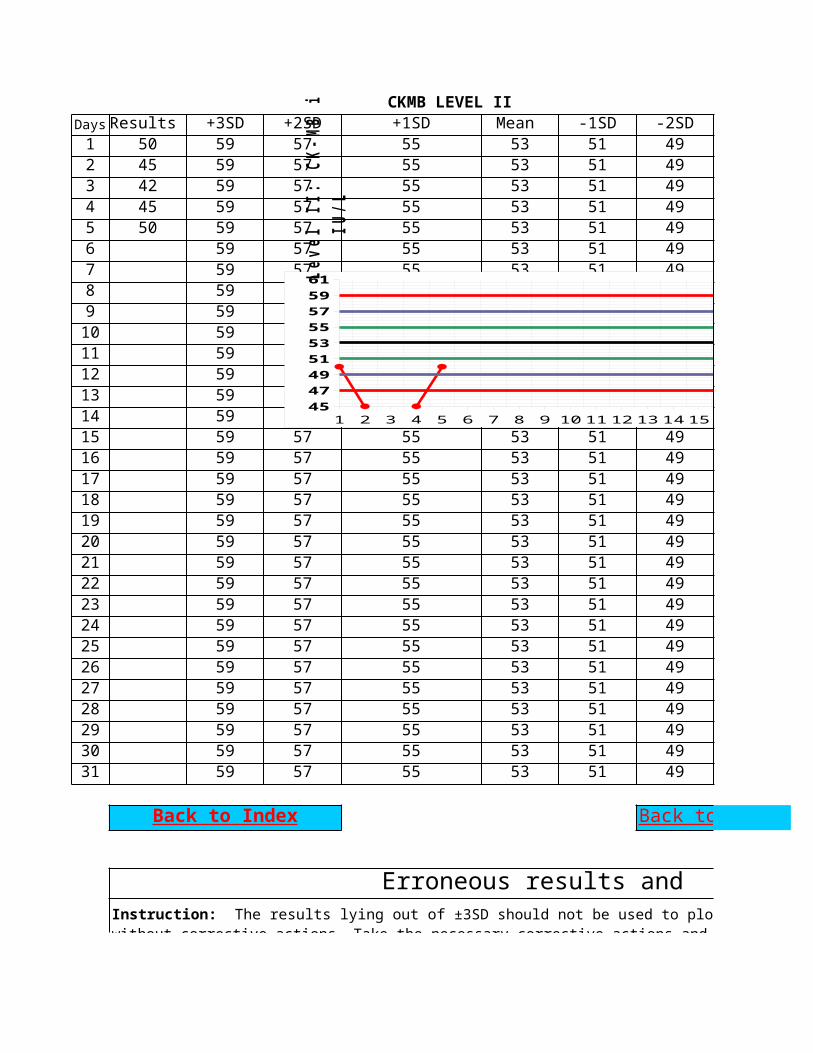
CKMB LEVEL IIDays Results +3SD +2SD +1SD Mean -1SD -2SD1 50 59 57 55 53 51 492 45 59 57 55 53 51 493 42 59 57 55 53 51 494 45 59 57 55 53 51 495 50 59 57 55 53 51 496 59 57 55 53 51 497 59 57 55 53 51 498 59 57 55 53 51 499 59 57 55 53 51 4910 59 57 55 53 51 4911 59 57 55 53 51 4912 59 57 55 53 51 4913 59 57 55 53 51 4914 59 57 55 53 51 4915 59 57 55 53 51 4916 59 57 55 53 51 4917 59 57 55 53 51 4918 59 57 55 53 51 4919 59 57 55 53 51 4920 59 57 55 53 51 4921 59 57 55 53 51 4922 59 57 55 53 51 4923 59 57 55 53 51 4924 59 57 55 53 51 4925 59 57 55 53 51 4926 59 57 55 53 51 4927 59 57 55 53 51 4928 59 57 55 53 51 4929 59 57 55 53 51 4930 59 57 55 53 51 4931 59 57 55 53 51 49
Erroneous results and trouble shooting
Back to Index Back to Data entry
Instruction: The results lying out of ±3SD should not be used to plot the LJ charts and the results can not be reported without corrective actions. Take the necessary corrective actions and fill in the following table. The values of the outlying results and corrected results should be writen clearly. No decimal points is required for the analyte concentration greater than 20 units but two decimal points should be used for analyte concentration less than 20 units (glucose = 89mg/dl; total bilirubin 1.56 mg/dl).
1 2 3 4 5 6 7 8 9 10 11 12 13 14 15 16 17 18 19 20 21 22 23 24 25 26 27 28 29 30 31454749515355575961
+3SD+2SD+1SDMean -1SD-2SD-3SD
Leve
l II
: CK
-MB
in
IU/L
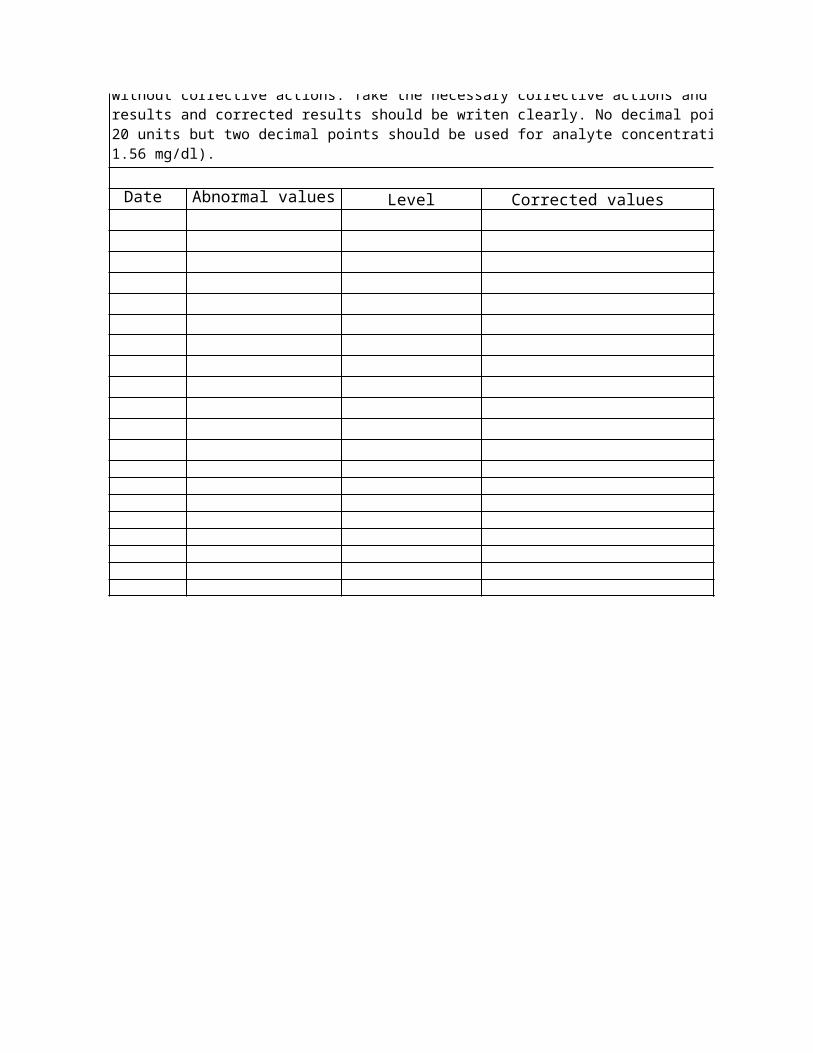
Date Abnormal values Level Corrected values
Instruction: The results lying out of ±3SD should not be used to plot the LJ charts and the results can not be reported without corrective actions. Take the necessary corrective actions and fill in the following table. The values of the outlying results and corrected results should be writen clearly. No decimal points is required for the analyte concentration greater than 20 units but two decimal points should be used for analyte concentration less than 20 units (glucose = 89mg/dl; total bilirubin 1.56 mg/dl).
IQC IN BIOCHEMISTRY: Biorad QC Level I and II
-3SD SD30.0 430.0 430.0 430.0 430.0 430.0 430.0 430.0 430.0 430.0 430.0 430.0 430.0 430.0 430.0 430.0 430.0 430.0 430.0 430.0 430.0 430.0 430.0 430.0 430.0 430.0 430.0 430.0 430.0 430.0 430.0 4
Back to Data entry
Back to Data entry
1 2 3 4 5 6 7 8 9 10 11 12 13 14 15 16 17 18 19 20 21 22 23 24 25 26 27 28 29 30 31263034384246505458
+3SD+2SD+1SDMean -1SD-2SD-3SD
Leve
l I:
CK-
MB i
n IU
/L
-3SD SD47 247 247 247 247 247 247 247 247 247 247 247 247 247 247 247 247 247 247 247 247 247 247 247 247 247 247 247 247 247 247 2
Erroneous results and trouble shooting
Back to Data entry
3SD should not be used to plot the LJ charts and the results can not be reported without corrective actions. Take the necessary corrective actions and fill in the following table. The values of the outlying results and corrected results should be writen clearly. No decimal points is required for the analyte concentration greater than 20 units but two decimal points should be used for analyte concentration less than 20 units (glucose = 89mg/dl; total bilirubin
1 2 3 4 5 6 7 8 9 10 11 12 13 14 15 16 17 18 19 20 21 22 23 24 25 26 27 28 29 30 31454749515355575961
+3SD+2SD+1SDMean -1SD-2SD-3SD
Leve
l II
: CK
-MB
in
IU/L
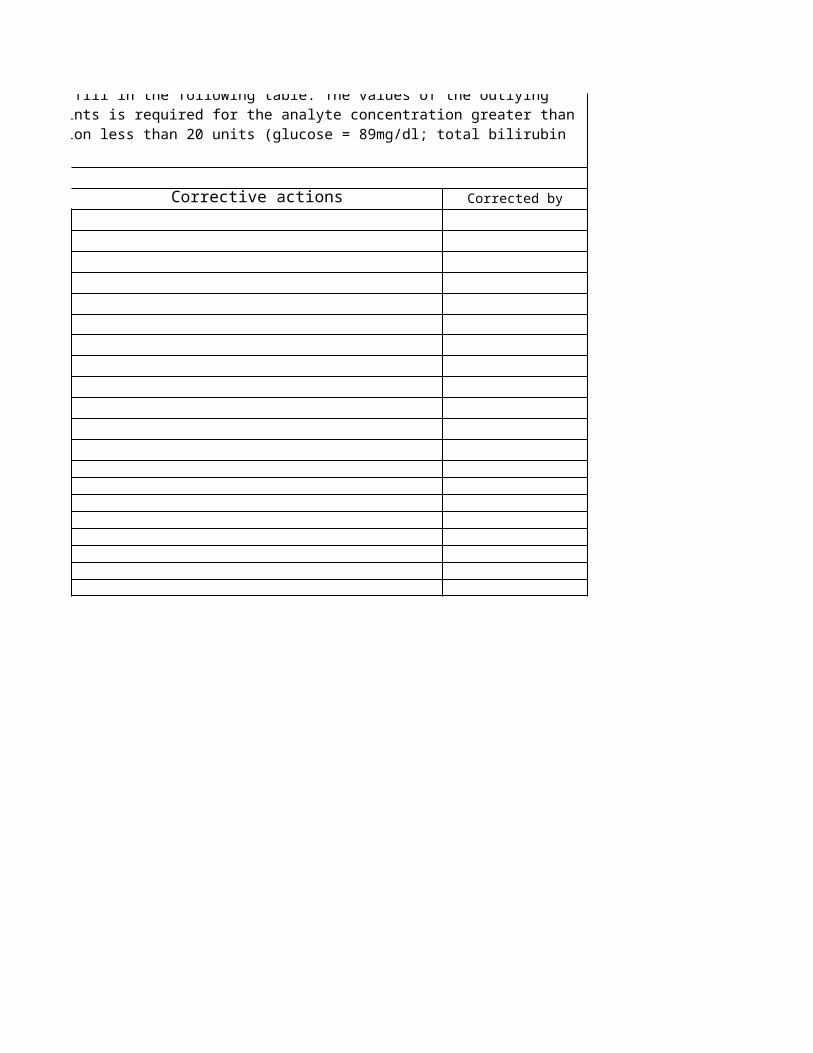
Corrective actions Corrected by
3SD should not be used to plot the LJ charts and the results can not be reported without corrective actions. Take the necessary corrective actions and fill in the following table. The values of the outlying results and corrected results should be writen clearly. No decimal points is required for the analyte concentration greater than 20 units but two decimal points should be used for analyte concentration less than 20 units (glucose = 89mg/dl; total bilirubin
IQC IN BIOCHEMISTRY: Biorad QC Level I and II
LEVEL I
LEVEL II
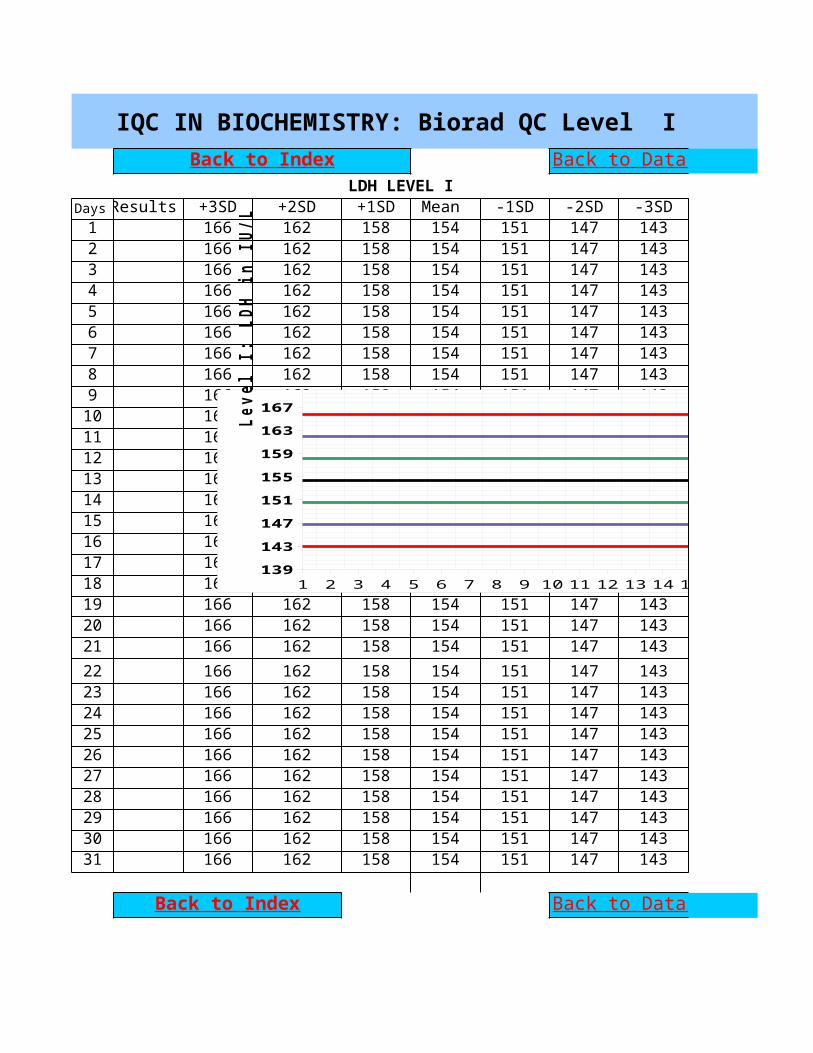
IQC IN BIOCHEMISTRY: Biorad QC Level I and II
LDH LEVEL IDays Results +3SD +2SD +1SD Mean -1SD -2SD -3SD1 166 162 158 154 151 147 1432 166 162 158 154 151 147 1433 166 162 158 154 151 147 1434 166 162 158 154 151 147 1435 166 162 158 154 151 147 1436 166 162 158 154 151 147 1437 166 162 158 154 151 147 1438 166 162 158 154 151 147 1439 166 162 158 154 151 147 14310 166 162 158 154 151 147 14311 166 162 158 154 151 147 14312 166 162 158 154 151 147 14313 166 162 158 154 151 147 14314 166 162 158 154 151 147 14315 166 162 158 154 151 147 14316 166 162 158 154 151 147 14317 166 162 158 154 151 147 14318 166 162 158 154 151 147 14319 166 162 158 154 151 147 14320 166 162 158 154 151 147 14321 166 162 158 154 151 147 14322 166 162 158 154 151 147 14323 166 162 158 154 151 147 14324 166 162 158 154 151 147 14325 166 162 158 154 151 147 14326 166 162 158 154 151 147 14327 166 162 158 154 151 147 14328 166 162 158 154 151 147 14329 166 162 158 154 151 147 14330 166 162 158 154 151 147 14331 166 162 158 154 151 147 143
Back to Index Back to Data entry
Back to Index Back to Data entry
1 2 3 4 5 6 7 8 9 10 11 12 13 14 15 16 17 18 19 20 21 22 23 24 25 26 27 28 29 30 31139143147151155159163167
+3SD+2SD+1SDMean -1SD-2SD-3SD
Leve
l I:
LDH
in
IU/L
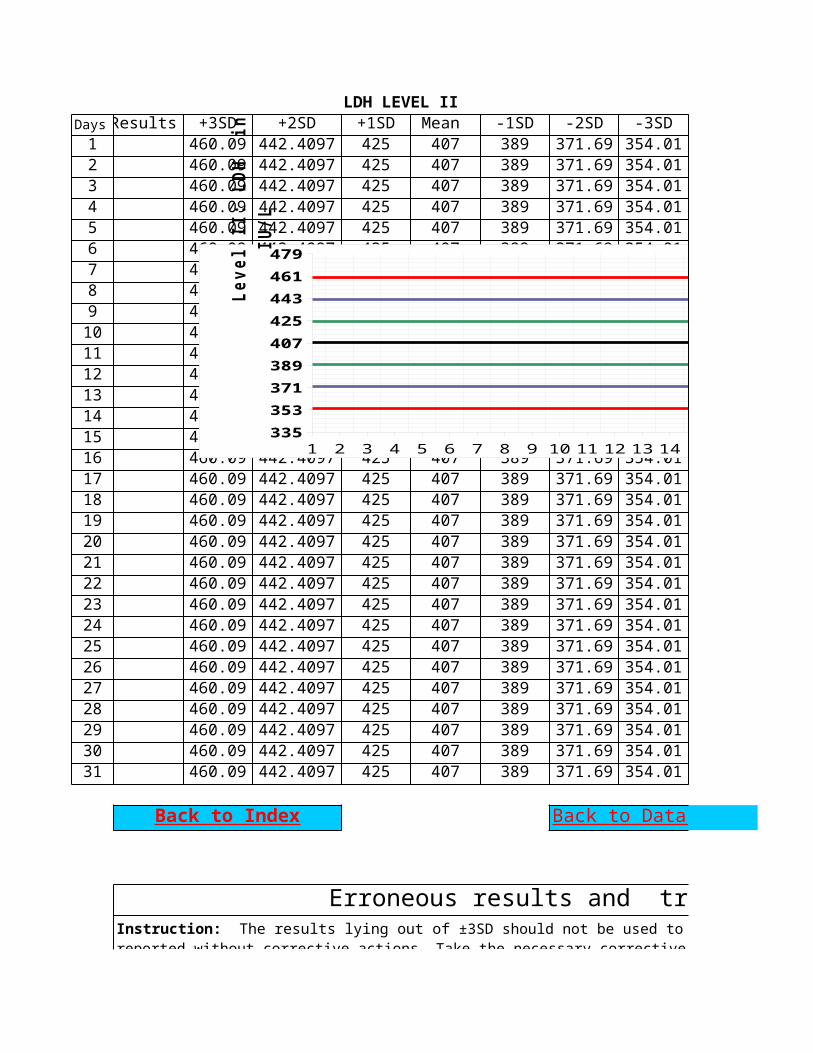
LDH LEVEL IIDays Results +3SD +2SD +1SD Mean -1SD -2SD -3SD1 460.09 442.4097 425 407 389 371.69 354.012 460.09 442.4097 425 407 389 371.69 354.013 460.09 442.4097 425 407 389 371.69 354.014 460.09 442.4097 425 407 389 371.69 354.015 460.09 442.4097 425 407 389 371.69 354.016 460.09 442.4097 425 407 389 371.69 354.017 460.09 442.4097 425 407 389 371.69 354.018 460.09 442.4097 425 407 389 371.69 354.019 460.09 442.4097 425 407 389 371.69 354.0110 460.09 442.4097 425 407 389 371.69 354.0111 460.09 442.4097 425 407 389 371.69 354.0112 460.09 442.4097 425 407 389 371.69 354.0113 460.09 442.4097 425 407 389 371.69 354.0114 460.09 442.4097 425 407 389 371.69 354.0115 460.09 442.4097 425 407 389 371.69 354.0116 460.09 442.4097 425 407 389 371.69 354.0117 460.09 442.4097 425 407 389 371.69 354.0118 460.09 442.4097 425 407 389 371.69 354.0119 460.09 442.4097 425 407 389 371.69 354.0120 460.09 442.4097 425 407 389 371.69 354.0121 460.09 442.4097 425 407 389 371.69 354.0122 460.09 442.4097 425 407 389 371.69 354.0123 460.09 442.4097 425 407 389 371.69 354.0124 460.09 442.4097 425 407 389 371.69 354.0125 460.09 442.4097 425 407 389 371.69 354.0126 460.09 442.4097 425 407 389 371.69 354.0127 460.09 442.4097 425 407 389 371.69 354.0128 460.09 442.4097 425 407 389 371.69 354.0129 460.09 442.4097 425 407 389 371.69 354.0130 460.09 442.4097 425 407 389 371.69 354.0131 460.09 442.4097 425 407 389 371.69 354.01
Erroneous results and trouble shooting
Back to Index Back to Data entry
Instruction: The results lying out of ±3SD should not be used to plot the LJ charts and the results can not be reported without corrective actions. Take the necessary corrective actions and fill in the following table. The
1 2 3 4 5 6 7 8 9 10 11 12 13 14 15 16 17 18 19 20 21 22 23 24 25 26 27 28 29 30 31335353371389407425443461479
+3SD+2SD+1SDMean -1SD-2SD-3SD
Leve
l II
: LD
H i
n IU
/L
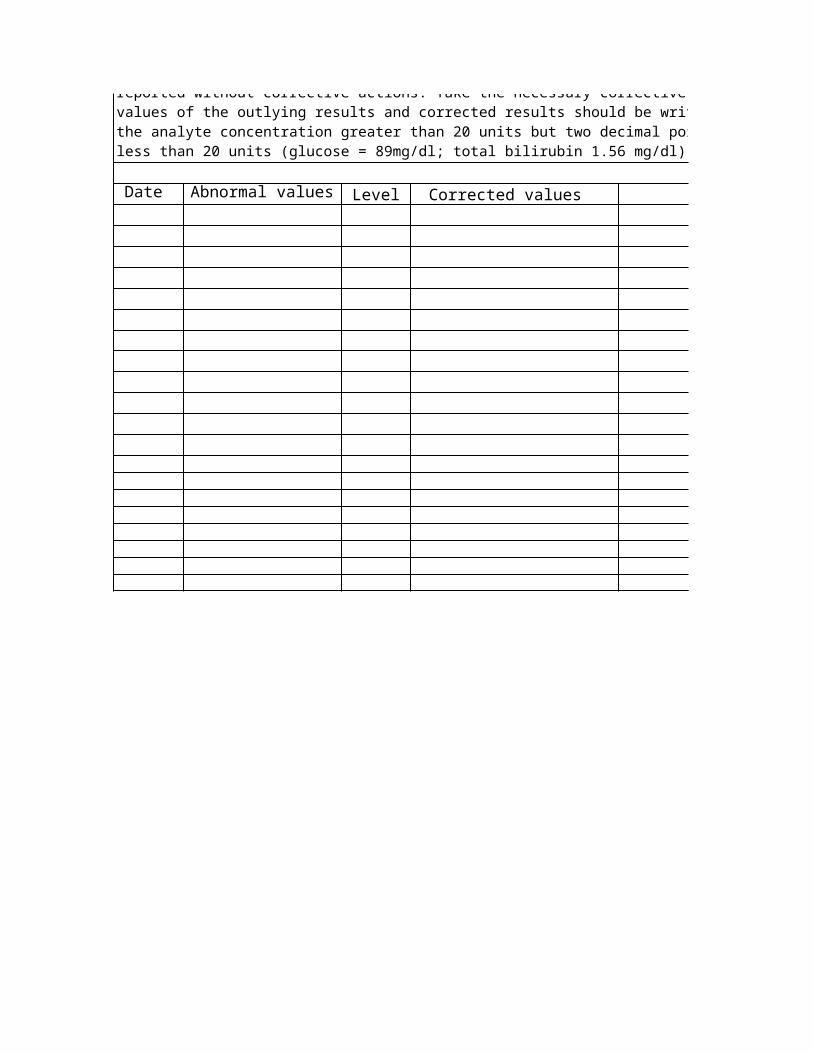
Date Abnormal values Level Corrected values Corrective actions
reported without corrective actions. Take the necessary corrective actions and fill in the following table. The values of the outlying results and corrected results should be writen clearly. No decimal points is required for the analyte concentration greater than 20 units but two decimal points should be used for analyte concentration less than 20 units (glucose = 89mg/dl; total bilirubin 1.56 mg/dl).
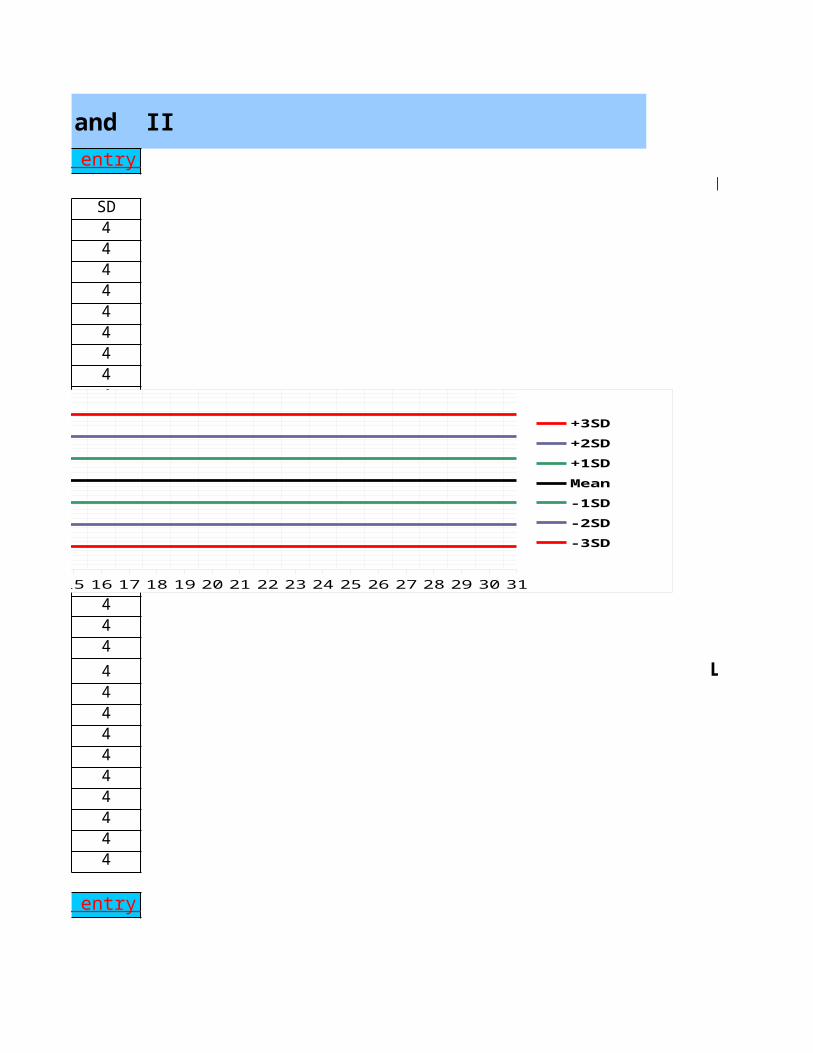
IQC IN BIOCHEMISTRY: Biorad QC Level I and II
LEVEL ISD4444444444444444444444 LEVEL II444444444
Back to Data entry
Back to Data entry
1 2 3 4 5 6 7 8 9 10 11 12 13 14 15 16 17 18 19 20 21 22 23 24 25 26 27 28 29 30 31139143147151155159163167
+3SD+2SD+1SDMean -1SD-2SD-3SD
Leve
l I:
LDH
in
IU/L
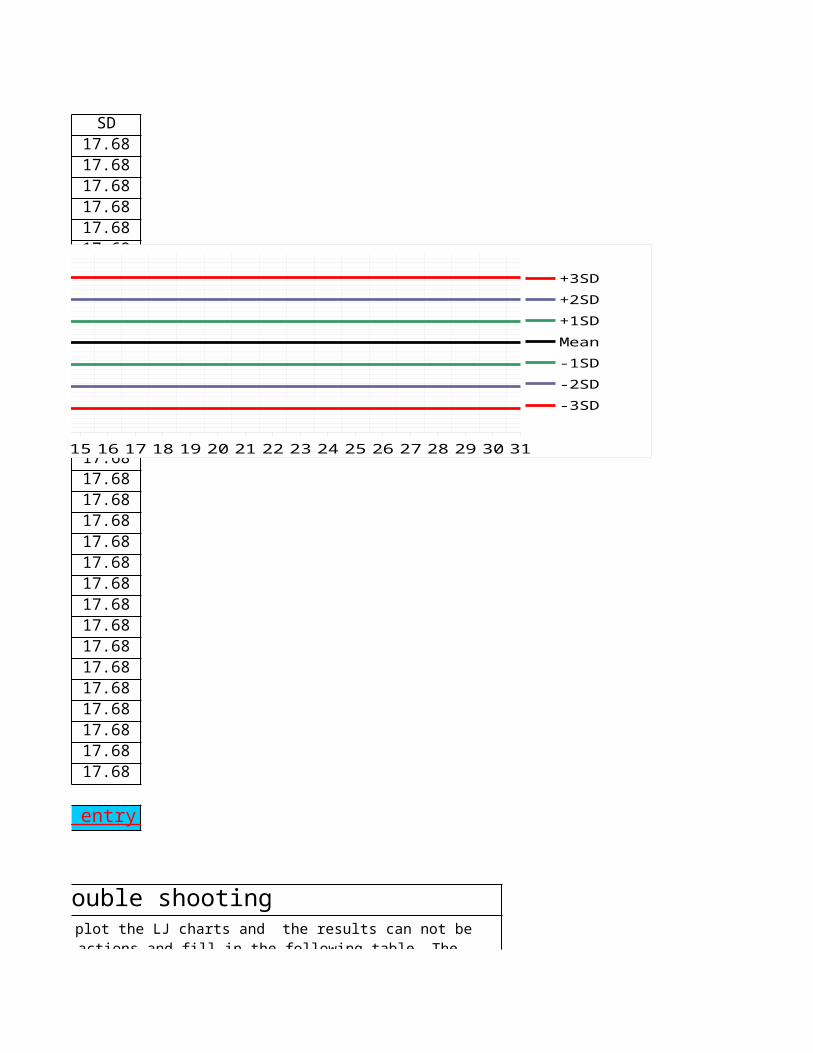
SD17.6817.6817.6817.6817.6817.6817.6817.6817.6817.6817.6817.6817.6817.6817.6817.6817.6817.6817.6817.6817.6817.6817.6817.6817.6817.6817.6817.6817.6817.6817.68
Erroneous results and trouble shooting
Back to Data entry
3SD should not be used to plot the LJ charts and the results can not be reported without corrective actions. Take the necessary corrective actions and fill in the following table. The
1 2 3 4 5 6 7 8 9 10 11 12 13 14 15 16 17 18 19 20 21 22 23 24 25 26 27 28 29 30 31335353371389407425443461479
+3SD+2SD+1SDMean -1SD-2SD-3SD
Leve
l II
: LD
H i
n IU
/L
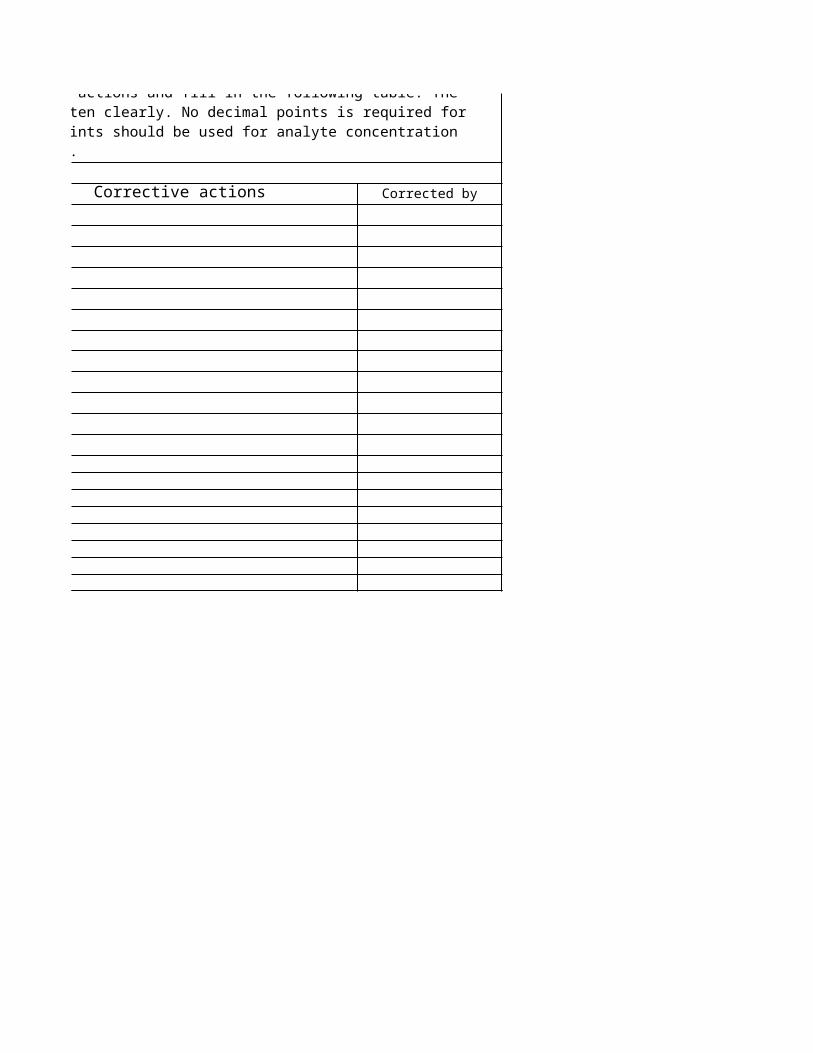
Corrective actions Corrected by
reported without corrective actions. Take the necessary corrective actions and fill in the following table. The values of the outlying results and corrected results should be writen clearly. No decimal points is required for the analyte concentration greater than 20 units but two decimal points should be used for analyte concentration less than 20 units (glucose = 89mg/dl; total bilirubin 1.56 mg/dl).

LEVEL I
LEVEL II
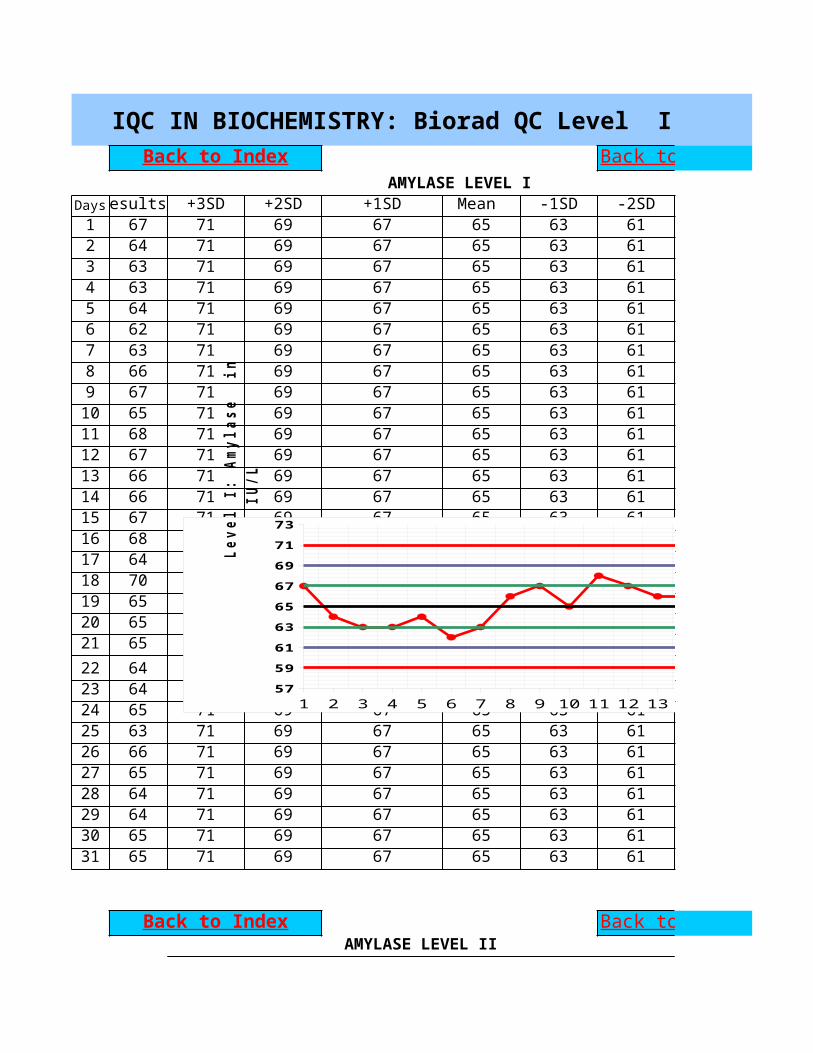
IQC IN BIOCHEMISTRY: Biorad QC Level I and II
AMYLASE LEVEL IDaysResults +3SD +2SD +1SD Mean -1SD -2SD1 67 71 69 67 65 63 612 64 71 69 67 65 63 613 63 71 69 67 65 63 614 63 71 69 67 65 63 615 64 71 69 67 65 63 616 62 71 69 67 65 63 617 63 71 69 67 65 63 618 66 71 69 67 65 63 619 67 71 69 67 65 63 6110 65 71 69 67 65 63 6111 68 71 69 67 65 63 6112 67 71 69 67 65 63 6113 66 71 69 67 65 63 6114 66 71 69 67 65 63 6115 67 71 69 67 65 63 6116 68 71 69 67 65 63 6117 64 71 69 67 65 63 6118 70 71 69 67 65 63 6119 65 71 69 67 65 63 6120 65 71 69 67 65 63 6121 65 71 69 67 65 63 6122 64 71 69 67 65 63 6123 64 71 69 67 65 63 6124 65 71 69 67 65 63 6125 63 71 69 67 65 63 6126 66 71 69 67 65 63 6127 65 71 69 67 65 63 6128 64 71 69 67 65 63 6129 64 71 69 67 65 63 6130 65 71 69 67 65 63 6131 65 71 69 67 65 63 61
AMYLASE LEVEL II
Back to Index Back to Data entry
Back to Index Back to Data entry
1 2 3 4 5 6 7 8 9 10 11 12 13 14 15 16 17 18 19 20 21 22 23 24 25 26 27 28 29 30 31575961636567697173
+3SD+2SD+1SDMean -1SD-2SD-3SD
Leve
l I:
Amy
lase
in
IU
/L
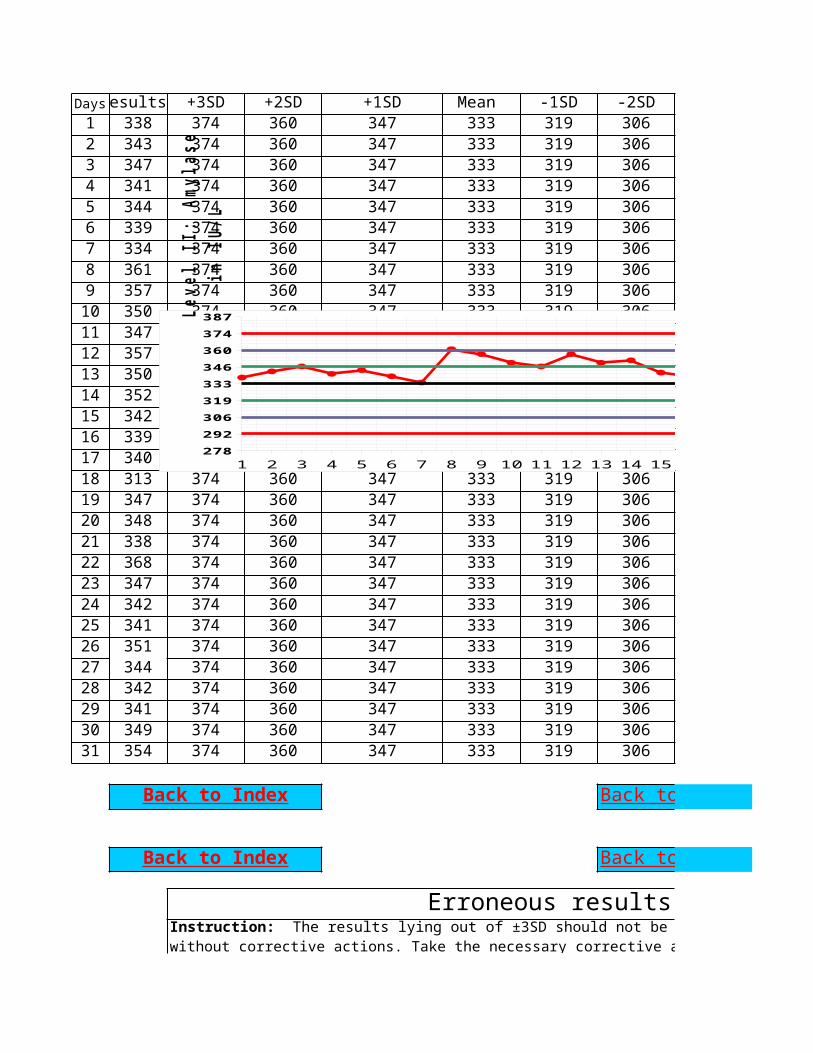
DaysResults +3SD +2SD +1SD Mean -1SD -2SD1 338 374 360 347 333 319 3062 343 374 360 347 333 319 3063 347 374 360 347 333 319 3064 341 374 360 347 333 319 3065 344 374 360 347 333 319 3066 339 374 360 347 333 319 3067 334 374 360 347 333 319 3068 361 374 360 347 333 319 3069 357 374 360 347 333 319 30610 350 374 360 347 333 319 30611 347 374 360 347 333 319 30612 357 374 360 347 333 319 30613 350 374 360 347 333 319 30614 352 374 360 347 333 319 30615 342 374 360 347 333 319 30616 339 374 360 347 333 319 30617 340 374 360 347 333 319 30618 313 374 360 347 333 319 30619 347 374 360 347 333 319 30620 348 374 360 347 333 319 30621 338 374 360 347 333 319 30622 368 374 360 347 333 319 30623 347 374 360 347 333 319 30624 342 374 360 347 333 319 30625 341 374 360 347 333 319 30626 351 374 360 347 333 319 30627 344 374 360 347 333 319 30628 342 374 360 347 333 319 30629 341 374 360 347 333 319 30630 349 374 360 347 333 319 30631 354 374 360 347 333 319 306
Erroneous results and trouble shooting
Back to Index Back to Data entry
Back to Index Back to Data entry
Instruction: The results lying out of ±3SD should not be used to plot the LJ charts and the results can not be reported without corrective actions. Take the necessary corrective actions and fill in the following table. The values of the outlying
1 2 3 4 5 6 7 8 9 10 11 12 13 14 15 16 17 18 19 20 21 22 23 24 25 26 27 28 29 30 31278292306319333346360374387
+3SD+2SD+1SDMean -1SD-2SD-3SD
Leve
l II
: Am
ylas
e
in I
U/L
Date Abnormal values Level Corrected values
without corrective actions. Take the necessary corrective actions and fill in the following table. The values of the outlying results and corrected results should be writen clearly. No decimal points is required for the analyte concentration greater than 20 units but two decimal points should be used for analyte concentration less than 20 units (glucose = 89mg/dl; total bilirubin 1.56 mg/dl).
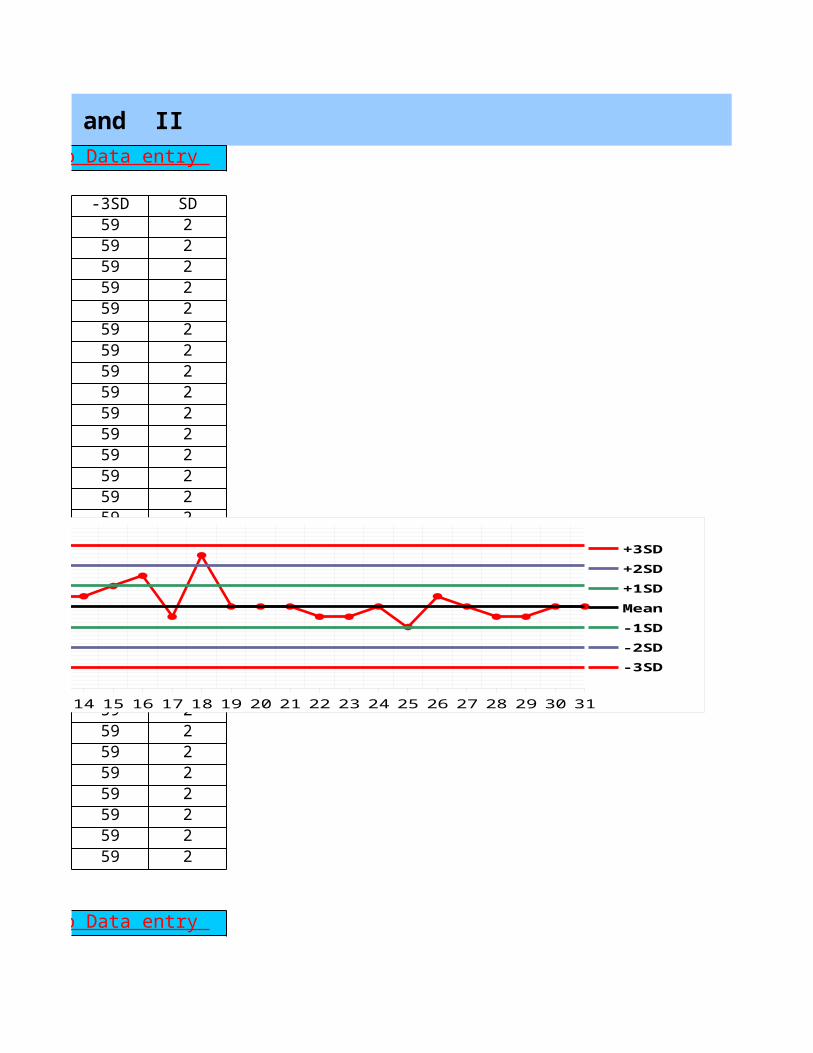
IQC IN BIOCHEMISTRY: Biorad QC Level I and II
AMYLASE LEVEL I-3SD SD59 259 259 259 259 259 259 259 259 259 259 259 259 259 259 259 259 259 259 259 259 259 259 259 259 259 259 259 259 259 259 2
Back to Data entry
Back to Data entry
1 2 3 4 5 6 7 8 9 10 11 12 13 14 15 16 17 18 19 20 21 22 23 24 25 26 27 28 29 30 31575961636567697173
+3SD+2SD+1SDMean -1SD-2SD-3SD
Leve
l I:
Amy
lase
in
IU
/L
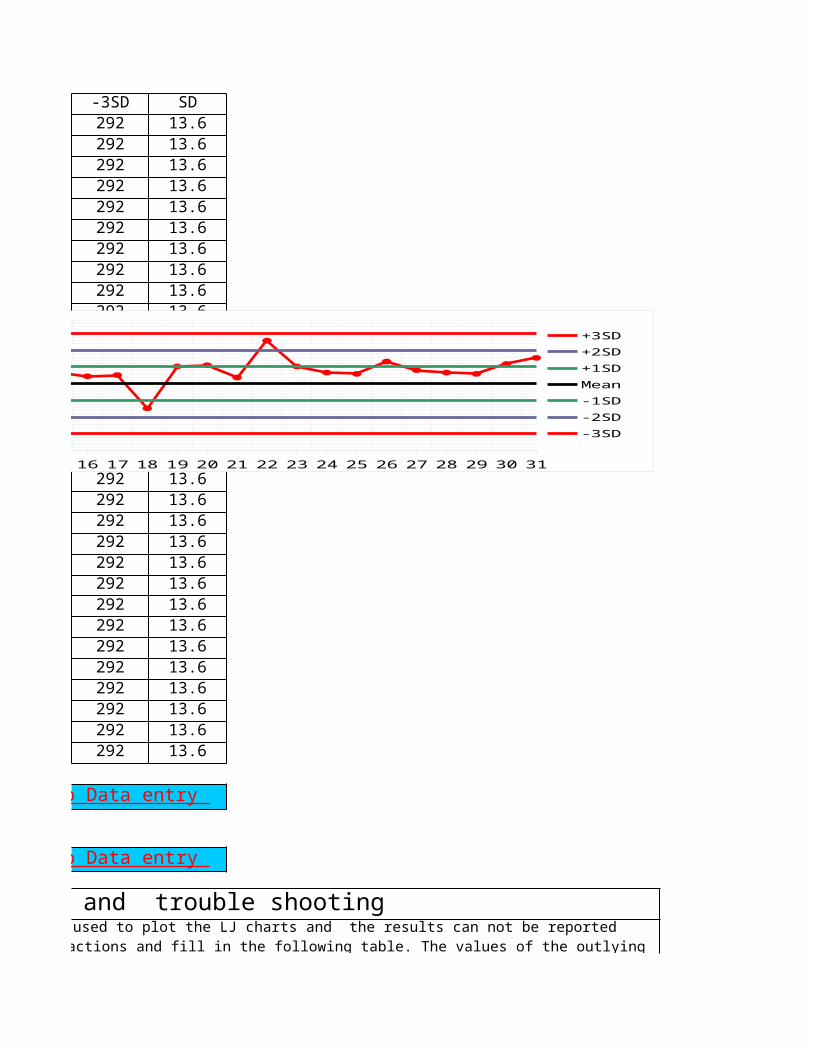
-3SD SD292 13.6292 13.6292 13.6292 13.6292 13.6292 13.6292 13.6292 13.6292 13.6292 13.6292 13.6292 13.6292 13.6292 13.6292 13.6292 13.6292 13.6292 13.6292 13.6292 13.6292 13.6292 13.6292 13.6292 13.6292 13.6292 13.6292 13.6292 13.6292 13.6292 13.6292 13.6
Erroneous results and trouble shooting
Back to Data entry
Back to Data entry
3SD should not be used to plot the LJ charts and the results can not be reported without corrective actions. Take the necessary corrective actions and fill in the following table. The values of the outlying
1 2 3 4 5 6 7 8 9 10 11 12 13 14 15 16 17 18 19 20 21 22 23 24 25 26 27 28 29 30 31278292306319333346360374387
+3SD+2SD+1SDMean -1SD-2SD-3SD
Leve
l II
: Am
ylas
e
in I
U/L
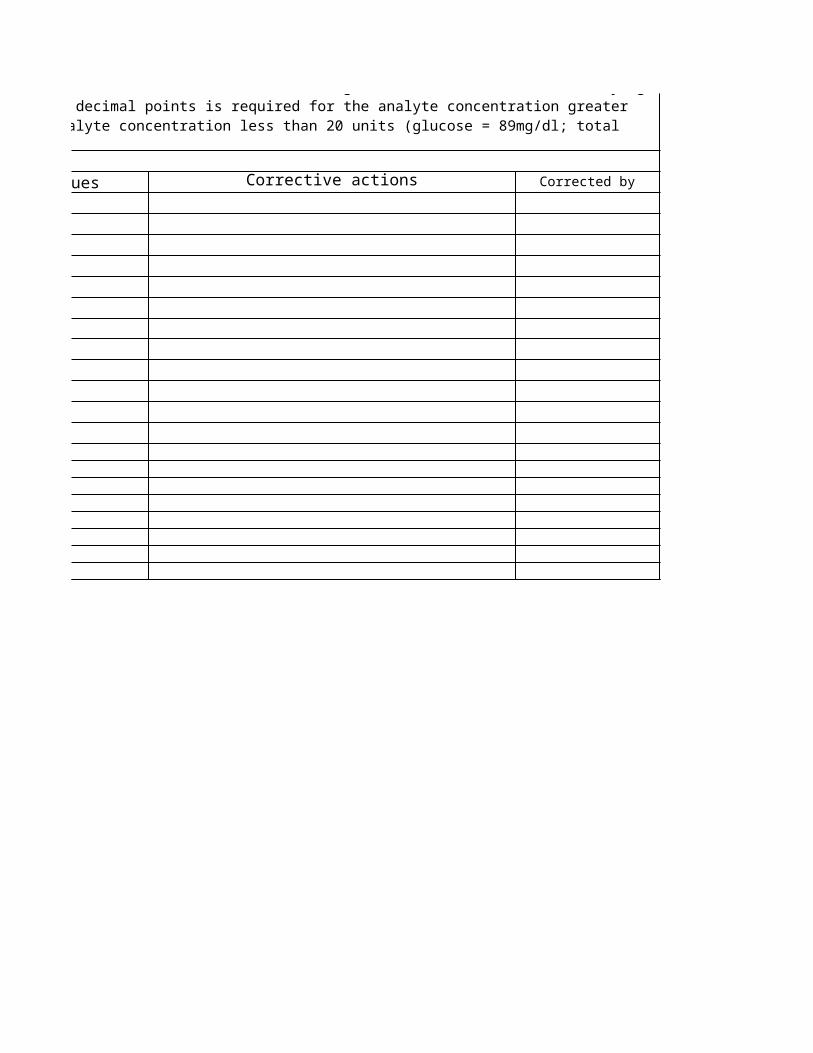
Corrected values Corrective actions Corrected by
without corrective actions. Take the necessary corrective actions and fill in the following table. The values of the outlying results and corrected results should be writen clearly. No decimal points is required for the analyte concentration greater than 20 units but two decimal points should be used for analyte concentration less than 20 units (glucose = 89mg/dl; total

IQC IN BIOCHEMISTRY: Biorad QC Level I and II
LEVEL I
LEVEL II
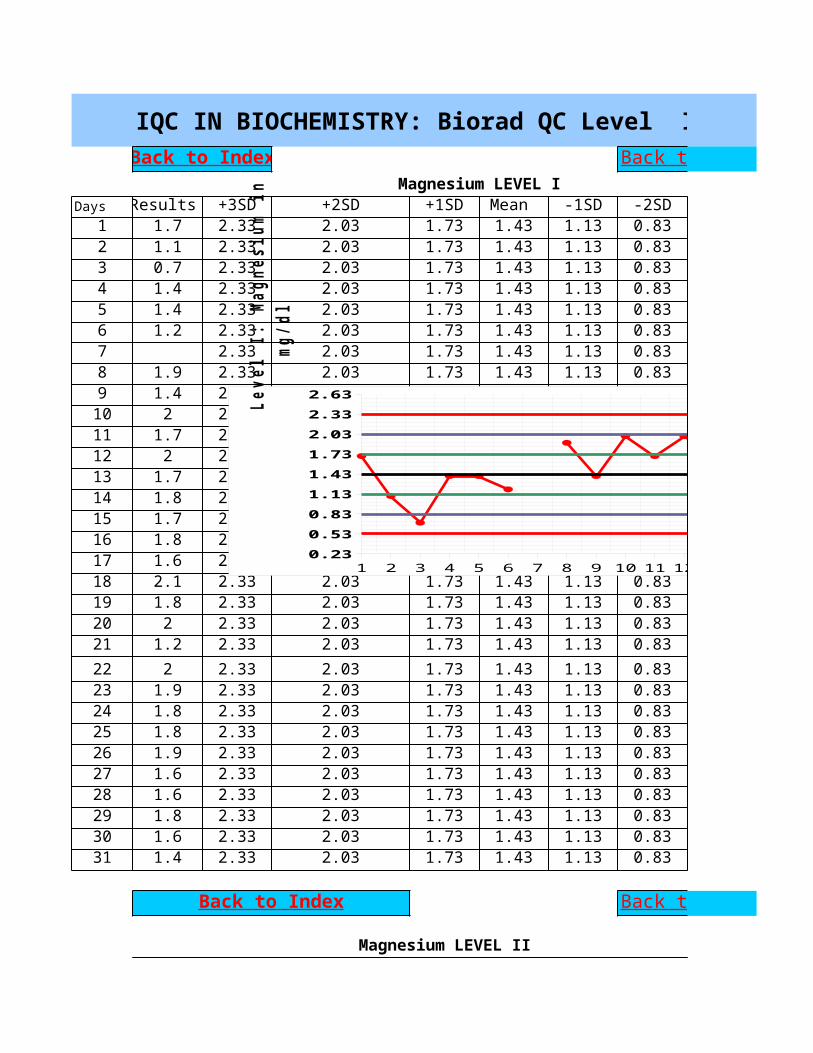
IQC IN BIOCHEMISTRY: Biorad QC Level I and II
Magnesium LEVEL IDays Results +3SD +2SD +1SD Mean -1SD -2SD
1 1.7 2.33 2.03 1.73 1.43 1.13 0.832 1.1 2.33 2.03 1.73 1.43 1.13 0.833 0.7 2.33 2.03 1.73 1.43 1.13 0.834 1.4 2.33 2.03 1.73 1.43 1.13 0.835 1.4 2.33 2.03 1.73 1.43 1.13 0.836 1.2 2.33 2.03 1.73 1.43 1.13 0.837 2.33 2.03 1.73 1.43 1.13 0.838 1.9 2.33 2.03 1.73 1.43 1.13 0.839 1.4 2.33 2.03 1.73 1.43 1.13 0.8310 2 2.33 2.03 1.73 1.43 1.13 0.8311 1.7 2.33 2.03 1.73 1.43 1.13 0.8312 2 2.33 2.03 1.73 1.43 1.13 0.8313 1.7 2.33 2.03 1.73 1.43 1.13 0.8314 1.8 2.33 2.03 1.73 1.43 1.13 0.8315 1.7 2.33 2.03 1.73 1.43 1.13 0.8316 1.8 2.33 2.03 1.73 1.43 1.13 0.8317 1.6 2.33 2.03 1.73 1.43 1.13 0.8318 2.1 2.33 2.03 1.73 1.43 1.13 0.8319 1.8 2.33 2.03 1.73 1.43 1.13 0.8320 2 2.33 2.03 1.73 1.43 1.13 0.8321 1.2 2.33 2.03 1.73 1.43 1.13 0.8322 2 2.33 2.03 1.73 1.43 1.13 0.8323 1.9 2.33 2.03 1.73 1.43 1.13 0.8324 1.8 2.33 2.03 1.73 1.43 1.13 0.8325 1.8 2.33 2.03 1.73 1.43 1.13 0.8326 1.9 2.33 2.03 1.73 1.43 1.13 0.8327 1.6 2.33 2.03 1.73 1.43 1.13 0.8328 1.6 2.33 2.03 1.73 1.43 1.13 0.8329 1.8 2.33 2.03 1.73 1.43 1.13 0.8330 1.6 2.33 2.03 1.73 1.43 1.13 0.8331 1.4 2.33 2.03 1.73 1.43 1.13 0.83
Magnesium LEVEL II
Back to Index Back to Data entry
Back to Index Back to Data entry
1 2 3 4 5 6 7 8 9 10 11 12 13 14 15 16 17 18 19 20 21 22 23 24 25 26 27 28 29 30 310.230.530.831.131.431.732.032.332.63
+3SD+2SD+1SDMean -1SD-2SD-3SD
Leve
l I:
Mag
nesi
um i
n mg
/dl
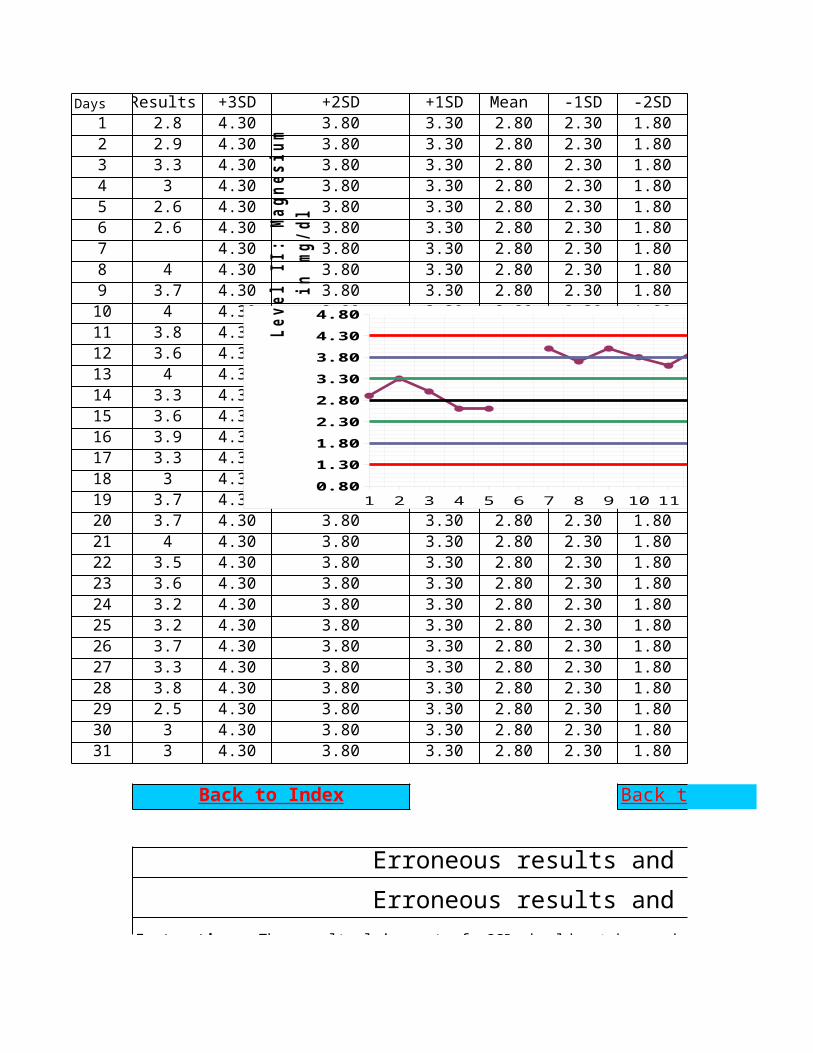
Days Results +3SD +2SD +1SD Mean -1SD -2SD1 2.8 4.30 3.80 3.30 2.80 2.30 1.802 2.9 4.30 3.80 3.30 2.80 2.30 1.803 3.3 4.30 3.80 3.30 2.80 2.30 1.804 3 4.30 3.80 3.30 2.80 2.30 1.805 2.6 4.30 3.80 3.30 2.80 2.30 1.806 2.6 4.30 3.80 3.30 2.80 2.30 1.807 4.30 3.80 3.30 2.80 2.30 1.808 4 4.30 3.80 3.30 2.80 2.30 1.809 3.7 4.30 3.80 3.30 2.80 2.30 1.8010 4 4.30 3.80 3.30 2.80 2.30 1.8011 3.8 4.30 3.80 3.30 2.80 2.30 1.8012 3.6 4.30 3.80 3.30 2.80 2.30 1.8013 4 4.30 3.80 3.30 2.80 2.30 1.8014 3.3 4.30 3.80 3.30 2.80 2.30 1.8015 3.6 4.30 3.80 3.30 2.80 2.30 1.8016 3.9 4.30 3.80 3.30 2.80 2.30 1.8017 3.3 4.30 3.80 3.30 2.80 2.30 1.8018 3 4.30 3.80 3.30 2.80 2.30 1.8019 3.7 4.30 3.80 3.30 2.80 2.30 1.8020 3.7 4.30 3.80 3.30 2.80 2.30 1.8021 4 4.30 3.80 3.30 2.80 2.30 1.8022 3.5 4.30 3.80 3.30 2.80 2.30 1.8023 3.6 4.30 3.80 3.30 2.80 2.30 1.8024 3.2 4.30 3.80 3.30 2.80 2.30 1.8025 3.2 4.30 3.80 3.30 2.80 2.30 1.8026 3.7 4.30 3.80 3.30 2.80 2.30 1.8027 3.3 4.30 3.80 3.30 2.80 2.30 1.8028 3.8 4.30 3.80 3.30 2.80 2.30 1.8029 2.5 4.30 3.80 3.30 2.80 2.30 1.8030 3 4.30 3.80 3.30 2.80 2.30 1.8031 3 4.30 3.80 3.30 2.80 2.30 1.80
Erroneous results and trouble shooting Erroneous results and trouble shooting
Back to Index Back to Data entry
Instruction: The results lying out of ±3SD should not be used to plot the LJ charts and the results can not be reported without corrective actions. Take the necessary corrective actions and fill in the following table. The values of the outlying results and corrected results should be writen clearly. No decimal points is required for the analyte concentration greater than 20 units but two decimal points should be used for analyte concentration less than 20 units (glucose = 89mg/dl; total bilirubin 1.56 mg/dl).
1 2 3 4 5 6 7 8 9 10 11 12 13 14 15 16 17 18 19 20 21 22 23 24 25 26 27 28 29 300.801.301.802.302.803.303.804.304.80
+3SD+2SD+1SDMean -1SD-2SD-3SD
Leve
l II
: Ma
gnes
ium
in
mg/
dl
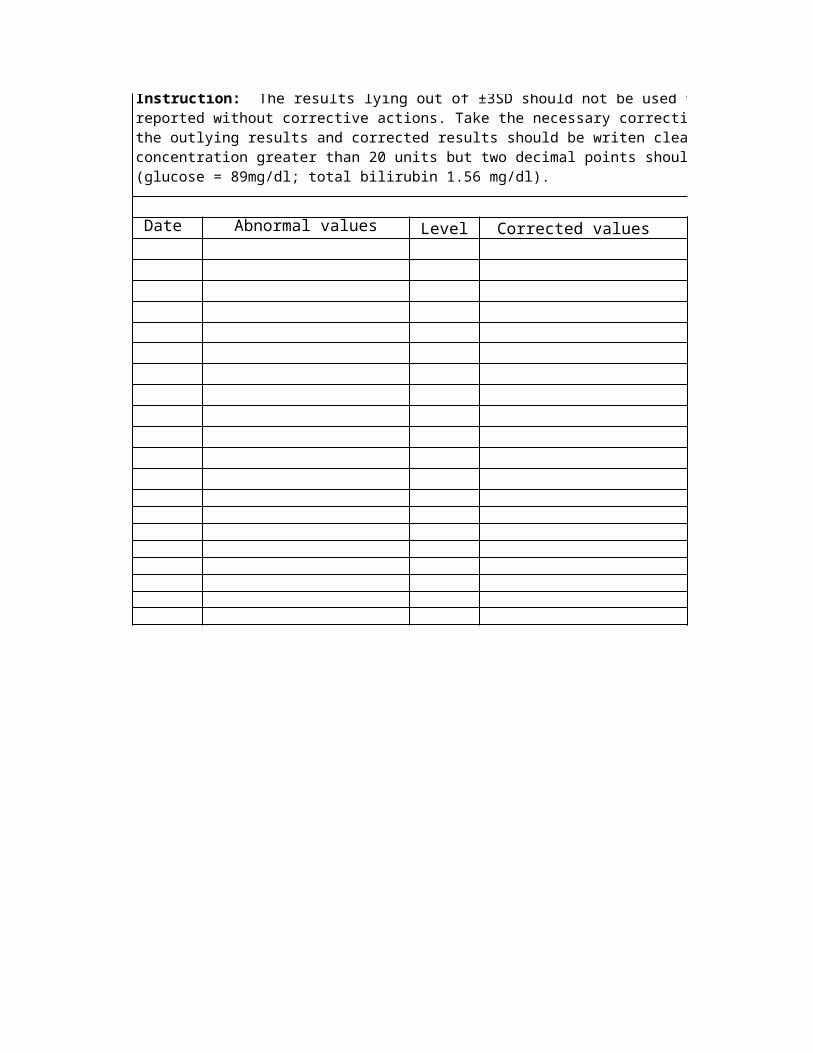
Date Abnormal values Level Corrected values
Instruction: The results lying out of ±3SD should not be used to plot the LJ charts and the results can not be reported without corrective actions. Take the necessary corrective actions and fill in the following table. The values of the outlying results and corrected results should be writen clearly. No decimal points is required for the analyte concentration greater than 20 units but two decimal points should be used for analyte concentration less than 20 units (glucose = 89mg/dl; total bilirubin 1.56 mg/dl).
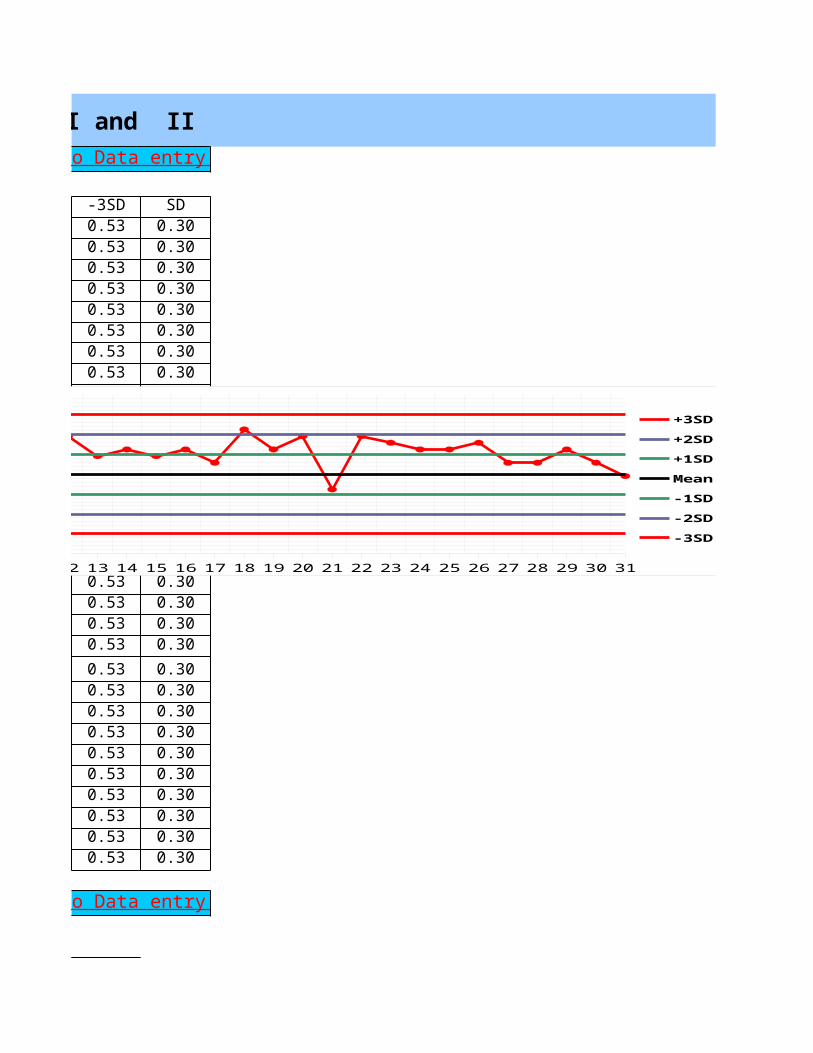
IQC IN BIOCHEMISTRY: Biorad QC Level I and II
Magnesium LEVEL I-3SD SD0.53 0.300.53 0.300.53 0.300.53 0.300.53 0.300.53 0.300.53 0.300.53 0.300.53 0.300.53 0.300.53 0.300.53 0.300.53 0.300.53 0.300.53 0.300.53 0.300.53 0.300.53 0.300.53 0.300.53 0.300.53 0.300.53 0.300.53 0.300.53 0.300.53 0.300.53 0.300.53 0.300.53 0.300.53 0.300.53 0.300.53 0.30
Magnesium LEVEL II
Back to Data entry
Back to Data entry
1 2 3 4 5 6 7 8 9 10 11 12 13 14 15 16 17 18 19 20 21 22 23 24 25 26 27 28 29 30 310.230.530.831.131.431.732.032.332.63
+3SD+2SD+1SDMean -1SD-2SD-3SD
Leve
l I:
Mag
nesi
um i
n mg
/dl
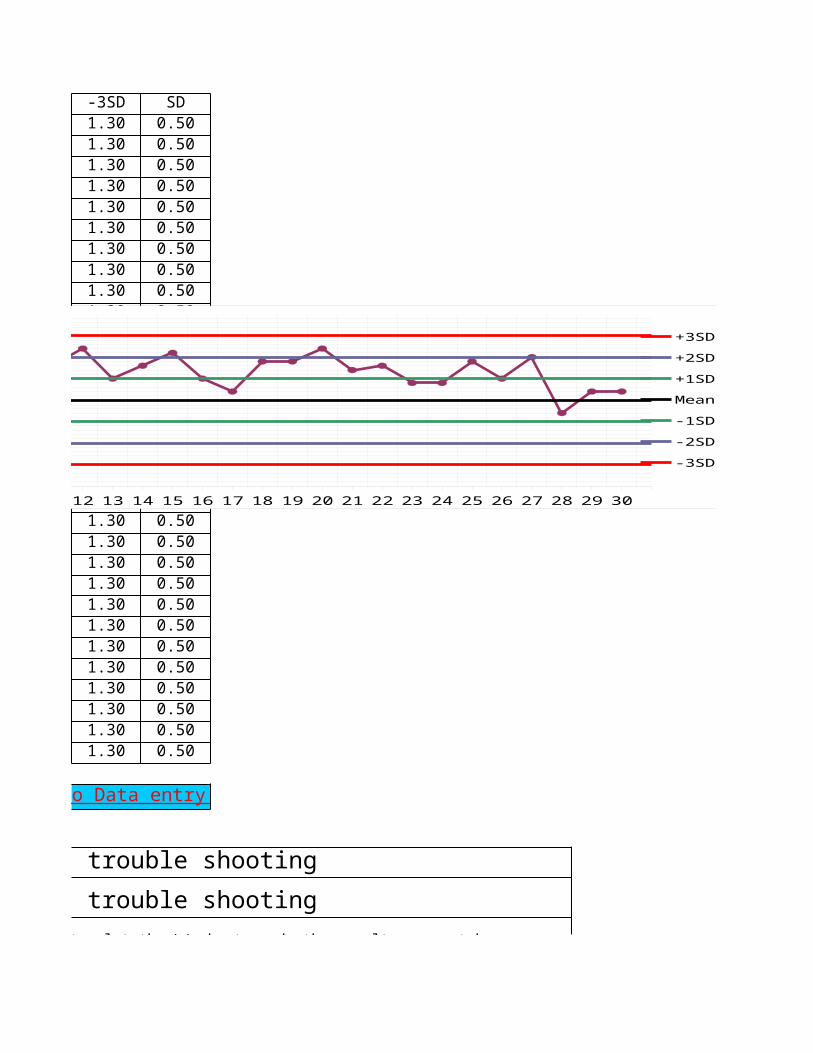
-3SD SD1.30 0.501.30 0.501.30 0.501.30 0.501.30 0.501.30 0.501.30 0.501.30 0.501.30 0.501.30 0.501.30 0.501.30 0.501.30 0.501.30 0.501.30 0.501.30 0.501.30 0.501.30 0.501.30 0.501.30 0.501.30 0.501.30 0.501.30 0.501.30 0.501.30 0.501.30 0.501.30 0.501.30 0.501.30 0.501.30 0.501.30 0.50
Erroneous results and trouble shooting Erroneous results and trouble shooting
Back to Data entry
3SD should not be used to plot the LJ charts and the results can not be reported without corrective actions. Take the necessary corrective actions and fill in the following table. The values of the outlying results and corrected results should be writen clearly. No decimal points is required for the analyte concentration greater than 20 units but two decimal points should be used for analyte concentration less than 20 units
1 2 3 4 5 6 7 8 9 10 11 12 13 14 15 16 17 18 19 20 21 22 23 24 25 26 27 28 29 300.801.301.802.302.803.303.804.304.80
+3SD+2SD+1SDMean -1SD-2SD-3SD
Leve
l II
: Ma
gnes
ium
in
mg/
dl
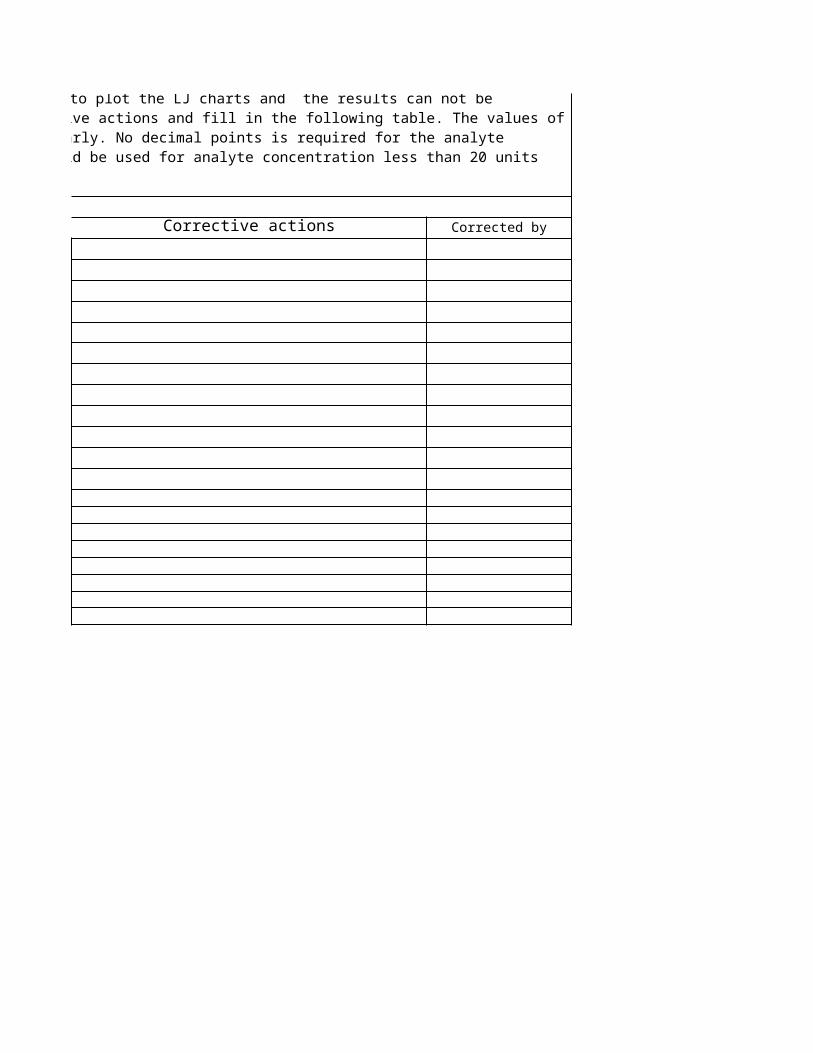
Corrective actions Corrected by
3SD should not be used to plot the LJ charts and the results can not be reported without corrective actions. Take the necessary corrective actions and fill in the following table. The values of the outlying results and corrected results should be writen clearly. No decimal points is required for the analyte concentration greater than 20 units but two decimal points should be used for analyte concentration less than 20 units
IQC IN BIOCHEMISTRY: Biorad QC Level I and II
LEVEL I
LEVEL II
1 2 3 4 5 6 7 8 9 10 11 12 13 14 15 16 17 18 19 20 21 22 23 24 25 26 27 28 29 30 310.230.530.831.131.431.732.032.332.63
+3SD+2SD+1SDMean -1SD-2SD-3SD
Leve
l I:
Mag
nesi
um i
n mg
/dl

1 2 3 4 5 6 7 8 9 10 11 12 13 14 15 16 17 18 19 20 21 22 23 24 25 26 27 28 29 300.801.301.802.302.803.303.804.304.80
+3SD+2SD+1SDMean -1SD-2SD-3SD
Leve
l II
: Ma
gnes
ium
in
mg/
dl
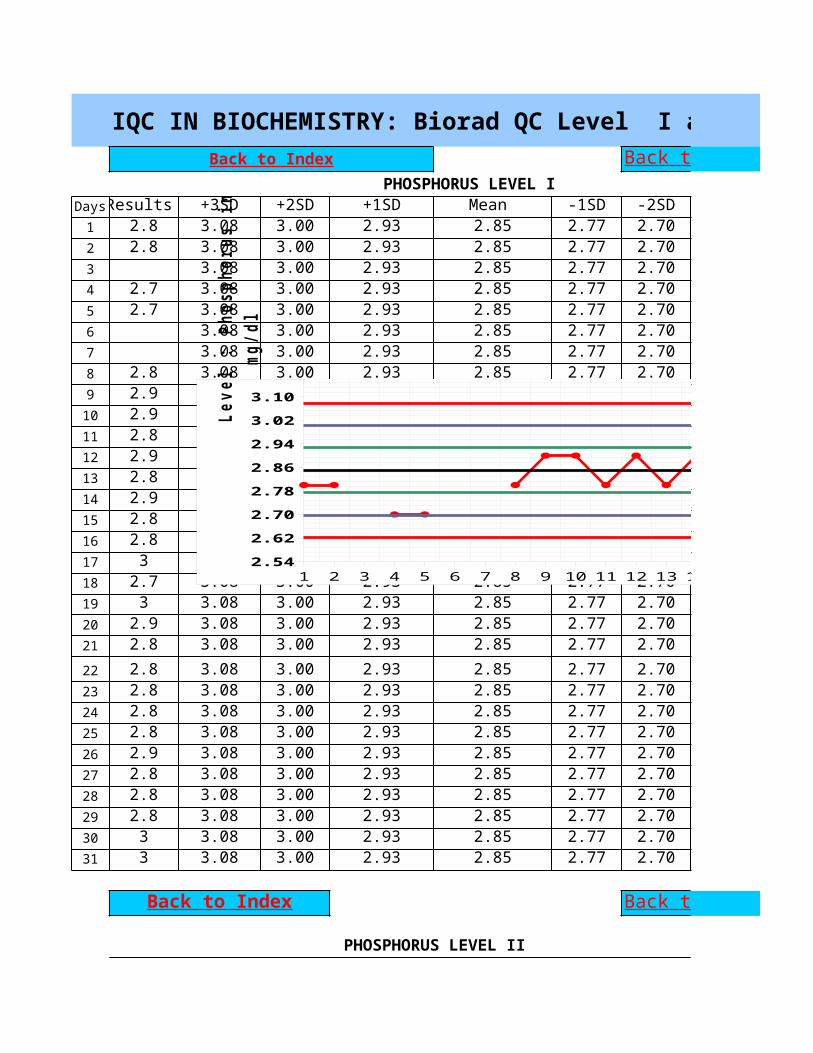
IQC IN BIOCHEMISTRY: Biorad QC Level I and II
PHOSPHORUS LEVEL IDaysResults +3SD +2SD +1SD Mean -1SD -2SD1 2.8 3.08 3.00 2.93 2.85 2.77 2.702 2.8 3.08 3.00 2.93 2.85 2.77 2.703 3.08 3.00 2.93 2.85 2.77 2.704 2.7 3.08 3.00 2.93 2.85 2.77 2.705 2.7 3.08 3.00 2.93 2.85 2.77 2.706 3.08 3.00 2.93 2.85 2.77 2.707 3.08 3.00 2.93 2.85 2.77 2.708 2.8 3.08 3.00 2.93 2.85 2.77 2.709 2.9 3.08 3.00 2.93 2.85 2.77 2.7010 2.9 3.08 3.00 2.93 2.85 2.77 2.7011 2.8 3.08 3.00 2.93 2.85 2.77 2.7012 2.9 3.08 3.00 2.93 2.85 2.77 2.7013 2.8 3.08 3.00 2.93 2.85 2.77 2.7014 2.9 3.08 3.00 2.93 2.85 2.77 2.7015 2.8 3.08 3.00 2.93 2.85 2.77 2.7016 2.8 3.08 3.00 2.93 2.85 2.77 2.7017 3 3.08 3.00 2.93 2.85 2.77 2.7018 2.7 3.08 3.00 2.93 2.85 2.77 2.7019 3 3.08 3.00 2.93 2.85 2.77 2.7020 2.9 3.08 3.00 2.93 2.85 2.77 2.7021 2.8 3.08 3.00 2.93 2.85 2.77 2.7022 2.8 3.08 3.00 2.93 2.85 2.77 2.7023 2.8 3.08 3.00 2.93 2.85 2.77 2.7024 2.8 3.08 3.00 2.93 2.85 2.77 2.7025 2.8 3.08 3.00 2.93 2.85 2.77 2.7026 2.9 3.08 3.00 2.93 2.85 2.77 2.7027 2.8 3.08 3.00 2.93 2.85 2.77 2.7028 2.8 3.08 3.00 2.93 2.85 2.77 2.7029 2.8 3.08 3.00 2.93 2.85 2.77 2.7030 3 3.08 3.00 2.93 2.85 2.77 2.7031 3 3.08 3.00 2.93 2.85 2.77 2.70
PHOSPHORUS LEVEL II
Back to Index Back to Data entry
Back to Index Back to Data entry
1 2 3 4 5 6 7 8 9 10 11 12 13 14 15 16 17 18 19 20 21 22 23 24 25 26 27 28 29 30 312.542.622.702.782.862.943.023.10
+3SD+2SD+1SDMean -1SD-2SD-3SD
Leve
l :
Phos
phor
us i
n mg
/dl
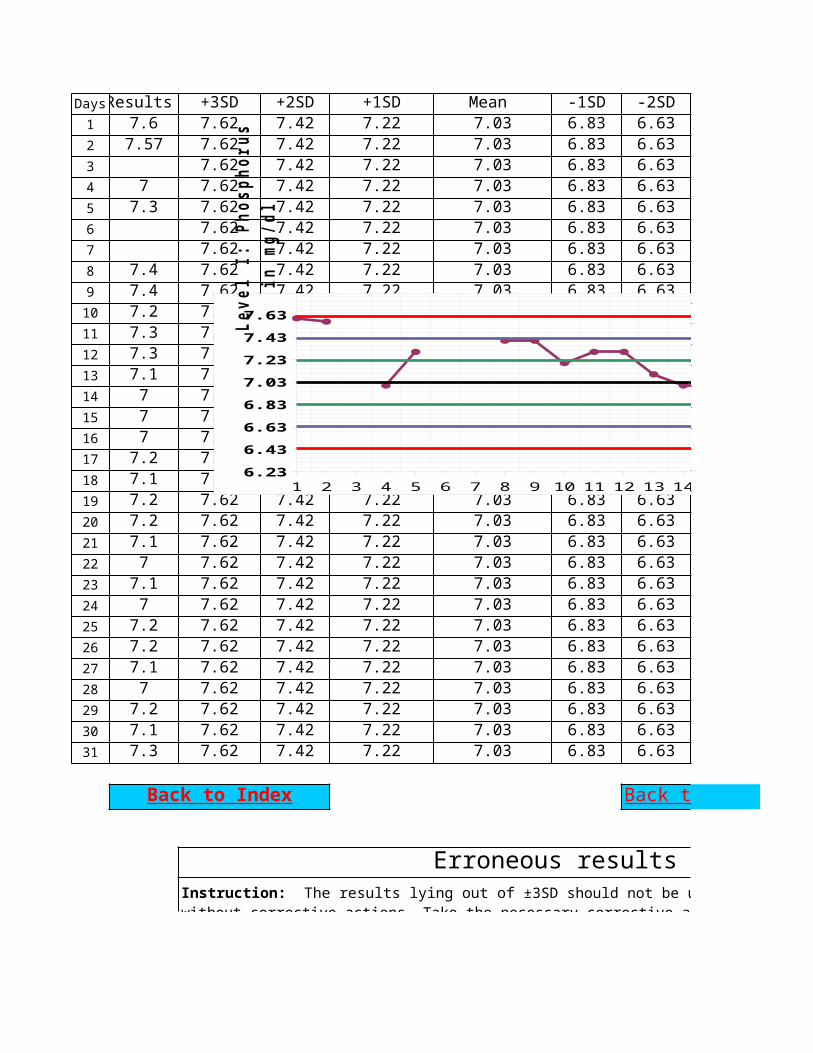
DaysResults +3SD +2SD +1SD Mean -1SD -2SD1 7.6 7.62 7.42 7.22 7.03 6.83 6.632 7.57 7.62 7.42 7.22 7.03 6.83 6.633 7.62 7.42 7.22 7.03 6.83 6.634 7 7.62 7.42 7.22 7.03 6.83 6.635 7.3 7.62 7.42 7.22 7.03 6.83 6.636 7.62 7.42 7.22 7.03 6.83 6.637 7.62 7.42 7.22 7.03 6.83 6.638 7.4 7.62 7.42 7.22 7.03 6.83 6.639 7.4 7.62 7.42 7.22 7.03 6.83 6.6310 7.2 7.62 7.42 7.22 7.03 6.83 6.6311 7.3 7.62 7.42 7.22 7.03 6.83 6.6312 7.3 7.62 7.42 7.22 7.03 6.83 6.6313 7.1 7.62 7.42 7.22 7.03 6.83 6.6314 7 7.62 7.42 7.22 7.03 6.83 6.6315 7 7.62 7.42 7.22 7.03 6.83 6.6316 7 7.62 7.42 7.22 7.03 6.83 6.6317 7.2 7.62 7.42 7.22 7.03 6.83 6.6318 7.1 7.62 7.42 7.22 7.03 6.83 6.6319 7.2 7.62 7.42 7.22 7.03 6.83 6.6320 7.2 7.62 7.42 7.22 7.03 6.83 6.6321 7.1 7.62 7.42 7.22 7.03 6.83 6.6322 7 7.62 7.42 7.22 7.03 6.83 6.6323 7.1 7.62 7.42 7.22 7.03 6.83 6.6324 7 7.62 7.42 7.22 7.03 6.83 6.6325 7.2 7.62 7.42 7.22 7.03 6.83 6.6326 7.2 7.62 7.42 7.22 7.03 6.83 6.6327 7.1 7.62 7.42 7.22 7.03 6.83 6.6328 7 7.62 7.42 7.22 7.03 6.83 6.6329 7.2 7.62 7.42 7.22 7.03 6.83 6.6330 7.1 7.62 7.42 7.22 7.03 6.83 6.6331 7.3 7.62 7.42 7.22 7.03 6.83 6.63
Erroneous results and trouble shooting
Back to Index Back to Data entry
Instruction: The results lying out of ±3SD should not be used to plot the LJ charts and the results can not be reported without corrective actions. Take the necessary corrective actions and fill in the following table. The values of the outlying results and corrected results should be writen clearly. No decimal points is required for the analyte concentration greater than 20 units but two decimal points should be used for analyte concentration less than 20 units (glucose = 89mg/dl; total bilirubin 1.56 mg/dl).
1 2 3 4 5 6 7 8 9 10 11 12 13 14 15 16 17 18 19 20 21 22 23 24 25 26 27 28 29 30 316.236.436.636.837.037.237.437.63
+3SD+2SD+1SDMean -1SD-2SD-3SD
Leve
l I:
Pho
spho
rus
in
mg/
dl
Date Abnormal values Level Corrected values 2/8/2013
Instruction: The results lying out of ±3SD should not be used to plot the LJ charts and the results can not be reported without corrective actions. Take the necessary corrective actions and fill in the following table. The values of the outlying results and corrected results should be writen clearly. No decimal points is required for the analyte concentration greater than 20 units but two decimal points should be used for analyte concentration less than 20 units (glucose = 89mg/dl; total bilirubin 1.56 mg/dl).
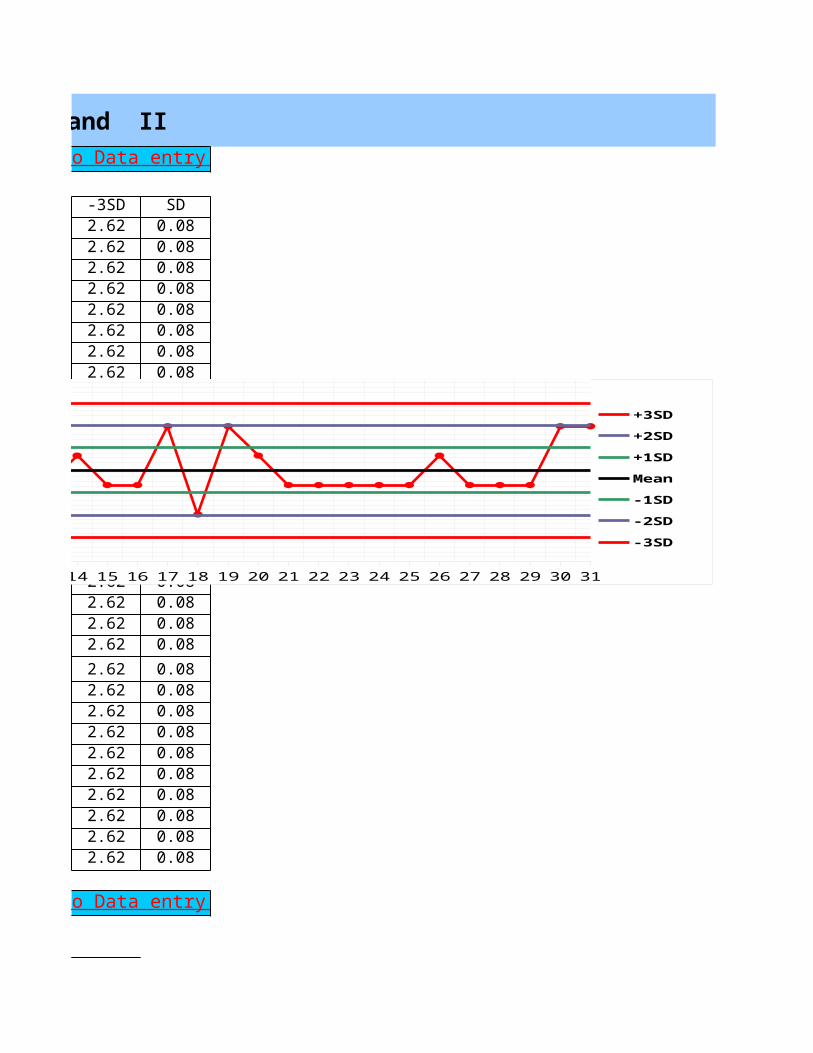
IQC IN BIOCHEMISTRY: Biorad QC Level I and II
PHOSPHORUS LEVEL I-3SD SD2.62 0.082.62 0.082.62 0.082.62 0.082.62 0.082.62 0.082.62 0.082.62 0.082.62 0.082.62 0.082.62 0.082.62 0.082.62 0.082.62 0.082.62 0.082.62 0.082.62 0.082.62 0.082.62 0.082.62 0.082.62 0.082.62 0.082.62 0.082.62 0.082.62 0.082.62 0.082.62 0.082.62 0.082.62 0.082.62 0.082.62 0.08
PHOSPHORUS LEVEL II
Back to Data entry
Back to Data entry
1 2 3 4 5 6 7 8 9 10 11 12 13 14 15 16 17 18 19 20 21 22 23 24 25 26 27 28 29 30 312.542.622.702.782.862.943.023.10
+3SD+2SD+1SDMean -1SD-2SD-3SD
Leve
l :
Phos
phor
us i
n mg
/dl
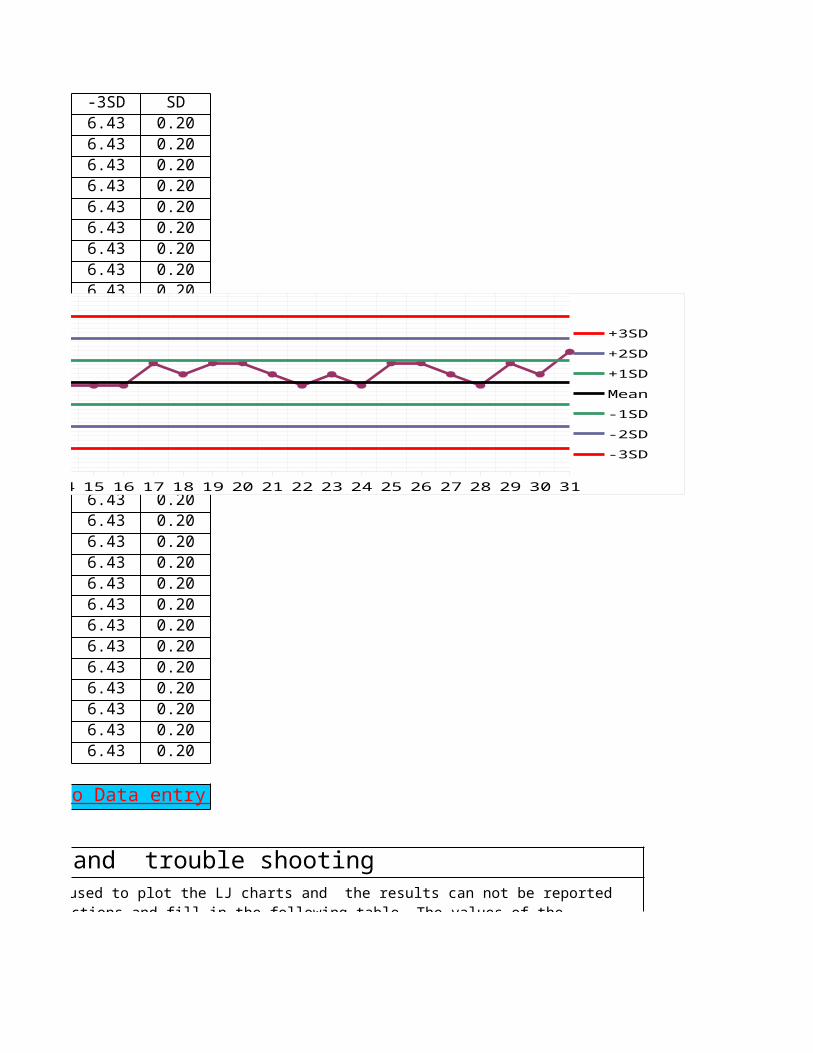
-3SD SD6.43 0.206.43 0.206.43 0.206.43 0.206.43 0.206.43 0.206.43 0.206.43 0.206.43 0.206.43 0.206.43 0.206.43 0.206.43 0.206.43 0.206.43 0.206.43 0.206.43 0.206.43 0.206.43 0.206.43 0.206.43 0.206.43 0.206.43 0.206.43 0.206.43 0.206.43 0.206.43 0.206.43 0.206.43 0.206.43 0.206.43 0.20
Erroneous results and trouble shooting
Back to Data entry
3SD should not be used to plot the LJ charts and the results can not be reported without corrective actions. Take the necessary corrective actions and fill in the following table. The values of the outlying results and corrected results should be writen clearly. No decimal points is required for the analyte concentration greater than 20 units but two decimal points should be used for analyte concentration less than 20 units (glucose = 89mg/dl;
1 2 3 4 5 6 7 8 9 10 11 12 13 14 15 16 17 18 19 20 21 22 23 24 25 26 27 28 29 30 316.236.436.636.837.037.237.437.63
+3SD+2SD+1SDMean -1SD-2SD-3SD
Leve
l I:
Pho
spho
rus
in
mg/
dl
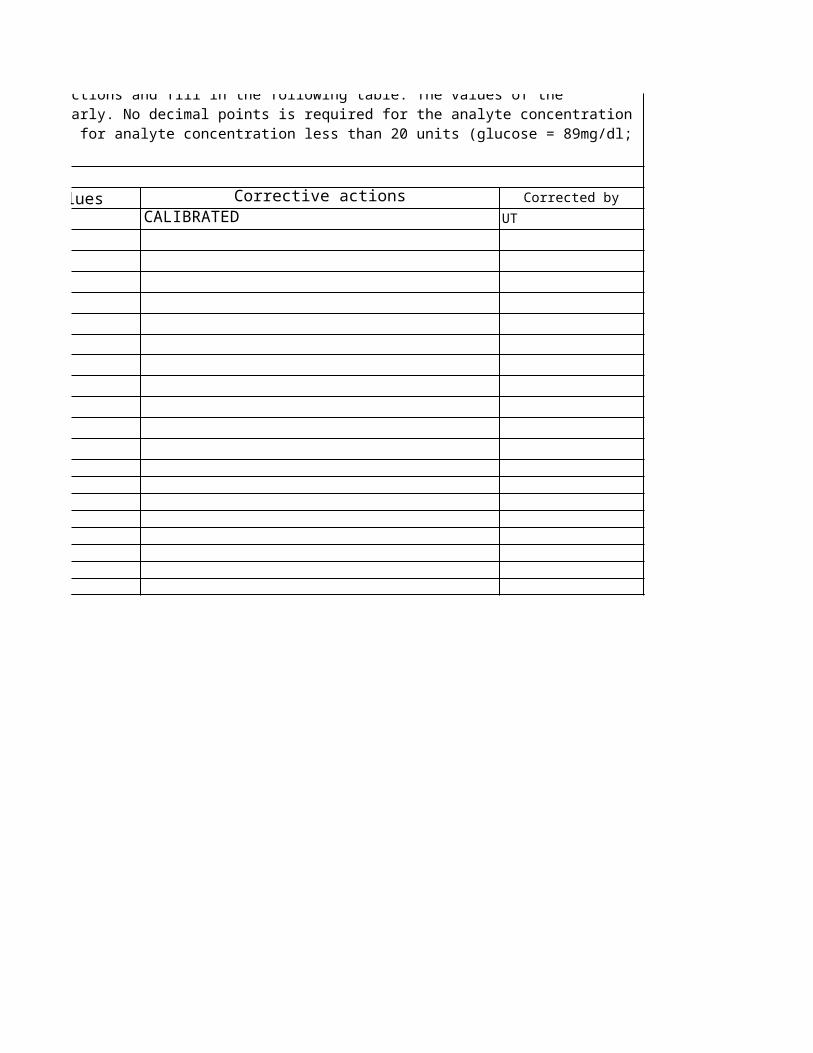
Corrected values Corrective actions Corrected byCALIBRATED UT
3SD should not be used to plot the LJ charts and the results can not be reported without corrective actions. Take the necessary corrective actions and fill in the following table. The values of the outlying results and corrected results should be writen clearly. No decimal points is required for the analyte concentration greater than 20 units but two decimal points should be used for analyte concentration less than 20 units (glucose = 89mg/dl;
IQC IN BIOCHEMISTRY: Biorad QC Level I and II
LEVEL II
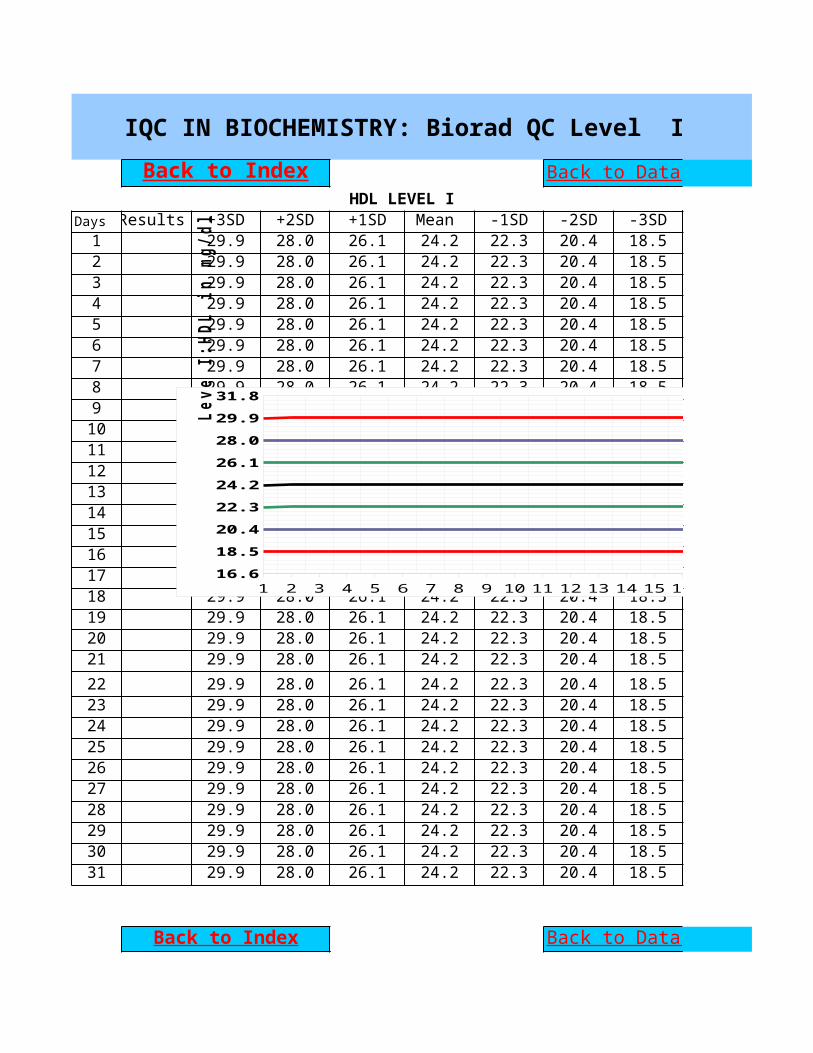
IQC IN BIOCHEMISTRY: Biorad QC Level I and II Back to Index
HDL LEVEL IDays Results +3SD +2SD +1SD Mean -1SD -2SD -3SD1 29.9 28.0 26.1 24.2 22.3 20.4 18.52 29.9 28.0 26.1 24.2 22.3 20.4 18.53 29.9 28.0 26.1 24.2 22.3 20.4 18.54 29.9 28.0 26.1 24.2 22.3 20.4 18.55 29.9 28.0 26.1 24.2 22.3 20.4 18.56 29.9 28.0 26.1 24.2 22.3 20.4 18.57 29.9 28.0 26.1 24.2 22.3 20.4 18.58 29.9 28.0 26.1 24.2 22.3 20.4 18.59 29.9 28.0 26.1 24.2 22.3 20.4 18.510 29.9 28.0 26.1 24.2 22.3 20.4 18.511 29.9 28.0 26.1 24.2 22.3 20.4 18.512 29.9 28.0 26.1 24.2 22.3 20.4 18.513 29.9 28.0 26.1 24.2 22.3 20.4 18.514 29.9 28.0 26.1 24.2 22.3 20.4 18.515 29.9 28.0 26.1 24.2 22.3 20.4 18.516 29.9 28.0 26.1 24.2 22.3 20.4 18.517 29.9 28.0 26.1 24.2 22.3 20.4 18.518 29.9 28.0 26.1 24.2 22.3 20.4 18.519 29.9 28.0 26.1 24.2 22.3 20.4 18.520 29.9 28.0 26.1 24.2 22.3 20.4 18.521 29.9 28.0 26.1 24.2 22.3 20.4 18.522 29.9 28.0 26.1 24.2 22.3 20.4 18.523 29.9 28.0 26.1 24.2 22.3 20.4 18.524 29.9 28.0 26.1 24.2 22.3 20.4 18.525 29.9 28.0 26.1 24.2 22.3 20.4 18.526 29.9 28.0 26.1 24.2 22.3 20.4 18.527 29.9 28.0 26.1 24.2 22.3 20.4 18.528 29.9 28.0 26.1 24.2 22.3 20.4 18.529 29.9 28.0 26.1 24.2 22.3 20.4 18.530 29.9 28.0 26.1 24.2 22.3 20.4 18.531 29.9 28.0 26.1 24.2 22.3 20.4 18.5
Back to Data entry
Back to Index Back to Data entry
1 2 3 4 5 6 7 8 9 10 11 12 13 14 15 16 17 18 19 20 21 22 23 24 25 26 27 28 29 30 3116.618.520.422.324.226.128.029.931.8
+3SD+2SD+1SDMean -1SD-2SD-3SD
Leve
I:H
DL i
n mg
/dl
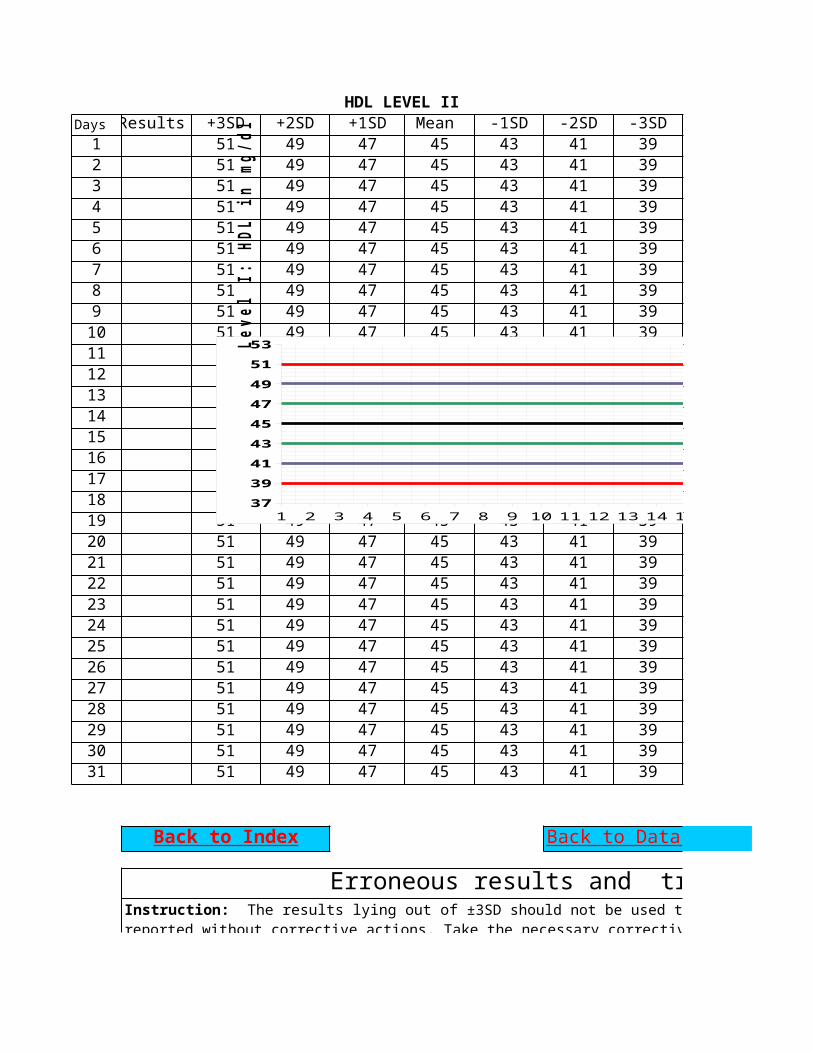
HDL LEVEL IIDays Results +3SD +2SD +1SD Mean -1SD -2SD -3SD1 51 49 47 45 43 41 392 51 49 47 45 43 41 393 51 49 47 45 43 41 394 51 49 47 45 43 41 395 51 49 47 45 43 41 396 51 49 47 45 43 41 397 51 49 47 45 43 41 398 51 49 47 45 43 41 399 51 49 47 45 43 41 3910 51 49 47 45 43 41 3911 51 49 47 45 43 41 3912 51 49 47 45 43 41 3913 51 49 47 45 43 41 3914 51 49 47 45 43 41 3915 51 49 47 45 43 41 3916 51 49 47 45 43 41 3917 51 49 47 45 43 41 3918 51 49 47 45 43 41 3919 51 49 47 45 43 41 3920 51 49 47 45 43 41 3921 51 49 47 45 43 41 3922 51 49 47 45 43 41 3923 51 49 47 45 43 41 3924 51 49 47 45 43 41 3925 51 49 47 45 43 41 3926 51 49 47 45 43 41 3927 51 49 47 45 43 41 3928 51 49 47 45 43 41 3929 51 49 47 45 43 41 3930 51 49 47 45 43 41 3931 51 49 47 45 43 41 39
Erroneous results and trouble shooting Back to Index Back to Data entry
Instruction: The results lying out of ±3SD should not be used to plot the LJ charts and the results can not be reported without corrective actions. Take the necessary corrective actions and fill in the following table. The values of the outlying results and corrected results should be writen clearly. No decimal points is required for the analyte concentration greater than 20 units but two decimal points should be used for analyte concentration less than 20 units (glucose = 89mg/dl; total bilirubin 1.56 mg/dl).
1 2 3 4 5 6 7 8 9 10 11 12 13 14 15 16 17 18 19 20 21 22 23 24 25 26 27 28 29 30 31373941434547495153
+3SD+2SD+1SDMean -1SD-2SD-3SD
Leve
l I:
HDL
in
mg/d
l
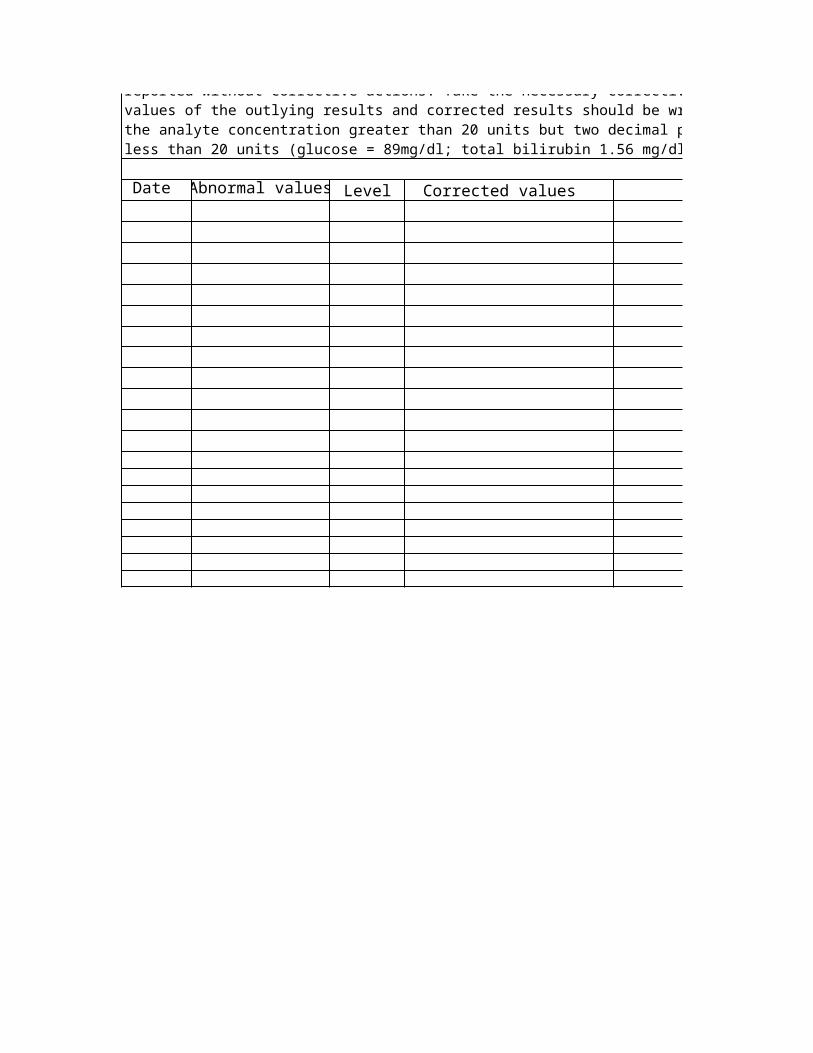
Date Abnormal values Level Corrected values Corrective actions
Instruction: The results lying out of ±3SD should not be used to plot the LJ charts and the results can not be reported without corrective actions. Take the necessary corrective actions and fill in the following table. The values of the outlying results and corrected results should be writen clearly. No decimal points is required for the analyte concentration greater than 20 units but two decimal points should be used for analyte concentration less than 20 units (glucose = 89mg/dl; total bilirubin 1.56 mg/dl).
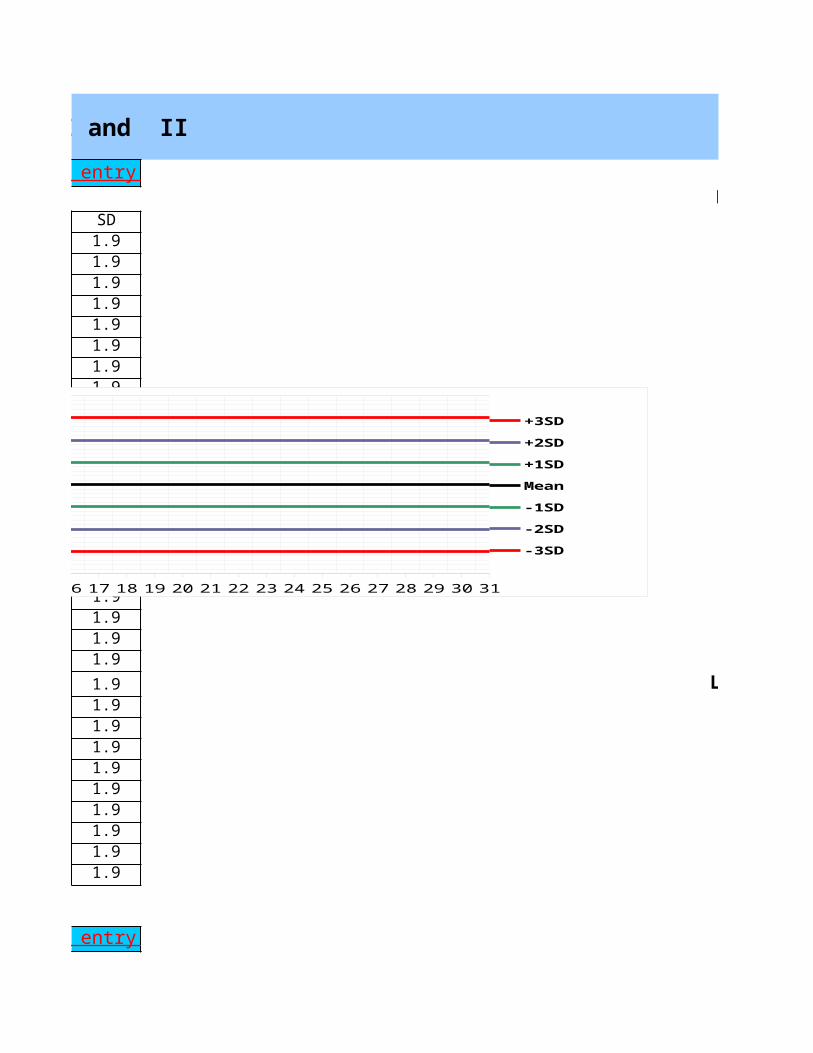
IQC IN BIOCHEMISTRY: Biorad QC Level I and II
LEVEL ISD1.91.91.91.91.91.91.91.91.91.91.91.91.91.91.91.91.91.91.91.91.91.9 LEVEL II1.91.91.91.91.91.91.91.91.9
Back to Data entry
Back to Data entry
1 2 3 4 5 6 7 8 9 10 11 12 13 14 15 16 17 18 19 20 21 22 23 24 25 26 27 28 29 30 3116.618.520.422.324.226.128.029.931.8
+3SD+2SD+1SDMean -1SD-2SD-3SD
Leve
I:H
DL i
n mg
/dl
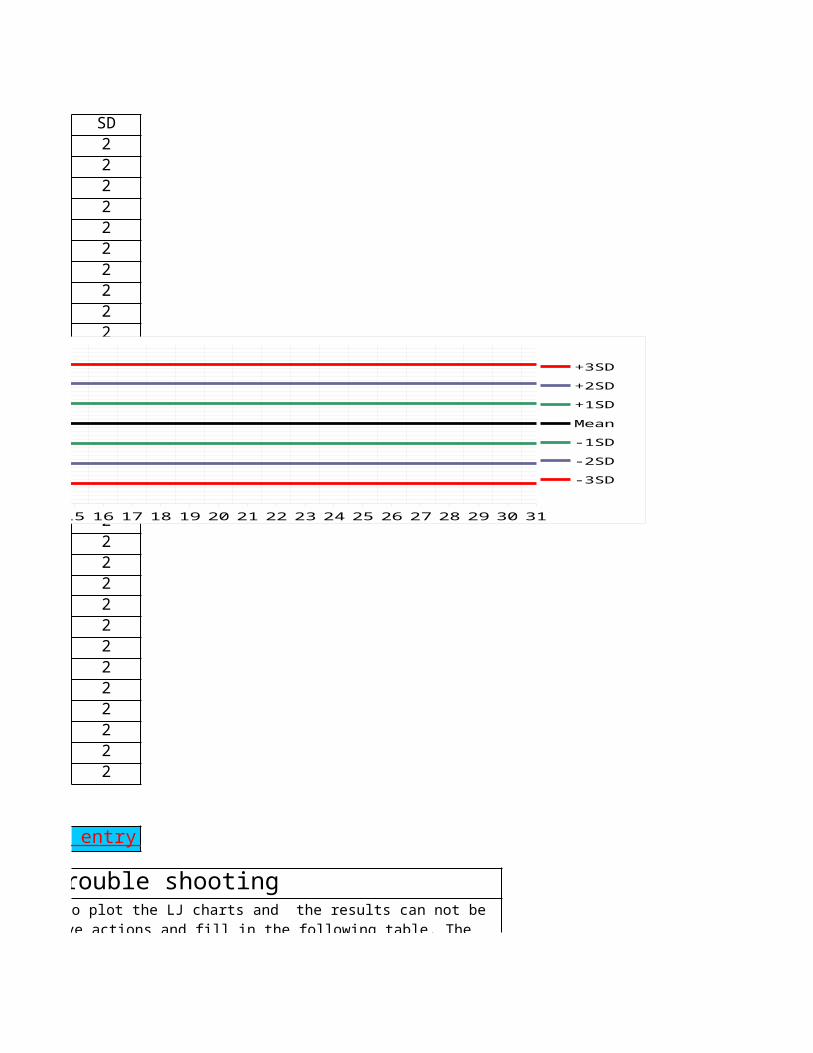
SD2222222222222222222222222222222
Erroneous results and trouble shooting Back to Data entry
3SD should not be used to plot the LJ charts and the results can not be reported without corrective actions. Take the necessary corrective actions and fill in the following table. The values of the outlying results and corrected results should be writen clearly. No decimal points is required for the analyte concentration greater than 20 units but two decimal points should be used for analyte concentration less than 20 units (glucose = 89mg/dl; total bilirubin 1.56 mg/dl).
1 2 3 4 5 6 7 8 9 10 11 12 13 14 15 16 17 18 19 20 21 22 23 24 25 26 27 28 29 30 31373941434547495153
+3SD+2SD+1SDMean -1SD-2SD-3SD
Leve
l I:
HDL
in
mg/d
l

Corrective actions Corrected by
3SD should not be used to plot the LJ charts and the results can not be reported without corrective actions. Take the necessary corrective actions and fill in the following table. The values of the outlying results and corrected results should be writen clearly. No decimal points is required for the analyte concentration greater than 20 units but two decimal points should be used for analyte concentration less than 20 units (glucose = 89mg/dl; total bilirubin 1.56 mg/dl).

IQC IN BIOCHEMISTRY: Biorad QC Level I and II
LEVEL I
LEVEL II
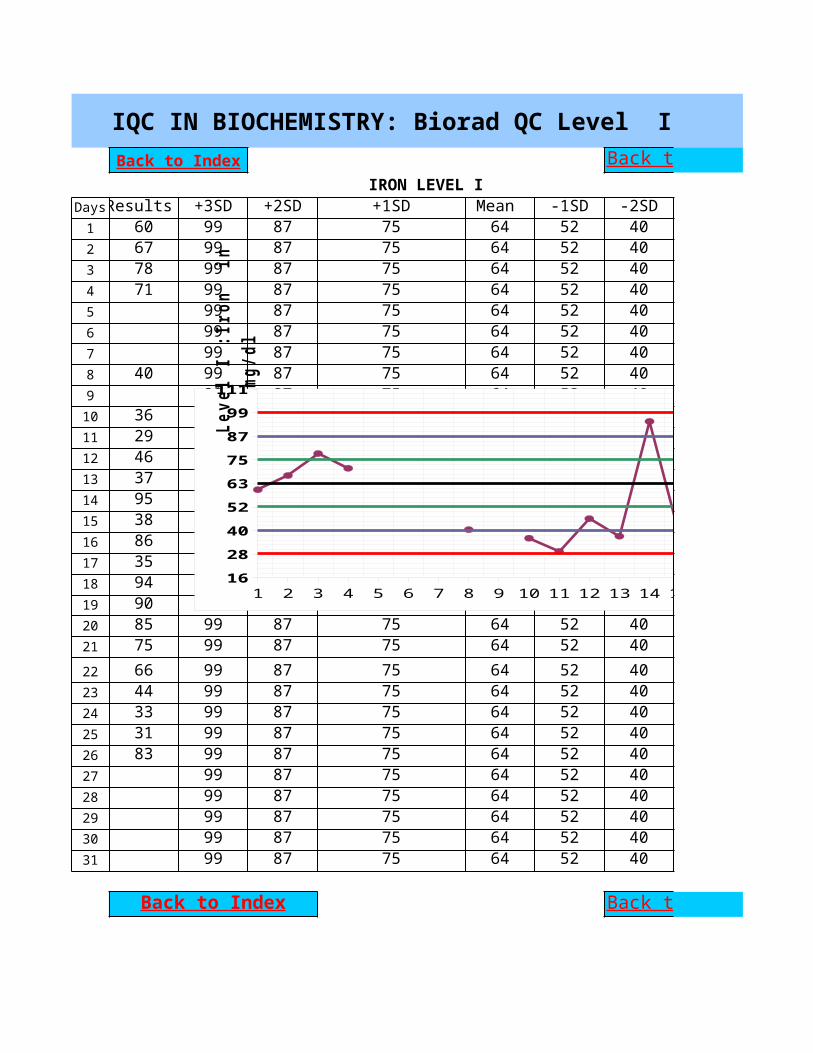
IQC IN BIOCHEMISTRY: Biorad QC Level I and II
IRON LEVEL IDaysResults +3SD +2SD +1SD Mean -1SD -2SD1 60 99 87 75 64 52 402 67 99 87 75 64 52 403 78 99 87 75 64 52 404 71 99 87 75 64 52 405 99 87 75 64 52 406 99 87 75 64 52 407 99 87 75 64 52 408 40 99 87 75 64 52 409 99 87 75 64 52 4010 36 99 87 75 64 52 4011 29 99 87 75 64 52 4012 46 99 87 75 64 52 4013 37 99 87 75 64 52 4014 95 99 87 75 64 52 4015 38 99 87 75 64 52 4016 86 99 87 75 64 52 4017 35 99 87 75 64 52 4018 94 99 87 75 64 52 4019 90 99 87 75 64 52 4020 85 99 87 75 64 52 4021 75 99 87 75 64 52 4022 66 99 87 75 64 52 4023 44 99 87 75 64 52 4024 33 99 87 75 64 52 4025 31 99 87 75 64 52 4026 83 99 87 75 64 52 4027 99 87 75 64 52 4028 99 87 75 64 52 4029 99 87 75 64 52 4030 99 87 75 64 52 4031 99 87 75 64 52 40
Back to Index Back to Data entry
Back to Index Back to Data entry
1 2 3 4 5 6 7 8 9 10 11 12 13 14 15 16 17 18 19 20 21 22 23 24 25 26 27 28 29 30 311628405263758799111
+3SD+2SD+1SDMean -1SD-2SD-3SD
Leve
l I
:Iro
n i
n mg
/dl
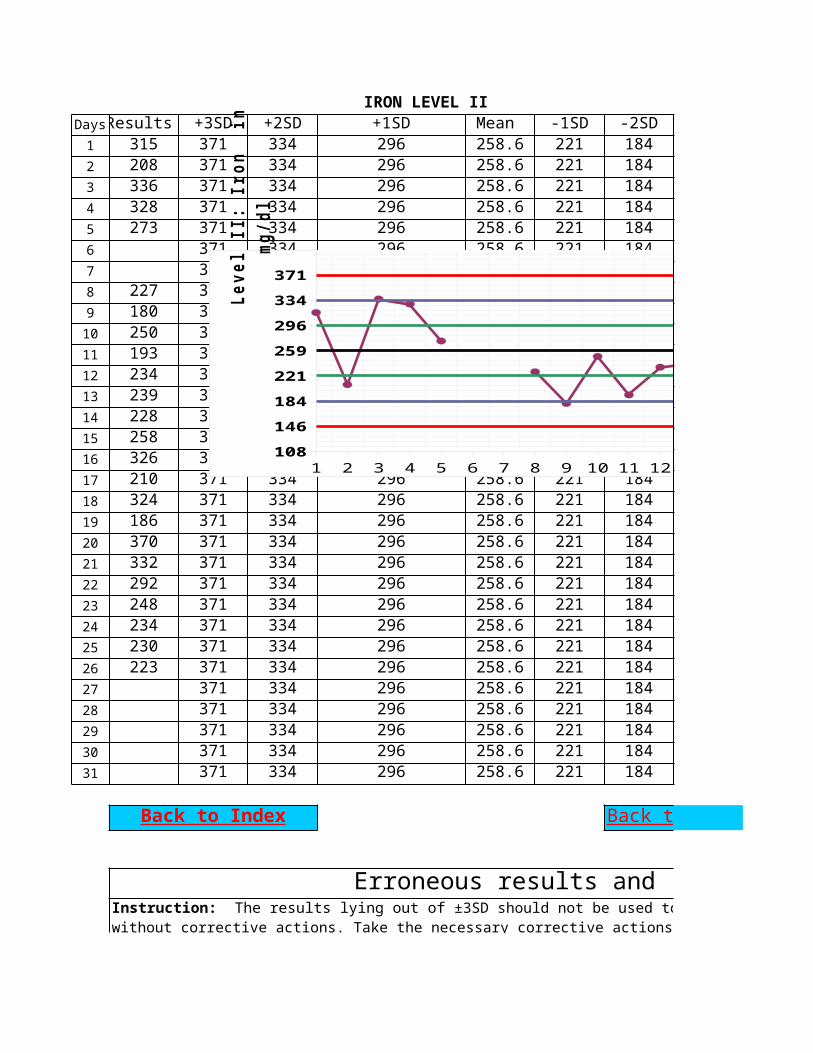
IRON LEVEL IIDaysResults +3SD +2SD +1SD Mean -1SD -2SD1 315 371 334 296 258.6 221 1842 208 371 334 296 258.6 221 1843 336 371 334 296 258.6 221 1844 328 371 334 296 258.6 221 1845 273 371 334 296 258.6 221 1846 371 334 296 258.6 221 1847 371 334 296 258.6 221 1848 227 371 334 296 258.6 221 1849 180 371 334 296 258.6 221 18410 250 371 334 296 258.6 221 18411 193 371 334 296 258.6 221 18412 234 371 334 296 258.6 221 18413 239 371 334 296 258.6 221 18414 228 371 334 296 258.6 221 18415 258 371 334 296 258.6 221 18416 326 371 334 296 258.6 221 18417 210 371 334 296 258.6 221 18418 324 371 334 296 258.6 221 18419 186 371 334 296 258.6 221 18420 370 371 334 296 258.6 221 18421 332 371 334 296 258.6 221 18422 292 371 334 296 258.6 221 18423 248 371 334 296 258.6 221 18424 234 371 334 296 258.6 221 18425 230 371 334 296 258.6 221 18426 223 371 334 296 258.6 221 18427 371 334 296 258.6 221 18428 371 334 296 258.6 221 18429 371 334 296 258.6 221 18430 371 334 296 258.6 221 18431 371 334 296 258.6 221 184
Erroneous results and trouble shooting
Back to Index Back to Data entry
Instruction: The results lying out of ±3SD should not be used to plot the LJ charts and the results can not be reported without corrective actions. Take the necessary corrective actions and fill in the following table. The values of the outlying results and corrected results should be writen clearly. No decimal points is required for the analyte concentration greater than 20 units but two decimal points should be used for analyte concentration less than 20 units (glucose = 89mg/dl; total bilirubin 1.56 mg/dl).
1 2 3 4 5 6 7 8 9 10 11 12 13 14 15 16 17 18 19 20 21 22 23 24 25 26 27 28 29 30 31108146184221259296334371
+3SD+2SD+1SDMean -1SD-2SD-3SD
Leve
l II
: Ir
on
in
mg/d
l
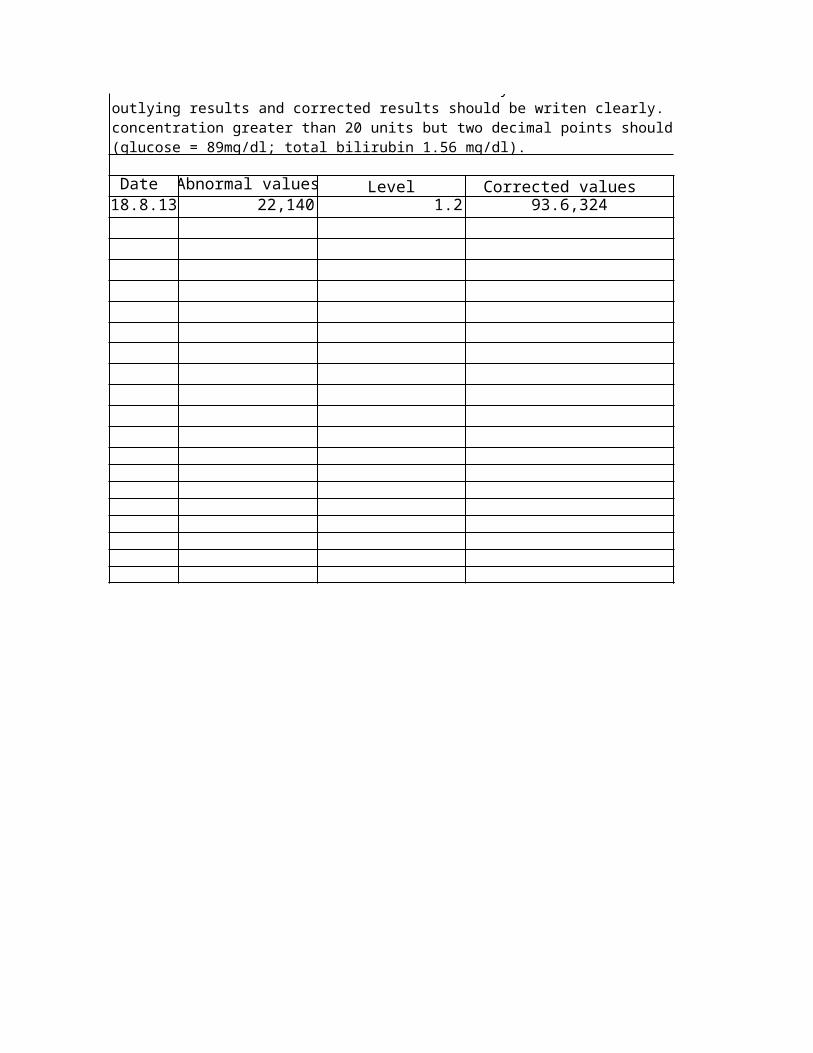
Date Abnormal values Level Corrected values 18.8.13 22,140 1.2 93.6,324
Instruction: The results lying out of ±3SD should not be used to plot the LJ charts and the results can not be reported without corrective actions. Take the necessary corrective actions and fill in the following table. The values of the outlying results and corrected results should be writen clearly. No decimal points is required for the analyte concentration greater than 20 units but two decimal points should be used for analyte concentration less than 20 units (glucose = 89mg/dl; total bilirubin 1.56 mg/dl).
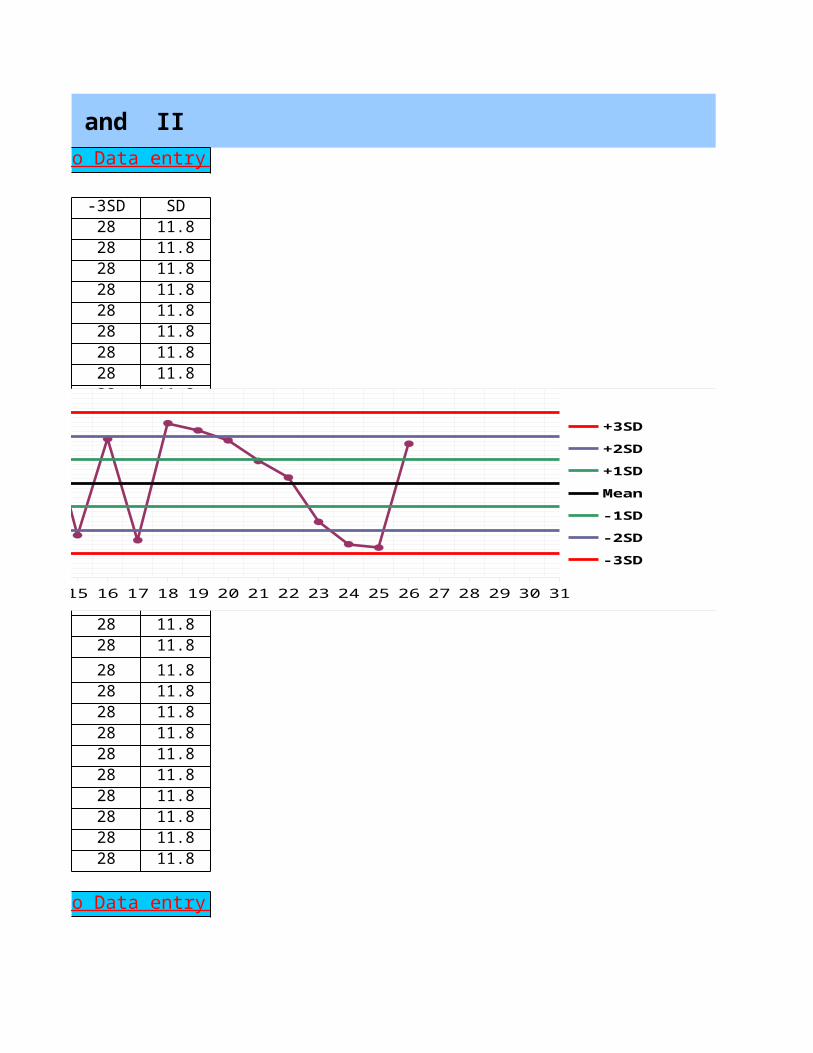
IQC IN BIOCHEMISTRY: Biorad QC Level I and II
-3SD SD28 11.828 11.828 11.828 11.828 11.828 11.828 11.828 11.828 11.828 11.828 11.828 11.828 11.828 11.828 11.828 11.828 11.828 11.828 11.828 11.828 11.828 11.828 11.828 11.828 11.828 11.828 11.828 11.828 11.828 11.828 11.8
Back to Data entry
Back to Data entry
1 2 3 4 5 6 7 8 9 10 11 12 13 14 15 16 17 18 19 20 21 22 23 24 25 26 27 28 29 30 311628405263758799111
+3SD+2SD+1SDMean -1SD-2SD-3SD
Leve
l I
:Iro
n i
n mg
/dl
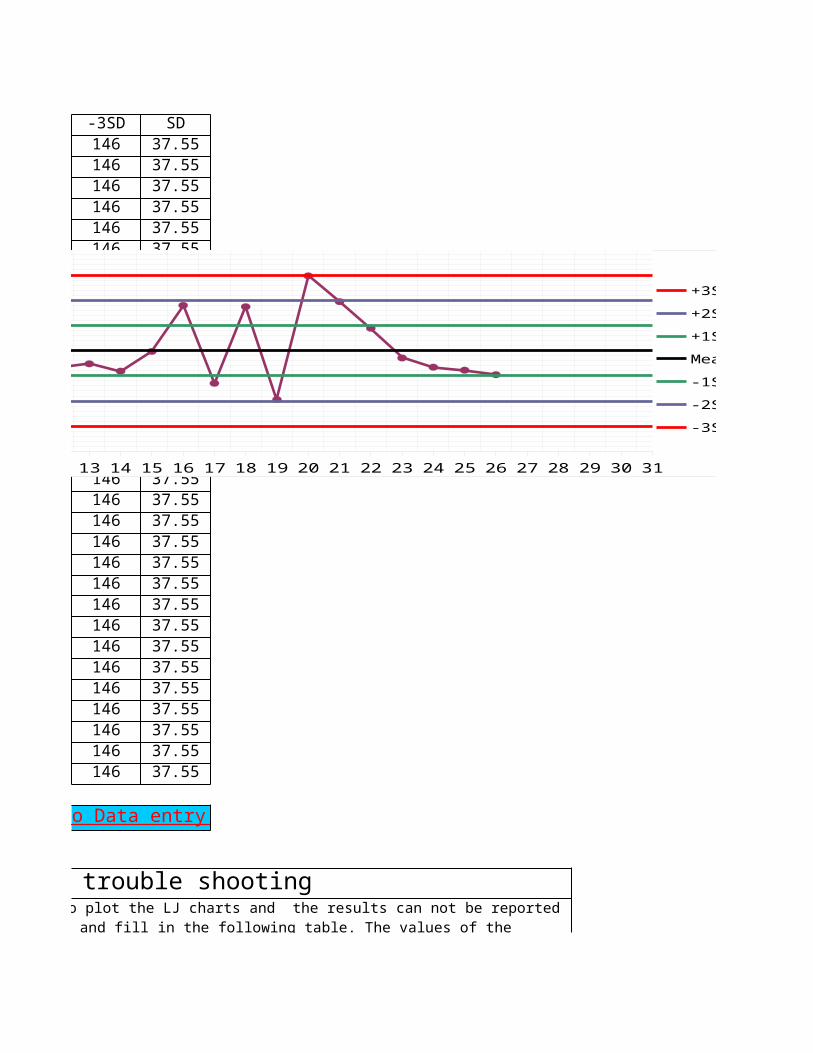
-3SD SD146 37.55146 37.55146 37.55146 37.55146 37.55146 37.55146 37.55146 37.55146 37.55146 37.55146 37.55146 37.55146 37.55146 37.55146 37.55146 37.55146 37.55146 37.55146 37.55146 37.55146 37.55146 37.55146 37.55146 37.55146 37.55146 37.55146 37.55146 37.55146 37.55146 37.55146 37.55
Erroneous results and trouble shooting
Back to Data entry
3SD should not be used to plot the LJ charts and the results can not be reported without corrective actions. Take the necessary corrective actions and fill in the following table. The values of the outlying results and corrected results should be writen clearly. No decimal points is required for the analyte concentration greater than 20 units but two decimal points should be used for analyte concentration less than 20 units
1 2 3 4 5 6 7 8 9 10 11 12 13 14 15 16 17 18 19 20 21 22 23 24 25 26 27 28 29 30 31108146184221259296334371
+3SD+2SD+1SDMean -1SD-2SD-3SD
Leve
l II
: Ir
on
in
mg/d
l
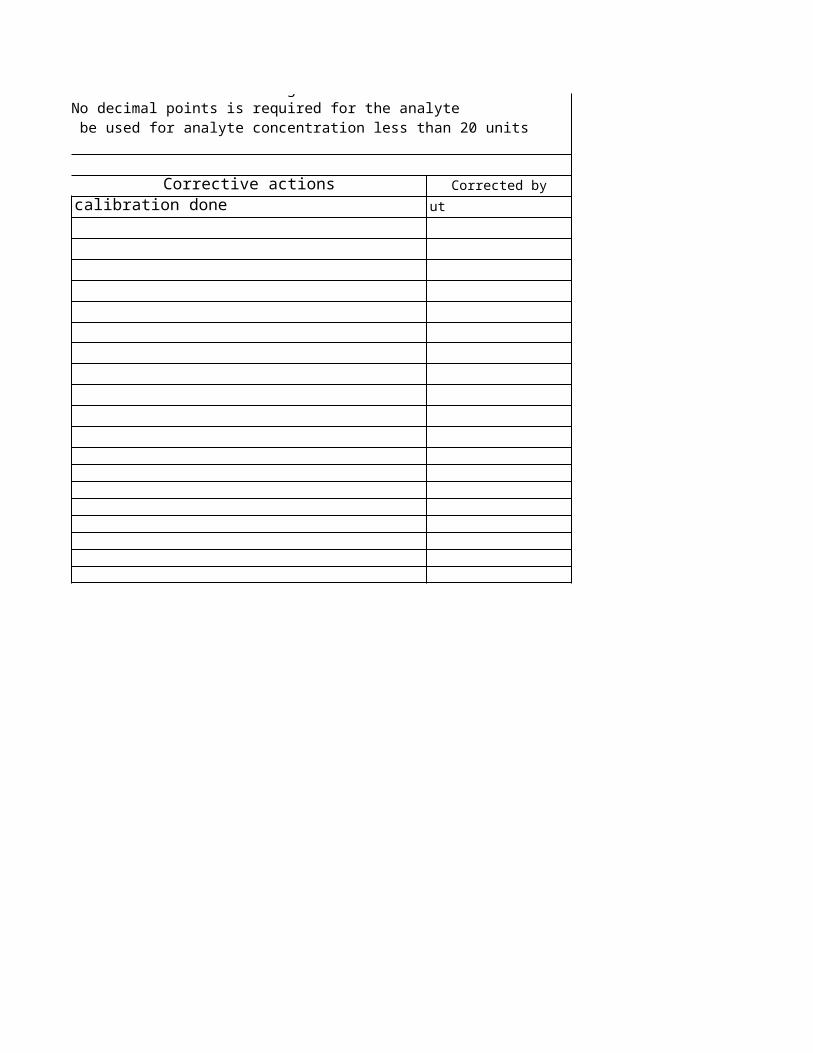
Corrective actions Corrected bycalibration done ut
3SD should not be used to plot the LJ charts and the results can not be reported without corrective actions. Take the necessary corrective actions and fill in the following table. The values of the outlying results and corrected results should be writen clearly. No decimal points is required for the analyte concentration greater than 20 units but two decimal points should be used for analyte concentration less than 20 units

IQC IN BIOCHEMISTRY: Biorad QC Level I and II
LEVEL I
LEVEL II
1 2 3 4 5 6 7 8 9 10 11 12 13 14 15 16 17 18 19 20 21 22 23 24 25 26 27 28 29 30 311628405263758799111
+3SD+2SD+1SDMean -1SD-2SD-3SD
Leve
l I
:Iro
n i
n mg
/dl

1 2 3 4 5 6 7 8 9 10 11 12 13 14 15 16 17 18 19 20 21 22 23 24 25 26 27 28 29 30 31108146184221259296334371
+3SD+2SD+1SDMean -1SD-2SD-3SD
Leve
l II
: Ir
on
in
mg/d
l
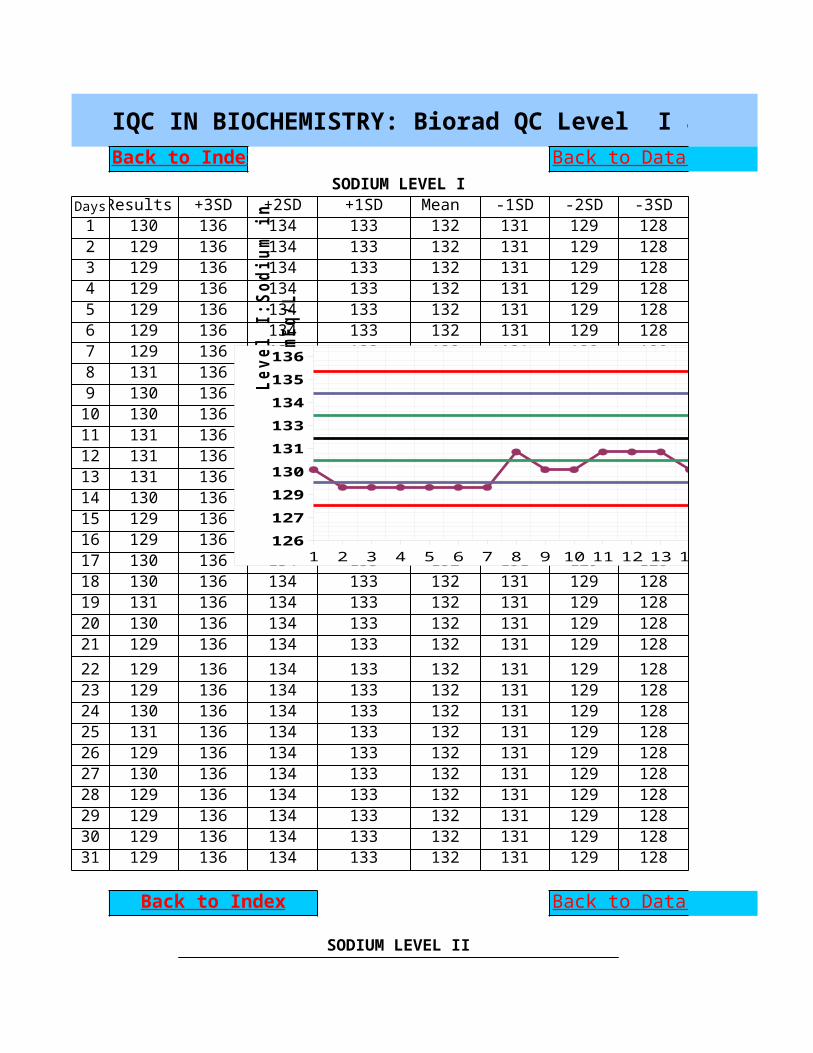
IQC IN BIOCHEMISTRY: Biorad QC Level I and II
SODIUM LEVEL IDaysResults +3SD +2SD +1SD Mean -1SD -2SD -3SD1 130 136 134 133 132 131 129 1282 129 136 134 133 132 131 129 1283 129 136 134 133 132 131 129 1284 129 136 134 133 132 131 129 1285 129 136 134 133 132 131 129 1286 129 136 134 133 132 131 129 1287 129 136 134 133 132 131 129 1288 131 136 134 133 132 131 129 1289 130 136 134 133 132 131 129 12810 130 136 134 133 132 131 129 12811 131 136 134 133 132 131 129 12812 131 136 134 133 132 131 129 12813 131 136 134 133 132 131 129 12814 130 136 134 133 132 131 129 12815 129 136 134 133 132 131 129 12816 129 136 134 133 132 131 129 12817 130 136 134 133 132 131 129 12818 130 136 134 133 132 131 129 12819 131 136 134 133 132 131 129 12820 130 136 134 133 132 131 129 12821 129 136 134 133 132 131 129 12822 129 136 134 133 132 131 129 12823 129 136 134 133 132 131 129 12824 130 136 134 133 132 131 129 12825 131 136 134 133 132 131 129 12826 129 136 134 133 132 131 129 12827 130 136 134 133 132 131 129 12828 129 136 134 133 132 131 129 12829 129 136 134 133 132 131 129 12830 129 136 134 133 132 131 129 12831 129 136 134 133 132 131 129 128
SODIUM LEVEL II
Back to Index Back to Data entry
Back to Index Back to Data entry
1 2 3 4 5 6 7 8 9 10 11 12 13 14 15 16 17 18 19 20 21 22 23 24 25 26 27 28 29 30 31126127129130131133134135136
+3SD+2SD+1SDMean -1SD-2SD-3SD
Leve
l I:
Sodi
um i
n mE
q/L
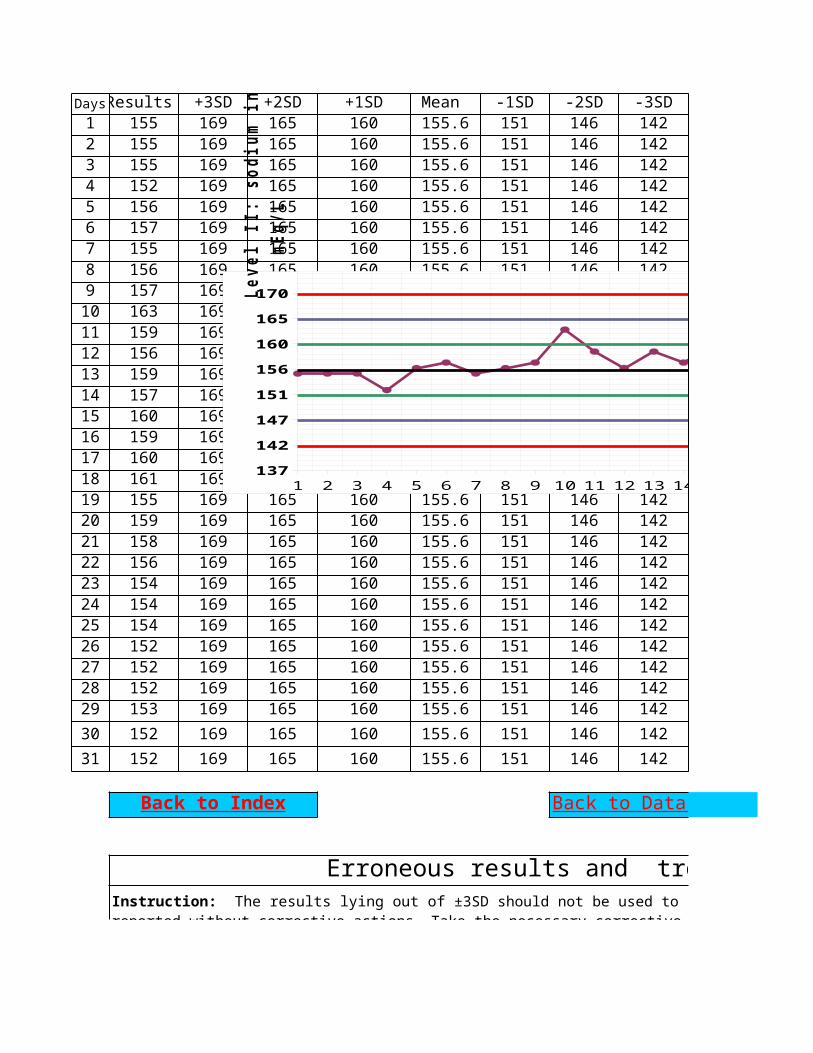
DaysResults +3SD +2SD +1SD Mean -1SD -2SD -3SD1 155 169 165 160 155.6 151 146 1422 155 169 165 160 155.6 151 146 1423 155 169 165 160 155.6 151 146 1424 152 169 165 160 155.6 151 146 1425 156 169 165 160 155.6 151 146 1426 157 169 165 160 155.6 151 146 1427 155 169 165 160 155.6 151 146 1428 156 169 165 160 155.6 151 146 1429 157 169 165 160 155.6 151 146 14210 163 169 165 160 155.6 151 146 14211 159 169 165 160 155.6 151 146 14212 156 169 165 160 155.6 151 146 14213 159 169 165 160 155.6 151 146 14214 157 169 165 160 155.6 151 146 14215 160 169 165 160 155.6 151 146 14216 159 169 165 160 155.6 151 146 14217 160 169 165 160 155.6 151 146 14218 161 169 165 160 155.6 151 146 14219 155 169 165 160 155.6 151 146 14220 159 169 165 160 155.6 151 146 14221 158 169 165 160 155.6 151 146 14222 156 169 165 160 155.6 151 146 14223 154 169 165 160 155.6 151 146 14224 154 169 165 160 155.6 151 146 14225 154 169 165 160 155.6 151 146 14226 152 169 165 160 155.6 151 146 14227 152 169 165 160 155.6 151 146 14228 152 169 165 160 155.6 151 146 14229 153 169 165 160 155.6 151 146 14230 152 169 165 160 155.6 151 146 14231 152 169 165 160 155.6 151 146 142
Erroneous results and trouble shooting
Back to Index Back to Data entry
Instruction: The results lying out of ±3SD should not be used to plot the LJ charts and the results can not be reported without corrective actions. Take the necessary corrective actions and fill in the following table. The values of the outlying results and corrected results should be writen clearly. No decimal points is required for the analyte concentration greater than 20 units but two decimal points should be used for analyte concentration less than 20 units (glucose = 89mg/dl; total bilirubin 1.56 mg/dl).
1 2 3 4 5 6 7 8 9 10 11 12 13 14 15 16 17 18 19 20 21 22 23 24 25 26 27 28 29 30 31137
142
147
151
156
160
165
170+3SD+2SD+1SDMean -1SD-2SD-3SD
Leve
l II
: so
dium
in
mEq/
L
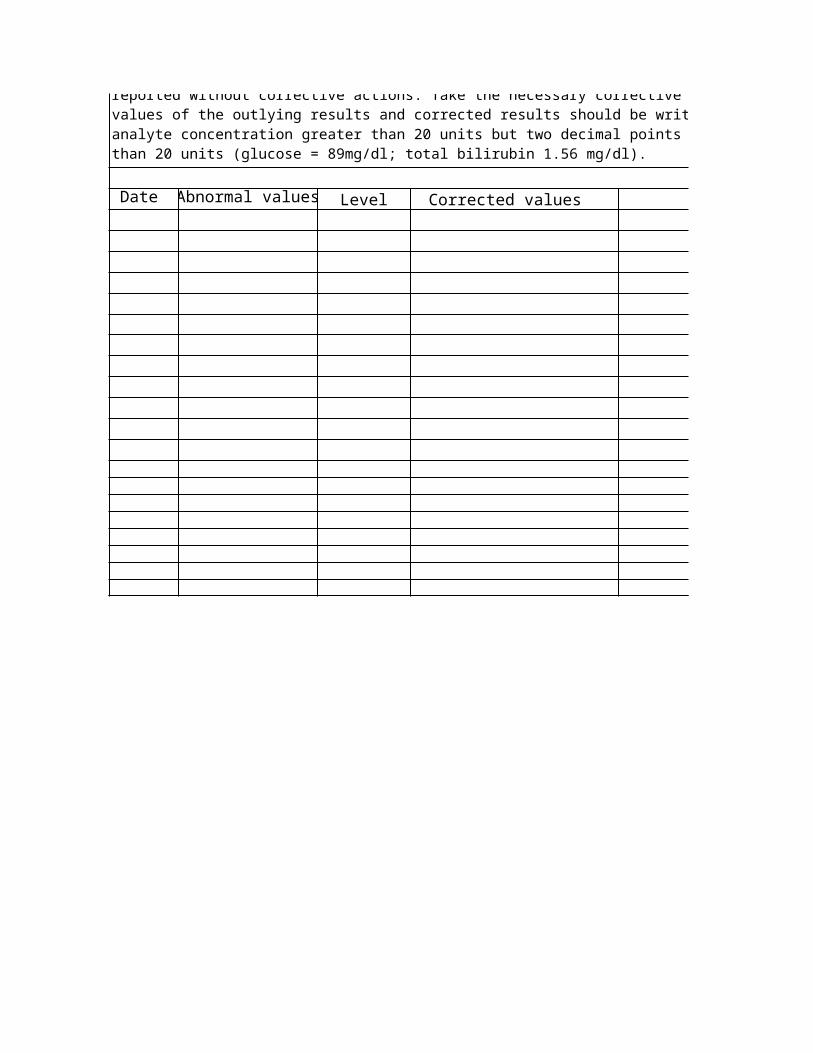
Date Abnormal values Level Corrected values Corrective actions
Instruction: The results lying out of ±3SD should not be used to plot the LJ charts and the results can not be reported without corrective actions. Take the necessary corrective actions and fill in the following table. The values of the outlying results and corrected results should be writen clearly. No decimal points is required for the analyte concentration greater than 20 units but two decimal points should be used for analyte concentration less than 20 units (glucose = 89mg/dl; total bilirubin 1.56 mg/dl).
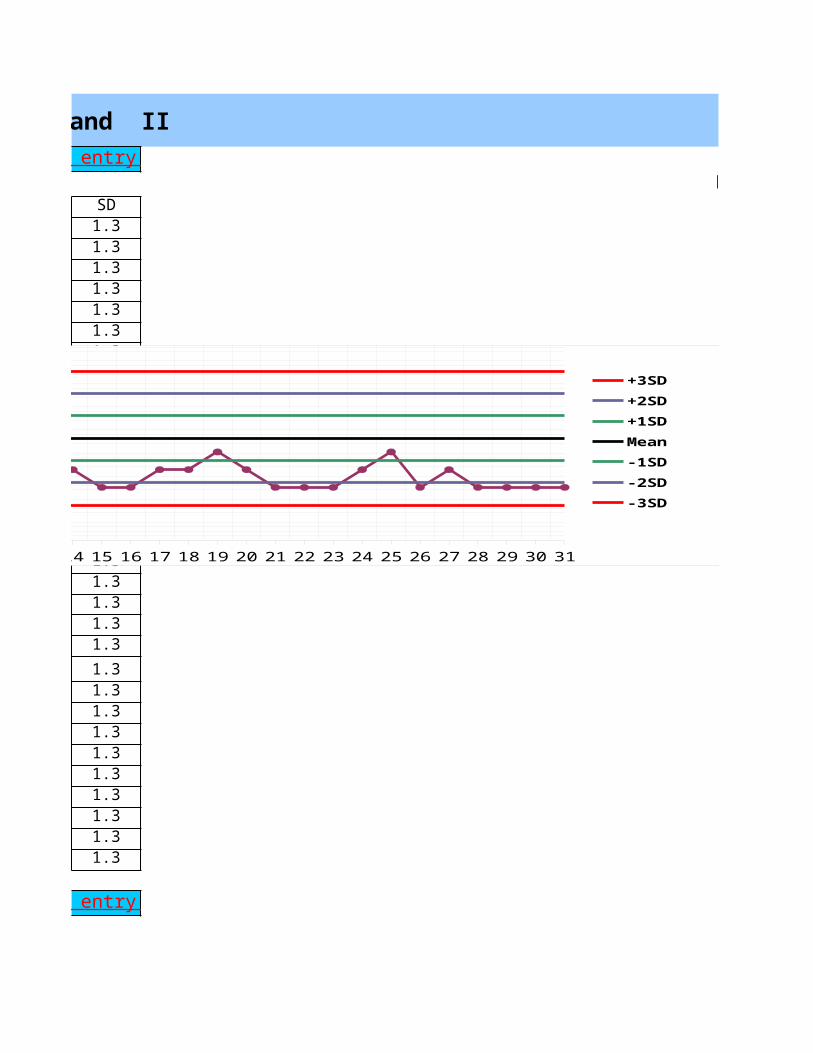
IQC IN BIOCHEMISTRY: Biorad QC Level I and II
LEVEL ISD1.31.31.31.31.31.31.31.31.31.31.31.31.31.31.31.31.31.31.31.31.31.31.31.31.31.31.31.31.31.31.3
Back to Data entry
Back to Data entry
1 2 3 4 5 6 7 8 9 10 11 12 13 14 15 16 17 18 19 20 21 22 23 24 25 26 27 28 29 30 31126127129130131133134135136
+3SD+2SD+1SDMean -1SD-2SD-3SD
Leve
l I:
Sodi
um i
n mE
q/L
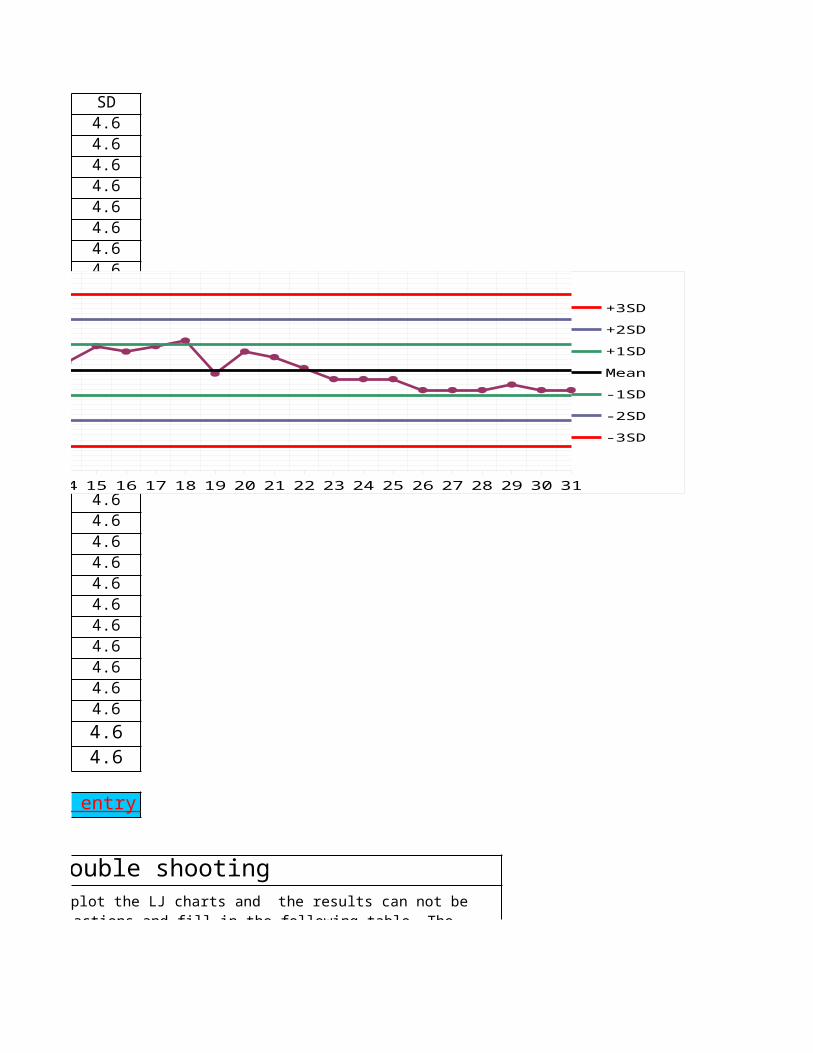
SD4.64.64.64.64.64.64.64.64.64.64.64.64.64.64.64.64.64.64.64.64.64.64.64.64.64.64.64.64.64.64.6
Erroneous results and trouble shooting
Back to Data entry
3SD should not be used to plot the LJ charts and the results can not be reported without corrective actions. Take the necessary corrective actions and fill in the following table. The values of the outlying results and corrected results should be writen clearly. No decimal points is required for the analyte concentration greater than 20 units but two decimal points should be used for analyte concentration less than 20 units (glucose = 89mg/dl; total bilirubin 1.56 mg/dl).
1 2 3 4 5 6 7 8 9 10 11 12 13 14 15 16 17 18 19 20 21 22 23 24 25 26 27 28 29 30 31137
142
147
151
156
160
165
170+3SD+2SD+1SDMean -1SD-2SD-3SD
Leve
l II
: so
dium
in
mEq/
L
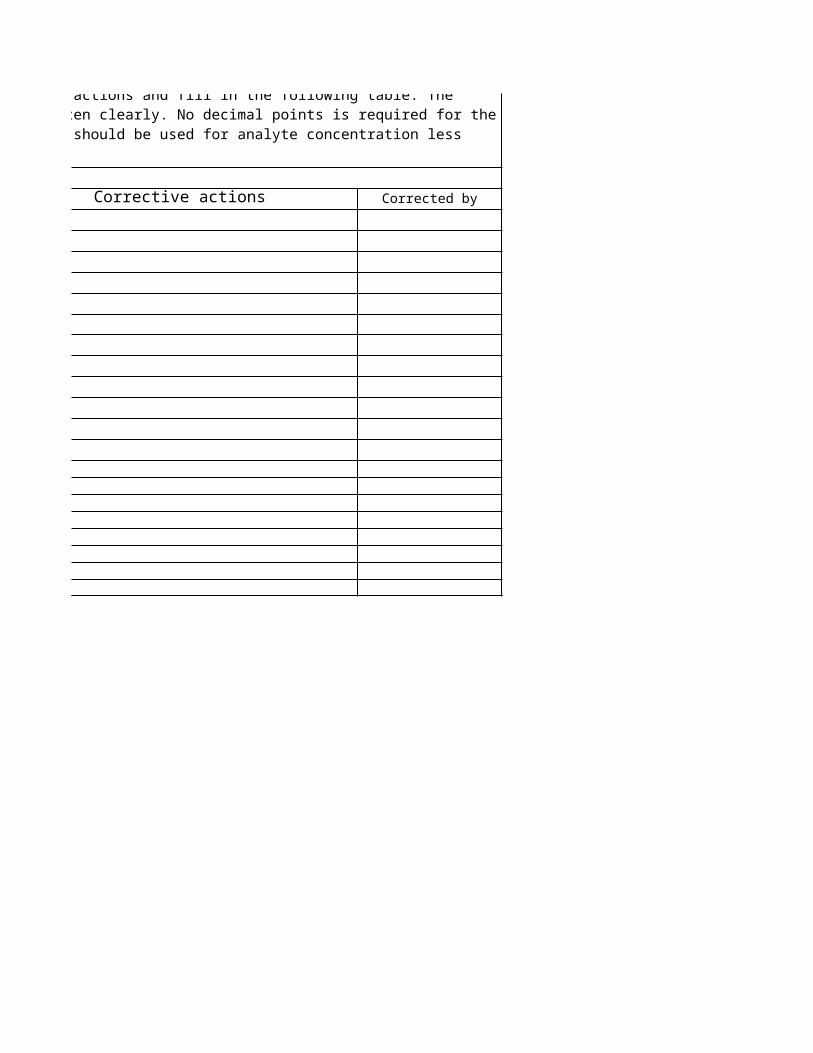
Corrective actions Corrected by
3SD should not be used to plot the LJ charts and the results can not be reported without corrective actions. Take the necessary corrective actions and fill in the following table. The values of the outlying results and corrected results should be writen clearly. No decimal points is required for the analyte concentration greater than 20 units but two decimal points should be used for analyte concentration less than 20 units (glucose = 89mg/dl; total bilirubin 1.56 mg/dl).

IQC IN BIOCHEMISTRY: Biorad QC Level I and II
LEVEL I
1 2 3 4 5 6 7 8 9 10 11 12 13 14 15 16 17 18 19 20 21 22 23 24 25 26 27 28 29 30 31126127129130131133134135136
+3SD+2SD+1SDMean -1SD-2SD-3SD
Leve
l I:
Sodi
um i
n mE
q/L
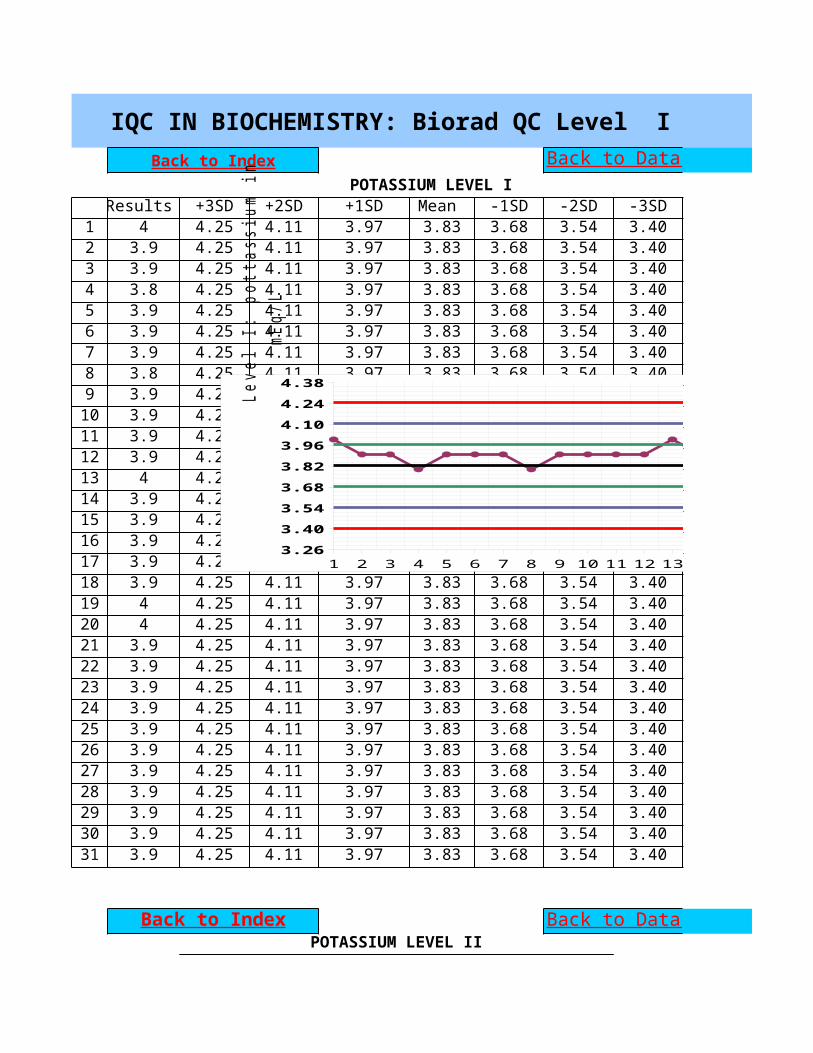
IQC IN BIOCHEMISTRY: Biorad QC Level I and II
POTASSIUM LEVEL IResults +3SD +2SD +1SD Mean -1SD -2SD -3SD
1 4 4.25 4.11 3.97 3.83 3.68 3.54 3.402 3.9 4.25 4.11 3.97 3.83 3.68 3.54 3.403 3.9 4.25 4.11 3.97 3.83 3.68 3.54 3.404 3.8 4.25 4.11 3.97 3.83 3.68 3.54 3.405 3.9 4.25 4.11 3.97 3.83 3.68 3.54 3.406 3.9 4.25 4.11 3.97 3.83 3.68 3.54 3.407 3.9 4.25 4.11 3.97 3.83 3.68 3.54 3.408 3.8 4.25 4.11 3.97 3.83 3.68 3.54 3.409 3.9 4.25 4.11 3.97 3.83 3.68 3.54 3.4010 3.9 4.25 4.11 3.97 3.83 3.68 3.54 3.4011 3.9 4.25 4.11 3.97 3.83 3.68 3.54 3.4012 3.9 4.25 4.11 3.97 3.83 3.68 3.54 3.4013 4 4.25 4.11 3.97 3.83 3.68 3.54 3.4014 3.9 4.25 4.11 3.97 3.83 3.68 3.54 3.4015 3.9 4.25 4.11 3.97 3.83 3.68 3.54 3.4016 3.9 4.25 4.11 3.97 3.83 3.68 3.54 3.4017 3.9 4.25 4.11 3.97 3.83 3.68 3.54 3.4018 3.9 4.25 4.11 3.97 3.83 3.68 3.54 3.4019 4 4.25 4.11 3.97 3.83 3.68 3.54 3.4020 4 4.25 4.11 3.97 3.83 3.68 3.54 3.4021 3.9 4.25 4.11 3.97 3.83 3.68 3.54 3.4022 3.9 4.25 4.11 3.97 3.83 3.68 3.54 3.4023 3.9 4.25 4.11 3.97 3.83 3.68 3.54 3.4024 3.9 4.25 4.11 3.97 3.83 3.68 3.54 3.4025 3.9 4.25 4.11 3.97 3.83 3.68 3.54 3.4026 3.9 4.25 4.11 3.97 3.83 3.68 3.54 3.4027 3.9 4.25 4.11 3.97 3.83 3.68 3.54 3.4028 3.9 4.25 4.11 3.97 3.83 3.68 3.54 3.4029 3.9 4.25 4.11 3.97 3.83 3.68 3.54 3.4030 3.9 4.25 4.11 3.97 3.83 3.68 3.54 3.4031 3.9 4.25 4.11 3.97 3.83 3.68 3.54 3.40
POTASSIUM LEVEL II
Back to Index Back to Data entry
Back to Index Back to Data entry
1 2 3 4 5 6 7 8 9 10 11 12 13 14 15 16 17 18 19 20 21 22 23 24 25 26 27 28 29 30 313.263.403.543.683.823.964.104.244.38
+3SD+2SD+1SDMean -1SD-2SD-3SD
Leve
l I:
pot
tass
ium
in
mEq/
L
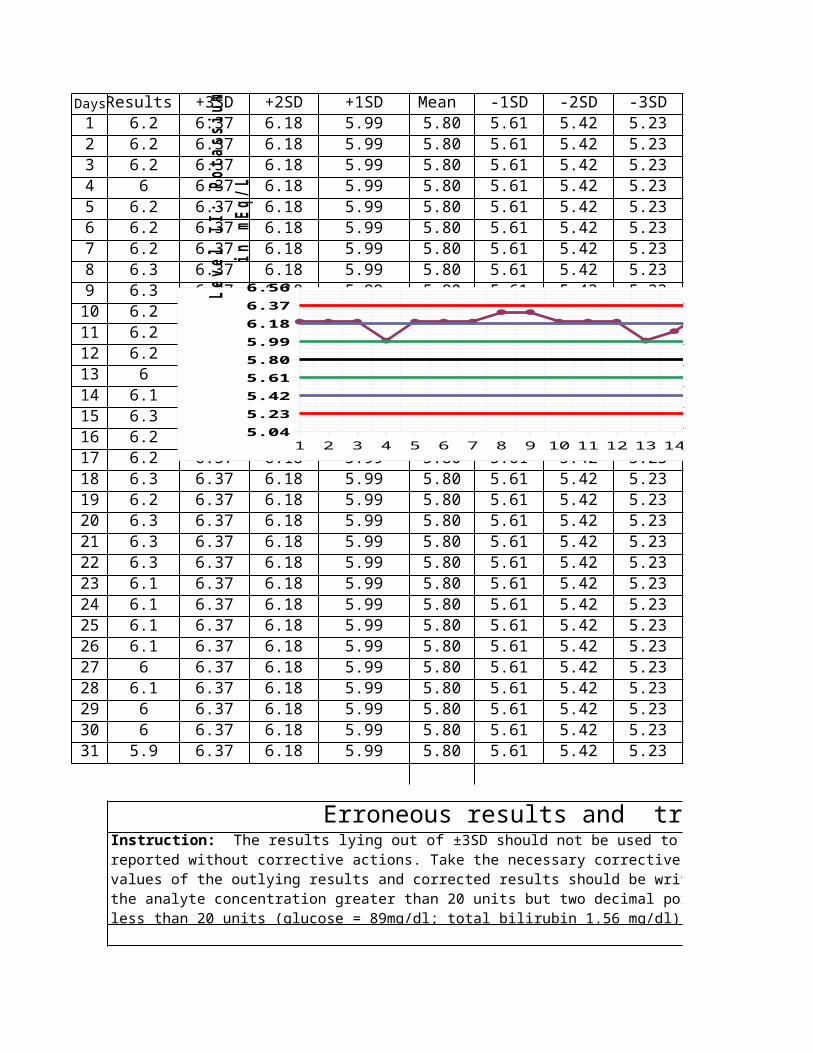
DaysResults +3SD +2SD +1SD Mean -1SD -2SD -3SD1 6.2 6.37 6.18 5.99 5.80 5.61 5.42 5.232 6.2 6.37 6.18 5.99 5.80 5.61 5.42 5.233 6.2 6.37 6.18 5.99 5.80 5.61 5.42 5.234 6 6.37 6.18 5.99 5.80 5.61 5.42 5.235 6.2 6.37 6.18 5.99 5.80 5.61 5.42 5.236 6.2 6.37 6.18 5.99 5.80 5.61 5.42 5.237 6.2 6.37 6.18 5.99 5.80 5.61 5.42 5.238 6.3 6.37 6.18 5.99 5.80 5.61 5.42 5.239 6.3 6.37 6.18 5.99 5.80 5.61 5.42 5.2310 6.2 6.37 6.18 5.99 5.80 5.61 5.42 5.2311 6.2 6.37 6.18 5.99 5.80 5.61 5.42 5.2312 6.2 6.37 6.18 5.99 5.80 5.61 5.42 5.2313 6 6.37 6.18 5.99 5.80 5.61 5.42 5.2314 6.1 6.37 6.18 5.99 5.80 5.61 5.42 5.2315 6.3 6.37 6.18 5.99 5.80 5.61 5.42 5.2316 6.2 6.37 6.18 5.99 5.80 5.61 5.42 5.2317 6.2 6.37 6.18 5.99 5.80 5.61 5.42 5.2318 6.3 6.37 6.18 5.99 5.80 5.61 5.42 5.2319 6.2 6.37 6.18 5.99 5.80 5.61 5.42 5.2320 6.3 6.37 6.18 5.99 5.80 5.61 5.42 5.2321 6.3 6.37 6.18 5.99 5.80 5.61 5.42 5.2322 6.3 6.37 6.18 5.99 5.80 5.61 5.42 5.2323 6.1 6.37 6.18 5.99 5.80 5.61 5.42 5.2324 6.1 6.37 6.18 5.99 5.80 5.61 5.42 5.2325 6.1 6.37 6.18 5.99 5.80 5.61 5.42 5.2326 6.1 6.37 6.18 5.99 5.80 5.61 5.42 5.2327 6 6.37 6.18 5.99 5.80 5.61 5.42 5.2328 6.1 6.37 6.18 5.99 5.80 5.61 5.42 5.2329 6 6.37 6.18 5.99 5.80 5.61 5.42 5.2330 6 6.37 6.18 5.99 5.80 5.61 5.42 5.2331 5.9 6.37 6.18 5.99 5.80 5.61 5.42 5.23
Erroneous results and trouble shooting Instruction: The results lying out of ±3SD should not be used to plot the LJ charts and the results can not be reported without corrective actions. Take the necessary corrective actions and fill in the following table. The values of the outlying results and corrected results should be writen clearly. No decimal points is required for the analyte concentration greater than 20 units but two decimal points should be used for analyte concentration less than 20 units (glucose = 89mg/dl; total bilirubin 1.56 mg/dl).
1 2 3 4 5 6 7 8 9 10 11 12 13 14 15 16 17 18 19 20 21 22 23 24 25 26 27 28 29 30 315.045.235.425.615.805.996.186.376.56
+3SD+2SD+1SDMean -1SD-2SD-3SD
Leve
l II
: Po
tass
ium
in m
Eq/L
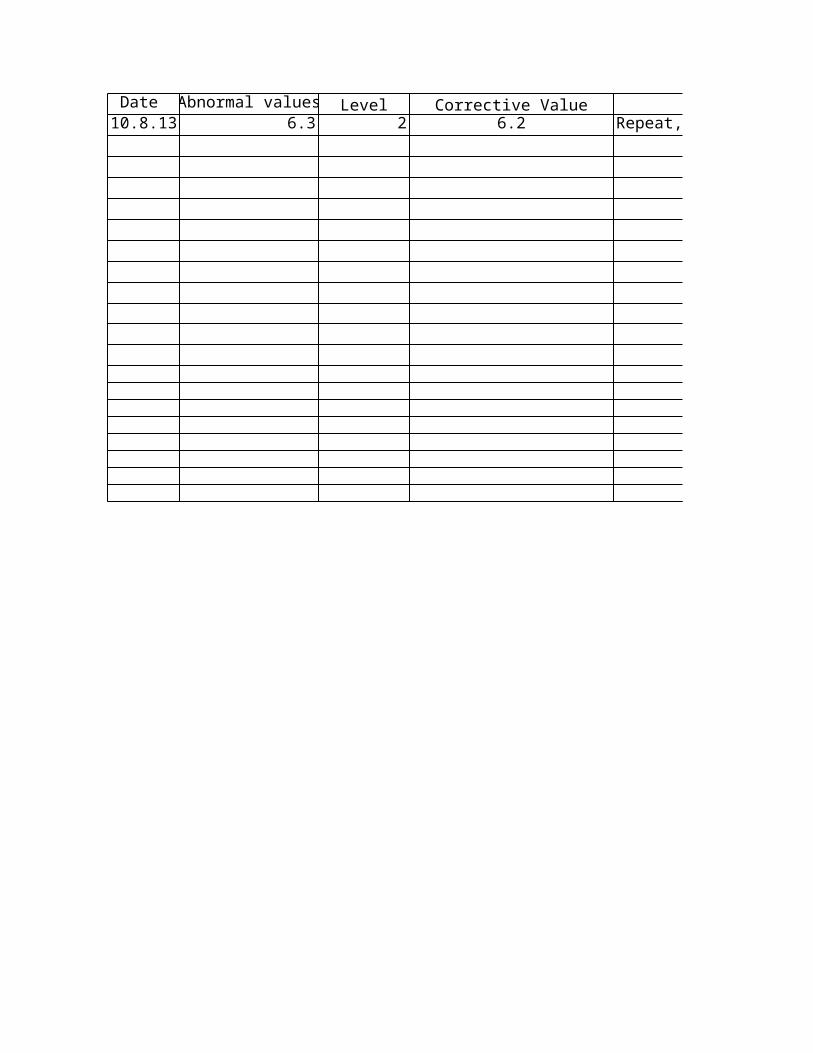
Date Abnormal values Level Corrective Value Corrective actions10.8.13 6.3 2 6.2 Repeat, QC change
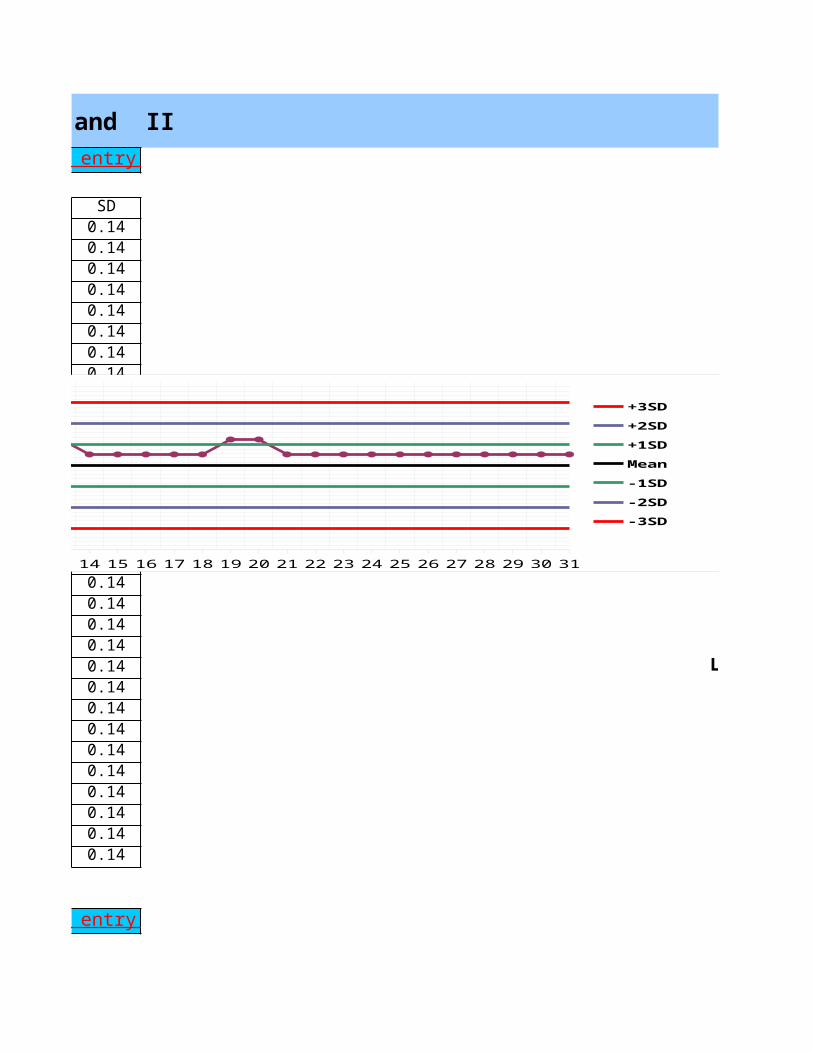
IQC IN BIOCHEMISTRY: Biorad QC Level I and II
SD0.140.140.140.140.140.140.140.140.140.140.140.140.140.140.140.140.140.140.140.140.140.14 LEVEL II0.140.140.140.140.140.140.140.140.14
Back to Data entry
Back to Data entry
1 2 3 4 5 6 7 8 9 10 11 12 13 14 15 16 17 18 19 20 21 22 23 24 25 26 27 28 29 30 313.263.403.543.683.823.964.104.244.38
+3SD+2SD+1SDMean -1SD-2SD-3SD
Leve
l I:
pot
tass
ium
in
mEq/
L
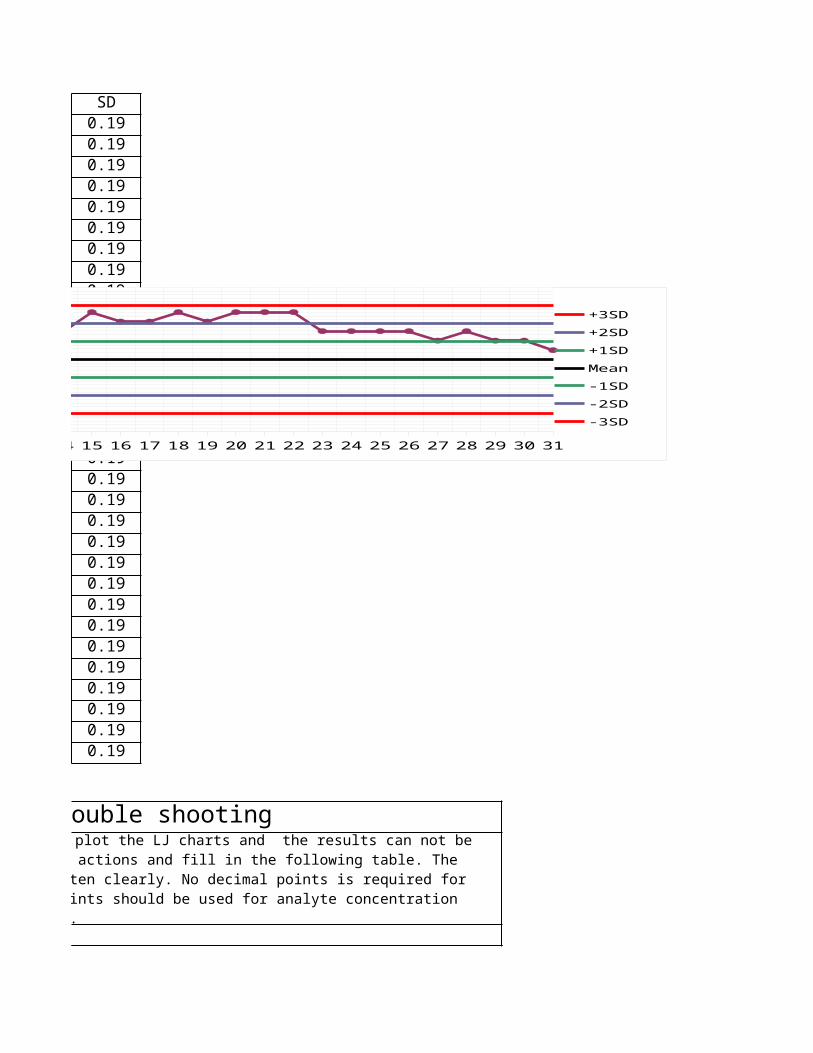
SD0.190.190.190.190.190.190.190.190.190.190.190.190.190.190.190.190.190.190.190.190.190.190.190.190.190.190.190.190.190.190.19
Erroneous results and trouble shooting 3SD should not be used to plot the LJ charts and the results can not be
reported without corrective actions. Take the necessary corrective actions and fill in the following table. The values of the outlying results and corrected results should be writen clearly. No decimal points is required for the analyte concentration greater than 20 units but two decimal points should be used for analyte concentration less than 20 units (glucose = 89mg/dl; total bilirubin 1.56 mg/dl).
1 2 3 4 5 6 7 8 9 10 11 12 13 14 15 16 17 18 19 20 21 22 23 24 25 26 27 28 29 30 315.045.235.425.615.805.996.186.376.56
+3SD+2SD+1SDMean -1SD-2SD-3SD
Leve
l II
: Po
tass
ium
in m
Eq/L
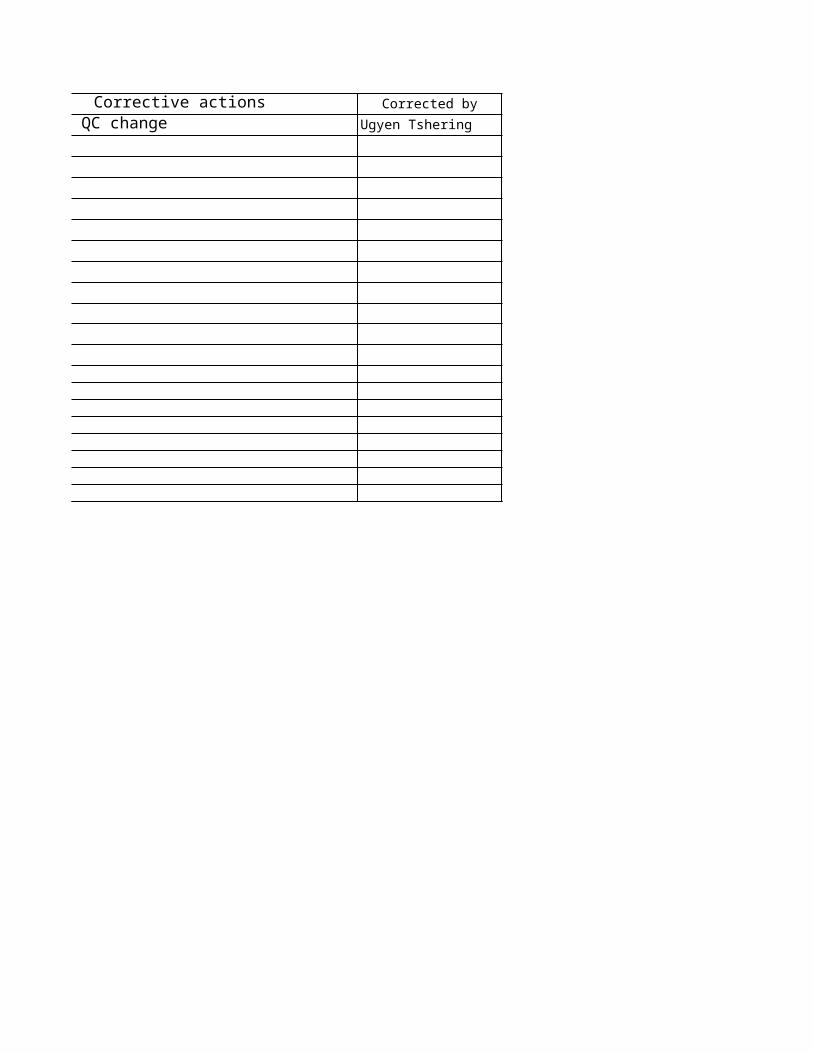
Corrective actions Corrected byRepeat, QC change Ugyen Tshering
IQC IN BIOCHEMISTRY: Biorad QC Level I and II
LEVEL II
1 2 3 4 5 6 7 8 9 10 11 12 13 14 15 16 17 18 19 20 21 22 23 24 25 26 27 28 29 30 313.263.403.543.683.823.964.104.244.38
+3SD+2SD+1SDMean -1SD-2SD-3SD
Leve
l I:
pot
tass
ium
in
mEq/
L
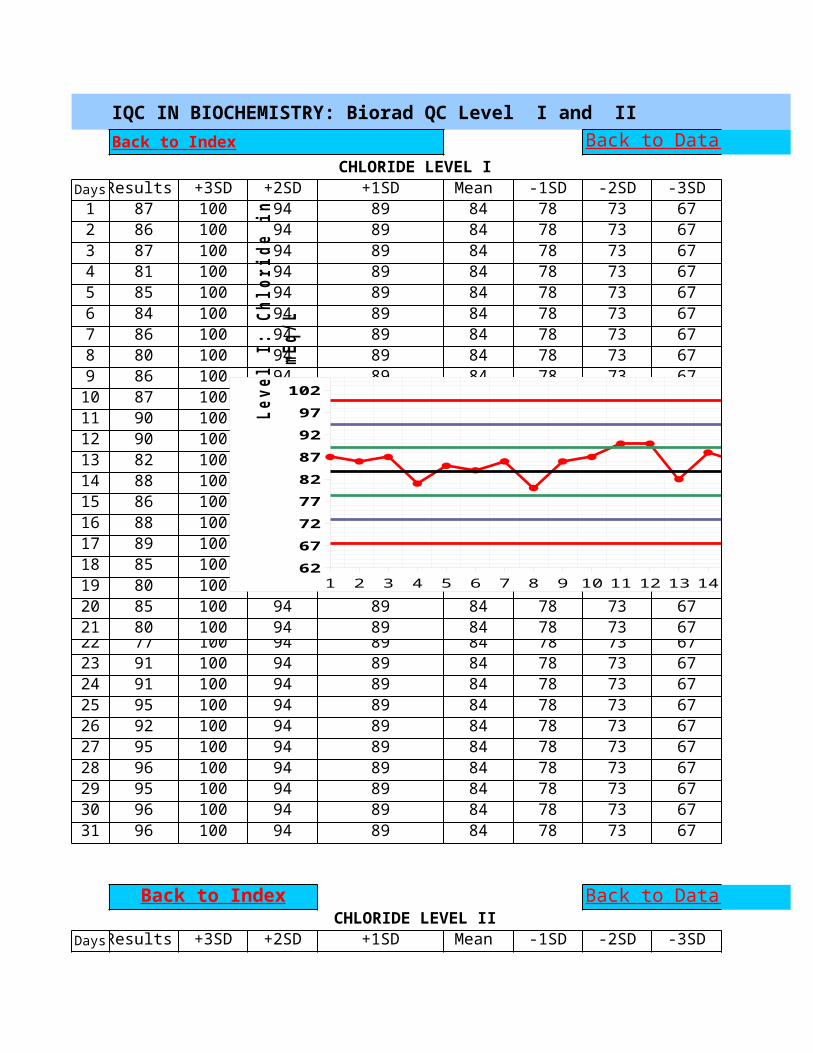
IQC IN BIOCHEMISTRY: Biorad QC Level I and II
CHLORIDE LEVEL IDaysResults +3SD +2SD +1SD Mean -1SD -2SD -3SD1 87 100 94 89 84 78 73 672 86 100 94 89 84 78 73 673 87 100 94 89 84 78 73 674 81 100 94 89 84 78 73 675 85 100 94 89 84 78 73 676 84 100 94 89 84 78 73 677 86 100 94 89 84 78 73 678 80 100 94 89 84 78 73 679 86 100 94 89 84 78 73 6710 87 100 94 89 84 78 73 6711 90 100 94 89 84 78 73 6712 90 100 94 89 84 78 73 6713 82 100 94 89 84 78 73 6714 88 100 94 89 84 78 73 6715 86 100 94 89 84 78 73 6716 88 100 94 89 84 78 73 6717 89 100 94 89 84 78 73 6718 85 100 94 89 84 78 73 6719 80 100 94 89 84 78 73 6720 85 100 94 89 84 78 73 6721 80 100 94 89 84 78 73 6722 77 100 94 89 84 78 73 6723 91 100 94 89 84 78 73 6724 91 100 94 89 84 78 73 6725 95 100 94 89 84 78 73 6726 92 100 94 89 84 78 73 6727 95 100 94 89 84 78 73 6728 96 100 94 89 84 78 73 6729 95 100 94 89 84 78 73 6730 96 100 94 89 84 78 73 6731 96 100 94 89 84 78 73 67
CHLORIDE LEVEL IIDaysResults +3SD +2SD +1SD Mean -1SD -2SD -3SD
Back to Index Back to Data entry
Back to Index Back to Data entry
1 2 3 4 5 6 7 8 9 10 11 12 13 14 15 16 17 18 19 20 21 22 23 24 25 26 27 28 29 30 316267727782879297102
+3SD+2SD+1SDMean -1SD-2SD-3SD
Leve
l I:
Chl
orid
e in
mE
q/L
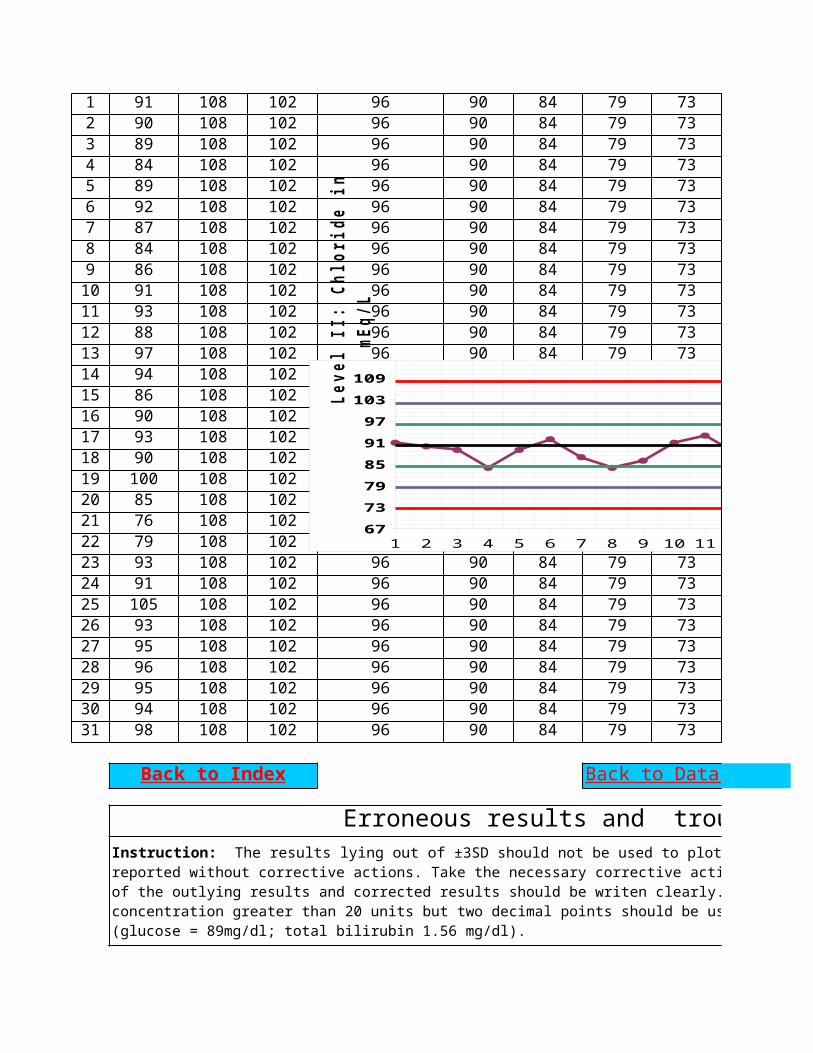
1 91 108 102 96 90 84 79 732 90 108 102 96 90 84 79 733 89 108 102 96 90 84 79 734 84 108 102 96 90 84 79 735 89 108 102 96 90 84 79 736 92 108 102 96 90 84 79 737 87 108 102 96 90 84 79 738 84 108 102 96 90 84 79 739 86 108 102 96 90 84 79 7310 91 108 102 96 90 84 79 7311 93 108 102 96 90 84 79 7312 88 108 102 96 90 84 79 7313 97 108 102 96 90 84 79 7314 94 108 102 96 90 84 79 7315 86 108 102 96 90 84 79 7316 90 108 102 96 90 84 79 7317 93 108 102 96 90 84 79 7318 90 108 102 96 90 84 79 7319 100 108 102 96 90 84 79 7320 85 108 102 96 90 84 79 7321 76 108 102 96 90 84 79 7322 79 108 102 96 90 84 79 7323 93 108 102 96 90 84 79 7324 91 108 102 96 90 84 79 7325 105 108 102 96 90 84 79 7326 93 108 102 96 90 84 79 7327 95 108 102 96 90 84 79 7328 96 108 102 96 90 84 79 7329 95 108 102 96 90 84 79 7330 94 108 102 96 90 84 79 7331 98 108 102 96 90 84 79 73
Erroneous results and trouble shooting Back to Index Back to Data entry
Instruction: The results lying out of ±3SD should not be used to plot the LJ charts and the results can not be reported without corrective actions. Take the necessary corrective actions and fill in the following table. The values of the outlying results and corrected results should be writen clearly. No decimal points is required for the analyte concentration greater than 20 units but two decimal points should be used for analyte concentration less than 20 units (glucose = 89mg/dl; total bilirubin 1.56 mg/dl).
1 2 3 4 5 6 7 8 9 10 11 12 13 14 15 16 17 18 19 20 21 22 23 24 25 26 27 28 29 30 31677379859197103109
+3SD+2SD+1SDMean -1SD-2SD-3SD
Leve
l II
: Ch
lori
de i
n mE
q/L
Date Abnormal values Level Probable causes Corrective actions
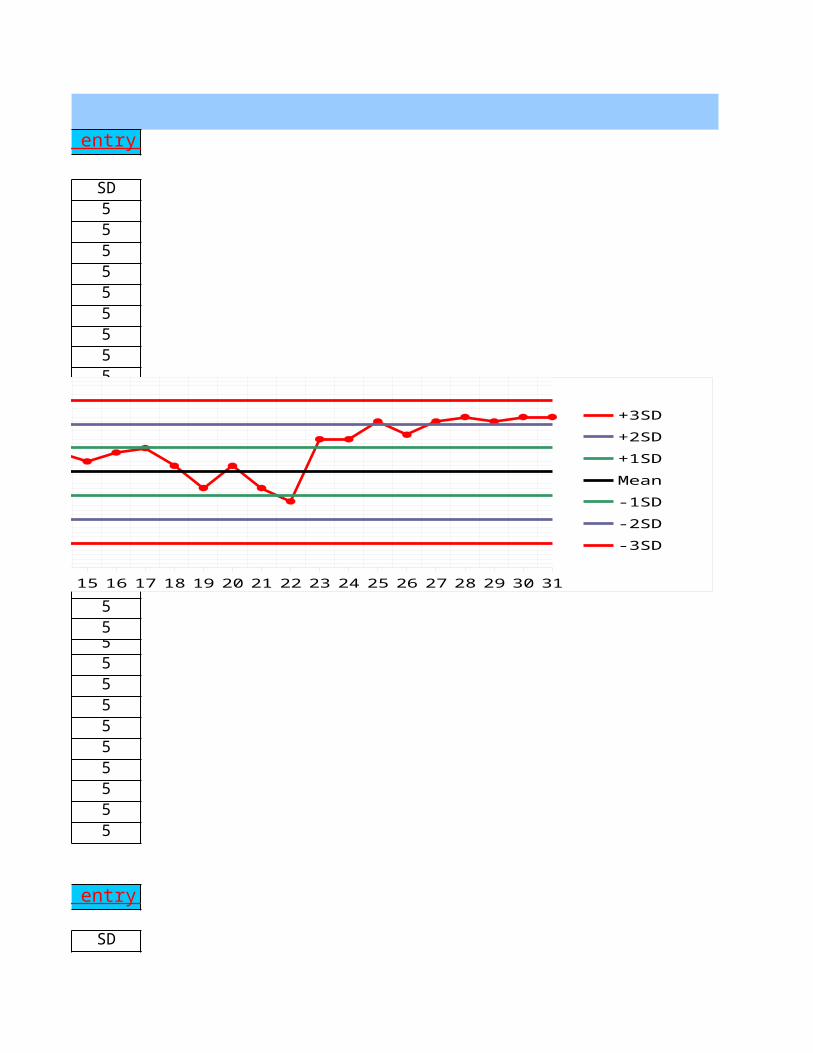
IQC IN BIOCHEMISTRY: Biorad QC Level I and II
SD5555555555555555555555555555555
SD
Back to Data entry
Back to Data entry
1 2 3 4 5 6 7 8 9 10 11 12 13 14 15 16 17 18 19 20 21 22 23 24 25 26 27 28 29 30 316267727782879297102
+3SD+2SD+1SDMean -1SD-2SD-3SD
Leve
l I:
Chl
orid
e in
mE
q/L
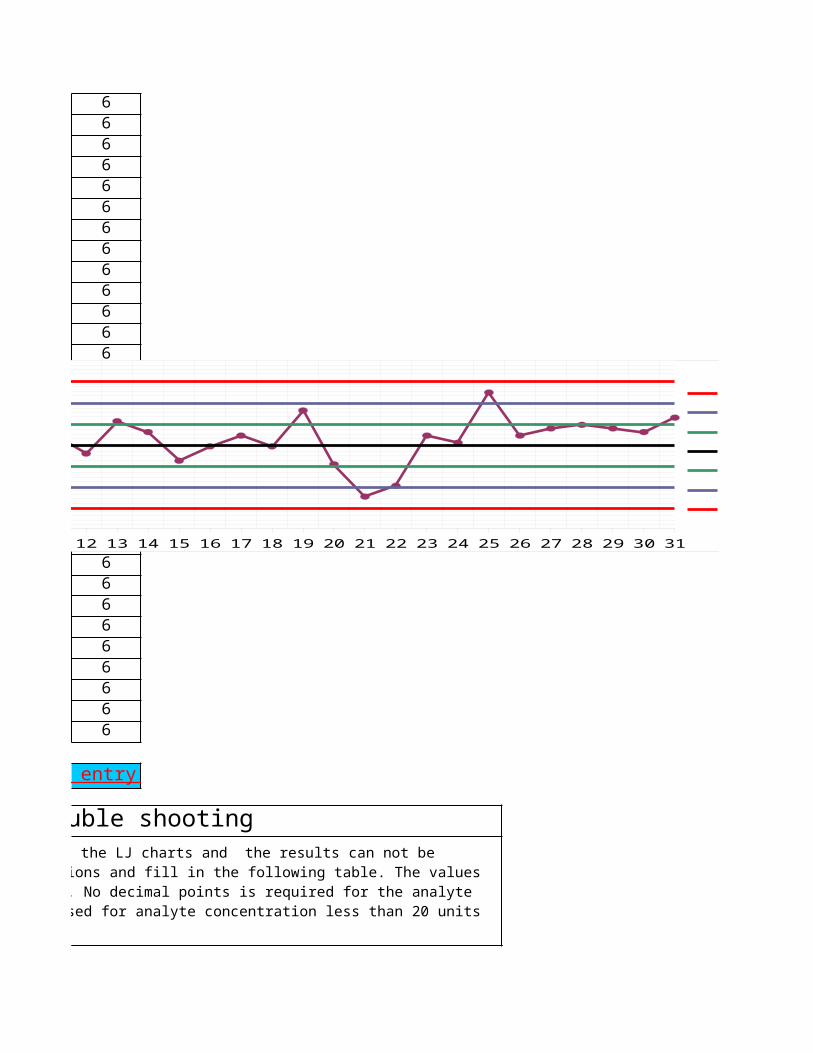
6666666666666666666666666666666
Erroneous results and trouble shooting Back to Data entry
3SD should not be used to plot the LJ charts and the results can not be reported without corrective actions. Take the necessary corrective actions and fill in the following table. The values of the outlying results and corrected results should be writen clearly. No decimal points is required for the analyte concentration greater than 20 units but two decimal points should be used for analyte concentration less than 20 units
1 2 3 4 5 6 7 8 9 10 11 12 13 14 15 16 17 18 19 20 21 22 23 24 25 26 27 28 29 30 31677379859197103109
+3SD+2SD+1SDMean -1SD-2SD-3SD
Leve
l II
: Ch
lori
de i
n mE
q/L
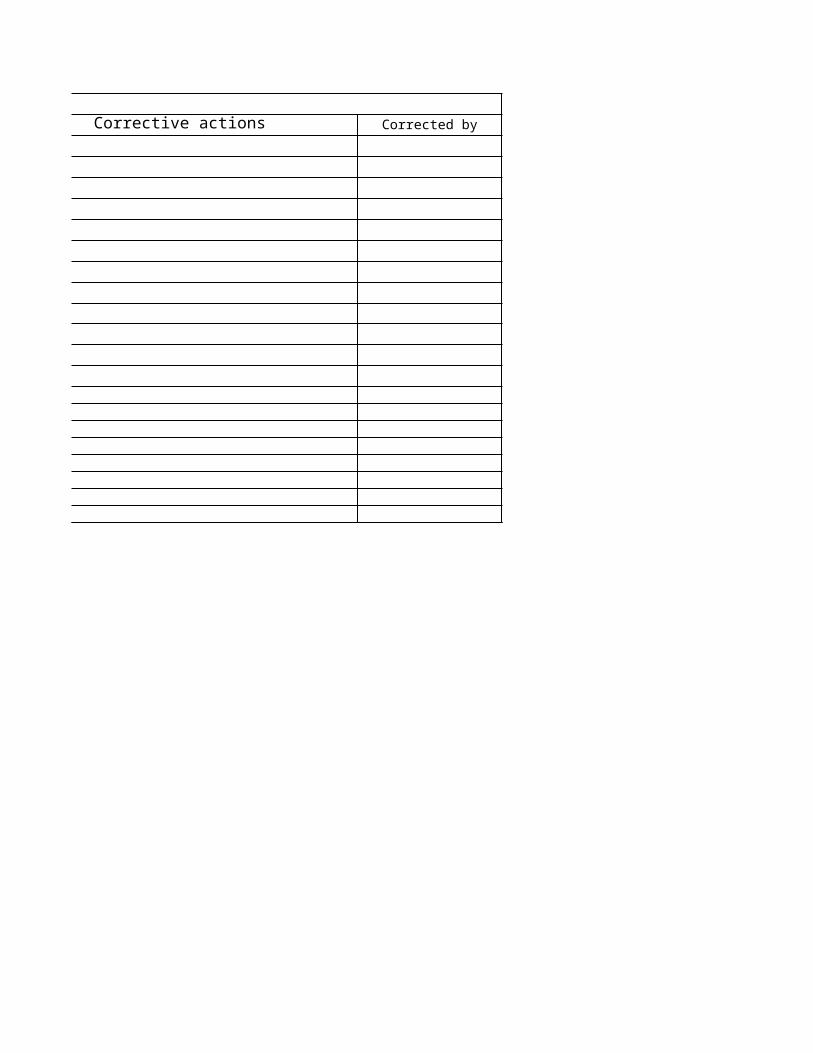
Corrective actions Corrected by

IQC IN BIOCHEMISTRY: Biorad QC Level I and II
1 2 3 4 5 6 7 8 9 10 11 12 13 14 15 16 17 18 19 20 21 22 23 24 25 26 27 28 29 30 31677379859197103109
+3SD+2SD+1SDMean -1SD-2SD-3SD
Leve
l II
: Ch
lori
de i
n mE
q/L
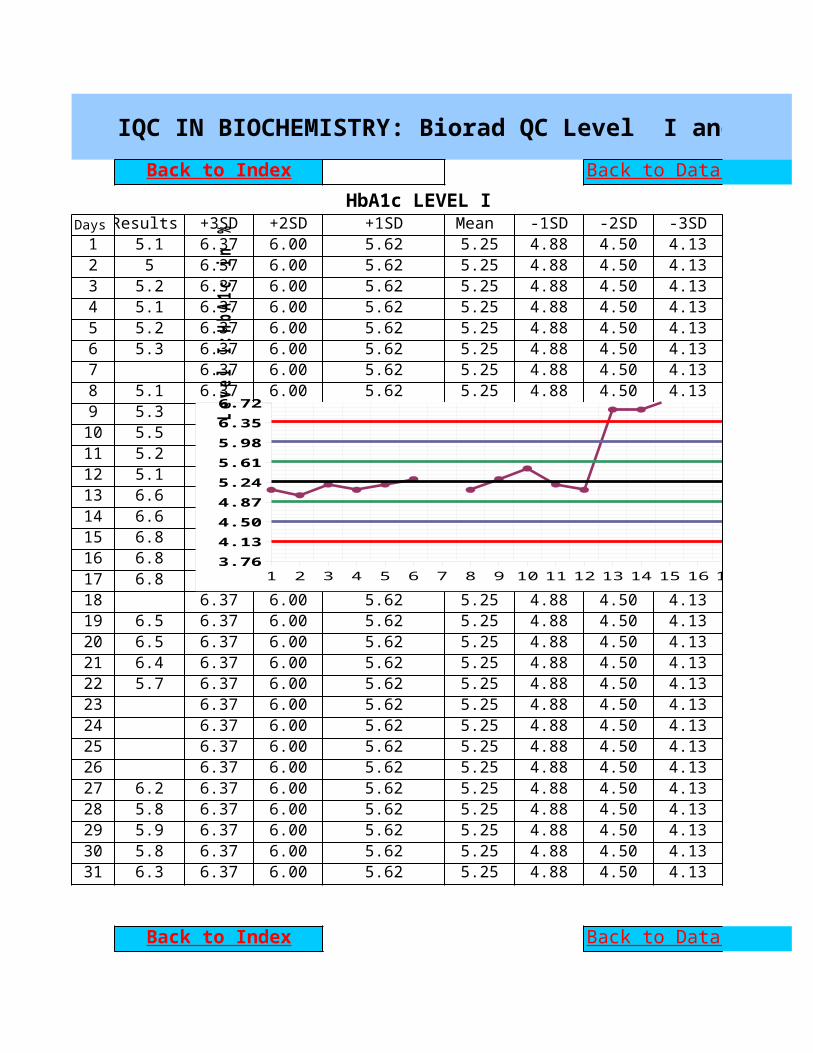
IQC IN BIOCHEMISTRY: Biorad QC Level I and II
HbA1c LEVEL IDays Results +3SD +2SD +1SD Mean -1SD -2SD -3SD1 5.1 6.37 6.00 5.62 5.25 4.88 4.50 4.132 5 6.37 6.00 5.62 5.25 4.88 4.50 4.133 5.2 6.37 6.00 5.62 5.25 4.88 4.50 4.134 5.1 6.37 6.00 5.62 5.25 4.88 4.50 4.135 5.2 6.37 6.00 5.62 5.25 4.88 4.50 4.136 5.3 6.37 6.00 5.62 5.25 4.88 4.50 4.137 6.37 6.00 5.62 5.25 4.88 4.50 4.138 5.1 6.37 6.00 5.62 5.25 4.88 4.50 4.139 5.3 6.37 6.00 5.62 5.25 4.88 4.50 4.1310 5.5 6.37 6.00 5.62 5.25 4.88 4.50 4.1311 5.2 6.37 6.00 5.62 5.25 4.88 4.50 4.1312 5.1 6.37 6.00 5.62 5.25 4.88 4.50 4.1313 6.6 6.37 6.00 5.62 5.25 4.88 4.50 4.1314 6.6 6.37 6.00 5.62 5.25 4.88 4.50 4.1315 6.8 6.37 6.00 5.62 5.25 4.88 4.50 4.1316 6.8 6.37 6.00 5.62 5.25 4.88 4.50 4.1317 6.8 6.37 6.00 5.62 5.25 4.88 4.50 4.1318 6.37 6.00 5.62 5.25 4.88 4.50 4.1319 6.5 6.37 6.00 5.62 5.25 4.88 4.50 4.1320 6.5 6.37 6.00 5.62 5.25 4.88 4.50 4.1321 6.4 6.37 6.00 5.62 5.25 4.88 4.50 4.1322 5.7 6.37 6.00 5.62 5.25 4.88 4.50 4.1323 6.37 6.00 5.62 5.25 4.88 4.50 4.1324 6.37 6.00 5.62 5.25 4.88 4.50 4.1325 6.37 6.00 5.62 5.25 4.88 4.50 4.1326 6.37 6.00 5.62 5.25 4.88 4.50 4.1327 6.2 6.37 6.00 5.62 5.25 4.88 4.50 4.1328 5.8 6.37 6.00 5.62 5.25 4.88 4.50 4.1329 5.9 6.37 6.00 5.62 5.25 4.88 4.50 4.1330 5.8 6.37 6.00 5.62 5.25 4.88 4.50 4.1331 6.3 6.37 6.00 5.62 5.25 4.88 4.50 4.13
Back to Index Back to Data entry
Back to Index Back to Data entry
1 2 3 4 5 6 7 8 9 10 11 12 13 14 15 16 17 18 19 20 21 22 23 24 25 26 27 28 29 30 313.764.134.504.875.245.615.986.356.72
+3SD+2SD+1SDMean -1SD-2SD-3SD
Leve
l I:
HbA1
c in
%
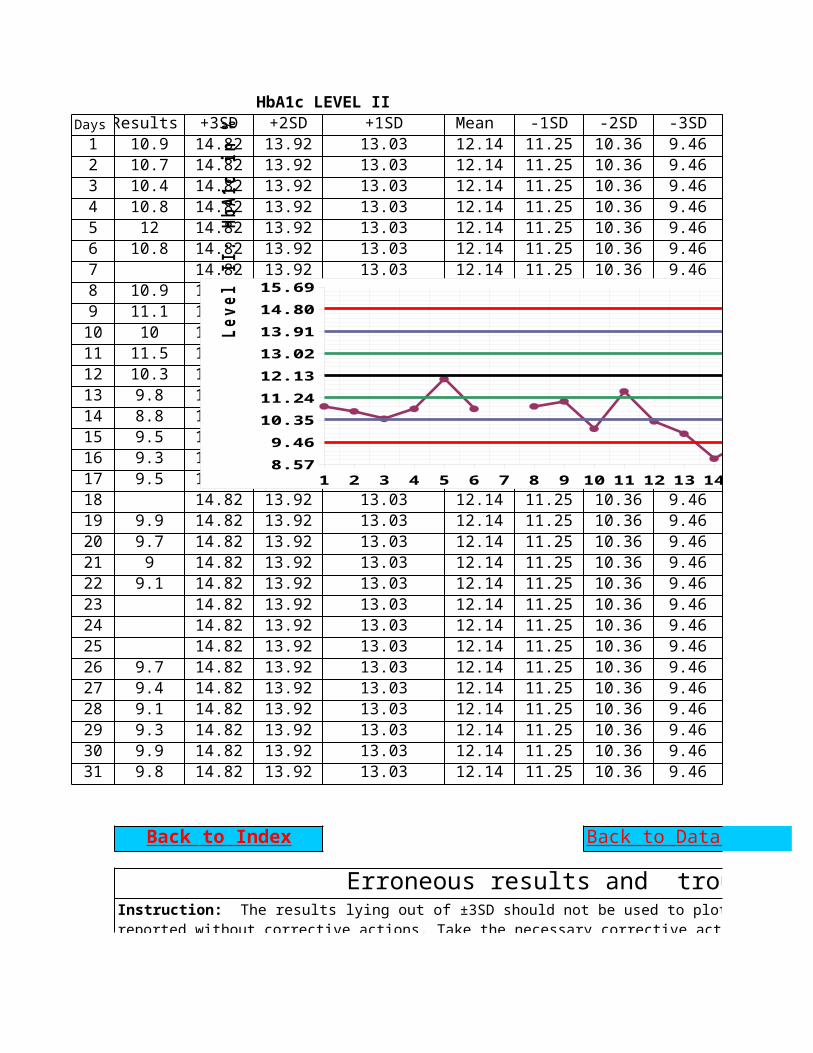
HbA1c LEVEL IIDays Results +3SD +2SD +1SD Mean -1SD -2SD -3SD1 10.9 14.82 13.92 13.03 12.14 11.25 10.36 9.462 10.7 14.82 13.92 13.03 12.14 11.25 10.36 9.463 10.4 14.82 13.92 13.03 12.14 11.25 10.36 9.464 10.8 14.82 13.92 13.03 12.14 11.25 10.36 9.465 12 14.82 13.92 13.03 12.14 11.25 10.36 9.466 10.8 14.82 13.92 13.03 12.14 11.25 10.36 9.467 14.82 13.92 13.03 12.14 11.25 10.36 9.468 10.9 14.82 13.92 13.03 12.14 11.25 10.36 9.469 11.1 14.82 13.92 13.03 12.14 11.25 10.36 9.4610 10 14.82 13.92 13.03 12.14 11.25 10.36 9.4611 11.5 14.82 13.92 13.03 12.14 11.25 10.36 9.4612 10.3 14.82 13.92 13.03 12.14 11.25 10.36 9.4613 9.8 14.82 13.92 13.03 12.14 11.25 10.36 9.4614 8.8 14.82 13.92 13.03 12.14 11.25 10.36 9.4615 9.5 14.82 13.92 13.03 12.14 11.25 10.36 9.4616 9.3 14.82 13.92 13.03 12.14 11.25 10.36 9.4617 9.5 14.82 13.92 13.03 12.14 11.25 10.36 9.4618 14.82 13.92 13.03 12.14 11.25 10.36 9.4619 9.9 14.82 13.92 13.03 12.14 11.25 10.36 9.4620 9.7 14.82 13.92 13.03 12.14 11.25 10.36 9.4621 9 14.82 13.92 13.03 12.14 11.25 10.36 9.4622 9.1 14.82 13.92 13.03 12.14 11.25 10.36 9.4623 14.82 13.92 13.03 12.14 11.25 10.36 9.4624 14.82 13.92 13.03 12.14 11.25 10.36 9.4625 14.82 13.92 13.03 12.14 11.25 10.36 9.4626 9.7 14.82 13.92 13.03 12.14 11.25 10.36 9.4627 9.4 14.82 13.92 13.03 12.14 11.25 10.36 9.4628 9.1 14.82 13.92 13.03 12.14 11.25 10.36 9.4629 9.3 14.82 13.92 13.03 12.14 11.25 10.36 9.4630 9.9 14.82 13.92 13.03 12.14 11.25 10.36 9.4631 9.8 14.82 13.92 13.03 12.14 11.25 10.36 9.46
Erroneous results and trouble shooting Back to Index Back to Data entry
Instruction: The results lying out of ±3SD should not be used to plot the LJ charts and the results can not be reported without corrective actions. Take the necessary corrective actions and fill in the following table. The values of the outlying results and corrected results should be writen clearly. No decimal points is required for the analyte concentration greater than 20 units but two decimal points should be used for analyte concentration less than 20 units (glucose = 89mg/dl; total bilirubin 1.56 mg/dl).
1 2 3 4 5 6 7 8 9 10 11 12 13 14 15 16 17 18 19 20 21 22 23 24 25 26 27 28 29 30 318.579.4610.3511.2412.1313.0213.9114.8015.69
+3SD+2SD+1SDMean -1SD-2SD-3SD
Leve
l II
: Hb
A1c
in %
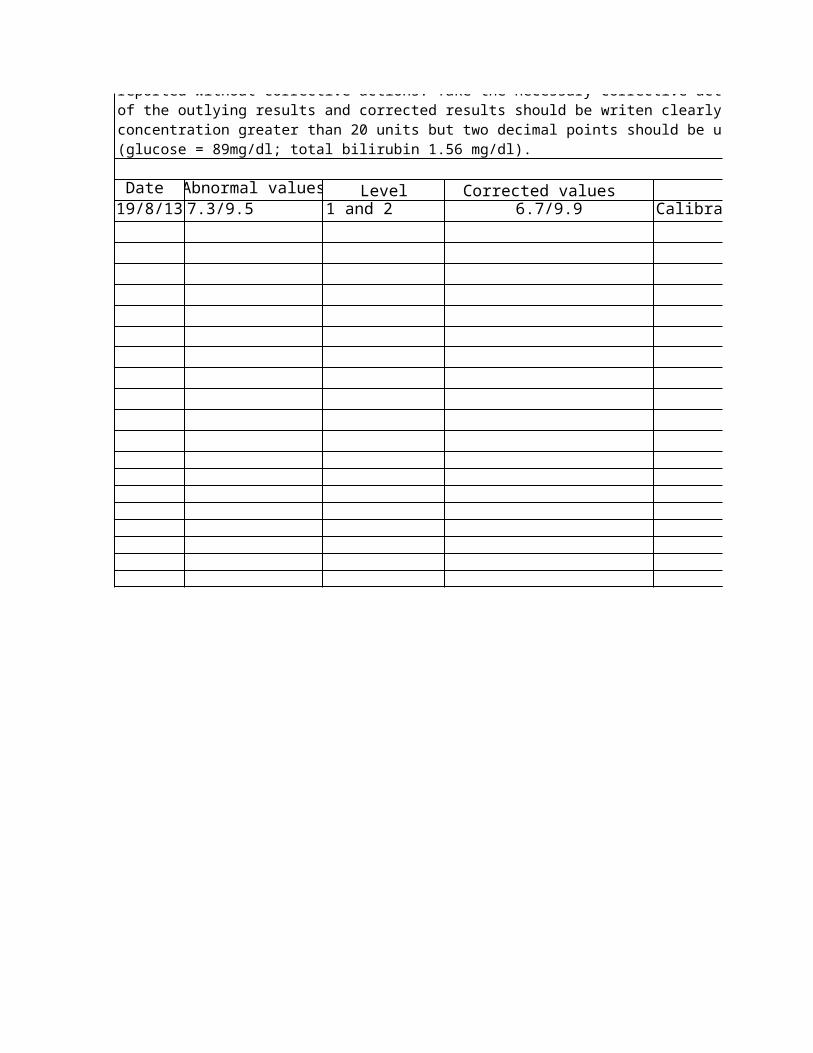
Date Abnormal values Level Corrected values Corrective actions19/8/13 7.3/9.5 1 and 2 6.7/9.9 Calibrated
Instruction: The results lying out of ±3SD should not be used to plot the LJ charts and the results can not be reported without corrective actions. Take the necessary corrective actions and fill in the following table. The values of the outlying results and corrected results should be writen clearly. No decimal points is required for the analyte concentration greater than 20 units but two decimal points should be used for analyte concentration less than 20 units (glucose = 89mg/dl; total bilirubin 1.56 mg/dl).
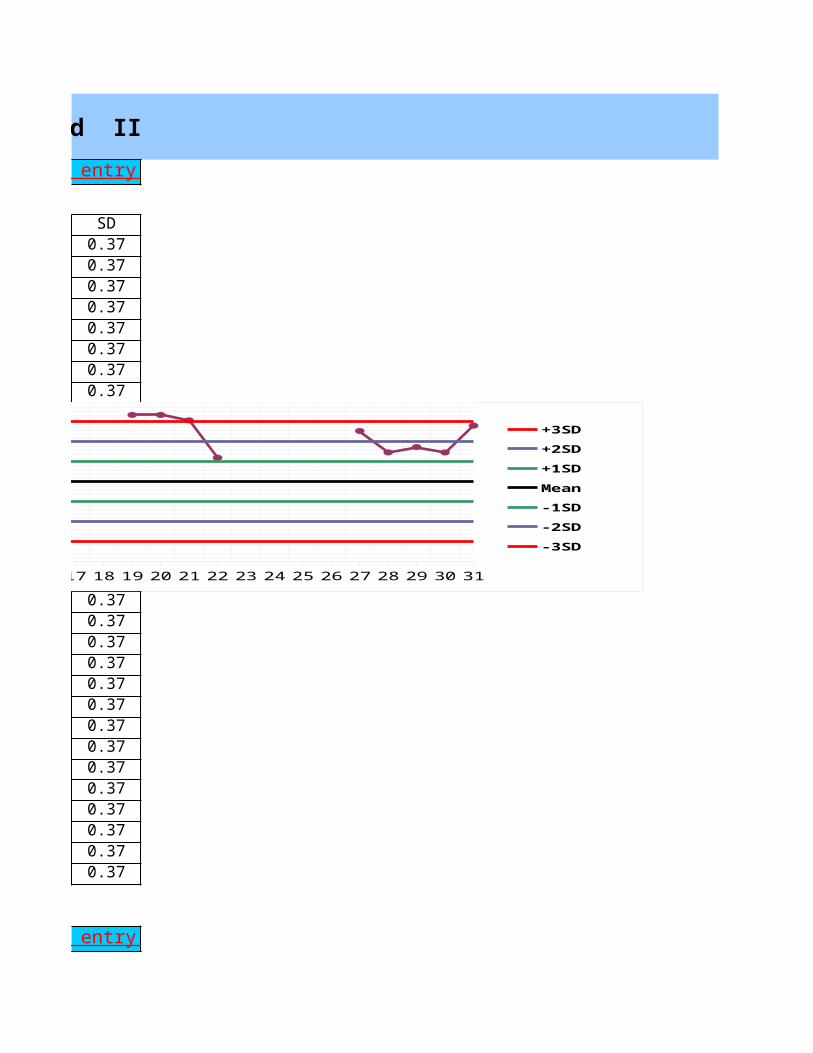
IQC IN BIOCHEMISTRY: Biorad QC Level I and II
SD0.370.370.370.370.370.370.370.370.370.370.370.370.370.370.370.370.370.370.370.370.370.370.370.370.370.370.370.370.370.370.37
Back to Data entry
Back to Data entry
1 2 3 4 5 6 7 8 9 10 11 12 13 14 15 16 17 18 19 20 21 22 23 24 25 26 27 28 29 30 313.764.134.504.875.245.615.986.356.72
+3SD+2SD+1SDMean -1SD-2SD-3SD
Leve
l I:
HbA1
c in
%
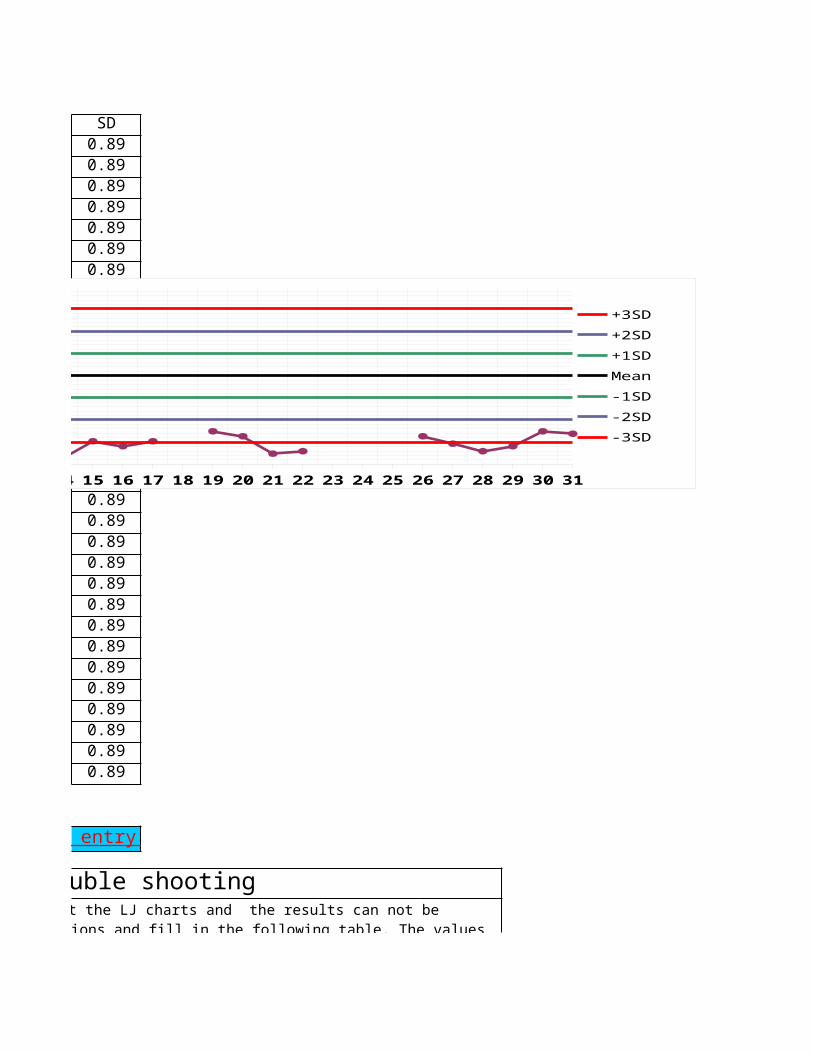
SD0.890.890.890.890.890.890.890.890.890.890.890.890.890.890.890.890.890.890.890.890.890.890.890.890.890.890.890.890.890.890.89
Erroneous results and trouble shooting Back to Data entry
3SD should not be used to plot the LJ charts and the results can not be reported without corrective actions. Take the necessary corrective actions and fill in the following table. The values of the outlying results and corrected results should be writen clearly. No decimal points is required for the analyte concentration greater than 20 units but two decimal points should be used for analyte concentration less than 20 units
1 2 3 4 5 6 7 8 9 10 11 12 13 14 15 16 17 18 19 20 21 22 23 24 25 26 27 28 29 30 318.579.4610.3511.2412.1313.0213.9114.8015.69
+3SD+2SD+1SDMean -1SD-2SD-3SD
Leve
l II
: Hb
A1c
in %
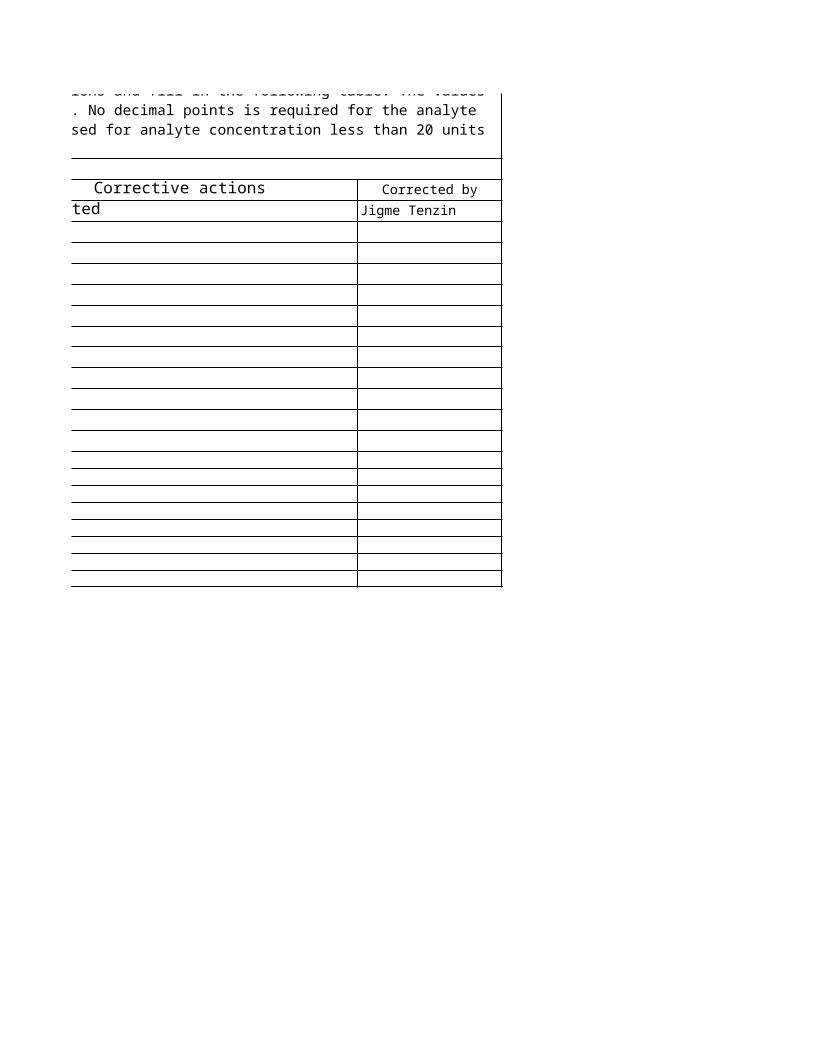
Corrective actions Corrected byCalibrated Jigme Tenzin
3SD should not be used to plot the LJ charts and the results can not be reported without corrective actions. Take the necessary corrective actions and fill in the following table. The values of the outlying results and corrected results should be writen clearly. No decimal points is required for the analyte concentration greater than 20 units but two decimal points should be used for analyte concentration less than 20 units

IQC IN BIOCHEMISTRY: Biorad QC Level I and II
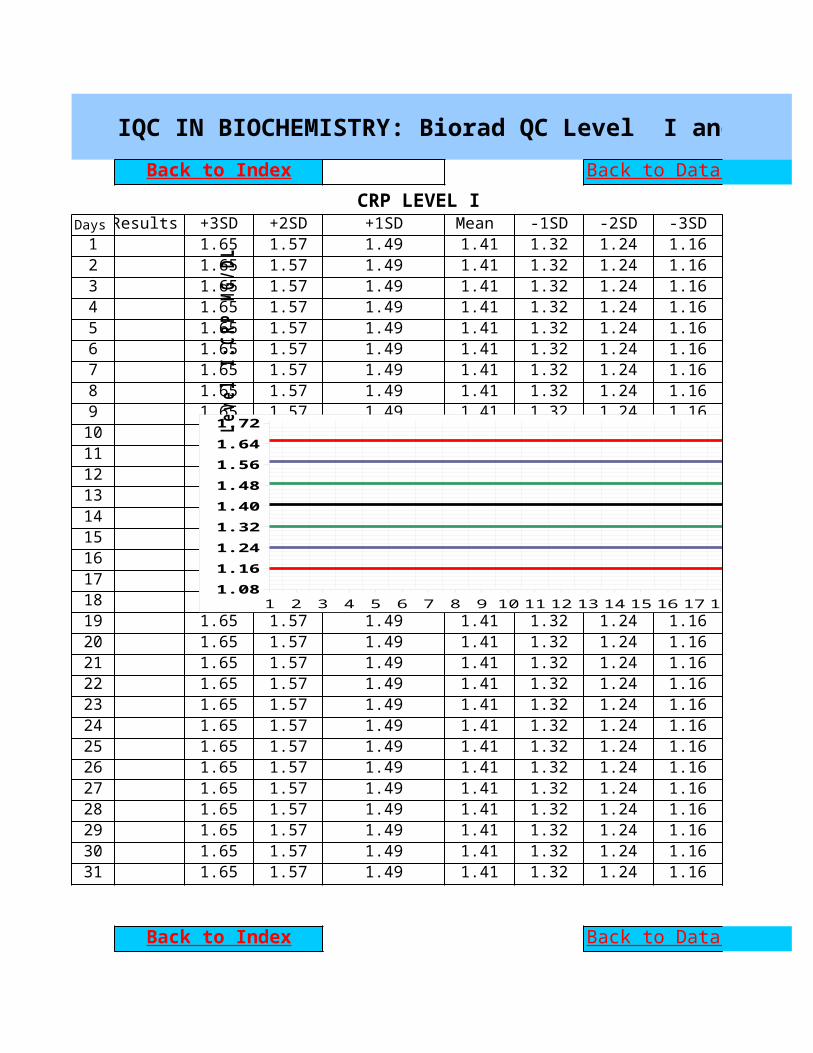
IQC IN BIOCHEMISTRY: Biorad QC Level I and II
CRP LEVEL IDays Results +3SD +2SD +1SD Mean -1SD -2SD -3SD1 1.65 1.57 1.49 1.41 1.32 1.24 1.162 1.65 1.57 1.49 1.41 1.32 1.24 1.163 1.65 1.57 1.49 1.41 1.32 1.24 1.164 1.65 1.57 1.49 1.41 1.32 1.24 1.165 1.65 1.57 1.49 1.41 1.32 1.24 1.166 1.65 1.57 1.49 1.41 1.32 1.24 1.167 1.65 1.57 1.49 1.41 1.32 1.24 1.168 1.65 1.57 1.49 1.41 1.32 1.24 1.169 1.65 1.57 1.49 1.41 1.32 1.24 1.1610 1.65 1.57 1.49 1.41 1.32 1.24 1.1611 1.65 1.57 1.49 1.41 1.32 1.24 1.1612 1.65 1.57 1.49 1.41 1.32 1.24 1.1613 1.65 1.57 1.49 1.41 1.32 1.24 1.1614 1.65 1.57 1.49 1.41 1.32 1.24 1.1615 1.65 1.57 1.49 1.41 1.32 1.24 1.1616 1.65 1.57 1.49 1.41 1.32 1.24 1.1617 1.65 1.57 1.49 1.41 1.32 1.24 1.1618 1.65 1.57 1.49 1.41 1.32 1.24 1.1619 1.65 1.57 1.49 1.41 1.32 1.24 1.1620 1.65 1.57 1.49 1.41 1.32 1.24 1.1621 1.65 1.57 1.49 1.41 1.32 1.24 1.1622 1.65 1.57 1.49 1.41 1.32 1.24 1.1623 1.65 1.57 1.49 1.41 1.32 1.24 1.1624 1.65 1.57 1.49 1.41 1.32 1.24 1.1625 1.65 1.57 1.49 1.41 1.32 1.24 1.1626 1.65 1.57 1.49 1.41 1.32 1.24 1.1627 1.65 1.57 1.49 1.41 1.32 1.24 1.1628 1.65 1.57 1.49 1.41 1.32 1.24 1.1629 1.65 1.57 1.49 1.41 1.32 1.24 1.1630 1.65 1.57 1.49 1.41 1.32 1.24 1.1631 1.65 1.57 1.49 1.41 1.32 1.24 1.16
Back to Index Back to Data entry
Back to Index Back to Data entry
1 2 3 4 5 6 7 8 9 10 11 12 13 14 15 16 17 18 19 20 21 22 23 24 25 26 27 28 29 30 311.081.161.241.321.401.481.561.641.72
+3SD+2SD+1SDMean -1SD-2SD-3SD
Leve
l I:
CRP
MG/D
L
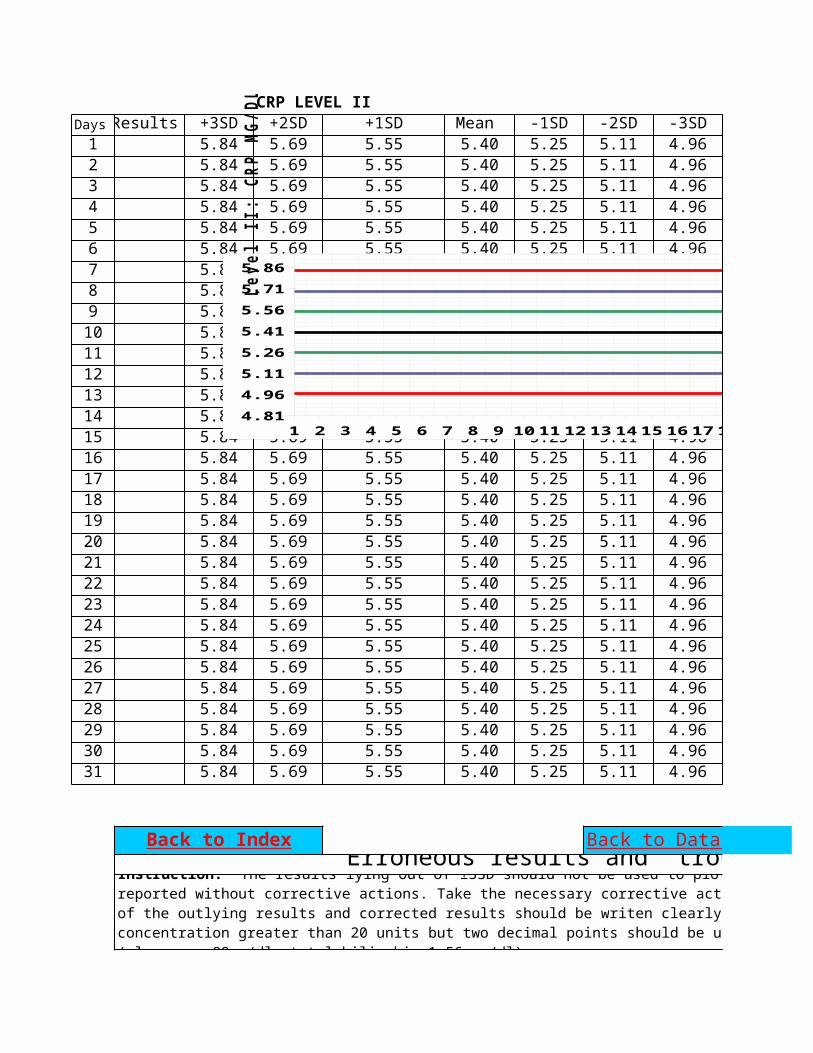
CRP LEVEL IIDays Results +3SD +2SD +1SD Mean -1SD -2SD -3SD1 5.84 5.69 5.55 5.40 5.25 5.11 4.962 5.84 5.69 5.55 5.40 5.25 5.11 4.963 5.84 5.69 5.55 5.40 5.25 5.11 4.964 5.84 5.69 5.55 5.40 5.25 5.11 4.965 5.84 5.69 5.55 5.40 5.25 5.11 4.966 5.84 5.69 5.55 5.40 5.25 5.11 4.967 5.84 5.69 5.55 5.40 5.25 5.11 4.968 5.84 5.69 5.55 5.40 5.25 5.11 4.969 5.84 5.69 5.55 5.40 5.25 5.11 4.9610 5.84 5.69 5.55 5.40 5.25 5.11 4.9611 5.84 5.69 5.55 5.40 5.25 5.11 4.9612 5.84 5.69 5.55 5.40 5.25 5.11 4.9613 5.84 5.69 5.55 5.40 5.25 5.11 4.9614 5.84 5.69 5.55 5.40 5.25 5.11 4.9615 5.84 5.69 5.55 5.40 5.25 5.11 4.9616 5.84 5.69 5.55 5.40 5.25 5.11 4.9617 5.84 5.69 5.55 5.40 5.25 5.11 4.9618 5.84 5.69 5.55 5.40 5.25 5.11 4.9619 5.84 5.69 5.55 5.40 5.25 5.11 4.9620 5.84 5.69 5.55 5.40 5.25 5.11 4.9621 5.84 5.69 5.55 5.40 5.25 5.11 4.9622 5.84 5.69 5.55 5.40 5.25 5.11 4.9623 5.84 5.69 5.55 5.40 5.25 5.11 4.9624 5.84 5.69 5.55 5.40 5.25 5.11 4.9625 5.84 5.69 5.55 5.40 5.25 5.11 4.9626 5.84 5.69 5.55 5.40 5.25 5.11 4.9627 5.84 5.69 5.55 5.40 5.25 5.11 4.9628 5.84 5.69 5.55 5.40 5.25 5.11 4.9629 5.84 5.69 5.55 5.40 5.25 5.11 4.9630 5.84 5.69 5.55 5.40 5.25 5.11 4.9631 5.84 5.69 5.55 5.40 5.25 5.11 4.96
Erroneous results and trouble shooting Back to Index Back to Data entry
Instruction: The results lying out of ±3SD should not be used to plot the LJ charts and the results can not be reported without corrective actions. Take the necessary corrective actions and fill in the following table. The values of the outlying results and corrected results should be writen clearly. No decimal points is required for the analyte concentration greater than 20 units but two decimal points should be used for analyte concentration less than 20 units (glucose = 89mg/dl; total bilirubin 1.56 mg/dl).
1 2 3 4 5 6 7 8 9 10 11 12 13 1415161718 19 20 21 22 23 24 25 26272829 30 314.814.965.115.265.415.565.715.86
+3SD+2SD+1SDMean -1SD-2SD-3SD
Leve
l II
: CR
P MG
/DL
Date Abnormal values Level Probable causes Corrective actions
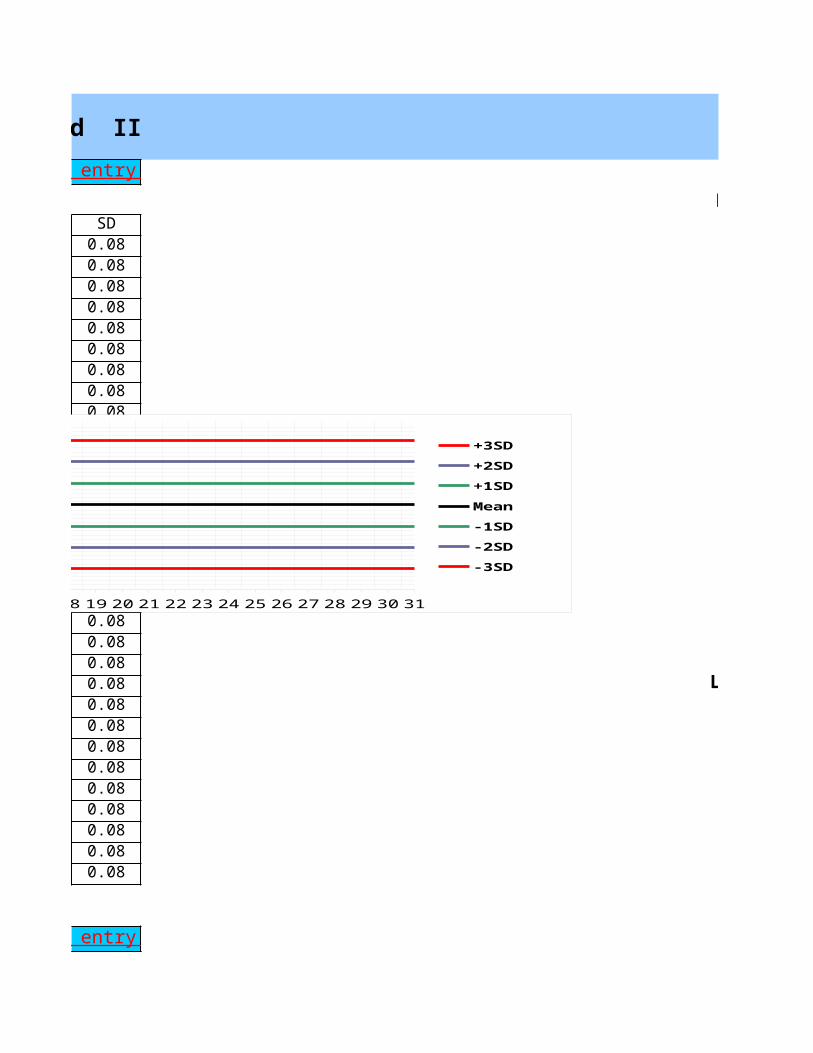
IQC IN BIOCHEMISTRY: Biorad QC Level I and II
LEVEL ISD
0.080.080.080.080.080.080.080.080.080.080.080.080.080.080.080.080.080.080.080.080.080.08 LEVEL II0.080.080.080.080.080.080.080.080.08
Back to Data entry
Back to Data entry
1 2 3 4 5 6 7 8 9 10 11 12 13 14 15 16 17 18 19 20 21 22 23 24 25 26 27 28 29 30 311.081.161.241.321.401.481.561.641.72
+3SD+2SD+1SDMean -1SD-2SD-3SD
Leve
l I:
CRP
MG/D
L
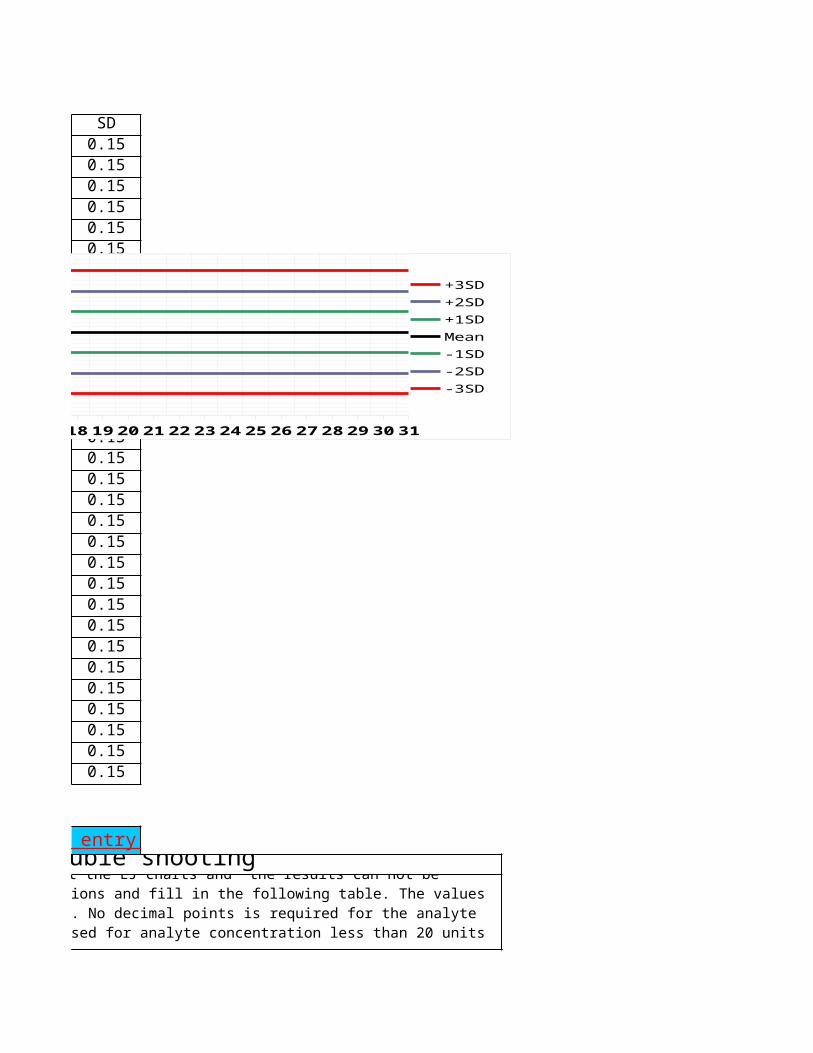
SD0.150.150.150.150.150.150.150.150.150.150.150.150.150.150.150.150.150.150.150.150.150.150.150.150.150.150.150.150.150.150.15
Erroneous results and trouble shooting Back to Data entry
3SD should not be used to plot the LJ charts and the results can not be reported without corrective actions. Take the necessary corrective actions and fill in the following table. The values of the outlying results and corrected results should be writen clearly. No decimal points is required for the analyte concentration greater than 20 units but two decimal points should be used for analyte concentration less than 20 units
1 2 3 4 5 6 7 8 9 10 1112 13 14 15 16 17 18 19 20 21 22 23 24 2526 272829 30 314.814.965.115.265.415.565.715.86
+3SD+2SD+1SDMean -1SD-2SD-3SD
Leve
l II
: CR
P MG
/DL

Corrective actions Corrected by
IQC IN BIOCHEMISTRY: Biorad QC Level I and II
LEVEL I
LEVEL II
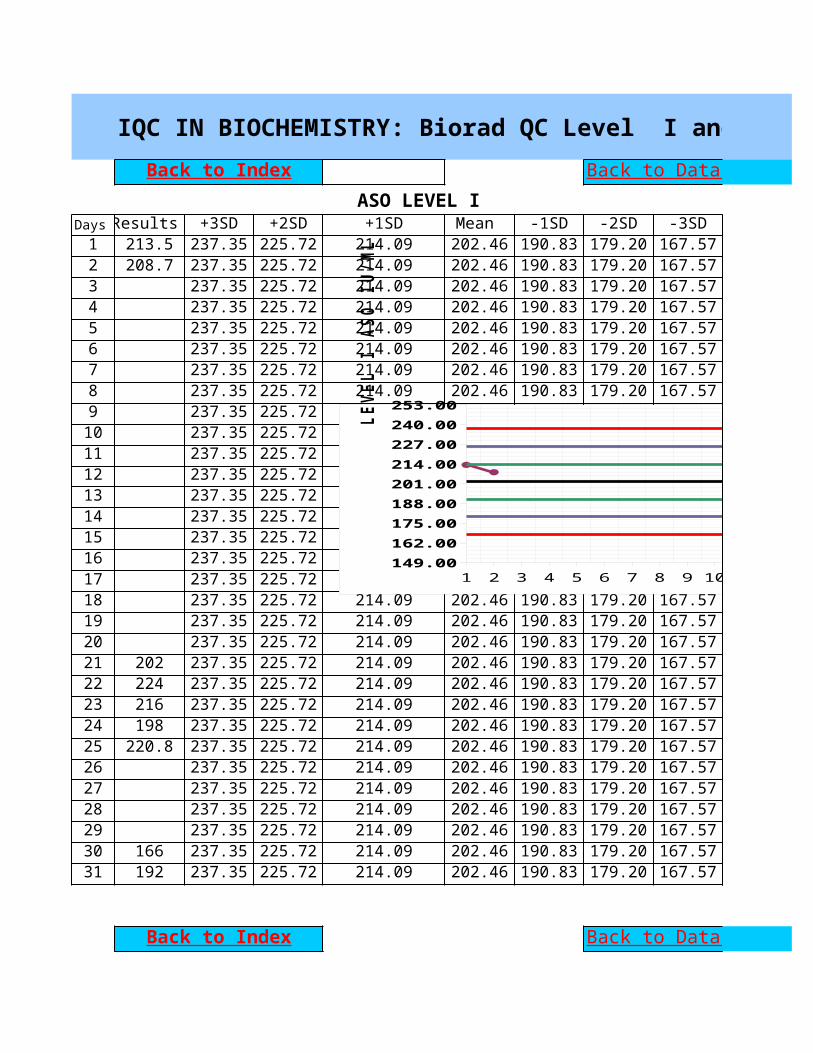
IQC IN BIOCHEMISTRY: Biorad QC Level I and II
ASO LEVEL IDays Results +3SD +2SD +1SD Mean -1SD -2SD -3SD1 213.5 237.35 225.72 214.09 202.46 190.83 179.20 167.572 208.7 237.35 225.72 214.09 202.46 190.83 179.20 167.573 237.35 225.72 214.09 202.46 190.83 179.20 167.574 237.35 225.72 214.09 202.46 190.83 179.20 167.575 237.35 225.72 214.09 202.46 190.83 179.20 167.576 237.35 225.72 214.09 202.46 190.83 179.20 167.577 237.35 225.72 214.09 202.46 190.83 179.20 167.578 237.35 225.72 214.09 202.46 190.83 179.20 167.579 237.35 225.72 214.09 202.46 190.83 179.20 167.5710 237.35 225.72 214.09 202.46 190.83 179.20 167.5711 237.35 225.72 214.09 202.46 190.83 179.20 167.5712 237.35 225.72 214.09 202.46 190.83 179.20 167.5713 237.35 225.72 214.09 202.46 190.83 179.20 167.5714 237.35 225.72 214.09 202.46 190.83 179.20 167.5715 237.35 225.72 214.09 202.46 190.83 179.20 167.5716 237.35 225.72 214.09 202.46 190.83 179.20 167.5717 237.35 225.72 214.09 202.46 190.83 179.20 167.5718 237.35 225.72 214.09 202.46 190.83 179.20 167.5719 237.35 225.72 214.09 202.46 190.83 179.20 167.5720 237.35 225.72 214.09 202.46 190.83 179.20 167.5721 202 237.35 225.72 214.09 202.46 190.83 179.20 167.5722 224 237.35 225.72 214.09 202.46 190.83 179.20 167.5723 216 237.35 225.72 214.09 202.46 190.83 179.20 167.5724 198 237.35 225.72 214.09 202.46 190.83 179.20 167.5725 220.8 237.35 225.72 214.09 202.46 190.83 179.20 167.5726 237.35 225.72 214.09 202.46 190.83 179.20 167.5727 237.35 225.72 214.09 202.46 190.83 179.20 167.5728 237.35 225.72 214.09 202.46 190.83 179.20 167.5729 237.35 225.72 214.09 202.46 190.83 179.20 167.5730 166 237.35 225.72 214.09 202.46 190.83 179.20 167.5731 192 237.35 225.72 214.09 202.46 190.83 179.20 167.57
Back to Index Back to Data entry
Back to Index Back to Data entry
1 2 3 4 5 6 7 8 9 10 11 12 13 14 15 16 17 18 19 20 21 22 23 24 25 26 27 28 29 30 31149.00162.00175.00188.00201.00214.00227.00240.00253.00
+3SD+2SD+1SDMean -1SD-2SD-3SD
LEVE
L I
ASO
IU/M
L
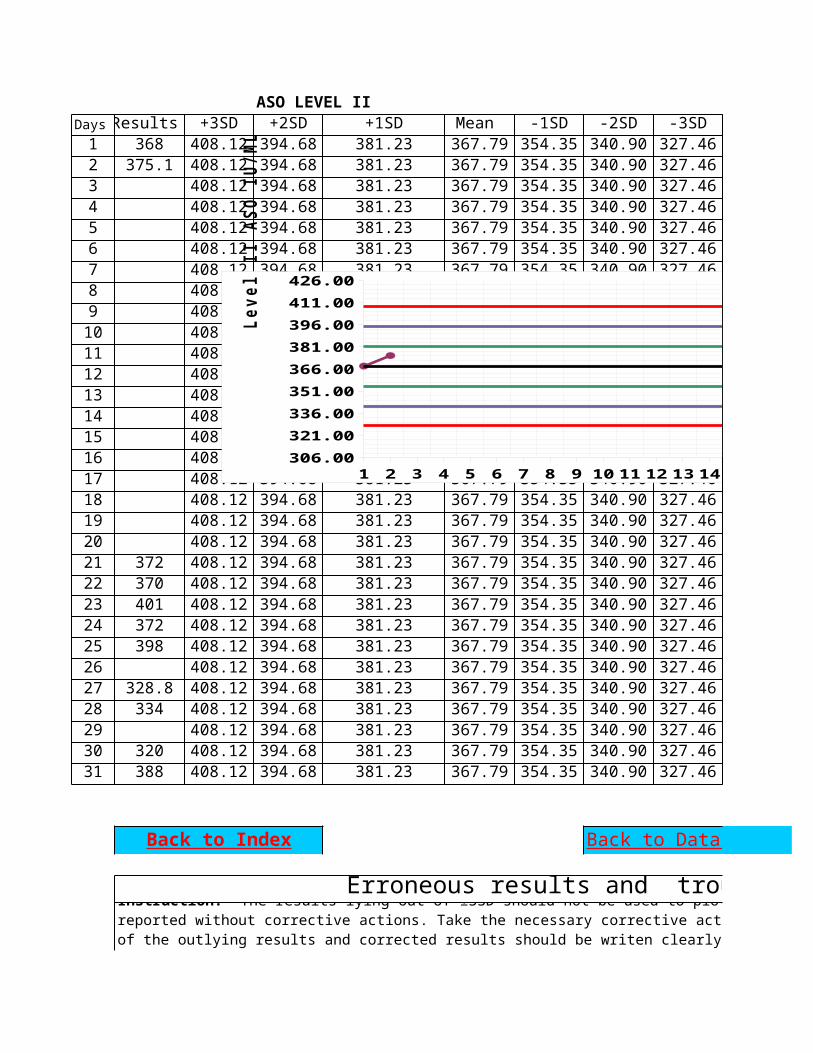
ASO LEVEL IIDays Results +3SD +2SD +1SD Mean -1SD -2SD -3SD1 368 408.12 394.68 381.23 367.79 354.35 340.90 327.462 375.1 408.12 394.68 381.23 367.79 354.35 340.90 327.463 408.12 394.68 381.23 367.79 354.35 340.90 327.464 408.12 394.68 381.23 367.79 354.35 340.90 327.465 408.12 394.68 381.23 367.79 354.35 340.90 327.466 408.12 394.68 381.23 367.79 354.35 340.90 327.467 408.12 394.68 381.23 367.79 354.35 340.90 327.468 408.12 394.68 381.23 367.79 354.35 340.90 327.469 408.12 394.68 381.23 367.79 354.35 340.90 327.4610 408.12 394.68 381.23 367.79 354.35 340.90 327.4611 408.12 394.68 381.23 367.79 354.35 340.90 327.4612 408.12 394.68 381.23 367.79 354.35 340.90 327.4613 408.12 394.68 381.23 367.79 354.35 340.90 327.4614 408.12 394.68 381.23 367.79 354.35 340.90 327.4615 408.12 394.68 381.23 367.79 354.35 340.90 327.4616 408.12 394.68 381.23 367.79 354.35 340.90 327.4617 408.12 394.68 381.23 367.79 354.35 340.90 327.4618 408.12 394.68 381.23 367.79 354.35 340.90 327.4619 408.12 394.68 381.23 367.79 354.35 340.90 327.4620 408.12 394.68 381.23 367.79 354.35 340.90 327.4621 372 408.12 394.68 381.23 367.79 354.35 340.90 327.4622 370 408.12 394.68 381.23 367.79 354.35 340.90 327.4623 401 408.12 394.68 381.23 367.79 354.35 340.90 327.4624 372 408.12 394.68 381.23 367.79 354.35 340.90 327.4625 398 408.12 394.68 381.23 367.79 354.35 340.90 327.4626 408.12 394.68 381.23 367.79 354.35 340.90 327.4627 328.8 408.12 394.68 381.23 367.79 354.35 340.90 327.4628 334 408.12 394.68 381.23 367.79 354.35 340.90 327.4629 408.12 394.68 381.23 367.79 354.35 340.90 327.4630 320 408.12 394.68 381.23 367.79 354.35 340.90 327.4631 388 408.12 394.68 381.23 367.79 354.35 340.90 327.46
Erroneous results and trouble shooting Back to Index Back to Data entry
Instruction: The results lying out of ±3SD should not be used to plot the LJ charts and the results can not be reported without corrective actions. Take the necessary corrective actions and fill in the following table. The values of the outlying results and corrected results should be writen clearly. No decimal points is required for the analyte concentration greater than 20 units but two decimal points should be used for analyte concentration less than 20 units (glucose = 89mg/dl; total bilirubin 1.56 mg/dl).
1 2 3 4 5 6 7 8 9 10 11 12 13 14 15 16 17 18 19 20 21 22 23 24 25 26 27 28 29 30 31306.00321.00336.00351.00366.00381.00396.00411.00426.00
+3SD+2SD+1SDMean -1SD-2SD-3SD
Leve
l II
ASO
IU/
ML

Date Abnormal values Level Corrected values Corrective actions
Instruction: The results lying out of ±3SD should not be used to plot the LJ charts and the results can not be reported without corrective actions. Take the necessary corrective actions and fill in the following table. The values of the outlying results and corrected results should be writen clearly. No decimal points is required for the analyte concentration greater than 20 units but two decimal points should be used for analyte concentration less than 20 units (glucose = 89mg/dl; total bilirubin 1.56 mg/dl).
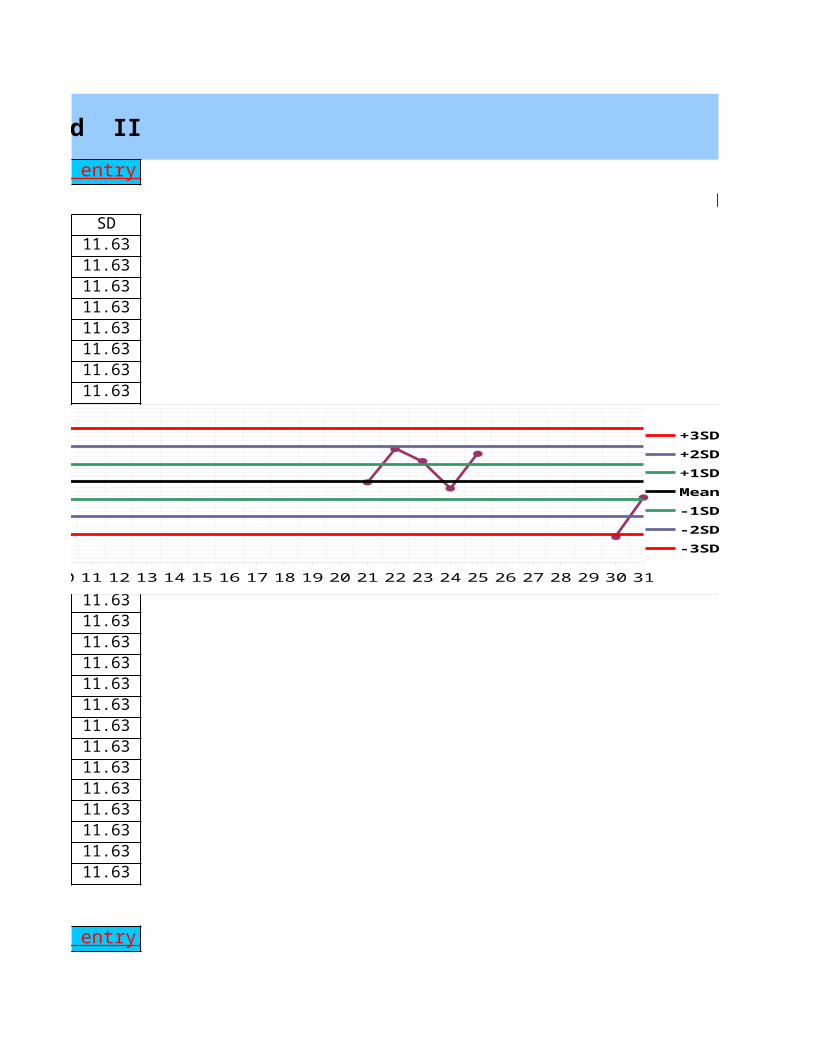
IQC IN BIOCHEMISTRY: Biorad QC Level I and II
LEVEL ISD
11.6311.6311.6311.6311.6311.6311.6311.6311.6311.6311.6311.6311.6311.6311.6311.6311.6311.6311.6311.6311.6311.6311.6311.6311.6311.6311.6311.6311.6311.6311.63
Back to Data entry
Back to Data entry
1 2 3 4 5 6 7 8 9 10 11 12 13 14 15 16 17 18 19 20 21 22 23 24 25 26 27 28 29 30 31149.00162.00175.00188.00201.00214.00227.00240.00253.00
+3SD+2SD+1SDMean -1SD-2SD-3SD
LEVE
L I
ASO
IU/M
L
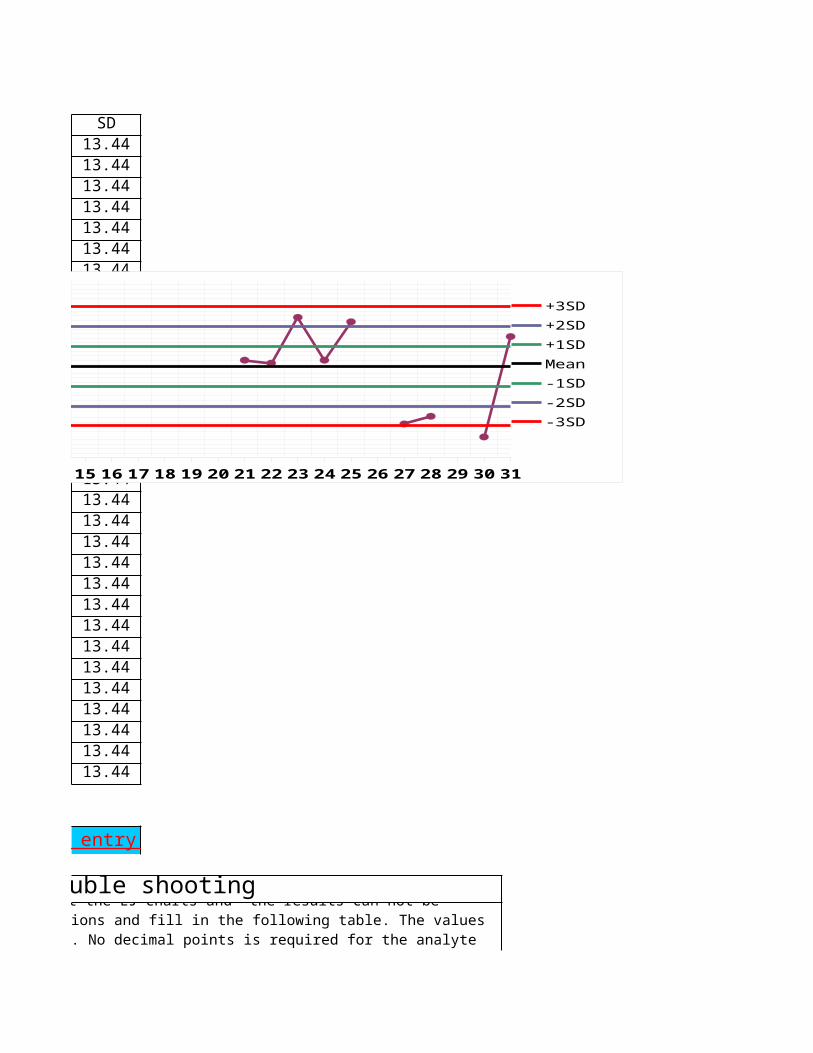
SD13.4413.4413.4413.4413.4413.4413.4413.4413.4413.4413.4413.4413.4413.4413.4413.4413.4413.4413.4413.4413.4413.4413.4413.4413.4413.4413.4413.4413.4413.4413.44
Erroneous results and trouble shooting Back to Data entry
3SD should not be used to plot the LJ charts and the results can not be reported without corrective actions. Take the necessary corrective actions and fill in the following table. The values of the outlying results and corrected results should be writen clearly. No decimal points is required for the analyte concentration greater than 20 units but two decimal points should be used for analyte concentration less than 20 units
1 2 3 4 5 6 7 8 9 10 11 12 13 14 15 16 17 18 19 20 21 22 23 24 25 26 27 28 29 30 31306.00321.00336.00351.00366.00381.00396.00411.00426.00
+3SD+2SD+1SDMean -1SD-2SD-3SD
Leve
l II
ASO
IU/
ML

Corrective actions Corrected by
3SD should not be used to plot the LJ charts and the results can not be reported without corrective actions. Take the necessary corrective actions and fill in the following table. The values of the outlying results and corrected results should be writen clearly. No decimal points is required for the analyte concentration greater than 20 units but two decimal points should be used for analyte concentration less than 20 units
IQC IN BIOCHEMISTRY: Biorad QC Level I and II
LEVEL I
1 2 3 4 5 6 7 8 9 10 11 12 13 14 15 16 17 18 19 20 21 22 23 24 25 26 27 28 29 30 31149.00162.00175.00188.00201.00214.00227.00240.00253.00
+3SD+2SD+1SDMean -1SD-2SD-3SD
LEVE
L I
ASO
IU/M
L
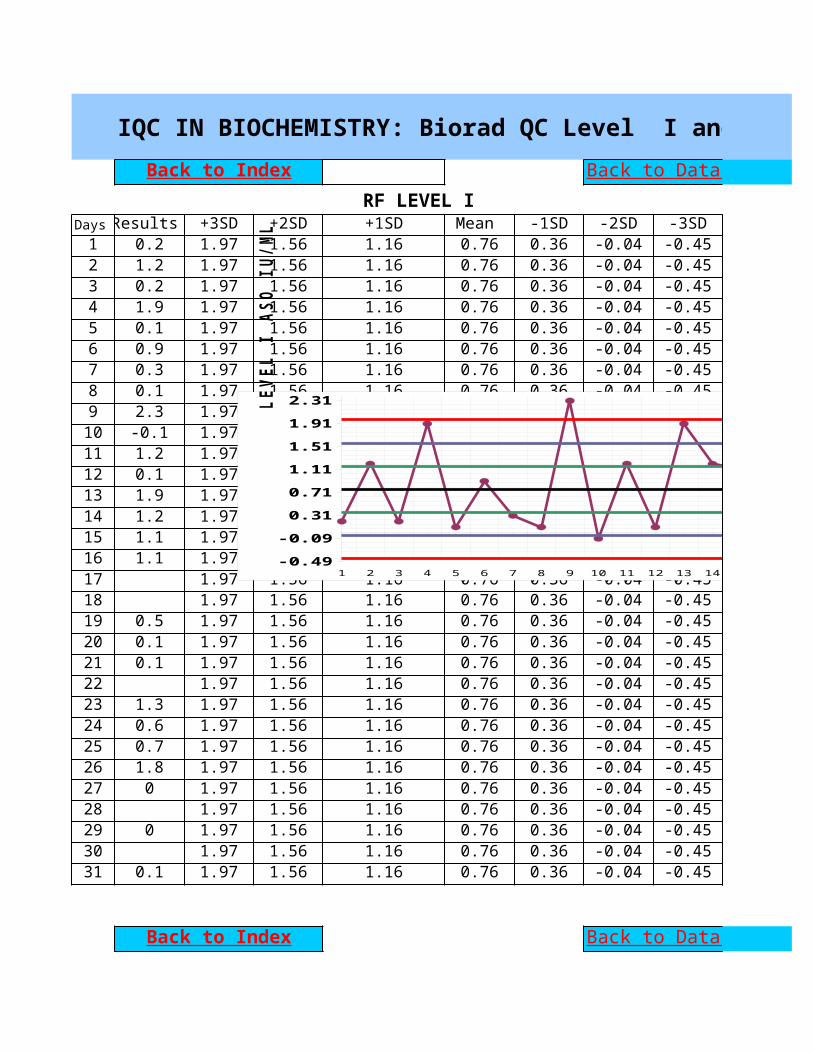
IQC IN BIOCHEMISTRY: Biorad QC Level I and II
RF LEVEL IDays Results +3SD +2SD +1SD Mean -1SD -2SD -3SD1 0.2 1.97 1.56 1.16 0.76 0.36 -0.04 -0.452 1.2 1.97 1.56 1.16 0.76 0.36 -0.04 -0.453 0.2 1.97 1.56 1.16 0.76 0.36 -0.04 -0.454 1.9 1.97 1.56 1.16 0.76 0.36 -0.04 -0.455 0.1 1.97 1.56 1.16 0.76 0.36 -0.04 -0.456 0.9 1.97 1.56 1.16 0.76 0.36 -0.04 -0.457 0.3 1.97 1.56 1.16 0.76 0.36 -0.04 -0.458 0.1 1.97 1.56 1.16 0.76 0.36 -0.04 -0.459 2.3 1.97 1.56 1.16 0.76 0.36 -0.04 -0.4510 -0.1 1.97 1.56 1.16 0.76 0.36 -0.04 -0.4511 1.2 1.97 1.56 1.16 0.76 0.36 -0.04 -0.4512 0.1 1.97 1.56 1.16 0.76 0.36 -0.04 -0.4513 1.9 1.97 1.56 1.16 0.76 0.36 -0.04 -0.4514 1.2 1.97 1.56 1.16 0.76 0.36 -0.04 -0.4515 1.1 1.97 1.56 1.16 0.76 0.36 -0.04 -0.4516 1.1 1.97 1.56 1.16 0.76 0.36 -0.04 -0.4517 1.97 1.56 1.16 0.76 0.36 -0.04 -0.4518 1.97 1.56 1.16 0.76 0.36 -0.04 -0.4519 0.5 1.97 1.56 1.16 0.76 0.36 -0.04 -0.4520 0.1 1.97 1.56 1.16 0.76 0.36 -0.04 -0.4521 0.1 1.97 1.56 1.16 0.76 0.36 -0.04 -0.4522 1.97 1.56 1.16 0.76 0.36 -0.04 -0.4523 1.3 1.97 1.56 1.16 0.76 0.36 -0.04 -0.4524 0.6 1.97 1.56 1.16 0.76 0.36 -0.04 -0.4525 0.7 1.97 1.56 1.16 0.76 0.36 -0.04 -0.4526 1.8 1.97 1.56 1.16 0.76 0.36 -0.04 -0.4527 0 1.97 1.56 1.16 0.76 0.36 -0.04 -0.4528 1.97 1.56 1.16 0.76 0.36 -0.04 -0.4529 0 1.97 1.56 1.16 0.76 0.36 -0.04 -0.4530 1.97 1.56 1.16 0.76 0.36 -0.04 -0.4531 0.1 1.97 1.56 1.16 0.76 0.36 -0.04 -0.45
Back to Index Back to Data entry
Back to Index Back to Data entry
1 2 3 4 5 6 7 8 9 10 11 12 13 14 15 16 17 18 19 20 21 22 23 24 25 26 27 28 29 30 31-0.49-0.090.310.711.111.511.912.31
+3SD+2SD+1SDMean -1SD-2SD-3SD
LEVE
L I
ASO
IU/M
L
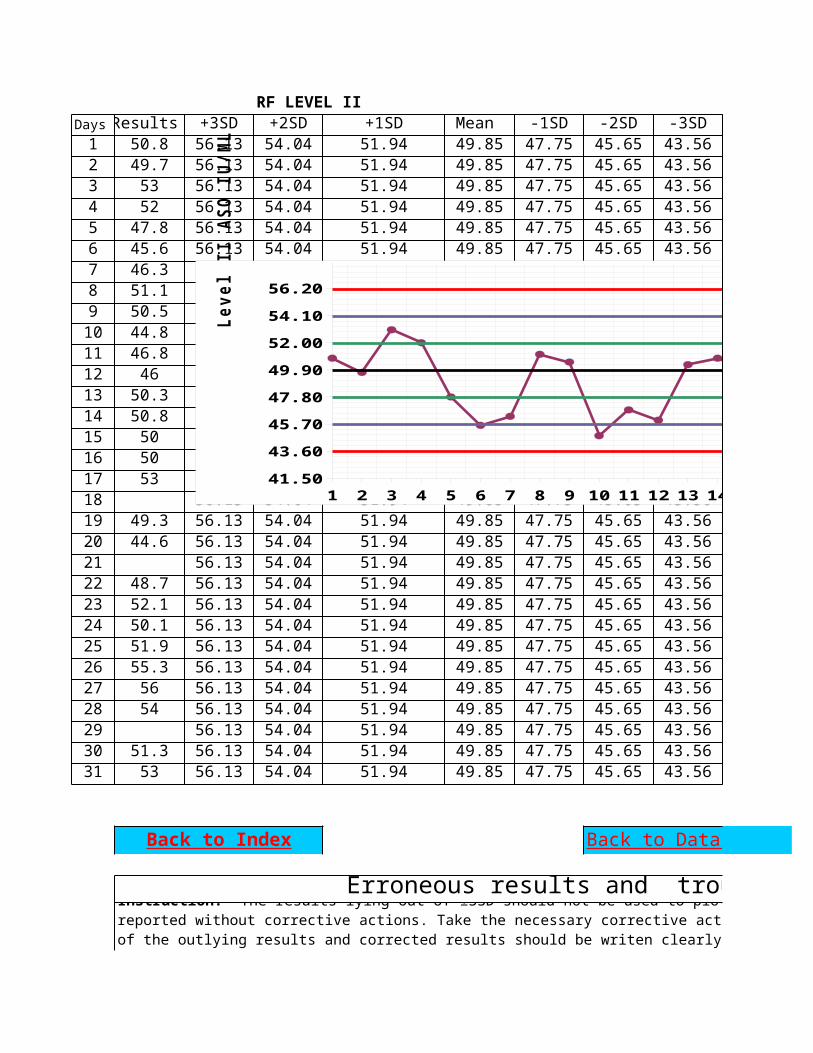
RF LEVEL IIDays Results +3SD +2SD +1SD Mean -1SD -2SD -3SD1 50.8 56.13 54.04 51.94 49.85 47.75 45.65 43.562 49.7 56.13 54.04 51.94 49.85 47.75 45.65 43.563 53 56.13 54.04 51.94 49.85 47.75 45.65 43.564 52 56.13 54.04 51.94 49.85 47.75 45.65 43.565 47.8 56.13 54.04 51.94 49.85 47.75 45.65 43.566 45.6 56.13 54.04 51.94 49.85 47.75 45.65 43.567 46.3 56.13 54.04 51.94 49.85 47.75 45.65 43.568 51.1 56.13 54.04 51.94 49.85 47.75 45.65 43.569 50.5 56.13 54.04 51.94 49.85 47.75 45.65 43.5610 44.8 56.13 54.04 51.94 49.85 47.75 45.65 43.5611 46.8 56.13 54.04 51.94 49.85 47.75 45.65 43.5612 46 56.13 54.04 51.94 49.85 47.75 45.65 43.5613 50.3 56.13 54.04 51.94 49.85 47.75 45.65 43.5614 50.8 56.13 54.04 51.94 49.85 47.75 45.65 43.5615 50 56.13 54.04 51.94 49.85 47.75 45.65 43.5616 50 56.13 54.04 51.94 49.85 47.75 45.65 43.5617 53 56.13 54.04 51.94 49.85 47.75 45.65 43.5618 56.13 54.04 51.94 49.85 47.75 45.65 43.5619 49.3 56.13 54.04 51.94 49.85 47.75 45.65 43.5620 44.6 56.13 54.04 51.94 49.85 47.75 45.65 43.5621 56.13 54.04 51.94 49.85 47.75 45.65 43.5622 48.7 56.13 54.04 51.94 49.85 47.75 45.65 43.5623 52.1 56.13 54.04 51.94 49.85 47.75 45.65 43.5624 50.1 56.13 54.04 51.94 49.85 47.75 45.65 43.5625 51.9 56.13 54.04 51.94 49.85 47.75 45.65 43.5626 55.3 56.13 54.04 51.94 49.85 47.75 45.65 43.5627 56 56.13 54.04 51.94 49.85 47.75 45.65 43.5628 54 56.13 54.04 51.94 49.85 47.75 45.65 43.5629 56.13 54.04 51.94 49.85 47.75 45.65 43.5630 51.3 56.13 54.04 51.94 49.85 47.75 45.65 43.5631 53 56.13 54.04 51.94 49.85 47.75 45.65 43.56
Erroneous results and trouble shooting Back to Index Back to Data entry
Instruction: The results lying out of ±3SD should not be used to plot the LJ charts and the results can not be reported without corrective actions. Take the necessary corrective actions and fill in the following table. The values of the outlying results and corrected results should be writen clearly. No decimal points is required for the analyte concentration greater than 20 units but two decimal points should be used for analyte concentration less than 20 units (glucose = 89mg/dl; total bilirubin 1.56 mg/dl).
1 2 3 4 5 6 7 8 9 10 11 12 13 14 15 16 17 18 19 20 21 22 23 24 25 26 27 28 29 30 3141.5043.6045.7047.8049.9052.0054.1056.20
+3SD+2SD+1SDMean -1SD-2SD-3SD
Leve
l II
ASO
IU/
ML
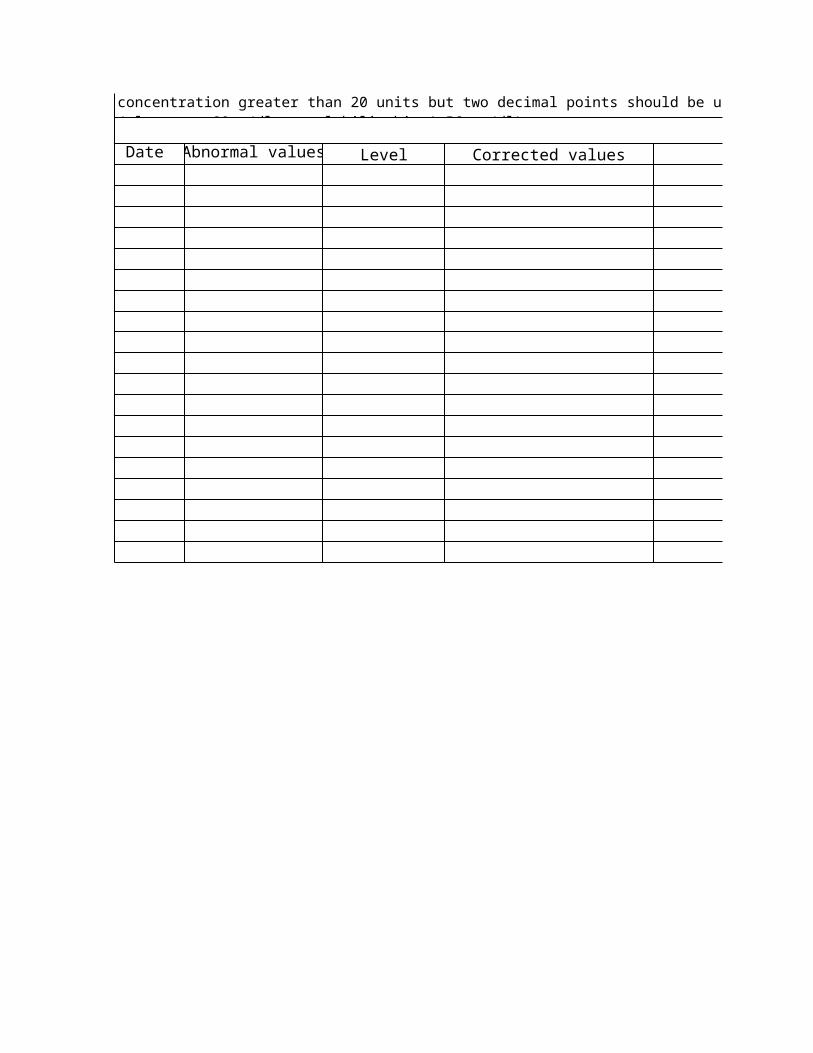
Date Abnormal values Level Corrected values Corrective actions
Instruction: The results lying out of ±3SD should not be used to plot the LJ charts and the results can not be reported without corrective actions. Take the necessary corrective actions and fill in the following table. The values of the outlying results and corrected results should be writen clearly. No decimal points is required for the analyte concentration greater than 20 units but two decimal points should be used for analyte concentration less than 20 units (glucose = 89mg/dl; total bilirubin 1.56 mg/dl).
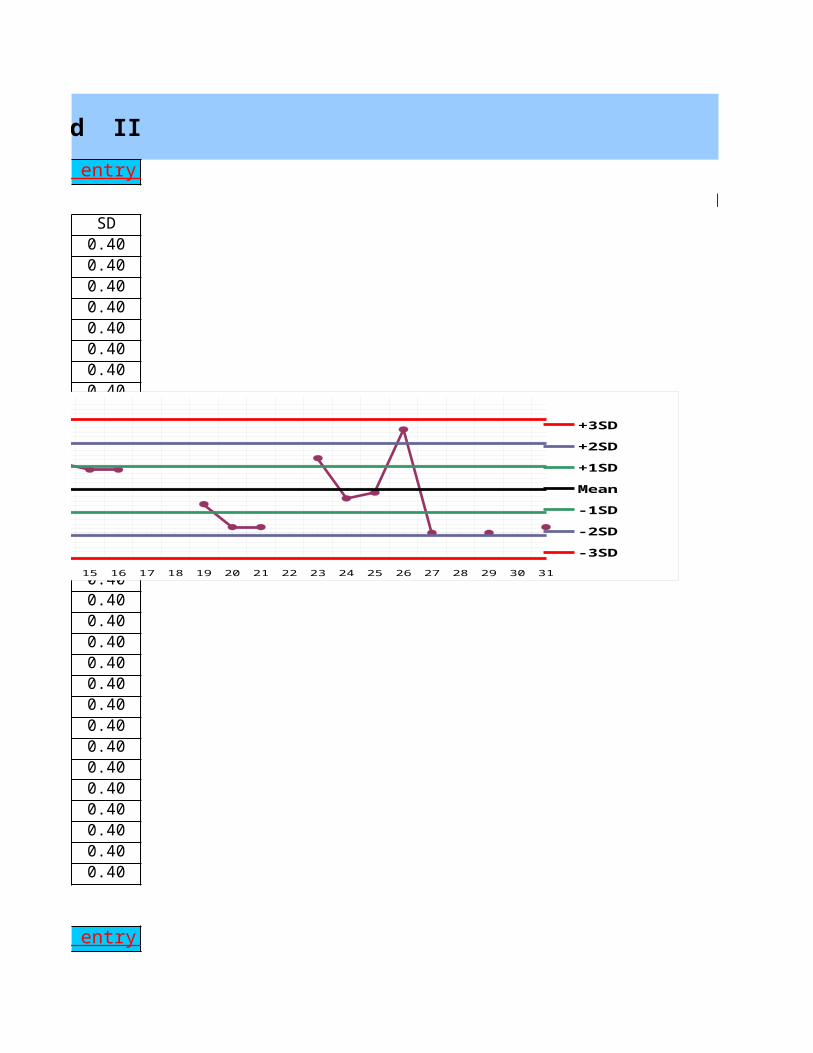
IQC IN BIOCHEMISTRY: Biorad QC Level I and II
LEVEL ISD
0.400.400.400.400.400.400.400.400.400.400.400.400.400.400.400.400.400.400.400.400.400.400.400.400.400.400.400.400.400.400.40
Back to Data entry
Back to Data entry
1 2 3 4 5 6 7 8 9 10 11 12 13 14 15 16 17 18 19 20 21 22 23 24 25 26 27 28 29 30 31-0.49-0.090.310.711.111.511.912.31
+3SD+2SD+1SDMean -1SD-2SD-3SD
LEVE
L I
ASO
IU/M
L
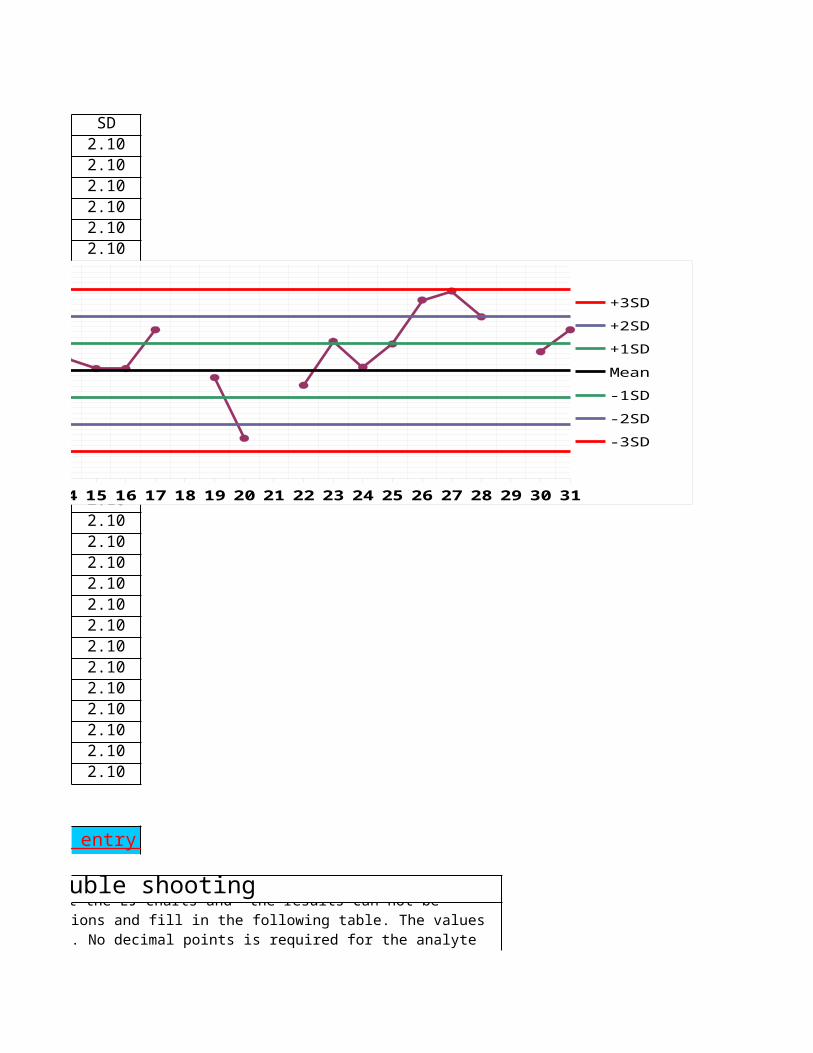
SD2.102.102.102.102.102.102.102.102.102.102.102.102.102.102.102.102.102.102.102.102.102.102.102.102.102.102.102.102.102.102.10
Erroneous results and trouble shooting Back to Data entry
3SD should not be used to plot the LJ charts and the results can not be reported without corrective actions. Take the necessary corrective actions and fill in the following table. The values of the outlying results and corrected results should be writen clearly. No decimal points is required for the analyte concentration greater than 20 units but two decimal points should be used for analyte concentration less than 20 units
1 2 3 4 5 6 7 8 9 10 11 12 13 14 15 16 17 18 19 20 21 22 23 24 25 26 27 28 29 30 3141.5043.6045.7047.8049.9052.0054.1056.20
+3SD+2SD+1SDMean -1SD-2SD-3SD
Leve
l II
ASO
IU/
ML
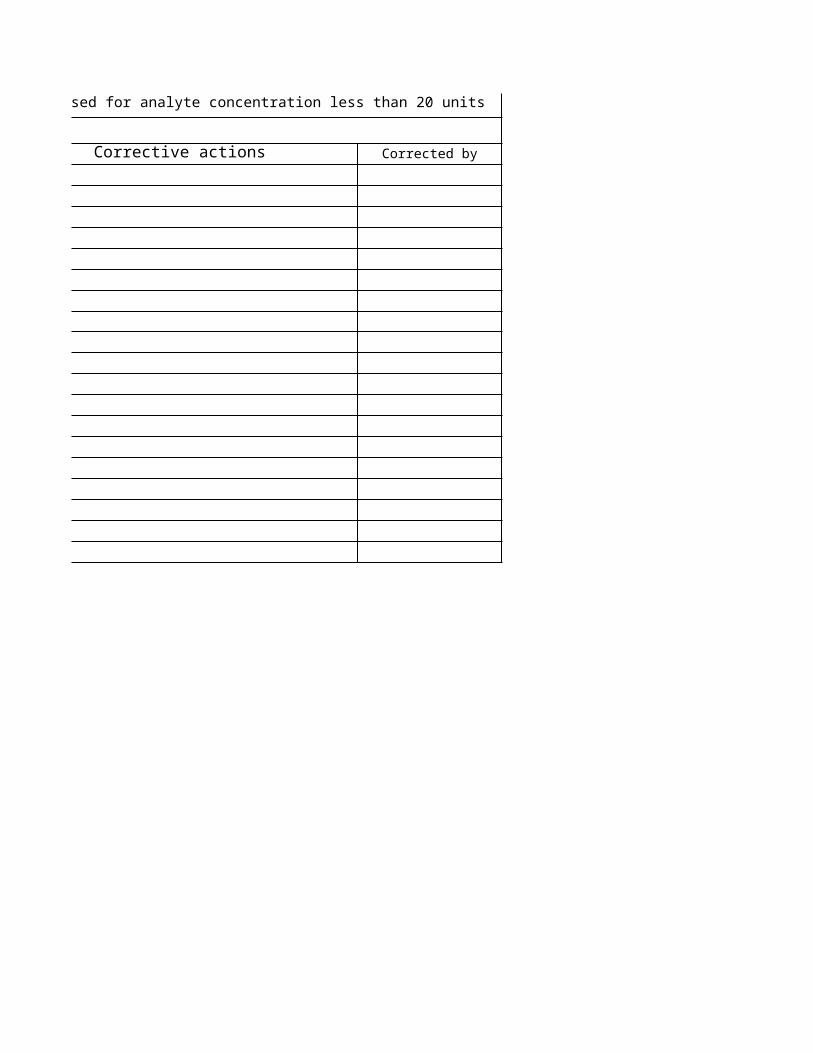
Corrective actions Corrected by
3SD should not be used to plot the LJ charts and the results can not be reported without corrective actions. Take the necessary corrective actions and fill in the following table. The values of the outlying results and corrected results should be writen clearly. No decimal points is required for the analyte concentration greater than 20 units but two decimal points should be used for analyte concentration less than 20 units

IQC IN BIOCHEMISTRY: Biorad QC Level I and II
LEVEL I


