Embed Size (px)
Citation preview

Correction of error in two-dimensional wear measurements
of cemented hip arthroplasties
B. TheL. Mol
R.L. DiercksP.M.A. van Ooijen
N. Verdonschot
Clinical Orthopaedics and Related Research 2006 January; 442: 180-6

Chapter 6 - Correction of error in 2D wear measurements of cemented hip arthroplasties
90

Chapter 6 - Correction of error in 2D wear measurements of cemented hip arthroplasties
91
Abstract
IntroductionThe irregularity of individual wear patterns of total hip prostheses seen during patient follow up may partially result from differences in radiographic projection of the components between different radiographs. A method to adjust for this source of error would highly increase the value of individual wear curves. We developed and tested a method to correct for this source of error.MethodsThe influence of patient position on validity of wear measurements was investigated with controlled manipulation of a cadaveric pelvis.ResultsWithout correction the error exceeded 0.2 mm if differences in cup projection were as small as 5°. When using the described correction method, cup positioning differences could be more than 20° before introducing an error exceeding 0.2 mm.ConclusionFor individual patient follow up in clinical practice, we recommend using the correction method to enhance accuracy of the results.

Chapter 6 - Correction of error in 2D wear measurements of cemented hip arthroplasties
92
Introduction
Wear is an important factor in failure of total hip arthroplasties.4, 9, 10, 20, 21, 22, 35 Wear measurements using manual methods, sometimes combined with a digital analysis of the manually placed markings are reported in a number of publications although surprisingly little is published about their validity and precision in clinical practice. 5, 6, 11, 13, 18, 28, 29, 32 Modern and more reliable fully digital measurements have become the standard for two-dimensional wear measurements. Reported mean errors, as a measure of validity, vary between 0.01 mm and 0.5 mm, while reported precision is between 0.2 mm and 0.4 mm (95% confidence intervals). The large variation in these reported figures is probably at least partly due to differences in measurement methods.3, 8, 9, 14, 19, 23, 30, 31, 36, 37 Another potential source of errors in two-dimensional wear measurements in a clinical setting is the variability in projections of the artificial joint on the radiographs. The irregular wear patterns often seen for individual patients are probably the result of this and limit the value of individual measurements. A method to adjust for error because of these variations in clinical practice would be very valuable.Characterization of the cup projection is most easily performed on all polyethylene cups with a circular metal ring around the mouth of the cup. Although most orthopedic surgeons restrict all polyethylene cups to elderly patients in which the problem of wear might be considered less relevant, other orthopedic surgeons use them in younger patients with good results.15, 25, 26, 33 Others have used the metal ring of all polyethylene cups to perform wear measurements, but their methods differed slightly from the technique applied in this study.12, 29 However, regardless of purpose, measurement errors caused by projection differences apply to both metal backed and all polyethylene cups.The three aims of this study are:First, to determine validity and precision of the measurement method. Second, to determine how much validity and precision are diminished when the cup is increasingly projected out of the plane of wear. And last, to show that validity diminishes less with projections of the cup out of the plane of wear after application of a geometrics based correction method.
Methods
We first describe the measurement method which is used throughout the paper. Second, we explain the correction method. The effect of differences in patient positioning on validity of two-dimensional-wear measurements are investigated with and without application of the correction method. These measurements are performed on a cadaver, which was manipulated to produce different projections of an implanted total hip prosthesis (Scientific Hip Prosthesis, Biomet NL, Dordrecht, The Netherlands).

Chapter 6 - Correction of error in 2D wear measurements of cemented hip arthroplasties
93
Manipulation was performed while measuring the angular steps using long pins which were inserted in the pelvis. Third we describe the validation procedure of the measurement technique. Validity is determined by comparison of the measurement values with the true values as determined by three-dimensional radiostereographic analysis (RSA). Precision is determined by quantification of the standard deviation of repeated measurements performed by one observer on a series of clinical radiographs. Interobserver reliability is determined by quantification of the standard deviation of repeated measurements performed by a series of observers on a series of clinical radiographs. All measurements were performed on all polyethylene cups using software HyperORTHO™ (Rogan Delft, Veenendaal, The Netherlands) for preoperative planning and postoperative measurements on digital radiographs. The centre of the metal contrast wire of the cup and the centre of the prosthetic femoral head were used as reference points. The centre of the metal ring was determined by digital placement of 10 points on the outer outline of the metal contrast wire. Using these points, an ellipse was fitted by the computer and its centre calculated. Ten points on the edge of the femoral head were used to fit an ellipse on the femoral head and calculate its centre. Then, the difference between the centre of the femoral head and the centre of the metal ring of the acetabular cup was calculated (fig. 1). Wear was calculated as the change in distance between these reference points on two radiographs taken at different moments during follow-up. These distances were corrected for magnification with the known diameter of the femoral head. The images for testing the correction method were acquired with the digital EXP 8000 fluoroscope (Ziehm Imaging, Nürnberg, Germany).Measurements with and without correction were performed on a series of radiographs of a freshly thawed cadaver with a cemented total hip prosthesis in situ. The nonmanipulated supine position was used as the reference position. Images were
Figure 1. The measurement method in this study uses the change in distance between two reference points. We have used the centre of the femoral head (A) and the centre of the metal ring (B) throughout this study as reference points.

Chapter 6 - Correction of error in 2D wear measurements of cemented hip arthroplasties
94
made after rotating the pelvis, in consecutive steps of 5°, up to 30° anteversion, 10° retroversion, 30° clockwise rotation, and 30° counterclockwise rotation. On each of the images, the projected distance between the centre of the metal ring and the centre of the femoral head was determined. In addition, the opening angle of the cup was measured on each radiograph with use of the shape of the projected metal contrast wire.The correction method uses the underlying mechanism of differences in two-dimensionally projected distances with varying possibilities of positions of two objects in space to reconstruct the true change in distance between the objects (fig. 2). The first possibility is that the first and the second radiograph are both taken in the same plane (or one radiograph is corrected to produce this situation in a virtual way), and this plane is the plane in which the wear truly occurs. Thus, on the direct postoperative radiograph the centre of the femoral head O is projected in A, and the centre of the metal ring Q is projected as C. The distance between the two reference points is AC. On the second radiograph the centre of the femoral head is now at P and is projected as B. The distance between the reference points is now BC. Wear is calculated as AC – BC = AB, which is the true wear value (OP = AB). This is obviously the best of all possibilities, and is the result of using the correction method with the assumption of the correct plane in which wear occurs. The second possibility is that the first and second radiograph are both taken in the same plane (or one radiograph is corrected), but this plane is not the plane in which the wear truly occurs. Thus, on the direct postoperative radiograph the centre of the femoral head R is projected in D, and the centre of the metal ring T is projected as F. The projected distance between the two reference points is DF. On the second radiograph the centre of the femoral head is now at S and is projected as E. The projected distance between the reference points is now EF. Wear is calculated as DF – EF = DE, which is a slight underestimation of the true wear value (DE < SR). The difference between the true wear value and the measured value is small, though. This is the second best of all possibilities, and is also the result of using the correction method, but with the assumption of the wrong plane in which the wear occurs. The third possibility is that the first radiograph is taken in the correct plane (1) and the second radiograph is not (2). Thus, on the direct postoperative radiograph the distance between the two reference points is again AC. Now, on the second radiograph the projected distance between the reference points is now EF. Wear is calculated as AC – EF, which gives a negative wear value as a result (AC < EF). This is obviously an undesirable outcome and is the result of not using the correction method, while using the correction method would have resulted in an outcome as described in the first or second possible situation. The fourth possibility is that the first radiograph is taken in the wrong plane (2) and the second radiograph is taken in the correct plane (1). Thus, on the direct postoperative radiograph the distance between the two reference points is now DF. On the second radiograph the projected distance between the reference points is now BC. Wear is calculated as DF – BC, which gives a wear value which is more than double the true wear value (DF

Chapter 6 - Correction of error in 2D wear measurements of cemented hip arthroplasties
95
Figure 2. The figure illustrates four possible relationships between the first and second radiograph. The left part (1) illustrates how the several reference points will behave when the radiograph is taken in the plane of wear; O = centre of the femoral head in a direct postoperative radiograph, P = centre of the femoral head after wear has occurred, Q = centre of the metal ring of the cup, A-C = distance measured between centre of the femoral head and centre of the metal ring on the direct postoperative radiograph, B-C = distance measured between centre of the femoral head and centre of the metal ring after wear has occurred. The right part (2) illustrates how these reference points will behave when the radiograph is not taken in the plane of wear; R = centre of the femoral head in a direct postoperative radiograph, S = centre of the femoral head after wear has occurred, T = centre of the metal ring of the cup, D-F = distance measured between centre of the femoral head and centre of the metal ring on the direct postoperative radiograph, E-F = distance measured between centre of the femoral head and centre of the metal ring after wear has occurred. Both diagrams correspond with the two drawings at the bottom of the figure. They illustrate the fact that if the opening angle of the cup is large (the minor and major axis do not differ much in length – see left drawing) the distance between the reference points of the femoral head and cup seem to be closer to each other than if the opening angle is small (minor axis is much smaller than the major axis – see right drawing).The first possibility is that the first and the second radiograph are both taken in the same plane (or one radiograph is corrected to produce this situation in a virtual way), and this plane is the plane in which the wear truly occurs. The second possibility is that the first and second radiograph are both taken in the same plane (or one radiograph is corrected), but this plane is not the plane in which the wear truly occurs. The third possibility is that the first radiograph is taken in the correct plane (1) and the second radiograph is not (2). The fourth possibility is that the first radiograph is taken in the wrong plane (2) and the second radiograph is taken in the correct plane (1).
Chapter 6 - Correction of error in 2D wear measurements of cemented hip arthroplasties
96
– BC >> OP)! This is also a highly biased outcome and again results from not using the correction method, while using the correction method would have resulted in a far less biased outcome as described in the first or second possible situation.
The following steps were followed to obtain corrected wear values.First, the opening angles on the two radiographs were determined:
opening angle = arcsine (minor axis / major axis).
Then the following formula (which is a direct derivation of the model in fig. 2) was used to correct the wear value with the second radiograph assumed to be the correct plane of wear:
corrected wear value = v1 x cosine β / cosine α – v2
In this formula v1 is the distance between the two reference points on the first (direct postoperative) radiograph, v2 is the distance between the reference points on the second radiograph, α is the opening angle of the cup on the first radiograph and β is the opening angle of the cup on the second radiograph used for the wear measurement.
This formula should be applied to the vectoral component of wear occurring perpendicular to the long axis of the projected metal contrast wire. The component of wear occurring parallel to this axis should not be changed. The total linear wear was then calculated by taking the square root of the sums of the quadratic values of both the adjusted vector perpendicular to the major axis and the unadjusted vector parallel to the major axis of the ellipse.
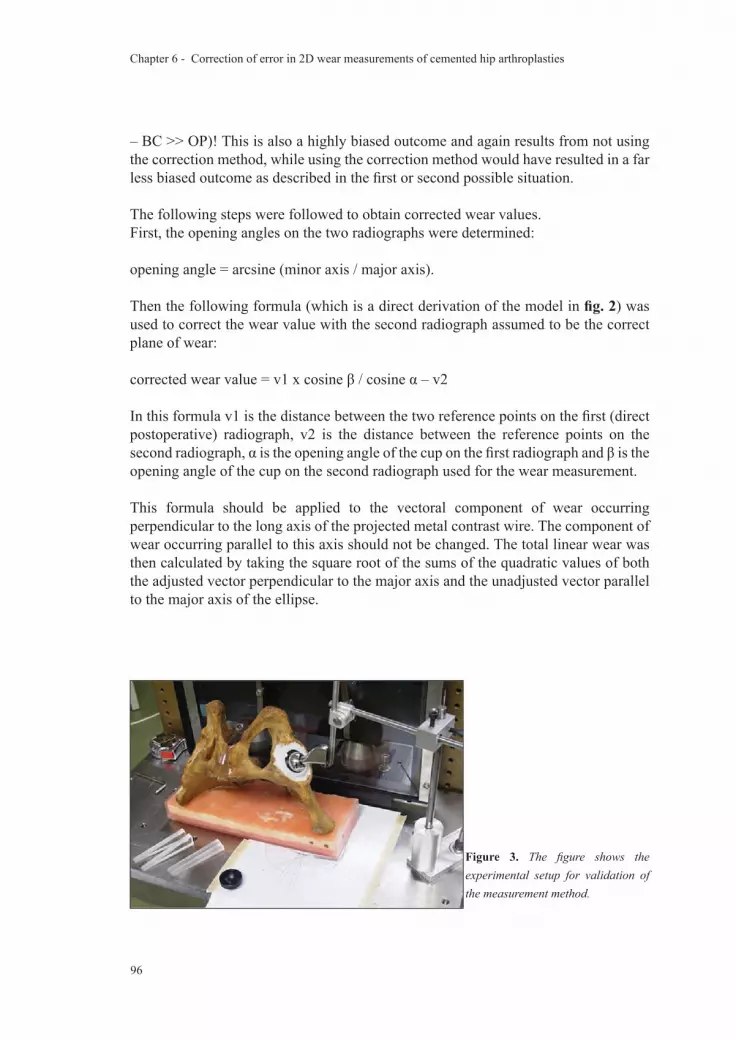
Figure 3. The figure shows the experimental setup for validation of the measurement method.

Chapter 6 - Correction of error in 2D wear measurements of cemented hip arthroplasties
97
Validation of our measurement method was assessed by three parameters: Validity, precision and interobserver reliability. The measurements were performed on 300 dpi digitized radiographs (Howtek MultiRAD 760 Scanning Device, Aztek Digital Imaging, Irvine, USA) of an all polyethylene cup with a metal wire marker implanted in one specimen of a cadaveric pelvis. The femoral component was an Exeter stem with a 28 mm femoral head (Stryker-Howmedica, Mahwah, New Jersey) and was manually pressed in the cup and fixated mechanically (fig. 3). The acetabular cup consisted of two parts: the outer (cemented) part and an inner interchangeable inlay. An eccentric defect was machined in one of the inlays to produce a certain amount of wear, while another inlay was used without machining, simulating a situation without any wear (fig. 4). The exact amount and direction of the defect were not determined otherwise than by RSA which served as the gold standard. Radiographs of the pelvis were made in anterior-posterior direction focused on the symphysis. The distance between the radiographic tube and the plate was kept constant at 100 cm for all radiographs. The two-dimensional wear measurement results were compared with results obtained with RSA. This is a method with which change of position of bony or artificial (prosthetic) structures in relation to each other can be measured very accurately. Several tantalum balls need to be incorporated in the objects of interest for this measurement technique. A stereoradiographic approach provides a computer with the necessary data to calculate the relative displacement of interest.34
The precision was determined by measuring wear 10 times by the same observer on a series of radiographs. The observer was always blinded for his previous measurements. The interobserver reliability was determined by measuring the same radiograph by 10 different observers. They were blinded for each other’s measurements. Since it was noticed, that precision seemed to decrease when the metal ring was projected with a narrow opening (or in extreme: as a line), we decided to perform a second investigation on precision. One hundred twenty-three plain pelvic direct digital radiographs (150 dpi) of patients with a Scientific Hip Prosthesis (Biomet, Dordrecht, The Netherlands) were randomly sampled. All radiographs were direct digital images and were taken in a standardized way. The patients were in a supine position with their legs 10 degrees
Figure 4. On this image the two inlays that are used in the experimental setup are shown. The left inlay is without wear, while the right one is machined to simulate a situation with wear.

Chapter 6 - Correction of error in 2D wear measurements of cemented hip arthroplasties
98
internally rotated. The film-focus distance was always 115 cm, while the x-ray plate was 7 cm below the x-ray table. Three repeated wear measurements were performed on each radiograph. This resulted in 123 times three values for both the medial and the cranial wear component. The standard deviations of these values were calculated, representing the precision of the measurement. The relation between the flatness of the projected metal ring and the precision of the measurement was visualized in a scatterplot.All data were collected and analyzed using SPSS version 12.0 (SPSS Inc., Chicago, IL). To assess validity, the mean differences between the true values and the measured values were determined. Precision was determined using the standard deviation of a series of measurements as a measure of dispersion. Interobserver reliability was determined by calculation of the mean difference between measurements on identical radiographs by different observers. Scatterplots were made for visualization of the relation between the projection of the metal ring and precision of wear measurements. The association of change in patient position and measured wear with and without correction is also displayed using scatterplots. Linear regression analysis was used to study these latter mentioned relationships.
Results
The difference between the HyperORTHO™ measurements and RSA was 0.06 mm in craniomedial direction (table 1), whereas the standard deviations of repeated measurements ranged from 0.08 to 0.12 mm (table 2).A clear relation was present between projection of the cup and validity. A difference in ratio of 0.085 (corresponding with 5° difference in projected opening angle) resulted in wear measurement errors exceeding 0.2 mm in this specimen (fig. 5). Precision of wear measurements was also affected. If the ratio between the minor and major axis was larger than 0.1 the median standard deviation of repeated measurements was 0.035 mm (range 0.006 – 0.125 mm); when the ratio was smaller than 0.1 the median standard deviation was 0.12 mm (range 0.006 – 0.790 mm). This difference is explained by the fact that the measurements take on the steepest part of the sine wave: a small change in ratio between 0.0 and 0.1 causes the greatest change in measured anteversion, with subsequent magnification of errors in this range. The scatterplot (fig. 6) shows how the ratio of the minor and major axis of the elliptical projection are related to precision of the measurement. Application of the presented correction method results in measurements which are more valid with variances in projection (fig. 7): only differences in ratio of more than 0.307 (or 20° difference in opening angle) result in measurement errors exceeding 0.2 mm (table 3).

Chapter 6 - Correction of error in 2D wear measurements of cemented hip arthroplasties
99
Table 1. Difference between Wear Measured with HyperORTHO™ and RSA (mm).Method Wear Component
Medial Cranial VectorHyperORTHO™ -0.147 2.156 2.162RSA -0.276 2.203 2.220Difference 0.129 -0.046 -0.059
Table 2. Precision and Interobserver ReliabilityMeasurement Comp Mean (mm) SD (mm) SEM (mm) 95% CI (mm)Precision med 5.00 0.082 0.026 ± 0.059
cra 3.18 0.079 0.025 ± 0.056vec 5.93 0.081 0.025 ± 0.058
Interobserver med 5.00 0.119 0.037 ± 0.085cra 3.26 0.072 0.023 ± 0.052vec 5.97 0.109 0.034 ± 0.078
Comp = component; med = medial component; cra = cranial component; vec = vectorial wear; SD = standard deviation; SEM = standard error of the mean; CI = confidence interval.
Table 3. Error in wear measurement induced by different projections in study specimenError (mm) Without Correction With Correction
Δ (max) Ratio* Δ (max) Angle† Δ (max) Ratio* Δ (max) Angle†0.1 0.043 2.6° 0.153 10.0°0.2 0.085 5.3° 0.307 20.0°0.3 0.128 7.9° 0.460 30.0°0.4 0.171 10.5° 0.613 40.0°*maximum differences in ratio between two radiographs; †maximum differences in opening angle.
Discussion
To investigate whether validity problems in two dimensional wear measurements due to differences in projection of cemented cups can be adjusted for, we have developed a geometrics based theoretical framework to model this potential source of error. An algorithm for adjustment of two dimensional measurements was derived from this theoretical model. In order to be able to test it under controlled circumstances, we used a cadaveric specimen with an implanted hip joint prosthesis for evaluation of the correction method.We note a few potential limitations of our study. First, we chose to use all polyethylene cups throughout the study because the circumferential metal ring provides a good measure for differences in projection of the artificial hip joint.1 The choice for a specific implant type for the measurements in our study does not result in limited generalizability of this measurement method to all polyethylene cups, as other authors

Chapter 6 - Correction of error in 2D wear measurements of cemented hip arthroplasties
100
Figure 7. This figure shows the association between the ratio of the projected metal contrast wire and the distance between the two reference points after correction.
Figure 6. The standard deviations of three repeated measurements on each radiograph are scattered against the ratio of the short and the long axis of the projected metal ring of the cup.
Figure 5. This figure shows the association between the ratio of the projected metal contrast wire and the distance between the two reference points. No correction was applied.

Chapter 6 - Correction of error in 2D wear measurements of cemented hip arthroplasties
101
who have used the same principle to measure the orientation of the cup also stated.1 The underlying mechanism of the apparent change in distance between two reference points (one being the centre of the femoral head; the other being either the centre of the metal ring or the centre of the metal backed cup) is universally applicable. The fact that – in a zero wear situation – the centre of a metal backed cup coincides with the centre of the femoral head, in contrast with the centre of the metal ring, does not alter this principle, although the impact on the absolute error reduction is expected to be different for different implant designs. Second, when the beam is centered over the hip, anteversion can be measured accurately but this observation does not apply to our study because parallax error caused by an x-ray beam centered on the symphysis pubis is the same for all of the radiographs of a single patient. Third, we do not distinguish between wear and creep in our study. The latter can certainly be a relevant source of additional penetration of the femoral head into the polyethylene. It is thought to mostly add to penetration rates in the first years after implantation and has been the specific subject of study in several papers.2, 16, 27 Although our correction method cannot directly distinguish creep from wear, it does offer the possibility of estimating the amount of creep in individual cases because it makes reliable individual wear curves possible. In our formula, we chose to use the second radiograph as the assumed plane in which wear occurs. This is partially arbitrary, but it does have a theoretical advantage: since we do not know the true plane of wear, the link between opening angle and distance of reference points is the most accurate in the first postoperative radiograph. Correction of the opening angle (and therefore the projected distance) is sure to be exact on the first radiograph, while a correction on other radiographs can slightly overcorrect or undercorrect. The method of correction needs an assumption considering the plane in which the wear occurs. It has been shown that this is approximately in the plane of the radiograph in 95% of the patients.37 Therefore, it seems reasonable to choose the plane of one of the radiographs which are used for the measurements. It is also possible to choose a different plane, such as the average of the two radiographic planes. Even without knowing the true plane in which the wear occurs, it is beneficial to apply this method. Series of measurements of individual patients might still slightly underestimate or overestimate the true wear value, but no excessive bias (like a negative wear value) can be present anymore. In all cases, correction of the measurement values will be toward the chosen plane in which wear is assumed to occur.We did not assume that wear occurs only in a craniomedial direction, since this assumption is not met in a substantial fraction of our patients. This necessitates a step by which the correction is only applied on the vectoral component perpendicular to the major axis of the elliptical projection of the metal ring as described in the Materials section. Not following these guidelines might result in overcorrection of the measurement values.Several papers have described the implications of using two-dimensional rather

Chapter 6 - Correction of error in 2D wear measurements of cemented hip arthroplasties
102
than three-dimensional wear measurements using simple radiographs.17, 24, 37 In contrast to our approach, all three-dimensional methods require lateral radiographs. Although high correlations (r2 varying from 0.78 to 0.93) between the two types of measurements have repeatedly been found when comparing follow-up series on group level, the irregularity of wear curves during individual patient follow up have never been investigated to our knowledge. It is commonly accepted that two-dimensional measurements underestimate the three-dimensional wear value (mean differences varying from 0.07 mm to 0.46 mm) 7, 17, 24, 37, but again, the fact that the amount of underestimation might vary within individual radiographic series has never been investigated to our knowledge. The measurement method presented in this paper is the first two-dimensional measurement to account for this source of error.Unadjusted digital two dimensional wear measurements on all polyethylene cups are valid under strict (laboratory) conditions, demanding comparability of radiographs, which cannot always be attained in clinical practice. Therefore, we recommend implementation of this correction method in the now widely available orthopaedic software packages to obtain valid wear measurements, even when patient positioning varies throughout clinical evaluations over time.
Acknowledgements
Funds were received in partial support of the research of the study presented in this article from Biomet NL, Dordrecht, the Netherlands.

Chapter 6 - Correction of error in 2D wear measurements of cemented hip arthroplasties
103
Chapter 6 - Correction of error in 2D wear measurements of cemented hip arthroplasties
Reference List
1. Ackland MK, Bourne WB, Uhthoff HK. Anteversion of the acetabular cup. Measurement of angle after total hip replacement. J Bone Joint Surg Br 1986 May;68(3):409-13.
2. Atkinson JR, Cicek RZ. Silane crosslinked polyethylene for prosthetic applications. II. Creep and wear behaviour and a preliminary moulding test. Biomaterials 1984 November;5(6):326-35.
3. Bankston AB, Cates H, Ritter MA, Keating EM, Faris PM. Polyethylene wear in total hip arthroplasty. Clin Orthop 1995 August;(317):7-13.
4. Barrack RL, Castro FP, Jr., Szuszczewicz ES, Schmalzried TP. Analysis of retrieved uncemented porous-coated acetabular components in patients with and without pelvic osteolysis. Orthopedics 2002 December;25(12):1373-8.
5. Callaghan JJ, Pedersen DR, Olejniczak JP, Goetz DD, Johnston RC. Radiographic measurement of wear in 5 cohorts of patients observed for 5 to 22 years. Clin Orthop 1995 August;(317):14-8.
6. Charnley J, Halley DK. Rate of wear in total hip replacement. Clin Orthop 1975 October;(112):170-9.
7. Devane PA, Bourne RB, Rorabeck CH, Hardie RM, Horne JG. Measurement of polyethylene wear in metal-backed acetabular cups. I. Three-dimensional technique. Clin Orthop 1995;(319):303-16.
8. Devane PA, Horne JG. Assessment of polyethylene wear in total hip replacement. Clin Orthop 1999;(369):59-72.
9. Dowd JE, Sychterz CJ, Young AM, Engh CA. Characterization of long-term femoral-head-penetration rates. Association with and prediction of osteolysis. J Bone Joint Surg Am 2000 August;82-A(8):1102-7.
10. Dumbleton JH, Manley MT, Edidin AA. A literature review of the association between wear rate and osteolysis in total hip arthroplasty. J Arthroplasty 2002 August;17(5):649-61.
11. Ebramzadeh E, Normand PL, Sangiorgio SN et al. Long-term radiographic changes in cemented total hip arthroplasty with six designs of femoral components. Biomaterials 2003 August;24(19):3351-63.
12. Eggli S, z’Brun S, Gerber C, Ganz R. Comparison of polyethylene wear with femoral heads of 22 mm and 32 mm. A prospective, randomised study. J Bone Joint Surg Br 2002 April;84(3):447-51.
13. Griffith MJ, Seidenstein MK, Williams D, Charnley J. Socket wear in Charnley low friction arthroplasty of the hip. Clin Orthop 1978 November;(137):37-47.
14. Hardinge K, Porter ML, Jones PR, Hukins DW, Taylor CJ. Measurement of hip prostheses using image analysis. The maxima hip technique. J Bone Joint Surg Br 1991 September;73(5):724-8.

Chapter 6 - Correction of error in 2D wear measurements of cemented hip arthroplasties
104
Chapter 6 - Correction of error in 2D wear measurements of cemented hip arthroplasties
15. Havelin LI, Engesaeter LB, Espehaug B, Furnes O, Lie SA, Vollset SE. The Norwegian Arthroplasty Register: 11 years and 73,000 arthroplasties. Acta Orthop Scand 2000 August;71(4):337-53.
16. Huber J, Walter A, Plitz W, Refior HJ. Effect of the manufacturing process on creep and wear properties of UHMWPE (ultra-high molecular weight polyethylene). Biomed Tech (Berl) 1995 April;40(4):88-92.
17. Hui AJ, McCalden RW, Martell JM, MacDonald SJ, Bourne RB, Rorabeck CH. Validation of two and three-dimensional radiographic techniques for measuring polyethylene wear after total hip arthroplasty. J Bone Joint Surg Am 2003 March;85-A(3):505-11.
18. Ilchmann T, Mjoberg B, Wingstrand H. Measurement accuracy in acetabular cup wear. Three retrospective methods compared with Roentgen stereophotogrammetry. J Arthroplasty 1995 October;10(5):636-42.
19. Jones PR, Taylor CJ, Hukins DW, Porter ML, Hardinge K. Prosthetic hip failure: retrospective radiograph image analysis of the acetabular cup. J Biomed Eng 1989 May;11(3):253-7.
20. Kadoya Y, Kobayashi A, Ohashi H. Wear and osteolysis in total joint replacements. Acta Orthop Scand Suppl 1998 February;278:1-16.
21. Looney RJ, Boyd A, Totterman S et al. Volumetric computerized tomography as a measurement of periprosthetic acetabular osteolysis and its correlation with wear. Arthritis Res 2002;4(1):59-63.
22. Maloney WJ, Schmalzried T, Harris WH. Analysis of long-term cemented total hip arthroplasty retrievals. Clin Orthop 2002 December;(405):70-8.
23. Martell JM, Berdia S. Determination of polyethylene wear in total hip replacements with use of digital radiographs. J Bone Joint Surg Am 1997 November;79(11):1635-41.
24. Martell JM, Berkson E, Berger R, Jacobs J. Comparison of two and three-dimensional computerized polyethylene wear analysis after total hip arthroplasty. J Bone Joint Surg Am 2003 June;85-A(6):1111-7.
25. McAuley JP, Szuszczewicz ES, Young A, Engh CA, Sr. Total hip arthroplasty in patients 50 years and younger. Clin Orthop Relat Res 2004 January;(418):119-25.
26. McCombe P, Williams SA. A comparison of polyethylene wear rates between cemented and cementless cups. A prospective, randomised trial. J Bone Joint Surg Br 2004 April;86(3):344-9.
27. McDonald MD, Bloebaum RD. Distinguishing wear and creep in clinically retrieved polyethylene inserts. J Biomed Mater Res 1995 January;29(1):1-7.
28. Nashed RS, Becker DA, Gustilo RB. Are cementless acetabular components the cause of excess wear and osteolysis in total hip arthroplasty? Clin Orthop 1995 August;(317):19-28.
29. Ohlin A, Selvik G. Socket wear assessment. A comparison of three different radiographic methods. J Arthroplasty 1993 August;8(4):427-31.

Chapter 6 - Correction of error in 2D wear measurements of cemented hip arthroplasties
105
Chapter 6 - Correction of error in 2D wear measurements of cemented hip arthroplasties
30. Pedersen DR, Brown TD, Hillis SL, Callaghan JJ. Prediction of long-term polyethylene wear in total hip arthroplasty, based on early wear measurements made using digital image analysis. J Orthop Res 1998 September;16(5):557-63.
31. Phillips NJ, Stockley I, Wilkinson JM. Direct plain radiographic methods versus EBRA-Digital for measuring implant migration after total hip arthroplasty. J Arthroplasty 2002 October;17(7):917-25.
32. Pollock D, Sychterz CJ, Engh CA. A clinically practical method of manually assessing polyethylene liner thickness. J Bone Joint Surg Am 2001 December;83-A(12):1803-9.
33. Schreurs BW, Busch VJ, Welten ML, Verdonschot N, Slooff TJ, Gardeniers JW. Acetabular reconstruction with impaction bone-grafting and a cemented cup in patients younger than fifty years old. J Bone Joint Surg Am 2004 November;86-A(11):2385-92.
34. Selvik G. Röntgen stereophotogrammetry. A method for the study of the kinematics of the skeletal system. Acta Orthop Scand Suppl 1989;232:1-51.
35. Sethi RK, Neavyn MJ, Rubash HE, Shanbhag AS. Macrophage response to cross-linked and conventional UHMWPE. Biomaterials 2003 July;24(15):2561-73.
36. Shaver SM, Brown TD, Hillis SL, Callaghan JJ. Digital edge-detection measurement of polyethylene wear after total hip arthroplasty. J Bone Joint Surg Am 1997 May;79(5):690-700.
37. Sychterz CJ, Yang AM, McAuley JP, Engh CA. Two-dimensional versus three-dimensional radiographic measurements of polyethylene wear. Clin Orthop 1999 August;(365):117-23.

Chapter 6 - Correction of error in 2D wear measurements of cemented hip arthroplasties
106
Chapter 6 - Correction of error in 2D wear measurements of cemented hip arthroplasties


