Embed Size (px)
Citation preview
Small strain behaviour of cemented soils
Jana Trhlíková
David Mašín
Jan Boháč
Faculty of ScienceCharles University in Prague, Czech Republic
correspondence to:Jana Trhlíková
Charles University in PragueFaculty of Science
Albertov 6, 128 43 Prague 2, Czech RepublicE-mail: [email protected]
Tel: +420-2-2195 1509, Fax: +420-2-2195 1556
Technical Note for Géotechnique
Keywords: fabric/structure of soils, shear modulus, laboratory tests, constitutive relations
1
ABSTRACT
The shear modulus of cemented soils at very small strain (G0) was studied. For artificially cemented clay, G0 was
found to be independent of the mean effective stress until the yield stress. After yield, a significant effect of
structure degradation on G0 was observed. The experimental data was interpreted by an equation, which relates
G0 of cemented soils to mean stress, apparent overconsolidation ratio and the state of structure (sensitivity). The
equation was also found to represent G0 of cemented sands.
INTRODUCTION
The soil structure affects the mechanical behaviour of soil in the range from very small to large strains (Clough
et al. 1981; Burland 1990; Leroueil and Vaughan 1990; Feda 1995; Cuccovillo and Coop 1999; Kavvadas and
Amorosi 2000; Cotecchia and Chandler 2000; Baudet and Stallebrass 2004). The present Note focuses on the
effect of structure on the very small strain shear modulus (G0), when the behaviour is elastic and G0 is
independent of the shear strain.
The literature review shows that natural or artificial cementation increases G0 of sands (Acar and El-Tahir 1986;
Saxena et al. 1988; Chang and Woods 1992; Sharma and Fahey 2004) and clays (Jovičić et al. 2006; Puppala et
al. 2006) in comparison with G0 of the corresponding reconstituted soil at the same mean effective stress.
According to Acar and El-Tahir (1986) and Delfosse-Ribay et al. (2004), shear modulus of cemented sands
increased with confining stress in the whole applied range. Conversely, Cuccovillo and Coop (1997), Baig et al.
(1997), Fernandez and Santamarina (2001) and Sharma and Fahey (2004) reported G0 to be for cemented sands
practically independent of the mean stress and dependent on cementation until it was reached a threshold stress
corresponding to the onset of major structure degradation. Cementation appears to control only G0 of clays
below isotropic or vertical yield stress and the pressure dependency appears to prevail at higher stresses
accordingly (Jovičić et al. 2006; Hird and Chan 2008). The latter findings are consistent with the predictions of a
micromechanical model for cemented granular material developed by Dvorkin et al. (1991), leading to the
conclusion that the stiffness of the cemented system is strongly increased by cementation and independent of
confining pressure.
The connection between deterioration of bonding and initiation of the pressure dependency of G0 was reported
for naturally cemented carbonate sand (i.e.calcarenite; Cuccovillo and Coop 1997), loose cement treated sand
(Yun and Santamarina 2005), cement treated clay (Hird and Chan 2008) and natural clay with carbonate bonding
(Cafaro and Cotecchia 2001). After yielding, Cuccovillo and Coop (1997) and Cafaro and Cotecchia (2001)
2
reported the reduction of G0, associated with degradation of the natural structure with increasing mean stress.
Conversely, Yun and Santamarina (2005) and Hird and Chan (2008) indicated for artificially cemented soils an
increase of G0 with increasing stress after yielding and the values of G0 remained higher than for the
reconstituted soils.
Despite the reported differences, it can be shown that a single relationship, which relates G0 to the strength of the
bonded structure, mean effective stress and apparent overconsolidation, can be used to predict the variation of G0
for three different cemented soils.
EXPERIMENTAL DATA
Cemented kaolin clay
Kaolin was mixed with distilled water at approximately the liquid limit (70%). After homogenization, Portland
cement was added at the contents of 0% and 4% of the dry mass. The thoroughly mixed uniform paste was
transferred into an oedometer cell or into a high consolidometer of 38 mm in diameter and consolidated at a low
vertical stress of 5 kPa. After 3 days of curing (cemented soil), or after 10 days of consolidation (uncemented
soil), the triaxial specimens of 76 mm height were trimmed and transferred into triaxial cells. After saturation,
using the back pressure of 100 kPa, the specimens were continuously isotropically compressed up to the mean
effective stress of 1500 kPa with measurements by bender elements at various stress levels. The compression
rate for cemented clay was 1.25 kPa/hour. The consolidation fulfilment was controlled before each
measurement. In the oedometer, the maximum vertical stress reached 7 MPa and 16 MPa during the one-
dimensional compression of pure kaolin and cemented specimen, respectively.
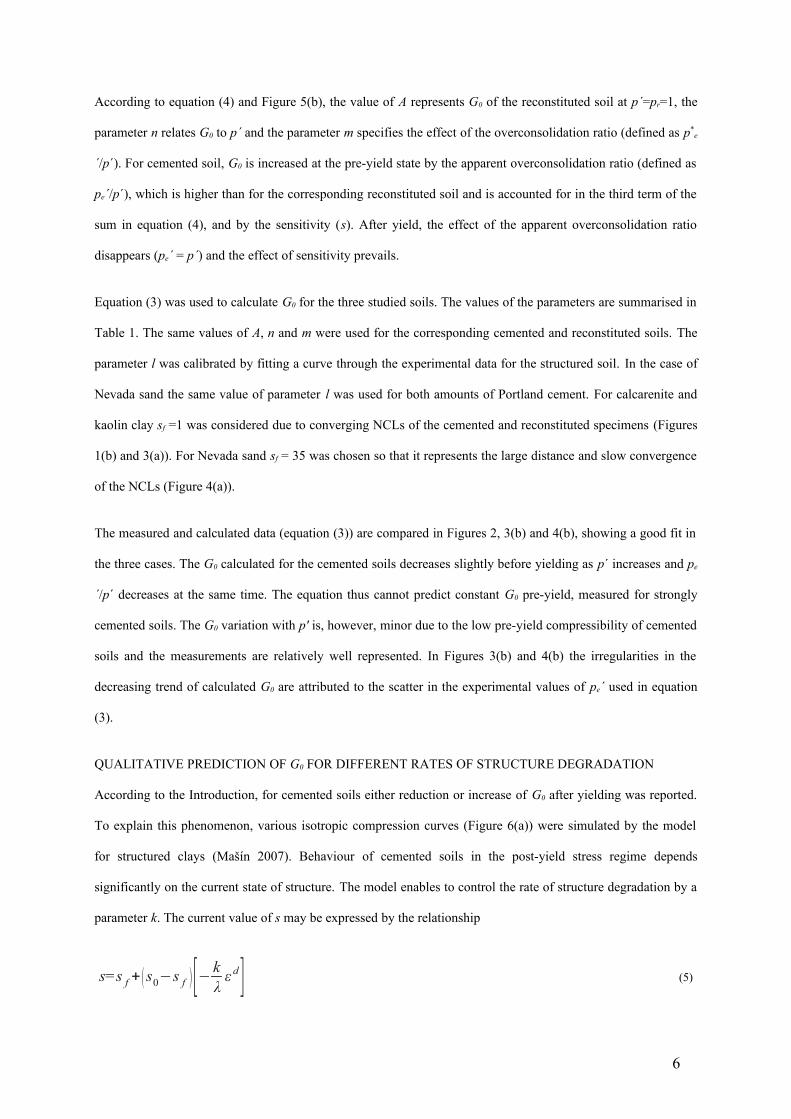
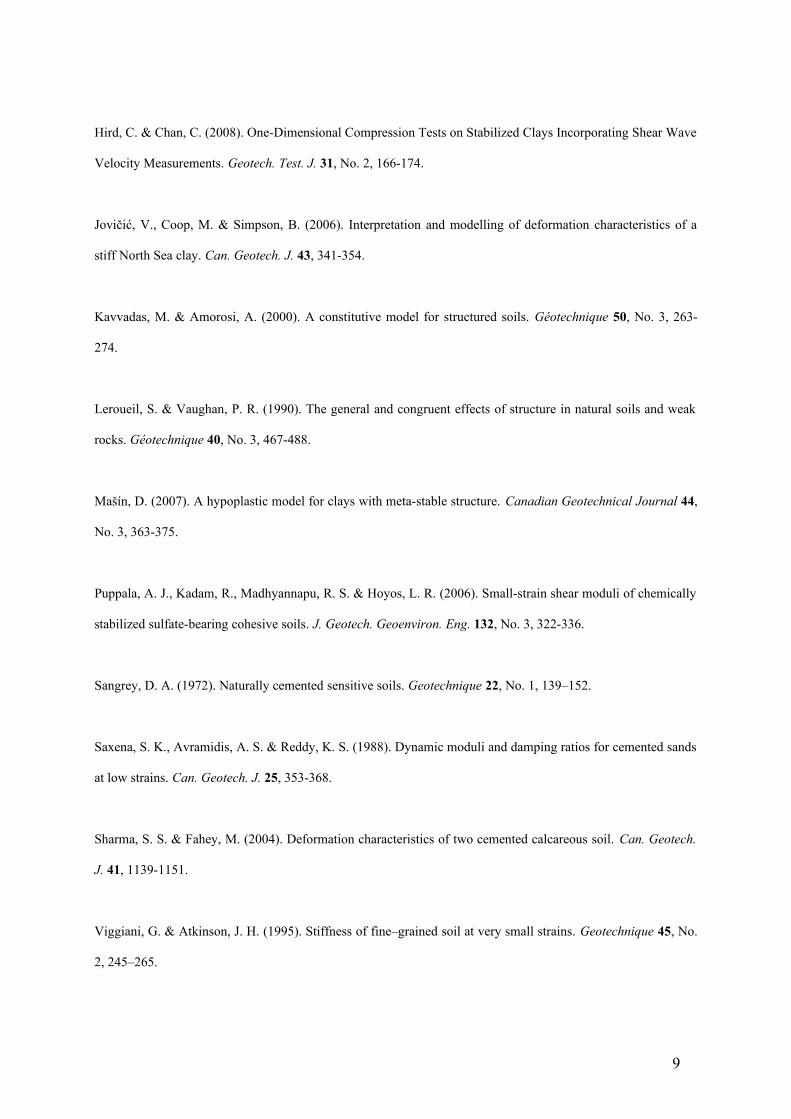
The behaviour of the artificially cemented kaolin clay was found to be qualitatively similar to the behaviour of
sensitive natural clays (Sangrey 1972; Burland 1990; Cotecchia and Chandler 1997). Figure 1(a) shows the
isotropic normal compression lines (NCLs) of pure and cemented kaolin clay. Thanks to bonding, the
compressibility of the cemented clay is lower until a threshold stress (of about 400 kPa), at which the
cementation structure starts to degrade. The threshold isotropic state represents the maximum size of the state
boundary surface (SBS). The applied stresses were not high enough to confirm the convergence of NCLs of pure
and cemented clay. Oedometer tests (Figure 1(b)) however indicate that the NCLs of cemented and pure clay
ultimately converge at high stresses.
3
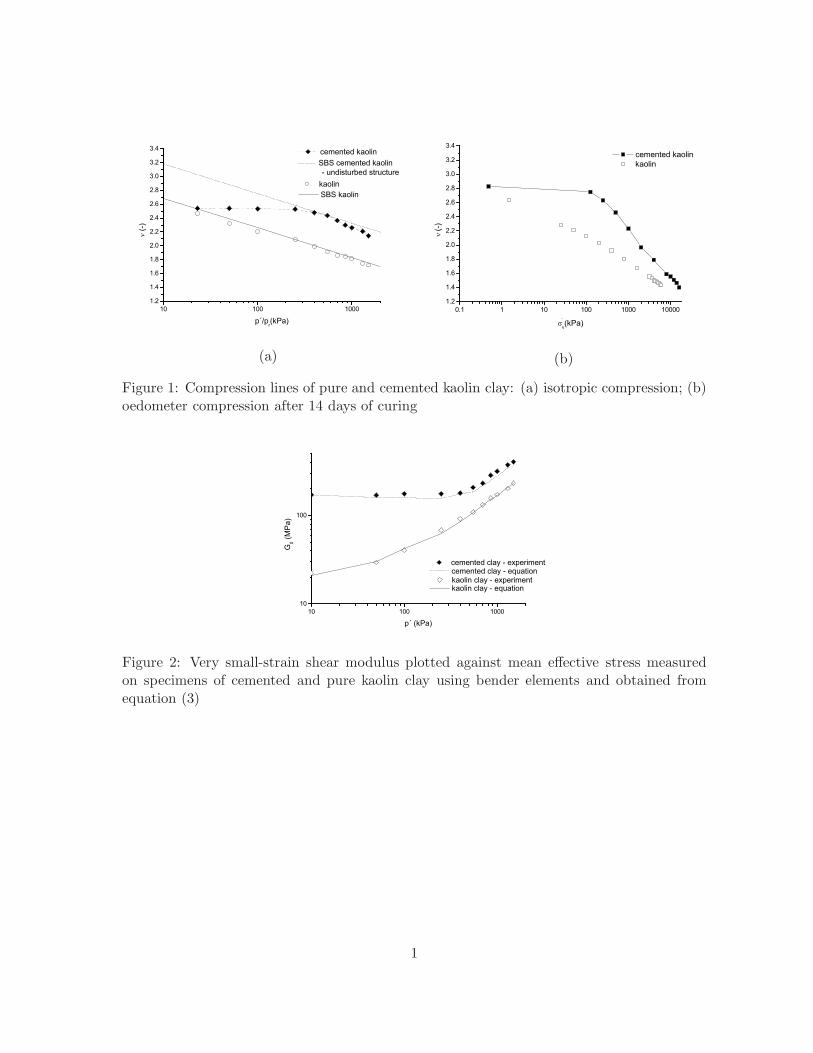
Figure 2 shows the relationship between G0 and the mean effective stress p´ for both types of clay specimens.
The cementation increases G0 in the whole measured stress range. For pure kaolin G0 is seen to vary with p´. The
values of G0 of the cemented specimen, instead, appear to be controlled by cementation, and do not vary with p´,
until p' is about 400 kPa. At higher stresses, G0 increases with p´.
Cemented sands
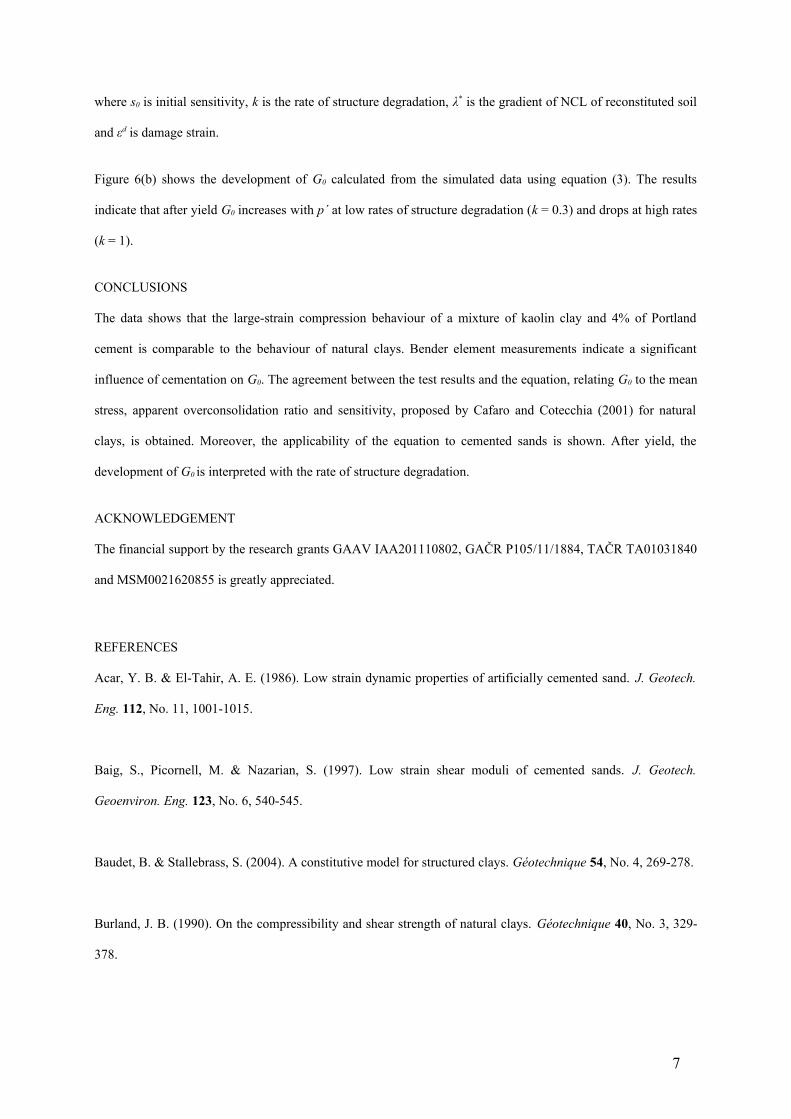
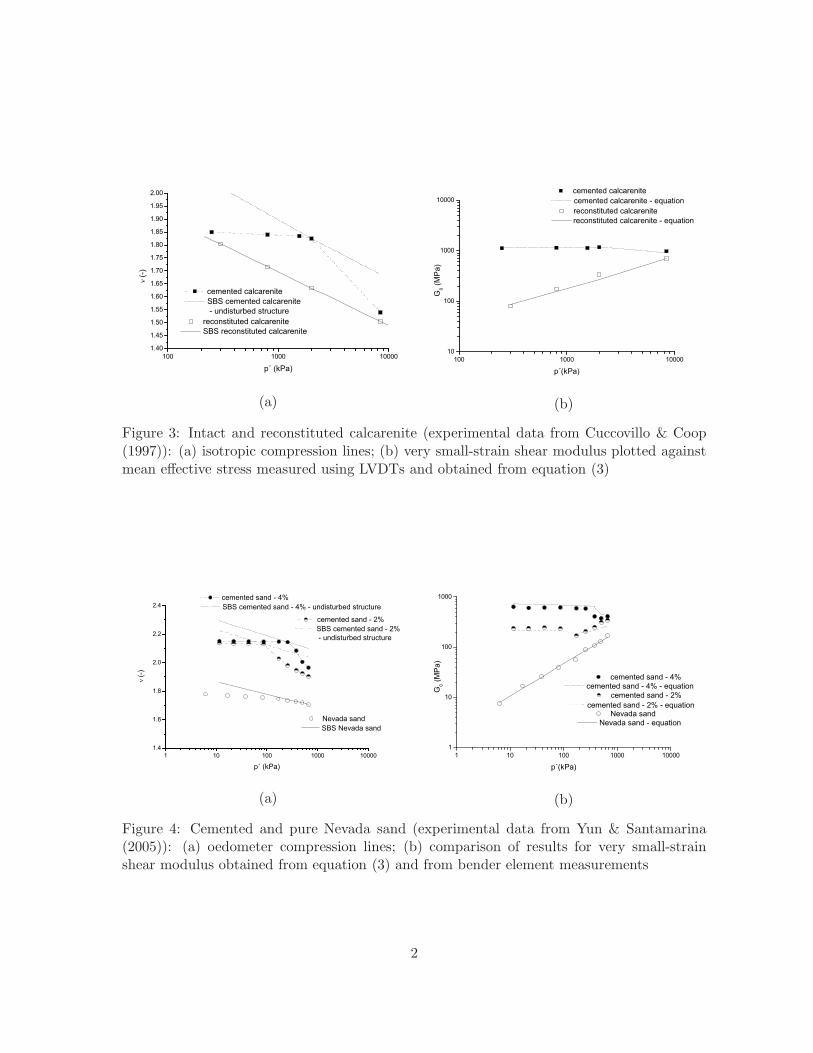
Cuccovillo and Coop (1997) studied the behaviour of calcarenite. Results from the isotropic compression of
intact and reconstituted calcarenite are shown in Figure 3(a). Undrained shearing probes were performed and the
shear moduli were measured using LVDTs. According to the authors, after accounting for the compressibility of
the pore fluid, the effective stress paths followed during undrained shearing were consistent with the material
having isotropic properties. Figure 3(b) compares the values of shear moduli for the intact and reconstituted soil.
Yun and Santamarina (2005) tested pure and artificially cemented Nevada sand. The small strain shear modulus
was measured using shear wave propagation within an oedometer cell. The data for loose uncemented sand and
loose sand with 2% and 4% of cement was used in this study. The changes in specific volume are shown in
Figure 4(a). The values of G0 were evaluated from the values of shear wave velocities, considering ρs = 2.67
g/cm3 (Figure 4(b)).
QUANTIFICATION OF THE SOIL STRUCTURE
The experimental data indicates that G0 of cemented soils depends significantly on the state of soil structure. The
structure can be quantified by the variable stress sensitivity ratio s (Cotecchia and Chandler 2000), defined as the
ratio of the size of the SBS of the cemented soil to that of the corresponding reconstituted soil. In Figure 5(a)
adapted from Cotecchia and Chandler (2000), the position of the SBS of the cemented soil is defined with
parameters N and λ*. The current SBS relates to pe´, that is the Hvorslev equivalent pressure defined as
pe´ = exp ( N− ln (1 +e )
λ ) (1)
where λ* is the slope of the NCL, N is the value of ln(1+e) at p´=pr= 1 kPa and e is void ratio. For the
reconstituted soil the position of the SBS is defined with parameters N* and λ* (Figure 5(a)), which determine the
Hvorslev equivalent pressure p*e´ for the reconstituted soil. The current state of the structure can be quantified by
the ratio s = pe´/p*e´.
4
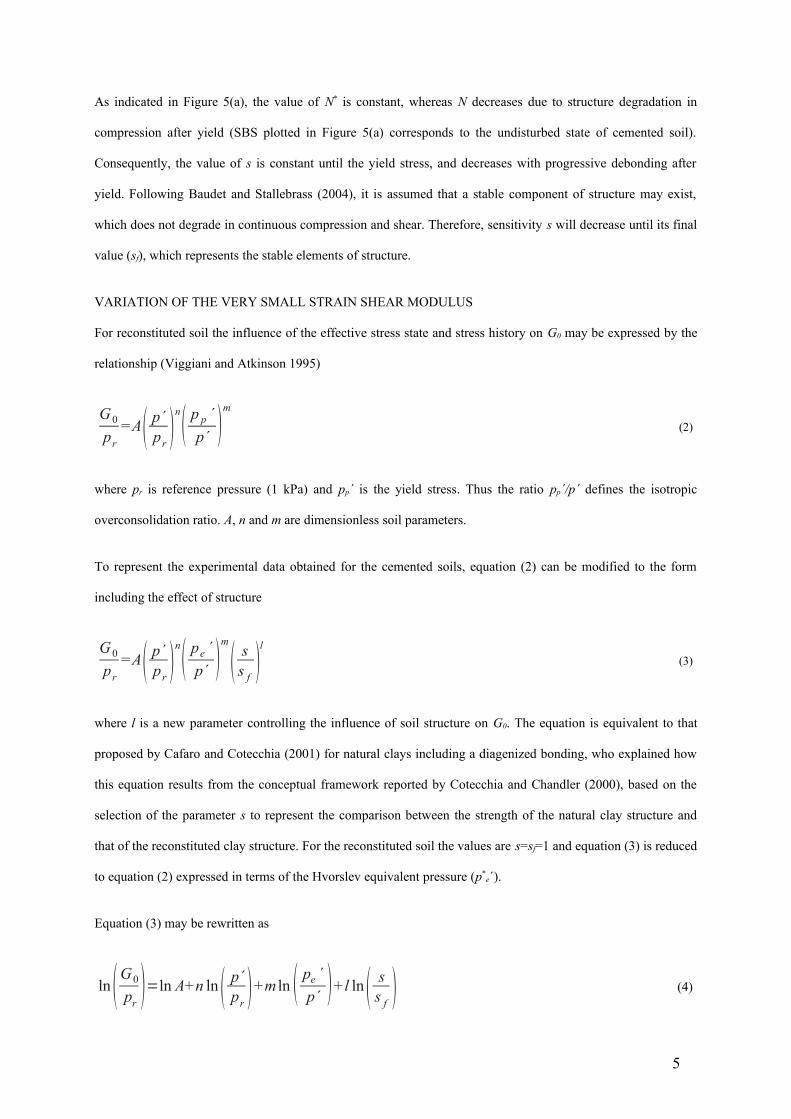
As indicated in Figure 5(a), the value of N* is constant, whereas N decreases due to structure degradation in
compression after yield (SBS plotted in Figure 5(a) corresponds to the undisturbed state of cemented soil).
Consequently, the value of s is constant until the yield stress, and decreases with progressive debonding after
yield. Following Baudet and Stallebrass (2004), it is assumed that a stable component of structure may exist,
which does not degrade in continuous compression and shear. Therefore, sensitivity s will decrease until its final
value (sf), which represents the stable elements of structure.
VARIATION OF THE VERY SMALL STRAIN SHEAR MODULUS
For reconstituted soil the influence of the effective stress state and stress history on G0 may be expressed by the
relationship (Viggiani and Atkinson 1995)
G0
pr
=A( p´pr
)n
( p p ´
p´ )m
(2)
where pr is reference pressure (1 kPa) and pp´ is the yield stress. Thus the ratio pp´/p´ defines the isotropic
overconsolidation ratio. A, n and m are dimensionless soil parameters.
To represent the experimental data obtained for the cemented soils, equation (2) can be modified to the form
including the effect of structure
G0
pr
=A( p´pr
)n
( pe ´
p´ )m
( ss f
)l
(3)
where l is a new parameter controlling the influence of soil structure on G0. The equation is equivalent to that
proposed by Cafaro and Cotecchia (2001) for natural clays including a diagenized bonding, who explained how
this equation results from the conceptual framework reported by Cotecchia and Chandler (2000), based on the
selection of the parameter s to represent the comparison between the strength of the natural clay structure and
that of the reconstituted clay structure. For the reconstituted soil the values are s=sf=1 and equation (3) is reduced
to equation (2) expressed in terms of the Hvorslev equivalent pressure (p*e´).
Equation (3) may be rewritten as
ln(G0
pr)=ln A+n ln( p´
pr)+m ln ( pe ´
p´ )+l ln( ss f
) (4)
5
According to equation (4) and Figure 5(b), the value of A represents G0 of the reconstituted soil at p´=pr=1, the
parameter n relates G0 to p´ and the parameter m specifies the effect of the overconsolidation ratio (defined as p*e
´/p´). For cemented soil, G0 is increased at the pre-yield state by the apparent overconsolidation ratio (defined as
pe´/p´), which is higher than for the corresponding reconstituted soil and is accounted for in the third term of the
sum in equation (4), and by the sensitivity (s). After yield, the effect of the apparent overconsolidation ratio
disappears (pe´ = p´) and the effect of sensitivity prevails.
Equation (3) was used to calculate G0 for the three studied soils. The values of the parameters are summarised in
Table 1. The same values of A, n and m were used for the corresponding cemented and reconstituted soils. The
parameter l was calibrated by fitting a curve through the experimental data for the structured soil. In the case of
Nevada sand the same value of parameter l was used for both amounts of Portland cement. For calcarenite and
kaolin clay sf =1 was considered due to converging NCLs of the cemented and reconstituted specimens (Figures
1(b) and 3(a)). For Nevada sand sf = 35 was chosen so that it represents the large distance and slow convergence
of the NCLs (Figure 4(a)).
The measured and calculated data (equation (3)) are compared in Figures 2, 3(b) and 4(b), showing a good fit in
the three cases. The G0 calculated for the cemented soils decreases slightly before yielding as p´ increases and pe
´/p´ decreases at the same time. The equation thus cannot predict constant G0 pre-yield, measured for strongly
cemented soils. The G0 variation with p' is, however, minor due to the low pre-yield compressibility of cemented
soils and the measurements are relatively well represented. In Figures 3(b) and 4(b) the irregularities in the
decreasing trend of calculated G0 are attributed to the scatter in the experimental values of pe´ used in equation
(3).
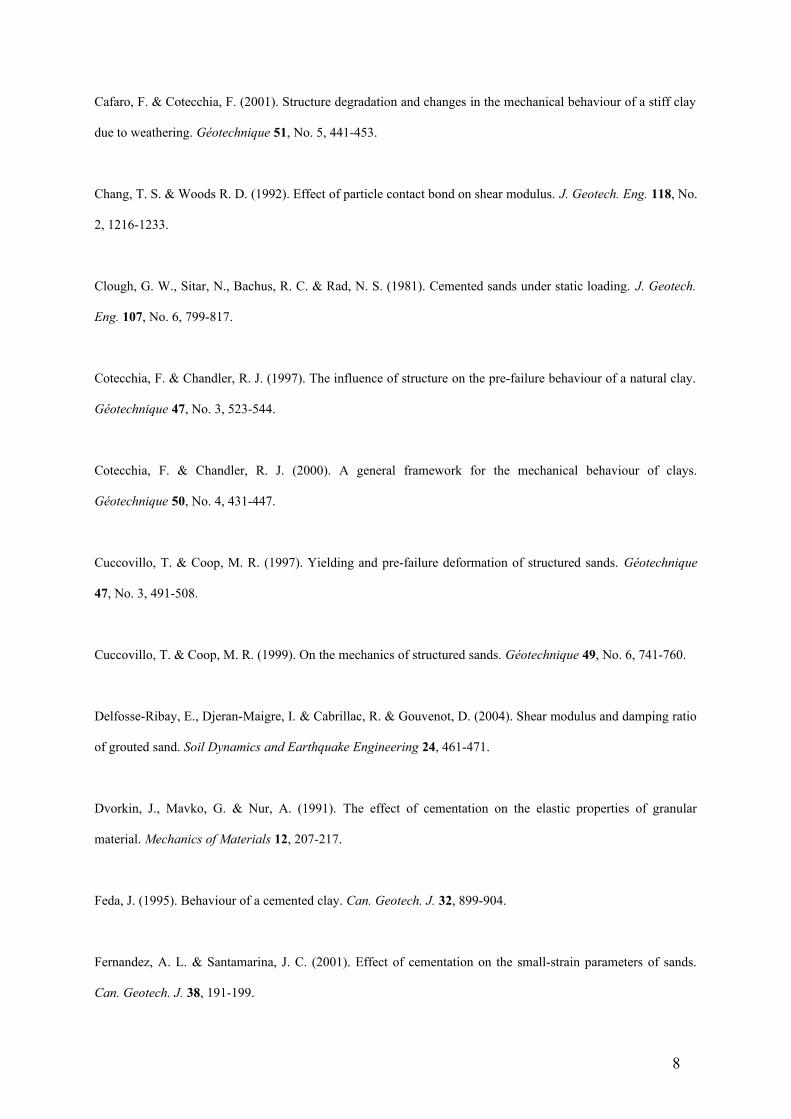
QUALITATIVE PREDICTION OF G0 FOR DIFFERENT RATES OF STRUCTURE DEGRADATION
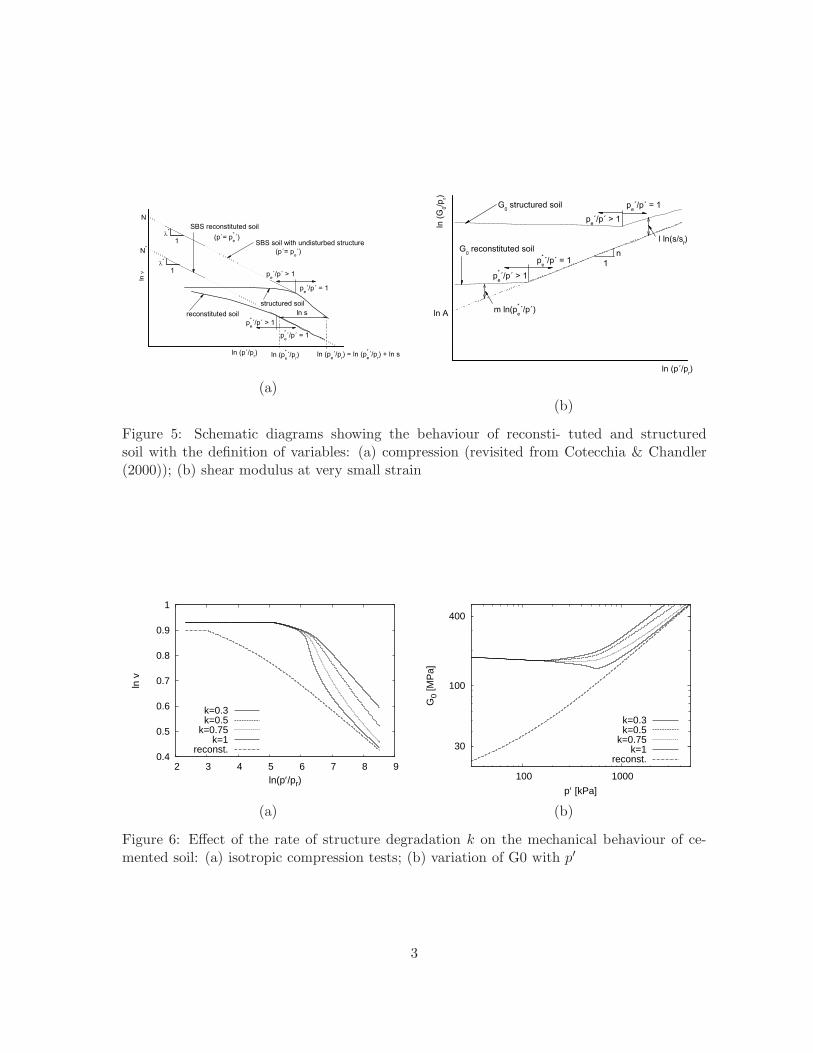
According to the Introduction, for cemented soils either reduction or increase of G0 after yielding was reported.
To explain this phenomenon, various isotropic compression curves (Figure 6(a)) were simulated by the model
for structured clays (Mašín 2007). Behaviour of cemented soils in the post-yield stress regime depends
significantly on the current state of structure. The model enables to control the rate of structure degradation by a
parameter k. The current value of s may be expressed by the relationship
s=s f +(s0−s f )[− kλ
ε d ] (5)
6
where s0 is initial sensitivity, k is the rate of structure degradation, λ* is the gradient of NCL of reconstituted soil
and εd is damage strain.
Figure 6(b) shows the development of G0 calculated from the simulated data using equation (3). The results
indicate that after yield G0 increases with p´ at low rates of structure degradation (k = 0.3) and drops at high rates
(k = 1).
CONCLUSIONS
The data shows that the large-strain compression behaviour of a mixture of kaolin clay and 4% of Portland
cement is comparable to the behaviour of natural clays. Bender element measurements indicate a significant
influence of cementation on G0. The agreement between the test results and the equation, relating G0 to the mean
stress, apparent overconsolidation ratio and sensitivity, proposed by Cafaro and Cotecchia (2001) for natural
clays, is obtained. Moreover, the applicability of the equation to cemented sands is shown. After yield, the
development of G0 is interpreted with the rate of structure degradation.
ACKNOWLEDGEMENT
The financial support by the research grants GAAV IAA201110802, GAČR P105/11/1884, TAČR TA01031840
and MSM0021620855 is greatly appreciated.
REFERENCES
Acar, Y. B. & El-Tahir, A. E. (1986). Low strain dynamic properties of artificially cemented sand. J. Geotech.
Eng. 112, No. 11, 1001-1015.
Baig, S., Picornell, M. & Nazarian, S. (1997). Low strain shear moduli of cemented sands. J. Geotech.
Geoenviron. Eng. 123, No. 6, 540-545.
Baudet, B. & Stallebrass, S. (2004). A constitutive model for structured clays. Géotechnique 54, No. 4, 269-278.
Burland, J. B. (1990). On the compressibility and shear strength of natural clays. Géotechnique 40, No. 3, 329-
378.
7
Cafaro, F. & Cotecchia, F. (2001). Structure degradation and changes in the mechanical behaviour of a stiff clay
due to weathering. Géotechnique 51, No. 5, 441-453.
Chang, T. S. & Woods R. D. (1992). Effect of particle contact bond on shear modulus. J. Geotech. Eng. 118, No.
2, 1216-1233.
Clough, G. W., Sitar, N., Bachus, R. C. & Rad, N. S. (1981). Cemented sands under static loading. J. Geotech.
Eng. 107, No. 6, 799-817.
Cotecchia, F. & Chandler, R. J. (1997). The influence of structure on the pre-failure behaviour of a natural clay.
Géotechnique 47, No. 3, 523-544.
Cotecchia, F. & Chandler, R. J. (2000). A general framework for the mechanical behaviour of clays.
Géotechnique 50, No. 4, 431-447.
Cuccovillo, T. & Coop, M. R. (1997). Yielding and pre-failure deformation of structured sands. Géotechnique
47, No. 3, 491-508.
Cuccovillo, T. & Coop, M. R. (1999). On the mechanics of structured sands. Géotechnique 49, No. 6, 741-760.
Delfosse-Ribay, E., Djeran-Maigre, I. & Cabrillac, R. & Gouvenot, D. (2004). Shear modulus and damping ratio
of grouted sand. Soil Dynamics and Earthquake Engineering 24, 461-471.
Dvorkin, J., Mavko, G. & Nur, A. (1991). The effect of cementation on the elastic properties of granular
material. Mechanics of Materials 12, 207-217.
Feda, J. (1995). Behaviour of a cemented clay. Can. Geotech. J. 32, 899-904.
Fernandez, A. L. & Santamarina, J. C. (2001). Effect of cementation on the small-strain parameters of sands.
Can. Geotech. J. 38, 191-199.
8
Hird, C. & Chan, C. (2008). One-Dimensional Compression Tests on Stabilized Clays Incorporating Shear Wave
Velocity Measurements. Geotech. Test. J. 31, No. 2, 166-174.
Jovičić, V., Coop, M. & Simpson, B. (2006). Interpretation and modelling of deformation characteristics of a
stiff North Sea clay. Can. Geotech. J. 43, 341-354.
Kavvadas, M. & Amorosi, A. (2000). A constitutive model for structured soils. Géotechnique 50, No. 3, 263-
274.
Leroueil, S. & Vaughan, P. R. (1990). The general and congruent effects of structure in natural soils and weak
rocks. Géotechnique 40, No. 3, 467-488.
Mašín, D. (2007). A hypoplastic model for clays with meta-stable structure. Canadian Geotechnical Journal 44,
No. 3, 363-375.
Puppala, A. J., Kadam, R., Madhyannapu, R. S. & Hoyos, L. R. (2006). Small-strain shear moduli of chemically
stabilized sulfate-bearing cohesive soils. J. Geotech. Geoenviron. Eng. 132, No. 3, 322-336.
Sangrey, D. A. (1972). Naturally cemented sensitive soils. Geotechnique 22, No. 1, 139–152.
Saxena, S. K., Avramidis, A. S. & Reddy, K. S. (1988). Dynamic moduli and damping ratios for cemented sands
at low strains. Can. Geotech. J. 25, 353-368.
Sharma, S. S. & Fahey, M. (2004). Deformation characteristics of two cemented calcareous soil. Can. Geotech.
J. 41, 1139-1151.
Viggiani, G. & Atkinson, J. H. (1995). Stiffness of fine–grained soil at very small strains. Geotechnique 45, No.
2, 245–265.
9

Yun, T. S. & Santamarina, J. C. (2005). Decementation, Softening, and Collapse: Changes in Small-Strain Shear
Stiffness in k0 Loading. J. Geotech. Geoenviron. Eng. 131, No. 3, 350-358.
10

Table 1. Parameters controlling the shear modulus of soils with cementation bonds used in equation (3)
material: A n m l sf
kaolin clay 1020 0.73 0.77 0.24 1calcarenite 2326 0.631 0.7 0.7 1
Nevada sand 2454 0.642 0.7 0.34 35
11
10 100 10001.2
1.4
1.6
1.8
2.0
2.2
2.4
2.6
2.8
3.0
3.2
3.4 (-
)
p´/pr(kPa)
kaolin
cemented kaolin SBS cemented kaolin
- undisturbed structure
SBS kaolin
(a)
0.1 1 10 100 1000 100001.2
1.4
1.6
1.8
2.0
2.2
2.4
2.6
2.8
3.0
3.2
3.4
(-)
´v(kPa)
cemented kaolin kaolin
(b)
Figure 1: Compression lines of pure and cemented kaolin clay: (a) isotropic compression; (b)oedometer compression after 14 days of curing
10 100 100010
100
G0 (M
Pa)
p´ (kPa)
cemented clay - experiment cemented clay - equation kaolin clay - experiment kaolin clay - equation
Figure 2: Very small-strain shear modulus plotted against mean effective stress measuredon specimens of cemented and pure kaolin clay using bender elements and obtained fromequation (3)
1
100 1000 100001.40
1.45
1.50
1.55
1.60
1.65
1.70
1.75
1.80
1.85
1.90
1.95
2.00
(-)
p´ (kPa)
cemented calcarenite
reconstituted calcarenite SBS reconstituted calcarenite
SBS cemented calcarenite - undisturbed structure
(a)
100 1000 1000010
100
1000
10000
p´(kPa)
cemented calcarenite
G0 (M
Pa)
cemented calcarenite - equation reconstituted calcarenite reconstituted calcarenite - equation
(b)
Figure 3: Intact and reconstituted calcarenite (experimental data from Cuccovillo & Coop(1997)): (a) isotropic compression lines; (b) very small-strain shear modulus plotted againstmean effective stress measured using LVDTs and obtained from equation (3)
1 10 100 1000 100001.4
1.6
1.8
2.0
2.2
2.4
(-)
p´ (kPa)
SBS cemented sand - 2% - undisturbed structure
Nevada sand
cemented sand - 2%
cemented sand - 4% SBS cemented sand - 4% - undisturbed structure
SBS Nevada sand
(a)
1 10 100 1000 100001
10
100
1000
p´(kPa)
cemented sand - 2% cemented sand - 2% - equation
cemented sand - 4% cemented sand - 4% - equation
G0 (M
Pa)
Nevada sand Nevada sand - equation
(b)
Figure 4: Cemented and pure Nevada sand (experimental data from Yun & Santamarina(2005)): (a) oedometer compression lines; (b) comparison of results for very small-strainshear modulus obtained from equation (3) and from bender element measurements
2
ln (p´/pr)
*
ln (pe´/pr) = ln (p*e´/pr) + ln sln (p*
e´/pr)
ln sreconstituted soilstructured soil
SBS reconstituted soil (p´= p*
e´) SBS soil with undisturbed structure (p´= pe´)
pe´/p´ = 1
pe´/p´ > 1
N
*
N*
1
p*e´/p´ > 1
p*e´/p´ = 1
ln
1
(a)
G0 reconstituted soil
ln (G
0/pr)
ln (p´/pr)
ln A
G0 structured soil
pe´/p´ > 1
p*e´/p´ > 1
pe´/p´ = 1
m ln(p*e´/p´)
1n
l ln(s/sf)
p*e´/p´ = 1
(b)
Figure 5: Schematic diagrams showing the behaviour of reconsti- tuted and structuredsoil with the definition of variables: (a) compression (revisited from Cotecchia & Chandler(2000)); (b) shear modulus at very small strain
0.4
0.5
0.6
0.7
0.8
0.9
1
2 3 4 5 6 7 8 9
ln v
ln(p′/pr)
k=0.3k=0.5
k=0.75k=1
reconst.
(a)
30
400
100
100 1000
G0
[MP
a]
p′ [kPa]
k=0.3k=0.5
k=0.75k=1
reconst.
(b)
Figure 6: Effect of the rate of structure degradation k on the mechanical behaviour of ce-mented soil: (a) isotropic compression tests; (b) variation of G0 with p′
3


