Embed Size (px)
Citation preview

Country Report
On
Financing of Domestic Biogas Plants in India
Postage stamp released on 22 Nov., 2007
International Year of Sanitation – 2008 Cooking on biogas
Dr. K. C. Khandelwal D-146, Vaishali Nagar, JAIPUR - 302021, INDIA
Telephone ++ 91-141-6456813; Email: [email protected]
(Adviser (Retd), Ministry of New and Renewable Energy, Government of India, New Delhi)
22-23 October, 2008
International Workshop on Financing of Domestic Biogas Plants
Bangkok, Thailand (Sponsored by Asia Biogas Programme, SNV Netherlands Development Organisation)
ii
Acknowledgement
Thanks are due to Mr. B. K. Bhatt, Director, Ministry of New and Renewable Energy, Government of India, New Delhi for providing latest information on the National Biogas and Manure Development Programme. Information gathered from the Directorate of Biotechnology, Khadi and Village Industries Commission, Mumbai and UCO Bank, Regional Office, Ajmer, Rajasthan is duly acknowledged. Grateful to Mr. Timo Hogenhout and Mr. Ramesh Gautam, Microfinance Adviser, SNV–Lao PDR and Nepal respectively and Mr. D. Owekisa, Financial Adviser, SNV-Rwanda for reviewing manuscript and giving valuable suggestions. I thank the Asia Biogas Programme, SNV Netherlands Development Organisation and Mr. Wim van Nes, Biogas Practice Leader, SNV for supporting the preparation of this report. Hope this report will generate interest and guide discussions in the forthcoming International Workshop on Financing of Domestic Biogas Plants scheduled on 22-23 October, 2008 in Bangkok, Thailand. The author will feel privileged if this report, even in a small measure, could help the participants of the Asia Biogas Programme in working out practical recommendations for promoting biogas to improve the life of farming families. Place: Jaipur (K. C. Khandelwal) Date: 14 October, 2008

iii
Summary
Biogas provides multiple benefits to rural people. The fixed dome biogas technology developed indigenously for producing biogas from cattle dung is simple and has been accepted widely by small and marginal farmers and weaker sections of the society. Over 4 million plants have already been installed throughout the country. Financial support in terms of subsidy and bank loans is critical to motivate farmers, who cannot afford investment in biogas. Ministry of New and Renewable Energy (MNRE) is implementing the National Biogas and Manure Management Programme and providing subsidy and other incentives for domestic biogas plants. The programme is continued since 1981-82 and the target planned for the XI Five Year Plan (2007-11) is to add capacity of producing two million cubic metres of biogas. State Governments, Khadi and Village Industries Commission, several non-government organisations (NGOs) and private entrepreneurs are constructing plants and providing technical support. Reserve Bank of India and National Bank on Agriculture and Rural Development are providing refinancing facility. Commercial and cooperative banks provide loans and a scheme of insurance of plants against natural calamities exists. During the last one decade, most plants were self- financed and bank loans were not availed. However, with rapid increase in cost of plants during the last two years and subsidy remained unchanged, interest in bank loans is getting revived. Financial analysis of fixed dome Deenbandhu model carried out based on current costs and monetary values assigned to saving of fuels and production of manure indicated that plants continue to be viable and economics of scale prevails. For a plant of one m3 size of 55 days of retention period, the payback period was a maximum of 6.17 years and for 40 days retention period was 4.07 years. The payback period for all other sizes of plants was less than 4 years, except a 2 m3 plant of 55 days retention period. Nat Present Values were positive and Internal Rate of Return was more than 30 percent for all sizes of plants, except one m3 plant of 55 days retention period. Of late, the Clean Development Mechanism of the United Nations Framework on Climate Change has renewed interest in domestic biogas plants both at the national and international level. Two projects on domestic biogas plants, one under CDM and another under Chicago Climate Exchange, have already received carbon rebates and three more projects are at validation stages under CDM. Of late, many NGOs and financing institutions are enthusiastic to formulate such projects. SWOT analysis of applied financial instruments, i.e., subsidy, bank financing and carbon rebate has been carried out. An attempt has been made to work out a set of recommendations on investment subsidy, bank loans on liberal terms, developing projects for carbon rebate, international financial support and minimizing capital cost of plants for deliberation in the International Workshop on Financing of Domestic Biogas Plants scheduled for 22-23 October, 2008 at Bangkok, Thailand.

iv
Table of Content Page
Title page Acknowledgement ii Summary iii Table of Contents iv Abbreviations vi 1. Introduction and Background 1 1.1 Introduction 1.2 Approved models and sizes
1.3 Implementation strategy 1.4 Number of biogas plants installed 1.5 Insurance of biogas plants 1.6 Diagnostic study 1.7 Targets of number of plants to be installed in future
2. Objectives, Methodology and Limitations 6 2. 1 Objectives 2.2 Methodology and Limitations 3. Current costs of domestic biogas plants 7 3.1 Requirements of materials and labour 3.2 Cost estimates 4. Financial analysis 8 5. Brief description of financing instruments 9
5.1 Subsidy 5.2. Institutional financing 5.3 Other sources
6. Overview of financing of domestic biogas plants 13 6.1 Farmers’ contribution
6.2 Subsidy 6.3 Bank finance 6.4 Carbon rebate
7. SWOT analysis of the applied financial instruments 15 7.1 Subsidy 7.2 Bank financing 7.3 Carbon rebate 8. Conclusions and recommendations 17
8.1 Conclusions 8.2 Recommendations
9. References 20

v
Annexure
I. Materials and labour required for floating drum plants (30 days retention period) 21 II. Materials and labour required for floating drum plants (40 days retention period) 22 III. Materials and labour required for floating drum plants (55 days retention period) 23
IV. Materials and labour required for fixed dome Deenbandhu plants (40 days 24 retention period)
V. Materials and labour required for fixed dome Deenbandhu plants (55 days 25 retention period) VI. Materials and cost estimates for fixed dome Deenbandhu ferro-cement plants 26 for in situ construction VII. Highlights of Bagepalli CDM Biogas Programme implemented under CDM 27 VIII. Highlights of Vedaranniyam Biogas Project posed for funding under CDM 28 IX. Highlights of Hassan Biogas Project posed for funding under CDM 29 X. Highlights of Kolar Biogas Project posed for funding under CDM 30 XI. Financial analysis of Deenbandhu Model (40 days retention period) 31 XII. Financial analysis of Deenbandhu Model (55 days retention period) 32

vi
Abbreviations
BDTCs Biogas Development and Training Centre CCX Chicago Climate Exchange CERs Carbon Emission Reduction Certificates CDM Clean Development Mechanism under the Kyoto Protocol cuft Cubic feet oC Degree Centigrade IRDP Integrated Rural Development Programme IRR Internal Rate of Return KfW Kreditenstalt fur Wiederaufbau, Frankfurt – Development Bank of Germany kg Kilogramme KVIC Khadi and Village Industries Commission, Mumbai l Litre m Metre m
3 Cubic metres
MoU Memorandum of Understanding MNRE Ministry of New and Renewable Energy NABARD National Bank for Agriculture and Rural Development NBMMP National Biogas and Manure Development Programme NGOs Non-Governmental Organisations NPV Net Present Value OREDA Orissa Renewable Energy Development Agency, Bhubaneswar, Orissa PDD Project Design Document Reliance Reliance Industries Limited, Dahej Manufacturing Division, Dahej, Bharuch Gujarat RBI Reserve Bank of India RRBs Regional Rural Banks Rs. Indian currency in Rupees SC Scheduled Castes SHGs Self Help Groups Sintex Sintex Industries Limited (Plastic Division), Kalol, Gujarat State, 302721 SLBC State Level Bankers Committee ST Scheduled Tribes SWOT Strengths, Weaknesses, Opportunities and Threats UNFCC United Nations Framework Convention on Climate Change
$ US Dollar

1
1. Introduction and Background
1.1 Introduction
India has the largest cattle population in the World and cattle dung offers a very high potential for producing biogas to meet ever increasing cooking fuel requirements and achieve recycling of organic waste for improving soil health and increasing agricultural production with simultaneous better sanitation and environment in villages. The combined population of cattle and buffaloes is over 289 million heads (Livestock Census - 2001) and is estimated to yield about 1,000 million tonnes of dung annually. While more than one-third of the total number of rural households in the country, i.e., 40 million rural families, who own 3 or more cattle heads, can benefit from biogas technology, at present the Government aims at a potential of 12 million domestic biogas plants, besides large capacity plants for electricity generation. Indigenously developed simple-to-construct and easy-to-operate domestic biogas plants have been promoted mainly for processing of cattle dung under a Centrally Sponsored Scheme - National Project on Biogas Development, since 1981-82. It was rechristened as National Biogas and Manure Management Programme (NBMMP) in 2002-03 and is continued during the Eleventh Five Year Plan (2007-12). The objectives of programme are (i) to provide fuel for cooking purposes and organic manure to rural households through family type biogas plants; (ii) to mitigate drudgery of rural women, reduce pressure on forests and accentuate social benefits; and (iii) to improve sanitation in villages by linking sanitary toilets with biogas plants.
1.2 Approved models and sizes
A multi-model promotional approach was implemented right from the beginning of biogas programme to suit availability of local construction materials and skill and also needs of different economic groups of rural families. Historically, Khadi and Village Industries Commission, Mumbai (KVIC) designated the plant sizes in terms of quantity of gas produced daily, which is followed even today and not in terms of volume of digesters, followed internationally. When 25 kg of wet dung (20 % Total Solids), collectable from 2-3 cattle, depending upon age, size and breed of animals, method of grazing, etc., is fed into a plant, about one cubic metre of gas is produced daily. For domestic purpose, plant sizes are: 1, 2, 3, 4 and 6 cubic metres gas production per day. Plants are promoted in areas up to an altitude of 2000 metres from sea level. Plants of 30, 40 and 55 days of retention periods have been developed to suit different geographical areas on the basis of average ambient temperatures during winter months (November to February). States grouped into three zones on the basis of average ambient temperatures during winter months and recommended retention periods for plants are mentioned in Table 1 (Khandelwal and Mahdi, 1986). A list of approved models and sizes is given at Table 2. Photographs of fixed dome model made of brick masonry and ferro-cement, floating drum and Syntex model are given at page 3. The fixed dome Deenbandhu (meaning ‘friend of poor’) model made of brick masonry structure is the most popular, representing over 85 percent of the plants installed, because of its low capital and maintenance costs. The most common sizes are 1 and 2 m3.

2
Table 1. Grouping of States for promotion of plants of recommended retention period
States Average temperature during winter months
Recommended retention period
Zone I: Andaman and Nicobar Islands, Andhra Pradesh, Goa, Karnataka, Kerala, Maharashtra, Puducherry and Tamil Nadu
More than 15 oC 30 days
Zone II: Bihar, Chandigarh, Chattisgarh, Dadra and Nagar Haveli, Daman and Diu, Delhi, Gujarat, Haryana, Jammu area of Jammu and Kashmir, Jharkhand, Madhya Pradesh, Orissa, Punjab, Rajasthan, Uttar Pradesh and West Bengal
Between 10 oC to 15 oC 40 days
Zone III: Himachal Pradesh, North-Eastern Region States, Sikkim, Kashmir and Ladhak regions of Jammu and Kashmir and Uttarakhand
Less than 10 oC 55 days
Table 2. Biogas models and sizes approved for promotion during 2008-09
Model Plant size (m3)
I. Fixed Dome Model (40 and 55 days retention period)
(i) Deenbandhu brick masonry 1,2,3,4 and 6
(ii) Deenbandhu ferro-cement in-situ construction 1,2,3,4 and 6
(iii) Pre-fabricated RCC fixed dome 2 and 3
II. Floating Drum Model (30, 40 and 55 days retention period)
(i) KVIC floating metal drum 1,2,3,4, 6 and 10
(ii) KVIC ferro-cement digester and fibre glass reinforced plastic gas holder 1,2,3,4, 6 and 10
(iv) KVIC reinforced cement concrete (RCC) digester 1,2,3,4, 6 and 10
III. Prefabricated Model for limited field trial (40 days retention period)
(i) Sintex - HDPE prefabricated Deenbandhu 2
(ii) Reliance - Rotomolded Polyethylene prefabricated dome for Deenbandhu
2
KVIC- Khadi and Village Industries Commission, Mumbai; Sintex - Sintex Industries Limited, Kalol, Gujarat; Reliance - Reliance Industries Limited, Dahej Manufacturing Division, Dahej, District Bharuch, Gujarat
1.3 Implementation strategy
Ministry of New and Renewable Energy (MNRE), earlier called Ministry of Non-conventional Energy Sources, is implementing NBMMP through State nodal departments/nodal agencies and Central agencies, such as, KVIC. In-turn, they involve district level organizations, non-governmental organisations (NGOs) and trained private entrepreneurs. Village local bodies, called ‘Gram panchayats’ are involved in the selection of beneficiaries and also for monitoring purpose. For technical and training support, Biogas Development and Training Centres (BDTCs) have been established in ten different States.

3
Biogas Plant Models
Top: Floating drum
Bottom: Fixed dome
Ferro-cement fixed dome model(in situ construction)
Sintex - HDPE prefabricated Deenbandhu Model
4
Fig. 1 Achievement from 1981-82 to 2007-08 under NBMMP
0
500000
1000000
1500000
2000000
2500000
3000000
3500000
4000000
4500000
1981-82
1983-84
1985-86
1987-88
1989-90
1991-92
1993-94
1995-96
1997-98
1999-2000
2001-02
2003-04
2005-06
2007-08Fiscal year
No.o
f pla
nts
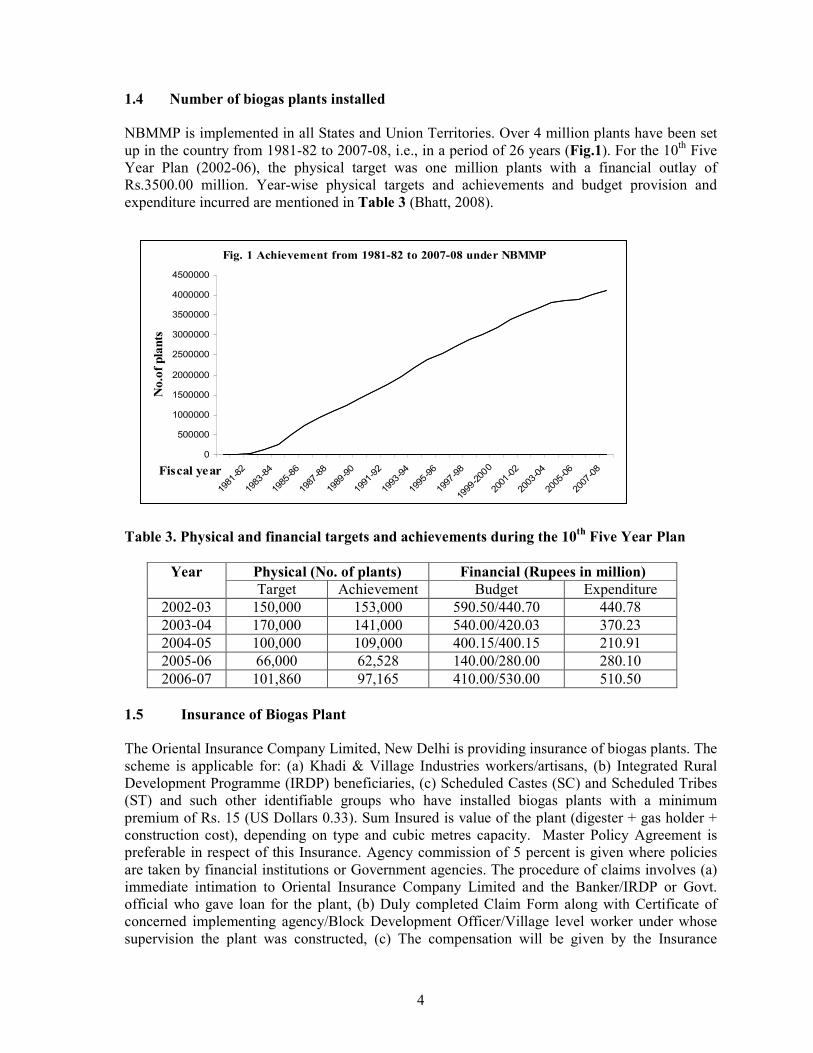
1.4 Number of biogas plants installed
NBMMP is implemented in all States and Union Territories. Over 4 million plants have been set up in the country from 1981-82 to 2007-08, i.e., in a period of 26 years (Fig.1). For the 10
th Five
Year Plan (2002-06), the physical target was one million plants with a financial outlay of Rs.3500.00 million. Year-wise physical targets and achievements and budget provision and expenditure incurred are mentioned in Table 3 (Bhatt, 2008).
Table 3. Physical and financial targets and achievements during the 10th Five Year Plan
Physical (No. of plants) Financial (Rupees in million) Year
Target Achievement Budget Expenditure
2002-03 150,000 153,000 590.50/440.70 440.78
2003-04 170,000 141,000 540.00/420.03 370.23
2004-05 100,000 109,000 400.15/400.15 210.91
2005-06 66,000 62,528 140.00/280.00 280.10
2006-07 101,860 97,165 410.00/530.00 510.50
1.5 Insurance of Biogas Plant
The Oriental Insurance Company Limited, New Delhi is providing insurance of biogas plants. The scheme is applicable for: (a) Khadi & Village Industries workers/artisans, (b) Integrated Rural Development Programme (IRDP) beneficiaries, (c) Scheduled Castes (SC) and Scheduled Tribes (ST) and such other identifiable groups who have installed biogas plants with a minimum premium of Rs. 15 (US Dollars 0.33). Sum Insured is value of the plant (digester + gas holder + construction cost), depending on type and cubic metres capacity. Master Policy Agreement is preferable in respect of this Insurance. Agency commission of 5 percent is given where policies are taken by financial institutions or Government agencies. The procedure of claims involves (a) immediate intimation to Oriental Insurance Company Limited and the Banker/IRDP or Govt. official who gave loan for the plant, (b) Duly completed Claim Form along with Certificate of concerned implementing agency/Block Development Officer/Village level worker under whose supervision the plant was constructed, (c) The compensation will be given by the Insurance

5
Company to the Bank/Financing Agency. Covered risks are: loss or damage due to (a) Fire, (b) Lightning, (c) Explosion/Implosion, (d) Riot, Strike, Malicious damage, (e) Impact by Rail/Road vehicle or animals, (f) Aircraft and other aerial and/or space devices, (g) Flood, inundation, storm, cyclone, typhoon, tempest, hurricane, tornado, (h) Earthquake, volcanic eruption or other convulsions of nature and (i) Subsidence landslide (including rockslide) damage. The Government of India has permitted programme implementing agencies to pay premium for insurance out of the subsidy amount. In general, NGOs and programme implementing agencies, which build hundreds of biogas plants in a year, insure plants for the duration of guarantee period, i.e., two years.
1.6 Diagnostic study
A diagnostic study was under taken in 2001 by the Programme Evaluation Organisation (PEO), Planning Commission (Anonymous, 2002). The study covered a sample of 615 plants set up from 1981-82 to 1999-2000 in 19 States, namely, Andhra Pradesh, Arunachal Pradesh, Assam, Bihar, Gujarat, Haryana, Himachal Pradesh, Karnataka, Kerala, Madhya Pradesh, Maharashtra, Meghalaya, Orissa, Punjab, Rajasthan, Sikkim, Tamil Nadu, Uttar Pradesh and West Bengal. Results indicated that about 81 percent plants were commissioned, 6 percent plants were lying un-commissioned, 4 percent plants were incomplete and 9 percent plants were dismantled. Out of the commissioned plants, 66 per cent plants were found in use. Among various reasons for incomplete and dismantled plants, some plant owners reported shortage of funds, lack of timely supply of cement and gas holders and delay by construction agency (Though not reported in the study, the author found in earlier years that some plant owners dismantle plants to avoid or delay repayment of loans). In regard to benefits, the study found that an average size of plants installed was 2 m3 and monthly saving in the consumption of fuels was on an average 74 kg firewood, 7 kg charcoal, and 5.5 kg of LPG. This was the first study to record the use of biogas for saving of LPG. The use of manure found to result in the saving of nitrogenous chemical fertilizer to an average of 61 kg urea per year.
1.7 Targets of number of plants to be installed in future
For the 11
th Five Year Plan (2007-2011), a target of an aggregate capacity of generating 2 million
cubic metres of biogas was planned with an outlay of Rs.4210.00 million. In other words the plan is to promote one million more plants of an average capacity of 2 m3. The targets and achievements for the first two years of the Plan (2007-11) are given at Table 4 (Anonymous, 2007a; Bhatt, 2008).
Table 4. Targets and achievements for 2007-08 and 2008- 09
Physical (No. of plants) Financial (Rupees in million) Year
Target Achievement Budget Estimates/ Revised Estimates
Expenditure
2007-08 104,460 91,645 360/ 560 550.91
2008-09 116,500
1,364 (April-July 2008)
630 30.73 (April-August 2008)

6
2. Objective, Methodology and Limitations
2. 1 Objective
Biogas plants benefit in terms of avoided costs and do not generate direct income to households. It is recognised that a mix of financial instruments, i.e., subsidy and credit on easy terms motivates farmers in developing countries to adopt biogas technology for improving the quality of life. India has been implementing the biogas programme for 27 years with its internal financial resources. As the installation cost of plants has been escalating continuously and the subsidy support in percentage terms has come down substantially, interest in availing loans is getting revived. The present country report attempts to examine the evolution of instruments for financing of biogas plants in India and whether financing of biogas plants is an issue and if so, what measures are needed to attract more potential farmers to adopt biogas technology. More specifically, the report addresses the following areas:
- Brief description of the domestic biogas programme in India including an overview of the number of plants installed in the past, with possible targets for the future;
- A breakdown of the current costs of domestic biogas plants, and a cost-benefit analysis from the perspective of the household;
- An overview of the financial instruments applied in the programme in the past and today; - A breakdown of the current financing of domestic biogas plants, and a cost-benefit
analysis from the perspective of the financing institution; - An evaluation of the strengths, weaknesses, opportunities and threats (SWOT) of the
financial instruments applied in India so far; and - Conclusions on the use of financial instruments so far and recommendations on its
improved use in future. The report will be presented in the International Workshop on 22 and 23 October, 2008 in Bangkok, Thailand for the benefit of representatives of the participating countries of the Asia Biogas Programme of SNV Netherlands Development Organisation.
2.2 Methodology and Limitations
The country report is based on published papers, brochures, reports, etc., and information collected from the Ministry of New and Renewable Energy, Khadi and Village Industries Commission and UCO Bank, Zonal Office, Ajmer, Rajasthan and other contact persons who are key informants. Since most of the plants installed during the last one decade were self-financed, not much information on bank loans is available. While efforts were made to collect current information from as many sources as possible within the given limited period of one month, the present report attempts to highlight key issues of financing of domestic biogas plants in India. The report is not exhaustive and views expressed are of the author only.

7
3. Current costs of domestic biogas plants
3.1 Requirements of materials and labour
Requirements of materials and labour for floating drum KVIC model having 30, 40 and 55 days of retention period are given at Annexure-I, II and III respectively (Khandelwal and Mahdi, 1986). Similarly, materials and labour required for fixed dome Deenbandhu model of 40 and 55 days of retention period are given at Annexure-IV and V respectively (Singh, Myles and Dhussa, 1987). Fixed dome model of 40 days retention period is promoted even in the States which are recommended for plants of 30 days of retention period.
3.2 Cost estimates
During the last two years, prices of building materials and wages of labour have escalated rapidly. Presently, MNRE is collecting latest information on cost estimates from different states. The information received so far in MNRE from the States of Gujarat and Karnataka and five BDTCs (Coimbatore, Tamil Nadu; Guwahati, Assam; Indore, Madhya Pradesh; Kharagpur , West Bengal; and Palampur, Himachal Pradesh) (Bhatt, 2008), along with data collected for floating drum model KVIC (Dhale, 2008; Anonymous, 2007b), is used for working out cost estimates mentioned in Table 5 (Floating drum KVIC model of 55 days retention period is not included as its demand in hilly and difficult terrain areas is now almost negligible due to its high cost and problems of transportation of drum and regular maintenance, beyond the affordability of potential plant owners). Cost estimates along with materials and labour required for Deenbandhu ferro-cement in situ construction model are given at Annexure-VI (Thomas, 1999). Sintex plants of 2 m3 and 3 m3 capacity cost Rs. 22,000 and 23,200 respectively, excluding cost on transportation. Table 5. Average estimated costs of Deenbandhu and KVIC plants
Estimated Cost
(Prices in September, 2008) Model Plant size
(m3)
in Rupees in US Dollars*
Fixed Dome Deenbandhu (40 days retention period) 1 12,000 267
2 16,000 356
3 20,000 445
4 24,000 533
Fixed Dome Deenbandhu (55 days retention period) 1 16,000 (19200) 356
2 21,000 (25200) 467
3 26,000 (31200) 578
4 31,000 (37200) 689
Floating drum KVIC masonry digester and steel gas holder (30 days retention period)
1
19,000
422
2 22,000 489
3 25,000 556
4 28,000 622
Floating drum KVIC masonry digester and steel gas holder (40 days retention period)
1
24,000
533
2 29,000 778
3 34,000 644
4 39,000 867
*One US Dollar = Rs. 45.
Figures given in parenthesis are cost estimates of Deenbandhu model (55 days of retention period) for North Eastern Region States (excluding plain areas of Assam). Plants are generally built within the premises of households near kitchens and therefore, cost of land for building a plant is taken as zero. Each State works out cost estimates as necessary. However, the actual cost of plants varies from place to place.

8
4. Financial analysis
4.1 The two main products of domestic biogas plants are clean gaseous cooking fuel and enriched manure, which have monetary values. Besides, the use of biogas helps in saving of about 2-3 hours daily per household, mainly for women and also in reducing eye and lung diseases, thereby decreasing expenditure on health, but it is different to give monetary values to them due to inadequate data and lack of alternative employment opportunities in rural areas. 4.2 Financial analysis of the most popular fixed dome model has been carried out based on the cost of plants given in Table 5 and assumptions from published literature and field observation of the author. Details of the analysis for fixed dome Deenbandhu model of 40 days and 55 days retention period are given at Annexure-XI and XII respectively. Assumptions are mentioned in Table 6 and a summary of the analysis is given at Table 7.
Table 6. Assumptions made for financial analysis
Particular Assumption
1 kg wet dung produces 0.24 kg dried dung cake
1 kg wet dung produces 0.4 m3 biogas containing 55 percent methane
Price of dung cakes Rs. 700/tonne
1 m3 size plant requires 25 kg wet dung/day
Annual maintenance cost of plant 2% of installation cost
Size of plant: 1 m3
2 m3 3 m3 4 m3
Annual saving of fuels 700 kg purchased firewood + 4 LPG cylinders (each of 14.2 kg net weight) 900 kg firewood + 6 LPG cylinders 1100 kg firewood + 8 LPG cylinders 1200 kg firewood + 10 LPG cylinders
Size of plant: 1 m3 2 m3 3 m3
4 m3
Annual production of manure 3.42 tonnes 6.84 tonnes 10.27 tonnes 13.69 tonnes
Price of manure Rs. 1000/tonne
Price of firewood Rs. 1.50 / kg
Price of one LPG cylinder Rs. 300 / cylinder
Life span of a plant 20 years
Rate of interest 12 %
Table 7. Summary of the financial analysis of fixed dome Deenbandhu model
Plant size Particular
1 m3 2 m3 3 m3 4 m3
I. Deenbandhu model (40 days of retention period)
Payback period without subsidy 4.07 years 3.03 years 2.63 years 2.45 years
Payback period with subsidy 3.21 years 2.44 years 2.22 years 2.14 years
NPV at 30 % rate of discount without subsidy 927.87 5909.94 10892.01 15376.71
NPV at 30 % rate of discount with subsidy 3027.87 8609.94 13592.01 18076.71
IRR with out subsidy 32.56 % 41.37 % 46.68 % 49.51 %
IRR with subsidy 39.40 % 49.70 % 54.28 % 66.19 %
II. Deenbandhu model (55 days of retention period)
Payback period without subsidy 6.17 years 4.32 years 3.66 years 3.36 years
Payback period with subsidy 4.4 years 3.2 years 2.9 years 2.79 years
NPV at 30 % rate of discount without subsidy -3337.39 578.36 4494.12 7912.50
NPV at130 % rate of discount with subsidy 162.60 5078.36 8994.12 12412.5
IRR without subsidy 23.71% 31.09 % 35.97 % 38.23 %
IRR with subsidy 30.52 % 39.53 % 42.88 % 44.33 %

9
4.3 The analysis indicates that fixed dome plants are financially viable and economics of scale prevails. Without subsidy, the payback period for a plant of 1 m3 is 4.07 years and it decreases with increase in sizes. With subsidy, the payback period is reduced to 3.21 years for 1 m3 plant. The Net Present Value (NPV) at 30 percent rate of discount for all sizes of plants is positive, except for the smallest 1 m3 plant of 55 days of retention period. When subsidy is not counted, the Internal Rate of Return (IRR) is maximum, i.e., 49.51 for 4 m3 plant of 40 days of retention period and 38.23 percent for the plant of 55 days of retention period. It decreases with decrease in size of plants. IRR is 32.66 percent for 1 m3 plant of 40 days of retention period and 23.71 percent for the plant of 55 days of retention period. 4.4 In general, the financial benefits are in terms of avoidance of costs in fuel and chemical fertiliser. Of late, a trend is emerging, in particular in agriculturally prosperous villages close to cities, where products of biogas plants, i.e., biogas and manure are sold to neighbours.
5. Brief description of financing instruments
5.1 Subsidy
NBMMP envisaged an important provision of subsidy to motivate prospective farmers, right from the beginning in 1981-82. Even before, from 1975-76 to 1979-78, the Government of India subsided plants under a scheme called ‘Development of Local Manurial Resources’. The subsidy was given on percentage level, i.e., up to 33 percent for general category and 50 percent for weaker sections of society (Schedules Castes, Scheduled Tribes, small and marginal farmers) and varied according to sizes, ranging from 2 m
3 to 85 m
3. The percentage level of subsidy was
difficult to administer due to vast variation in the cost of plants from State to State and even among districts. In late 90s, when evaluation survey studies pointed out that people installed plants of sizes higher than what was necessary, simply for availing more amount of subsidy, a system of flat rate of subsidy was evolved with focus on 2 m
3 plant. The flat rate of subsidy was
found easy and transparent to administer. The flat amount of subsidy coupled with advance release of funds up to district level made flow of subsidy funds easy and smooth from the Central Government to State Governments and in turn to farmers. Rates of subsidy approved for 2008-09 are given at Table 8 (MNRE, 2008). Besides, additional subsidy is given at the rate of Rs.500 per plant for cattle dung based biogas plants linked with sanitary toilet in individual households. State corporate bodies, NGOs, entrepreneurs, etc., receive a grant of Rs.700 per plant for setting up plants on turn-key job basis in North Eastern Region States (excluding plain areas of Assam), Sikkim, Jammu and Kashmir, Himachal Pradesh, Uttarakhand, hilly districts and islands and Rs. 500 per plant in remaining States and areas.
5.2. Institutional financing
Reserve Bank of India (RBI) - the federal government bank and National Bank for Agriculture and Rural Development (NABARD) – an apex institution for policy, planning and operation in the field of agriculture credit, have been supporting biogas programme. The Syndicate Bank, Manipal, Karnataka was first to develop and implement a scheme of financing of biogas plants in October, 1973. Later in 1976 more than 20 banks were giving loans for biogas plants (Anonymous, 1976). NABARD made automatic refinancing facility available to commercial banks and other eligible financing institutions for up to 75 percent of loan amount disbursed for plants (NABARD, 1984). NABARD developed and circulated a model composite scheme on

10
‘dairy farming’, which included biogas plant also for small and marginal farmers and landless labourers.
Table 8. Rates of central subsidy approved for 2008-09 under NBMMP
Category Amount of Central subsidy / plant ( in US Dollars)
I. North Eastern Region States and Sikkim (except plain areas of Assam)
Rs.11,700 ($ 260)
II. Plain areas of Assam Rs.9,000 ($ 200)
III. Jammu & Kashmir, Himachal Pradesh, Uttaranchal (excluding terai region), Nilgiris of Tamil Nadu; Sadar Kursoong and Kalimkpong sub-divisions of the Darjeeling district (WB), Sunder bans, Andaman and Nicobar Islands
Rs.4,500 ($ 100) [Restricted to Rs. 3,500 ($ 77.78) for 1 m3 fixed dome]
IV. Scheduled Castes (SC), Scheduled Tribes (ST), desert districts, small and marginal farmers, landless labourers, Terai region of Uttaranchal, Western Ghats and other notified hilly areas
Rs.3,500 ($ 77.78) [Restricted to Rs. 2,800 ($ 62.22) for 1 m3 fixed dome]
V. All others Rs.2,700 ($ 60) [Restricted to Rs. 2,100 ($ 46.67) for 1 m3 fixed dome]
$ - UD Dollar
At present, the items ‘Biogas plants and biogas engines’ are mentioned under the heading “Small Sector Industrial Units, Equipment/Systems for Development of New and Renewable Sources of Energy, etc.,” in the lists of “Priority Sector/Weaker Section Advance” under “Priority Sector Lending (RBI, 2007). Individual banks are free to formulate their own schemes for lending various investment activities, including biogas plants, within the broad norms and guidelines issued by RBI from time to time. For an example, the United Bank of India is implementing a new scheme called ‘United Gramyashree Yojana’ for providing liberal financial assistance to farmers for agriculture and allied activities, including biogas. It is a composite scheme for existing borrowers/depositors and their women family members for supplementing family income. Existing medium term borrowers with good track record for the last three years can draw again fully, an amount equivalent to the amount repaid earlier without providing further additional security. Women family members of such borrowers can also avail loan up to Rs.50,000 for productive purposes on their simple recommendation and guarantee without any other security. Existing depositors with good track record maintaining an average balance of Rs.25,000 or above for over last three years can recommend proposals of others for loan, which are expeditiously dealt with. Concessional rate of interest is extended to borrowers, guaranteed by such depositors. The amount of loan is could be up to a maximum of the original loan repaid by the existing borrower without further security or up to Rs.50,000/- for women family members. Potential plant owners apply for loan in a prescribed from. Banks insist upon farmers to contribute in cash or kind at least 10 percent of the estimated cost of plants and sanction loan for the remaining estimated cost. Margin money is not insisted upon till the subsidy is available. At present the rate of interest is 12 percent and repayment period is fixed between 3 to 7 years. Collateral security is taken, besides hypothecation of biogas appliances. For technical feasibility of plants, banks accept the recommendations of field staff of programme implementing agencies. The sanctioned loan amount is disbursed in 2 or 3 instalments linked with the progress of construction of plants. The borrower is solely responsible for repaying loan with interest to the bank at pre-determined half yearly instalments. In practice, the plant owners sign loan applications and other documents

11
in advance and authorise plant constructing company or NGO to receive the loan amount from the bank. If payment of instalments is delayed, then the bank resorts to remedial measures provided in the signed agreement, including revoking collateral guarantee. However, when the plant of sub-standard quality is constructed or maintenance servicing is not rendered in time during the guarantee period by the company or NGO concerned, then the plant owner does not get any help from the banks and is left to file complaint to the district nodal department for redress of grievances. Bank Branch Managers follow the cost estimates recommended by the State Level Unit Cost Committee and prepare repayment schedules for individual borrowers depending upon his or her total family income and repayment capacity. Since Branch Mangers are the key persons in the financing of biogas plants, their motivation and correct understanding of the benefits of plants are critical. Programme implementing agencies maintain liaison with designated State and district level lead banks and take action on the following:
(i) The block / district-wise targets should be reflected in the service area plans prepared by different banks.
(ii) Bank-wise targets should be worked out in the beginning of the financial year and finalised in the meeting of State Level Bankers Committee (SLBC).
(iii) The banks, in turn, should chalk out a programme for expeditious clearance of loan applications so that construction activities can start in full swing before the commencement of the monsoon.
(iv) Loan applications for biogas plants pending with branches for more than one month without action should be reviewed in the meetings of SLBC.
(v) When loan applications are pending for more than 3 months, State Government/ Agencies should compile bank-wise details of such applications and send the information to the Banking Division, Ministry of Finance or RBI for issuing directions to banks concerned.
(vi) State Governments have Unit Cost Committees at the State Level to examine all issues relating to fixation of unit cost of installation of various models and sizes of biogas plants. This exercise is being done in collaborating with NABARD and financial institutions. Since periodic revisions in unit-cost are necessary for sanctioning realistic loan amounts, State nodal departments and implementing agencies should take initiatives for getting the regular meetings of Unit Cost Committees organized by NABARD.
5.3 Other sources
5.3.1 Other Government organisations, Local Bodies, Cooperative Societies, etc.
Some state government departments/ local bodies provide additional financial support to supplement subsidy to meet special requirements of local people and area. Such supports are in the range of a few hundred rupees (e.g., Rs. 500 / plant given by a few Zilla Parishads-District Councils in Maharashtra State) to a few thousand rupees (e.g., State Government departments in Himachal Pradesh, Karnataka and Andhra Pradesh and by Rubber Board-India, Kottayam, Kerala). This kind of additional assistance, in particular large amounts, though seems attractive, yet caused problems, such as plants installed by non-cattle owners and lack of interest due to nil or negligible financial stake of plant owners (Anonymous, 2002). Multiple sources of financial

12
support for same plants should be discouraged and focus should be to cover more beneficiaries with pooled resources.
5.3.2 International Non-Governmental Organisations
The CHF - Canadian Hunger Foundation, a not-for-profit institution supported by the Canadian Government and now known as Partners in Rural Development initiated in 1983 a project to support NGOs in India for implementing biogas programme. The donor funds were used mainly for meeting organisational cost and sometimes for subsidising poor farmers. It lasted for about two decades and helped in capacity building of over 50 NGOs. In 2000, it initiated a project called Canada-India Rural Energy Project (CIREP), which led NGOs to establish Indian Rural Energy Network (IRENet) as a not-for-profit organisation in India. IRENet established rural Self Help Groups (SHGs), assisted by NGOs, to install and manage renewable energy devices and services, including biogas plants. The Canadian NGO gave limited working capital to NGOs for enabling SHGs to avail micro-finance credit. However, this mechanism did not succeed mainly due to poor response of SHGs, whose primary concern was direct income generating activities.
5.3.3 Clean Development Mechanism (CDM)
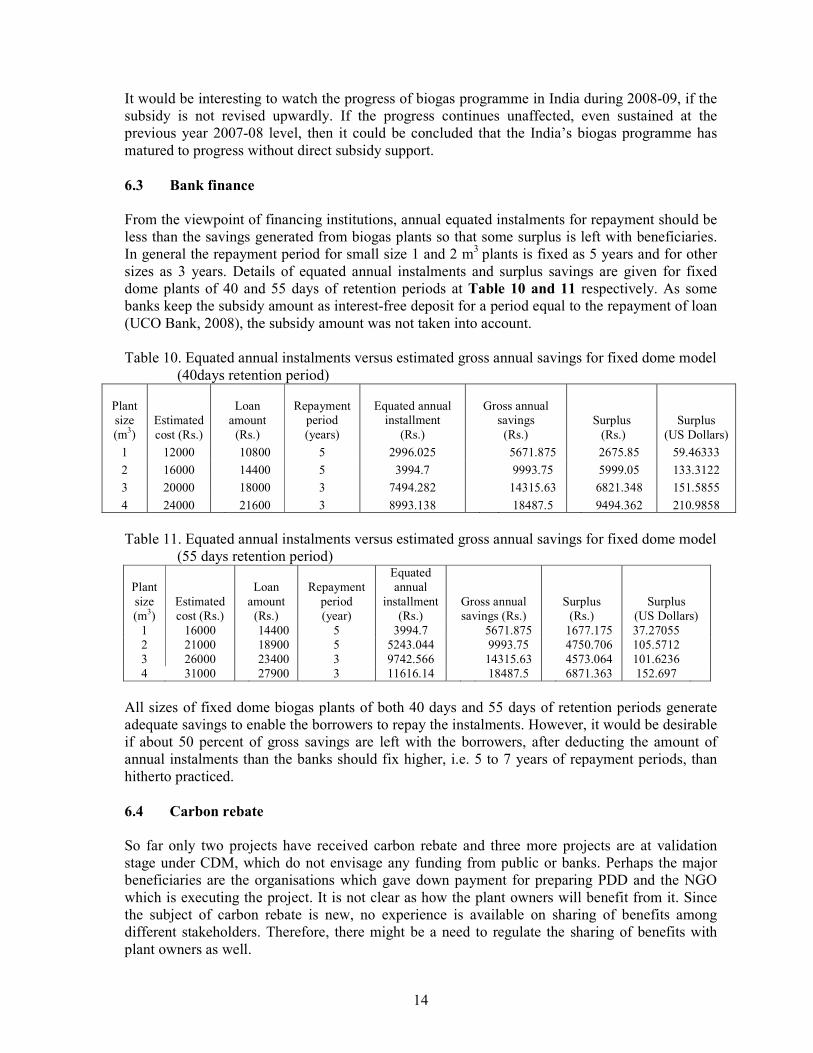
The United Nations Framework for Climate Change (UNFCC) is administering CDM under Kyoto Protocol (UNFCC, 2008). The first project called “Bagepalli Biogas Project”, aiming at setting up of 5500 plants in district Kolar, Karnataka was submitted to the UNFCC-CDM in 2005 and has recently submitted monitoring report for issuing Carbon Emission Reduction Certificates (CERs) (Annexure-VI). Three more projects are at validation stages (Annexure-VII, VIII and
IX). These CDM projects do not envisage any public funding or bank loans. However, the Project Design Document (PDD) does not provide details of up-front investment made by different organisations involved, including farmers. The revenue of generated over a period of 7 to 10 years is expected to provide profit over and above the up-front investment. Of late, many NGOs, which already have adequate infrastructure and trained man power, are developing projects in availing carbon rebate facility.
5.3.4 Climate Exchange
Recently an NGO called Anthyodaya, Angamali, Kochi, and Kerala has pioneered the idea of
carbon credit for a group of farmers operating biogas plants. About 16,000 plant owners gave an
undertaking that they will sell the credit only to Chicago Climate Exchange (CCX) and also
produce a document from village panchayats certifying the biogas plants. The NGO functions as
an aggregator of carbon emission offset credits for CCX and pools the credits generated from the
operation of biogas plants for sale in the exchange. It ensures distribution of the amount received
by the sale of the carbon credits amongst the farmers, based on the size of plants installed. In
April, 2008, each farmer received on an average about Rs. 1000 (US Dollar 22.22) as first
proceeds from CCX.
5.3.5 International development bank
One of the programme implementing organisations, namely the Orissa Renewable Energy Development Agency (OREDA), signed a MoU with Kreditenstalt fur Wiederaufbau, Frankfurt (KfW) - a Development Bank of Germany, on 9 September, 2008 for making the biogas plants that are being set up in the state eligible for CDM benefits. KfW is carrying out a survey on the

13
non-functional biogas plants, out of a total of 190,000 plants set up in the state before 2004. The non-functional bio-gas plants with structural problems will be repaired and made CDM compatible. The project design document (PDD) for each non-functional bio-gas plant will be worked out by KfW and made reusable. KfW is also working out PDD for 8,000 new bio-gas plants coming up in the state by 2008. KfW will pay upfront for the new bio-gas plants that are estimated to earn revenue of Rs 4,000 (US Dollars 88.89) per annum per plant. KfW will bear the cost of preparation and registration of PDD, which is estimated to be about Rs.1, 500,000 (US Dollars 3333.33).
6. Overview of financing of domestic biogas plants
6.1 Farmers’ contribution
The biogas programme does not envisage any contribution from farmers. However, involvement of family members in working with masons and transporting materials from road side to the plant site is common. In general, farmers contribute about 10 percent of the actual cost of plants in kind.
6.2 Subsidy
The rate of subsidy approved for 2008-09 remains the same as was followed during 2006-07 and 2007-08. Since the cost of plants has escalated during the last two years, the subsidy on percentage level has decreased (Table 9). For general category, which is the largest group to build plants, the subsidy works out to a maximum of 17.5 percent for one m3 plant of Deenbandhu model and 16.87 percent for 2 m3 plant. For weaker sections of the community, the rate of subsidy is up to a maximum of 23.3 percent only. For North Eastern Region States, where the Government policy was to subsidise up to 90 percent level, the present subsidy is only 61 percent of the cost of the cheaper Deenbandhu model. The subsidy in terms of percentage of costs for floating drum model works out to still less. Table 9. Subsidy in percentage terms for different category of beneficiary and common models of biogas plants
Percentage of subsidy on estimated cost of Deenbandhu Model
(m3)
Category of beneficiary Retention period of plants
Amount of Central subsidy/plant
1 2 3 4
I. North Eastern Region States and Sikkim
55 days Rs.11,700 60.94 46.43 37.5 31.45
II. Hilly 55 day Rs.4,500 (Restricted to Rs.
3,500 for 1 m3 fixed dome)
21.88 21.43 17.31 14.52
III. Scheduled Castes (SC), Scheduled Tribes (ST), desert districts, small and marginal farmers and landless labourers
30 & 40 days
Rs.3,500 (Restricted to Rs.
2,800/- for 1 m3 fixed dome)
23.3 21.88 17.5 14.58
IV. All others :
30 & 40 days
Rs.2,700 (Restricted to Rs.
2,100/- for 1 m3 fixed dome)
17.5
16.87
13.5
11.25
14
It would be interesting to watch the progress of biogas programme in India during 2008-09, if the subsidy is not revised upwardly. If the progress continues unaffected, even sustained at the previous year 2007-08 level, then it could be concluded that the India’s biogas programme has matured to progress without direct subsidy support.
6.3 Bank finance
From the viewpoint of financing institutions, annual equated instalments for repayment should be less than the savings generated from biogas plants so that some surplus is left with beneficiaries. In general the repayment period for small size 1 and 2 m3 plants is fixed as 5 years and for other sizes as 3 years. Details of equated annual instalments and surplus savings are given for fixed dome plants of 40 and 55 days of retention periods at Table 10 and 11 respectively. As some banks keep the subsidy amount as interest-free deposit for a period equal to the repayment of loan (UCO Bank, 2008), the subsidy amount was not taken into account. Table 10. Equated annual instalments versus estimated gross annual savings for fixed dome model (40days retention period)
Plant size (m3)
Estimated cost (Rs.)
Loan amount (Rs.)
Repayment period (years)
Equated annual installment
(Rs.)
Gross annual
savings (Rs.)
Surplus (Rs.)
Surplus (US Dollars)
1 12000 10800 5 2996.025 5671.875 2675.85 59.46333
2 16000 14400 5 3994.7 9993.75 5999.05 133.3122
3 20000 18000 3 7494.282 14315.63 6821.348 151.5855
4 24000 21600 3 8993.138 18487.5 9494.362 210.9858
Table 11. Equated annual instalments versus estimated gross annual savings for fixed dome model (55 days retention period)
Plant size (m3)
Estimated cost (Rs.)
Loan amount (Rs.)
Repayment period (year)
Equated annual
installment (Rs.)
Gross annual savings (Rs.)
Surplus (Rs.)
Surplus (US Dollars)
1 16000 14400 5 3994.7 5671.875 1677.175 37.27055
2 21000 18900 5 5243.044 9993.75 4750.706 105.5712
3 26000 23400 3 9742.566 14315.63 4573.064 101.6236
4 31000 27900 3 11616.14 18487.5 6871.363 152.697
All sizes of fixed dome biogas plants of both 40 days and 55 days of retention periods generate adequate savings to enable the borrowers to repay the instalments. However, it would be desirable if about 50 percent of gross savings are left with the borrowers, after deducting the amount of annual instalments than the banks should fix higher, i.e. 5 to 7 years of repayment periods, than hitherto practiced.
6.4 Carbon rebate
So far only two projects have received carbon rebate and three more projects are at validation stage under CDM, which do not envisage any funding from public or banks. Perhaps the major beneficiaries are the organisations which gave down payment for preparing PDD and the NGO which is executing the project. It is not clear as how the plant owners will benefit from it. Since the subject of carbon rebate is new, no experience is available on sharing of benefits among different stakeholders. Therefore, there might be a need to regulate the sharing of benefits with plant owners as well.

15
7. SWOT analysis of the applied financial instruments
7.1 Subsidy
Strengths Weaknesses
1. The Government continues to provide subsidy for biogas plants.
2. Administration of flat rate of subsidy was more transparent and easy.
1. With the recent rapid escalation in cost of plants, the prevailing rates of subsidy are quite low in percentage terms.
2. Corruption in disbursement of subsidy discourses other potential farmers to install biogas plants.
Opportunities Threats
1. In recent years, subsidy on LPG, kerosene and urea fertilizer has been reduced.
2. The Government plans to loosen price control regime on LPG, kerosene and urea fertilizer possibly in the next 2-3 years.
1. Penetration of subsidized LPG is increasing at a faster rate in rural areas.
7.2 Bank financing
Strengths Weaknesses
1. Loans for biogas plants are covered under ‘priority lending’ schemes of the Government.
2. Financing institutions are supportive of biogas programme and provide medium term loans 93-7 years) at liberal terms.
3. Both RBI and NABARD provide refinancing facilities to cooperative and commercial banks respectively for loan amounts sanctioned for biogas plants.
4. Banks can avail a scheme of insurance of biogas plants to safeguard against default in repayment due to natural calamities.
5. Programme implementing agencies have adequate staff at the district level for technical appraisal of loan applications for banks.
6. With rapid escalation in cost of plants, farmers have started showing interest in availing loans.
7. Banks are also providing working capital and term loans to small scale industries for manufacturing biogas appliances.
8. Unit Cost Committees at district level work out installation costs once in six months or as necessary.
1. Sometimes local branch mangers do not feel comfortable to sanction loans as plants do not generate direct cash in flow and also due to inadequate quality control mechanism during construction of fixed dome plants and lack of maintenance servicing of plants.
2. In general Branch Managers fix short repayment period, i.e., 3 years.
3. Collateral security is insisted upon. 4. Field data on monetary values of social
benefits, such as saving of time for using in income generating activities and reduction in expenditure on health, are lacking.

16
Opportunities Threats
1. Commercial banks are developing various
new loaning schemes for farmers, such as credit cards.
2. Matured micro-financing institutions could provide collateral-free loans for biogas plants.
1. The Government’s relief measures by
waiving off repayment of agricultural loans for distressed farmers discourage banks to sanction small loan amounts.
2. Natural calamities, like floods and drought, cause death of cattle and make biogas plants non-functional; thereby farmers stop repayment of loans.
7.3 Carbon rebate
Strengths Weaknesses
1. Many NGOs already involved in the biogas programme have adequate capacity to develop projects for carbon credit financing.
2. Adequate institutional capacity exits for monitoring biogas projects to meet the requirements of CDM or other mechanisms.
1. The present rate of carbon credit can not meet in full even the prevailing low rate of subsidy in the first year.
2. Only organisations capable of taking high risks can meet the up front cost of PDD.
3. CDM methodology for small projects is cumbersome and costly.
4. So far no regulation exits to ensure transfer of a part of the share of carbon rebate to plant owners, at least in proportion to capital costs borne by them.
Opportunities Threats
1. Carbon credit could be a new profitable business for NABARD and financing institutions. State Bank of India signed a MOU on 19 May, 2008 with KfW CARBON FUND for jointly exploring financing of CDM projects.
2. Multi Commodity Exchange (MCX), Mumbai has recently started carbon
credit trading.
The first commitment period agreed by the parties under Kyoto Protocol terminates in 2012.

17
8. Conclusions and recommendations
8.1 Conclusions
8.1.1 General
(i) The fixed dome Deenbandhu is the cheapest model and therefore most popular. However, the lack of effective supervision during construction time and the use of poor quality construction materials caused its failure in certain areas and the process of revival of old non-functional fixed dome plants is very difficult and costly. (ii) The progress of biogas programme has been steady during the last two decades. While every year physical targets are achieved and the quality of construction and maintenance serving of plants have improved over time, mainly because of increased awareness among people, the continuing low functionality of plants is a point of serious concern. (iii) The impact of turn-key job fee with two years’ free maintenance guarantee is not visible. (iv) In certain areas NGOs and entrepreneurs have been constructing plants satisfactorily but the replication of their successes in other areas, even in surrounding areas, has not been taking place. (v) Failure of even a single plant in an area discourages many potential farmers and also banks to sanction loans. (vi) Cost of plants has rapidly escalated during the last two years due to increase in the prices of building materials and labour charges.
(vii) Since the prices of LPG cylinders and urea fertiliser have been increased recently, plants of fixed dome model have become financially viable, in spite of escalation in cost of plants.
8.1.2 Rate of Central subsidy
At present, the quantum of subsidy in percentage terms is too low to attract more farmers of both general category and weaker sections to set up plants.
8.1.3 Institutional financing
(i) In the last one decade, most of the plants were built with self finances and bank loans were not availed. However, with the escalation in the cost of plants, now the interest in getting loans is reviving. (ii) Microfinance institutions are yet to be involved in a big way in giving collateral-free loans for biogas plants in particular to Women Small Help Groups.
8.1.4 Carbon rebate
(i) With the implementation of two projects, one under CDM and another supported by Chicago Climate Exchange, NGOs are enthusiastically developing many projects for carbon funding.

18
(ii) Banks are also exploring this new venture. Recently the State Bank of India signed a MOU with KfW Carbon fund for jointly exploring financing under CDM. (iii) A programme implementing agency has also signed a MoU with KfW for a CDM project on biogas in the State of Orissa.
8.2 Recommendations
8.2.1 One of the key issues for promotion of the use of biogas as fuel in rural households in developing countries is the financing of plants. After a decision for building a biogas plant is taken, it is the availability of adequate funds in time which will determines the successful completion and commissioning of the plant. In India about 2-3 percent of plants remain in-complete and un- commissioned due to shortage of funds after start of digging of pits. 8.2.2 For deliberation in the International Workshop on Financing of Domestic Biogas Plants scheduled for 22-23 October, 2008 at Bangkok, Thailand, a set of recommendations are suggested below:
(i) Investment subsidy to a level to bring down payback period to less than 3 years
(a) In the developing countries majority of farmers are small and marginal and depend upon subsistence farming including animal husbandry. They can not afford biogas plants which involve, like any other renewable energy system, high capital investment. Therefore, biogas plants need subsidy support as an investment in improving the life of poor farmers, in particular women. It serves an important factor in attracting potential farmers to accept biogas plants. Moreover, the Governments in developing countries are subsidizing LPG and kerosene and also providing various kinds of fiscal and financial incentives to industries, urban households, etc., for using other renewable energy systems (e.g., solar water heating systems, solar photovoltaic lights, wind turbines, small hydro power stations, etc.,). The individual rural households, which set up biogas plants, can not avail those incentives as in general they are not paying income tax and import of equipment/material might not be involved. (b) A holistic view of ‘biogas’ should be taken in working out cost estimates so as to include cow-shed, wheel barrow, manure pits, etc., as needed by households for drawing optimum benefits from plants. (c) A flat rate of subsidy to a level to bring down the payback period of investment in small size plants to less than 3 years might be justified keeping in view the affordability by majority of potential biogas users.
(ii) Bank loans on liberal terms
(a) Most of the developing countries might need assistance for formulating specific lending scheme on liberal terms suited to biogas plants as was developed by banks way back in 1976 in India, which triggered fast growth of biogas plants. While the biogas plant construction companies could extend help in determining technical feasibility of plants, the banks should examine the financing viability of the proposal and repaying capacity of borrowers (b) Micro-finance institutions could develop a scheme of collateral-free but group-secured loan, repayable on a monthly or quarterly basis in a short period, say 3 years.

19
(iii) Developing projects for carbon rebate
(a) Preparation of PDD for small projects for biogas plants are costly and time consuming. Consultants for providing assistance in formulating CDM projects and arranging funds for up front investment from developed countries are mushrooming. It is feared that a major portion of carbon rebate will be ushered in by these consulting organisations. Developing countries would need assistance in appraising consultants and developing a transparent procedure to ensure a part of the carbon rebate is shared with plant owners, at least in proportion to the investment made by them. (b) The present methodology for monitoring thermal use of biogas is cumbersome. Efforts should be made to devise a simple methodology for consideration and acceptance of UNFCC.
(iv) More international financial support
(a) Most of the developing countries would need international financial support in the form of both grant and soft loans for biogas plants. (b) SNV Netherlands Development Organisation is an important agency which is providing not only financial support but also arranging technical, training and extension assistance for an effective designing and executing of biogas programmes under ‘Asia Biogas Programme’. It very successfully implemented for many years the Biogas Support Programme in Nepal, which received international recognitions and awards, including the prestigious Ashden Award in 2005. SNV should continue, rather increase, its support for biogas in Asian countries.
(v) Minimizing capital cost of plants
(a) In an open market economy, prices and availability of building materials would fluctuate. On the other hand, quality of materials could not be sacrificed. However, proper management of inventory of materials and constructing more number of plants simultaneously in one village/locality ensure optimal use of the resources. Therefore, construction companies should encourage group proposals for building 3 or more plants at a time in a village and pass on the benefit of lower capital cost of plants to the farmers. (b) In countries, where building materials and biogas appliances are imported, the respective Governments should encourage biogas plants by waiving off import duties and other taxes, if levied to keep the cost of plants as minimum as feasible.

20
9. References
Anonymous. 1976. Report of the Inter-Institutional Group on Financing Gobar Gas Plants by Banks. Reserve Bank of India, Mumbai.pp.1-152. Anonymous. 2002. Evaluation study on National Project on Biogas Development. Programme Evaluation Organisation, Planning Commission, Government of India, New Delhi. Anonymous. 2007a. Annual Report 2006-07. Ministry of New and Renewable Energy, Government of India, New Delhi. Anonymous. 2007b.Biogas Manual. Indian Institute of Technology, Guwahati, Assam. Bhatt BK. 2008. Personal Communication. Director (Biogas), Ministry of New and Renewable Energy, Government of India, New Delhi. Dhale. 2008. Dhale Biogas Engineers. 12 Chawala Chawl, Irani Wadi Road, Kandivali (West), Mumbai. Khandelwal KC and Mahdi SS.1986. Biogas Technology A Practical Handbook. Tata Mc Graw-Hill publishing Company Limited, New Delhi. Pp.1-128. MNRE. 2008. Implementation of National Biogas and Manure Management Programme –Sanction order. Letter No.5-5/2008-BG dated 29 July, 2008. NABARD. 1984. Refinance facilities from NABARD for installation of biogas plants –Extension of automatic refinance –uniform rate of interest. Circular No. NB. PDD. NFS. 330/MS (37)/84-85, dated 9 October, 1984. RBI. 2007. Master Circular on priority Sector Lending – Primary (Urban) Cooperative Banks, dated 4 July, 2007 (www.rbi.org.in, downloaded on 25 October, 2008). Singh JB, Myles Raymond and Dhuss Anil. 1987. Manual on Deenbandhu Biogas Plant. Tata Mc Graw-Hill publishing Company Limited, New Delhi. Pp.1- 49. Thomas KJ.1999. Ferrocement Biogas Plant –A construction manual for the Deenbandhu in situ model. Sustainable Development Agency, MDS Training Centre, Kanjirapally, Kottayam, Kerala. Pp.1-50. UCO Bank. 2008. Personal Communication. Zonal Office, Ajmer, Rajasthan. UNFCC. 2008. The United Nations Framework for Climate Change website: www.unfcc.int, downloaded on 25 September, 2008.

21
Annexure-I
Annexure-I. Materials and labour (for digester) required for floating drum plants
(30 days retention period)
Plant size (m3) 1 2 3 4 6
I. Construction Bricks (no.) - 2060 2270 2510 2900 Sand (m3) - 1.71 2.2 2.41 2.85 one chips (m3) - 0.6 0.85 0.95 1.25 Cement (bags) - 11 15 16 19 A.C.Pipe (100mm dia.) (m) - 3.4 3.6 4.9 5.25
II. Guide frame Angle iron (5mm) (m) 10.25 10.9 11.9 12.7 14.3 MS Pipe (40/65/80 mm dia) (m) 1.3 1.85 1.85 1.85 2.15 Square plate (no.) 2 2 2 2 2 Bolts and nuts (no.) 16 16 16 16 16
III. Gas holder Angle iron (5 mm) (m) 12.8 16.8 19.4 21 30.6 MS Pipe 50/80/100 mm dia (m) 0.6 1.15 1.15 1.25 1.25 Flange plate(no.) 2 2 2 2 2 Flats (m) 1.1 4.2 4.2 4.3 3.5 Gas outlet pipe (no.) 1 1 1 1 1 GI bend (no.) 1 1 1 1 1 Gas valve (no.) 1 1 1 1 1 MS Sheet 2.00mm/2.50mm(no.) 1 2.25 3 3.25 4.25
IV. Labour Digging (man days) 6 8 10 12 20 Mason (man days) 6 8 10 12 16 Construction (man days) 12 16 20 24 32

22
Annexure - II
Annexure-II. Materials and labour (for digester) required for floating drum plants
(40 days retention period)
Plant size (m3) 1 2 3 4 6
I. Construction Bricks (no.) - 2460 2770 3210 3730 Sand (m3) - 1.97 2.52 2.9 3.46 Stone chips (m3) - 0.6 0.85 0.95 1.25 Cement (bags) - 13 17 19 23 A.C .Pipe (100mm dia.) (m) - 3.8 3.6 6.3 6.5
II. Guide frame Angle iron (5mm) (m) 10.25 10.9 11.9 12.7 14.3 MS Pipe (40/65/80 mm dia) (m) 1.3 1.85 1.85 1.85 2.15 Square plate (no.) 2 2 2 2 2 Bolts and nuts (no.) 16 16 16 16 16
III. Gas holder Angle iron (5 mm) (m) 12.8 16.8 19.4 21 30.6 MS Pipe 50/80/100 mm dia (m) 0.6 1.15 1.15 1.25 1.25 Flange plate(no.) 2 2 2 2 2 Flats (m) 1.1 4.2 4.2 4.3 3.5 Gas outlet pipe (no.) 1 1 1 1 1 GI bend (no.) 1 1 1 1 1 Gas valve (no.) 1 1 1 1 1
IV. Labour Digging (man days) 6 8 10 12 20 Mason (man days) 6 8 10 12 16 Construction (man days) 12 16 20 24 32

23
Annexure-III
Annexure-III. Materials and labour (for digester) required for floating drum plants
(55 days retention period)
Plant size (m3) 1 2 3 4 6
I. Construction Bricks (no.) 1550 4350 5100 Sand (m3) 1.4 3.6 4.3 Stone chips (m3) 0.5 0.95 1.25 Cement (bags) 9 23 28 A.C. Pipe (100mm dia.) (m) 3.7 9.5 10
II. Guide frame Angle iron (5mm) (m) 10.25 10.9 11.9 12.7 14.3 MS Pipe (40/65/80 mm dia) (m) 1.3 1.85 1.85 1.85 2.15 Square plate (no.) 2 2 2 2 2 Bolts and nuts (no.) 16 16 16 16 16
III. Gas holder Angle iron (5 mm) (m) 12.8 16.8 19.4 21 30.6 MS Pipe 50/80/100 mm dia (m) 0.6 1.15 1.15 1.25 1.25 Flange plate(no.) 2 2 2 2 2 Flats (m) 1.1 4.2 4.2 4.3 3.5 Gas outlet pipe (no.) 1 1 1 1 1 GI bend (no.) 1 1 1 1 1 Gas valve (no.) 1 1 1 1 1
IV. Labour Digging (man days) 6 8 10 12 14 Mason (man days) 6 8 10 12 14 Construction (man days) 12 16 20 24 28

24
Annexure-IV
Annexure-IV. Materials and labour required for fixed dome Deenbandhu Model
(40 days retention period)
Plant size (m3) 1 2 3 4 6
I. Materials Bricks (no.) 700 1000 1300 1600 2200 Cement (no. of bags) 8 14 16 22 28 Stone chips (m3) 1 1.2 1.6 2 2.5 Sand (m3) 1 1.2 1.4 2 2.5 Coarse sand 1 1.4 1.7 1.8 2.8 GI Pipe (cm) 20 20 20 20 20 AC Pipe (m) 1.83 1.83 1.83 2.44 2.44 Iron bars (kg) 7 7 10 12 15 Paint (l) 1 1 1.5 2 3
II. Labour Digging (man days) 8 10 14 18 24 Mason (man days) 8 11 13 16 22 Construction (man days) 16 22 26 30 44

25
Annexure-V
Annexure-V. Materials and labour required for fixed dome Deenbandhu Model
(55 days retention period)
Plant size (m3) 1 2 3 4 6
I. Material Bricks (no.) 800 1100 1500 1900 2500 Cement (no. of bags) 9 15 19 25 33 Stone chips (m3) 1 1.27 1.55 1.98 2.54 Sand (m3) 1 1.13 1.41 1.83 2.54 Coarse sand 1 1.41 1.7 1.84 2.83 GI Pipe (cm) 20 20 20 20 20 AC Pipe (m) 1.83 1.83 2.44 2.74 2.74 Iron bars (kg) 5 7 10 12 15 Paint (l) 1 1.5 1.5 2.5 3
II. Labour Digging (man days) 8 10 15 18 25 Mason (man days) 8 12 14 18 25 Construction (man days) 16 24 28 34 50

26
Annexure-VI
Annexure-VI. Materials and cost estimates of fixed dome Deenbandhu ferro-cement plant
for in situ construction
LS- Lump sum; cut- cubic feet Note: Labour cost of initial filling of dung slurry deleted.
Quantity and cost for plant of different sizes
1 m3 2 m3 3 m3 4 m3
Item
Rate
in Rs. Quantity Cost in Rs. Quantity
Cost in Rs. Quantity
Cost in Rs. Quantity
Cost in Rs.
Pit digging LS 1600 2100 3100 4250
Sand LS 2750 60cft 3500 80 cuft 4000 120 cuft 6000
Cement 280 10 bags 2800 12 bags 3360 16 bags 4200 20 bags 5600
4" AC Pipe 75 1.20m 100 1.50 m 150 1.80 m 200
Chicken mesh 700 1.5 rolls 1050 2 rolls 1400 3 rolls 2100 4 rolls 2800
Weld mesh piece for inlet LS 120 120 120 120
6mm Iron rods 45 10 kg 450 12 kg 540 16 kg 720 35 kg 1575
Binding wire LS 0.5 kg 35 0.5 kg 35 0.75 kg 50 1 kg 70
3/4" Stone chips 20 15cft 300 20cft 400 40cft 800 50cft 1000
4mm Iron rods 63 10 kg 630 12kg 780 16kg 1008 20kg 1260
Skilled labour LS 1800 2250 2750 3500
Unskilled Labour LS 1500 2500 3200 4100
Plumbing Charge LS 300 300 300 400
Dome Pipe LS 50 50 50 100
Biogas Stove LS 1 no. 1000 1no. 1000 1no. 1000 1 no. 1000
Plumbing fittings LS 400 400 400 600
HDP Pipe 10 25m 250 25m 250 25m 250 25m 400
Initial feed filling labour cost LS 1000 1500 2000 2750
Transport LS 1000 1000 1000 1500
Miscellaneous LS 250 250 250 500
Total cost 17,285 21,835 27,448 37,725

27
Annexure-VII
Annexure VII. Highlights of Bagepalli CDM Biogas Programme implemented under CDM
Particular Description
Title Bagepalli CDM Biogas Programme
Host organisation/Authorised organisation Women For Sustainable Development (Ms. Anandi Sharan Meili) 32/2 Kempapura Road, Hebbal, Bangalru, Karnataka State, India
and Agricultural Development and Training Society, Bagepalli -561207, Kolar District, Karnataka State, India
Project brief 5500 biogas plants of 2 m3 capacity in rural
households for replacing biomass (firewood) and kerosene for cooking purpose
Project area Narsamma and Chingenapalli in Taluk Gudibanda, District Kolar
Methodology Type I. Renewable energy Projects Category I.C. Thermal energy for the users
Other party Velcan Energy, France and Switzerland
Date of Registration 11 December, 2005
Total estimated reductions of tonnes of CO2 e
136,874
Total number of crediting years
7
Annual average over the crediting period of estimated reduction of tonnes of CO2 e
19553
Date of issuing of CER
18 January, 2008
Crediting period
1 September, 2006 to 31 August, 2013
Monitoring Report
1 September, 2006 to 31t, 2007
Issuance requested state
Issued; CERs requested 11761
28
Annexure - VIII
Annexure VIII. Highlights of Vedaranniyam Biogas Project for funding under CDM
Particular Description
Title Vedaranniyam Biogas Project
Host organisation CER India Private Limited (Ms. Anandi Sharan Meili) 32/2 Kempapura Road, Hebbal, Bangalru, Karnataka 560024
Other organisation
Det Norske Veritas (DNV) Certificates
Project area District Nagapattinam, Tamil Nadu
Project brief
12, 000 biogas plants of 2 m3 capacity for replacing kerosene for cooking and water heating purpose
Methodology AMS. I.C Version 9 EB 28 December 26, 2006
Total estimated reductions of tonnes of CO2 e
342500
Total number of crediting years
10
Annual average over the crediting period of estimated reduction of tonnes of CO2 e
34250
Insert date 12 January, 2007
Period of comment 13 January -17 February, 2007

29
Annexure IX
Annexure IX. Highlights of Hassan Biogas Project for funding under CDM
Particular Description
Title Hassan Biogas Project, version 1, 12 September, 2008
Host organisation SKS Sangha (Vidya Sagar Devabhattuni) 2nd Main Road, Gandhi Nagar, 532, Kolar, Karnataka State, 5631011
Other organisation CarbonAided Limited, United Kingdom of Great Britain, Grosvenor Gardens House, 35-37 Grovenor Garden Britain SW1WOGS, London and North Ireland
Project brief 10,000 family size biogas plants of 2 m3 and 3 m3
capacity for replacing kerosene and biomass
Project area Hassan and Channarayapetna Taluka, district Hassan, Karnataka
Methodology A 4.2. Type and Category I.C. thermal energy for the user with or without electricity I.E Switch from non-renewable biomass for thermal application by the users III.R. Methane recovery in agricultural activities at household/small farm level
Total estimated reductions of tonnes of CO2 e
547224
Total number of crediting years
10
Annual average over the crediting period of estimated reduction of tonnes of CO2 e
54722
30
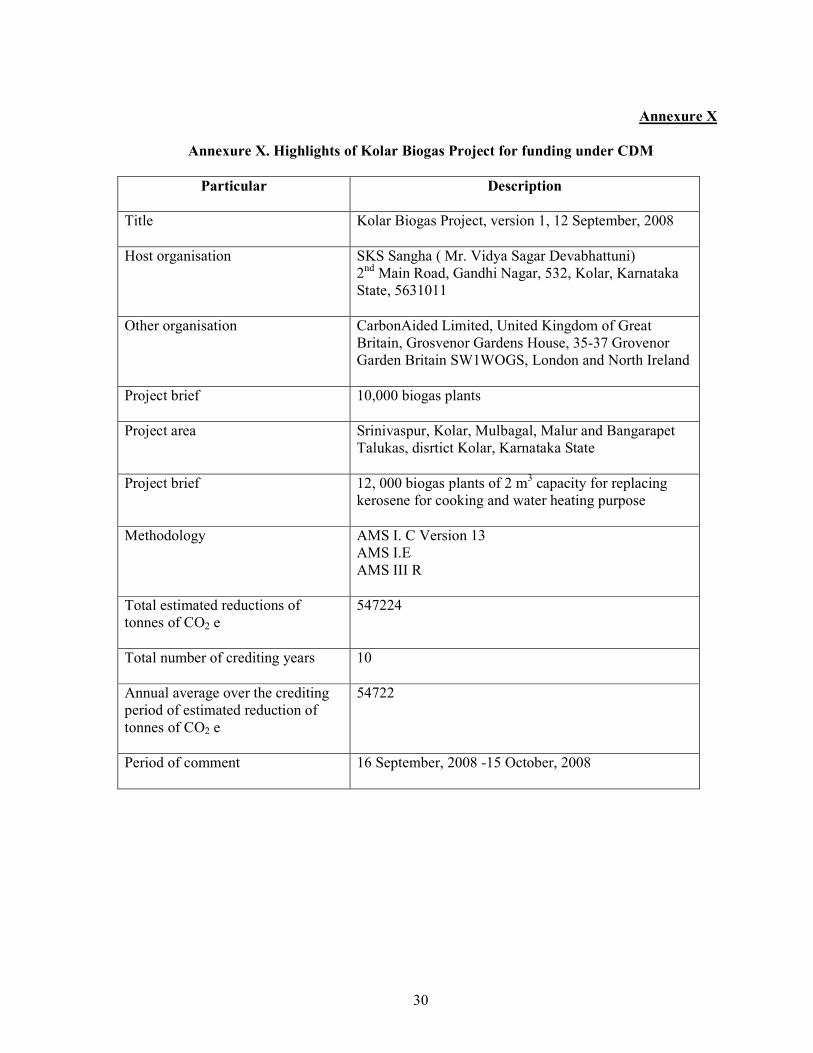
Annexure X
Annexure X. Highlights of Kolar Biogas Project for funding under CDM
Particular Description
Title Kolar Biogas Project, version 1, 12 September, 2008
Host organisation SKS Sangha ( Mr. Vidya Sagar Devabhattuni) 2nd Main Road, Gandhi Nagar, 532, Kolar, Karnataka State, 5631011
Other organisation CarbonAided Limited, United Kingdom of Great Britain, Grosvenor Gardens House, 35-37 Grovenor Garden Britain SW1WOGS, London and North Ireland
Project brief 10,000 biogas plants
Project area Srinivaspur, Kolar, Mulbagal, Malur and Bangarapet Talukas, disrtict Kolar, Karnataka State
Project brief
12, 000 biogas plants of 2 m3 capacity for replacing
kerosene for cooking and water heating purpose
Methodology AMS I. C Version 13 AMS I.E AMS III R
Total estimated reductions of tonnes of CO2 e
547224
Total number of crediting years
10
Annual average over the crediting period of estimated reduction of tonnes of CO2 e
54722
Period of comment 16 September, 2008 -15 October, 2008

31
Annexure-XI
Annexure XI. Financial analysis of Deenbandhu model (40 days retention period)
Item Plant size
1 m3 2 m3 3 m3 4 m3
1. Capital investment 12000 16000 20000 24000
2. Annual maintenance cost (2% of capital cost) (Rs.) 240 320 400 480
3. Quantity of wet dung input (kg/day) 25 50 75 100
4. Quantity of wet dung input (kg/year) 9125 18250 27375 36500
5. Quantity of air-dried dung (kg/year) 2190 4380 6570 8760
6. Unit price of dung cakes (Rs./kg) 0.7 0.7 0.7 0.7
7. Annual cost of dung input (Rs.) 1533 3066 4599 6132
8. Total Annual Cost (2+7). 1773 3386 4999 6612
10. Fuels saving
11. Quantity of purchased firewood saved (kg/year) 700 900 1100 1200
12. Unit price of firewood (Rs./kg) 1.5 1.5 1.5 1.5
13. Annual saving of firewood (Rs./year) 1050 1350 1650 1800
14. Saving of LPG cylinders (no./year) 4 6 8 10
15. Unit price of cylinder v(Rs./cylinder) 300 300 300 300
16. Annual saving of LPG cylinders(Rs.) 1200 1800 2400 3000
17. Total Annual Fuels Saving (Rs.) 2250 3150 4050 4800
18. Quantity of manure produced (t/year) 3.421875 6.84375 10.26563 13.6875
20. Price of bio-manure (@Rs.1000/t) 3421.875 6843.75 10265.63 13687.5
21. Total Annual Savings (Rs.) 5671.875 9993.75 14315.63 18487.5
22. Net Annual Benefit (Rs.) 3898.875 6607.75 9316.625 11875.5
23. Amount of subsidy (Rs.) 2100 2700 2700 2700
24. Loan amount (Rs.) 9900 13300 17300 21300
26. Rate of interest (%) 12 12 12 12
27. Life span of plant (years) 20 20 20 20
28. Payback period without subsidy 4.067674 3.029158 2.628395 2.450862
29. Payback period with subsidy 3.206748 2.439436 2.22444 2.138633
30. NPV at 15% rate of discount (without subsidy) 12404.35 25360.1 38315.84 50332.69
31. NPV at 15% rate of discount (with subsidy) 14504.35 28060.1 41015.84 53032.69
32. NPV at 20% rate of discount (without subsidy) 6985.883 16176.97 25368.05 33828.69
33. NPV at 20% rate of discount (with subsidy) 9085.883 18876.97 28068.05 36528.69
34. NPV at 25% rate of discount (without subsidy) 3415.696 10126.27 16836.85 22954.34
35. NPV at 25% rate of discount (subsidy) 5515.696 12826.27 19536.85 25654.34
36. NPV at 30%rate of discount (without subsidy) 927.8665 5909.938 10892.01 15376.71
37. NPV at 30 % rate of discount (with subsidy) 3027.867 8609.938 13592.01 18076.71
38. NPV at 35 % rate of discount (without subsidy) -887.912 2832.586
39. NPV at 35 % rate of discount (with subsidy) 1212.088
40. NPV at 40 % rate of discount (without subsidy) 499.6311
41. NPV at 40 % rate of discount (with subsidy). -164.462
42. NPV at 45 % rate of discount (without subsidy) -1324.81 691.3456 2374.366
43. NPV at 45 % rate of discount (with subsidy) 1375.19 5074.366
44. NPV at 50 % rate of discount (without subsidy) -1372.35 -256.143
45. NPV at 50 % rate of discount (with subsidy) -88.4743 1327.646 2443.857
45. NPV at 60% rate of discount (with subsidy) 1375.19 -1773.58 -1509.14
46. IRR (without subsidy) 0.32555 0.413693 0.46675 0.495131
47. IRR (with subsidy) 0.394026 0.496978 0.54281 0.661937

32
Annexure-XII
Annexure XII. Financial analysis of Deenbandhu model (55 days retention period) Item Plant size
1 m3 2 m3 3 m3 4 m3
1. Capital investment 16000 21000 26000 31000
2. Annual maintenance cost (2% of capital cost) (Rs.) 320 420 520 620
3. Quantity of wet dung input (kg/day) 25 50 75 100
4. Quantity of wet dung input (kg/year) 9125 18250 27375 36500
5. Quantity of air-dried dung (kg/year) 2190 4380 6570 8760
6. Unit price of dung cakes (Rs./kg) 0.7 0.7 0.7 0.7
7. Annual cost of dung input (Rs.) 1533 3066 4599 6132
8. Total Annual Cost (2+7). 1853 3486 5119 6752
10. Fuels saving
11. Quantity of purchased firewood saved (kg/year) 700 900 1100 1200
12. Unit price of firewood (Rs./kg) 1.5 1.5 1.5 1.5
13. Annual saving of firewood (Rs./year) 1050 1350 1650 1800
14. Saving of LPG cylinders (no./year) 4 6 8 10
15. Unit price of cylinder v(Rs./cylinder) 300 300 300 300
16. Annual saving of LPG cylinders(Rs.) 1200 1800 2400 3000
17. Total Annual Fuels Saving (Rs.) 2250 3150 4050 4800
18. Quantity of manure produced (t/year) 3.421875 6.84375 10.26563 13.6875
20. Price of bio-manure (@Rs.1000/t) 3421.875 6843.75 10265.63 13687.5
21. Total Annual Savings (Rs.) 5671.875 9993.75 14315.63 18487.5
22. Net Annual Benefit (Rs.) 3818.875 6507.75 9196.625 11735.5
23. Amount of subsidy (Rs.) 3500 4500 4500 4500
24. Loan amount (Rs.) 12500 16500 21500 26500
26. Rate of interest (%) 12 12 12 12
27. Life span of plant (years) 20 20 20 20
37. Payback period without subsidy 6.165202 4.321647 3.656507 3.364032
27. Payback period with subsidy 4.402007 3.201031 2.905276 2.788739
28. NPV at 20% rate of discount (without subsidy) 2596.316 10690.01 18783.7 26146.95
29. NPV at 20% rate of discount (subsidy) 6096.316 15190.01 23283.7 30646.95
30. NPV at 25 % rate of discount (without subsidy) -900.615 4730.883 10362.38 15400.8
31. NPV at 25% rate of discount (subsidy) 2599.385 9230.883 14862.38 19900.8
32. NPV at 30% rate of discount (without subsidy) -3337.4 578.3588 4494.115 7912.501
33. NPV at 30% rate of discount (with subsidy) 162.603 5078.359 8994.115 12412.5
34. NPV at 40% rate of discount (without subsidy) -6464.22 -4750.07 -3035.92 -1696.32
35. NPV at 40 % rate of discount (with subsidy) -2964.22 -250.07 1464.083 2803.684
36. NPV at 45 % rate of discount (with subsidy) -1075.16 -436.561
37. IRR (without subsidy) 0.237123 0.310854 0.359683 0.382346
38. IRR (with subsidy) 0.3052 0.395307 0.428829 0.443263