Embed Size (px)
Citation preview

‐ MASTERS DISSERTATION ‐
POTENTIAL FOR DOMESTIC BIOGAS AS HOUSEHOLD ENERGY SUPPLY IN SOUTH AFRICA
By
Sunset Siphamandla Msibi 12194922
Submitted in partial fulfilment of the requirements for the degree MSc (Applied Science): Environmental Technology
in the
FACULTY OF ENGINEERING, BUILT ENVIRONMENTAL AND INFORMATION TECHNOLOGY
at the
UNIVERSITY OF PRETORIA
Study leader: Dr. G Kornelius
Date of submission 30 October 2015
© University of Pretoria

UNIVERSITY OF PRETORIA
FACULTY OF ENGINEERING, BUILT ENVIRONMENT AND IFORMATION TECHNOLOGY
DEPARTMENT OF CHEMICAL ENGINEERING
I (full names) : Sunset Siphamandla Msibi
Student number : 12194922
Topic of work : Potential for domestic biogas as household energy supply in South
Africa.
Declaration
1. I understand what plagiarism is and am aware of the University’s policy in this regard.
2. I declare that the material handed in this dissertation is my own original work. Where
other people’s work has been used (either from a printed source, internet or any
other source), this has been properly acknowledged and referenced in accordance
with departmental requirements.
3. I have not used another student’s past written work to hand in as my own.
4. I have not allowed, and will not allow, anyone to copy my work with the intention of
passing it off as his or her own work.
Signature __________________________________
© University of Pretoria

ACKNOWLEDGEMENTS
I wish to express my appreciation to the following organisations and persons who have made
this project dissertation possible:
a. The Nova Institute for the expert knowledge and technical support during the course of
the study.
b. Dr. G. Kornelius, my supervisor, and Dr. A. van Niekerk, my co‐supervisor for their
guidance and support.
c. My family and partner for their consistent encouragement and support during the
course of the study.
© University of Pretoria

Potential for domestic biogas as household energy
supply in South Africa
Author: Sunset Siphamandla Msibi
Supervisor: Dr. G Kornelius
Department: Chemical Engineering
Degree: MSc (Applied Science): Environmental Technology
Keywords: Domestic biogas technology, anaerobic digestion, organic waste,
household energy supply, indoor air pollution, South Africa
SYNOPSIS
Domestic biogas technology is a clean, renewable form of energy that is accessible to low‐
income households through anaerobic digestion of readily available organic waste. The
objective of this desktop study was to determine the amount of biogas required for substitution
of conventional domestic fuels (fuelwood, paraffin and coal), to quantify the health benefits
from reduced indoor air pollution due to such a substitution and to evaluate the availability of
feedstock for adoption of domestic biogas technology in South Africa.
The energy demand by low‐income South African households for cooking with fuelwood was
calculated to be 27 MJ/day and the total energy demand to be 68 MJ/day. Approximately 80%
of the total energy is used for cooking, water heating and space heating and approximately 20%
is used for lighting. To meet the energy demand for cooking (27 MJ/day) with fuelwood with a
thermal efficiency of 13%, it was calculated that 2 500 L/day/household of biogas is required
which is in line with studies conducted in India and China. In order to meet the total energy
demand of 68 MJ/day by low‐income South African households, it was calculated that biogas of
© University of Pretoria
approximately 6 250 L/day/household is required of which 5 000 L/day/household is used for
cooking, water heating and space heating and also 1 250 L/day/household for lighting. A
photovoltaic (PV) solar home system is recommended for lighting in rural households instead of
using the inefficient biogas lamps which often pose a safety risk to the household members.
Complete substitution of fuelwood used for cooking with 2 500 L of biogas per day results in
cost savings of R904 per household per annum which is 4.3% savings of the average household
income and translates to a gross national annual cost savings of approximately R 1.5 billion.
Complete substitution of fuelwood as a source of energy results in cost savings of R1 808 per
household per annum which is 8.6% of the household income and translates to a gross national
annual cost savings of R4 ‐ 5 billion.
In terms of burden of disease and mortalities, it was determined that fuelwood use in South
African households results in 702 790 and 22 365 attributable disability‐adjusted life years
(DALYs) lost and mortalities respectively. It was also determined that 50% of the attributable
DALYs lost and mortalities from solid fuel use can be avoided by substitution of fuelwood used
for cooking with 2 500 L of biogas per day per household whereas complete substitution of
fuelwood with biogas can result in the avoidance of approximately 85.4% of total DALYs lost
and mortalities from solid fuel use.
It terms of feedstock availability, it was determined that there is potential for domestic biogas
technology utilising cattle and pigs waste as feedstock. Due to access to sufficient cattle dung, it
was determined that approximately 613 662 households can potentially benefit from 2 500
L/day capacity biogas digester installations fed with cattle dung. Approximately 131 392
households can potentially benefit from 5 000 or 6 250 L/day capacity biogas digester
installations fed with cattle dung. The number of households that have access to sufficient pigs
waste to benefit from installations of 2 500 or 5 000 or 6 250 L/day capacity biogas digesters
fed with pig waste are 12 089. Due to the number of chickens required and the average number
of chickens kept by South African households, it can be deduced that it is not feasible to
operate a biogas digester fed solely with chicken waste. It was also determined that South
African households do not generate sufficient human excreta and food waste to feed a biogas
© University of Pretoria

digester of a sufficiently large size. It is therefore recommended that community digesters in
peri‐urban areas/informal settlements be co‐fed with 1:1 mixture of sewage and food waste. It
is also recommended that the households interchangeably utilize the biogas from the
community digester for cooking purposes.
Non‐sewered households with access to on‐site water supply generate sufficient greywater for
feeding a domestic biogas digester. This is therefore recommended over drinking water. Non‐
sewered households with access to off‐site water supply generate insufficient greywater for
feeding biogas digesters of 5 000 L/day and 6 250 L/day capacity. It is therefore recommended
that in non‐sewered households with access to off‐site water supply greywater be augmented
with harvested storm water or water from nearby rivers, dams and streams.
Since the present work is a desktop study, it is recommended that a pilot scale study be
launched to confirm the findings of this study regarding the quantity of biogas required to
substitute conventional domestic fuels as well as the feasibility of domestic biogas technology
in low‐income South African households or at community level.
© University of Pretoria
Table of contents
Abbreviations ................................................................................................................................... i
Nomenclature List ........................................................................................................................... iii
CHAPTER 1: Introduction .............................................................................................................. 1
1.1. Energy Crisis in Africa ....................................................................................................... 1
1.2. Energy Utilization in South African Households .............................................................. 1
1.3. Biogas as renewable energy source ................................................................................. 2
1.4. Problem Statement .......................................................................................................... 3
1.5. Research objectives and scope ........................................................................................ 4
1.6. Methods ........................................................................................................................... 5
1.7. Report Outline .................................................................................................................. 5
CHAPTER 2: Literature Review ...................................................................................................... 6
2.1. Introduction ...................................................................................................................... 6
2.2. Energy demand in low income South African households .............................................. 6
2.2.1. Energy Efficiencies of domestic fuels ....................................................................................... 7
2.2.2. Economic value of fuelwood ................................................................................................... 10
2.2.3. Burden of disease attributed to indoor smoke from fuelwood use .................................. 10
2.3. What is biogas? .............................................................................................................. 12
2.3.1. Biochemical processes involved in biogas production ........................................................ 13
2.3.2. Biogas digester technology ...................................................................................................... 16
2.3.3. Kinetics of anaerobic digestion ............................................................................................... 21
2.3.4. Characteristics of feedstocks ................................................................................................... 23
2.3.5. Factors affecting biogas digester operation .......................................................................... 31
© University of Pretoria

2.4. Biogas as a renewable energy source in the developing world ..................................... 35
2.4.1. Domestic biogas technology status in Asia ........................................................................... 35
2.4.2. Domestic biogas technology status in South America ......................................................... 37
2.4.3. Domestic biogas technology status in Africa ........................................................................ 37
2.4.4. Domestic biogas technology status in South Africa ............................................................. 39
2.4.5. Challenges for the dissemination of domestic biogas technology .................................... 39
2.5. Benefits of biogas technology ........................................................................................ 45
2.5.1. Health benefits .......................................................................................................................... 45
2.5.2. Biogas slurry as an organic fertilizer ....................................................................................... 46
2.5.3. Economic benefits..................................................................................................................... 48
2.5.4. Social development .................................................................................................................. 48
2.5.5. Greenhouse gas emissions reduction .................................................................................... 49
2.5.6. Reduced deforestation ............................................................................................................. 50
2.6. Renewable Energy Policy in South Africa: the biogas technology context .................... 51
2.7. Conclusion ...................................................................................................................... 52
CHAPTER 3: Methodology ........................................................................................................... 53
3.1. Research design .............................................................................................................. 54
3.1.1. Energy demand by low‐income households ......................................................................... 54
3.1.2. Biogas requirements for substitution of fuelwood used for cooking ................................ 54
3.1.3. Biogas requirements for complete substitution of conventional domestic fuels ........... 54
3.1.4. Energy and costs savings .......................................................................................................... 55
3.1.5. Reduction in burden of diseases ............................................................................................. 55
3.1.6. Feedstock availability for feeding a domestic biogas digester ........................................... 55
3.1.7. Number of households that can potential benefit from digester installations ............... 56
© University of Pretoria

3.1.8. Water demand and availability for feeding a domestic biogas digester ........................... 57
3.2. Data collection................................................................................................................ 57
3.3. Data analysis ................................................................................................................... 58
CHAPTER 4: Results and Discussion ............................................................................................ 59
4.1. Energy demand by low‐income households .................................................................. 59
4.2. Biogas requirements for substitution of firewood used for cooking ............................. 59
4.3. Biogas requirements for substitution of conventional domestic fuels.......................... 60
4.4. Energy savings from biogas substitution of conventional domestic fuels ..................... 61
4.5. Cost savings from biogas substitution of conventional domestic fuels ......................... 61
4.6. Reduction in burden of diseases .................................................................................... 62
4.7. Availability of feedstocks ................................................................................................ 64
4.6.1. Animal and human waste ........................................................................................................ 64
4.6.2. Kitchen/Food waste .................................................................................................................. 66
4.6.3. Co‐digestion ............................................................................................................................... 67
4.6.4. Water Availability ...................................................................................................................... 68
4.6.5. Biogas digester capacity ........................................................................................................... 71
CHAPTER 5: Conclusions ............................................................................................................. 72
CHAPTER 6: Recommendations .................................................................................................. 74
References .................................................................................................................................... 76
Appendix A .................................................................................................................................... 85
A.1. Sample Calculations ....................................................................................................... 85
A.1.1. Energy requirements from fuelwood by an average sized family ..................................... 85
A.1.2. Biogas required to substitute fuelwood as an energy source ............................................ 85
A.1.3. Complete energy substitution of conventional domestic fuels ......................................... 85
© University of Pretoria

A.1.4. Burden of disease attributed to indoor smoke from solid fuels ........................................ 86
A.1.5. Availability of feedstocks ......................................................................................................... 87
A.1.6. Prediction of digester volume ................................................................................................. 90
A.2. Case Study: Biogas socket: for local power supply ........................................................ 92
List of Figures
Figure 2‐1: The three‐stage anaerobic fermentation of biomass ................................................ 13
Figure 2‐2: Schematic diagram of a Chinese fixed dome digester ............................................... 18
Figure 2‐3: Schematic diagram of an Indian floating drum digester ............................................ 19
Figure 2‐4: Schematic diagram of a Taiwanese plastic tubular digester ...................................... 20
Figure 4‐1: Quantification of feedstocks ...................................................................................... 64
Figure 4‐2: The number of animals and people required ............................................................. 65
Figure 4‐3: Co‐digestion of a 1:1 mixture of cattle and human waste ......................................... 68
Figure 4‐4: Water demand per feedstock for non‐sewered households with access to on‐site
water supply ................................................................................................................................. 70
Figure 4‐5: Water demand per feedstock for non‐sewered households with access to off‐site
water supply ................................................................................................................................. 70
Figure A‐0‐1: Excel model for the prediction of digester volume. ............................................... 91
Figure A‐0‐2: Biogas Socket .......................................................................................................... 92
Figure A‐0‐3: Biogas Socket charging mobile set .......................................................................... 93
© University of Pretoria

List of Tables
Table 2‐1: Thermal efficiencies of fuelwood in open fires measured using WBT .......................... 8
Table 2‐2: Calorific values of domestic fuels .................................................................................. 9
Table 2‐3: Chemical composition of biogas and properties of components ................................ 12
Table 2‐4: Requirements of digester volumes .............................................................................. 17
Table 2‐5: Kinetic constants for cattle dung in semi‐continuous digesters.................................. 23
Table 2‐6: Properties of typical feedstock .................................................................................... 24
Table 2‐7: Biogas production from selected feedstock ................................................................ 25
Table 2‐8: Comparison of cum biogas production from cow dung & other co‐digested feed ..... 30
Table 2‐9: Number of biogas plants installed in Asia ................................................................... 36
Table 2‐10: Number of biogas plants installed in selected African countries .............................. 38
Table 2‐11: Nutrient content of important organic manure ........................................................ 47
Table 2‐12: Potential energy from livestock manure and litter ................................................... 51
Table 4‐1: Estimated residential energy consumption by activity. .............................................. 60
Table 4‐2: Attributable DALYs lost and mortalities per cause ...................................................... 62
Table 4‐3: Attributable DALYs and mortalities per cause due to fuelwood use .......................... 63
Table 4‐4 Attributable DALYs and mortalities avoided per cause due to fuelwood substitution 63
Table 4‐5: Number of households involved in livestock production ............................................ 66
Table 4‐6: Quantities of household food waste generated annually in South Africa. ................. 67
Table A‐0‐1: Composition and properties of food waste ............................................................. 89
© University of Pretoria

i
Abbreviations
AD Anaerobic Digestion
BOD Biochemical Oxygen Demand
C: N Carbon to Nitrogen
COD Chemical Oxygen Demand
CPI Consumer Price Index
DM Dry Matter
FBW Free Basic Water
GHG Greenhouse Gas
GWh Giga Watt Hour
GWP Global Warming Potential
HRT Hydraulic Retention Time
IAP Indoor Air Pollution
LPG Liquefied Petroleum Gas
m.a.s.l Meters Above Sea Level
NERSA National Energy Regulator of South Africa
OLR Organic Loading Rate
ppm Parts Per Million
PV Photovoltaic
© University of Pretoria

ii
PVC Polyvinyl Chloride
TS Total Solids
UNEP United Nations Environment Programme
US$ United States Dollar
v/v volume by volume
VS Volatile Solids
WHO World Health Organization
© University of Pretoria

iii
Nomenclature List
C Carbon
C6H12O6 Glucose
CH3(CH2)2COOH Butyric acid
CH3(CH2)COOH Propionic acid
CH3CH2OH Ethanol
CH3COOH Acetic acid
CH4 Methane
CO Carbon Monoxide
CO2 Carbon Dioxide
H Hydrogen
H2 Hydrogen gas
H2O Water
H2S Hydrogen Sulphide
K2O Potassium Oxide
N2 Nitrogen gas
NH3 Ammonia
NOx Oxides of Nitrogen
O Oxygen
O2 Oxygen gas
© University of Pretoria

iv
P2O5 Phosphorus Pentoxide
PM Particulate Matter
PM10 Particulate matter having an aerodynamic diameter less than 10 μm
PM2.5 Particulate matter having an aerodynamic diameter less than 2.5 μm
Q Heat
SO2 Sulphur Dioxide
η Thermal Efficiency
© University of Pretoria

1
CHAPTER 1: Introduction
1.1. Energy Crisis in Africa
Energy plays a vital role in the socio‐economic development of a region. Africa is not only the
poorest continent in the world but it was the only major developing region with negative
growth in income per capita during 1980–2000. Biomass in the form of mainly fuelwood and
charcoal is the dominant energy source used in Sub‐Saharan Africa (SSA), accounting for about
74% of total energy consumption, as compared to 37% in Asia and 25% in Latin America
(Parawira, 2009; Amigun et al, 2012). People living in SSA lack access to clean, affordable,
reliable, safe, and environmentally‐safe energy and rely on solid biomass to meet their basic
needs for cooking (Brown, 2006). This is a major contributor to poverty and a hindrance to
development.
Africa is a net energy exporter, but the majority of its population lacks access to clean energy,
and many African countries rely on imported energy. Half a billion people living in SSA do not
have access to electricity in their homes and rely on solid forms of biomass (fuelwood,
agricultural residues, animal wastes, etc.) to meet basic energy needs for cooking, heating and
lighting. The disadvantages of these traditional fuels are many: (1) they are inefficient energy
carriers and their heat release is difficult to control, (2) they release harmful gases, and (3) their
current rate of extraction is unsustainable (Parawira, 2009; Amigun et al, 2012).
1.2. Energy Utilization in South African Households
South Africa is an industrialised and energy intensive country and the 12th largest emitter of CO2
in the world (UNEP, 2004 as cited in Hemraj, 2010). The country is heavily reliant on coal for the
production of electricity and has a 1.6% share of the world’s carbon emissions (UNEP, 2004 as
cited in Hemraj, 2010). In a South African study on attitudes and perceptions about energy, 85%
of households indicated that they have access to electricity. Fuelwood was the most dominant
solid fuel used in South African households with 10% of households with access to electricity
and 54% of households without access to electricity relying on fuelwood as an energy source
© University of Pretoria

2
for cooking. Apart from cooking, another energy‐intensive thermal application is domestic
space heating. Though in households with access to electricity only 7% still used fuelwood for
space heating, in households without access to electricity 29% used fuelwood. It is important to
note that more than 53% of households without access to electricity do not make use of any
energy source to stay warm, thus rather using blankets and warm clothing. In terms of water
heating, approximately 46% of households without access to electricity used fuelwood
(Department of Energy, 2013). It can be deduced that in South African context, fuelwood is the
major solid fuel of concern for replacement with renewable sources of energy such as biogas.
In terms of lighting, 97% of households with access to electricity use it for lighting and
approximately 1% relying on candles. There are 59% of households without access to electricity
that rely on candles for lighting, with 36% relying on paraffin. Other energy sources such as
photovoltaic (PV) solar systems hardly feature and account for less than 2% (Department of
Energy, 2013). The marginal use of PV solar systems can be attributed to the Government’s off‐
grid electricity supply initiative in 1999 to install solar home systems (SHS) to 300 000 rural
households. By 2004, it was estimated that only 20 000 – 30 000 SHSs had been installed
instead of the 300 000 originally envisaged (Prasad, 2007).
South African proportion of households that rely on coal as the main source of energy for
cooking and space heating has diminished from 3% to 0.8% and 5% to 1.8% respectively from
2002 to 2012. Mpumalanga province remains the main user of coal with 5.7% and 10.5% of
households still relying on coal for cooking and space heating respectively (Statistics South
Africa, 2013b). The use of coal is more prevalent in urban areas and peri‐urban/informal
settlements of Mpumalanga province (without access to electricity) which do not keep livestock
therefore substitution of coal with biogas is less important in the context of this study.
1.3. Biogas as renewable energy source
Biogas is a renewable form of energy which is currently employed in the developing world
especially Asia to combat the environmental and health effect of fossil fuel combustion. Biogas
is a low cost technology which is used to meet the energy demands of low income households.
Poverty‐struck Asian, South American and African countries can make use of this form of energy
© University of Pretoria

3
to reduce domestic consumption of fossil fuels which have both environmental and health
effects.
Research on domestic biogas technology has been conducted in Asian countries especially
China and India, both of which have seen growth in the installation of domestic biogas digesters
in these countries. In 2007 it was reported that around 4 and 27 million biogas digesters had
been installed in India and China respectively (Bond & Templeton, 2011). Such growth has been
influenced by extensive research in these countries thus encouraging governmental and private
sector participation through subsidies and credit offerings.
Unlike other renewable energy production systems such as biodiesel and bioethanol
technologies, biogas production derived from agricultural residues, industrial and municipal
wastewater does not compete with food production systems (Parawira, 2009), therefore
making such technology suitable for the developing world especially Africa which is faced with
food shortages. The use of energy crops (i.e. maize, wheat and oats grain) for the production of
biogas as practiced in developed countries such Germany, United States and New Zealand can
compete with food production systems (Heiermann et al, 2009). In developing countries, there
is a serious shortage of food therefore food production is much more important and should
take precedence over the production of energy crops for biofuels (Parawira, 2009).
Biogas is produced through anaerobic digestion of organic waste therefore making the
technology ideal for African countries that have poor waste handling systems and sanitation
facilities. South Africa is one of the African countries that has seen poor growth in terms of
domestic biogas digester installations hence the inception of this study.
1.4. Problem Statement
The problems arising from non‐sustainable use of fossil fuels and traditional biomass fuels have
led to increased awareness and widespread research on the accessibility of new and renewable
energy resources, such as biogas, biofuels, and biodiesel. Past research on biogas technology in
Africa has focused more on the prospects, constraints and how biogas technology has failed in
Africa. Hennekens (2012) conducted a study which was aimed at gaining a sociological
© University of Pretoria

4
understanding of the potentials of biogas practices to address the problem of domestic energy
in low income households, in both rural and peri‐urban areas in South Africa. The study
identified the various stakeholders in the biogas sector, extensively explored the potentials and
barriers of biogas technology in South Africa and presented case studies on the currently
installed biogas digesters. The present study continues from the work done by Hennekens
(2012) by investigating the extent to which biogas derived from organic waste could alleviate
the problem of rural and peri‐urban household’s access to clean energy in South Africa, the
health co‐benefits of the substitution of presently used solid fuels and the constraints to
adoption of domestic biogas technology. The following research objectives have been
formulated to address problem statement.
1.5. Research objectives and scope
This study was aimed at achieving the following research objectives:
i. Evaluate the energy demand by a low‐income South African household.
ii. Evaluate the amount of biogas required for substitution of fuelwood used for
cooking and the amount of biogas required for complete substitution of
conventional domestic fuels.
iii. Quantify fuelwood and cost savings from substitution with biogas.
iv. Quantify the reduction in the burden of diseases from installation and operation of a
domestic biogas digester.
v. Evaluate the availability of feedstocks for domestic biogas digester implementation
in low‐income South African households.
vi. Estimate the number of households in South Africa that can potentially benefit from
domestic biogas technology due to availability of feedstocks.
vii. Evaluate the demand and availability of water required for operating a domestic
biogas digester.
The initial scope of work was to address the substitution of all conventional domestic fuels (coal
included). However, due to the limited coal use in rural areas where biogas technology is more
feasible due to the availability of feedstock, coal substitution was disregarded in the study.
© University of Pretoria

5
1.6. Methods
To achieve the research objectives listed in Section 1.5 above, the primary research method
used is to calculate the required parameters based on values obtained from a literature study.
The literature study was also used to identify the gaps in terms of biogas technology adoption
and dissemination in South Africa thereby formulating the research questions to address those
gaps. Literature study conducted includes analyzing the text in scientific articles, policy
documents, census reports, research reports and websites.
1.7. Report Outline
The research on the potential of biogas as household energy in South Africa commences in
Chapter 2 with the literature survey. Chapter 2 describes biogas characteristics as an energy
source, biochemical processes involved in the production of biogas, the status of biogas
technology in the developing world, and the benefits of adopting biogas as household energy
and the constraints in the dissemination of biogas technology.
Chapter 3 defines the research methodology followed to address the research questions.
Chapter 4 outlines the results of the calculations conducted in Appendix A as well as the results
obtained from literature. The results are also discussed in Chapter 4 where the calculated
results are compared to the results obtained from literature. The conclusions and
recommendations are provided in Chapter 5 and 6 respectively where the feasibility of using
biogas as household energy and the suitable practice in South Africa is explored. Lastly, the
dissertation concludes with a case study regarding local power supply from a biogas socket
which is currently piloted in Bangladesh, Rwanda and Tanzania.
© University of Pretoria

6
CHAPTER 2: Literature Review
2.1. Introduction
This chapter reviews the energy demand by low‐income households in South Africa using
conventional domestic fuels. Biogas is explored as a potential energy substitute of conventional
domestic fuels. Biochemical processes involved in biogas production are reviewed and the
factors that affect these biochemical processes are explored. The status of domestic biogas
technology in the developing world is also reviewed and the challenges faced are presented.
This chapter concludes with the review of the benefits of domestic biogas technology and the
current South African policies that govern the use of biogas are presented.
2.2. Energy demand in low‐income South African households
The majority of non‐electrified households in South Africa rely on biomass as a main source of
energy used for cooking, space heating and water heating. Households without access to
electricity are mainly located in rural areas of KwaZulu Natal, Eastern Cape and Limpopo and
informal settlements of Gauteng (DoE, 2013). According to the Energy Research Centre (ERC) at
the University of Cape Town (2004) as cited in Damm & Triebel (2008), approximately 64% of
the households that depend on fuelwood for cooking purposes are in the lowest income
brackets, where household income ranges from R0 to R9 600 per annum. A survey of 348 rural
households in the Eastern Cape conducted by Prasad (2007) found that the poorest households
with an average monthly income of R819 (R9 828 per annum) were without any supply of
electricity. The Government of South Africa (2000) as cited in Damm & Triebel (2008) also
reported that 70% of rural households are poor. It can therefore be deduced that mainly low‐
income households without access to electricity residing in rural areas and peri‐urban/informal
settlements of South Africa rely on biomass (fuelwood predominantly) as a main source of
energy for cooking, space heating and water heating.
The total annual fuelwood consumption in South African households was estimated at 11.2
million tons which is equivalent to 190 400 TJ or 52 889 GWh (DME, 2006 as cited in Damm &
Triebel, 2008). This represents approximately 40% of the total energy consumption in South
© University of Pretoria

7
African households. The high proportion of fuelwood is attributed to its low efficiency in
inefficient cooking and heating methods used by rural households. The total number of
households that depend on fuelwood for cooking and heating purposes is generally estimated
at around 2.3 – 2.8 million (Census, 2001; DWAF, 2004 as cited in Damm & Triebel, 2008). It is
thus concluded that a good estimate for the average annual household fuelwood consumption
is 4.5 tons per annum per household (≈ 12 kg/day/household) (Damm & Triebel, 2008).
2.2.1. Energy efficiencies of domestic fuels
There has been a variety of fuelwood efficiencies reported in literature which is mainly
attributed to the types of cooking stoves and the testing method used. In the rural areas of the
developing countries, the use of traditional or conventional cooking stoves and three stone
fires (TSF) or open fires is still prevalent. Pathak et al (2009) reported a 40% burning efficiency
of fuelwood used in conventional cooking stoves in rural India whereas Yu et al (2008) reported
a 24% fuelwood efficiency used in traditional cooking stoves in China. These high efficiencies
are attributed to the nature of the cooking stove used as well as its ability to retain or transmit
heat. According to Xiaohua (1996), the thermal efficiency of the stoves in China was only 5‐20%,
while the average was about 10‐11%. The improvement in efficiencies can be attributed to
implementation of more improved and efficient cooking stoves in China over the years.
According to Muye (2015), cooking on TSF or open fires is still a norm in Africa. In South African
rural households, open fires are still the most prevalent cooking method. Open fires for cooking
have a low efficiency in the range of 3–8%, which means that about 92–97% of the energy is
lost to the surroundings (Muye, 2015). According to Ballard‐Tremeer (1997), the low efficiency
of open fires is attributed to the low heat transfer efficiency due to high losses to the ground.
Several studies have been conducted by researchers worldwide to determine the fuelwood
efficiency of various cooking stoves including TSF using a Water Boiling Test (WBT). The WBT is
a simplified simulation of the cooking process. The WBT involves operating the stove under
conditions of heating up and simmering, using water to simulate food. Water is brought to boil
as rapidly as possible during the heating‐up phase (commonly called the ‘high‐power phase’)
and is then maintained within 5°C of boiling for 30 minutes during the simmering phase (called
© University of Pretoria

8
the ‘low‐power phase’) (Ballard‐Tremeer, 1997). Table 2‐1 shows the reported fuelwood
thermal efficiencies for open fires measured using the WBT:
Table 2‐1: Thermal efficiencies of fuelwood in open fires measured using WBT
Thermal Efficiency (%) Source
13 Boy et al (2000)
14 Ballard‐Tremeer (1997)
16 Umogbai (2011)
18 TERI (1987) as cited Smith et al (2000)
18 Venkataraman et al (2010)
23 CES (2001) as cited in Rajendran et al (2012)
One of the limitations of the WBT is that it is a controlled test therefore it is less representative
of the actual cooking. Ballard‐Tremeer (1997) stressed that during the WBT, their open fires
were sensibly controlled therefore considerably lower efficiencies would have been achieved by
building larger fires. One of the major contributors to lower thermal efficiency is the moisture
content of the fuelwood. The moisture in fuelwood (or any fuel) acts as a heat sink thus
lowering the combustion efficiency (Ballard‐Tremeer, 1997). The WBT takes into consideration
the moisture content by measuring it and incorporating in the thermal efficiency calculation.
The thermal efficiency obtained from a WBT is an overestimate of the actual thermal efficiency
therefore it is logical that the lowest thermal efficiency (13%) from Table 2‐1 be used in the
calculation as it is the figure that is closest to the actual thermal efficiency.
The thermal efficiency for the biogas stoves varied between 50 and 60% (CES, 2001 as cited in
Rajendran et al, 2012; Itodo et al, 2007; RCSD, 2008; Fulford, 1988:161). Khadi and Village
Industries Commission (KVIC) and Bureau of Indian Standards (BIS) recommend that the
efficiency of domestic burners should not be less than 55% (Smith et al, 2000). It can be
deduced that using a biogas efficiency of 55% as reported in Smith et al (2000) for calculations
in this present study is reasonable.
© University of Pretoria

9
Another application for biogas besides cooking is lighting. In remote rural areas where there is
no access to electricity, farmers use biogas for lighting too (Ghimire, 2013). Biogas used for
lighting can be used in Liquefied Petroleum Gas (LPG) lamps or biogas lamps. Due to the
inefficiency of biogas lamps, it is not recommended to use biogas for lighting and it should only
be used where there is an excess of biogas (Everson & Smith, 2015). According to Thom (1994)
as cited in Everson & Smith (2015), the efficiency of biogas lamps is approximately 5%. Al Seadi
(2008) as cited in Smith & Everson (2016) reported a slightly lower efficiency of 3%. The use of
biogas for lighting is often discouraged due its complexity from a technical and safety
perspective (Everson & Smith, 2015).
The energy demand by a household is also dependent on the heating value or calorific value of
the fuel used. The calorific value of any fuel is the energy released per unit mass or per unit
volume of the fuel when the fuel is burnt completely. Table 2‐2 shows reported calorific values
of the various domestic fuels. Fuelwood has the lowest calorific value which is attributed to its
moisture content. According to Ballard‐Tremeer (1997), the calorific value of Saligna which is
hardwood that is grown extensively in South Africa on a commercial basis was 19.76 MJ/kg and
the calorific value of Pine (softwood) was 20.42 MJ/kg. Considering the poor quality of
fuelwood that is now available to rural areas due to deforestation, a slightly lower calorific
value of fuelwood of 17 MJ/kg used in the present study is reasonable. Due to the marginal
differences in the calorific values of biogas reported by the sources in Table 2‐2, an average
calorific value of 20 MJ/m3 will be used in the calculations of the present study.
Table 2‐2: Calorific values of domestic fuels
Fuel Calorific Value Units Source
Paraffin 35 MJ/L (Pathak et al, 2009)
38 MJ/L (Fulford, 1988: 161)
Fuelwood 16 MJ/kg (Pathak et al, 2009)
18 MJ/kg (Fulford, 1988: 161)
Biogas 20 MJ/m3 (Pathak et al, 2009)
© University of Pretoria

10
Fuel Calorific Value Units Source
19 MJ/m3 (Fulford, 1988: 161)
21 MJ/m3 (Surendra et al, 2014)
22 MJ/m3 (CES, 2001; Itodo, 2007)
2.2.2. Economic value of fuelwood
There are two main value components of fuelwood which are (i) direct value where a market
exists and fuelwood is traded, and (ii) opportunity cost which is related to the time spent
collecting the resource (Damm & Triebel, 2008). The gross direct use value of fuelwood to rural
households ranged from R600 to over R4 400 per year, with a mean of approximately R2 000
(Damm & Triebel, 2008). Census 2001 showed that 2.3–2.8 million of households rely on
fuelwood which translated to a total gross direct use value of fuelwood in the region of R4.5 –
R5.5 billion (Damm & Triebel, 2008).
Approximately 1‐5 hours are spent on a given day to collect fuelwood by mainly women and
girls (Damm & Triebel, 2008). On a monthly basis, the time spent can range from a few hours to
over 80 hours per month, depending on the frequency of collection and the proximity of the
fuelwood resource (Damm & Triebel, 2008). Taking an average of 40 hours per month at R12
per day, the opportunity cost would be of the order of R720 per annum, or 36% of the gross
value of fuelwood to rural households (Damm & Triebel, 2008). Deducting this from the gross
value means that the net direct‐use value of fuelwood is of the order of R1 250 per household
per annum, or R3–3.5 billion per annum in total (Damm & Triebel, 2008).
2.2.3. Burden of disease attributed to indoor smoke from fuelwood use
Although air pollutant emissions are dominated by outdoor sources, human exposures are a
function of the level of pollution in places where people spend most of their time. Human
exposure to air pollution is thus dominated by the indoor environment. Cooking and heating
with solid fuels such as animal dung, wood, agricultural residues or coal is likely to be the
largest source of indoor air pollution globally. When used in simple cooking stoves, these fuels
emit substantial amounts of pollutants, including respirable particles, carbon monoxide,
© University of Pretoria

11
nitrogen and sulphur oxides, and benzene. Limited ventilation is common in many developing
countries and increases exposure, particularly for women and young children who spend much
of their time indoors (WHO, 2002).
Studies have shown reasonably consistent and strong relationships between the indoor use of
solid fuels and a number of diseases. These analyses estimate that indoor smoke from solid
fuels causes about 35.7% of acute lower respiratory infections (ALRI), 22.0% of chronic
obstructive pulmonary disease (COPD) and 1.5% of trachea, bronchus and lung cancer. Indoor
air pollution may also be associated with tuberculosis (TB), cataracts and asthma. The most
important interventions to reduce this impact are better ventilation, more efficient vented
stoves, and cleaner fuels (WHO, 2002).
Various estimators of the health impact of air pollution have been employed in recent health
impact assessments. Some assessments have used indices such as the attributable risk (AR), or
measures derived from it, such as the number of attributable cases, to quantify the burden of
disease or death in a given population. The impact of increases in the mortality rate due to air
pollution has also been quantified in terms of the average reduction of lifespan produced in a
given population, using estimators such as years‐of‐life‐lost (YLL). Still other assessments
combine impacts on morbidity and mortality, using estimators such as disability‐ or quality‐
adjusted life‐years (DALYs or QALYS, respectively) (WHO, 2001). DALY combines in a single
metric, the time lived with a disability and the time lost due to premature death (DALY = YLL +
YLD). YLL is the years of life lost due to premature death and YLD is the years lived with a
disability (Prüss‐Üstün et al, 2003). One DALY is equal to the loss of one healthy life year (WHO,
2002). According to Prüss‐Üstün et al (2003) the DALY is the widely‐used estimator of burden of
disease and can be applied across cultures, therefore it is principal estimator used in this
present study. Biogas reduces the burden of diseases associated with solid fuel use in rural low‐
income households by providing a cleaner cooking fuel as a substitute to solid fuels which is
extensively discussed subsequently.
© University of Pretoria

12
2.3. What is biogas?
Biogas is a mixture of gases produced by anaerobic digestion (AD) of biological matter. Various
biological matters (substrates) can be used as feedstock in a domestic anaerobic digester such
as kitchen waste, animal and human excreta due to their availability on a domestic level. The
use of human excreta for biogas production and using bio‐slurry that results from it has been
dismissed in other countries as it was perceived socially and culturally unacceptable (Amigun et
al, 2012; Van Nes & Nhete, 2007).
Biogas consists of 50‐70% methane, 30‐40% carbon dioxide and traces of other gases such as
hydrogen sulphide, ammonia and hydrogen (Ghimire, 2013; Surendra et al, 2014). Biogas is an
odourless and colourless gas that burns with clear blue flame (soot–free) similar to LPG gas
(Ghimire, 2013). Typical compositions of raw biogas and the properties of the components are
summarised in Table 2‐3 below (Surendra et al, 2014):
Table 2‐3: Chemical composition of biogas and properties of components
Components Concentration (v/v) Properties
CH4 50 ‐ 75% Energy carrier.
CO2 25 ‐ 50% Decreases heating value. Corrosive, especially in the
presence of moisture.
H2S 0 ‐ 5 000 ppm Corrosive and toxic. Sulphur dioxide emission during
combustion.
NH3 0 ‐ 500 ppm NOx – Emissions during combustion.
N2 0 ‐ 5% Decreases heating value
Water vapour 1 ‐ 5% Facilitates corrosion in the presence of CO2 and sulphur
dioxide (SO2).
Normal combustion of biogas with excess air is expressed by reaction (1) below:
O2HCO2OCH 2224 Heat (1)
© University of Pretoria

13
Biogas has a calorific value of approximately 21 – 24MJ/m3 (Bond & Templeton, 2011). Bio‐
slurry, which is rich in nutrients is produced as a bi‐product in the biogas production process
which can be used as a potent organic fertilizer for crop production. Bio‐slurry unlike synthetic
fertilizer imparts no detrimental effect on soil or on the environment.
Biogas is a clean and renewable form of energy that could be a substitute (especially in the rural
sector) for conventional sources of energy such fuelwood, coal and paraffin which are causing
ecological–environmental problems and at the same time depleting at a faster rate (Gautam,
Baral & Herat, 2009).
2.3.1. Biochemical processes involved in biogas production
Anaerobic digestion of biological matter to produce biogas is achieved by a series of
biochemical reactions which are made possible by the existence of specific micro‐organisms
(bacteria). The biochemical processes involved in the production of biogas can be divided into
three stages (see Figure 2‐1 below) namely hydrolysis, acidogenesis (acid‐formation) and
methanogenesis (methane‐formation).
Figure 2‐1: The three‐stage anaerobic fermentation of biomass (Source: Thomas et al, 1999)
© University of Pretoria

14
2.3.1.1. Hydrolysis
Hydrolysis involves the breakdown of long chain organic molecules such as carbohydrates,
cellulose, proteins, lipids and fats into simpler shorter molecules such as monosaccharides and
amino acids by extra‐cellular enzymes of facultative (such as Streptococci) and obligatorily
anaerobic bacteria (such as Bactericides and Clostridia) (Yadvika et al, 2004). Hydrolysis can be
represented by reaction (2) below:
(2)
The hydrolysis of carbohydrates takes place within a few hours, the hydrolysis of proteins and
lipids within few days. Lignocellulose and lignin are degraded only slowly and incompletely. The
facultative anaerobic bacteria make use of the dissolved oxygen in the water and thus cause
the reducing conditions necessary for obligatory anaerobic microorganisms (Deublein &
Steinhauser, 2008: 94).
2.3.1.2. Acidogenesis
The second stage involves the conversion of the fermented intermediate materials into short‐
chain organic acids, C1‐C5 molecules (e.g. butyric acid, propionic acid, acetate and acetic acid),
alcohols such as ethanol, hydrogen and carbon dioxide by the action of acidogenic bacteria
(Deublein & Steinhauser, 2008). This stage can be illustrated by the following reaction:
236126 COOH3nCHOHCn (3)
Products of the acidogens such as butyric acid and propionic acid are further degraded by
acetogenic microorganisms into acetic acid as shown by reaction (4) and (5) below (Deublein &
Steinhauser, 2008: 96; Yadvika et al, 2004 ):
223223 3HCOCOOH2CHO2HCOOHCHCH (4)
232223 2HHCOO2CHO2HCOOCHCH (5)
61262n5106 OHCnOnH︶OH︵C
© University of Pretoria

15
Acetogenic bacteria are obligatory hydrogen producers and acetic acid is further produced
through the reduction of the hydrogen and carbon dioxide as shown by reaction (6) below
(Deublein & Steinhauser, 2008: 96):
O2HCOOHCH4H2CO 2322 (6)
The acetate formation by reaction (3) runs automatically and is thus thermodynamically
possible only with very low hydrogen partial pressure. Acetogenic bacteria can get the energy
necessary for their survival and growth, therefore, only at very low hydrogen concentration. On
the other hand, methanogenic bacteria can survive only with higher hydrogen partial pressure.
They constantly remove the products of metabolism of the acetogenic bacteria from the
substrate and so keep the hydrogen partial pressure at a low level suitable for the acetogenic
bacteria. Therefore acetogenic and methanogenic microorganisms must live in symbiosis
(Deublein & Steinhauser, 2008: 97; Dioha et al, 2012). According to Dioha et al (2012), this
cooperation between methanogenic bacteria and acetogenic bacteria is called syntrophic
acetate oxidation (SAO).
When the hydrogen partial pressure is low, H2, CO2 and acetate are predominately formed by
the acetogenic bacteria (Deublein & Steinhauser, 2008: 97; Dioha et al, 2012). When the
hydrogen partial pressure is higher, predominately butyric acid, propionic acid and ethanol are
formed. From these products, the methanogenic products can process only acetate, H2 and CO2
(Deublein & Steinhauser, 2008: 97).
About 30% of the entire CH4 production in the anaerobic sludge can be attributed to the
reduction of CO2 by H2 (70% from acetate), but only 5‐6% of the entire methane formation can
be attributed to the dissolved hydrogen (Fulford, 1988: 31; Deublein & Steinhauser, 2008: 97;
Dioha et al, 2012). The bacteria (acidogens and acetogens) use up all the oxygen present
creating an anaerobic environment for the methane‐producing micro‐organisms to react
afterwards (Yadvika et al, 2004).
© University of Pretoria

16
2.3.1.3. Methanogenesis
Methanogenesis is the final stage of the biogas production process. In this stage, methane and
carbon dioxide (biogas) are formed by various obligatory methane‐producing microorganisms
called methanogens as shown by reactions (7), (8) and (9) below (Deublein & Steinhauser,
2008: 98). These methanogens include acetotrophic species (acetate utilizers) such as
Methanosaeta, Methanosarcina spp. and Methanothrix spp and also hydrogenotrophs
(hydrogen utilizing species) such as Methanobacterium, Methanococcus, etc. (Yadvika et al,
2004; Dioha et al, 2012).
Reduction of CO2 by H2: O2HCH4HCO 2422 (7)
Oxidation of acetate: 3423 HCOCHOHCOOCH (8)
Oxidation of ethanol: COOH2CHCHCOOHCH2CH 34223 (9)
When the methane formation works, the acetogenic phase also works without problems
(Deublein & Steinhauser, 2008: 99). When the methane formation is disturbed, over‐
acidification due to accumulation of organic acids from the acidogenesis step occurs (Deublein
& Steinhauser, 2008: 99). According to Dioha et al (2012), methanogens are easily affected by
various disturbances such pH changes or the presence of toxic compounds such as heavy
metals or organic pollutants.
2.3.2. Biogas digester technology
Biogas digester technology can be utilised industrially and domestically. Industrial biogas
digesters are mainly used in developed countries for anaerobic digestion of municipal solid
waste to release the pressure from landfill sites (Libsu, Chavan & Wonde, 2011). The biogas
thus generated is mainly used for power production. In recent years, considerable attention has
been paid towards the development of industrial reactors for anaerobic treatment of high
strength organic effluents leading to the conversion of organic molecules into biogas. These
reactors, known as second generation reactors or high rate digesters have been developed in
industries such as distillery, pulp and paper, dairy and slaughterhouse, and can handle wastes
© University of Pretoria

17
at a high organic loading rate of 24 kg COD/m3 day and high upflow velocity of 2‐3 m/h at a low
hydraulic retention time. These reactors can be classified as follows (Rajeshwari et al, 2000):
i. Fixed film reactors
ii. Upflow anaerobic sludge blanket reactor (UASB)
iii. Anaerobic fluidized bed reactor.
Domestic biogas digesters are most popular among the developing countries due to their ability
to produce biogas on a small scale at household level. The biogas produced is used as fuel to
minimise the use of biomass as fuel. This study focuses on domestic biogas digesters which are
most popular among the developing countries including South Africa. Table 2‐4 below shows
the amount of biogas, digester size and cattle numbers required based on the household size.
Table 2‐4: Requirements of digester volumes (Dioha et al, 2012)
Number of persons in
the family
Requirements of Biogas
for cooking and lighting
(m3) per day
Volume of digester
required (m3)
Number of cattle
needed
Up to 4 persons 1 4 2 – 4
5 – 6 1.5 6 4 – 5
7 – 9 2 8 5 – 7
10 – 13 2.5 10 7 – 9
14 – 18 3.75 15 9 – 12
19 – 25 5 20 13 – 15
There are three domestic biogas digester types that are popular in developing countries
namely:
2.3.2.1. Chinese fixed dome digester
The Chinese fixed dome digester (see Figure 2‐2 below) consists of a cylindrical chamber with a
feedstock inlet and a bio‐slurry outlet, which also serves as an overflow tank (Pérez et al, 2014).
Biogas is stored in the upper part of the chamber called the dome. When biogas production
© University of Pretoria

18
starts, the slurry is displaced into the overflow tank by the pressure of the gas in the dome. The
volume of the overflow tank is equal to the volume of the biogas storage. Gas pressure
increases with the volume of biogas stored resulting in the difference in slurry levels between
the inside of the digester and the overflow tank. It is constructed underground to facilitate
loading and to make use of the insulating properties of the soil, thus maintaining favourable
temperature inside the digester (Pérez et al, 2014). It is constructed with locally available
materials such as bricks, concrete and stones (Surendra et al, 2014). Construction material
contributes significantly in the capital costs of the digester. An inventory analysis of household
biogas digesters at high altitude conducted by Pérez et al (2014) showed that bricks and cement
accounted for 60% of the total cost in the fixed dome digester construction.
Figure 2‐2: Schematic diagram of a Chinese fixed dome digester (Source: Gautam et al, 2009)
Sizing of a biogas digester depends on the location (urban or rural), number of households
(single or multiple household), and feedstock availability (Rajendran et al, 2012). For instance,
the size of these digesters can typically vary between 4 and 20 m3 in Nepal (Gautam, 2009;
Ghimire, 2013), between 6 and 10 m3 in China (Daxion, 1990 as cited in Rajendran et al, 2012),
between 1 and 150 m3 in India (Tomar, 1994 as cited in Rajendran et al, 2012) and in Nigeria it
is around 6 m3 for a family of 9 members (Adeoti et al, 1990 as cited in Rajendran et al, 2012).
Instead of having a single household biogas digester, a large volume digester is used to produce
© University of Pretoria

19
biogas for 10–20 homes, and is called community type biogas digester (Rajendran et al, 2012).
In countries where houses are clustered as in Nigeria or the informal settlements in South
Africa, these types of biogas digesters are more feasible (Akinbami et al, 2001 as cited in
Rajendran et al, 2012).
2.3.2.2. Indian floating drum digester
The Indian floating drum type digester (see Figure 2‐3 below) consists of two tanks (the upper
tank and the lower tank) where the slurry is contained in the lower tank; with the upper tank
(inverted tank) serving as a cap which is lifted by the biogas as it is generated (Dana, 2010). As
the gas is being consumed, the gas pressure drops therefore the upper tank sinks back down. In
general, plastic tanks are preferable to steel tanks for both slurry container and gas storage
tanks as both the slurry and biogas can corrode steel tanks rapidly (Dana, 2010). In contrast,
according to Bond & Templeton (2011) and Surendra et al (2014); a floating drum type digester
is often constructed with concrete and steel. Unlike the fixed dome type digester, only the
inverted tank is above the ground (Surendra et al, 2014).
Figure 2‐3: Schematic diagram of an Indian floating drum digester (Source: Dana, 2010)
© University of Pretoria

20
The average size of these kinds of digesters is around 1.2 m3 (Gosling, 1982 as cited in
Rajendran et al, 2012). For a small‐medium size farm the size varies from around 5–15 m3
(Werner et al, 1989 as cited in Rajendran et al, 2012). Singh and Gupta (1990) compared 14
different community biogas plants with a floating drum model. The size of each digester was
about 85 m3.
2.3.2.3. Taiwanese plastic tubular digester
The Taiwanese plastic tubular digester (see Figure 2‐4 below) operates in plug‐flow mode. The
size of such digesters varies from 2.4 –7.5 m3 (Rajendran et al, 2012). Feedstock flows through a
tubular plastic (polyethylene or PVC) bag from the inlet to the outlet, while biogas is collected
by means of a gas pipe connected to a burner or a reservoir (for storage) (Garfí et al, 2012). In
order to maintain higher process temperatures and reduce overnight temperature fluctuations,
the digester is buried in a trench and/or covered by a greenhouse (Ferrer et al, 2011; Garfí et al,
2012; Pérez et al, 2014; Surendra et al, 2014). Taiwanese plastic tubular digesters are said to be
the simplest (in terms of implementation and handling) and most inexpensive design but are
susceptible to mechanical damage and have a short operational life of only 2‐10 years
(Surendra et al, 2014). Pérez et al (2014) gives a more conservative operational life for the
plastic tubular digester of less than 5 years.
Figure 2‐4: Schematic diagram of a Taiwanese plastic tubular digester (Source: Dana, 2010)
The Chinese fixed dome digester is the design of choice because of its reliability, low
maintenance requirement and long lifetime (Parawira, 2009). According to Ghimire (2013), a 4
© University of Pretoria

21
m3 sized digester can produce 800 – 1 600 L/day of biogas that can fulfil energy demand for
cooking for a 4‐5 member family. According to Bond and Templeton (2011), 1 500 – 2 400 L of
biogas is sufficient to supply cooking requirements for a family of five.
2.3.3. Kinetics of anaerobic digestion
Several kinetic models have been developed to describe the anaerobic digestion of biological
material. The Monod model can be used to determine the rate of substrate utilisation sr by
Equation 1 below:
SKSQr max
s Equation 1
Where S is the limiting substrate concentration, K is half velocity concentration, and maxQ is
maximum substrate utilization rate. The above equation is applicable for a low substrate
concentration. However, for high substrate concentration (S >>K ), the equation is re‐written
as:
maxs Qr Equation 2
According to Mittal (1996), the Monod model suffers from the drawback that one set of kinetic
parameters are not sufficient to describe the biological process for both for short‐ and long‐
retention times, and that kinetic parameters cannot be obtained for some complex substrates.
To alleviate limitations of the Monod model while retaining its advantages, Chen & Hashimoto
(1978) developed an alternative equation which attempts to describe kinetics of methane
fermentation in terms of several parameters. According to Equation 3, given below, for a given
loading rate (S0/q) daily volume of methane per volume of digester is depended on the
biodegradability of the material (B0) and kinetic parameters μm and K (Chen & Hashimoto,
1978).
K1qμ
K1qSBr
max
00v Equation 3
Where,
© University of Pretoria

22
vr = volumetric methane production in cubic meter methane gas per cubic meter digester per
day.
0S = Influent volatile solids concentration in kg VS per cubic meter digester
0B = Ultimate methane yield in cubic meters methane per kg VS
q = Hydraulic retention time (HRT) in days
mμ = Maximum specific growth of the microorganism in per day.
K = Dimensionless kinetic parameter, for cattle dung, 0S0.06e0.00160.8K
For predicting the daily gas production in a semi‐continuous biogas digester fed with cattle
dung, Equation 4 below can be used (Fulford, 1988: 152). The reaction is derived from the first
order kinetics model.
k.R1kC.V.Sg o
Equation 4
Where,
g = daily gas production in cubic meter per day
C = Yield constant for the substrate
V = volume of the reactor in cubic meters
0S = Initial substrate concentration
k = First order rate constant in per day
R = Hydraulic retention time in days
Typical values for yield and rate constants for cattle dung in semi‐continuous digesters are
given in Table 2‐5 below.
© University of Pretoria

23
Table 2‐5: Kinetic constants for cattle dung in semi‐continuous digesters (Fulford, 1988: 152)
Temp (°C) Yield Constant: C (L/kg) Rate Constant: k (1/d)
Volatile Solids COD Volatile Solids COD
33.5 402 347 0.083 0.081
30.1 450 ‐ 0.052 ‐
27.5 310 ‐ 0.044 ‐
25 289 237 0.069 0.078
24.4 250 ‐ 0.036 ‐
20.3 310 ‐ 0.022 ‐
16 178 164 0.033 0.026
2.3.4. Characteristics of feedstocks
In general, all types of biomass can be used as feedstock as long as they contain carbohydrates,
proteins, fats, cellulose, and hemicellulose as main components (Deublein & Steinhauser, 2008:
57; Bond & Templeton, 2011). However, the biodegradability of the feedstock depends on its
physical and chemical form (Fulford, 1988: 33). Typical feedstocks used for biogas production
are as follows:
i. Animal waste
ii. Kitchen/food waste
iii. Human excreta/sewage
iv. Co‐digestion
Raw plant material is bound up in plant cells, usually strengthened with cellulose and lignin,
which are difficult to digest. In order to let the bacteria reach the more digestible foods the
plant material must be broken down (Fulford, 1988: 34). Cattle dung is a suitable feedstock due
to the presence of methanogens in the stomachs of ruminants (Bond & Templeton, 2011) and
because it has been ground up by the animal’s teeth and has also been broken down chemically
by acids and enzymes in the animal’s gut (Fulford, 1988: 34).
© University of Pretoria
24
“It is believed that fresh human excreta are suitable for biogas production, whereas sludge
collected from septic tanks, pit latrines, etc. is not. This is most likely because both aerobic and
anaerobic digestion contribute to the decomposition of biodegradable waste in pit latrines,
leaving a residual of biologically‐inert solids after a certain residence time” (Bond & Templeton,
2011).
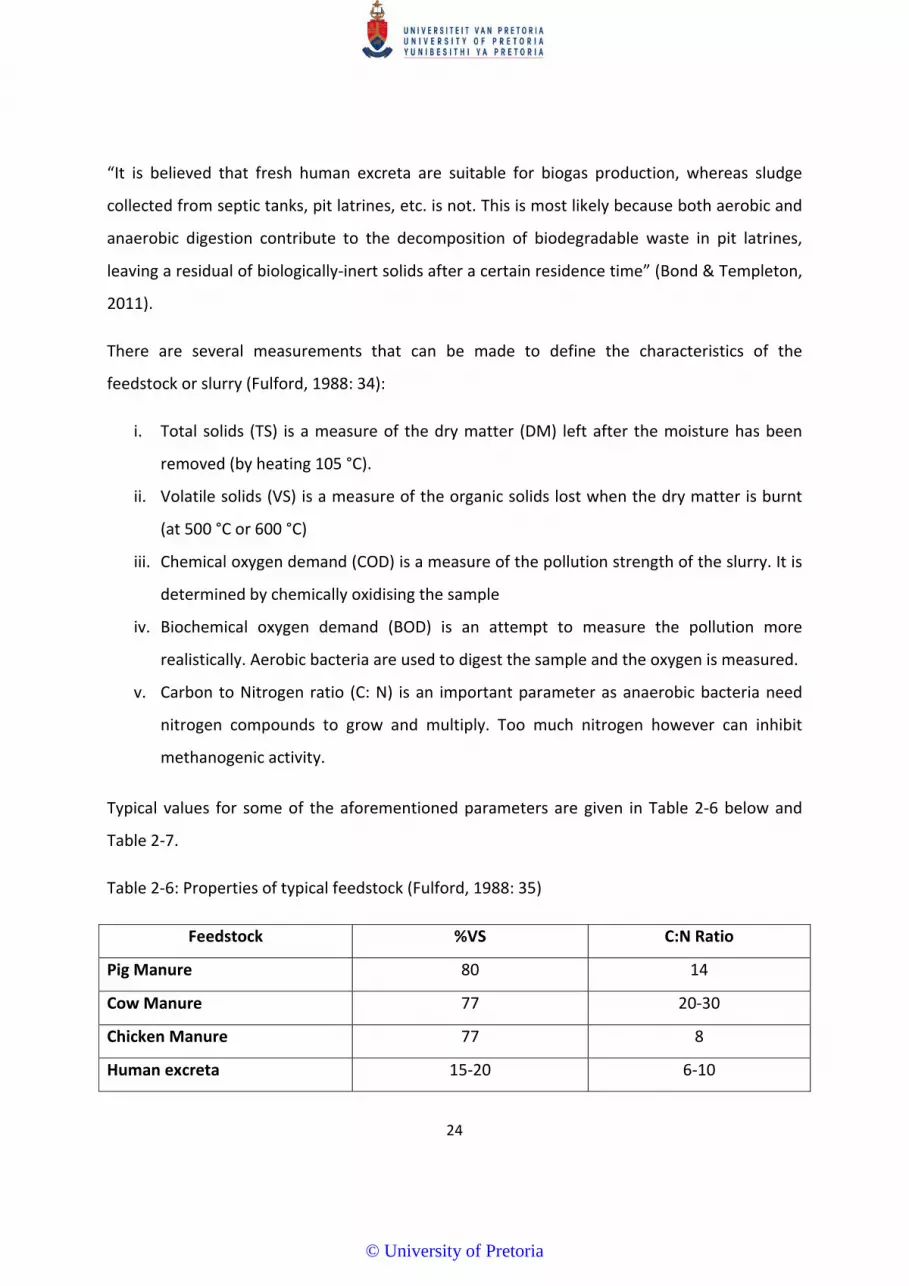
There are several measurements that can be made to define the characteristics of the
feedstock or slurry (Fulford, 1988: 34):
i. Total solids (TS) is a measure of the dry matter (DM) left after the moisture has been
removed (by heating 105 °C).
ii. Volatile solids (VS) is a measure of the organic solids lost when the dry matter is burnt
(at 500 °C or 600 °C)
iii. Chemical oxygen demand (COD) is a measure of the pollution strength of the slurry. It is
determined by chemically oxidising the sample
iv. Biochemical oxygen demand (BOD) is an attempt to measure the pollution more
realistically. Aerobic bacteria are used to digest the sample and the oxygen is measured.
v. Carbon to Nitrogen ratio (C: N) is an important parameter as anaerobic bacteria need
nitrogen compounds to grow and multiply. Too much nitrogen however can inhibit
methanogenic activity.
Typical values for some of the aforementioned parameters are given in Table 2‐6 below and
Table 2‐7.
Table 2‐6: Properties of typical feedstock (Fulford, 1988: 35)
Feedstock %VS C:N Ratio
Pig Manure 80 14
Cow Manure 77 20‐30
Chicken Manure 77 8
Human excreta 15‐20 6‐10
© University of Pretoria

25
VS is not an ideal measure of the digestibility of a feedstock. Lignin and other indigestible solids
will burn at 500 °C, while some digestible solids, such as sugars, leave a carbon deposit when
heated. COD and BOD are also not ideal ways to predict what proportion of the feedstock will
be digested in an anaerobic digester, as they were designed as measures of the aerobic
digestibility of materials (Fulford, 1988: 35). COD is useful in that it is possible to define a value
for methane. Using this figure, a digester should produce 350 litres of methane per kg of COD
digested (Fulford, 1988: 36).
The best way to determine the anaerobic digestibility of a feedstock is to digest it in small
laboratory digesters (2 litres) in controlled temperature baths. The values of total carbon during
measurement can be misleading, as some of the carbon is bound up in indigestible lignin
(Fulford, 1988: 35).
Table 2‐7 below shows typical biogas yields per kg of dry matter of selected feedstock used for
domestic anaerobic digesters.
Table 2‐7: Biogas production from selected feedstock
Feedstock
Daily
production
(kg/animal)
%DM Biogas yield
(m3/kg DM)
Biogas yield
(m3/animal/day) Source
Pig Manure 2 17 0.25‐0.5 0.128 Surendra et al
(2014)
Cow Manure 8 16 0.2‐0.3 0.32(Bond &
Templeton,
2011)
Chicken Manure 0.08 25 0.35‐0.8 0.01
Human
excrement/sewage 0.5 20 0.35‐0.5 0.04
Vegetable Waste ‐ 5‐20 0.4 ‐ (Deublein &
Steinhauser,
2008: 59‐61)
Bio waste from
households ‐ 40‐75 0.3‐1.0 ‐
© University of Pretoria

26
2.3.4.1. Animal Waste
The specific characteristics of animal manure (as a feedstock for AD) vary with species and
geography, but in general, animal manure has a high moisture content (75–92%) and volatile
solids (VS) ranging from 72 – 93% of total solids (TS), as well as a good buffering capacity which
makes it an ideal substrate for AD (Surendra et al, 2014). According to Garfí et al (2012), the
digestibility and net energy content of animal excreta is greatly influenced by type of species,
age and type of feeding. Furthermore, animal manure contains large and diverse microbial
communities; hence anaerobic digesters receiving animal manure as a feedstock can be
initiated without the addition of any external inoculums (Surendra et al, 2014). However,
because of a relatively low readily degradable organic content, animal manure has low
biochemical methane potentials (BMP) and digestion can be slow (Surendra et al, 2014). In
addition, depending on manure type and freshness, a high concentration of NH3, generated
during digestion, creates unfavourable environment for methanogens (Surendra et al, 2014).
The liquid manure from all animal species may contain foreign matter from animal feed.
Unwanted foreign matter that impairs the fermentation of liquid animal manure includes
(Deublein & Steinhauser, 2008: 62):
i. Sand from material present in feed of pigs and poultry
ii. Sawdust from scattering
iii. Soil from roughage
iv. Soil which is carried from meadows
v. Skin and tail hair, bristles and feathers
vi. Cords, wires, plastic, stones and others.
The presence of foreign matter leads to an increased complexity in the operations and
increases the operating expenditure of the plant. Such operational complexities and operating
expenditure includes continuous stirring of the digester, desludging of the digester and scum
removal. For an example, during the process of fermentation of liquid manure from pigs and
cattle the formation of scum caused by feed residues and straw and/or muck is expected. Pig
© University of Pretoria

27
liquid manure rather causes aggregates at the bottom as the feed contains a certain proportion
of sand and consists of undigested parts of corn and grain. Likewise chicken manure leads to a
similar phenomenon due to a high content of lime and sand (Deublein & Steinhauser, 2008: 64).
In general, organic acids, antibiotics, chemotherapeutic agents, and disinfectants found in liquid
manure can impair or even disrupt the fermentation process in biogas digesters (Deublein &
Steinhauser, 2008: 64). This is in accordance with Dioha et al (2011) regarding the sensitivity of
methanogens to toxic compounds such as heavy metals and organic pollutants. In the liquid
manure of pigs, the high content of heavy metals such as copper and zinc derived from
additives in the feed can be the limiting factor (Deublein & Steinhauser, 2008: 64).
The degree to which the organic substance in the biomass is decomposed in the digester
depends on the origin of the liquid manure. The organic content in liquid manure derived from
cattle is only 30% decomposed because of the high raw fibres in the feed, while about 50% of
pig manure and more than 65% of chicken manure is broken down (Deublein & Steinhauser,
2008: 64).
2.3.4.2. Kitchen/food Waste
Kitchen/food waste is bio‐waste generated by households. Kitchen wastes include peels of
vegetables, peels of fruits, waste milk and milk products, stale cooked and uncooked food, and
spent tea (Munda et al, 2012). Kitchen wastes and crop residues are some underexploited
substrates for the domestic biogas production (Rajendran, Aslanzadeh & Taherzadeh, 2012).
Kitchen wastes contain a high amount of fat in the form of animal fat from meat and cooking oil
(Rajendran et al, 2012). According to Bond & Templeton (2011), this high‐fat content can
enhance the biogas production.
Food and food‐processing waste are arguably the best resource for bio‐methane production
because of their high moisture (> 80%) and VS (95% of TS) contents (Surendra et al, 2014). With
the exception of meat waste, most food processing waste is poor in nitrogen content; but is rich
in readily fermentable organic matter (Surendra et al, 2014). Scano et al (2014) attributes this
to the high simple sugars content often found in vegetable and fruit waste which is easily
© University of Pretoria

28
fermentable to organic acids thus promoting acidification with a resulting inhibition of
methanogenic bacteria activity. Co‐digestion of food waste with cattle dung is therefore
recommended due to the readily available methanogens in the stomachs of cattle.
Raw vegetable matter usually needs to be treated before it can be used. It can be physically
chopped up or minced, or it can be treated chemically (Fulford, 1988: 34). The methane
potential of organic substrates increases with reduced particle size because of increased
surface area thus enhancing microbial activity. The presence of lignin in peels makes food waste
harder to hydrolyse therefore pre‐processing food waste enhances gas production (Munda et
al, 2012). One good method seems to be to compost vegetable matter for five days before
feeding it to the digester, as aerobic bacteria are better at breaking down cellulose (Fulford,
1988: 35).
In urban areas bio waste is poor in structure and quite pasty. This waste includes leftovers,
spoiled food, market waste, and different industrial waste (e.g. mash, waste liquor, waste from
the food industry and the industry of luxury articles). In the outskirts of a town or in rural
settlement the bio waste is fairly rich in structure and fibrous, and hence is well suitable for
composting (Deublein & Steinhauser, 2008: 66).
Methane percentage in biogas from agro‐feed digesters is higher than in animal waste feed
digesters, so the agricultural waste will be good alternative source for biogas. Leaves, grasses,
and other garden waste are a good alternative feed for biogas. High carbohydrate content in
agricultural species results in higher biogas output, but due to low nitrogen content the
bacterial growth is low. So, co‐feeding a mixture of animal waste and agricultural species can
result in both higher rate and ultimate yield of biogas production (Munda et al, 2012).
2.3.4.3. Human Excreta/Sewage
Anaerobic digestion of human waste provides sanitation by reducing the pathogenic content of
substrate materials. Hence biogas installation can dramatically improve the health of users. This
is particularly the case where biogas plants are linked to public toilets and/or where waste is no
longer stored openly. Rapid public health improvements following biogas implementation have
© University of Pretoria

29
been observed in rural China, with reductions in schistosomiasis and tapeworm of 90–99% and
13% respectively (Bond & Templeton, 2011).
Solid retention times of 3 weeks at mesophilic conditions are enough to kill pathogens leading
to typhoid, cholera, dysentery, schistosomiasis and hookworm. However, for eliminating other
pathogens mesophilic anaerobic processes are rather ineffective, with typically 50%
inactivation of helminth eggs and modest reductions of tapeworm, roundworm, E. coli and
Enterococci. Thus, the World Health Organisation (WHO) suggests pathogen reduction by
mesophilic AD is insufficient to allow subsequent use of human excreta as fertiliser (Bond &
Templeton, 2011).
Some potential users are reluctant to try the biogas digesters out of concern about sanitation.
Use of human wastes for biogas production and the subsequent digested sludge, for example in
schools, as a source of fertiliser faces cultural and health resistance. Even though the AD
process naturally reduces the pathogen load, handling biogas feedstock particularly human
excreta and using biogas slurry as fertiliser does pose some risk of infection (Parawira, 2009).
Human, pig and chicken manure are also good feedstocks, but need a ‘starter’, such as slurry
from a working digester, if they are used to start a biogas plant, because these animals do not
have all the right bacteria in their gut (Fulford, 1988: 34).
2.3.4.4. Co‐digestion
Several studies have found that the use of multiple substrates often has synergistic effects in
that biogas production is higher than would be expected on the basis on methane potential of
feedstocks components (Shah, 1997). Surendra et al (2014) recommends co‐digestion of
different organic substrates, not only to improve biogas production but to cope with feedstock
scarcity. Co‐digestion can improve the nutrient balance; maintain the pH, and results in positive
synergism (Rajendran et al, 2012). This is illustrated by data showing biogas yields for cattle
manure, sewage and a 50:50 mix of cattle manure and sewage to be 0.380, 0.265 and
0.407m3/kg DM respectively after 40 days' digestion (Shah, 1997). Consequently, co‐digestion is
© University of Pretoria
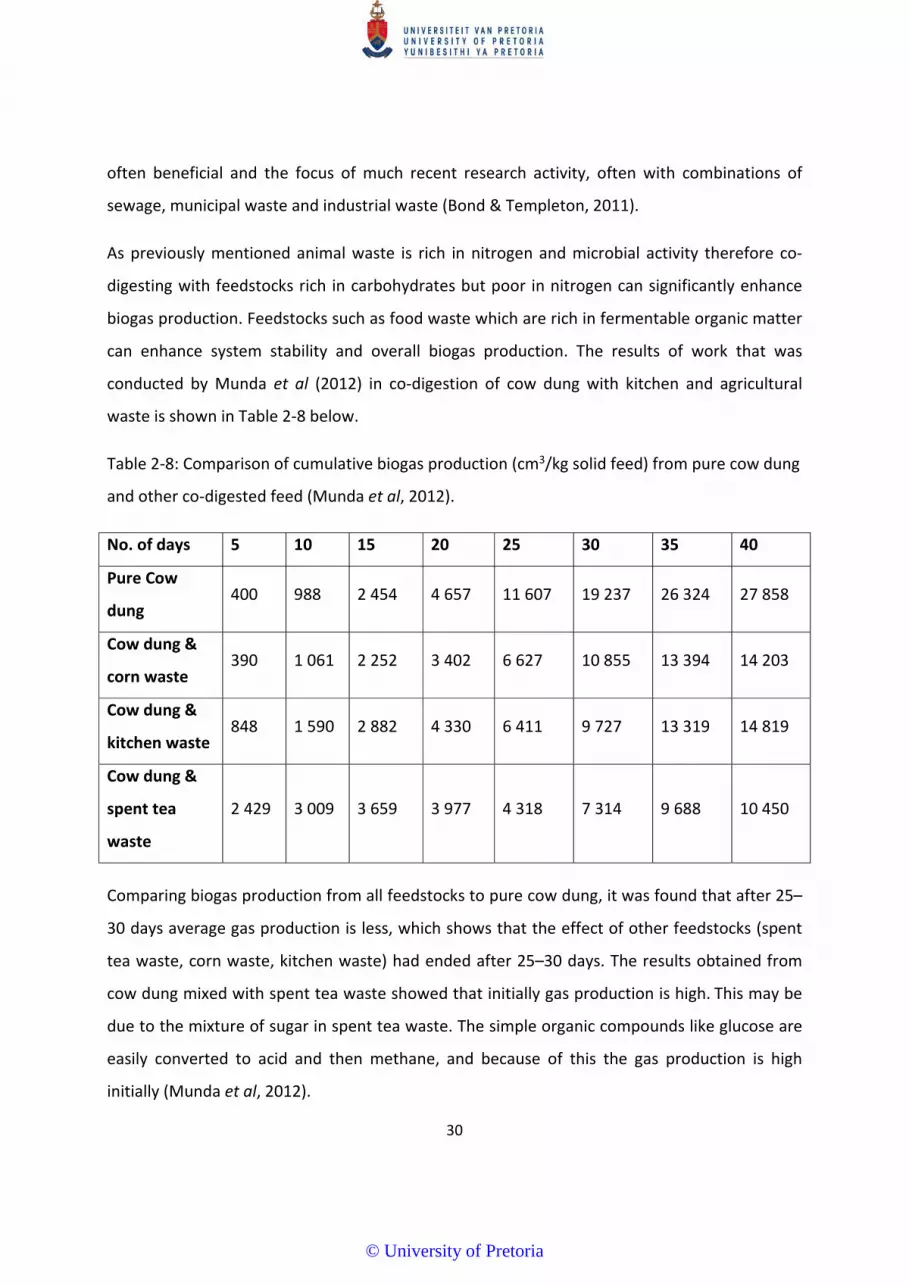
30
often beneficial and the focus of much recent research activity, often with combinations of
sewage, municipal waste and industrial waste (Bond & Templeton, 2011).
As previously mentioned animal waste is rich in nitrogen and microbial activity therefore co‐
digesting with feedstocks rich in carbohydrates but poor in nitrogen can significantly enhance
biogas production. Feedstocks such as food waste which are rich in fermentable organic matter
can enhance system stability and overall biogas production. The results of work that was
conducted by Munda et al (2012) in co‐digestion of cow dung with kitchen and agricultural
waste is shown in Table 2‐8 below.
Table 2‐8: Comparison of cumulative biogas production (cm3/kg solid feed) from pure cow dung
and other co‐digested feed (Munda et al, 2012).
No. of days 5 10 15 20 25 30 35 40
Pure Cow
dung 400 988 2 454 4 657 11 607 19 237 26 324 27 858
Cow dung &
corn waste 390 1 061 2 252 3 402 6 627 10 855 13 394 14 203
Cow dung &
kitchen waste 848 1 590 2 882 4 330 6 411 9 727 13 319 14 819
Cow dung &
spent tea
waste
2 429 3 009 3 659 3 977 4 318 7 314 9 688 10 450
Comparing biogas production from all feedstocks to pure cow dung, it was found that after 25–
30 days average gas production is less, which shows that the effect of other feedstocks (spent
tea waste, corn waste, kitchen waste) had ended after 25–30 days. The results obtained from
cow dung mixed with spent tea waste showed that initially gas production is high. This may be
due to the mixture of sugar in spent tea waste. The simple organic compounds like glucose are
easily converted to acid and then methane, and because of this the gas production is high
initially (Munda et al, 2012).
© University of Pretoria

31
2.3.5. Factors affecting biogas digester operation
Biogas digestion is a microbial process, and for that reason requires the maintenance of
suitable growth conditions for biogas producing bacteria (Yadvika et al, 2004). The common
factors that affect biogas production include:
2.3.5.1. Temperature
Temperature inside the digester has a major effect on the biogas production as it impacts the
growth of the methane producing bacteria (Yadvika et al, 2004). There are temperature ranges
during which anaerobic fermentation can be carried out: psychrophilic (<30 °C), mesophilic (30
– 40 °C) and thermophilic (50 – 60 °C) (Yadvika et al, 2004). El‐Mashad et al (2004) as cited in
Alvarez & Lidén (2008) classified the three temperature ranges for the AD process as <20 °C for
psychrophilic, 20 – 40 °C for mesophilic and >40 °C for thermophilic. However, anaerobes are
more active in the mesophilic and thermophilic temperature ranges (Yadvika et al, 2004).
Oxygen is less soluble in the thermophilic temperature range, so that the optimal anaerobic
operating conditions are reached more quickly (Deublein & Steinhauser, 2008: 113).
While anaerobic digestion is more efficient in the thermophilic region than in the mesophilic
region, rural biogas digesters operate in the mesophilic range because higher temperatures are
difficult to maintain. The Chinese fixed dome digester is an underground design, which utilises
the earth’s insulating properties to maintain healthy process temperatures. The gas production
rate roughly doubles for every 10 °C rise in temperature between 15 °C and 35 °C (Fulford,
1988: 33). Alvarez & Lidén (2008) conducted a study on a bench‐scale digester fed with a
mixture of llama‐cow‐sheep manure which showed that a temperature reduction from 35 °C to
25 °C resulted in a reduction of 30% biogas production rate, whereas temperature reduction
from 25 °C to 18 °C caused biogas production rate reduction of 51%. A study conducted by
Pérez et al (2014) showed that in the plastic tubular model (without greenhouse), the biogas
production rate dropped by 70% during winter months as compared to summer months; while
in the fixed dome model the biogas production rate dropped by only 15%. This is attributed to
the lack of insulation for the plastic tubular model therefore exposed to temperature
fluctuations as compared to the fixed dome model which is constructed underground therefore
© University of Pretoria

32
making use of the earth’s insulating properties. The gas production efficiency (the gas produced
per kilogram of feedstock) also increases with temperature. According to Cha et al (1997) as
cited in Alvarez & Lidén (2008), the activity of acidogenic bacteria is suppressed at temperature
below 20°C. A mesophilic digester works best at 35 °C (Fulford, 1988: 33).
Methanogenic bacteria are sensitive to drastic temperature changes (Fulford, 1988: 33; Yadvika
et al, 2004). Even small variations in temperature can cause a substantial decrease in activity,
resulting in a build‐up of undigested volatile acids causing acidic conditions (Deublein &
Steinhauser, 2008: 113). Therefore, the temperature should be kept exactly within a range of ±
2 °C (Deublein & Steinhauser, 2008: 113). A sudden change of more than 5 °C in a day can cause
a temporary inactivity of the methanogenic bacteria (Fulford, 1988: 33). The optimum
temperature is achieved when the methanogenic bacteria consume all the acids at
approximately the same rate that they are being produced by acidogenic bacteria (Dioha et al,
2012).
2.3.5.2. pH
An appropriate pH level is very important for effective performance of the methanogenic
bacteria (Yadvika et al, 2004). When a biogas digester is newly started, the acidogens become
active first, increasing the acid content thus reducing the pH to below 7. The methanogens then
start consuming these acids, increasing the pH back to neutral (Fulford, 1988: 114). The ideal
pH value for methane formation lies between 6.5 and 7.5 (Yadvika et al, 2004; Fulford, 1988:
114).
A working biogas plant is naturally buffered therefore the acid level is controlled by the process
itself (Fulford, 1988: 32). A drop in the pH‐value and a rise of the CO2 in the biogas is an
indication of a disturbance of the fermentation process (particularly the methanogenesis step)
(Deublein & Steinhauser, 2008: 115). Some of the CO2 produced by the bacteria dissolves in the
water to form bicarbonate ions (HCO3‐) which results in a mildly alkaline solution (Fulford, 1988:
32). For normal anaerobic fermentation, concentration of the volatile fatty acids, acetic acid in
particular, should be below 2 000 ppm; too high a concentration will greatly inhibit the activity
of methanogenic bacteria (Van Buren, 1979: 24; Yadvika et al, 2004).
© University of Pretoria

33
2.3.5.3. Carbon to Nitrogen ratio
For optimum growth and activity of bacteria and production of biogas, it is desired that the
feed contains adequate nutrients. While carbon supplies energy, nitrogen is needed for cell
growth (Munda et al, 2012). It is generally found that during AD, microorganisms utilize carbon
25–30 times faster than nitrogen. Thus to meet this requirement, microbes need a 20‐30:1 ratio
of C to N with the largest percentage of the carbon being readily degradable (Yadvika et al,
2004). A wider range of C: N ratio is given in Deublein & Steinhauser (2008: 115) as 16‐25:1.
Table 2‐6 shows the C: N ratio for some of the typical feedstocks.
A low C: N ratio basically means that the substrate is rich in nitrogen and vice versa. Substrates
with a too low C: N ratio lead to increased ammonia production and inhibition of methane
production (Deublein & Steinhauser, 2008: 116). For an example, if chicken manure is used as
feedstock, the addition of carbon such as chopped grass or water hyacinth can reduce the
possibility of toxicity from too much nitrogen affecting the bacteria (Fulford, 1988: 36).
If the C: N ratio is too high, then gas production can be enhanced by adding nitrogen in the
form of cattle urine or urea, or by connecting a toilet to the digester (Fulford, 1988: 36). Co‐
digestion is beneficial in improving the C: N ratio. Use of urine soaked waste materials is
particularly advantageous during winter months when gas production is otherwise low (Yadvika
et al, 2004).
2.3.5.4. Nutrients availability
Feedstock to the digester must contain enough nutrients to enhance the growth of
microorganisms. The need for other nutrients besides carbon and nitrogen is very low due to
the fact that with anaerobic process not much biomass is developed, so that for methane
formation even a nutrient ratio C: N: P: S of 500: 20: 5: 3 and/or an organic matter ratio of COD:
N: P: S = 800: 5: 1: 0.5 is sufficient (Deublein & Steinhauser, 2008: 116).
2.3.5.5. Solids concentration
Solids concentration is the amount of fermentable material of feed in a unit volume of slurry
(Yadvika et al, 2004). Ordinarily 7–9% solids concentration is best‐suited for optimum AD
© University of Pretoria

34
(Yadvika et al, 2004). A wider range for optimum solids concentration in low‐rate biogas
digesters is given by Bond & Templeton (2011) and Rajendran et al (2012) as 5‐10%. Some
literature recommends solid concentration for feedstock to be between 8% and 12% (Fulford,
1988: 35). The water content should normally be around 90% of the weight of the total
contents (Van Buren, 1979: 23). Therefore feedstock such as cow dung must be diluted with
water prior to being fed into the biogas digester (Fulford, 1988: 35). Typical values of the solids
concentrations (as %TS) for various feedstocks are given in Table 2‐6.
A low solids concentration means that the digester volume is used inefficiently. It can also lead
to a separation of the slurry, the heavier solids sinking to the bottom to form a sludge layer and
the lighter solids floating to form a scum layer on top of the liquid (supernatant). The scum
layer can dry out to form a solid mat, preventing gas release from the liquid and blocking pipes
which will result in operational complexities and increase the operating expenditure of the
digester. This should not happen if the solids concentration is kept above 6% (Fulford, 1988:
35).
A feedstock with a high solids concentration (greater than 12%) does not easily flow through
the inlet pipes (Fulford, 1988: 35). If toxins are present, such as a high nitrogen concentration,
bacteria are more likely to be affected in the thick slurry (Fulford, 1988: 35). However slurries of
up to 30% total solids can be digested in a dry fermenter (Fulford, 1988: 35). If the water
content is too low, acetic acids will accumulate, inhibiting the fermentation process and hence
production; also a rather thick scum will form on the surface (Van Buren, 1979: 23).
2.3.5.6. Organic loading rate (OLR)
Organic loading rate is the amount of volatile solids fed per unit volume of digester capacity per
day. Gas production rate is highly dependent on loading rate. Methane yield was found to
increase with reduction in loading rate. There is an optimum feed rate for a particular size of
plant, which will produce maximum gas and beyond which further increase in the quantity of
substrate will not proportionately produce more gas (Yadvika et al, 2004). The normal OLR of a
digester operating in mesophilic condition is 2‐3 kg VS/m3.day (Rajendran et al, 2012).
© University of Pretoria

35
If the digester is underfed (loading rate is too low), the bacteria will exhibit a lower metabolic
activity and very small quantities of biogas will be produced, although perhaps with an efficient
solids breakdown (Stafford, Hawkes & Horton, 1980: 83). If the digester is overfed (loading rate
is too high), an overload situation will be produced in which volatile fatty acids (VFA) builds up,
inhibiting methane production, and the proportion of carbon dioxide rises (Stafford, Hawkes &
Horton, 1980: 83).
2.3.5.7. Hydraulic retention time (HRT)
HRT is the ratio of the volume of the digester to the daily feed rate. HRT is the average time
spent by the input slurry inside the digester before it exits (Yadvika et al, 2004). At higher
temperatures (beyond 35 °C), the HRT is reduced due to enhanced microbial activity inside the
biogas digester. It is possible to carry out methanogenic fermentation at low HRT’s without
stressing the fermentation process at mesophilic and thermophilic temperature ranges (Yadvika
et al, 2004).
In tropical countries like India, HRT varies from 30–50 days while in countries with colder
climate it varies from 60‐90 (Pérez et al, 2014) or may go up to 100 days (Yadvika et al, 2004).
Shorter retention time is likely to face the risk of washout of active bacterial population
because they do not have sufficient time to grow at the same rate as the material is being
pumped in and out of the digester (Yadvika et al, 2004; Dioha et al, 2012). Longer retention
time requires a large volume of the digester and hence more capital cost. Hence there is a need
to reduce HRT for domestic biogas plants based on solid substrates (Yadvika et al, 2004).
2.4. Biogas as a renewable energy source in the developing world
2.4.1. Domestic biogas technology status in Asia
In Asia, countries such as China and India have seen massive campaigns to popularise the
technology. Widespread dissemination of biogas digesters in developing countries stems from
the 1970s and there are now around 4 and 27 million biogas plants in India and China
respectively (Bond & Templeton, 2011). The rapid development of biogas through these
© University of Pretoria

36
countries is linked to accumulated technical knowledge, the availability of fermentation
materials, and strong state support, including financial.
Similar encouraging signs of growth have been received from other Asian countries such as
Nepal, Vietnam and Bangladesh which have reported 205 762, 75 820 and 10 019 of biogas
digesters installed respectively up to 2009 (see Table 2‐9 below). The 299 908 biogas plants
installed in 14 countries till the end of 2009 under the framework of SNV national biogas
programme in Asia and Africa produce more than 600 million liters of biogas per day which is
equivalent to 3 000 tons of fuelwood or 360 Kiloliters of paraffin or 240 Ton of LPG or 900
Megawatt‐hour of electricity (Ghimire, 2013). Table 2‐9 below shows the growth in the number
of domestic biogas digesters installed in selected Asian countries.
Table 2‐9: Number of biogas plants installed in Asia
Country
Year of
programme
initiation
Cumulative number of biogas
plants installed up to 2009
(Ghimire, 2013).
Cumulative number of biogas
plants installed up to 2012
(Surendra et al, 2014).
China 1974 27 000 000 35 000 000
India 1970s 4 000 000 4 500 000
Nepal 1992 205 762 268 464
Vietnam 2003 75 820 152 349
Bangladesh 2006 10 019 26 311
Cambodia 2006 6 402 19 173
Lao PDR 2006 1 020 2 888
Indonesia 2009 50 7 835
Pakistan 2009 100 2 324
Bhutan 2011 ‐ 265
Total 31 299 173 39 979 675
© University of Pretoria

37
2.4.2. Domestic biogas technology status in South America
In Latin American countries i.e. the rural areas of tropical countries like Colombia and Costa
Rica and the hilly regions of Peru and Bolivia, the implementation of biogas plants is growing
dating back to the 1980s (Pérez et al, 2014). The simple constructions are similar to those in
Asia, with a digester volume of 2‐10m3 with a growing interest in the Taiwanese plastic tubular
digester design by the Andean communities in the past decade. Taiwanese plastic tubular
digesters are known for their low cost, and ease of implementation and handling (Garfí et al,
2011; Pérez et al, 2014).
Andean communities reside on the highest mountain peaks in the world with highest altitude of
6 960 meters above sea level (m.a.s.l.) thereby making it one of the coldest regions in the
world. The Peruvian Andes is characterized by two seasons, a dry sunny season with an average
of 13 °C and a wet cloudy season with an average temperature of 9 °C (Garfí et al, 2011). Low
temperatures (psychrophilic conditions) due to high altitude played a major role in the poor
performance of the digesters in the Andean countries therefore requiring insulation increasing
capital cost (Pérez et al, 2014).
2.4.3. Domestic biogas technology status in Africa
Unlike Asia, domestic biogas technology in Africa is still embryonic although the potential is
there. Taking into consideration multiple assumptions, Africa is estimated to have to have some
168 million head of domestic cattle thereby the technical potential market for domestic biogas
in Africa is estimated at 18.5 million households (Van Nes & Nhete, 2007; Ghimire, 2014). This is
considering only animal excreta as feed.
In most cases, biogas was introduced free of cost through a pilot or demonstration project.
Such projects were often implemented through government structures with intent to motivate
people to adopt the technology automatically (Van Nes & Nhete, 2007). However, this
approach has not led to widespread dissemination and market development of the technology
(Van Nes & Nhete, 2007). There are project initiatives that are currently running in Africa such
as SNV supported national biogas programmes which are active in nine African countries
© University of Pretoria

38
(Ghimire, 2013). Through such programmes, Africa has seen a 44% rise in the number of biogas
digesters installed from 2011 to 2012. An analysis conducted by Van Nes & Nhete (2007)
revealed that the exact number of plants installed in Africa was not known but the most units
were installed in Tanzania (more than 4000), Kenya and Ethiopia with hundreds to only a few in
other countries (see Table 2‐10 below). This lack of information regarding the number of biogas
digester installed is attributed to the fact that in most African countries, the biogas programme
was initiated post 2007. Unfortunately, an estimated 60% of these plants failed to stay in
operation (Van Nes & Nhete, 2007). The same failure rate was reported for the 27 million
biogas digesters installed in China (Surendra et al, 2014).
An African biogas initiative was launched in May 2007 in Nairobi which aimed at installing two
million biogas plants by 2020 with half of the digesters connected to toilets. The initiative also
aimed at job creation, reducing health costs, saving wood and reduction of greenhouse gas
emissions etc. (Van Nes & Nhete, 2007).
Table 2‐10: Number of biogas plants installed in selected African countries
Country
Year of
programme
initiation
Cumulative number of biogas
plants installed up to 2009
(Ghimire, 2013).
Cumulative number of biogas
plants installed up to 2012
(Surendra et al, 2014).
Rwanda 2007 434 2 619
Ethiopia 2008 128 5 011
Tanzania 2008 3 4 980
Kenya 2009 106 6 749
Uganda 2009 40 3 083
Burkina Faso 2009 1 2 013
Cameroon 2009 23 159
Benin 2010 ‐ 42
Senegal 2010 ‐ 334
Total 735 24 990
© University of Pretoria

39
2.4.4. Domestic biogas technology status in South Africa
Some of the first biogas digesters were set up in Africa in the 1950s in South Africa but similarly
to its African counterparts, growth of domestic biogas technology in South Africa is at its infant
stage (Amigun et al, 2012). Compared to Asian countries, biogas development in Africa has
been pretty modest so far because of various challenges, especially, the high investment costs,
limited access to credit facilities, insufficient awareness raising activities and significantly lower
purchasing power of potential households (Parawira, 2009).
A total of 38 biogas production operations have been registered by National Energy Regulator
of South Africa (NERSA) to date. The majority of these biogas digesters are of fixed dome type
fed with cow dung, pig manure, kitchen waste and agricultural residue (De Bruyn, 2013).This is
in line with the Gas Act of 2001 which stipulates that small biogas projects in rural communities
not connected to the national gas pipeline grid are exempted from obligation to apply or hold a
license but have to be registered with NERSA.
Most of the biogas operations in South Africa are in the rural areas of Limpopo and KwaZulu
Natal and of the fixed–dome design (De Bruyn, 2013). It has been estimated that more than 300
000 rural South African households could benefit from the waste‐to‐energy production to meet
their cooking needs, thus eliminating long travels to collect five wood used for cooking (Greben
& Oelofse, 2009) which this study aims to evaluate.
2.4.5. Challenges for the dissemination of domestic biogas technology
Developing countries have faced several challenges in the biogas sector which have constrained
the dissemination of domestic biogas digesters. These are listed as follows:
2.4.5.1. Lack of a renewable energy policy
An existing renewable energy policy can assist in breaking the barriers for the wide scale
dissemination of biogas technology. Policy should guide the stakeholders and suppliers to
maintain quality of product and services. Renewable energy needs to come into a government’s
main streaming agenda as evident from the success of biogas programmes in China and India.
© University of Pretoria

40
Government should provide active promotion and facilities such as tax and custom exemption,
laws and other supports to promote biogas technology (Ghimire, 2013). In countries like China,
India and Nepal, biogas programmes developed quickly due to the financial injection and the
technical support by the government (Surendra et al, 2014).
It is essential to establish a separate autonomous renewable energy apex organization at
national level to coordinate and facilitate the stakeholders (Ghimire, 2013). In absence of such
an organization, renewable energy including biogas cannot take place as a national programme
(Ghimire, 2013). In South African context, Hennekens (2012) identified the stakeholders
involved in domestic biogas technology such as Agama Biogas, Nova Institute, Trade plus Aid,
CSIR etc.
2.4.5.2. Climate too cold or too dry
Areas where the temperature sometimes goes below 10 °C (such as the hilly areas of Nepal and
rural communities of Peruvian Andes) are not suitable for biogas production unless the digester
is protected against temperature extremes (Gautam et al, 2009). Due to this, the biogas
technology has been found to be less feasible in high‐altitude areas. Therefore more research
needs to be done in increasing the efficiency of biogas production in colder regions (Gautam et
al, 2009). Research on biogas technology at high altitudes of rural Andean communities has
been conducted by Alvarez & Lidén (2008), Ferrer et al (2011), Garfí et al (2011), Garfí et al
(2012) and Pérez et al (2014).
From 2006 to 2011 more than 30 digesters were implemented in rural Andean communities of
Peru by means of pilot research and development cooperation projects (Ferrer et al, 2011).
Most of them were located at altitudes of between 3 000 and 4 000 m.a.s.l, where average
annual temperatures are 10 °C and irradiation as high as 6.0 – 6.5 kWh/m2.day (Ferrer et al,
2011). As previously mentioned, in such conditions the use of greenhouses and burying the
tubular digester inside a trench is important in increasing process temperatures (to around 20
°C) and reduce overnight temperature fluctuations (Ferrer et al, 2011; Garfí et al, 2012; Pérez et
al, 2014).
© University of Pretoria
41
Developing countries in Africa, South America and Asia occupy regions where the climate is
warm most of the time. The high ambient temperatures (15 – 40 °C) permit the utilization of
anaerobic reactors without heating, if they are designed and operated at convenient organic
loading rates. Arid areas are not conducive for biogas production since biogas operation
requires the use of water (Parawira, 2009).
2.4.5.3. Lack of private sector participation
The private sector has a key role in promoting renewable energy and making the biogas sector
commercially sustainable and market oriented. The national policy should be developed in such
a way that it attracts more private companies to participate in the biogas sector (Ghimire,
2013). In 2009 there were more than 30 private companies in Nepal that were involved with the
biogas sector. However, only eight of these companies were capable of installing more than 500
biogas plants per year because they were weak financially (Gautam et al, 2009).
2.4.5.4. Low income of the target group
One of the major barriers for the widespread dissemination of domestic biogas technology is
the high installation, operating and maintenance cost which puts it out of financial reach of
many rural households (Surendra et al, 2014). Access to micro credit makes biogas technology
more affordable for the poor (Ghimire, 2013). In Nepal, over 260 micro‐finance institutions are
providing credits for households which are unable to pay for the upfront cost of biogas digester
(Surendra et al, 2014). Another challenge is reducing the existing high costs of installation of
robust fixed‐dome biogas designs without compromising on quality and performance and
making it affordable to the people (Ghimire, 2013).
Biogas technology in the developing world has the potential of reducing greenhouse gas (GHG)
emissions thereby generating carbon revenues (Ghimire, 2013; Surendra et al, 2014). Nepal and
Cambodia have already started obtaining carbon revenues from their biogas programmes and
other countries like Bangladesh, Vietnam and Rwanda are in process of obtaining it. Carbon
credits can be a viable and sustainable source of funds to continue the programme in the longer
term, and therefore needs attention right from the beginning (Ghimire, 2013). According to
© University of Pretoria

42
Surendra et al (2014), carbon revenues could be deployed for research and development (R&D)
and dissemination of biogas technology locally.
2.4.5.5. Lack of technical knowledge
Lack of knowledge about the construction, operation and maintenance of biogas systems is
often cited as a reason for non‐adoption of biogas in some countries in Africa (Parawira, 2009;
Amigun et al, 2012; Surendra et al, 2014). Where people have installed biogas reactors,
problems arising from the bad quality of the installed units and the poor operations and
maintenance capacity of users have led to poor performance and even abandonment of biogas
digesters. In some instance, the demonstration effect has been one of failure and has served to
deter rather than enhance biogas adoption (Parawira, 2009; Amigun et al, 2012). According to
Parawira (2009):
It is also important to realise that lack of information on improved technologies such
as biogas technology at all levels, government, energy institutions, and consumers,
poses a very serious problem for technology penetration. Poor infrastructure prevents
access to the vast information available in the public domain about biogas technology
and its application. Generating interest among the various stakeholders and setting up
information systems using relatively cheap devices now available can assist greatly.
Setting up or strengthening existing information systems is very important for the use
of renewable energy technologies such as biogas. These systems should be capable of
coordinating energy and energy‐related information activities with appropriate means
for collection, filtering, storage, retrieval and dissemination.
In order to promote the implementation and proper use of anaerobic digestion technology, it is
important to initiate long‐term anaerobic digestion and other renewable energy training and
capacity‐building programmes, and to perform scientific work in this field (through appropriate
research) (Parawira, 2009). Biogas technology and its implementation can be included in the
curriculum of most engineering and technical courses offered in educational and private
institutions. It is important to establish contact between research and university groups and
© University of Pretoria
43
experienced contractors, and to initiate collaboration with polluting industries, i.e., to interest
them in the system, either for use as an environmental protection method or for energy
production. In addition, experts should provide reliable and pertinent information about the
biogas technology and its potential to local authorities, politicians, and the public in general
(Parawira, 2009; Amigun et al, 2012).
2.4.5.6. Limited water availability
The site‐specific issues that have limited the scope of biogas technology in sub‐Saharan Africa
include the availability of water and organic materials for effective bio‐digester operation
(Parawira, 2009; Amigun et al, 2012; Surendra et al, 2014). Inadequate water supply for
operating biogas plants in other areas is a significant hindrance for the widespread adoption of
biogas technology; particularly if the water source is distant from individual households and/or
is limited during changing seasons (Surendra et al, 2014). It also poses a constraint for biogas
installation and operation in some countries because biogas plants typically require water and
substrates such as manure to be mixed in an equal ratio (Parawira, 2009; Amigun et al, 2012;
Surendra et al, 2014). At least 60 L of water is required for a cow per day as well as an
additional 60 L/day to feed into the digester (Surendra et al, 2014).
Only a small percentage of the population in mountainous and African regions has consistent
access to sufficient water (Surendra et al, 2014). Sub‐Saharan countries such as Tanzania and
Botswana are classified as dry countries due to their arid climate therefore unsuitable domestic
biogas technology. Many parts of these countries are characterised by long periods of drought
between rainy seasons. According to the Department of Waters Affairs and Forestry (1997),
South Africa is classified as an arid country with rainfall less than the world average and very
unevenly distributed across the country
In 2001, the South African Government approved the free basic water (FBW) policy to provide 6
000 L of safe water per household per month (200 L per household per day) for a household of
8 people (Department of Waters and Forestry, 2007). Since the inception of the FBW policy, the
percentage of households with access to piped water or tap water in their dwellings, off‐site
(communal taps) or on‐site improved from 85% in 2002 to 90% in 2013 (Statistics South Africa,
© University of Pretoria

44
2013b). Although generally households’ access to water is improving, 4.2% of households still
had to fetch water from rivers, streams, stagnant water pools and dams, wells and springs in
2013 (Statistics South Africa, 2013b).
Greywater is often preferred over drinking water for mixing with organic waste even though it
is of inferior quality. According to Rodda et al (2010), greywater is untreated household effluent
from baths, showers, kitchen, hand wash basins and laundry (i.e. all non‐toilet uses).
Approximately 50 – 80% of indoor household water use is normally used for these purposes.
According to Carden et al (2007), the approximate volume of greywater produced per
household is 75% of the household water consumption. Carden et al (2007) assumed that 25%
of the non‐sewered households in South African have access to onsite water supply and that
they consume approximately twice the average amount of water than those that use off‐site
water (i.e. 200 L/household/day). Based on the number of non‐sewered households of
5 237 000 in 2004 and a 75% return factor (as greywater), it was estimated that over 500 000
m3 of greywater is generated daily in non‐sewered areas in South Africa. This amounts to 185
million m3 per annum (Carden et al, 2007). Statistics South Africa (2013a) reported 6 216 000
non‐sewered households in South Africa which translates to over 600 000 m3/day of greywater
generated in 2013. The increase of greywater generated from 2004 to 2013 can be attributed
to the increase in the number of households in South Africa from 11 425 000 and 15 107 000
respectively (Statistics South Africa, 2013a).
In China, biogas technology is used for the treatment or sanitization of greywater. In 1995,
biogas digesters in China cities handled 100 million m3 of greywater per year (Mengjie, 2002).
Josefsson (2009) and Ng’wandu et al (2009) have recommended the use of greywater in
domestic biogas digesters. Greywater contains nitrogen and phosphorus which can aid in
microbial growth in the biogas digester. The use of greywater from the kitchen is often
discouraged due to high levels of micro‐organisms, COD, oil, grease and detergents (Rodda et
al, 2010). The feeding of greywater contaminated with detergents or chemical cleaning
products will inhibit the microbiological processes of the biogas digester (Josefsson, 2009 &
Ng’wandu et al, 2009). Persistent chemical products (PCPs) used for cleaning purposes can also
© University of Pretoria
45
contaminate the bio‐slurry, rendering it inappropriate as fertilizer (Josefsson, 2009). It is
therefore recommended that kitchen greywater be separated from the greywater that is fed
into the domestic biogas digester or alternately biodegradable or environmental friendly
cleaning products be used in the kitchen.
2.5. Benefits of biogas technology
Beyond producing free, clean and renewable energy for developing countries through
anaerobic digestion of readily available biomass at household level such as kitchen waste,
animal waste and human waste, biogas technology offers the subsequent benefits.
2.5.1. Health benefits
Burning of solid fuels such as fuelwood, animal dung, agricultural residues and coal releases
smoke which contains toxic pollutants such as carbon monoxide, hydrocarbons and particulate
matter (Smith et al, 2005 as cited in Amigun et al, 2012; Surendra et al, 2014). Cooking is
usually performed indoors without proper ventilation thus resulting in severe health effects
associated with indoor smoke (Surendra et al, 2014). Evidence on solid fuel use and the burden
of diseases such as acute lower respiratory infections (ALRI) or pneumonia for children younger
than 5 years, chronic obstructive pulmonary disease (COPD), and lung cancer has been reported
in several developing countries (Desai et al, 2004; Surendra et al, 2014). Moreover, studies have
linked indoor air pollution (IAP) exposure to a variety of other health effects; such as asthma,
cataracts, tuberculosis and hypertension among others (Desai et al, 2004; Surendra et al, 2014).
Biogas improves health of the rural low‐income households by providing a cleaner cooking fuel
thus avoiding these health problems (Amigun et al, 2012). Women spend a lot of time in the
kitchen with children cradled on their backs therefore they are at high risk of these health
problems (Libsu et al, 2011).
Indoor air pollution from solid fuels accounted for 3.5 million (2.6 million to 4.4 million) deaths
and 4.3% (3.4–5.3) of global DALYs in 2010 (Lim et al, 2012). In 2012, the number of deaths
attributed to IAP had increased to 4.3 million globally, almost all in low and middle income
(LMI) countries. The South East Asian and Western Pacific regions bear most of the burden with
© University of Pretoria

46
1.69 and 1.62 million deaths, respectively. Almost 600 000 deaths occur in Africa, 200 000 in
the Eastern Mediterranean region, 99 000 in Europe and 81 000 in the Americas. The remaining
19 000 deaths occur in high income countries (WHO, 2012). Importantly, women and children
suffer the most from IAP because they are traditionally responsible for cooking and other
household chores which involve spending hours by the cooking fire, and prolonged exposure to
smoke (WHO, 2006).
In rural areas, infants are generally cradled in the back of their mothers who are doing the daily
gathering of fuel and cooking with exposes them to these harmful products. These pollutants
are the major causes of chronic bronchitis and lung diseases. A further concern related to IAP is
the level of toxic carbon monoxide released during combustion of biomass (Libsu et al, 2011).
Carbon monoxide combines with haemoglobin to form carboxyhaemoglobin (COHb) which
reduces the oxygen‐carrying capacity of blood. COHb has more severe effect on pregnant
women resulting in either foetal damage or low birth weight of infant (Libsu et al, 2011).
Often, the rural population are also faced with the lack of sanitation, resulting in water borne
diseases such diarrhoea, typhoid and cholera affecting mainly women and children. Rural
households which currently do have sanitation generally, use pit‐latrines, which have a serious
impact on groundwater pollution (Cawood & Simelane, 2004). Sanitation problems can be
solved by connecting toilets to biogas digesters thus using human excreta/sewage as feedstock.
The other health benefit is associated with the relief in abdominal pains attributed to reduced
workload on the women and children which are involved in the collecting and carrying of
fuelwood over long distances for cooking purposes (Amigun et al, 2012).
2.5.2. Biogas slurry as an organic fertilizer
In addition to fuel in form of biogas, anaerobic digestion (AD) produces an organic fertilizer in
the form of bio‐slurry or digestate as a by‐product which rich in nitrogen, potassium and
phosphorus. The spent digested slurry (digestate) exiting the biogas digester enhances physical,
chemical, and biological attributes of the soil as well as increases crop productivity when
applied to the land. Due to improved flow properties, the digestate can penetrate into the soil
© University of Pretoria

47
faster which reduces the risk for nitrogen losses in the form of ammonia (Surendra et al, 2014).
The digestate is also known to suppress soil borne pathogens by stimulating soil actinomycetes
which produce antibiotics (Surendra et al, 2014).
Fulford (1988: 29) reported that the chemical composition of bio‐slurry consists of 1.41%,
1.18% and 1.48% of nitrogen, phosphorus and potassium respectively. In general bio‐slurry
contains N2 (1.8%), P2O5 (1.0%), K2O (0.9%), Mn (188 ppm), Fe (3 550 ppm), Zn (144 ppm) and
Cu (28 ppm) (Surendra et al, 2014). A summary of the nutrient contents of the digestate
compared against other organic manure is included in Table 2‐11 below.
Table 2‐11: Nutrient content of important organic manure (Surendra et al, 2014)
Organic Manure Organic Matter (%) C:N N2 (%) P2O5 (%) K2O (%)
Farm yard manure 25‐55 15‐20 0.40‐0.80 0.60‐0.82 0.50‐0.65
Biogas slurry 60‐73 17‐23 1.50‐2.25 0.90‐1.20 0.80‐1.20
Vermicompost 9.80‐13.40 ‐ 0.51‐1.61 0.19‐1.02 0.15‐0.73
Human excreta contains higher amounts of plant nutrients than cow dung, therefore the
incorporation of human excreta as a feedstock can improve the overall nutrient qualities of the
slurry, and if treated properly, the slurry can be utilized in agriculture as a complete fertilizer
(Surendra et al, 2014). AD also results in a significant reduction of odours (up to 80%) of the
crude feedstock (Surendra et al, 2014) resulting in an odourless bio‐slurry that does not attract
flies (Fulford, 1988:40).
However, spent slurries’ derivation (in part) from animal and/or human excreta maybe of
concern particularly when dealing with the large‐scale loading, transportation, and distribution
of the slurry in remote, underprivileged regions. Pathogenic micro‐organisms (e.g. Salmonella,
Listeria, Escherichia coli, Campylobacter, Mycobacteria, Clostridia, and Yersinia) are known to
be naturally present in raw feedstock (Surendra et al, 2014). Although AD can significantly
reduce the aforementioned microbial pathogens, the digestate may still not be completely safe
to use as fertilizer; especially at short solids retention time under mesophilic temperatures
(Parawira, 2009; Bond & Templeton, 2011; Surendra et al, 2014). Therefore, to prevent public
© University of Pretoria

48
health risks, proper post‐treatment of bio‐slurry is required prior to application as a soil
amendment (Surendra et al, 2014).
2.5.3. Economic benefits
Economic benefits from biogas are the creation of jobs in the biogas sector and the funds that
can made through carbon credits. In Nepal, approximately 11 000 people are employed in the
biogas sector. Due to the installation of biogas digesters, the use of imported paraffin has been
reduced by 7.7 million liters per annum in Nepal thus resulting in savings of approximately
US$2.1 million per annum (Gautam et al, 2009).
As previously mentioned, along with the methane gas, biogas digester produces organic
fertilizer that is high in nitrogen, potassium and phosphorus contents (Gautam et al, 2009;
Surendra et al, 2014). This organic form of fertilizer can be used in farmlands as an alternative
to chemical fertilizers. Chemical fertilizers are usually imported in Nepal (Gautam et al, 2009). It
has been estimated that there is an annual saving of 4 329 tons nitrogen, 2 109 tons
phosphorous and 4 329 kg potassium due to the installation of biogas digesters in Nepal
(Gautam et al, 2009). This translates into an annual saving of almost US$ 300 000 (Gautam et al,
2009). Garfí et al (2012) reported approximately 1.5% savings of household annual income from
substituting compost with bio‐slurry as fertilizer in rural Andean communities.
An article in the Nepal Times pointed out that the Nepal’s successful biogas program brought
farmers a clean fuel, conserved forests and provided high quality fertilizer for crops. Moreover,
Nepal also benefits in terms of hard cash (in the form of carbon revenues) received from the
industrialized nations for the burning of biomass to release greenhouse gas emissions into the
atmosphere (Libsu et al, 2011).
2.5.4. Social development
Social development is closely related to the reduced workload from the women and children
and also the availability of clean energy in a household. In the majority of developing countries,
women and children are responsible for fuelwood and dung collection which are both time
© University of Pretoria
49
consuming and exhausting tasks. For example, women and children in some places travel more
than 5 km and spend nearly 6 hours a day gathering biomass and cooking food (Surendra et al,
2014). The time spent collecting solid fuels imposes opportunity costs that constrain socio‐
economic development (Garfí et al, 2012). According to Garfí et al, biogas digester installations
in rural Andean communities reduced the time spent for collecting solid fuels by 50% and
envisaged that 80 ‐ 90% time spent collecting solid fuels can be reduced in regions where
digesters are operated in mesophilic conditions. A survey reported by Surendra et al (2014)
showed that a third of the time spent collecting solid fuels is saved through biogas installation.
In addition to IAP, the labour is hard and can lead to back‐and neck‐pain as well as other
physical ailments (Surendra et al, 2014).
Due to the significant demands on time and labour, women and children are deprived of
opportunities for education, recreational activities and other income‐generating activities (Garfí
et al, 2012; Surendra et al, 2014). In rural areas where there is no electricity supply, the use of
biogas as a source of light has enabled women to engage in evening study, has made easier
literacy classes and other home and community activities (Libsu et al, 2011). Thus the
installation of biogas plants at the household level can directly provide increased and better
opportunities for gender equality in rural areas of developing nations; the long‐term social
benefits of which may be significant (Surendra et al, 2014).
2.5.5. Greenhouse gas emissions reduction
Domestic use of conventional fossil fuels such as wood, coal, and paraffin in inefficient stoves to
meet energy demands contribute towards greenhouse gas emissions. Biogas helps to reduce
greenhouse gas emissions by displacing the consumption of fuelwood and paraffin (Dioha et al,
2012; Garfí et al, 2012). The biogas is assumed to be produced on a sustainable basis, and
therefore CO2 associated with biogas combustion is reabsorbed in the process of the growth of
the fodder and foodstuffs (Dioha et al, 2012).
Uncontrolled decomposition of each metric tonne of solid waste could potentially release 50‐
110 m3 CO2 and 90‐40 m3 CH4 into the atmosphere, contributing to global warming (Parawira,
© University of Pretoria

50
2009). According to Bond and Templeton (2011), biogas technology could potentially reduce
global anthropogenic methane emissions by around 4%. Burning of biogas does produce a
greenhouse gas in the form of CO2 which has a global warming potential (GWP) that is over 20
times less than that of CH4.
Biogas technology does not only contribute to controlling environmental pollution and recycling
of nutrients but alleviates dependence on imported fossil fuels. In the South African context,
utilization of biogas to meet energy demands of low income households can assist in reducing
pressure to the national power grid.
2.5.6. Reduced deforestation
The most significant implication of high dependency on fuelwood for fuel especially in
developing countries is its association to deforestation. Fuelwood accounts for 54% of forest
loss in developing countries (Amigun et al, 2012; Garfí et al, 2012; Surendra et al, 2014). Global
deforestation is responsible for 17–25% of all anthropogenic GHG emissions, making it one of
the leading causes of increased GHG emissions (Surendra et al, 2014). In Nepal, the installation
of biogas plants has helped protect the forest (Gautam et al, 2009). For instance, there is an
annual saving of 2 tons of fuelwood per household that has installed a biogas plant (Gautam et
al, 2009). Garfí et al (2012) reported 50% higher annual fuelwood savings in Nepal of 3 tons per
household. This means that there is a nationwide saving of more than 200 000 tons of fuelwood
per annum (Gautam et al, 2009).
Deforestation is a contributor to soil erosion resulting in vulnerability to the effects of droughts
and floods. As the degree of deforestation increases, so does the amount of time spent
searching for fuelwood due to its scarcity. Therefore the use of biogas reduces the dependency
of rural communities on fuelwood thereby reducing deforestation, soil erosion and burden to
women and children.
© University of Pretoria

51
2.6. Renewable Energy Policy in South Africa: the biogas technology context
In 2000, the estimated energy contribution from renewable energy sources was 115 278
GWh/annum (mainly from fuelwood and waste) which had come about largely as a result of
poverty (e.g. fuelwood and animal waste used for cooking and heating) (Department of
Minerals and Energy, 2003).
According to the White Paper on Renewable Energy of 2003, the Government set a medium‐
term (10‐year) target of 10 000 GWh renewable energy contribution to final energy
consumption by 2013 (i.e. a 1 000 GWh/annum increase), to be produced mainly from biomass,
wind, solar and small‐scale hydro (Department of Minerals and Energy, 2003). The renewable
energy is to be utilised for power generation and non‐electric technologies such as solar water
heating and bio‐fuels (Department of Minerals and Energy, 2003). This is approximately 3% (1
141 MW) of the projected electricity demand for 2013 (41 539 MW) which is almost equivalent
to replacing two (2 x 600 MW) units of Eskom's combined coal fired power stations
(Department of Minerals and Energy, 2003).
In 2010, the total South African generating capacity was estimated at 46 993 MW with 17%
contributed by renewable energy sources (hydro, wind and solar) and the envisaged energy
generating capacity by 2030 is 89 532 MW with 30% from renewable energy. According to the
White Paper on Renewable Energy of 2003, a potential exists to utilise manure from cattle, pig
and poultry farms. The potential energy that can be harvested from animal manure in South
African farms is shown in Table 2‐12 below:
Table 2‐12: Potential energy from livestock manure and litter (Department of Minerals and
Energy, 2003)
Type Energy Production (GWh/year)
Cattle 3 889
Pigs 306
Poultry 1 417
© University of Pretoria

52
2.7. Conclusion
In terms of achieving the research objectives, it can be concluded that the literature review
partially answers the question on the availability of animal waste. Literature only specifies the
amount of power that can be produced by taking advantage of the available animal waste
(cattle, pigs and poultry) not for feeding a domestic biogas digester. This confirms the findings
by Hennekens (2012) that in South Africa energy equals electricity.
The availability of organic waste (animal, human and food) in South African households for
feeding a domestic biogas digester is not explored in the literature review which is addressed in
this study. The literature reviewed does not quantify the number of households that can
benefit from biogas digester installations fed with animal, human and food waste which is
addressed in this study.
One of the remaining gaps from literature that is addressed by this present study, is the energy
requirements by an average sized household in South Africa and hence biogas requirements to
substitute the conventional domestic fuels. Literature reviewed only specifies biogas
requirements as per application of biogas technology in China and India. In the literature, the
reduction in the burden of diseases and mortalities due to the substitution of conventional
domestic fuels with biogas is not specified but addressed in the study.
© University of Pretoria
53
CHAPTER 3: Methodology
The methodology discussed in this chapter was followed in order to answer the following
research questions:
(i). What is the energy demand for cooking derived from fuelwood by low‐income
South African households?
(ii). What is the total energy demand by low‐income South African households for all
household applications such as cooking, water heating, space heating and lighting?
(iii). What is the equivalent biogas requirement for meeting the energy demand for
cooking and the total energy demand for all household applications?
(iv). Is 800 – 1 600 or 1 500 – 2 400 L/day of biogas reported by Ghimire (2013) and
Bond and Templeton (2011) respectively sufficient to meet the energy demand for
cooking for an average sized South African household of 4‐5 members?
(v). What are the energy and costs savings that can be incurred by low‐income South
African households from installations of domestic biogas digesters.
(vi). What are the health benefits (improvements in burden of disease) due to reduced
indoor smoke from solid fuels?
(vii). Is a South African household producing sufficient organic waste (kitchen/food
waste, animal waste and human excreta) to be used as feedstock to the biogas
digester for daily biogas production? What is the corresponding water demand for
each feedstock?
(viii). How many households in South Africa that can potentially benefit from domestic
biogas digester installations fed with animal waste (cattle, pigs and chickens)?
(ix). Is it feasible to operate a domestic biogas digester fed with food waste and human
waste? Are South African households producing sufficient food waste for feeding a
biogas digester? Is the average household size in South Africa sufficient to produce
the required human waste?
(x). Is it feasible to operate a biogas digester co‐fed with a 1:1 mixture of cattle dung
and human excreta and a 1:1 mixture of kitchen/food waste and human excreta?
© University of Pretoria

54
(xi). Do South African households have access to sufficient water supply for daily
feeding of domestic biogas digesters?
3.1. Research design
3.1.1. Energy demand by low‐income households
The energy demand of an average sized family in South Africa was calculated using daily
fuelwood consumption by a South African household which was obtained from Damm & Triebel
(2008). The energy demand was calculated using Equation 5 below. The efficiency and calorific
value of fuelwood used in the calculations were 13% and 17 MJ/kg respectively.
3.1.2. Biogas requirements for substitution of fuelwood used for cooking
The energy demand calculated in Section 3.1.1 above was used to calculate the biogas
requirements for replacing fuelwood used for cooking using Equation 5. The biogas
requirement was compared against the 800 ‐ 1 600 and 1 500 – 2 400 L of biogas per day per
household required for cooking reported by Ghimire (2013) and Bond and Templeton (2011)
respectively. The efficiency and calorific value of biogas used in the calculations were 55% and
20 MJ/m3 respectively.
ηCmQ v Equation 5
Where,
Q = Energy demand (MJ/day),
m = Fuel demand (kg/day or L/day)
vC = Calorific value of fuel (MJ/kg or MJ/m3), and
η = Fuel thermal efficiency.
3.1.3. Biogas requirements for complete substitution of conventional domestic fuels
The amount of biogas required for complete substitution of the conventional domestic fuels
was also calculated using Equation 5 based on the calculated total energy demand by low‐
© University of Pretoria

55
income households in South Africa obtained from Damm & Triebel (2008). The efficiency and
calorific value of biogas used in the calculations were also 55% and 20 MJ/m3 respectively.
3.1.4. Energy and costs savings
The percentage fuelwood savings is the amount of fuelwood saved due to the installation of
domestic biogas digesters to produce sufficient biogas for cooking and for complete
substitution of conventional fuels. The cost savings incurred by households from using biogas
were calculated using the net direct cost of the fuelwood reported by Damm & Triebel (2008)
and the percentage fuelwood savings. The percentage of the income saved was calculated
based on the cost savings from firewood substitution and the upper band of the income range
for low income households. The income bracket of R 0 – R9 600 reported in ERC (2004) as cited
in Damm & Triebel (2008) is based on Census 2001. The net direct cost of fuelwood and the
upper band of the income bracket was inflated to current times using equation 6 below:
1
2
1
2
CPICPI
PricePrice
Equation 6
Where 2Price is the current item price, 1Price is the base price, 2CPI is the current consumer
price index and 1CPI base year consumer price index.
3.1.5. Reduction in burden of diseases
The attributable DALYs lost and mortalities avoided due the substitution of fuelwood use with
biogas were calculated based on the attributable DALYs lost and mortalities from indoor smoke
due to solid fuel use in Africa obtained from WHO (2002). The solid fuel mix used in South
Africa was obtained from Statistics SA (2013b) to calculate the attributable DALYs lost and
mortalities avoided from indoor smoke from fuelwood use.
3.1.6. Feedstock availability for feeding a domestic biogas digester
The properties of the various feedstocks for biogas digesters accessible to South African
households were evaluated from different literature sources and tabulated in Table 2‐6. The
© University of Pretoria
56
number of animals and the amount of animal waste required for feeding the digester to
produce enough biogas for partial and complete substitution of conventional domestic fuels
were calculated using Equation 7 and Equation 8 below respectively. The same methodology
was followed when calculating the number of people and human waste required for feeding an
average sized domestic biogas digester. The availability of animal waste in South Africa was
evaluated based on the number of livestock kept in South African households reported by
Statistics SA (2011). The availability of human waste was evaluated based on the average size of
a South African household as reported in Statistic SA (2013b). The evaluation of food waste
availability was based on the average food waste generated by South African households as
reported by the Department of Environmental Affairs (2012).
y ︶/animal.da︵mYieldBiogas/day ︶︵mtRequiremenBiogasanimalsofNumber 3
3
Equation 7
animalsofNumber ︶︵kg/animalProduction Daily= tRequiremen Waste Equation 8
The amount of water required for mixing with waste was calculated using Equation 9 below.
The % DM for the various feedstocks used in calculations were obtained from Table 2‐6 and %
DM(new) is the optimum percentage dry matter of 8% for feeding a digester as recommended by
Yadvika et al (2004). Feed is the waste requirement calculated using Equation 8.
Feed%DM
Feed%DMaddedWaternew
old
Equation 9
3.1.7. Number of households that can potentially benefit from digester installations
The number of households that can potentially benefit from domestic biogas digester
installations were evaluated based on the calculated number of animals required compared to
the available number of animals in low‐income households. For human waste, the feasibility of
domestic biogas technology was evaluated by comparing the calculated number of people
required against the average size of a South African household. The feasibility of operating a
biogas digester fed solely with food waste was evaluated by comparing the calculated food
waste required against the average food waste generated by a South African household. The
© University of Pretoria

57
feasibility of the options of co‐digesting a 1:1 mixture of cattle dung and sewage and a 1:1
mixture of human waste and food waste were also explored using the above mentioned
principles.
3.1.8. Water availability for feeding a domestic biogas digester
The availability of water at household level for feeding a domestic biogas digester was
evaluated by comparing water consumption by non‐sewered South African households with
access to water supply on‐site or off‐site and greywater generated by these households against
the water requirements of the various feedstocks.
3.2. Data collection
In order to achieve the research objectives, the following data were collected from various
literature sources:
i. Thermal efficiencies (%) and calorific values (MJ/kg or MJ/m3) for conventional domestic
fuels and biogas were obtained from different literature sources as discussed in Section
2.2.1.
ii. Fuelwood consumption in (tons/annum/household) by low‐income households was
obtained from Damm & Triebel (2008).
iii. The energy mix in low income South African households was obtained from Statistics SA
(2013b).
iv. The economic value of firewood in (R/household/annum) was obtained from Damm &
Triebel (2008).
v. The number of attributable DALYs and mortalities due to indoor smoke from solid fuels
were obtained from WHO (2002).
vi. The properties of the various feedstocks such as biogas yields and % DM were obtained
from Bond & Templeton (2011) and Fulford (1988:35)
vii. The South African population numbers and the average size of a South African
household were obtained from Statistics SA (2013b).
© University of Pretoria
58
viii. Household livestock numbers and the number of households involved in livestock
production from Statistics SA (2011).
ix. Available water resource in the form of free basic water supply and greywater
generated by low‐income households were obtained from Department of Waters and
Forestry (2007) and Rodda et al (2010) respectively.
3.3. Data analysis
A comparative study of the following was conducted:
i. The calculated biogas requirement by low‐income households for cooking against the
800 – 1 600 and 1 500 – 2400 L/day/household that were reported by Ghimire (2013)
and Bond and Templeton (2011) respectively.
ii. The calculated fuelwood savings from substituting conventional domestic fuels with
biogas in low‐income South African households against the 74% and 84% reported by
Bond & Templeton (2011) for China and the Southern province of Sri Lanka respectively.
iii. The calculated number of animals (cattle, pigs and chickens) required per household
against the number of animals per agricultural household.
iv. The calculated number of people to produce enough human waste against the average
number of people per household in South Africa as reported by Statistic SA (2013b). The
calculated number of people is then used to deduce the number of households required
for feeding a community digester. This was also conducted for the co‐digestion of 1:1
mixture of cattle dung with human waste.
v. The calculated amount of food waste required against the amount of food waste
generated by a low‐income South African household as reported by the Department of
Environmental Affairs (2012). This was also conducted for the co‐digestion of 1:1
mixture of human waste with kitchen waste.
vi. The calculated water demand for each feedstock against each other and against the
water supply in form of FBW and greywater generated by households.
© University of Pretoria

59
CHAPTER 4: Results and Discussion
4.1. Energy demand by low‐income households
Based on the average annual household fuelwood consumption of 4.5 tons per annum
discussed in Section 2.2, the energy demand from fuelwood and the total energy demand for
an average sized family (5‐6 members) were calculated as shown in Appendix A.1.1 to be
approximately 27 MJ and 68 MJ per day per household. The calculations were based on
fuelwood efficiency and a calorific value of 13% for open fires and 17 MJ/kg respectively as
discussed in Section 2.2.1.
4.2. Biogas requirements for substitution of firewood used for cooking
The amount of biogas required for the substitution of fuelwood used for cooking was calculated
as shown in Appendix A.1.2 to be approximately 2 500 L/day/household. This is in line with the
biogas requirement for cooking of 1 500 – 2 400 L of biogas per day per household as reported
by Bond and Templeton (2011). The calculations were based on biogas efficiency and calorific
value of 55% and 20 MJ/m3 respectively. Based on these calculations it can be deduced that 800
– 1 600 L/day produced from a 4 m3 biogas digester reported by Ghimire (2013) is insufficient
to meet the energy demand for cooking in an average sized low‐income household in South
African context. The following linear relationship between the biogas requirement for cooking
and the efficiency of fuelwood being replaced has been developed and represented by
Equation 10 below:
η05419B c Equation 10
Where, cB (L/day/household) is the biogas requirement for cooking and η (%) is the efficiency
of the fuelwood being replaced.
© University of Pretoria
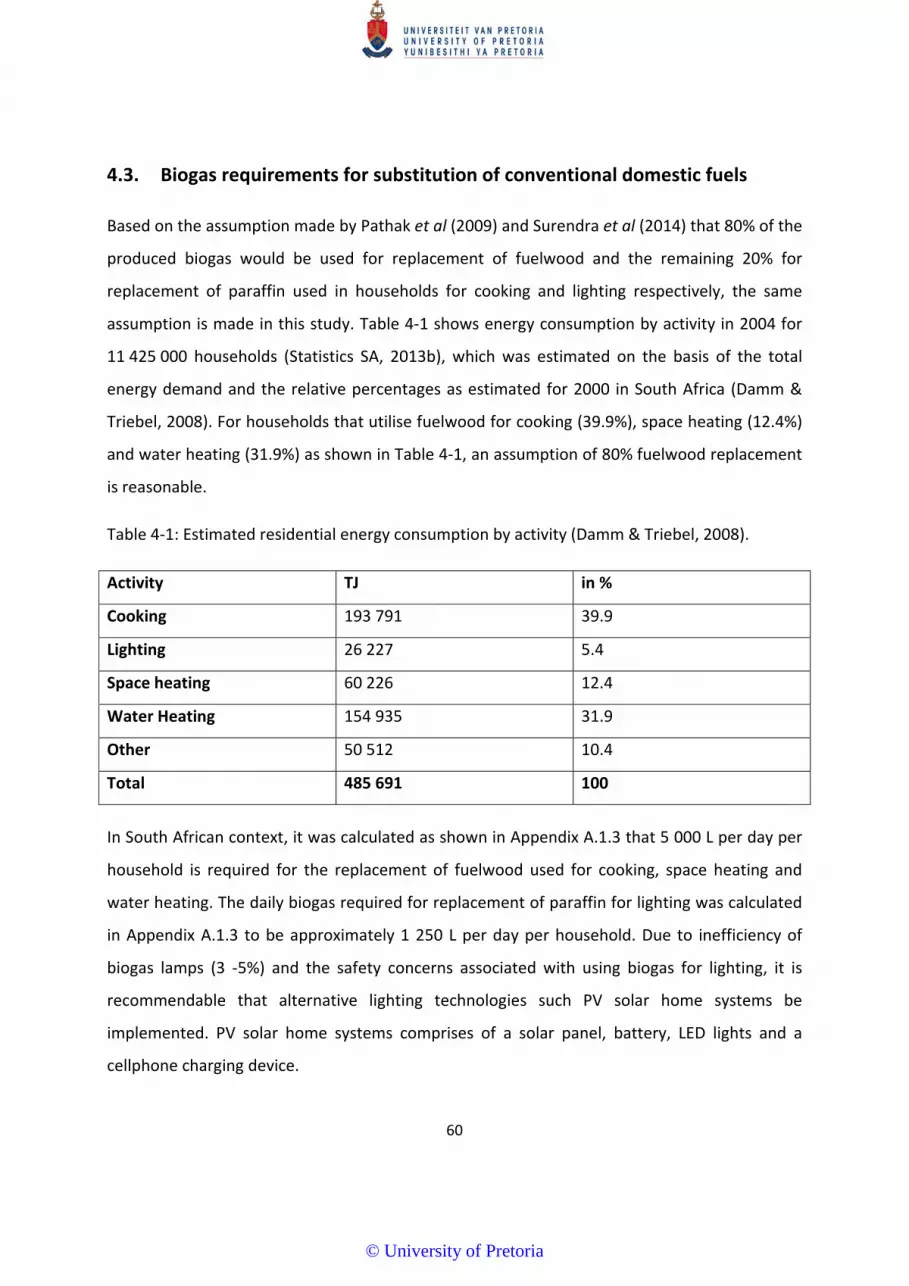
60
4.3. Biogas requirements for substitution of conventional domestic fuels
Based on the assumption made by Pathak et al (2009) and Surendra et al (2014) that 80% of the
produced biogas would be used for replacement of fuelwood and the remaining 20% for
replacement of paraffin used in households for cooking and lighting respectively, the same
assumption is made in this study. Table 4‐1 shows energy consumption by activity in 2004 for
11 425 000 households (Statistics SA, 2013b), which was estimated on the basis of the total
energy demand and the relative percentages as estimated for 2000 in South Africa (Damm &
Triebel, 2008). For households that utilise fuelwood for cooking (39.9%), space heating (12.4%)
and water heating (31.9%) as shown in Table 4‐1, an assumption of 80% fuelwood replacement
is reasonable.
Table 4‐1: Estimated residential energy consumption by activity (Damm & Triebel, 2008).
Activity TJ in %
Cooking 193 791 39.9
Lighting 26 227 5.4
Space heating 60 226 12.4
Water Heating 154 935 31.9
Other 50 512 10.4
Total 485 691 100
In South African context, it was calculated as shown in Appendix A.1.3 that 5 000 L per day per
household is required for the replacement of fuelwood used for cooking, space heating and
water heating. The daily biogas required for replacement of paraffin for lighting was calculated
in Appendix A.1.3 to be approximately 1 250 L per day per household. Due to inefficiency of
biogas lamps (3 ‐5%) and the safety concerns associated with using biogas for lighting, it is
recommendable that alternative lighting technologies such PV solar home systems be
implemented. PV solar home systems comprises of a solar panel, battery, LED lights and a
cellphone charging device.
© University of Pretoria

61
The total daily biogas requirement for complete substitution of conventional domestic fuels is
therefore estimated at 6 250 L/day/household. The following linear relationship between the
biogas requirement for complete substitution of conventional domestic fuels and fuelwood
efficiency has been developed and represented by Equation 11 below:
η63447BT Equation 11
Where, TB (L/day/household) is the total biogas requirement for substitution of conventional
domestic fuels and η (%) is the efficiency of the fuelwood. It is worth noting that Equation 10
and 11 are only applicable to the conditions set out in this study and were formulated to
accommodate the variation in fuelwood efficiency from different cooking stoves.
4.4. Energy savings from biogas substitution of conventional domestic fuels
Installation of a 2 500 L/day capacity biogas digester per household will result in 50% reduction
in the total household fuelwood use (100% fuelwood used for cooking) whereas a 5 000 L/day
capacity digester would result in 100% reduction in the total household fuelwood use. This is
comparable to the 74% reduction in household usage of fuelwood in China (Remais et al, 2009
as cited in Bond & Templeton, 2011). It is also in line with a survey conducted by de Alwis
(2002) as cited in Bond & Templeton (2011) in the Southern province of Sri Lanka which found
that the introduction of biogas for cooking resulted in an 84% reduction in fuelwood
consumption.
4.5. Cost savings from biogas substitution of conventional domestic fuels
As previously mentioned, the net direct‐use value of fuelwood is R1 250 per household per
annum as reported by Damm and Triebel (2008). The adjusted net direct‐use value of fuelwood
due to inflation was calculated in Appendix A.1.4 to be R1 808 using the yearly average CPI for
2008 and 2015 of 79.3 and 114.7 respectively as reported in Statistics South Africa (2016).
Therefore, the estimated cost savings based on the 50% reduction of the total fuelwood use
from installing a 2 500 L/day capacity biogas digester per household was calculated to be R904
per household per annum. The upper band in the income range for low‐income households was
R9 600 per annum according to Census 2001 as reported by Damm and Triebel (2008). The
© University of Pretoria

62
adjusted income due to inflation is calculated in Appendix A.1.4 to be R21 013 per annum using
the yearly average CPI for 2001 and 2015 of 52.4 and 114.7 respectively as reported in Statistics
South Africa (2016). It can therefore be deduced that 4.3% of income in low‐income households
can be saved by substituting fuelwood used for cooking with biogas. Complete substitution of
fuelwood as an energy source would result in 8.6% savings of household income. According to
Statistics South Africa (2013a), the number of households that still relied on fuelwood as the
main source of energy for cooking was approximately 1.581 million (10.5% of the total number
of households) in 2013. Therefore the estimated gross national cost savings was calculated to
be close to R1.5 billion per annum. As previously mentioned there are 2.3 ‐2.8 million
households that still rely on fuelwood as the main source of energy, therefore complete
substitution of fuelwood with biogas can result in cost savings of R4 – 5 billion per annum.
4.6. Reduction in burden of diseases
The estimated DALYs lost and mortalities in South Africa due to indoor smoke from solid fuels in
2001 were calculated as shown in Appendix A.1.5 to be 822 940 and 26 189 respectively (WHO,
2002). According to Desai, Mehta and Smith (2004), the burden of disease from solid fuel use
(SFU) in India was 11 million DALYs lost and 360 000 deaths. The difference between these two
developing countries is attributed to the greater number of households in India of 152 million
with 81% relying on solid fuels whereas 23% of the 11 million households in South Africa relied
on solid fuels in 2002 (Desai et al, 2004). Based on the estimate by WHO (2002) that indoor
smoke from solid fuels causes about 35.7% of ALRI, 22.0% of COPD and 1.5% of trachea,
bronchus and lung cancer, the DALYs lost and mortalities per cause are shown in Table 4‐2
below:
Table 4‐2: Attributable DALYs lost and mortalities per cause
ALRI COPD Trachea, bronchus
and lung cancer
TB, cataracts and
asthma etc. Total
DALYs 293 790 181 047 12 344 335 760 822 940
Mortalities 9 349 5 761 393 10 685 26 189
© University of Pretoria

63
According to Statistics South Africa (2013b), solid fuel use (SFU) for cooking in South African
households in 2002 comprised of 1.3%, 13.3% and 85.4% of animal dung, coal and fuelwood
respectively. Table 4‐3 shows the attributable DALYs lost and mortalities per cause or exposure
outcome due to indoor smoke from fuelwood use:
Table 4‐3: Attributable DALYs and mortalities per cause due to fuelwood use
ALRI COPD
Trachea,
bronchus and
lung cancer
TB, cataracts and
asthma etc. Total
DALYs 250 897 154 614 10 542 286 739 702 792
Mortalities 7 984 4 920 336 9 125 22 365
Due to the increased numbers of households with access to electricity in South Arica, the
percentage of solid fuel use for cooking dropped from 22.6% in 2002 to 12.6% in 2012
(Statistics South Africa, 2013). Though SFU* has dropped by more than 44%, the solid fuel mix in
South African households is still dominated by fuelwood (92% in 2012). Substitution of 50% of
total fuelwood use (100% of fuelwood used for cooking) by 2 500 L of biogas per day per
household will result in attributable DALYs lost and mortalities avoided as shown in Table 4‐4
below:
Table 4‐4 Attributable DALYs and mortalities avoided per cause due to fuelwood substitution
ALRI COPD
Trachea,
bronchus and
lung cancer
TB, cataracts and
asthma etc. Total
DALYs 125 449 77 307 5 271 143 370 351 397
Mortalities 3 992 2 460 168 4 563 11 183
It can therefore be deduced that 50% fuelwood substitution with biogas will result in 43% of
total attributable DALYs lost and mortalities from indoor smoke due to SFU avoided. Complete
* In this work SFU is defined as: household combustion of solid fuels such as animal dung, coal and fuelwood
© University of Pretoria

64
substitution of fuelwood with biogas will result in 85.4% of total attributable DALYs lost and
mortalities from indoor smoke due to SFU avoided.
4.7. Availability of feedstocks
4.6.1. Animal and human waste
The calculated amount of waste and water (as shown in Appendix A.1.6) required for feeding a
2 500, 5 000 and 6 250 L/day capacity biogas digester are shown in Figure 4‐1 below. The ratio
of cow dung to water required for daily feeding of a domestic biogas digester was calculated to
be 1:1 which concurs with Bond & Templeton (2011) and Smith (2011) regarding equal amount
of water to be added simultaneously if cow dung is used as feedstock to a digester. Food waste
gave the least waste to water ratio of 0.31:1 which is attributed to the higher %DM of 48% thus
requiring more water for dilution to 8% DM.
Figure 4‐1: Quantification of feedstocks
6440
2032
1334
19
128
78
4063
27
68
38
160
98
5078
33
85
47
64
4543
4743
4345
128
88
8594
86
8590
160
110
106
117
108
107
112
0
50
100
150
200
250
300
350
Cattle Waste
Pig W
aste
Chicken W
aste
Human
Waste
Food W
aste
1:1 Cattle & Human
Waste
1:1 Food & Human
Waste
Cattle Waste
Pig W
aste
Chicken W
aste
Human
Waste
Food W
aste
1:1 Cattle & Human
Waste
1:1 Food & Human
Waste
Cattle Waste
Pig W
aste
Chicken W
aste
Human
Waste
Food W
aste
1:1 Cattle & Human
Waste
1:1 Food & Human
Waste
2 500 L/day biogas digester 5 000 L/day biogas digester 6 250 L/day biogas digester
Waste (kg/day/biodigester)
Water (L/day/biodigester)
Waste (kg/day/biodigester) Water (L/day/biodigester)
© University of Pretoria

65
The number of animals (cattle, pigs and chickens) and people required per household to
produce enough waste for feeding a 2 500, 5 000 and 6 250 L/day capacity biogas digester were
calculated in Appendix A.1.6 and are shown in Figure 4‐2 below. According to Bembridge &
Tapson (1993) cited in Gaudex (2014), in Southern Africa, 68% of communal farmers own fewer
than ten cattle, with an average of six cattle per household. According to Table 4‐5, 78% of
agricultural households own ten or fewer cattle. According to Figure 4‐2 below, 8, 15 and 20
cows are required for feeding a 2 500, 5 000 and 6 250 L/day capacity biogas digester
respectively. The number of cows (8) required for feeding a 2 500 L/day capacity biogas
digester is double the number reported by Hennekens (2012) of a minimum of 4 cows to feed a
domestic biogas digester, in order to provide enough biogas for a family to cook on. Thus using
Table 4‐5, it can be deduced that approximately 613 662 South African households can
potentially benefit from 2 500 L/day capacity biogas digesters installations fed with cattle dung.
Using Table 4‐5, the number of households that can potentially benefit from installations of a
5 000 or a 6 250 L/day capacity biogas digesters fed with cattle waste can be estimated at
131 391 (117 934 + 13 457).
Figure 4‐2: The number of animals and people required
8 20
250
63
1639
500
125
2049
625
156
0
100
200
300
400
500
600
700
Cattle Pigs Chicken People Cattle Pigs Chicken People Cattle Pigs Chicken People
2 500 L/day biogas digester 5 000 L/day biogas digester 6 250 L/day biogas digester
Number/household
© University of Pretoria

66
The number of pigs required to produce enough waste to feed 2 500, 5 000 and 6 250 L/day
capacity biogas digesters is 20, 39 and 49 respectively (see Figure 4‐2 above). Thus from Table
4‐5 it can be deduced that 89% (100 589/112 678) of the total number of households that own
pigs cannot benefit from domestic biogas digesters fed with pig waste due to insufficient
number of pigs. Only 12 089 households can potentially benefit from a 2 500 or a 5 000 or a
6 250 L/day capacity biogas digester fed with pigs waste.
Table 4‐5: Number of households involved in livestock production (Statistics SA, 2011)
Livestock 1‐10 11‐100 +100 Total
Cattle 482 270 117 934 13 457 613 662
Pigs 100 589 9 716 2 373 112 678
The number of households involved in poultry production was estimated at 1.4 million as per
report by Statistics South Africa (2011). The total number of chickens in South African
households reported by Statistics South Africa (2010) was 22.8 million. Therefore the number of
chickens per household (involved in poultry production) can be estimated at 16. Based on the
number of chickens required (see Figure 4‐2 above), it can be deduced that it is not feasible to
operate a biogas digester fed with solely chicken waste at household level in South Africa.
Therefore a chicken farm is recommended for such an application.
According to Statistics SA (2013a), the South African population was estimated at 53 million and
the number of households at 15.1 million therefore it can be estimated that there are four
people per household Based on the number of people required (see Figure 4‐2 above), it can be
deduced that the size of an average South African household is not sufficient to produce
enough human excreta for feeding a 2 500, 5 000 and 6 250 L/day capacity biogas digester.
Therefore a community digester used by 15, 30 and 39 households is recommended for feeding
a 2 500, 5 000 and 6 250 L/day capacity biogas digesters respectively.
4.6.2. Kitchen/Food waste
The solids concentration (as % DM) and biogas yield (m3 biogas/kg DM) for food waste was
calculated in Appendix A.1.5.5 to be 34% and 0.55 m3/kg DM. The calculated daily food waste
© University of Pretoria

67
requirements per household for feeding a 2 500, 5 000 and 6 250 L/day capacity biogas digester
were calculated to be approximately 13 kg, 27 kg and 33 kg respectively (Figure 4‐1 above).
The estimated quantities of household food waste generated in South Africa per income group
are indicated in Table 4‐6 below. The total food waste generated in South African households is
estimated at 1.44 million tons per annum as shown in Table 4‐6. The number of households in
South Africa in 2012 was estimated at 14.6 million (Statistics South Africa, 2013a). Therefore
the average food waste generated can be estimated at 270 g per day per household. Thus it can
be deduced that a South African household does not generate enough food waste to feed a 2
500, 5 000 and 6 250 L/day capacity biogas digester. This is in agreement with one of
Hennekens’ (2012) interviewees who asserted that the amount of food waste generated by
households is insufficient for feeding a domestic biogas digester.
Table 4‐6: Quantities of household food waste generated annually in South Africa (Department
of Environmental Affairs, 2012a).
Income Level Domestic waste
(tonnes/annum) Food waste (%)
Food waste
(tonnes/annum)
Low 5 600 116 18.08 1 012 688
Middle 2 929 639 10.98 321 577
High 1 093 352 9.56 104 713
Total 9 623 106 1 438 977
4.6.3. Co‐digestion
Co‐digestion of a 1:1 mixture of cattle dung and human waste is not feasible in South African
context. The number of people required per household (see Figure 4‐3 below) to produce
enough waste is higher than the average size (4 members) of a South African household. The
majority of households that own cattle are in rural areas (Statistics SA, 2011). Co‐digestion of
cattle dung and human waste in a community digester is also not feasible for either rural or
peri‐urban areas due to the unavailability of cattle dung in peri‐urban areas and the segregated
nature of rural households.
© University of Pretoria

68
Figure 4‐3: Co‐digestion of a 1:1 mixture of cattle and human waste
Co‐digestion of a 1:1 mixture of kitchen waste and human waste requires a household with at
least 19, 38 and 47 people and food waste of 9.5, 19 and 23.5 kg/day (see Figure 4‐1) for
feeding a 2 500, 5 000 and 6 250 L/day capacity biogas digester respectively. Based on the
average amount of food waste generated by a South African household of 270 g per day and
the average size of 4 members, it can therefore be deduced that there is insufficient waste
(kitchen waste and human excreta) for feeding the digesters at household level. A community
digester in a peri‐urban area or informal settlement is a feasible option due to the availability of
both food and human waste.
4.6.4. Water Availability
The water requirement per feedstock as compared against the water consumption by non‐
sewered South African households with access to on‐site and off‐site water supply is shown in
2
34
4
68
5
85
0
10
20
30
40
50
60
70
80
90
Cattle Human Cattle Human Cattle Human
2 500 L/day biogas digester 5 000 L/day biogas digester 6 250 L/day biogas digester
Number/household
© University of Pretoria

69
Figure 4‐4 and Figure 4‐5 respectively. Cattle waste has the highest water demand of all the
feedstocks and this attributed to the higher amount of cattle waste required compared to the
other types of feedstocks.
It can be deduced that the installation of a 2 500, 5 000 and 6 250 L/day capacity domestic
biogas digester in non‐sewered households with access to on‐site water supply will result in the
consumption of approximately 24%, 47% and 60% respectively of the water consumption
(equivalent to FBW) for feeding the digester. Alternatively, the installation of a 2 500, 5 000 and
6 250 L/day capacity domestic biogas digester in non‐sewered households with access to on‐
site water supply will result the handling of approximately 31%, 62% and 78% of the total
greywater generated by households respectively by feeding the digester.
In terms of non‐sewered households with access to off‐site water supply, the installation of a 2
500, 5 000 and 6 250 L/day capacity domestic biogas digester will result in consumption of 45%,
89% and 112% respectively of the total water consumption. Alternatively, the installation of a 2
500, 5 000 and 6 250 L/day capacity domestic biogas digester will result in the handling of 60%,
119% and 149% respectively of the total greywater generated by non‐sewered households with
access to off‐site water supply.
It can be deduced that non‐sewered households with access to on‐site water supply generates
sufficient greywater for feeding a domestic biogas digester therefore recommended over
drinking water. Non‐sewered households with access to off‐site water supply generate
insufficient greywater for feeding biogas digesters of 5 000 L/day and 6 250 L/day capacity. It is
therefore recommended that in non‐sewered households with access to off‐site water supply
greywater be augmented by harvested storm water or water from nearby rivers, dams and
streams. This will ensure that drinking water is not used for feeding a biogas digester.
© University of Pretoria

70
Figure 4‐4: Water demand per feedstock for non‐sewered households with access to on‐site water supply
Figure 4‐5: Water demand per feedstock for non‐sewered households with access to off‐site water supply
6445 43 47 43 43 45
128
88 85 94 86 85 90
160
110 106117 108 107 112
200
150
0
50
100
150
200
250
Cattle Waste
Pigs Waste
Chicken W
aste
Human
Waste
Food W
aste
1:1 Cattle & Human
Waste
1:1 Food & Human
Waste
Water deman
d (L/day.household)
Feedstocks
Non‐sewered households with access to on‐site water supply
2500 L of Biogas/day
5 000 L of Biogas/day
6 250 L of Biogas/day
Water consumption
Greywater generated
64
45 43 47 43 43 45
128
88 8594 86 85 90
160
110 106117
108 107 112
105
78.75
0
20
40
60
80
100
120
140
160
180
Cattle Waste
Pigs Waste
Chicken W
aste
Human
Waste
Food W
aste
1:1 Cattle & Human
Waste
1:1 Food & Human
Waste
Water dem
and (L/day.household)
Feedstocks
Non‐sewered households with access to off‐site water supply
2500 L of Biogas/day
5 000 L of Biogas/day
6 250 L of Biogas/day
Water consumption
Greywater generated
© University of Pretoria

71
4.6.5. Biogas digester capacity
According to Table 2‐4, the volume of digester required for the production of 2 500 L/day of
biogas is 10 m3 and 7 ‐ 9 cattle are needed. Using the Excel model shown in Appendix A.1.7 it
was determined that in order to use a 10 m3 digester volume, more feedstock is required.
Instead of feeding 128 L/day of a 1:1 mixture of cow dung and water as calculated in Appendix
A.1.5.1 which require 8 cows, 145 L/day is required which translates to 9 cows needed. This
means that the Excel model agrees with the contents of Table 2‐4. According to Appendix A.1.7,
the volume of digester required for the production of 2 500 L/day of biogas is 28 m3 but when
the feed rate is slightly increased a smaller digester volume is required. This is attributed to
reduction in the organic loading rate (kg VS/m3/day) by reducing the digester capacity of which
according to Yadvika et al (2004) increases biogas yield.
Using the Excel model, for biogas production of 5 000 L/day; the calculated optimum digester
volume is 20 m3 fed with a 1:1 mixture of cow dung and water at a rate of 290 L/day (18 cattle
needed) which is slightly higher than the calculated rate of 256 L/day (16 cattle needed). For
biogas production of 6 250 L/day, the optimum digester volume is 25 m3. The predicted feed
rate is 363 L/day (22 cattle needed) which is slightly higher than the calculated rate of 320
L/day (20 cattle needed). A 20 m3 digester volume can be used for biogas production 6 250
L/day but the predicted feed rate of a 1:1 mixture of cattle and water is 382 L/day which
translates to 24 cattle required.
© University of Pretoria
72
CHAPTER 5: Conclusions
The amount of biogas required to meet the energy demand for cooking by a South African
household is approximately 2 500 L/day which is in line with the 1500 – 2 400 L/day reported by
Bond and Templeton (2011). The amount of biogas required for complete substitution of
fuelwood used for cooking, water heating and space heating is estimated at 5 000
L/day/household and 1 250 L/day/household of biogas is required for substituting paraffin used
for lighting. The amount of biogas required for complete substitution of conventional domestic
fuels is therefore estimated at 6 250 L/day/household.
It can be concluded that fuelwood use in South African households contributes 702 790 and 22
365 attributable DALYs lost and mortalities respectively. Substitution of fuelwood with 2 500 L
of biogas per day per household will result in the avoidance of approximately 50% of the total
attributable DALYs lost and mortalities from indoor smoke due to solid fuel use. Complete
substitution of fuelwood with biogas will result in avoidance of 85.4% of attributable DALYs lost
and mortalities due to solid fuel use.
It can be concluded that there is potential for domestic biogas technology utilising cattle and
pig waste as feedstock. Due to access to cattle dung, approximately 613 662 households can
potentially benefit from biogas digester installations fed with cattle dung for the production of
2 500 L of biogas per day per household. The number of households that can potentially benefit
from the installation of a 5 000 or 6 250 L/day capacity biogas digester fed with cattle dung is
131 392. Due to access to pigs waste, the number of households that can potentially benefit
from installations of 2 500 or 5 000 or 6 250 L/day capacity biogas digesters fed with pigs waste
is 12 089. Due to the number of chickens required and the average number of chickens kept in
South African households, it can deduced that it is not feasibly to operate a biogas digester fed
solely with chicken waste.
Based on the average size of a South African household and the number of people required, it
can be concluded that South Africa households do not produce enough human excreta to feed
a digester for complete substitution of fuelwood used for cooking and for complete substitution
© University of Pretoria

73
of conventional domestic fuels. South African households generate less than 2% of the required
food waste for feeding a family sized biogas digester therefore it can be concluded that food
waste is not a potential digester feedstock in South African context.
A biogas digester fed with animal waste is more suitable for rural areas as most households
own livestock. Biogas digesters fed with sewage are more suitable for peri‐urban
areas/informal settlements where a community digester can be connected to the water‐borne
sewage system. Informal settlements with centralized ablution facilities are ideal for connecting
with a community biogas digester for the production of biogas.
Based on the water demand of biogas technology and the fact that South Africa is a water
stressed country with limited water supply to low‐income households, alternative water
sources were assessed such as greywater for feeding a digester. It was determined that non‐
sewered households with access to on‐site water supply generate sufficient and surplus
greywater for feeding a domestic biogas digester. Non‐sewered households with access to off‐
site water supply generate insufficient greywater for feeding biogas digesters of 5 000 L/day
and 6 250 L/day capacity therefore requiring alternative water sources for augmentation. It is
therefore recommended that in non‐sewered households with access to off‐site water supply
greywater be augmented by harvested storm water or water from nearby rivers, dams and
streams. This will ensure that drinking water is not used for feeding a biogas digester.
© University of Pretoria

74
CHAPTER 6: Recommendations
It is recommended that a pilot scale study be launched to determine the actual replacement of
fuelwood by biogas as well as the feasibility of domestic biogas technology in low‐income South
African households. Approximately 800 000 agricultural households in South Africa can gain
access to 960 million liters/day of biogas for complete substitution of fuelwood used for
cooking. Due to water scarcity and water supply in South Africa especially in low‐income
households, it is recommended that biogas digesters be connected to ablution facilities to make
use of flushing water thus limiting the water demand.
It is also recommended that community biogas digesters fed with human waste be installed in
peri‐urban areas/informal settlements. The community biogas digesters must be connected to
local ablution facilities. Food waste generated by the households can also be fed into the
digester thus resulting in co‐digestion of food and human waste. Approximately 15 households
can generate enough human waste to feed a digester for daily biogas production of 2 500 L to
be used by at least one household per day for cooking purposes. Therefore a few of these
biogas digesters can be installed in a single community. In terms of biogas consumption,
households can take turns in utilizing biogas for cooking.
Instead of using inefficient biogas lamps for lighting purpose which poses a risk to the safety of
the household members, it is recommended that PV solar home systems be installed in rural
households to provide electricity for lighting and charging of mobile devices. The significant
amount of energy required for water heating in low‐income South African households of
approximately 32% can be met by the installation of a solar water heating system. This will
reduce the size of the biogas digester required.
Non‐sewered South African households with access to on‐site water supply should make use of
the generated greywater for feeding domestic biogas digester instead of drinking water
supplied by the government in the form of FBW. Non‐sewered South African households with
access to off‐site water supply should make use of the generated greywater and in cases where
it is insufficient it must be augmented with harvested rainwater or water from nearby rivers or
© University of Pretoria

75
dams. Where it is envisaged that greywater won’t be sufficient for feeding a domestic biogas
digester, it is recommended that a water supply technology such as rainwater harvesting be
implemented simultaneously with domestic biogas technology.
© University of Pretoria

76
References
Alvarez, R. and Lidén, G. (2008) The effect of temperature variation on biomethanation at high
altitude. Bioresource Technology, 99, pp 7278 – 7284.
Amankwah, E. (2011) Integration of Biogas Technology into Farming System of the three
Northern Regions of Ghana. Economics and Sustainable Development, 2 (4), pp 76‐85
Amigun,B. Parawira, W. Musango, J.K. Aboyade, A.O. and Badmos, A.S. (2012) Anaerobic Biogas
Generation for Rural Area Energy Provision in Africa, Biogas, Dr. Sunil Kumar (Ed.), ISBN: 978‐
953‐51‐0204‐5, InTech, Available from: http://www.intechopen.com/books/biogas/anaerobic‐
biogas‐generation‐for‐rural‐area‐energy‐provision‐in‐africa.
Asam, Z.Z. Poulsen, T.G. Nizami, A.S. Rafique,R. Kiey, G. and Murphy, J.D. (2011) How can we
improve biomethane production per unit of feedstock in biogas?. Applied Energy, 88, pp 2013‐
2018
Ballan‐Tremeer, G. (1997) Emissions of Rural Wood‐Burning Cooking Devices. PhD Thesis, Wits
University.
Bond, T. and Templeton, M.R. (2011) History and Future of domestic biogas plants in the
developing world. Energy for Sustainable Development, 15, pp. 347‐354.
Boy, E. Bruce, N. Smith, K.R. Hernandez, R. (2000) Fuel efficiency of an improved wood‐burning
stove in rural Guatemala: implications for health, environment and development. Energy for
Sustainable Development, 4 (2), pp 23‐31.
Brown, V.J. (2006) Biogas a bright idea for Africa. Environmental Health Perspectives 114:301‐
303.
Carden, K. Armitage, N. Winter, K. Sichone, O. and Rivett, U. (2007) Understanding the use and
disposal of greywater in the non‐sewered areas in South Africa. WRC Project No. 1524/1/07.
Cape Town.
© University of Pretoria

77
Cawood, W. and Simelane, B.R. (2004) Rural School Energization Using Biogas Technology.
Domestic Use of Energy Conference 2004, pp 199‐202.
CES. (2001) Efficiency Measurement of Biogas, Kerosene and LPG Stoves. Tribhuvan University,
Nepal.
Chaggu, E. Sanders, W. and Lettinga, G. (2007) Demonstration of anaerobic stabilization of black
water in accumulation systems under tropical conditions. Bioresource Technology, 98, pp 3090‐
3097.
Chen, Y.R. and Hashimoto, A.G. (1978) Kinetics of Methane Fermentation. Biotechnology and
Bioengineering Symposium, 8, pp 269‐282.
Damm, O. and Triebel, R. (2008) A synthesis report on biomass energy consumption and
availability in South Africa. Johannesburg: Programme for basic energy and conservation
ProBEC and LHA Management Consultants.
Dana, R. (2010) Micro‐scale Biogas Production: A beginner’s guide. National Center for
Appropriate Technology, pp 1 – 10.
De Bruyn, C. (2013) Nersa registers six KZN biogas production operations [WWW] Engineering
News. Available from: https://m.engineeringnews.co.za/article/nersa‐registers‐six‐kzn‐biogas‐
production‐operations‐2013‐10‐28 [Accessed: 26/06/2014].
Department of Agriculture, Forestry and Fisheries. (2015) Abstract of Agricultural Statistics
2015. Department of Agriculture, Forestry and Fisheries. Pretoria, South Africa.
Department of Energy. (2013) A survey of energy‐related behavior and perceptions in South
Africa ‐ The Residential Sector. Department of Energy. Pretoria, South Africa.
Department of Environmental Affairs. (2012a) National Environmental Management: Air
Quality Act (39/2004): Highveld Priority Area Air Quality Management Plan – Gazette No.
35072. Pretoria, South Africa.
© University of Pretoria

78
Department of Environmental Affairs. (2012b) National Waste Information Baseline Report.
Department of Environmental Affairs. Pretoria, South Africa.
Department of Minerals and Energy. (1998) White Paper on the Energy Policy of the Republic of
South Africa. Pretoria, South Africa.
Department of Minerals and Energy. (2003b) White Paper on the Renewable Energy Policy of
the Republic of South Africa. Pretoria, South Africa.
Department of Water Affairs and Forestry, (1996) South African Water Quality Guidelines
(second edition). Volume 4: Agricultural Use: Irrigation.
Department of Water Affairs and Forestry. (1997) White Paper on a National Water Policy of
South Africa. Pretoria, South Africa.
Department of Water Affairs and Forestry. (2007) 'Free Basic Water Implementation Strategy
2007: Consolidating and maintaining, Version 4. Pretoria. South Africa.
Desai, M.A. Mehta, S. and Smith, K.R. (2004) Indoor smoke from solid fuels: Assessing the
environmental burden of disease at national and local levels, WHO Environmental Burden of
Disease Series, No. 4, Geneva, World Health Organization.
Deublein, D. and Steinhauser, A. (2008) Biogas from Waste and Renewable Resources.
Weinheim: Wiley‐VCH.
Dioha, E. Dioha, J. and Nfor, B. (2012) Operating and Financing Biogas Plant. Energy of
Technologies and Policy, 2 (5), pp 25‐37
Everson, T.M. and Smith, M.T. (2015) Rural Livelihoods through Biogas Generation using
Livestock Manure and Rainwater Harvesting. Volume 1: Research Report (WRC Report No.
1955/1/15).
Ferrer, I. Garfí, M. Uggetti, E. Ferrer‐Martí, L. Calderon, A. Velo, E. (2011) Biogas production in
low‐cost household digesters at the Peruvian Andes. Biomass and Bioenergy, 35, pp 1668 –
1674.
© University of Pretoria

79
Fulford, D. (1988) Running a Biogas Programme: A handbook. London: Intermediate Technology
Publications.
Garfí, M. Ferrer‐Martí, L. Pérez, I. Flotats, X. Ferrer, I. (2011) Codigestion of cow and guinea pig
manue in low‐cost tubular digesters at high altitude. Ecological Engineering, 37, pp 2066 –
2070.
Garfí, M. Ferrer‐Martí, L. Velo, E. and Ferrer, I. (2012) Evaluating benefits of low‐cost household
digesters for rural Andean communities. Renewable and Sustainable Energy Reviews, 16, pp
575 – 581.
Gaudex, L. (2014) A health and demographic surveillance system of cattle on communal
rangelands in Bushbuckridge, South Africa: baseline census and population dynamics over 12
months. MSc. University of Pretoria.
Gautam, R. Baral, S. and Herat, S. (2009) Biogas as a sustainable energy source in Nepal: Present
status and future challenges. Renewable and Sustainable Energy Reviews, 13, pp 248‐252
Ghimire, P.C. (2013) SNV supported domestic biogas programmes in Asia and Africa. Renewable
Energy, 49 , pp 90‐94
Greben, H.A. and Oelofse, S.H.H. (2009) Unlocking the resource potential of organic waste: a
South African perspective. Waste Management and Research, 27, pp 676‐684
Heiermann, M. Plöchl, M. Linke, B. Schelle, H. Herrmann, C. (2009) Biogas Crops – Part I:
Specifications and Suitability of Field Crops for Anaerobic Digestion. Agricultural Engineering
International: the CIGR Ejournal. Manuscript 1087. Vol. XI.
Hemraj, S. (2010) Discussion Paper for Comment Reducing Greenhouse Gas Emissions: The
Carbon Tax Option. Department of National Treasury. Pretoria
Hennekens, E. (2012) Biogas as domestic energy solution? Potentials and barriers of the
technology for low‐income households in South Africa. Master thesis, Wageningen University.
© University of Pretoria

80
Hobson, P.N. Bousfield, S. and Summers, R. (1981) Methane Production from Agricultural and
Domestic. London: Applied Science Publishers Ltd.
Hower, J. and Chianese, D.S. (2012) Digester Gas Combustion. Environ International
Corporation, Los Angeles, CA.
Itodo, I.N. Agyo, G.E. Yusuf, P. (2007) Performance evaluation of a biogas stove for cooking in
Nigera. Journal of Energy in Southern Africa, 18 (3), pp 14‐18.
Josefsson, O. (2009) Getting Attached A study on domestic biogas and the integration of
sanitation in Ethiopia. University of Gothenburgh. SNV.
Libsu, S. Chavan, R.B. and Wonde, A. (2011) Implementation of Low Cost Technology for biogas
Generation from Kitchen wastes: An Alternative source of renewable energy. Bahir Dar. Bahir
Dar University.
Lim, S.S. Vos, T. Flaxman, A.D. Danaei, G. Shibuya, K. Adair‐Rohani, H. et al. (2012) A
comparative risk assessment of burden of disease and injury attributable to 67 risk factors and
risk factor clusters in 21 regions, 1990 – 2010: a systematic analysis for the Global Burden of
Disease Study 2010. The Lancet, 380 (9859), pp 2224‐60.
Mengjie, W. (2002) Biogas Technology and Ecological Environment Development in Rural Areas
of China. Chinese Academy of Agriculture Engineering Research.
Mital, K. M. (1996) Biogas Systems: Principles and Applications. New Age International
Publishers (p) Ltd, N. Delhi.
Munda, U.S. Pholane, L. Kar, D.D. and Meikap, B.C. (2012) Production of bioenergy from
composite waste materials made of corn waste, spent tea waste, and kitchen waste co‐mixed
with cow dung. International Journal of Green Energy, 9, pp 361‐375.
Muye, H.M. (2015) Energy conversion efficiency of pressurised kerosene and pyramid‐shaped
clay‐lined charcoal cooking stoves. African Journal of Science, Technology, Innovation and
Development, 7 (6), pp 518‐520.
© University of Pretoria

81
Ng’wandu, E. Shila, L. and ter Hegde F.E.W. (2009) Programme Imprementation Document:
Tanzania Domestic Biogas Programme. SNV. Tanzania.
Oelofse, S.H.H. and Nahman, A. (2013) Estimating the magnitude of food waste generated in
South Africa. Waste Management and Research, 31(1), pp 80‐86.
Parawira, W. (2009) Biogas Technology in Sub‐Saharan Africa: status, prospects and constraints.
Environmental Science Biotechnology, 8, pp 187‐200
Pathak, H. Jain, N. Mohanty, S. and Gupta, N. (2009) Global warming mitigation potential of
biogas plants in India. Eviron Monit Assess, 157, pp 407‐418.
Pérez, I. Garfí, M. Cadena, E. and Ferrer, I. (2014) Technical, economic and environmental
assessment of household biogas digesters for rural communities. Renewable Energy, 62, pp 313
– 318.
Prasad, G. (2007) Electricity from solar home systems in South Africa: Case Study 2.Energy
Research Centre. University of Cape Town.
Prüss‐Üstün, A. Mathers, C. Corvalanán, C. Woodward, A. (2003) Introduction and methods:
assessing the environmental burden of disease at national and local levels. WHO Environmental
Burden of Disease Series, No. 1. Geneva, World Health Organization.
Rajendran, K. Aslanzadeh, S. and Taherzadeh, M.J. (2012) Household Biogas Digester – A
Review. Energies, 5, pp 2911 ‐ 2942.
Rajeshwari, K.V. Balakrishnan, M. Kansal, A. Lata, K. Kishore, V.V.N. (2000) State‐of‐the‐art of
anaerobic digestion technology of industrial wastewater treatment. Renewable and Sustainable
Energy Reviews, 4, pp 135 – 156.
RCSD. (2008) Biogas Manual. Green‐farm technologies for small and marginal farms. India
Rodda, N. Carden, K. and Armitage, N. (2010) Sustainable use of greywater in small‐scale
agriculture and gardens in South Africa. WRC Report No. TT 469/10. Cape Town.
© University of Pretoria

82
Scano, E.A. Asquer, C. Pistis, A. Ortu, L. Demontis, V. Cocco, D. (2014) Biogas from anaerobic
digestion of fruit and vegetable wastes: Experimental results on pilot‐scale and preliminary
performance evaluation of a full‐scale power plant. Energy Conversion and Management, 77,
pp 22‐30.
Shah, N. (1997) The role of bio‐energy utilisation in sustainable development. International
Journal of Global Energy Issues, 9, 4‐6, pp 365 – 381.
Siddique, A. B. (2014) Biogas charges mobile [WWW] Dhaka Tribune. Available from:
http://www.dhakatribune.com/development/2014/feb/09/biogas‐charges‐mobile‐phones.
[Accessed: 19/08/2015].
Shrestha, J.N. (2001) Efficiency Measurement of Biogas, Kerosene and LPG Stoves. Center of
Energy Studies. Lalitpur, Nepal.
Singh, N. and Gupta, R. K. (1990) Community Biogas Plants in India. Biological Wastes, 32, pp
149 – 153.
Smith, K.R. Uma, R. Kishore, V.V.N. Lata, K. Joshi, V. Zhang, J. Rasmussen, R.A. Khalil, M.A.K.
(2000) Greenhouse Gases from Small‐Scale Combustion Devices in Developing Countries Phase
IIa Household Stoves in India, EPA Office of Research and Development.
Smith, M.T. (2011) The Financial and Economic Feasibility of Biodigester Use and Biogas
Production for Rural Households. Master thesis, University of KwaZulu‐Natal.
Smith, M.T and Everson, T.M. (2016) Improving Rural Livelihoods through Biogas Generation
Using Livestock Manure and Rainwater Harvesting. Volume 2: Guideline Report (WRC Report
No. TT 645/15).
Stafford, D.A. Hawkes, D.L. and Horton, R. (1980) Methane Production from Waste Organic
Matter. Florida: CRC Press, Inc.
Statistics South Africa. (2010) General Household Survey. Pretoria, South Africa. Statistics South
Africa.
© University of Pretoria
83
Statistics South Africa. (2011) Agricultural Households. Pretoria, South Africa. Statistics South
Africa.
Statistics South Africa. (2013a) General Household Survey. Pretoria, South Africa. Statistics
South Africa.
Statistics South Africa. (2013b) In‐depth analysis of the General Household Survey data. GHS
Series, volume V, Energy, 2002–2012. Pretoria, South Africa.
Statistics South Africa (2016) CPI History: 1960 onwards [WWW]. Available from:
http://www.statssa.gov.za/publications/P0141/CPIHistory.pdf? [Accessed: 05/06/2016]
Surendra, K.C. Takara, D. Hashimoto, A.G. and Khanal, S.K. (2014) Biogas as a sustainable energy
source for developing countries: Opportunities and challenges. Renewable and Sustainable
Energy Reviews, 31, pp 846–859.
Thomas, H. Pedro, K. Klingler, B. Kellner, C. Wittur, W. Klopotek, F. Krieg, A. and Euler, H. (1999)
Biogas Digest Volume 1 Biogas Basics. Information and Advisory Service on Appropriate
Technology. Frankfurt, Germany.
TNO. (no date) TNO develops the Biogas Socket. [WWW] Available from:
https://www.tno.nl/en/focus‐area/urbanisation/buildings‐infrastructures/energy‐built‐
environment/tno‐develops‐the‐biogas‐socket/ [Accessed: 26/05/2015].
Umogbai, V.I. and Orkuma, J.G. (2011) Development and Evaluation of a Biomass Stove. Journal
of Emerging Trends in Engineering and Applied Sciences, 2 (3), pp 513 – 520.
USEPA. (1995) Compilation of Air Pollutant Emission Factors. Volume I: Stationary Point and
Area Sources.
Van Buren, A. (1979) A Chinese Biogas Manual. London: Intermediate Technology Publications.
Van Nes, J. and Nhete, T.D. (2007) Biogas for a better life: an African initiative. Appropriate
Technology, 34 (4), pp 58 – 62.
© University of Pretoria

84
Venkataraman, C. Sagar, A.D. Habib, G. Lam, N. and Smith, K. R. (2010) The Indian National
Initiative for Advanced Biomass Cookstoves: The benefits of clean combustion. Energy for
Sustainable Development, 14, pp 63‐72.
WHO (World Health Organization). (2001) Quantification of the Health Effects of Exposure to
Air Pollution: Report of a WHO Working Group. Bilthoven, Netherlands.
WHO (World Health Organization). (2002) The World Health Report 2002: Reducing Risks,
Promoting Healthy Life. Geneva, Switzerland.
WHO (World Health Organization). (2006) Statistical information system. World Health
Organization. Available from: http://www.who.int/whosis [retrieved 27.07.15].
WHO (World Health Organization). (2010) WHO guidelines for indoor air quality: selected
pollutants. Winkler, H. (2005) Renewable energy policy in South Africa: Policy options for
renewable electricity. Energy Policy, 33, pp 25‐38.
WHO (World Health Organization). (2012) Burden of disease from Household Air Pollution for
2012, WHO.
Xiaohua, W. Zhenming, F. (1996) Survey of Rural Household Energy Consumption in China.
Energy, 22 (7/8), pp 703‐705.
Yadvika, Santosh, Sreekrishnan, T.R. Kohli, S. and Rana, V. (2004) Enhancement of biogas
production from solid substrates using different techniques – a review. Bioresource Technology,
95, 1‐10.
Yu, L. Yaoqiu, K. Ningsheng, H. Zhifeng, W. and Lianzhong, X. (2008) Popularising household‐
scale biogas digesters for rural sustainable energy development and greenhouse gas mitigation.
Renewable Energy, 33, pp 2027 – 2035.
© University of Pretoria

85
Appendix A
A.1. Sample Calculations
A.1.1. Energy requirements from fuelwood by an average sized family
seholdkg/day/hou 12days365
year1ton1
kg1000eholdannum.houstones/4.5m
ηCmQ v
Fuelwood calorific value (C v) = 17 MJ/kg
Fuelwood efficiency = 13%
seholdMJ/day/hou270.1317MJ/kgousehold12kg/day/hQ
According to Damm & Triebel (2008), 27 MJ/day.household represents 40% of the total energy
consumption in a South African household therefore the total energy is calculated as follows:
seholdMJ/day.hou680.4
seholdMJ/day.hou270.4QQT
A.1.2. Biogas required to substitute fuelwood as an energy source
eholdL/day/hous5002m 2.40.5520MJ/mseholdMJ/day.hou27
ηCQv
0.55ηMJ/m20︶︵C value calorific Biogas
ηCvQ
3
3
v
3v
v
A.1.3. Complete energy substitution of conventional domestic fuels
Biogas required for fuelwood replacement (80% of total energy):
© University of Pretoria

86
eholdL/day/hous0005m4.90.55MJ/m20
seholdMJ/day/hou680.8v 33
Biogas required for paraffin replacement (20% of total energy):
eholdL/day/hous2501m1.240.55MJ/m20
seholdMJ/day/hou680.2v 33
Total biogas requirement = 6 250 L/day/household
A.1.4. Cost savings from biogas substitution of conventional domestic fuels.
According to Damm and Triebel (2008), the net direct‐use value of fuelwood was R1 250 and
therefore the adjusted value due to inflation is calculated as follows:
1
2
1
2
CPICPI
PricePrice
808R1
250R179.3
114.7
PriceCPICPIPrice 1
1
22
According to Census 2001 reported by ERC 2004 as cited in Damm and Triebel (2008), the upper
band in the income bracket for low‐income households is R9 600 which can be inflated to
current times as follows:
013 R21
600 R952.4
114.7
PriceCPICPIPrice 1
1
22
A.1.5. Burden of disease attributed to indoor smoke from solid fuels
According to WHO (2002), the attributable DALYs lost due to indoor smoke from solid fuels in
Africa were 12 318 000 in 2000. Based on the African population of 655 476 000 and the South
© University of Pretoria
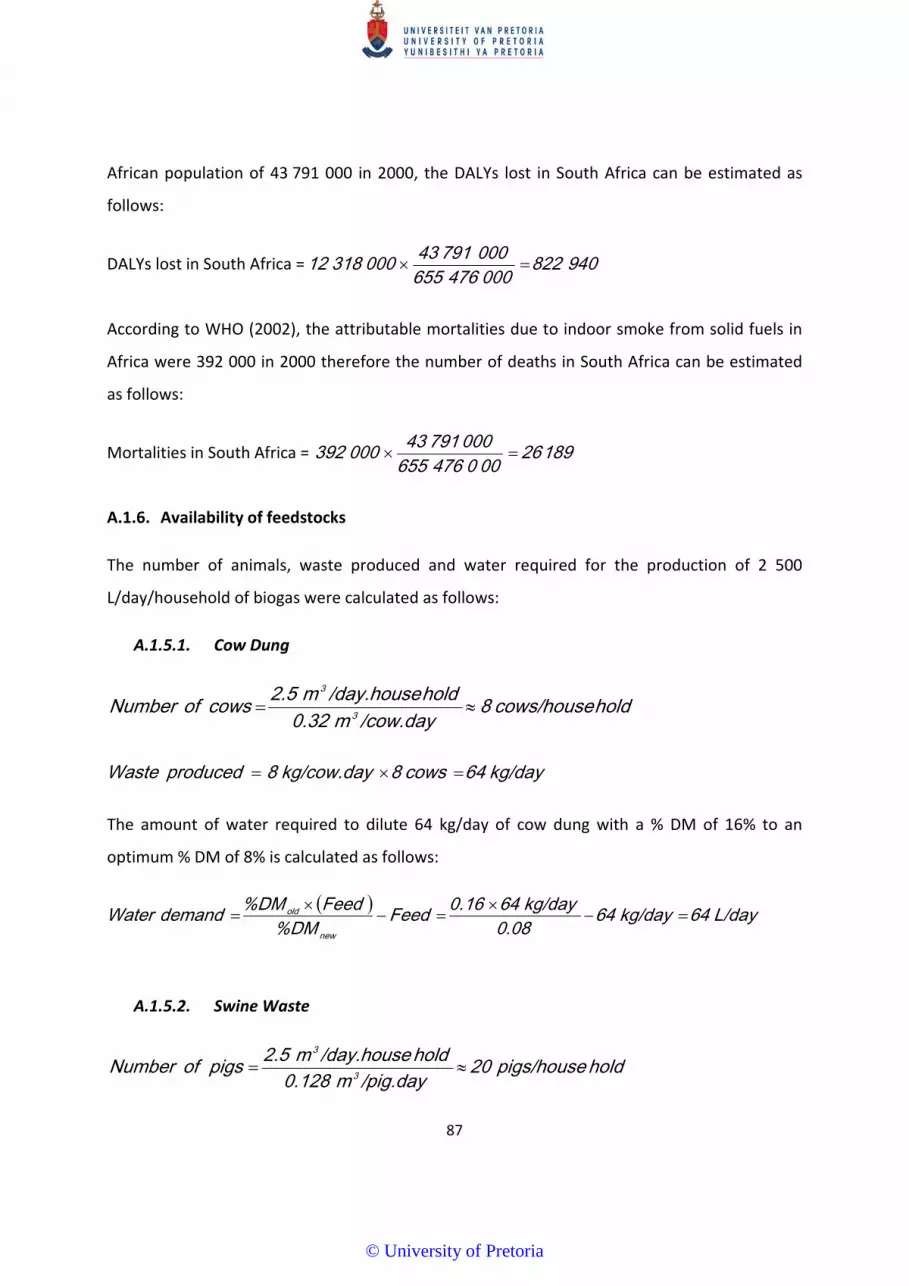
87
African population of 43 791 000 in 2000, the DALYs lost in South Africa can be estimated as
follows:
DALYs lost in South Africa = 940 8220004766550007914300031812
According to WHO (2002), the attributable mortalities due to indoor smoke from solid fuels in
Africa were 392 000 in 2000 therefore the number of deaths in South Africa can be estimated
as follows:
Mortalities in South Africa = 18926000476655
00079143 000392
A.1.6. Availability of feedstocks
The number of animals, waste produced and water required for the production of 2 500
L/day/household of biogas were calculated as follows:
A.1.5.1. Cow Dung
holdcows/house8/cow.daym0.32
hold/day.housem2.5cows of Number 3
3
kg/day64cows8kg/cow.day8producedWaste
The amount of water required to dilute 64 kg/day of cow dung with a % DM of 16% to an
optimum % DM of 8% is calculated as follows:
L/day64kg/day640.08
kg/day640.16Feed%DM
Feed%DMdemandWaternew
old
A.1.5.2. Swine Waste
holdpigs/house20/pig.daym0.128
hold/day.housem2.5 pigsof Number 3
3
© University of Pretoria

88
kg/day40pigs20kg/pig.day2producedWaste
The amount of water required to dilute 40 kg/day of pig waste with a % DM of 17% to an
optimum % DM of 8% is calculated as follows:
L/day45kg/day400.08
kg/day400.17Feed%DM
Feed%DMdemandWaternew
old
A.1.5.3. Poultry Waste
ouseholdchickens/h250ay/chicken.dm0.01
hold/day.housem2.5chickens of Number 3
3
kg/day20chickens250.daykg/chicken0.08producedWaste
The amount of water required to dilute 20 kg/day of chicken waste with a % DM of 25% to an
optimum % DM of 8% is calculated as follows:
L/day20kg/day200.08
kg/day200.25Feed%DM
Feed%DMdemandWaternew
old
A.1.5.4. Human Excreta
seholdpeople/hou63y/person.dam0.04
hold/day.housem2.5 peopleof Number 3
3
kg/day32people63daykg/person.0.5producedWaste
The amount of water required to dilute 32 kg/day of human excreta with a % DM of 20% to an
optimum % DM of 8% is calculated as follows:
L/day47kg320.08
kg/day320.20Feed%DM
Feed%DMdemandWaternew
old
© University of Pretoria

89
A.1.5.5. Kitchen/Food waste
The weightened average of % DM and biogas yield for food waste was calculated as follows
based on data in Table A‐0‐1 below:
iDM%xDM % of average Weightened i
Where, ix is the % of total pre‐consumer waste as shown in Table A‐0‐1.
0.34
0.080.010.170.10.130.480.920.030.120.080.880.28DM % ofaverage Weightened
DM/kgm0.550.70.0110.1
0.40.480.950.030.650.080.650.28yield biogas ofaverage Weightened
3
Table A‐0‐1: Composition and properties of food waste
Commodity group Post‐consumer food waste (1 000 tons)
% of total Post‐consumer food waste
%DM Biogas yield (m3/kg DM)
Cereals 142 28% 88% 0.65
Roots and Tubers 41 8% 12% 0.65
Oil seeds & Pulses 13 3% 92% 0.95
Fruits and Vegetables 241 48% 13% 0.4
Meat 52 10% 17% 1
Fish and Seafood 10 2% ‐ ‐
Milk 3 1% 8% 0.7
Total per stage of the food supply chain
502 100% 34% 0.55
The amount of food waste required as feed to produce 2 500 L/day of biogas is calculated as
follows:
.householdmatter/dayDrykg4.55matterDry/kgm0.55
hold/day.housem2.5matterDry 3
3
© University of Pretoria

90
seholdkg/day.hou130.34
.householdmatter/dayDrykg 4.55waste Food
The amount of water required to dilute 13 kg per day per household of food waste with a % DM
of 34% to an optimum %DM of 8% is calculated as follows:
L/day43kg130.08
kg/day130.34Feed%DM
Feed%DMdemandWaternew
old
A.1.7. Prediction of digester volume
The volume of the digester required to produce 2 500 liters of biogas per day was predicted
using the equation below which was derived from Equation 4. The feedstock requirements for
the production of 2 500 L/day of biogas as calculated in Appendix A.1.5.1 is 128 L/day mixture
of cattle dung and water at a ratio of 1:1. The total solids content of cattle dung mixed with
water is 9% and the volatile solids content is approximately 80% of this, say 72 kg/m3 (assuming
the density of slurry is 1 000 kg/m3). Assuming that the digester is operated at a temperature of
25 °C, from Table 2‐5 the yield constant C and the rate constant k are 289 L/kg and 0.069 day‐1
respectively.
vgkkCS
gVo
3
3
31133
3
28m
/daym0.128/daym2.5day0.069day0.069kg/m72/kgm0.289
/daym2.5V
An excel model was created to estimate the optimum digester capacity (m3) operated at 25°C
fed with a 1:1 mixture of cattle dung and water for biogas production of 2 500, 5 000 and 6 250
L/day/household. For production of 2 500 L/day of biogas, the calculated optimum digester
volume is 10 m3 fed with a 1:1 mixture of cattle dung and water at a rate of 145 L/day as shown
in Figure A‐0‐1.
© University of Pretoria

91
Figure A‐0‐1: Excel model for the prediction of digester volume.
© University of Pretoria

92
A.2. Case Study: Biogas socket: for local power supply
Users of biogas systems often live in off‐grid areas, and have a strong need for electricity,
especially due to the rise of the mobile phone (TNO, n.d.). Domestic biogas systems have the
potential to be used for electricity generation, but up to now, electricity generation was not
possible on small scale, household systems (TNO, n.d.). Dutch Development Organisation (SNV,
TNO, BoPInc and SimGas) have joined forces to develop a low cost electricity generator that
works on biogas: Biogas Socket (see Figure A‐0‐2 below).
Figure A‐0‐2: Biogas Socket (Source: TNO, n.d.)
The Biogas Socket works on the principle of thermo‐electric generation, using a piece of semi‐
conductor material (a Peltier element) that transforms the heat from a small biogas flame into
electricity, without any moving parts (TNO, n.d.). The excess heat generated is cooled away via
a tank filled with about 5 liters of water (TNO, n.d.). The Biogas Socket can produce up to 3‐5
watts of power that serves small‐scale household power needs (Siddique, 2014). Mobile sets
are charged through a USB port attached at the bottom of the structure (see Figure A‐0‐3
below) (Siddique, 2014). The Biogas Socket has been installed in 6 rural households in
Bangladesh and currently being tested in Rwanda and Tanzania (Siddique, 2014). The cost of
the Biogas Socket is estimated in the vicinity of 10 000 Bangladeshi Taka which is approximately
1 700 South African Rands.
© University of Pretoria

93
Figure A‐0‐3: Biogas Socket charging mobile set (Source: Siddique, 2014)
© University of Pretoria