Embed Size (px)
Citation preview

Geomorphology 143–144 (2012) 81–94
Contents lists available at SciVerse ScienceDirect
Geomorphology
j ourna l homepage: www.e lsev ie r .com/ locate /geomorph
Critical storm thresholds for morphological changes in the westernBlack Sea coastal zone
Ekaterina V. Trifonova ⁎, Nikolay N. Valchev, Nataliya K. Andreeva, Petya T. EftimovaInstitute of Oceanology, Bulgarian Academy of Sciences, 40 Parvi May Bul., Varna, 9000, Bulgaria
⁎ Corresponding author at: IO-BAS, 40 Parvi May Bul., V52 370 493.
E-mail address: [email protected] (E.V. Trifonova)
0169-555X/$ – see front matter © 2011 Elsevier B.V. Aldoi:10.1016/j.geomorph.2011.07.036
a b s t r a c t
a r t i c l e i n f oArticle history:Received 2 July 2010Received in revised form 30 June 2011Accepted 9 July 2011Available online 7 September 2011
Keywords:Coastal morphologyIntegral wave energyShoreline retreatCross-shore profile evolutionDamage
Storms are one of the phenomena determining the short-term evolution of coasts by influencing the erosionand accretion patterns of the beaches. Some severe storms could cause loss of beach sediments, partial orcomplete destruction of coastal structures and even threaten human life and occupation. Bearing this inmind, it is essential to comprehend, which storms could evoke transient, although in some instances, signif-icant morphological changes, and which could be considered as hazardous and result in catastrophic damage.This issue implies establishment of a set of critical thresholds for storm impact on coastal morphology.The paper presents a regional scale analysis of the near-shore morphological response of five beaches tostorms of varying intensity. The analysis is accomplished by coupling of offshore wave and cross-shore profiledata obtained for the Bulgarian Black sea coast. The historical storm pattern is reconstructed through hindcastusing a coupled wave model system, while resulting morphological changes, such as shoreline alteration andcross-shore profile evolution, are estimated by analysis of long-term series of coastal measurements per-formed in 1970–1977 and 2008–2010.The storm impact thresholds are set in terms of integral wave energy taking into account both storm patternand duration. It was found that the morphological response to storm impact is site specific and single-valuethresholds are difficult to be established even at regional scale. Nevertheless, a range of critical storm thresh-olds is proposed. Thus, storms with integral wave energy varying within threshold values 0.4–0.7×10⁶ J m−2
are regarded as capable of significant morphological changes, while less energetic events are supposed to in-fluence predominately the seasonal beach dynamics. Furthermore, storms with integral wave energy higherthan 0.7×10⁶ J m−2 represent potentially destructive events that can change irreversibly the beach patternor damage impact.
arna, 9000, Bulgaria. Tel.: +359
.
l rights reserved.
© 2011 Elsevier B.V. All rights reserved.
1. Introduction
Storms, among other phenomena, are the ones that play a signifi-cant role in shaping coasts. Some storms can cause severe beach ero-sion, partial or complete destruction of infrastructure and constitute ahazard for human life and occupation. Increased coastal developmentand rising sea level imply recognition of the role that storms play inalteration of beach systems and possible damage to the coastalenvironment.
Nowadays, over 9% of the Bulgarian population lives in coastalareas. Moreover, a significant population growth on the Bulgariancoast has been observed. Recently, this area is one of the most denselypopulated areas (Balev, 2002). Besides, tourism and marine tourismin particular are the fastest developing industries in Bulgaria. Beaches,on one hand support private and public property and on the other,
they are the most important tourist asset and provide habitat for adiversity of wildlife.
Severe storms have the ability to rapidly redistribute large vol-umes of sediment, and therefore, control short-term shoreline move-ment (Morton et al., 1995). Although, the response of a beach to alarge hurricane, for example, involves rapid erosion followed byslow recovery (Morton et al., 1995), there is still much to be under-stood about beach behavior under the impact of storms of differentintensity, in particular in enclosed seas. Cooper et al. (2004) statethat “analysis of the historic shoreline record does not provide defin-itive conclusions regarding the role of storms in coastal evolution. Thedifficulty of measurement during storms places strong reliance onpre- and post-storm morphological comparisons”. However, paststorm measurements do not always comply with this approach. Onthe other hand, even if a storm is severe enough to cause any mor-phological change, additional unconsidered factors could produce im-portant differences in coastal response patterns (Cooper et al., 2004).As Hill et al. (2004) claim the relationship between storm processesand near-shore sediment pattern is poorly understood. They also un-derpin the need for data from a variety of locations with different

Fig. 1. Location maps of Northern Black Sea coast of Bulgaria, studied beaches and relevant piers: 1) Albena pier (ALB) at Albena beach; 2) three piers at Golden Sands beach: GoldenSands-North (GSN), Golden Sands-Central (GSC) andGolden Sands-South (GSS), 3) twopiers at St. Constantine and Elena beach: St. Constantine and Elena-North (StCEN) and St. Constantineand Elena-South (StCES); 4) three piers at Varna beach: Ribarski (VNN), Varna Central (VNC) andDiyavolski (VNS); 5) pier at Kamchiya–Shkorpilovtsi beach (SHK), located near themouth ofthe Fandakliyska River. The situation of the grid point for which wave climate was modeled is denoted by the symbol⊙, while dashed line sketches out the rear line of the beaches.
82 E.V. Trifonova et al. / Geomorphology 143–144 (2012) 81–94

Table 1Morphological features of the beaches and piers' length. (Source: unpublished datameasured during field surveys in 1991 carried out at Coastal Zone Dynamics Departmentof IO-BAS, Bulgaria).
Location Exposure Beach length(m)
Beach width(m)
Pier length(m)
Albena–Kranevo beach ESE 5080 53 98Golden Sands beach E 3188 55 86 (N),
118 (C),96 (S)
Sts. Constantine and Elena ESE 1327 36 112 (N),134 (S)
Varna beach SE 1200 54 68 (N),132 (C),42 (S)
Kamchiya–Shkorpilovtsibeach
E 12,708 40 226
83E.V. Trifonova et al. / Geomorphology 143–144 (2012) 81–94
geological settings and hydrodynamic conditions contributing tobeach shaping.
There is only a small amount of information on storms in thewestern Black Sea. Trifonov and Trifonova (1988) made a classifi-cation of typical synoptic situations resulting in severe storms.Vassilev (1980) examined only few severe storms which occurredin 1976–1979. Recently, the wave climate of the western BlackSea shelf has been investigated by Valchev et al. (2008). However,knowledge with respect to the morphological impact of storms iseven poorer. For instance, some long- and short-term cross-shoreprofile variations in the Bulgarian coastal zone were investigatedby Nikolov and Pykhov (1980) and Pruszak and Nikolov (1992).In other cases, as by Stakev (1980), while giving evidence aboutdisastrous morphological changes due to the heaviest storm forthe last 60 years (February 1979), the attention is drawn mainlyto damage caused to coastal infrastructure.
Storms are able to cause diverse morphological changes some ofwhich could have significant environmental and/or economic conse-quences. Hence, there is a necessity to distinguish and possibly predictthe scale of storms using reliable information on hydrodynamicalforcing in general, and storm pattern in particular. Thus, the overallobjective of this paper is to set critical thresholds for storms that couldproduce morphological changes of a given scale — considerable oreven disastrous. Two threshold levels of storm impact are of particularinterest: impact resulting in significant changes, and impact causingdamage to the coast. The term ‘damage’ in the present study is notused as a full-scale risk assessment would imply (Koller, 2005),i.e. expressed in monetary value. Instead, we adopt the concept of‘morphological damage’ in terms of shoreline retreat or thicknessof the eroded layer, which could be expressed in metric units.
Thus, if morphological damage and the ability or inability forbeach recovery were known, economists would be able to determinethe damage, as well as the corresponding risk for a given coastal area.
2. Study area description
The Black Sea is an elliptical semi-closed basin with a complexorography (Fig. 1). The western coastal region is relatively low asbeing part of the Black Sea lowlands. In general, the coastline of theentire basin is not very deeply indented. The area of the Black Seashelf is about 24% of the total basin area and its outer edge can betraced along the 100–150 m depth contour. The shelf slope is relative-ly smooth with clearly marked shoaling (Mishev et al., 1978).
A large seasonal variability is the most remarkable feature of thewind and wave climate in the western Black Sea. In general, the windregime in the region corresponds to a particular atmospheric pressurefield over Eastern Europe. During the storm season the most relevantconfiguration is determined by the mutual position, displacementand resulting interactions between the Eastern European (Siberian)anticyclone and Mediterranean cyclones (Sorkina, 1974). Thus, themost intense and frequent winds directed onshore are those fromNE, E and SE. Having the largest fetch, they trigger the severeststorms. Winds from the NE prevail in the northern and middle sectionsof the shelf zone, while the impact of easterly winds increases south-wards. Ordinarily, southeast winds are less significant in terms ofstorm intensity but are still of importance for the northern shelf inparticular (Valchev et al., 2008). Following the wind patterns wavespropagate most frequently from E, NE and SE. The waves from otherdirections are less important in terms of both probability of occurrenceand wave height. Although, usually the storm season extends fromOctober to March (Kyutchukova, 1982), it is not uncommon thatenergetic wave events take place also in April and September(Cherneva et al., 2003) and even in August (Potapova, 1958).
The study area encompasses five beaches located within a stretchof about 70 km along the northern Black Sea coast of Bulgaria.From north to south those beaches are Albena, Golden Sands,
St. Constantine and Elena, Varna and Kamchiya–Shkorpilovtsi (Fig. 1).The geographical proximity of the beaches contributes to certain simi-larities between their morphological features. Some of them are sum-marized in Table 1. The general exposure of the entire coastal area iseastern (Fig. 1, Table 1). This predetermines susceptibility of almost allcoastal sites to wind waves from NE, E and SE, except for Varna beach,which is sheltered against NE waves.
Along-shore, the beaches are mainly bordered by rocky capesor cliffs consisting of Sarmatian limestone complex with a sandyinterlayer (Popov and Mishev, 1974), but in some cases — by coastalconstructions, e.g. those of Golden Sands and Varna. In general, thesandy interlayer is the sediment supplier for all the beaches. However,this nourishment flux intensifies only in springtime due to heavyrains. The longest beaches of Albena and Kamchiya–Shkorpilovtsibeing developed in estuaries of the rivers Batova and Kranevska, andKamchiya and Fandakliyska, respectively, are sustained also by con-tinuous river discharge. They are backed by dunes, as are those onAlbena where the dunes are less developed, but nevertheless inboth cases their fore-dune areas serve as a natural border betweenthe active and non-active parts of beaches. Beach sediments consistpredominantly of medium and fine sands with D50=0.19–0.40 mm.The average width of all beaches is more than 30m.
On every beach, piers were built that project from the shore intothe sea. They are permeable constructions on pillars. This type ofcoastal structure usually does not affect local morpho- and hydrody-namics. Pier locations, naming and number per beach are depictedin Fig. 1. Nine of them serve as tourist attractions, while only thepier at Kamchiya–Shkorpilovtsi site was built for research purposes.Their length varies from 42 m to 226 m (Table 1). On average thedepth at the far end of all piers is ≈4 m, except for piers StCEN andALB, where it is ≈3 m. The averaged seabed slope along the piersalso varies extensively, that is from 2.4/100 at pier VNN up to7.1/100 at piers VNS and GSN. The sediments below the piers consistpredominately of medium sand (D50=0.22–0.37 mm), whereas inthe swash zone of Golden Sands and Kamchiya–Shkorpilovtsi beachescourse sand with D50=0.60–0.70 mm is present. At the far end of thepiers the grain size decreases down to 0.18–0.20 mm (fine sand). Fur-ther down the bottom profiles at depths of 15–20 m fine and very finesand is replaced by sandy silt and silt, except for the slope at GoldenSands where there is Aladzha rocky bank, formed by Sarmatian lime-stones and sandstones. Its surface is very rough and covered by blocksand boulders, while the irregularities are filled with coarse detritus(D50=0.60–0.70 mm).
3. Data and methods
The methodology in use is based upon an approach suitable forrevealing most of the interdependence between hydrodynamics

Table 2Summary of the cross-shore profile measurements along piers.
N Pier Measurement period Minimum (days) Maximum (days)
1 ALB Oct 1973–Jul 1978 21 942 GSN Jan 1972–Jul 1978 7 963 GSC Jan 1972–Jul 1978 1 964 GSS Jan 1972–Jul 1978 8 1695 StCEN Jan 1972–Jul 1978 8 966 StCES Jan 1973–Jul 1978 21 1877 VNN Mar 1971–Jul 1978 1 1078 VNC Jan 1971–Oct 1972 1 169 VNS Jun 1971–Dec 1976 1 5110 SHK Nov 2008–Jun 2010 1 51
84 E.V. Trifonova et al. / Geomorphology 143–144 (2012) 81–94
(wave energy and wave induced flow), sediment transport andmorphological response.
In the absence of comprehensive and regular measurements ofstorm events, simulations of wave fields were undertaken in order togain insight into wave conditions. As a result, for the present paper atthe our disposal is a dataset of continuous series of wave parameterscalculated for the western Black Sea shelf (1948–2010) by means oftwo wave models: WAM (Günther et al., 1992; Komen et al., 1994)and SWAN (Booij et al., 1999; The SWAN Team, 2011). For the compu-tation of historical wind forcing the global atmospheric pressure reana-lysis carried out by the European Centre for Medium-range WeatherForecast (Uppala et al., 2005) and National Center for EnvironmentalPrediction (NCEP/NCAR) (Kalnay et al., 1996) was employed. TheWAMmodel was run on a grid covering the entire Black Sea basin. Sub-sequently, SWAN was nested into it, in order to simulate waves in thewestern shelf. The output of total sea and swell parameters is obtainedevery hour. This coupled systemofmodelswas already validated for thewestern Black Sea (Valchev et al., 2007).
For the purposes of the present study, a continuous time series ofwave parameters: significant wave height (Hs), mean wave period(Tm) and mean direction of wave propagation (θm) were extractedfor a grid point situated approximately 6 km offshore at waterdepth of ≈30 m in the middle part of the study area (Fig. 1).
In a previous paper, Valchev and Trifonova (2009) utilizing the re-sults of wave hindcast for thewestern Black sea shelf, performedwaveclimate clustering and proposed a combined threshold, hereafternamed initial wave threshold. The threshold takes into account waveconditions, in terms of Hs , Tm and θm causing intense sediment trans-port. The threshold discriminates between wave regimes capable oftriggering morphological response and those which do not apprecia-bly affect coastal morphology. Valchev and Trifonova (2009) haveshown that marked morphological changes could be produced only
Fig. 2. Scheme for definition of areas of sub-aerial and submerged beaches, sh
in 20% of all wave events. Following the above mentioned approachthe available model wave data were threshold leveled to differentiatethe events that fall within that particular cluster. After recognition ofevery wave event in the cluster, their durations were determined byapplication of initial wave threshold limit values to their developmentand decay stages. Analysis showed that in general, the durations varyquite widely — from several hours to more than a week. This factbrought forward the issue concerning which of the wave eventscould be regarded as storms and which not. In general, every eventcould be described by its integral (total)wave energy. Herein, it is con-sidered as a reference quantity for wave forcing which encompassesboth intensity and duration of a given wave event. The integral waveenergy for every selected wave event was estimated according to thelinear wave theory by time integration using the correspondingwave height at water depth of the grid point (≈30 m). Thus, eachwave event is described by only one value. Taking into account allwave events over the initial wave threshold the study, nevertheless, fo-cuses on events which integral wave energy values exceed0.15×106 J m−2. Herein, this value is introduced as storm threshold.This threshold limit value corresponds to the integral wave energy ofthe most intensive wave event which occurred during a storm seasonmarked by the least energetic storms (storm of October 2004).
In order to assess themorphological response to a givenwave impact,two indicators for storm-induced morphological changes were exam-ined, namely shoreline retreat and cross-shore (pier) profile evolution.
To study the morphological response, two sets of long-term dataseries were employed. One of the sets corresponds to regular mea-surements of profiles along 9 piers (Fig. 1) carried out in 1971–1978(Nikolov, 1981). The other consists of contemporary data measuredfrom the pier at Kamchiya–Shkorpilovtsi beach in 2008–2010. Forboth datasets, seabed evolution was gaged in an identical manner: ametal pole was lowered from pier decks at points of known coordi-nates and elevation, while horizontally distanced every 2 m. The ac-curacy of this kind of measurements is reported to be in the range5–10 cm depending on the weather conditions (Nikolov and Pykhov,1980). Coordinates of and elevations at the deck points, from whichthe profiles were surveyed, were gaged by means of a theodoliteTeo020 (for the data from the 70s), while for the contemporarydata (pier SHK on Fig. 1) by an autonomous Trimble® Site PositioningSystem with application of RTK CMR+corrections. The precision ofthese data is: horizontally — 0.05 m and vertically — 0.07 m.
Since the exact shoreline position cannot be determined due to swashmotion, it was assigned to the nearest mean sea-level measuring point.Thus, the second indicator – shoreline retreat – is traced as cross-shoremotion of shoreline position. The zero point coincides with beach rear-line.
oreline retreat and average thickness of the eroded and accreted layers.

Fig. 3. Time series of significant wave height, shoreline retreat, average thickness of eroded/accreted layers for sub-aerial and submerged beach, and integral storm energy for piers:A) ALB at Albena beach for period of survey 1973–1978; B) GSN at Golden Sands beach for 1972–1978; C) GSC at Golden Sands beach for 1972–1978; D) GSS at Golden Sands beachfor 1972–1978; E) StCEN at St. Constantine and Elena beach for 1972–1978; F) StCES at St. Constantine and Elena beach for 1973–1978; G) VNN at Varna beach for 1971–1978;H) VNC at Varna beach for 1971–1972; I) VNS at Varna beach for 1971–1977; J) SHK at Shkorpilovtsi beach for 2008–2010. Wave events identified as storms for the time spansof measurements are shown at the uppermost panel, as some of the important events are additionally highlighted. The bars' height corresponds to the amount of integralstorm energy. The next two panels from top to bottom illustrate time series of thickness of eroded and accreted layer of submerged (second panel) and sub-aerial (thirdpanel) beach. The average thickness is estimated separately for eroding and accreting zones of the profile. The subsequent panel depicts the shoreline displacement as the zerothtick on the vertical axes (which is not shown on all figures) matches up the beach rear-line. Herein, the shaded area represents the width of the active beach during every periodof survey. Ticks on the bottom of this panel show the time of the cross-shore profile measurements. Finally, on the last panel, continuous time series of significant wave heightare shown that give information about wave conditions. Dashed vertical lines highlight the weak events at the beginning of the storm season.
85E.V. Trifonova et al. / Geomorphology 143–144 (2012) 81–94

Fig. 3 (continued).
86 E.V. Trifonova et al. / Geomorphology 143–144 (2012) 81–94
For the first set of data, profile evolution was surveyed once permonth, except for Varna beach (Fig. 1), where measurements weretaken on a weekly basis for 22 months in a row (1971–1972).Where there were instances of severe storms, additional post stormmeasurements were performed. As for Kamchiya–Shkorpilovtsibeach, it was surveyed regularly for 18 months. In Table 2 a summaryof measurement periods at every pier is presented, as well asminimumand maximum intervals between two successive surveys.
The minimum time span between two successive measurementsis one day, and it is related to the survey of post-storm recovery(Table 2). A number of such measurements were performed at thebeaches at Varna and Golden Sands after the storm of January1972. There are three considerable interruptions in the line ofmeasurements (of more than two months) at piers GSS and StCES in
September–October 1972, 1973 and 1977, respectively, due to largescale experiments carried out elsewhere.
In order to quantify the morphological response, two consecutivelymeasured cross-shore profiles were brought into comparison. Thus, onone hand it was possible to determine the zones of erosion and accretionand, on the other, to estimate the relevant extent of shoreline retreat.
The analysis of profile evolution allows limiting the zones oferosion and accretion. A scheme that corresponds to the impact ofa real event – the storm of January 1977 – is presented in Fig. 2.The average thickness of the eroded (TEL) and/or accreted layer(TAL) is estimated as the ratio between erosion (Ser) and accretionarea (Sac), on one hand, and the width of eroded layer (Ler) andaccreted layer (Lac), on the other. Analysis of the available datashowed different response of sub-aerial and submerged beach to

Fig. 3 (continued).
87E.V. Trifonova et al. / Geomorphology 143–144 (2012) 81–94
the wide range of storm events with different impact. That is whythese profile portions were studied separately. This separation isperformed by taking into account the shoreline position at the initialprofile.
Furthermore, to comprehend the nature of given morphologicalchanges it was of high significance to recognize the ‘principal’ waveevents that caused them. For that reason, wind and wave hindcastdata were examined in detail in order to match profile evolutionto relevant wave events which occurred in the time-span between
two consecutive measurements. In instances when there had beenno storm, then the most energetic wave event in that time periodwas recognized as a driver. In contrast, when more than one eventand/or storm had taken place, the observed changes were attributedto the most intensive one. The described approach enables us tointerconnect storm intensity and magnitude of morphological re-sponse at five beaches along the northern coastal area of Bulgaria,which allows the definition of critical storm thresholds for morpho-logical change.

Fig. 3 (continued).
88 E.V. Trifonova et al. / Geomorphology 143–144 (2012) 81–94
Another issue to discuss is: which morphological changes are tobe regarded as significant? Lee et al. (1998) posed a fundamentalquestion: “whether beach near-shore profile response over yearsto decades is simply the cumulative result of seasonal scale processesor longer-scale processes are also at work?” Generally speaking,seasonal beach cycles are attributed to seasonal variations in theincident wave energy level causing a cross-shore sediment exchange
Fig. 3 (continued).
between the sub-aerial beach and surf zone, resulting in wide,non-barred beaches in summer and narrow, barred beaches inwinter (Hayes and Boothroyd, 1969). However, it was demonstrated(Masselink and Pattiaratchi, 2001) that beach width changes on mostbeaches along the Perth coasts are not caused by variations in thewave energy level, but mainly reflect seasonal changes in the littoraldrift direction. Bearing these statements in mind, we assume that onlythose morphological changes that exceed the typical seasonal scale aresignificant. Such changes were determined through examination of awide range of gaged cross-shore profile changes. Thus, the associatedwave regimes are considered in determination of the first soughtthreshold — the one for significant morphological changes.
Furthermore, the availability of both measured (already describedin this section) and previously published data about extreme stormimpact contributed to the introduction of a second storm threshold:a level over which the storms are regarded as able to cause damageto infrastructure and to threaten human life and occupation. In partic-ular we refer to the most widely studied and cited storm in the west-ern Black Sea — that of February 1979 (Stakev, 1980; Belberov et al.,1982; Davidan et al., 2006; Trifonova et al., 2010).
We consider that scatter analysis is a suitable methodology foradequate assessment of cause-and-effect relations. It is based onleast-squares fit between storm impact and storm energy. Results,discussed in Section 4, are statistically significant at the 95% confidencelevel.
4. Results
About 300 wave events were identified after application of theinitial wave threshold to data series from wave hindcast. However,only 48 of them were considered important as their integral energyexceeded the storm threshold. Twenty of these took place in Januaryand February, while eleven — in March and December. Six of them,namely storms of January 1972, December 1972, February 1976,October 1976, January 1977 and March 2010 (Fig. 3) were particularlysevere with integral energy larger than 0.3×10⁶ J m−2. Some of themhad produced not only significant morphological changes, but alsodamage, recorded in scientific and “gray” literature. On the other hand,there are weak to moderate wave events which are not consideredstorms but still had a significant erosion impact on the coast. According

Fig. 3 (continued).
Fig. 3 (continued).
89E.V. Trifonova et al. / Geomorphology 143–144 (2012) 81–94
to the data these are the less energetic storms at the beginning of theseason.
Therefore, it would be reasonable to reveal the pattern of thosewave events/storms that cause major beach erosion and/or shorelineretreat. Graphical representation of all data available for analysis thatis, significant wave height, integral energy of storms over the stormthreshold, shoreline position and profile evolution of sub-aerial andsubmerged beach for all study sites is shown in Fig. 3. The data visu-alization is organized in a way that morphological changes can easilybe related to a given event of known intensity. Furthermore, inTable 3 shoreline retreats for the six storms, particularly highlightedin the first paragraph of this section, are presented.
All major storms had similar wind and wave patterns. In thephases of full storm development winds were from the easternquarter, while in decay stages of the storms of October 1976, January1977 and March 2010, they became northeasterly. At the same timein all storm phases wind waves were predominantly easterly. As awhole, storm duration varied from 4–5 days (e.g. storms Mar-10 andFeb-76) to 7–8 days (e.g. storms Jan-77, Oct-76 and Dec-77). Meanwind velocity exceeded values of 20 m·s−1. For the storm of January1977 in particular, mean wind velocity did not fall beneath 25 m·s−1
for about 24 h, as the maximum value was 27.4 m·s−1. Significantwave height in the storm peak varied from 3.7 m to 4.7 m.
For the period 1971–1978 the average total wave energy ofall events over the initial wave threshold was calculated as2.0×106 J m−2, while the total wave energy only for events in season1976–1977 is 2.6×10⁶ J m−2. Thus, this storm season appears to bethe most intensive one. Moreover, this is the only storm seasonwithin which two major storms (Oct-76, Jan-77) with integralenergy more than 0.3×10⁶ J m−2 occurred.
The earliest event (Oct-76) was the first intense autumn storm withintegral wave energy of 0.7×10⁶ J m−2. There had been a few waveevents before this one, but none of them crossed the storm threshold of0.15×106 J m−2. During its most energetic stage, which lasted approxi-mately 2.5 days, the significant wave height was larger than 3 m. If we

Table 3Severe storms that occurred during 1971–1978 and 2008–2010 and related maximum shoreline retreats.
Beach Severe storms/Maximum shoreline retreat [m]
01/1972 12/1972 02/1976 10/1976 01/1977 03/2010
Albena NA NA 12 12 14 NAGolden Sands 6 2 2 0 12 NASts. Constantine and Elena 4 0 0 10 6 NAVarna 12 0 8 8 10 NAKamchiya–Shkorpilovtsi NA NA NA NA NA 8
90 E.V. Trifonova et al. / Geomorphology 143–144 (2012) 81–94
look into the whole 60-year period of wave data this is the most intensestorm that had occurred in September or October. This storm caused ero-sion of the sub-aerial beaches estimated as: 0.6 to 0.8 m at Albena,St. Constantine and Elena and Varna (Fig. 3A, E, I); while at Goldensands it was 0.3–0.4 m. (Fig. 3B–D). Maximum erosion of 0.6 m wasdetermined for the submerged beaches of St. Constantine and Elenaand Varna (Fig. 3E, I). The shoreline retreat at Albena, St. Constantineand Elena and Varna was 12 m, 10 m and 8 m, respectively (Table 3).
In January 1977 two successive storms occurred with a one-weekinterval in between, but a time-span of such length was insufficientfor beach recovery. The second storm (Jan-77) was quite severe, infact it was one of the five heaviest storms for the period 1948–2010.The stage of its full development lasted approximately 48 h, as signifi-cant wave height retained values higher than 4 m. All sub-aerialbeaches were under intensive erosion with maximum values between0.6 and 0.9 m for Golden Sands and St. Constantine and Elena(Fig. 3B–E). In contrast, in almost all submerged portions neithererosion nor accretion prevailed, except for Albena beach wherethe maximum thickness of the eroded layer (TEL) was estimated to be0.7 m (Fig. 3A). This storm caused shoreline retreat of 14 m at Albenabeach, 10 m at Varna and 12 m at Golden Sands (Table 3).
The storm of January 1972 is the only one that lasted for morethan 10 days, its maximum wind velocity was only 17.4 m·s−1 andHs — 2.8 m. Nevertheless, due to its long duration at Golden Sandsand St. Constantine and Elena beaches it caused profile erosion from0.2 m to 0.5 m (Fig. 3B–F). At Varna, on the submerged beach theaverage TEL reached 0.6 m (Fig. 3H), while accretion was estimated tobe 0.9 m. Maximum shoreline retreat of 12 m was also observed atVarna beach. Eroded sediments were deposited at depths of morethan 2 m.
Another heavy storm within 1971–1978 is that of December 1972.At sub-aerial beaches of Golden sands, St. Constantine and Elena andVarna it caused erosion from 0.2 m to 0.4 m (Fig. 3B, C, E, J), while atsubmerged profiles equilibrium between of erosion and accretion wasobserved. Shoreline retreat was negligible. The eroded sand wasdeposited on the offshore profile portion. Maximum TEL on Varnabeach was estimated at 0.5 m (Fig. 3G).
The storm of February 1976 caused significant erosion only on thesub-aerial beaches of Albena (ALB) — 0.2 m (Fig. 3A), Golden Sands(pier GSN, Fig. 3B)— 0.4 m andVarna (VNS, Fig. 3I)— 0.7 m.Maximumshoreline retreat was estimated at Albena (12 m) and Varna (8 m)beaches. For all other sub-aerial beaches the thickness of eroded andaccreted layers is comparable. Significant erosion was estimated onlyon the submerged beach at Varna: 0.3–0.5 m (Fig. 3G, I).
At the beginning of March 2010 a short, but very intense stormoccurred in the western Black Sea. This event was distinguishedwith all features of severe storms known from the historical overview.It lasted only four days, but the wind blew persistently, turning fromESE to ENE. Maximum Hs reached almost 4.20 m. Substantial erosionin the order of 0.9 m was observed only on the submerged profiles,while sub-aerial beaches underwent less severe impact (Fig. 3J).
Pruszak and Nikolov (1992) stated that two types of cross-shoreprofiles are typically formed at beaches on the Bulgarian coast: summerand winter ones. The summer profiles are formed gradually in fairweather conditions, while transition to winter profiles takes place
during the first intense event of the season. In some cases this couldbe an early autumn storm (in September or October) and in othercases — even a late summer event (usually in August). As a result,sub-aerial and upper submerged beaches undergo considerable erosion,as the eroded sand is deposited lower along the profile but within thepier length. In cases of more intense events, the deposition couldoccur even farther offshore. Impact of described wave events could betraced at the beginning of every storm season: late summer eventsin August 1975, September 1975, August 1977 or early autumn inSeptember 1971, October 1972, and September 1973 and September2009 (Fig. 3A–E, G, I, J). The summer events that had caused significanterosion were either slightly above the initial storm threshold level value(Aug-75, Sep-75) or slightly below it (Aug-77). During the stormof August 1975 the TEL at pier ALB was 0.5 m (Fig. 3A) and at pierGSC — 0.2 m (Fig. 3C), while for September 1975 at piers GSS andVNN it was 0.3 m (Fig. 3D, G). St. Constantine and Elena beach wasalso influenced by these storms, as TEL at pier StCEN was 0.4 m(Fig. 3E). The summer event (Aug-77) caused erosion up to 0.8 m atpier StCEN and 0.5 m at pier ALB. The autumn wave events that is thestorms of September 1971, 1973 and 1974, crossed the initial stormthreshold, but were a long way below the storm threshold. They erodedthe beaches of Varna (0.3–0.4 m) (Fig. 3G, I), St. Constantine andElena (up to 0.4 m) (Fig. 3E) and Golden Sands (0.3 m) (Fig. 3D).
In October 1972, a group of consecutive wave events took place,but only the first of them crossed the storm threshold level. Theseevents eroded the sub-aerial (up to 0.4 m), as well as the submerged(up to 0.3 m) beaches of Golden sands, St. Constantine and Elena andVarna (Fig. 3B, C, E, G).
Although the storm of November 1974 (Fig. 3A–C, E–G) crossedthe storm threshold level, it was not the first strong event in 1974.Nevertheless, it caused substantial erosion on the sub-aerial beachat piers ALB (0.3 m), GSN (0.5 m), GSC (0.6 m), StCEN (0.7 m) andStCES (0.5 m), and on the submerged beach at piers StCEN (0.2 m),StCES (0.2 m) and VNS (0.2 m). A similar event also occurred inSeptember 2009 (Fig. 3J).
Only in 1976 there had been no such moderate autumn eventsince the role was played by the severe storm of October 1976,described above.
5. Discussion
A number of issues hamper the accurate quantification of stormimpact on the coast. Firstly, the frequency of measurements is notalways in accordance with pre- and post-storm concept. Therefore,only in some cases can the impact of a given storm be judged withoutthe additional morphological signal caused by fair-weather conditions.Usually, during an interval between two surveys, either a group ofwave events of variable intensity or a major storm succeeded by aswell event had occurred.
Secondly, only a small number of intense storms had considerableerosional impact on the shoreline and/or profile. The behavior ofindicators for storm-induced morphological changes was observedto differ, depending on their inherent dynamics. The first one,shoreline alteration, seems to be less indicative as a considerableretreat of shoreline was observed only after few of the most severe

91E.V. Trifonova et al. / Geomorphology 143–144 (2012) 81–94
storms. Shoreline position was estimated to vary slightly around aquasi stable state after the majority of storms. The explanationmight be that displacements of the shoreline were effected overa smaller time scale in comparison to the measurements taken,therefore, the measurements did not reveal the actual changes.This is confirmed by the fact that considerable shoreline retreatwas recorded when surveys were done immediately or a short timeafter storms. These findings are in accordance with the statementof Cooper et al. (2004) that analysis of the historic shoreline recorddoes not provide definitive conclusions regarding the role of stormsin coastal evolution. They claim that this is partially due to the longintervals between morphological surveys in general, and partiallybecause of the inter-storm reworking.
The analysis of the second indicator, cross-shore profile evolution,showed no evident predominance of eroded over accreted portionsof the profile. Some of the profile changes resemble the classicalscheme of cross-shore sediment transport patterns that foreseeserosion at the upper and accretion at the middle and/or lowerparts of the profile. In other cases, however, a negligible shorelineretreat was accompanied by significant erosion of either sub-aerialor submerged beaches. Nevertheless, the profile evolution can bemore clearly related to a given storm intensity. This might be due tothe fact that the shape of thepost-stormseabedprofile is slow to changeand preserves evidence for storm impact for a longer time-span. Hence,the record of morphological response could be traced even some timeafter the storm was over. Besides, excluding some specific cases, themore energetic the event was, the larger the measured erosion was.For that reason, this indicator's behavior is considered more useful forthe definition of the threshold for significant change.
Three groups of events able to cause significant profile change canbe distinguished. Logically, severe storms fall within the first group.However, morphological response of similar order was also measuredfor wave events that not always cross the storm threshold (dashedlines on Fig. 3A–J). These are the first important events in eachstorm season (second group). They produce more erosion than thesucceeding ones which have similar or even higher energy. Thisissue is considered as another obstacle in finding a straightforwardrelationship between impact and response. In the third group casesare included, wherein more or less significant morphologicalresponse was recorded but there was no particular event towhich it could be attributed. The analysis of the available series showsthat such a situation is common for weak to moderate regimes withwaves propagating obliquely to the shore. In such conditions, cross-shore sediment transport is negligible with respect to long-shore drift.Hence, profile evolution depends on the redistribution of the sandalong the beach. For example, Dachev and Cherneva (1979) showedthat redistribution along the coastal segment Albena–St. Constantineand Elena due to long-shore sediment transport is more dynamic incomparison to the neighboring shore segments when exposed tonorth-easterly winds. According to our data a similar effect wasobserved for Varna beaches when exposed to easterly winds. Over alonger time span these processes could be of the same order as thestorm impact itself. This explains (partially) the fact that significantchanges can occur even if there were no important events. Since thispaper is focused on the storm impact, these morphological changesare not taken into further consideration.
There is a special instance of morphological response due to a suc-cession of several strong storms. In addition, the period of fair-weath-er conditions between the storms was not enough for the beach torecover. In such situations, the first events caused more erosion tothe sub-aerial beach and less to the submerged, whilst for the succes-sive event(s) the situation was reversed. This issue deserves a morethorough investigation.
In the light of the above discussion it appears essential to estimatethe typical scales of both erosion and storm energy. Data show that anaverage thickness of the eroded layer (TEL) of about 0.2–0.3 m is the
typical seasonal variability to which a retreat of about 2–4 m corre-sponds. However, the erosion caused by the first storms of the seasoncan measure up to 0.5 m. In both cases, the profile recovers during thepost-storm period. This kind of response is usually caused by moder-ate wave regimes. On the other hand, the largest average TEL for allstudied beaches is about 1 m. This means that the typical seasonalvariability is about 30–50% of the extreme erosion.
Looking at the integral wave energy, its largest values varybetween 0.8 and 0.9×10⁶ J m−2, while for events causing morpholog-ical response on a seasonal scale this parameter was estimated at0.6×106 J m−2, i.e. 60–70% of the maximum. Thus, the discrepancy ofscales complicates the separation of events inducing seasonal responsesinto a single group, in order to consider the rest of the events capable ofproducing significant change or (catastrophic) damage.
The last and probably the most important issue that preventsthe accurate quantification of storm impact on the coast are thesite specific geomorphic properties, which are likely to promote aspatially non-uniform pattern of storm response. Furthermore,identification of the impact is additionally hampered by the lackof high-resolution observational data of both coastal response andstormpattern. As a result, one and the same event can result in differentresponses at different beaches, and sometimes for different locations(piers) within the same beach.
The natural settings, such as exposure and shore slope, but alsothe manmade environment should be taken into account when asses-sing the storm impact. For example, it is important to know that theT-shaped groin at Golden Sands beach (Fig. 1) was constructed in1976. Hence, it had no influence on long-shore sediment drift duringthe first half of the period 1971–1978. In contrast, during the secondhalf, the northward sediment flux had been cut off by this structureand was not able to influence the sediment pattern in the vicinity ofpiers GSN and GSC. The same is true for the southward sedimentflux and the pier GSS. The marina at the Golden Sands resort was con-structed in 1979 and therefore had no effect on sediment transport onthis coastal segment prior to that date.
In summary, there are only a small number of storms such asthose of January 1972, December 1972 and February 1976 (Fig. 3)that should be regarded as significant events able to cause morpho-logical response beyond the seasonal scale. However, the measuredprofile erosion and shoreline retreat after the storms of October1976 and January 1977 (Fig. 3) greatly exceeded even the impact ofquite intense storms.
As mentioned in Section 4, there is one particular storm, that ofFebruary 1979, which is not present in the studied time series.However, it caused severe damage along the entire Bulgariancoast, as the average TEL was estimated to be more than 1 m.
The analysis of time series presented in Fig. 3 appeared useful fordetermination of typical scales of a number of processes, since itallowed a set of beach response patterns to be revealed. However,the lack of a straightforward match between impact and response,blurring of boundaries between different cases and the great varietyof local dynamic patterns impede the explicit definition of the thresh-olds. For that reason, assuming that this task requires a more generalapproach, the authors applied a cause-and-effect analysis visualizedin terms of scatter charts (Fig. 4).
In general, it could be expected that erosion on the sub-aerialbeach would be larger than that of the submerged beach. For exam-ple, Trifonova and Andreeva (2008) showed that the rate of wave en-ergy dissipation is higher in the upper surf zone. On the other hand,the rate of erosion is intensified considerably by swash processes. Infact, we observed that changes on the majority of studied sub-aerialbeaches, Albena in particular (Fig. 4A), more clearly reflect thestorm intensity.
The comparatively small rate of beach erosion observed at GoldenSands (smaller dispersion of data points in Fig. 4B–D) finds explana-tion in the geomorphic setting: the rocky Aladzha bank (Fig. 1) acts

Fig. 4. Scatter diagram of the dependence of the average thickness of the eroded layer on the integral wave energy over the storm duration: gray dots — data points; dashed line —
best least-square fit for pier ALB (A), pier GSN (B), pier GSC (C), pier GSS (D), pier StCEN (E), pier StCES (F), pier VNN (G), pier VNC (H), pier VNS (I), pier SHK (J).
92 E.V. Trifonova et al. / Geomorphology 143–144 (2012) 81–94
93E.V. Trifonova et al. / Geomorphology 143–144 (2012) 81–94
as a natural submerged breakwater since the minimum water depthabove it is about 4 m. Besides, the distance of 200–400 m betweenthe shoreline and the bank is narrow. These features predetermineweaker morphological response of Golden Sands beach to stormswith various extent of impact. The situation is similar for the pocketbeach, where the StCES pier is located. It is the smallest beach of allconsidered in this study, which explains the negligible morphologicalchanges observed on both sub-aerial and submerged beach (Fig. 4F).
Speaking about the length of data series, the series for piers VNCand SHK (Fig. 3H, J) are rather short and in addition no considerablestorm occurred within their time-span (Fig. 4H, J). But, even shortdata coverage might be quite indicative as in the case of Shkorpilovtsibeach due to the occurrence of a significant event — the storm ofMarch 2010 (Fig. 4J). On the other hand, Varna beach is not influ-enced by the most energetic storms – those coming from northwest –due to its exposure. This explains why despite the rather long seriesobtained for VNN and VNS the average erosion hardly exceeds 0.5 m(Fig. 4G, I).
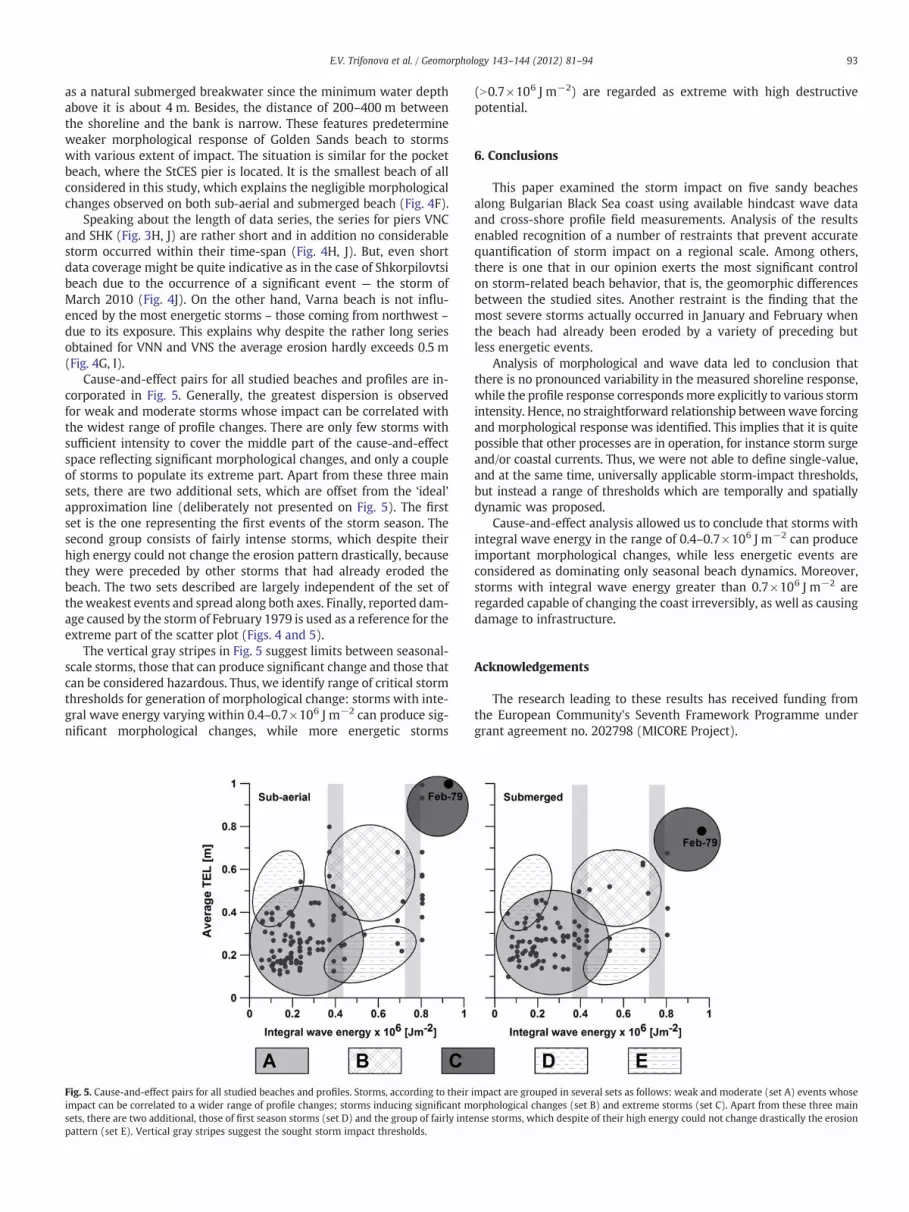
Cause-and-effect pairs for all studied beaches and profiles are in-corporated in Fig. 5. Generally, the greatest dispersion is observedfor weak and moderate storms whose impact can be correlated withthe widest range of profile changes. There are only few storms withsufficient intensity to cover the middle part of the cause-and-effectspace reflecting significant morphological changes, and only a coupleof storms to populate its extreme part. Apart from these three mainsets, there are two additional sets, which are offset from the ‘ideal’approximation line (deliberately not presented on Fig. 5). The firstset is the one representing the first events of the storm season. Thesecond group consists of fairly intense storms, which despite theirhigh energy could not change the erosion pattern drastically, becausethey were preceded by other storms that had already eroded thebeach. The two sets described are largely independent of the set ofthe weakest events and spread along both axes. Finally, reported dam-age caused by the storm of February 1979 is used as a reference for theextreme part of the scatter plot (Figs. 4 and 5).
The vertical gray stripes in Fig. 5 suggest limits between seasonal-scale storms, those that can produce significant change and those thatcan be considered hazardous. Thus, we identify range of critical stormthresholds for generation of morphological change: storms with inte-gral wave energy varying within 0.4–0.7×10⁶ J m−2 can produce sig-nificant morphological changes, while more energetic storms
Fig. 5. Cause-and-effect pairs for all studied beaches and profiles. Storms, according to theirimpact can be correlated to a wider range of profile changes; storms inducing significant msets, there are two additional, those of first season storms (set D) and the group of fairly intepattern (set E). Vertical gray stripes suggest the sought storm impact thresholds.
(N0.7×106 J m−2) are regarded as extreme with high destructivepotential.
6. Conclusions
This paper examined the storm impact on five sandy beachesalong Bulgarian Black Sea coast using available hindcast wave dataand cross-shore profile field measurements. Analysis of the resultsenabled recognition of a number of restraints that prevent accuratequantification of storm impact on a regional scale. Among others,there is one that in our opinion exerts the most significant controlon storm-related beach behavior, that is, the geomorphic differencesbetween the studied sites. Another restraint is the finding that themost severe storms actually occurred in January and February whenthe beach had already been eroded by a variety of preceding butless energetic events.
Analysis of morphological and wave data led to conclusion thatthere is no pronounced variability in the measured shoreline response,while the profile response correspondsmore explicitly to various stormintensity. Hence, no straightforward relationship betweenwave forcingand morphological response was identified. This implies that it is quitepossible that other processes are in operation, for instance storm surgeand/or coastal currents. Thus, we were not able to define single-value,and at the same time, universally applicable storm-impact thresholds,but instead a range of thresholds which are temporally and spatiallydynamic was proposed.
Cause-and-effect analysis allowed us to conclude that storms withintegral wave energy in the range of 0.4–0.7×10⁶ J m−2 can produceimportant morphological changes, while less energetic events areconsidered as dominating only seasonal beach dynamics. Moreover,storms with integral wave energy greater than 0.7×10⁶ J m−2 areregarded capable of changing the coast irreversibly, as well as causingdamage to infrastructure.
Acknowledgements
The research leading to these results has received funding fromthe European Community's Seventh Framework Programme undergrant agreement no. 202798 (MICORE Project).
impact are grouped in several sets as follows: weak and moderate (set A) events whoseorphological changes (set B) and extreme storms (set C). Apart from these three mainnse storms, which despite of their high energy could not change drastically the erosion

94 E.V. Trifonova et al. / Geomorphology 143–144 (2012) 81–94
References
Balev, I., 2002. Distribution of the Population by Regions, Municipalities, Towns andVillages. National Stat. Ins, Sofia, Bulgaria, p. 253 (In Bulgarian).
Belberov, Z., Zahariev, V., Krylov, Y., Kostichkova, D., Manyarova, R., Polyakov, Y., 1982.Analysis of the catastrophic storm in February 1979 near the Bulgarian Black Seacoast. Oceanology 9, 3–12 (in Bulgarian).
Booij, N., Ris, R.C., Holthuijsen, L.H., 1999. A third-generation wave model for coastalregions, Part I, Model description and validation. Journal of Geophysical Research104 (C4), 7649–7666.
Cherneva, Z., Valchev, N., Petrova, P., Andreeva, N., Valcheva, N., 2003. Offshore windwave distribution in Bulgarian part of the Black Sea. Proceedings of the Institutionof Oceanography 4, 10–15 (in Bulgarian).
Cooper, J.A.G., Jackson, D.W.T., Navas, F., McKenna, J., Malvarez, G., 2004. Identifyingstorm impacts on an embayed, high-energy coastline: examples from westernIreland. Marine Geology 210, 261–280.
Dachev, V., Cherneva, Z., 1979. Long-shore sediment movement at the BulgarianBlack Sea coast between c. Sivriburun and the Burgas Bay. Oceanology 4, 30–41(in Bulgarian).
Davidan, I., Valchev, N., Belberov, Z., Valcheva, N., 2006. Assessment of the reanalyzedwind field accurateness for wave modelling purposes in the Black Sea region. Proc.Int. Conf.: EuroGOOS — European Operational Oceanography: Present and Future,Brest, France, pp. 801–805.
Günther, H., Hasselmann, S., Janssen, P.A.E.M., 1992. Wave Model Cycle 4, Tech. ReportNo. 4. DeutschesKlimaRechenZentrum, Germany (91 pp.).
Hayes,M.O., Boothroyd, J.C., 1969. Storms asmodifying agents in the coastal environment.In: Hayes, M.O. (Ed.), Coastal Environments. NEMassachusetts, Depart. of Geol., Univ.Massachusetts, Amherst, USA, pp. 290–315.
Hill, H.W., Kelley, J.T., Belknap, D.F., Dickson, S.M., 2004. The effects of storms andstorm-generated currents on sand beaches in Southern Maine, USA. Marine Geology210, 149–168.
Kalnay, E., Kanamitsu, M., Kistler, R., Collins, W., Deaven, D., Gandin, L., Iredell, M., Saha,S., White, G., Woollen, J., Zhu, Y., Chelliah, M., Ebisuzaki, W., Higgins, W., Janowiak,J., Mo, K.C., Ropelewski, C., Wang, J., Leetmaa, A., Reynolds, R., Jenne, R., Joseph, D.,1996. The NCEP/NCAR reanalysis project. Bulletin of the American MeteorologicalSociety 77, 437–471.
Koller, G., 2005. Risk Assessment and Decision Making in Business and Industry:A Practical Guide, 2nd Edition. Chapman and Hall/CRC Press, Boca Raton, FL.(352 pp.).
Komen, G.J., Cavaleri, L., Donelan, M., Hasselmann, K., Hasselmann, S., Janssen, P.A.E.M.,1994. Dynamics andModelling of OceanWaves. Cambridge Univ, Press, Cambridge,UK. (532 pp.).
Kyutchukova, M. (Ed.), 1982. Reference Book of Climate of PR Bulgaria — Wind. Publ.H.Nauka i izkustvo, IV, Sofia, Bulgaria (382 pp.).
Lee, G., Nicholls, R., Birkemeier, W., 1998. Storm-driven variability of the beach–nearshore profile at Duck, North Carolina, USA, 1981–1991. Marine Geology148, 163–177.
Masselink, G., Pattiaratchi, C.B., 2001. Seasonal changes in beach morphology along thesheltered coastline of Perth, Western Australia. Marine Geology 172, 243–263.
Mishev, K., Popov, V., Dimitrov, V., Valkanov, A., Rozhdestvenski, A., 1978. Physical andgeographical features. In: Valkanov, A., Marinov, H., Danov, H., Vladev, P. (Eds.),Black Sea — Collection. Publ. House “G.Bakalov”, Varna, pp. 35–86.
Morton, R.A., Gibeaut, J.C., Paine, J.G., 1995. Meso-scale transfer of sand during and afterstorms: implications for predictions of shoreline movement. Marine Geology 126,161–179.
Nikolov, H., 1981. The thickness of the dynamical layer and tendencies in the variationof the profile in front of the beach strips of the resort complexes Albena, ZlatniPjasaci and Druzhba. Oceanology 8, 60–75 (in Bulgarian).
Nikolov, H., Pykhov, N., 1980. Brief deformations along the profile of the underwatercoastal slope during storm. In: Belberov, Z., Zahariev, V., Kuznetsov, O., Massel, S.,Pykhov, N., Rojdestvensky, A., Filyushkin, B. (Eds.), Interaction of the atmosphere,hydrosphere and lithosphere in the nearshore zone. Results of the InternationalExperiment “Kamchiya '77”. Publ. H. Bul. Acad. Sc, Sofia, Bulgaria, pp. 229–237(in Russian).
Popov, V., Mishev, K., 1974. Geomorphology of the Bulgarian Black Sea Coast and Shelf.Publ. H. Bul. Acad. Sc, Sofia (245 pp. (in Bulgarian)).
Potapova, E.I., 1958. Summer north-east storms in Black and Azov seas. Proceedingsof Marine Hydrophysical Institute Academy of Sciences USSR 12, 97–116(in Russian).
Pruszak, Z., Nikolov, H., 1992. Analysis of type-profiles in the conditions of the coastalzones of Poland and Bulgaria. Proceedings of the Institution of Oceanography 1,65–73 (In Bulgarian).
Sorkina, A.I. (Ed.), 1974. Climatic Handbook of the Black Sea. Gidrometeoizdat, Moscow,Russia (406 pp. (in Russian)).
Stakev, M., 1980. About the break-down state of some coastal structures afterthe storm in February 1979. Journal of Shipbuilder Navigation 10, 26–30(in Bulgarian).
The SWAN Team, 2011. SWAN Cycle III version 40.85. User Manual. Delft Univ. Tech.,Delft, The Netherlands. (Available online at) http://www.swan.tudelft.nl.
Trifonov, V., Trifonova, L., 1988. Typification of synoptic situations initiating high wavesalong Black Sea coast. Problems Geography 2, 42–47 (in Bulgarian).
Trifonova, E., Andreeva, N., 2008. Wave energy impact on the coastal zone. Comptesrendus de l'Académie Bulgare des sciences: sciences mathématiques et naturelles61, 1323–1334.
Trifonova, E., Valchev, N., Andreeva, N., Eftimova, P., 2010. Reconstruction of severestorms in the Western Black Sea and assessment of their impact on the coast.Proc. Int. Conf.: Marine Sciences and Technologies — Black Sea, Varna, Bulgaria,pp. 254–260.
Uppala, S.M., Kallberg, P.W., Simmons, A.J., Andrae, U., Bechtold, V.D., Fiorino, M., Gibson,J.K., Haseler, J., Hernandez, A., Kelly, G.A., Li, X., Onogi, K., Saarinen, S., Sokka, N.,Allan, R.P., Andersson, E., Arpe, K., Balmaseda, M.A., Beljaars, A.C.M., Van De Berg, L.,Bidlot, J., Bormann, N., Caires, S., Chevallier, F., Dethof, A., Dragosavac, M., Fisher, M.,Fuentes, M., Hagemann, S., Holm, E., Hoskins, B.J., Isaksen, L., Janssen, P.A.E.M.,Jenne, R., McNally, A.P., Mahfouf, J.F., Morcrette, J.J., Rayner, N.A., Saunders, R.W.,Simon, P., Sterl, A., Trenberth, K.E., Untch, A., Vasiljevic, D., Viterbo, P., Woollen, J.,2005. The ERA-40 re-analysis. Quarterly Journal Royal Meteorological Society 131,2961–3012.
Valchev, N., Trifonova, E., 2009. Wave climate clustering to define threshold valueswith respect to the expected morphological response. Journal of Coastal Research56, 1666–1670.
Valchev, N., Davidan, I., Belberov, Z., Palazov, A., 2007. Practicability of wind wavessimulations based on the global reanalysis wind fields in the Black Sea deep andshallow waters. Proc. Int. Conf.: Port Development and Coastal Environment,Varna, Bulgaria, pp. 185–191.
Valchev, N., Davidan, I., Belberov, Z., Palazov, A., Valcheva, N., 2008. Estimation of windwave climate of the Western Black Sea during the last 50 years. Proc. Int. Conf.:Marine Sciences and Technologies — Black Sea, Varna, Bulgaria, pp. 231–239.
Vassilev, T., 1980. On the peculiarities of the heavy storms along the Bulgarian BlackSea coast during years 1976–1979. Journal of Hydrology and Meteorology 1,53–56 (in Bulgarian).


