Embed Size (px)
Citation preview

IEEE TRANSACTIONS ON INDUSTRIAL ELECTRONICS, VOL. 57, NO. 2, FEBRUARY 2010 587
DC/DC Converter Design for Supercapacitor andBattery Power Management in Hybrid VehicleApplications—Polynomial Control Strategy
Mamadou Baïlo Camara, Hamid Gualous, Frederic Gustin,Alain Berthon, Member, IEEE, and Brayima Dakyo, Member, IEEE
Abstract—This paper presents supercapacitor (SCAP) and bat-tery modeling with an original energy management strategy in ahybrid storage technology. The studied dc power supply is com-posed of SCAPs and batteries. SCAPs are dimensioned for peakpower requirement, and batteries provide the power in steadystate. A bidirectional dc/dc converter is used between SCAPs andthe dc bus. Batteries are directly connected to the dc bus. Theoriginality of this study is focused on SCAP behavior modelingand energy management strategy. The proposed strategy is basedon a polynomial (RST) controller. For reasons of cost and existingcomponents (not optimized) such as batteries and semiconductors,the experimental test benches are designed in reduced scale. Thecharacterized packs of SCAPs include two modules of ten cellsin series for each one and present a maximum voltage of 27 V.The proposed strategy is implemented on a PIC18F4431 micro-controller for two dc/dc converter topology controls. Experimentaland simulation results obtained from the polynomial control strat-egy are presented, analyzed, and compared with that of classicalproportional–integral control.
Index Terms—Batteries, buck–boost converter, dynamiccontrol, electric hybrid vehicle (HEV), energy management,energy storage, polynomial control strategy, power management,supercapacitors.
I. INTRODUCTION
MANY research works are undertaken on technologiesof future vehicles. Battery power request in transient
state decreases its life span. To solve this problem of batteryand supercapacitor (SCAP) hybridization, there must be goodenergy management between these devices which enables thereduction of the battery size and improves its life span. The
Manuscript received January 26, 2009; revised June 1, 2009. First publishedJune 16, 2009; current version published January 13, 2010.
M. B. Camara and B. Dakyo are with the Groupe de Recherche en Elec-trotechnique et Automatique du Havre Laboratory, The University of Le Havre,76600 Le Havre, France (e-mail: [email protected]; [email protected]).
H. Gualous is with the Franche-Comté Electronique Mécanique Thermiqueet Optique—Sciences et Technologies Institute, University of Franche-Comté,90016 Belfort, France (e-mail: [email protected]).
F. Gustin and A. Berthon are with the Franche-Comté ElectroniqueMécanique Thermique et Optique—Sciences et Technologies Institute andthe Institut Universitaire de Technologie de Belfort–Montbéliard, Univer-sity of Franche-Comté, 90016 Belfort, France (e-mail: [email protected]; [email protected]).
Color versions of one or more of the figures in this paper are available onlineat http://ieeexplore.ieee.org.
Digital Object Identifier 10.1109/TIE.2009.2025283
Fig. 1. SCAP and battery HEV topology.
battery and SCAP energy coupling improves the autonomyand performance of the vehicle. For autonomy problems, thetraction battery used until now cannot satisfy the energy needsof future vehicles. An electric hybrid vehicle (HEV) is a vehiclethat combines, in addition to its main energy source (oil andgas), reverse energy storage devices like flywheels, SCAPs,and batteries. These technologies which associate SCAPs andbatteries (Fig. 1) are very promising in short and mediumterms due to the SCAPs’ high dynamic performances and theirlife span of about ten years longer than that of a battery.The SCAPs have power density from 10 to 100 times largerthan that of a battery with an energy density that is muchsmaller. Moreover, these high-power storage devices presentless risk of pollution than batteries. The hybrid vehicle as-sociates the advantages of thermal vehicles (autonomy andflexibility) and electric vehicles (no pollution), but it is notsimple to combine these models, because the devices must beoptimized. The main contribution of this paper presents twoaspects.
The first is based on SCAP behavior modeling with anoriginal method for experimental parameter identification.
The second aspect is focused on a novel strategy of embed-ded energy management using RST controllers.
To validate the proposed method, a SCAP module and twodc/dc converter topologies are designed at reduced scale. Thissolution is due to the reason of cost and existing compo-nents, such as the batteries and the semiconductors. Theseconverters are controlled by a PIC18F4431 microcontroller.The experimental data acquisition system is monitored by usingthe National Instruments Labview software. For hybrid systemsimulations, the SABER software package is used.
0278-0046/$26.00 © 2010 IEEE

588 IEEE TRANSACTIONS ON INDUSTRIAL ELECTRONICS, VOL. 57, NO. 2, FEBRUARY 2010
Fig. 2. Electrical model of SCAPs.
Fig. 3. SCAP module experimental voltage for Isc = 80 A.
II. BATTERY AND SCAP MODELING
A. SCAP Modeling and Characterization
To use SCAPs as energy storage devices [1] in HEV, it isnecessary to associate several cells in series to obtain a highvoltage level since each cell voltage is 2.7 V. The SCAP modelused includes an internal resistance Req and an equivalentcapacitance including two components. The main componentKveq · V varies linearly with the SCAP module voltage, andthe second component C0eq is a constant capacitor [2]. Thestudied electrical behavior model of the SCAP module is shownin Fig. 2. This model describes the immediate behavior of theSCAP in the time range of seconds in response to a charge ordischarge action.
To estimate the SCAP module parameters, a module includ-ing ten cells of the Maxwell Technology SCAPs (BOOSTCAP)is used. This module presents a maximum voltage of 27 V.The parameter estimation is based on the analysis of the SCAPmodule experimental discharge at constant current. The exper-imental voltage measured during the SCAP module dischargeat 80 A is shown in Fig. 3. The early discharge of the moduleis characterized by a voltage drop (ΔV0 in Fig. 3) in internalresistance Req, and this resistance can be estimated by using
Req = Rsc + Rcon =ΔV0
Isc. (1)
The assumed linear behavior of the differential capacitanceC0eq + Kveq · V enables one to estimate the β0 coefficientfrom an approximation of the segment AB (Fig. 4). Aand B have the following coordinates A(t1, Vsc(t1)) andB(t2, Vsc(t2)), respectively. The resulting equation from theseconditions is presented as
β0 ≈∣∣∣∣Vsc(t1) − Vsc(t2)
t2 − t1
∣∣∣∣ ≈ 0.3115. (2)
Fig. 4. AB segment approximation for Isc = 80 A with x = t.
TABLE ISCAP EXPERIMENTAL PARAMETERS
Fig. 5. SCAP charge and discharge current (−80 A, 0, and 80 A) and voltage.
The module capacitances Kveq and C0eq resulting fromexperimental curve analysis can be estimated by (3), where Δtpresents the SCAP module discharge time in seconds. In thefollowing, V1 and ΔV present the SCAP module initial voltageand module voltage variation between V1 and the final voltage(minimum value), respectively:⎧⎨
⎩Kveq =
(1β0
− ΔtΔV
)· Isc
2·V1−0.5·ΔV
C0eq =(
1β0
−(
1β0
− ΔtΔV
)· 2·V1
2·V1−0.5·ΔV
)· Isc.
(3)
The experimental parameters for ten cells of the BOOST-CAP2600F module obtained from (1) and (3) are presented inTable I. To validate the model, the SCAP module was chargedto maximum voltage (27 V) and discharged with constantcurrents of −80 and 80 A, respectively, as shown in Fig. 5. Thecomparison of the simulation and experimental results obtainedfrom these conditions is shown in Fig. 5. This model givesthe SCAP behavior during the charge and discharge, but it islimited, because it does not describe the SCAP behavior beforeand after the charge and discharge, i.e., for Isc = 0. This aspect(self-discharge) is studied in [3]. The proposed SCAP model inthis paper is satisfactory for HEV applications, and it will beused for the global system simulations.
CAMARA et al.: CONVERTER DESIGN FOR SCAP AND BATTERY POWER MANAGEMENT 589
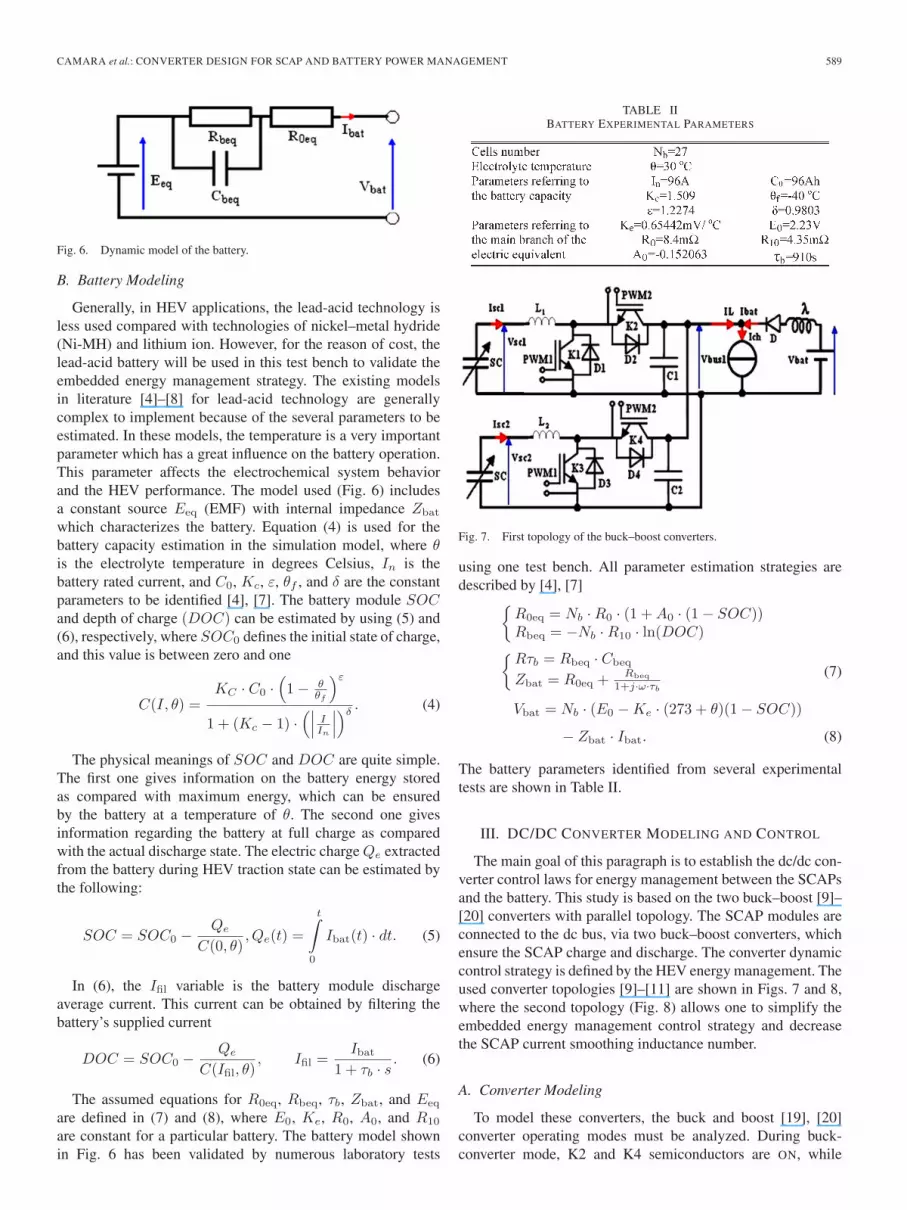
Fig. 6. Dynamic model of the battery.
B. Battery Modeling
Generally, in HEV applications, the lead-acid technology isless used compared with technologies of nickel–metal hydride(Ni-MH) and lithium ion. However, for the reason of cost, thelead-acid battery will be used in this test bench to validate theembedded energy management strategy. The existing modelsin literature [4]–[8] for lead-acid technology are generallycomplex to implement because of the several parameters to beestimated. In these models, the temperature is a very importantparameter which has a great influence on the battery operation.This parameter affects the electrochemical system behaviorand the HEV performance. The model used (Fig. 6) includesa constant source Eeq (EMF) with internal impedance Zbat
which characterizes the battery. Equation (4) is used for thebattery capacity estimation in the simulation model, where θis the electrolyte temperature in degrees Celsius, In is thebattery rated current, and C0, Kc, ε, θf , and δ are the constantparameters to be identified [4], [7]. The battery module SOCand depth of charge (DOC) can be estimated by using (5) and(6), respectively, where SOC0 defines the initial state of charge,and this value is between zero and one
C(I, θ) =KC · C0 ·
(1 − θ
θf
)ε
1 + (Kc − 1) ·(∣∣∣ I
In
∣∣∣)δ. (4)
The physical meanings of SOC and DOC are quite simple.The first one gives information on the battery energy storedas compared with maximum energy, which can be ensuredby the battery at a temperature of θ. The second one givesinformation regarding the battery at full charge as comparedwith the actual discharge state. The electric charge Qe extractedfrom the battery during HEV traction state can be estimated bythe following:
SOC = SOC0 −Qe
C(0, θ), Qe(t) =
t∫0
Ibat(t) · dt. (5)
In (6), the Ifil variable is the battery module dischargeaverage current. This current can be obtained by filtering thebattery’s supplied current
DOC = SOC0 −Qe
C(Ifil, θ), Ifil =
Ibat
1 + τb · s. (6)
The assumed equations for R0eq, Rbeq, τb, Zbat, and Eeq
are defined in (7) and (8), where E0, Ke, R0, A0, and R10
are constant for a particular battery. The battery model shownin Fig. 6 has been validated by numerous laboratory tests
TABLE IIBATTERY EXPERIMENTAL PARAMETERS
Fig. 7. First topology of the buck–boost converters.
using one test bench. All parameter estimation strategies aredescribed by [4], [7]{
R0eq = Nb · R0 · (1 + A0 · (1 − SOC))Rbeq = −Nb · R10 · ln(DOC){Rτb = Rbeq · Cbeq
Zbat = R0eq + Rbeq1+j·ω·τb
(7)
Vbat = Nb · (E0 − Ke · (273 + θ)(1 − SOC))
− Zbat · Ibat. (8)
The battery parameters identified from several experimentaltests are shown in Table II.
III. DC/DC CONVERTER MODELING AND CONTROL
The main goal of this paragraph is to establish the dc/dc con-verter control laws for energy management between the SCAPsand the battery. This study is based on the two buck–boost [9]–[20] converters with parallel topology. The SCAP modules areconnected to the dc bus, via two buck–boost converters, whichensure the SCAP charge and discharge. The converter dynamiccontrol strategy is defined by the HEV energy management. Theused converter topologies [9]–[11] are shown in Figs. 7 and 8,where the second topology (Fig. 8) allows one to simplify theembedded energy management control strategy and decreasethe SCAP current smoothing inductance number.
A. Converter Modeling
To model these converters, the buck and boost [19], [20]converter operating modes must be analyzed. During buck-converter mode, K2 and K4 semiconductors are ON, while

590 IEEE TRANSACTIONS ON INDUSTRIAL ELECTRONICS, VOL. 57, NO. 2, FEBRUARY 2010
Fig. 8. Second topology of the buck–boost converters.
K1 and K3 are OFF. Contrary to this mode, K1 and K3 areON, while K2 and K4 went OFF. For this study, the Isc1, Isc2,IL, Ibus1, and Ibus2 currents are supposed negative duringthe SCAP energy storage (buck-converter mode), and they arepositive during the SCAP discharge (boost-converter mode).The first converter topology (Fig. 7) and the second topology(Fig. 8) average models resulting from the buck/boost converteranalysis are given in the following, respectively:⎧⎨
⎩VL1 = L1 · d
dt (Isc1) = k · (Vsc1 − α · Vbus1)VL2 = L2 · d
dt (Isc2) = k · (Vsc2 − α · Vbus1)Vλ = λ · d
dt (Ibat) = Vbat − Vbus1{IL = Ibus1 + Ibus2
Ich = Ibat + k · IL(9)
⎧⎨⎩
VL = L · ddt (Isc) = k · (Vsc − α · Vbus1)
Vsc1 = Vsc2
Vλ = λ · ddt (Ibat) = Vbat − Vbus1{
IL = Ibus1 + Ibus2
Ich = Ibat + k · IL.(10)
For these analytical models, the k and α variables can have thefollowing values.
1) In boost-converter mode, k = 1 and α = 1 − α1, whereα1 is the boost-converter duty-cycle average value.
2) In buck-converter mode, k = −1 and α = α2, where α2
is the buck-converter duty-cycle average value.
These models have a nonlinear behavior because of crossesbetween the control variables (α1 and α2) and the state vari-ables (Isc1, Isc2, and Vbus1), as shown in Fig. 9. The Vsc1, Vsc2,Vbus1, Ich, and Vbat variables are likely to disturb the control;they are measured and used in the control law estimation toensure a dynamic control. This nonlinear behavior is studiedin [11].
The first-topology control laws which result from the boostand buck converter modeling are defined by α1 and α2 esti-mated duty cycles, respectively
α1 = 1 − 12· (Vsc1 + Vsc2) − (VL1 + VL2)
(Vbat − Vλ)
α2 =12· (VL1 + VL2) + (Vsc1 + Vsc2)
Vbus1. (11)
Fig. 9. Implemented polynomial control for buck and boost converters.
The second-topology control strategy can be obtained fromthe first-topology control strategy by using
VL =VL1 + VL2
2Vsc =
Vsc1 + Vsc2
2. (12)
B. Polynomial (RST) Control Strategy
This study is based on the polynomial (RST) dynamic controlstrategy [21]–[23] of the buck–boost converters for energy man-agement between the battery and SCAPs. The control strategymust be of current type because the dc-bus voltage level is fixedby the battery. The RST controllers give a robust algorithm,with good performances in the case of the following processes:
1) with a pure delay;2) whose dynamic characteristics change during operation;3) where the reference should not be exceeded.
The first-topology control strategy (Fig. 9) presents twodistinct phases. The first phase is characterized by the charge ofthe SCAP with constant current (Iscref = const). During thisphase, the battery current loop is not activated, i.e., only thePWM2 signal is activated (1 is ON and 2 is OFF). In this state,only one RST controller is used.
The second phase is characterized by the discharge of theSCAP with variable current. The SCAP current referenceIscref = Iscref1 + Iscref2 is obtained starting from energy man-agement between battery and SCAP (13), where η1 (first boost)and η2 (second boost) present the two parallel boost-convertertheoretical efficiencies (100% for simulations). During thisphase, the SCAP and battery current loops with PWM1 controlsignal are activated (1 is OFF and 2 is ON). In this case, twocontrollers are used for SCAP and battery current control. ThePWM1 and PWM2 signals cannot be activated simultaneously{
Isc1ref = 12 · Vbus1
η1·Vsc1· (Ich − Ibatref)
Isc2ref = 12 · Vbus1
η2·Vsc2· (Ich − Ibatref)
Iscref = Isc1ref + Isc2ref . (13)
For RST parameter estimation, the sampling-process transferfunctions obtained from (9) and (10) are presented in (14). Theconverter control strategy can be simplified if L1 = L2, and

CAMARA et al.: CONVERTER DESIGN FOR SCAP AND BATTERY POWER MANAGEMENT 591
Fig. 10. r0sc and r1sc estimation for two converter controls.
the general transfer function resulting from this assumption ispresented in (15){
G1(z−1) = Isc1(z−1)
VL1(z−1) = Te
L1· z−1
1−z−1
F (z−1) = Ibat(z−1)
Vλ(z−1) = Te
λ · z−1
1−z−1
G2(z−1) =Isc2(z−1)VL2(z−1)
=Te
L2· z−1
1 − z−1(14)
G1(z−1) = G2(z−1) =Isc1(z−1) + Isc2(z−1)VL1(z−1) + VL2(z−1)
. (15)
The RST control strategy method consists of identifyingR(z−1), S(z−1), and T (z−1) polynomials from an imposedmodel in closed loop, where R(z−1) and S(z−1) ensure therole of the regulation and T (z−1) ensures the system control.The Diophantine equation [21] gives R(z−1) and S(z−1) poly-nomials. The G1(z−1) and F (z−1) transfer functions in closedloop are similar; this is why only one method is presentedfor R(z−1), S(z−1), and T (z−1) polynomial identificationby using G1(z−1). The desired polynomial in closed loop ispresented in
P (z−1) = 1 + p1 · z−1 + p2 · z−2. (16)
This polynomial is of second order, and then, the closed-looptransfer-function characteristic equation must be equal to sec-ond order. In other words, the orders of A(z−1) and B(z−1) areequal to 1, and those of R(z−1) and S(z−1) must also be equalto 1. The SCAP current-control polynomial must be obtainedby using the closed-loop system shown in Fig. 10. In this case,the balancing issue between Isc1 and Isc2 is not significantwhen the two SCAP modules are balanced and when the twoconverters are the same. The A(z−1) and B(z−1) polynomialsfor the G1(z−1) transfer function are given in
A(z−1) = 1 − z−1 B(z−1) =Te
L1· z−1. (17)
To obtain a minimal static error in HEV energy managementwith a disturbance rejection, the R(z−1) and S(z−1) polynomi-als presented in the following are selected:
S(z−1) = 1 − z−1 R(z−1) = r0sc + r1sc · z−1. (18)
The sampling-process transfer function resulting from theclosed-loop system enables one to write
Fcl(z−1) =T (z−1) · B(z−1)
A(z−1) · S(z−1) + B(z−1) · R(z−1). (19)
To choose the T (z−1) polynomial, two methods are possible.
Fig. 11. Robust stability and robust performance analysis.
The first method consists of choosing two different polyno-mials of T (z−1) and R(z−1). In this case, the simplest solutionis to identify the T (z−1) polynomial for a static gain equal to 1.This condition is presented in (20), and the resulting equationfrom this comparison is given in (21)
T (1) · B(1) =A(1) · S(1) + B(1) · R(1) (20)
T (1) = r0sc + r1sc. (21)
The second method [22], [23] consists of choosing T (z−1)and R(z−1) that are identical to reduce the number of parame-ters to be identified (22). This last method is described and usedin this paper
T (z−1) = R(z−1). (22)
R(z−1) polynomial coefficients are identified, using a simplecomparison between the P (z−1) desired polynomial and thedenominator of the transfer function in closed loop
P (z−1) = A(z−1) · S(z−1) + B(z−1) · R(z−1) (23)
r0sc = (p1 + 2) · L1
Te
r1sc = (p2 − 1) · L1
Te. (24)
The resulting coefficients from this comparison are presentedin (24), where the P1 and P2 coefficients depend on the dy-namic system in closed loop. These coefficients can be obtainedby using the following desired polynomial:
P (z−1) =(1 − z−1 · exp(−ωn · Te)
)2. (25)
To ensure a robust stability of the system, the closed-looppoles must be remaining inside the unit circle (discrete-timecase) for all the models [Fig. 11(a)]. Concerning the robust per-formance evaluation, the closed-loop poles must be remaininginside the circle (c, r), as shown in Fig. 11(b). The obtainedpoles from this method using (25) are shown in Fig. 11(c).This curve shows that the conditions of stability and robustperformance are respected. Equation (26) presents the SCAPcurrent-loop polynomial approximate coefficients, according toL1 inductance, Te sampling period, and the bandwidth (ωn ≥Log(2)/Te). To choose the r0sc and r1sc coefficients, insidethe bandwidth, a k parameter is introduced as presented in thefollowing expression (ωn = k · Log(2)/Te). This variable is

592 IEEE TRANSACTIONS ON INDUSTRIAL ELECTRONICS, VOL. 57, NO. 2, FEBRUARY 2010
Fig. 12. Battery-current-control result.
selected between 1 and 2, and it gives all possible values ofthe bandwidth⎧⎨⎩
r0sc =2 · (1 − exp(−ωn · Te)) · L1Te
≈2 ·(1 − 1
1+ωn·Te
)· L1
Te
r1sc =(exp(−2 · ωn · Te) − 1) · L1Te
≈(
11+2·ωn·Te
− 1)· L1
Te.
(26)
The G1(z−1) and F (z−1) discretized processes are similar;in other words, the battery-current-loop polynomial coefficientscan be obtained while replacing L1 by λ as presented in (27).This operation enables one to write the battery-current-controlpolynomial approximate coefficients
r0bat ≈ 2 ·(
1 − 11 + ωn · Te
)· λ
Te
r1bat ≈(
11 + 2 · ωn · Te
− 1)· λ
Te. (27)
These coefficients are respectively implemented in thePIC18F4431 microcontroller and SABER software for controlof the test bench and system simulations in the reduced scale.
C. Second-Topology Simulation and Experimental Results
The boost-converter experimental test is carried out in thefollowing conditions: During the SCAP discharge, the batterycurrent reference (Ibatref) is fixed at 14 A so that the SCAPmodules provide HEV energy request during the transientstates. For these tests, the HEV request Ich was fixed at 54 A.
The comparison of the experimental and simulation resultsof the battery current is shown in Fig. 12. This figure showsthat the battery-current-control strategy is satisfactory during40 s; after that, it becomes insufficient because of the SCAPdischarge. In other words, these curves show that the simula-tion model developed describes correctly the behavior of theexperimental system during the first 40 s. After the first 40 s,the difference that appears between the experimental and simu-lation results can be explained by the fact that only one SCAPmodule among the two parallel sets has been characterized.This difference can be eliminated by adjusting the SCAP ca-pacitance value or characterizing the two SCAP modules.
Fig. 13 shows the SCAP experimental and simulation volt-ages during HEV traction states. These results show that thesimulation model developed with SABER software is satisfac-tory for hybrid-vehicle test-bench behavior description.
The dc-bus current (IL = 40 A) shown in Fig. 14 is ensuredby two SCAP modules. The first boost converter (K1-D2)
Fig. 13. SCAP module voltages.
Fig. 14. DC-bus current.
Fig. 15. Supplied current of two SCAP modules.
Fig. 16. Active load current.
ensures 50%, and the second (K3-D4) ensures also 50% of thedc-bus current. In other words, the two SCAP modules ensure acurrent (IL) of 40 A to HEV, and only 14 A is provided by thebattery.
Fig. 15 shows the simulation and experimental results of thetwo module currents Isc = Isc1 + Isc2, where Isc1 and Isc2 arenot identical because of the SCAP module dispersion. This fig-ure shows that the control strategy of the SCAP global currentIsc is satisfactory during HEV traction state. The simulationand experimentation results of the HEV request current (Ich)are well fitted, and these results are shown in Fig. 16. Theexperimental tests are carried out with a classical lead-acidbattery module that is not entirely charged. This is why one cannotice that a difference of about 5 V between the dc-bus voltageVbus1 experimental and simulation results (Fig. 17) occurs. This

CAMARA et al.: CONVERTER DESIGN FOR SCAP AND BATTERY POWER MANAGEMENT 593
Fig. 17. DC-bus voltage.
TABLE IIITEST-BENCH COMPONENT NOMENCLATURE
difference is also due to the global system simulation modelwhich is ideal.
IV. DC/DC CONVERTER DESIGN AND EXPERIMENTATION
A. Experimental Setup
For component cost and safety reasons, the experimental testbench is carried out at a reduced scale (1/10). The designedtest bench includes two SCAP modules, a battery module,an active load, and a dc/dc converter, which ensures energymanagement between the battery and SCAP modules. Theminimum and maximum voltages of these modules are 13.5 and27 V, respectively (i.e., ten cells of 2.7 V in series). The batterymodule, which defines the dc-bus voltage, has a rated voltageof 48 V. DC-bus voltage level must be between 38 and 54 V. Anactive load is used to define energy request. The whole systemis controlled by a PIC18F4431 microcontroller. The test-benchmain parameters are presented in Table III.
B. Experimental Test Conditions and Results
Conventionally, the Isc1, Isc2, Isc, IL, Ibus1, and Ibus2 cur-rents are supposed negative during the SCAP charging, andthey are positive during the discharge operation. To show thebidirectional behavior of the converters, the SCAP modulesare charged and discharged with constant current (60 A =30 + 30 A, i.e., 30 A for each module) and variable current(includes between 35 and 52 A for each module), respectively.The charging mode corresponds to SCAP energy storage (Isc
negative), and that of the discharge corresponds to the SCAPenergy supply to the dc bus (Isc positive). If the modulesare discharged more than 75%, the dynamic control becomesinsufficient because of the weakened SCAP voltage.
To ensure a comparative study, two bidirectional convertertopologies are carried out. For all experimental tests, the min-imum and maximum voltages of the modules are fixed at 18and 27 V, respectively. The HEV current request Ich is fixed
Fig. 18. Voltages and currents of two SCAP modules.
Fig. 19. Battery and active load currents.
at 50 A. The reference currents during the module charge anddischarge are Iscref = 60 A in buck mode and Ibatref = 10 Ain boost mode, respectively.
1) First-Topology Experimental Results: For this topology,the test bench includes two SCAP modules with ten cells of2.7 V in series, a battery module of four cells of 12 V inseries, two buck–boost converters, two dc-bus voltage filteringcapacitors C1 = C2, two SCAP current smoothing inductances(L1 = L2), and the battery current smoothing inductance λ.The system is controlled by the microcontroller (PIC18F4431),and the converter topology is shown in Fig. 7. This topologyensures minimum service during a defect in one of the converteror/and SCAP modules. However, it leads to some problems likemodule balancing when the modules’ internal resistances arenot identical or when there are unbalanced control times. TheSCAP voltages Vsc1 and Vsc2 values are identical. The Isc1 andIsc2 currents are also identical except during the discharge whena light difference appears because of the SCAP module internalresistance dispersion. This difference is due to the connectors.The SCAP module, which disposes the lowest internal resis-tance, provides the largest current (Fig. 18). During the SCAPdischarge (Fig. 19), i.e., between 80 and 135 s, the batterycurrent reference Ibatref is fixed at 10 A so that, the SCAPmodules provide HEV energy request during the transientstates via buck–boost converters. The dynamic control resultsof the dc-bus current IL and the voltage obtained from theseexperimental test conditions are shown in Fig. 20. In this case,each converter ensures 20 A, and the remainder current (10 A)is provided by the battery module. These experimental resultsat a reduced scale show that the proposed energy managementstrategy is satisfactory, and this strategy can be extrapolated toHEV embedded energy share.
The next paragraph regards power semiconductor (insulated-gate bipolar transistors (IGBTs) and diodes) loss estimation in

594 IEEE TRANSACTIONS ON INDUSTRIAL ELECTRONICS, VOL. 57, NO. 2, FEBRUARY 2010
Fig. 20. DC-bus voltage and current.
the traction state of the HEV. The semiconductors present twomain types of losses. The first losses are due to semiconductordynamic resistances (internal), and the second are due to IGBTfrequency switching [24], [25]. To illustrate and simplify theIGBT and diode conduction loss estimation, the voltage dropsin these components have been considered constant. In this pa-per, the HEV traction state is considered for the semiconductorloss estimation; in other words, this state supplies the SCAPmaximum current (maximum losses).
To estimate these losses, it is necessary to know the boost-converter duty-cycle average values [26]. The first and secondboost-converter duty cycles can be estimated using (28). D2 andD4 diode conduction losses resulting from these assumptionscan be determined by using (29)
d1 =Vbus1 − Vsc1
Vbus1
d2 =Vbus1 − Vsc2
Vbus1(28)
PD2,4 = (1 − d1,2) · 〈Isc1,2〉 · V(T0) + RT · (1 − d1,2)
·(
1 +112
·(
ΔIsc1,2
〈Isc1,2〉
)2)
· 〈Isc1,2〉2. (29)
The K1 and K3 switch (IGBT) conduction losses can beestimated by using the following:
PK1,3 = d1,2 · 〈Isc1,2〉 · VCE(T0) + RCE · d1,2
·(
1 +112
·(
ΔIsc1,2
〈Isc1,2〉
)2)
· 〈Isc1,2〉2. (30)
The electric power dissipated by all switches during conductionstate can be estimated by summing all conduction losses of thediodes and IGBTs
Pcond = PD2 + PD4 + PK1 + PK3. (31)
The switching losses of IGBTs are defined by (32), as shownat the bottom of the page, where fd, Unom, and Inom are theIGBT switching frequency and the rated voltage and current, re-
TABLE IVPOWER SEMICONDUCTOR PARAMETERS
spectively. The semiconductor dissipated energies EON_IGBT,EOFF_IGBT, and EOFF_DIODE corresponding to rated power(Unom · Inom) is given in the manufacturer datasheet. Assum-ing that the SCAP current smoothing inductances are same,the electric power dissipated in the internal resistance (RL1 =RL2 = RL) of these devices can be determined using
PL12 = RL ·((
1 +112
·(
ΔIsc1
〈Isc1〉
)2)
· 〈Isc1〉2
+
(1 +
112
·(
ΔIsc2
〈Isc2〉
)2)
· 〈Isc2〉2)
. (33)
The dissipated remainder power can be obtained from a dif-ference between the global losses and the aforementioned esti-mated losses. This difference is presented in following:
Prest = (Vsc1 · Isc1 + Vsc2 · Isc2) − IL · Vbus1
−(PL12 + Pcond + Pcom). (34)
The used power semiconductor (SKM400GB124D) parame-ters extracted from the manufacturer datasheet for the semi-conductor loss estimation are summarized in Table IV. Theboost-converter efficiency is defined by the ratio between thedc-bus power and SCAP module power as presented in
np_RST =(Ibus1 + Ibus2) · Vbus1
Isc1 · Vsc1 + Isc2 · Vsc2. (35)
This efficiency depends greatly on SCAP current; in otherwords, the progressive discharge of the modules is compensatedby the SCAP current progressive increase; which ensures thatthe semiconductor losses increase. The experimental results ofthe semiconductor (D2, D4, K1, and K3) conduction lossesfor the two boost converters are shown in Fig. 21, where thePK1 and PK3 losses increase when the SCAP module voltagesdecrease. The dissipated power distribution between the powerdevices corresponding to SCAP maximum current (96 A) isshown in Fig. 22. These losses can be concentrated (Fig. 23)in self-conduction losses (PL12), semiconductor conductionlosses (Pcond), semiconductor switching losses (Pcom), andother remainder losses (Prest).
{PS1,2 = Vsc1,2·Isc1,2·fd
Unom·Inom· (EON_IGBT + EOFF_IGBT + EOFF_DIODE)
Pcom = PS1 + PS2
(32)

CAMARA et al.: CONVERTER DESIGN FOR SCAP AND BATTERY POWER MANAGEMENT 595
Fig. 21. IGBT (K1, K3) and diode (D2, D4) losses.
Fig. 22. Power device losses in watts for Isc = 96 A.
Fig. 23. Power device losses in percent for Isc = 96 A.
Fig. 24. First-topology boost-converter efficiency.
The boost-converter experimental efficiency obtained from(35) is shown in Fig. 24. This figure shows that, for Isc = 80 A,the boost-converter efficiency is approximately 86%.
However, it is possible to improve this value by optimizingthe wiring and using low-loss power semiconductors.
2) Second-Topology Experimental Results: To simplify theconverter control strategy, the second parallel topology ofthe buck–boost converters was realized. This test bench alsohas the same components compared with the first topology.The designed converter topology is shown in Fig. 8, and the
Fig. 25. Voltages and currents of two SCAP modules.
Fig. 26. Battery and active load currents.
Fig. 27. DC-bus voltage and current.
experimental results of this topology are obtained in similarconditions to that of the first topology.
During the buck-converter mode (Fig. 25), i.e., between 0–91and 158–246 s, the SCAP reference current Isc1ref + Isc2ref isfixed at 60 A, and the two modules store energy by using aconstant current of 30 A for each module.
The difference which appears between Isc1 and Isc2 currents,shown in Fig. 25, is due to the two buck–boost converter disper-sion. This figure shows also the SCAP module correspondingvoltages, which are the same.
From 91 to 158 s, the buck–boost converter is in boostmode. In this state, the battery current reference Ibatref isalways fixed at 10 A so that the SCAP modules ensure theHEV energy request. This request (Ich) is always maintainedat 50 A, and two SCAP modules ensure the dc-bus currentIL = 40 A. Fig. 26 shows that the battery-current-control resultis satisfactory and that the hybrid vehicle main power is ensuredby SCAP modules via the dc/dc converter. The dc-bus currentcorresponding to the hybrid vehicle main power is shownin Fig. 27. The boost-converter efficiency estimation for thesecond topology is similar to that of the first topology, assuming

596 IEEE TRANSACTIONS ON INDUSTRIAL ELECTRONICS, VOL. 57, NO. 2, FEBRUARY 2010
Fig. 28. Second-topology boost-converter efficiency.
Fig. 29. Battery-current-control results with RST and PI.
that the SCAP module voltages are the same Vsc1 = Vsc2 = Vsc,which enables one to write
nt_RST =(Ibus1 + Ibus2) · Vbus1
(Isc1 + Isc2) · Vsc. (36)
The second topology is interesting because of the controlsimplicity, but the losses caused by the global current are moreimportant than the sum of the losses in the first topology, whichexplains why the second-topology efficiency (Fig. 28) is weakerthan that of first (Fig. 24).
3) Advantages of RST Control Compared with PI: Toshow the advantages of RST control compared with classicalproportional–integral (PI), the experimental tests are carried outby using boost-converter topology (Fig. 8, with PWM2 = 0),RST, and PI controllers. These controllers are estimated inidentical conditions. In the case of these tests, the batterycurrent reference is Ibatref = 5 A so that the SCAP providesto the HEV the significant power during transient states. Tosimulate the HEV behavior, a power electronic active load (Ich)is used with a current of 25 A. Fig. 29 shows that the batterycurrent resulting from RST control is more interesting thanthat of classical PI control, i.e., the PI control result presents adelay Δt = 1 s compared to RST system, and this difference isshown in Fig. 30. Concerning initial conditions, the polynomialcontrol strategy is also interesting compared with PI as shown inFig. 30, where Δi = 3 A, either 60% of Ibatref . The measuredcurrents on dc link (dc bus) with RST and PI are shown inFig. 31. These curves show that the polynomial control is moreaccurate and robust than classical PI.
These experimental results enable one to conclude that theproposed control strategy has better performance (rapid and ac-curate) compared with PI applied in hybrid vehicle applications.
Fig. 30. Zoom of battery-current-control results with RST and PI.
Fig. 31. DC-link (dc-bus) current-control results with RST and PI.
V. CONCLUSION
The SCAP model presented in this paper is a simplifiedmodel based on polynomial capacitance, which describes theSCAP cell energy behavior during the charge and dischargestates. In other words, this model does not describe the SCAPbehavior before and after the modules charge and discharge.
To avoid one buck–boost converter saturation, the first topol-ogy has been proposed for hybrid vehicle energy management.Contrary to this one, the second topology has been proposed forsimplifying converter control strategy and decreasing the SCAPcurrent smoothing inductance number. An original strategy ofthe RST synthesis with polynomial coefficient estimation ac-cording to inductances, sampling period, and desired bandwidthhas been presented in this paper. This polynomial control strat-egy is applied to two dc/dc converters for energy managementbetween SCAP and battery. The resulting algorithms are robustand easy to do with a microcontroller or DSP devices.
An experimental study of two dc/dc converter topologieswith the polynomial control strategy has been presented. Thefirst topology seems to be more interesting because its effi-ciency is higher as compared with that of the second topology.The advantages of the polynomial control strategy comparedwith classical PI techniques applied in HEV applications werehighlighted.
REFERENCES
[1] F. I. Simjee and P. H. Chou, “Efficient charging of supercapacitors for ex-tended lifetime of wireless sensor nodes,” IEEE Trans. Energy Convers.,vol. 23, no. 3, pp. 1526–1536, May 2008.
[2] M. Uzunoglu and M. S. Alam, “Modeling and analysis of an FC/UChybrid vehicular power system using a novel-wavelet-based load sharingalgorithm,” IEEE Trans. Energy Convers., vol. 23, no. 1, pp. 263–272,Mar. 2008.

CAMARA et al.: CONVERTER DESIGN FOR SCAP AND BATTERY POWER MANAGEMENT 597
[3] Y. Diab, P. Venet, H. Gualous, and G. Rojat, “Self-discharge characteriza-tion and modeling of electrochemical capacitor used for power electronicsapplications,” IEEE Trans. Power Electron., vol. 24, no. 2, pp. 510–517,Feb. 2009.
[4] S. Barsali and M. Ceraolo, “Dynamical models of lead-acid battery:Implementation issues,” IEEE Trans. Energy Convers., vol. 17, no. 1,pp. 16–23, Mar. 2002.
[5] L. Gao, S. Liu, and R. A. Dougal, “Dynamic lithium-ion battery modelfor system simulation,” IEEE Trans. Compon. Packag. Technol., vol. 25,no. 3, pp. 495–505, Sep. 2002.
[6] M. Ceraolo, “New dynamical models of lead-acid battery,” IEEE Trans.Power Syst., vol. 15, no. 4, pp. 1184–1190, Nov. 2000.
[7] A. Szumannowski and Y. Chang, “Battery management system based onbattery nonlinear dynamics modeling,” IEEE Trans. Veh. Technol., vol. 57,no. 3, pp. 1425–1432, May 2008.
[8] B. Schweighofer, K. M. Raab, and G. Brasseur, “Modeling of high powerautomotive battery by the use of an automated test system,” IEEE Trans.Instrum. Meas., vol. 52, no. 4, pp. 1087–1091, Aug. 2003.
[9] M. B. Camara, H. Gualous, F. Gustin, and A. Berthon, “Control strategyof hybrid sources for transport applications using supercapacitors andbattery,” in Proc. IEEE, IPEMC, Shanghai, China, Aug. 13–16, 2006,vol. 1, pp. 1–5.
[10] L. Solero, A. Lidozzi, and J. A. Pomilo, “Design of multiple-input powerconverter for hybrid vehicles,” IEEE Trans. Power Electron., vol. 20,no. 5, pp. 1007–1016, Sep. 2005.
[11] M. B. Camara, H. Gualous, F. Gustin, and A. Berthon, “Design and newcontrol of DC/DC converters to share energy between SCAP and batteryin hybrid vehicle,” IEEE Trans. Veh. Technol., vol. 57, no. 5, pp. 2721–2735, Sep. 2008.
[12] J. Moreno, M. E Ortuzar, and J. W. Dixon, “Energy-management systemfor a hybrid electric vehicle, using ultracapacitors and neural networks,”IEEE Trans. Ind. Electron., vol. 53, no. 2, pp. 614–623, Apr. 2006.
[13] P. Thounthong, S. Rael, and B. Davat, “Control strategy of fuel cell andsupercapacitors association for a distributed generation system,” IEEETrans. Ind. Electron., vol. 54, no. 6, pp. 3225–3233, Dec. 2007.
[14] L. Gao, Z. Jiang, and R. A. Dougal, “Evaluation of active hybrid fuelcell/battery power sources,” IEEE Trans. Aerosp. Electron. Syst., vol. 41,no. 1, pp. 346–355, Jan. 2005.
[15] X. Du, L. Zhou, and H.-M. Tai, “Double-frequency buck converter,” IEEETrans. Ind. Electron., vol. 56, no. 5, pp. 1690–1698, May 2009.
[16] K. Jin, X. Ruan, M. Yang, and M. Xu, “A hybrid fuel cell power system,”IEEE Trans. Ind. Electron., vol. 56, no. 4, pp. 1212–1222, Apr. 2009.
[17] F. Baalbergen, P. Bauer, and J. A. Ferreira, “Energy storage and powermanagement for typical 4Q-load,” IEEE Trans. Ind. Electron., vol. 56,no. 5, pp. 1485–1498, May 2009.
[18] A. M. Rahimi and A. Emadi, “Active damping in DC/DC power elec-tronic converters: A novel method to overcome the problems of constantpower loads,” IEEE Trans. Ind. Electron., vol. 56, no. 5, pp. 1428–1439,May 2009.
[19] S.-Y. Choe, J.-W. Ahn, J.-G. Lee, and S.-H. Baek, “Dynamic simulatorfor a PEM fuel cell system with a PWM DC/DC converter,” IEEE Trans.Energy Convers., vol. 23, no. 2, pp. 669–680, Jun. 2008.
[20] P. Thounthong, S. Raël, and B. Davat, “Control algorithm of fuel celland batteries for distributed generation system,” IEEE Trans. EnergyConvers., vol. 23, no. 1, pp. 148–155, Mar. 2008.
[21] I. D. Landau, J. Langer, D. Rey, and J. Barnier, “Robust control of a 360◦
flexible arm using the combined pole placement/sensitivity function shap-ing method,” IEEE Trans. Control Syst. Technol., vol. 4, no. 4, pp. 369–383, Jul. 1996.
[22] M. B. Camara, D. Fodorien, H. Gualous, D. Bouquain, and A. Miroui,“Hybrid sources control for electric drives traction applications,” in Proc.19th IEEE Int. Symp. Power Electron., Elect. Drives, Autom. Motion,Ischia, Italy, Jun. 11–13, 2008, pp. 744–749.
[23] M. B. Camara, H. Gualous, F. Gustin, and A. Berthon, “Experimentalstudy of buck–boost converters with polynomial control strategy for hy-brid vehicles applications,” Int. Rev. Elect. Eng. (IREE), vol. 2, no. 4,pp. 601–612, Aug. 2007.
[24] S. Castagno, R. D. Curry, and E. Loree, “Analysis and comparison of a fastturn-on series IGBT stack and high-voltage-rated commercial IGBTs,”IEEE Trans. Plasma Sci., vol. 34, no. 5, pp. 1692–1696, Oct. 2006.
[25] N. D. Benavides and P. L. Chapman, “Mass-optimal design methodologyfor DC/DC converters in low-power portable fuel cell applications,” IEEETrans. Power Electron., vol. 23, no. 3, pp. 1545–1555, May 2008.
[26] M. B. Camara, F. Gustin, H. Gualous, and A. Berthon, “Energy manage-ment strategy for coupling supercapacitors and batteries with DC–DCconverters for hybrid vehicle applications,” in Proc. 13th IEEE EPE-PEMC, Poznan, Poland, Sep. 1–3, 2008, pp. 1542–1547.
Mamadou Baïlo Camara was born in Guinea. Hereceived the Dipl.Eng. degree in electrical engineer-ing from the Polytechnic Institute of Conakry (IPC),Conakry, Guinea, in 2003 and the M.S. and Ph.D. de-grees from the University of Franche-Comté, Belfort,France, in 2004 and 2007, respectively.
Since 2004, he has been working in power elec-tronics and electric vehicle research projects, in-volving static converter topologies, supercapacitors,batteries, and electrical energy management forhybrid vehicle applications. He is currently an As-
sociate Professor with the Groupe de Recherche en Electrotechnique et Au-tomatique du Havre Laboratory, The University of Le Havre, Le Havre, France.
Hamid Gualous was born in Morocco on January1967. He received the Ph.D. degree in electronicsfrom the University of Paris XI, Orsay, France,in 1994.
Since 1996, he has been an Associate Professorwith the Franche-Comté Electronique MécaniqueThermique et Optique—Sciences et TechnologiesInstitute, University of Franche-Comté, Belfort,France. His main research activities are concerningsupercapacitors and fuel cells dedicated to trans-port applications, power electronics, and energy
management.
Frederic Gustin received the Ph.D. degree fromthe University of Franche-Comté, Belfort, France,in 2000.
He is currently with the University of Franche-Comté, where his research activities involve powerelectronics, converters, and simulation methods atthe Franche-Comté Electronique Mécanique Ther-mique et Optique—Sciences et Technologies Insti-tute and where he is currently an Associate Professorwith the Institut Universitaire de Technologie deBelfort–Montbéliard.
Alain Berthon (M’01) received the Dipl. Engineerdegree in electrical engineering from the Ecole Na-tionale Superieure d’Electricité et de Mécanique,Nancy, France, in 1972 and the Dr. Ing. degree fromthe University of Franche-Comté, Belfort, France.
He is currently a Professor with the Institut Uni-versitaire de Technologie de Belfort–Montbéliard,University of Franche-Comté, where he is alsothe Head of the power electronics team at theFranche-Comté Electronique Mécanique Thermiqueet Optique—Sciences et Technologies Institute. He is
working in the field of power electronic converters, drives, and electrical powermanagement for electrical vehicles.
Brayima Dakyo (M’06) received the Dipl. Engineerdegree and the Ph.D. degree in engineering fromDakar University, Dakar, Senegal, in 1984 and 1987,respectively, and the Ph.D. degree and Habilitationfrom The University of Le Havre, Le Havre, France,in 1988 and 1997, respectively.
He is a Full Professor of electrical engineeringand the Head of a research team at the Groupede Recherche en Electrotechnique et Automatiquedu Havre Laboratory, The University of Le Havre.His current interests include power electronics,
converter-fed electrical machines, electrically powered systems, wind and solarenergy systems, and diagnostics.


