Embed Size (px)
Citation preview
lable at ScienceDirect
Journal of Human Evolution 59 (2010) 16e34
Contents lists avai
Journal of Human Evolution
journal homepage: www.elsevier .com/locate/ jhevol
Dental and phylogeographic patterns of variation in gorillas
Varsha PilbrowUniversity of Melbourne Department of Anatomy and Cell Biology, Victoria 3010 Australia
a r t i c l e i n f o
Article history:Received 3 February 2009Accepted 18 January 2010
Keywords:GorillaMolar morphometricsAltitudinal variationGene flowDriftPhylogeographyChimpanzeesHominins
E-mail address: [email protected]
0047-2484/$ e see front matter � 2010 Elsevier Ltd.doi:10.1016/j.jhevol.2010.01.009
a b s t r a c t
Gorilla patterns of variation have great relevance for studies of human evolution. In this study, molarmorphometrics were used to evaluate patterns of geographic variation in gorillas. Dental specimens of 323adult individuals, drawn from the current distribution of gorillas in equatorial Africa were divided into 14populations. Discriminant analyses and Mahalanobis distances were used to study population structure.
Results reveal that: 1) the West and East African gorillas form distinct clusters, 2) the Cross River gorillasare well separated from the rest of the western populations, 3) gorillas from the Virunga mountains andthe Bwindi Forest can be differentiated from the lowland gorillas of Utu and Mwenga-Fizi, 4) the Tshia-berimu gorillas are distinct from other eastern gorillas, and the Kahuzi-Biega gorillas are affiliated withthem. These findings provide support for a species distinction between Gorilla gorilla and Gorilla beringei,with subspecies G. g. diehli, G. g. gorilla, G. b. graueri, G. b. beringei, and possibly, G. b. rex-pygmaeorum. Clearcorrespondence between dental and other patterns of taxonomic diversity demonstrates that dental datareveal underlying genetic patterns of differentiation.
Dental distances increased predictably with altitude but not with geographic distances, indicating thataltitudinal segregation explains gorilla patterns of population divergence better than isolation-by-distance. The phylogeographic pattern of gorilla dental metric variation supports the idea thatPlio-Pleistocene climatic fluctuations and local mountain building activity in Africa affected gorillaphylogeography. I propose that West Africa comprised the historic center of gorilla distribution andexperienced drift-gene flow equilibrium, whereas Nigeria and East Africa were at the periphery, whereclimatic instability and altitudinal variation promoted drift and genetic differentiation. This under-standing of gorilla population structure has implications for gorilla conservation, and for understandingthe distribution of sympatric chimpanzees and Plio-Pleistocene hominins.
� 2010 Elsevier Ltd. All rights reserved.
Introduction
Next to chimpanzees, gorillas are our closest evolutionary rela-tives. They are the largest living primates and exhibit a high degree ofsexual dimorphism. They occur in sympatry with chimpanzees inequatorial Africa and, like chimpanzees, shared a long evolutionaryhistory with early hominins in Africa. Being large-bodied apes it islikely that the present distribution and patterns of colonization, orphylogeography, of this closely related group was affected by thevicissitudes of Plio-Pleistocene climaticfluctuations inAfrica. As such,gorillas are relevant for studying the ranges and patterns of variationamonghuman ancestors, the phylogenetic relationships among fossilhominins and the environmental influences on early hominindistribution in Africa. Their sympatric relationshipwith chimpanzeesis relevant for studying the dietary and niche-separation strategies ofsympatric hominin groups. Despite this potential, many aspects ofgorilla behavior, diet, morphology and genetic structure still remain
All rights reserved.
undocumented. In recent years, habitat destruction, disease andpolitical turmoil have caused a decline in gorilla populations(Huijbregts et al., 2003; Leroy et al., 2004; Bermejo et al., 2006;McNeilage et al., 2006), resulting in a renewed urgency to gorillastudies. This paper focuses on patterns of dental diversity in gorillaswith a view to documenting and interpreting the dental morpho-logical structure of gorilla populations.
The study follows from an earlier study on dental diversity inchimpanzee populations using molar morphometrics (Pilbrow,2006). The aims of the study parallel the previous analysis,including to: 1) identifymajor divisions among gorilla populations inmolarmetrics, 2)map patterns of dental diversity onto the ecologicalpatterns of gorilla distribution, 3) determine the concordance amongdental and othermorphological,molecular, ecological and behavioralpatterns of diversity, 4) ascertain the dental affinities of isolatedgorilla populations, and 5) comprehend the evolutionary and envi-ronmental influences on gorilla population structure.
Molars are used to study population structure because of theirrelevance for paleontological systematics. They are preferentially
V. Pilbrow / Journal of Human Evolution 59 (2010) 16e34 17
preserved in the fossil record and commonly used to delineate fossilspecies. It is useful to know how capable they are for reconstructingtaxonomy(Pilbrow, 2006). Amatchbetween the taxonomicpatternsrevealed by molar morphometrics and non-dental types of datawould indicate that dentally-identified paleospecies are likely tohave exhibited differences in non-fossilizable morphologicalfeatures, such as soft-tissue anatomy, behavior and molecularstructure. While this is relevant for differentiating paleontologicalspecies, it is also relevant for extant species for conservation effortsbecause dental samples representing most wild populations arereadily available in museums. If teeth preserve a taxonomic signal,they could verify the distinctiveness of small, endangered pop-ulations and help corroborate the findings ofmolecular systematics,which limited sample sizes often constrain. Furthermore, anunderlying genetic structure to dental divergence patterns allows usto test predictions of population genetics, such as isolation-by-distance models and the role of Pleistocene climatic fluctuations ingenetic and phylogeographic structuring in gorillas. What sets thisstudy apart from previous gorilla dental studies is its substantivelylarger dataset, with the local population as the unit of analysis,providing amore comprehensive analysis of gorilla dental variation.
Gorilla distribution and taxonomy
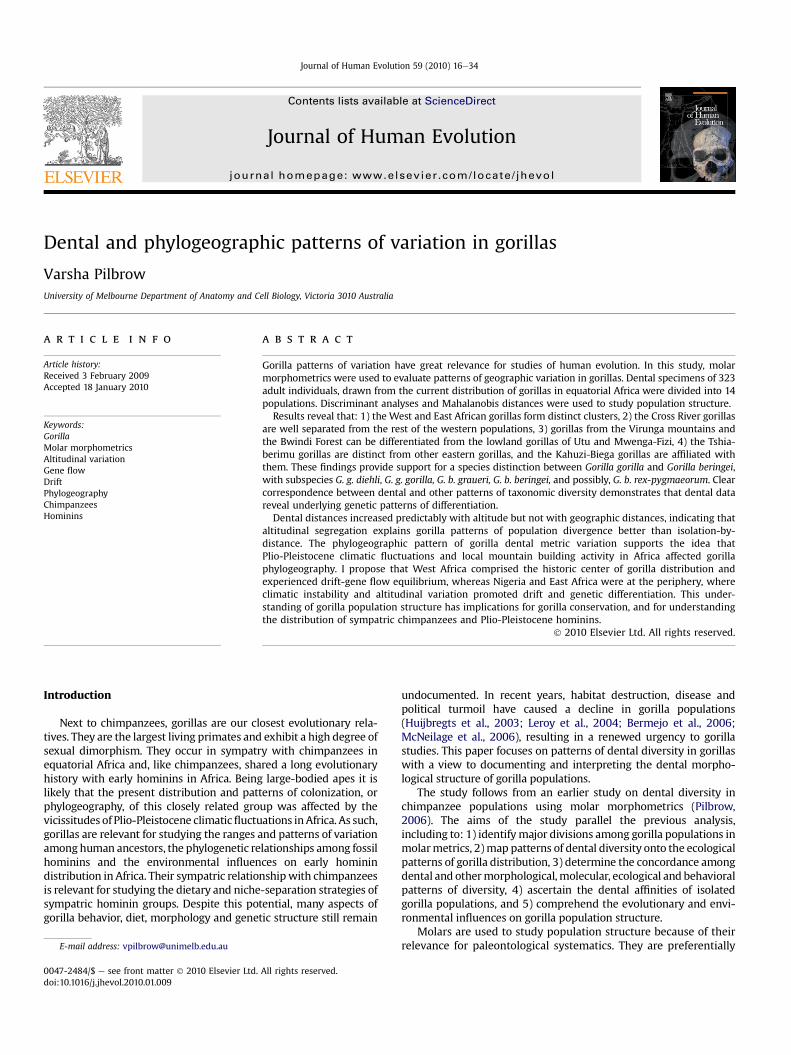
Gorillas occur in two main centers in the west and east ofequatorial Africa (Fig. 1). In the west their distribution begins at theNigeria-Cameroon border in the Cross River region and continuesthrough the western part of the Central African Republic to theOubangi River and southward to the lower Congo River in Angola.In the east, they occupy areas from the eastern part of the Demo-cratic Republic of Congo at the Lualaba River to the Albertine rift insouthwestern Uganda and the Luama River in northwesternRwanda (Sarmiento, 2003). A distance of about a 1000 km from 17�
E to 28� E along the Congo River is devoid of gorillas.Even within the western and eastern regions, gorilla populations
are distributed patchily at variable altitudes. Originally, many of theisolated populations receivednewspecies or subspecies designations(reviewed in Jenkins, 1990). Coolidge (1929) consolidated these intoone species with two subspecies: G. g. gorilla from West Africa andG. g. beringei from East Africa. Later Groves (1967, 1970b) reinstated
Figure 1. Gorilla distribution in equatorial Africa shown in shaded areas. Altitude data
G. g. graueri for the lowland east African gorillas, resulting in a threesubspecies classification,widely substantiated by cranial, postcranial,mandibular anddental data (Vogel,1961; Casimir,1975; Inouye,1992,2003; Sarmiento,1992,1994; Uchida,1998; Taylor, 2002, 2003; Leighet al., 2003). This classification was common until recent revisions(cited below) revived previous species and subspecies.
The most striking new proposal comes from mitochondrial DNA(mtDNA) sequence studies, arguing that there are greater mtDNAdifferences between East andWest African gorillas than between thetwo recognized species of Pan, and therefore, thatmajor gorilla groupsshouldbe recognized asdistinct species,G. gorilla andG. beringei, withG. b. graueri as a subspecies of G. beringei (Ruvolo et al., 1994; Morell,1994; Garner and Ryder, 1996: Saltonstall et al., 1998; Jensen-Seaman and Kidd, 2001; Jensen-Seaman et al., 2004). Groves (2001,2003) supports the two species distinction on the strength of cranialand nasal differences. However, non-mtDNA studies do not largelyadhere to the two species proposal, despite the fact that manymolecular, craniodental and postcranial studies find a primary splitbetween East and West African gorillas (Burrows and Ryder, 1997;Uchida, 1998; Altheide and Hammer, 1999, 2000; Jensen-Seamenet al., 2003; Stumpf et al., 2003; Taylor and Groves, 2003; Inouye,2003; Clifford et al., 2004; Guillén et al, 2005). Specifically, Y-chro-mosome and nuclear DNA sequences do not corroborate the greaterdistinction of East andWestAfrican gorillas relative to the two speciesof Pan (Burrows and Ryder, 1997; Altheide and Hammer, 1999, 2000;Jensen-Seamen et al., 2003). As importantly, some artifactual inte-grations of nuclear DNA copies into mtDNA sequences may havecompromised mtDNA studies supporting the split (Jensen-Seamanet al., 2004; Vigilant and Bradley, 2004a; Anthony et al., 2007).
Other new taxonomicproposals concern isolatedpopulations. TheCross River gorillas from southern Nigeria are separated from theother western gorillas by about 200 km and occur as impoverishedpopulations in fragmented localities within rugged mountainousterrains of more than 2000 m above sea level and lowland forests ofless than 200 m above sea level (Oates et al., 2003, 2004; Bergl andVigilant, 2007). Sarmiento and Oates (2000) reinstated them as G. g.diehli (Matschie, 1904). The subspecies distinction is supported byseveral cranial and postcranial differences (Groves,1967,1970b, 2001;Stumpf et al., 1998, 2003; Sarmiento and Oates, 2000), and somedifferences inmtDNA (Oates et al., 2003; but see Clifford et al., 2004).
taken from: Schaller, 1963; Hall et al., 1998; Omari et al., 1999; Sarmiento, 2003.
V. Pilbrow / Journal of Human Evolution 59 (2010) 16e3418
Gorillas from the south of the Sanaga River to the mouth of theCongo River and east of the Sangha River (Fig. 1) have a wide distri-bution across southern Cameroon, southwest Central AfricanRepublic, Equatorial Guinea, Gabon and Congo and mostly inhabitlowland closed-canopy forests at altitudes ranging from sea level toabout 800 m above sea level (Sarmiento, 2003). They are traditionallyincluded in the subspeciesG. g. gorilla, but higher population densities(Wolfheim, 1983; Doran and McNeilage, 1998; Vigilant and Bradley,2004b), greater diversity in locomotor repertoire, behavioral strate-gies anddietary preferences (Williamsonet al.,1990; Tutinet al.,1991;Kurodaet al.,1996; Remis,1997), andhigher variability inmtDNAthanin the eastern gorillas all indicate that there could be furthersubstructurewithin this region (Garner andRyder,1996;Clifford et al.,2004; Guillén et al., 2005). Clifford et al. (2004) found three geneticsubgroups in this region, in Equatorial Guinea, Central AfricanRepublic and Gabon including adjacent Congo, although nuclearintegrations of mtDNA appear to have influenced this to some extent(Jensen-Seaman et al., 2004). Groves (1967) also previously recog-nized three demes in the coastal area, inland plateau and the SanghaRiver region, but did not consider the distinctions great enough towarrant subspecies designations.
In East Africa an isolated population believed to be present nearBondo on the Uele River in the northeastern part of the DemocraticRepublic of Congo was originally described as G. g. uellensis (notedby Schouteden in Schwarz, 1927). The population is known onlyfrom museum specimens and could not be differentiated in cranialmeasurements from G. g. gorilla (Groves, 1970b). Recent mtDNAstudies of a single specimen aligned it with thewestern populationsof Nigeria, Cameroon and northern Gabon (Hofreiter et al., 2003;Clifford et al., 2004).
In the Virunga region of Rwanda in East Africa, a small secludedpopulation from a high altitude montane forest at 3900 m (Schaller,1963) has been recognized as G. g. beringei in the traditional threesubspecies classification. The new classfication elevates it to thespecies-level, G. beringei, which is distinct from eastern and westernlowland gorillas in morphology, diet and behavior (Coolidge, 1929;Schaller, 1963; Groves, 1970a, b). Another small population from theBwindi Impenetrable Forest in Uganda, about 25 km from Virunga(Sarmiento et al.,1996), but at a lower altitude of about 1160e2600 m(Jensen-Seaman and Kidd, 2001), is often allocated to this group(Groves and Stott, 1979; Butynski and Kalina,1993) and bears geneticsimilarity to it (Garner and Ryder, 1996; Jensen-Seaman and Kidd,2001). Sarmiento et al. (1996) noted a few morphological andbehavioral differences between the Bwindi and Virunga gorillas andsuggested that theydonotbelong to thesamesubspecies. Theydidnotprovide an alternative name (no prior name is available).
Gorillas from the ItombweMassif of Lake Tanganyika (Fig.1), andUtu and Mwenga-Fizi region of the Democratic Republic of Congofall midway between the eastern mountain and western lowlandgorillas in cranial morphology, and have been placed in G. g. graueri(Groves,1967,1970b). They occupy lowland forests at altitudes fromabout 1000 to 1500 m (Omari et al., 1999). The Kahuzi-Biega andTshiaberimu mountain gorillas from eastern Congo were provi-sionally placed in G. g. graueri (Groves and Stott, 1979). They areintermediate in morphology between G. g. graueri and G. g. beringei,and occur at intermediate altitudes of up to 3300 m (Hall et al.,1998). In mtDNA D-loop haplotypes the populations from Kahuzi-Biega and Tshiaberimu are more similar to each other than either isto the Virunga gorillas (Saltonstall et al., 1998; Jensen-Seaman andKidd, 2001). Sarmiento and Butynski (1996) suggest reviving thenomen G. g. rex-pygmaeorum (Schwarz, 1927) for the Tshiaberimugorillas. If revived, Jensen-Seaman and Kidd (2001) suggest allo-cating the Kahuzi-Biega gorillas to this subspecies.
Several new morphological, eco-behavioral and genetic lines ofevidence suggest that the three subspecies classification is no longer
viable for gorillas. A consensus summary of the studies offer predic-tions to be tested in this paper: 1) the main separation in gorillapopulations is between the western and eastern gorillas, 2) withinthewestern clade, theCrossRiver gorillas are distinguishable from theother western gorillas, 3) high levels of diversity characterize otherwestern gorillas, with possible subdivisions in Equatorial Guinea,Central African Republic and Gabon, including Congo, 4) gorillas fromthe Uele River region are similar to the western lowland gorillas, 5)within the eastern region the lowland gorillas and mountain gorillasform distinct groups, 6) the Utu and Mwenga-Fizi gorillas resembleeachother andaremorphologically distinct fromthewestern lowlandand easternmountain gorillas, 7) the Kahuzi and Tshiaberimu gorillasresemble each other and appear intermediate between the Utu,Mwenga Fizi and the Virunga gorillas, 8) the Virunga gorillas aredistinct fromtheKahuziandTshiaberimugroupsand9) theBwindi (orKayonza) gorillas are most similar to the Virunga gorillas.
Pleistocene climatic fluctuation and gorilla phylogeography
The current distribution of gorillas into isolated pockets may bea reflection of Pleistocene climatic fluctuations (Jensen-Seaman andKidd, 2001; Clifford et al., 2004). Evidence from aeolian dustdeposits (deMenocal,1995;Maley,1996), lake sediments (Talbot et al.,1984), ancient sand dunes (Nichol, 1999), deep-sea cores (Hamilton,1992; Livingstone, 1993), and fossil pollen (Maley, 1996), indicatethat after about 2.8 million years the climate in Africa becamedependent on the glacial and interglacial cycles of the northernhemisphere. In response to advancing and retreating ice sheets in theupper latitudes, local climate in Africa went through cooler and arid,and warmer and wetter periods, respectively. The arid periods led toshrinkage of tropical and montane forests into refugia (Livingstone,1975, 1993; Bonnefille et al., 1990; Maley, 1991, 1996; Hamilton,1992; deMenocal and Rind, 1993; deMenocal, 1995; Partridge et al.,1995; Nichol, 1999). Taxa adapted to tropical climates, includinggorillas, redistributed themselves into the climatically stable refugia.Extended periods of isolation resulted in a high level of endemismwithin refugia (Haffer, 1982; Vrba, 1992). When the climatic crisisceased migration and dispersal recommenced linking previousrefugia. Evidence for past refugia has been asserted in the endemicdistribution of African mammals (Grubb, 1982, 1990) and the phylo-geography of gorillas (Avise et al., 1998; Jensen-Seaman and Kidd,2001; Eggert et al., 2002). Whether the patterns of dental diversityin gorillas fit with isolation-by-distance models (dental distancesreflecting geographical distances) or are consistent with the evidencefor Pleistocene refugia is addressed in this study.
Materials and methods
Samples
The study sample includes 323 dental specimens from museumsin the United States of America and Europe (see Pilbrow, 2003 fora listing of museums). Only adult individuals with third molars inplace, relatively unworn teeth, and verifiable provenience wereselected. The sample represents all known wild gorilla populations,and particular carewas taken to include individuals frompopulationswith contested affinities. The dental samples were divided into 14populations (Table 1) based on locality allocations from previousstudies (Groves, 1970b; Braga, 1995 and others reviewed above).Small sample sizes for populations from Bwindi forest, Mt. Kahuziand the Uele River region reflect the numbers present in museums.Larger samples were available for West African gorillas. These weredivided into seven populations, preserving the distinctions recog-nized by Groves (1970b) and Clifford et al. (2004). The East Africangorillas were divided into six populations, separating the highland,
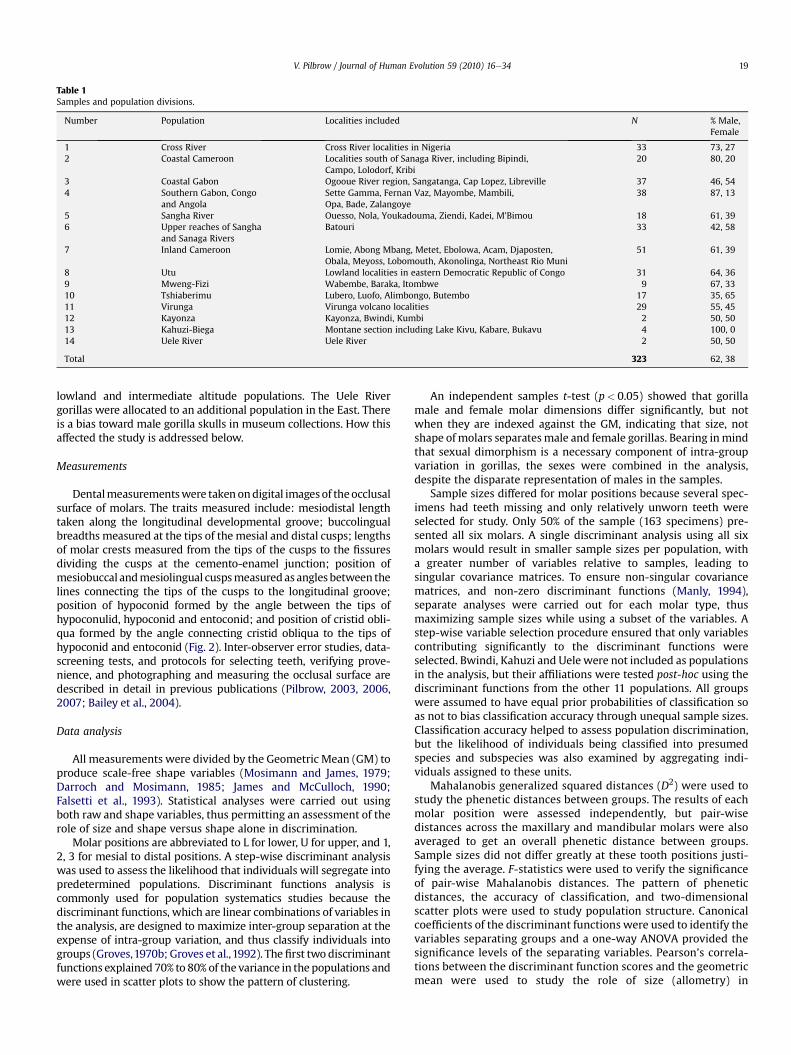
Table 1Samples and population divisions.
Number Population Localities included N % Male,Female
1 Cross River Cross River localities in Nigeria 33 73, 272 Coastal Cameroon Localities south of Sanaga River, including Bipindi,
Campo, Lolodorf, Kribi20 80, 20
3 Coastal Gabon Ogooue River region, Sangatanga, Cap Lopez, Libreville 37 46, 544 Southern Gabon, Congo
and AngolaSette Gamma, Fernan Vaz, Mayombe, Mambili,Opa, Bade, Zalangoye
38 87, 13
5 Sangha River Ouesso, Nola, Youkadouma, Ziendi, Kadei, M’Bimou 18 61, 396 Upper reaches of Sangha
and Sanaga RiversBatouri 33 42, 58
7 Inland Cameroon Lomie, Abong Mbang, Metet, Ebolowa, Acam, Djaposten,Obala, Meyoss, Lobomouth, Akonolinga, Northeast Rio Muni
51 61, 39
8 Utu Lowland localities in eastern Democratic Republic of Congo 31 64, 369 Mweng-Fizi Wabembe, Baraka, Itombwe 9 67, 3310 Tshiaberimu Lubero, Luofo, Alimbongo, Butembo 17 35, 6511 Virunga Virunga volcano localities 29 55, 4512 Kayonza Kayonza, Bwindi, Kumbi 2 50, 5013 Kahuzi-Biega Montane section including Lake Kivu, Kabare, Bukavu 4 100, 014 Uele River Uele River 2 50, 50
Total 323 62, 38
V. Pilbrow / Journal of Human Evolution 59 (2010) 16e34 19
lowland and intermediate altitude populations. The Uele Rivergorillas were allocated to an additional population in the East. Thereis a bias toward male gorilla skulls in museum collections. How thisaffected the study is addressed below.
Measurements
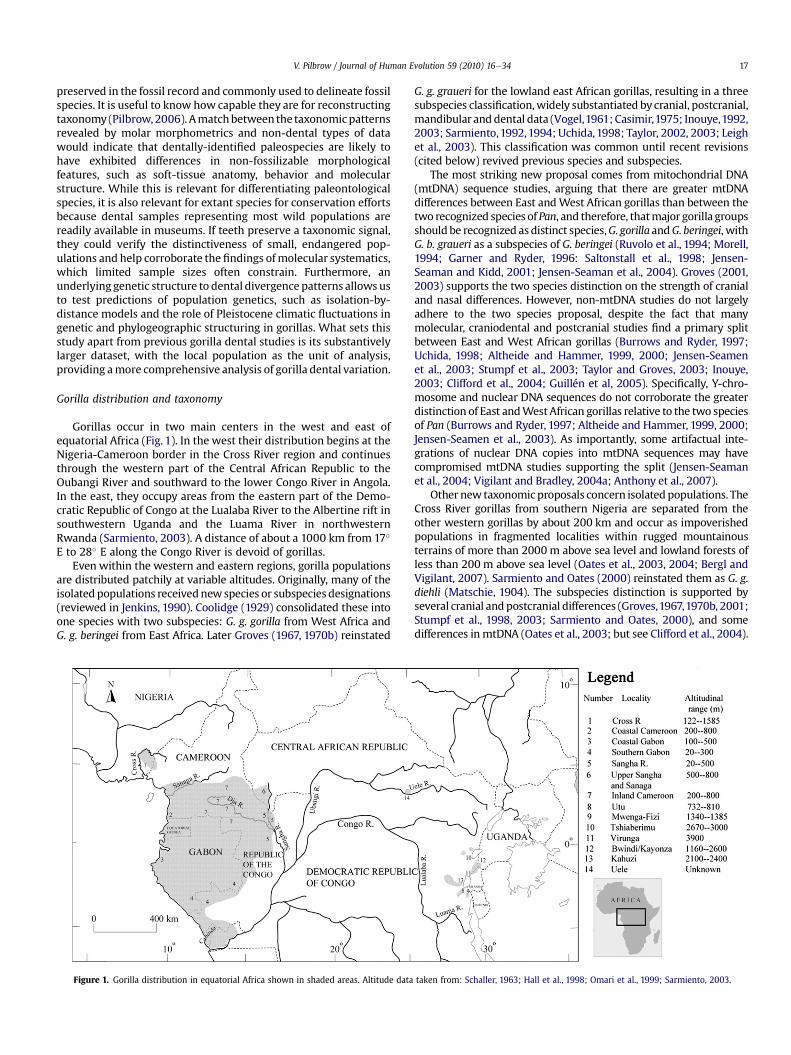
Dentalmeasurementswere taken ondigital images of theocclusalsurface of molars. The traits measured include: mesiodistal lengthtaken along the longitudinal developmental groove; buccolingualbreadths measured at the tips of the mesial and distal cusps; lengthsof molar crests measured from the tips of the cusps to the fissuresdividing the cusps at the cemento-enamel junction; position ofmesiobuccal andmesiolingual cuspsmeasuredas angles between thelines connecting the tips of the cusps to the longitudinal groove;position of hypoconid formed by the angle between the tips ofhypoconulid, hypoconid and entoconid; and position of cristid obli-qua formed by the angle connecting cristid obliqua to the tips ofhypoconid and entoconid (Fig. 2). Inter-observer error studies, data-screening tests, and protocols for selecting teeth, verifying prove-nience, and photographing and measuring the occlusal surface aredescribed in detail in previous publications (Pilbrow, 2003, 2006,2007; Bailey et al., 2004).
Data analysis
All measurements were divided by the Geometric Mean (GM) toproduce scale-free shape variables (Mosimann and James, 1979;Darroch and Mosimann, 1985; James and McCulloch, 1990;Falsetti et al., 1993). Statistical analyses were carried out usingboth raw and shape variables, thus permitting an assessment of therole of size and shape versus shape alone in discrimination.
Molar positions are abbreviated to L for lower, U for upper, and 1,2, 3 for mesial to distal positions. A step-wise discriminant analysiswas used to assess the likelihood that individuals will segregate intopredetermined populations. Discriminant functions analysis iscommonly used for population systematics studies because thediscriminant functions, which are linear combinations of variables inthe analysis, are designed to maximize inter-group separation at theexpense of intra-group variation, and thus classify individuals intogroups (Groves,1970b; Groves et al.,1992). The first two discriminantfunctions explained 70% to 80% of the variance in the populations andwere used in scatter plots to show the pattern of clustering.
An independent samples t-test (p< 0.05) showed that gorillamale and female molar dimensions differ significantly, but notwhen they are indexed against the GM, indicating that size, notshape ofmolars separatesmale and female gorillas. Bearing inmindthat sexual dimorphism is a necessary component of intra-groupvariation in gorillas, the sexes were combined in the analysis,despite the disparate representation of males in the samples.
Sample sizes differed for molar positions because several spec-imens had teeth missing and only relatively unworn teeth wereselected for study. Only 50% of the sample (163 specimens) pre-sented all six molars. A single discriminant analysis using all sixmolars would result in smaller sample sizes per population, witha greater number of variables relative to samples, leading tosingular covariance matrices. To ensure non-singular covariancematrices, and non-zero discriminant functions (Manly, 1994),separate analyses were carried out for each molar type, thusmaximizing sample sizes while using a subset of the variables. Astep-wise variable selection procedure ensured that only variablescontributing significantly to the discriminant functions wereselected. Bwindi, Kahuzi and Uele were not included as populationsin the analysis, but their affiliations were tested post-hoc using thediscriminant functions from the other 11 populations. All groupswere assumed to have equal prior probabilities of classification soas not to bias classification accuracy through unequal sample sizes.Classification accuracy helped to assess population discrimination,but the likelihood of individuals being classified into presumedspecies and subspecies was also examined by aggregating indi-viduals assigned to these units.
Mahalanobis generalized squared distances (D2) were used tostudy the phenetic distances between groups. The results of eachmolar position were assessed independently, but pair-wisedistances across the maxillary and mandibular molars were alsoaveraged to get an overall phenetic distance between groups.Sample sizes did not differ greatly at these tooth positions justi-fying the average. F-statistics were used to verify the significanceof pair-wise Mahalanobis distances. The pattern of pheneticdistances, the accuracy of classification, and two-dimensionalscatter plots were used to study population structure. Canonicalcoefficients of the discriminant functions were used to identify thevariables separating groups and a one-way ANOVA provided thesignificance levels of the separating variables. Pearson’s correla-tions between the discriminant function scores and the geometricmean were used to study the role of size (allometry) in
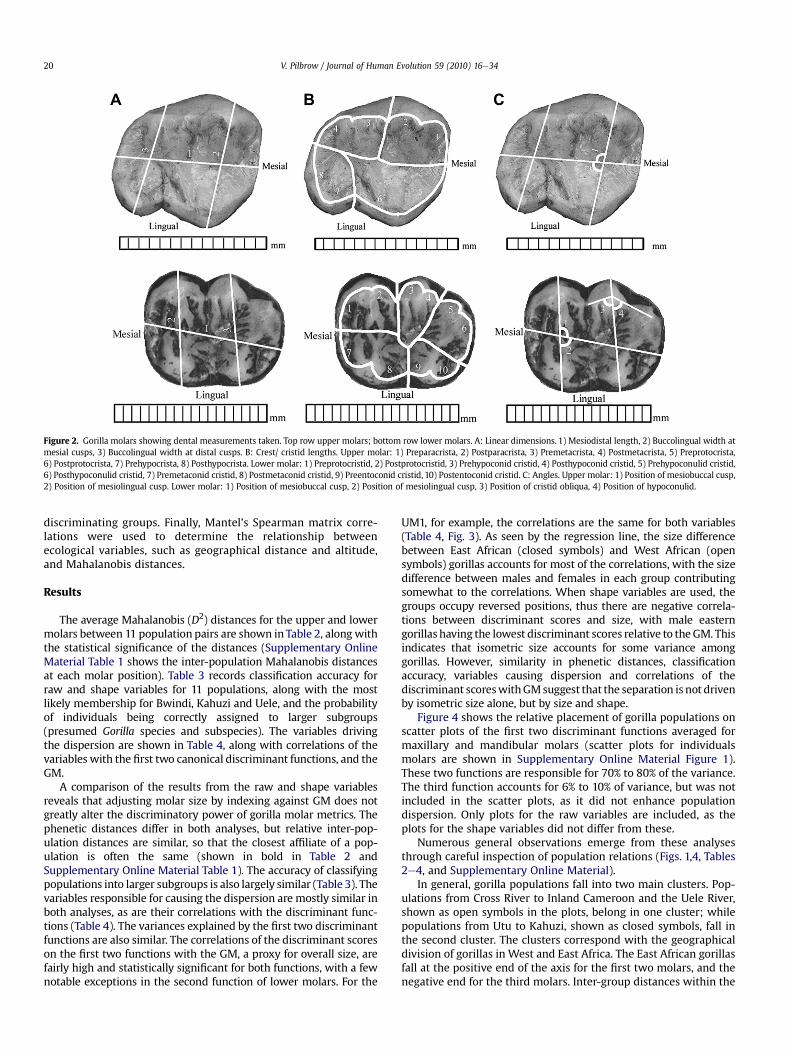
Figure 2. Gorilla molars showing dental measurements taken. Top row upper molars; bottom row lower molars. A: Linear dimensions. 1) Mesiodistal length, 2) Buccolingual width atmesial cusps, 3) Buccolingual width at distal cusps. B: Crest/ cristid lengths. Upper molar: 1) Preparacrista, 2) Postparacrista, 3) Premetacrista, 4) Postmetacrista, 5) Preprotocrista,6) Postprotocrista, 7) Prehypocrista, 8) Posthypocrista. Lower molar: 1) Preprotocristid, 2) Postprotocristid, 3) Prehypoconid cristid, 4) Posthypoconid cristid, 5) Prehypoconulid cristid,6) Posthypoconulid cristid, 7) Premetaconid cristid, 8) Postmetaconid cristid, 9) Preentoconid cristid, 10) Postentoconid cristid. C: Angles. Upper molar: 1) Position of mesiobuccal cusp,2) Position of mesiolingual cusp. Lower molar: 1) Position of mesiobuccal cusp, 2) Position of mesiolingual cusp, 3) Position of cristid obliqua, 4) Position of hypoconulid.
V. Pilbrow / Journal of Human Evolution 59 (2010) 16e3420
discriminating groups. Finally, Mantel’s Spearman matrix corre-lations were used to determine the relationship betweenecological variables, such as geographical distance and altitude,and Mahalanobis distances.
Results
The average Mahalanobis (D2) distances for the upper and lowermolars between 11 population pairs are shown in Table 2, along withthe statistical significance of the distances (Supplementary OnlineMaterial Table 1 shows the inter-population Mahalanobis distancesat each molar position). Table 3 records classification accuracy forraw and shape variables for 11 populations, along with the mostlikely membership for Bwindi, Kahuzi and Uele, and the probabilityof individuals being correctly assigned to larger subgroups(presumed Gorilla species and subspecies). The variables drivingthe dispersion are shown in Table 4, along with correlations of thevariables with the first two canonical discriminant functions, and theGM.
A comparison of the results from the raw and shape variablesreveals that adjusting molar size by indexing against GM does notgreatly alter the discriminatory power of gorilla molar metrics. Thephenetic distances differ in both analyses, but relative inter-pop-ulation distances are similar, so that the closest affiliate of a pop-ulation is often the same (shown in bold in Table 2 andSupplementary Online Material Table 1). The accuracy of classifyingpopulations into larger subgroups is also largely similar (Table 3). Thevariables responsible for causing the dispersion are mostly similar inboth analyses, as are their correlations with the discriminant func-tions (Table 4). The variances explained by the first two discriminantfunctions are also similar. The correlations of the discriminant scoreson the first two functions with the GM, a proxy for overall size, arefairly high and statistically significant for both functions, with a fewnotable exceptions in the second function of lower molars. For the
UM1, for example, the correlations are the same for both variables(Table 4, Fig. 3). As seen by the regression line, the size differencebetween East African (closed symbols) and West African (opensymbols) gorillas accounts for most of the correlations, with the sizedifference between males and females in each group contributingsomewhat to the correlations. When shape variables are used, thegroups occupy reversed positions, thus there are negative correla-tions between discriminant scores and size, with male easterngorillas having the lowest discriminant scores relative to theGM. Thisindicates that isometric size accounts for some variance amonggorillas. However, similarity in phenetic distances, classificationaccuracy, variables causing dispersion and correlations of thediscriminant scoreswithGMsuggest that the separation is not drivenby isometric size alone, but by size and shape.
Figure 4 shows the relative placement of gorilla populations onscatter plots of the first two discriminant functions averaged formaxillary and mandibular molars (scatter plots for individualsmolars are shown in Supplementary Online Material Figure 1).These two functions are responsible for 70% to 80% of the variance.The third function accounts for 6% to 10% of variance, but was notincluded in the scatter plots, as it did not enhance populationdispersion. Only plots for the raw variables are included, as theplots for the shape variables did not differ from these.
Numerous general observations emerge from these analysesthrough careful inspection of population relations (Figs. 1,4, Tables2e4, and Supplementary Online Material).
In general, gorilla populations fall into two main clusters. Pop-ulations from Cross River to Inland Cameroon and the Uele River,shown as open symbols in the plots, belong in one cluster; whilepopulations from Utu to Kahuzi, shown as closed symbols, fall inthe second cluster. The clusters correspond with the geographicaldivision of gorillas in West and East Africa. The East African gorillasfall at the positive end of the axis for the first two molars, and thenegative end for the third molars. Inter-group distances within the
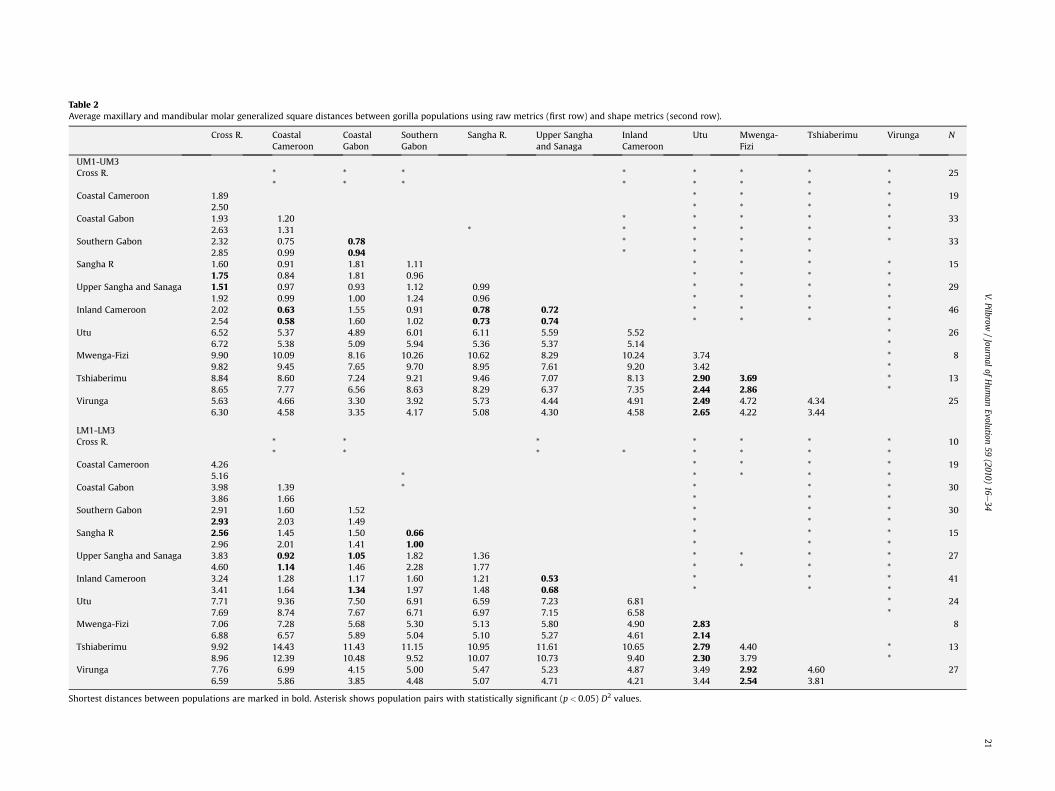
Table 2Average maxillary and mandibular molar generalized square distances between gorilla populations using raw metrics (first row) and shape metrics (second row).
Cross R. CoastalCameroon
CoastalGabon
SouthernGabon
Sangha R. Upper Sanghaand Sanaga
InlandCameroon
Utu Mwenga-Fizi
Tshiaberimu Virunga N
UM1-UM3Cross R. * * * * * * * * 25
* * * * * * * *Coastal Cameroon 1.89 * * * * 19
2.50 * * * *Coastal Gabon 1.93 1.20 * * * * * 33
2.63 1.31 * * * * * *Southern Gabon 2.32 0.75 0.78 * * * * * 33
2.85 0.99 0.94 * * * *Sangha R 1.60 0.91 1.81 1.11 * * * * 15
1.75 0.84 1.81 0.96 * * * *Upper Sangha and Sanaga 1.51 0.97 0.93 1.12 0.99 * * * * 29
1.92 0.99 1.00 1.24 0.96 * * * *Inland Cameroon 2.02 0.63 1.55 0.91 0.78 0.72 * * * * 46
2.54 0.58 1.60 1.02 0.73 0.74 * * * *Utu 6.52 5.37 4.89 6.01 6.11 5.59 5.52 * 26
6.72 5.38 5.09 5.94 5.36 5.37 5.14 *Mwenga-Fizi 9.90 10.09 8.16 10.26 10.62 8.29 10.24 3.74 * 8
9.82 9.45 7.65 9.70 8.95 7.61 9.20 3.42 *Tshiaberimu 8.84 8.60 7.24 9.21 9.46 7.07 8.13 2.90 3.69 * 13
8.65 7.77 6.56 8.63 8.29 6.37 7.35 2.44 2.86 *Virunga 5.63 4.66 3.30 3.92 5.73 4.44 4.91 2.49 4.72 4.34 25
6.30 4.58 3.35 4.17 5.08 4.30 4.58 2.65 4.22 3.44
LM1-LM3Cross R. * * * * * * * 10
* * * * * * * *Coastal Cameroon 4.26 * * * * 19
5.16 * * * * *Coastal Gabon 3.98 1.39 * * * * 30
3.86 1.66 * * *Southern Gabon 2.91 1.60 1.52 * * * 30
2.93 2.03 1.49 * * *Sangha R 2.56 1.45 1.50 0.66 * * * 15
2.96 2.01 1.41 1.00 * * *Upper Sangha and Sanaga 3.83 0.92 1.05 1.82 1.36 * * * * 27
4.60 1.14 1.46 2.28 1.77 * * * *Inland Cameroon 3.24 1.28 1.17 1.60 1.21 0.53 * * * 41
3.41 1.64 1.34 1.97 1.48 0.68 * * *Utu 7.71 9.36 7.50 6.91 6.59 7.23 6.81 * 24
7.69 8.74 7.67 6.71 6.97 7.15 6.58 *Mwenga-Fizi 7.06 7.28 5.68 5.30 5.13 5.80 4.90 2.83 8
6.88 6.57 5.89 5.04 5.10 5.27 4.61 2.14Tshiaberimu 9.92 14.43 11.43 11.15 10.95 11.61 10.65 2.79 4.40 * 13
8.96 12.39 10.48 9.52 10.07 10.73 9.40 2.30 3.79 *Virunga 7.76 6.99 4.15 5.00 5.47 5.23 4.87 3.49 2.92 4.60 27
6.59 5.86 3.85 4.48 5.07 4.71 4.21 3.44 2.54 3.81
Shortest distances between populations are marked in bold. Asterisk shows population pairs with statistically significant (p< 0.05) D2 values.
V.Pilbrow/Journal
ofHum
anEvolution
59(2010)
16e34
21
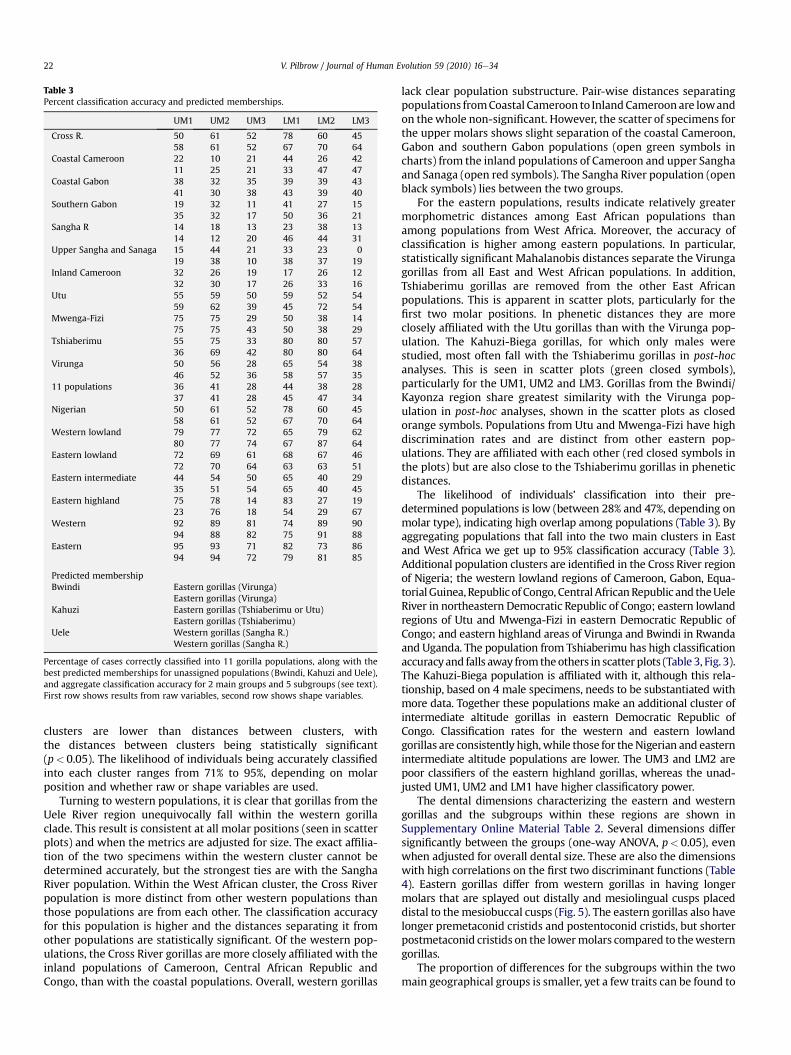
Table 3Percent classification accuracy and predicted memberships.
UM1 UM2 UM3 LM1 LM2 LM3
Cross R. 50 61 52 78 60 4558 61 52 67 70 64
Coastal Cameroon 22 10 21 44 26 4211 25 21 33 47 47
Coastal Gabon 38 32 35 39 39 4341 30 38 43 39 40
Southern Gabon 19 32 11 41 27 1535 32 17 50 36 21
Sangha R 14 18 13 23 38 1314 12 20 46 44 31
Upper Sangha and Sanaga 15 44 21 33 23 019 38 10 38 37 19
Inland Cameroon 32 26 19 17 26 1232 30 17 26 33 16
Utu 55 59 50 59 52 5459 62 39 45 72 54
Mwenga-Fizi 75 75 29 50 38 1475 75 43 50 38 29
Tshiaberimu 55 75 33 80 80 5736 69 42 80 80 64
Virunga 50 56 28 65 54 3846 52 36 58 57 35
11 populations 36 41 28 44 38 2837 41 28 45 47 34
Nigerian 50 61 52 78 60 4558 61 52 67 70 64
Western lowland 79 77 72 65 79 6280 77 74 67 87 64
Eastern lowland 72 69 61 68 67 4672 70 64 63 63 51
Eastern intermediate 44 54 50 65 40 2935 51 54 65 40 45
Eastern highland 75 78 14 83 27 1923 76 18 54 29 67
Western 92 89 81 74 89 9094 88 82 75 91 88
Eastern 95 93 71 82 73 8694 94 72 79 81 85
Predicted membershipBwindi Eastern gorillas (Virunga)
Eastern gorillas (Virunga)Kahuzi Eastern gorillas (Tshiaberimu or Utu)
Eastern gorillas (Tshiaberimu)Uele Western gorillas (Sangha R.)
Western gorillas (Sangha R.)
Percentage of cases correctly classified into 11 gorilla populations, along with thebest predicted memberships for unassigned populations (Bwindi, Kahuzi and Uele),and aggregate classification accuracy for 2 main groups and 5 subgroups (see text).First row shows results from raw variables, second row shows shape variables.
V. Pilbrow / Journal of Human Evolution 59 (2010) 16e3422
clusters are lower than distances between clusters, withthe distances between clusters being statistically significant(p< 0.05). The likelihood of individuals being accurately classifiedinto each cluster ranges from 71% to 95%, depending on molarposition and whether raw or shape variables are used.
Turning to western populations, it is clear that gorillas from theUele River region unequivocally fall within the western gorillaclade. This result is consistent at all molar positions (seen in scatterplots) and when the metrics are adjusted for size. The exact affilia-tion of the two specimens within the western cluster cannot bedetermined accurately, but the strongest ties are with the SanghaRiver population. Within the West African cluster, the Cross Riverpopulation is more distinct from other western populations thanthose populations are from each other. The classification accuracyfor this population is higher and the distances separating it fromother populations are statistically significant. Of the western pop-ulations, the Cross River gorillas are more closely affiliated with theinland populations of Cameroon, Central African Republic andCongo, than with the coastal populations. Overall, western gorillas
lack clear population substructure. Pair-wise distances separatingpopulations fromCoastal Cameroon to InlandCameroon are lowandon thewhole non-significant. However, the scatter of specimens forthe upper molars shows slight separation of the coastal Cameroon,Gabon and southern Gabon populations (open green symbols incharts) from the inland populations of Cameroon and upper Sanghaand Sanaga (open red symbols). The Sangha River population (openblack symbols) lies between the two groups.
For the eastern populations, results indicate relatively greatermorphometric distances among East African populations thanamong populations from West Africa. Moreover, the accuracy ofclassification is higher among eastern populations. In particular,statistically significant Mahalanobis distances separate the Virungagorillas from all East and West African populations. In addition,Tshiaberimu gorillas are removed from the other East Africanpopulations. This is apparent in scatter plots, particularly for thefirst two molar positions. In phenetic distances they are moreclosely affiliated with the Utu gorillas than with the Virunga pop-ulation. The Kahuzi-Biega gorillas, for which only males werestudied, most often fall with the Tshiaberimu gorillas in post-hocanalyses. This is seen in scatter plots (green closed symbols),particularly for the UM1, UM2 and LM3. Gorillas from the Bwindi/Kayonza region share greatest similarity with the Virunga pop-ulation in post-hoc analyses, shown in the scatter plots as closedorange symbols. Populations from Utu and Mwenga-Fizi have highdiscrimination rates and are distinct from other eastern pop-ulations. They are affiliated with each other (red closed symbols inthe plots) but are also close to the Tshiaberimu gorillas in pheneticdistances.
The likelihood of individuals’ classification into their pre-determined populations is low (between 28% and 47%, depending onmolar type), indicating high overlap among populations (Table 3). Byaggregating populations that fall into the two main clusters in Eastand West Africa we get up to 95% classification accuracy (Table 3).Additional population clusters are identified in the Cross River regionof Nigeria; the western lowland regions of Cameroon, Gabon, Equa-torial Guinea, Republic of Congo, Central AfricanRepublic and theUeleRiver in northeastern Democratic Republic of Congo; eastern lowlandregions of Utu and Mwenga-Fizi in eastern Democratic Republic ofCongo; and eastern highland areas of Virunga and Bwindi in Rwandaand Uganda. The population from Tshiaberimu has high classificationaccuracyand falls away fromtheothers in scatter plots (Table 3, Fig. 3).The Kahuzi-Biega population is affiliated with it, although this rela-tionship, based on 4 male specimens, needs to be substantiated withmore data. Together these populations make an additional cluster ofintermediate altitude gorillas in eastern Democratic Republic ofCongo. Classification rates for the western and eastern lowlandgorillas are consistently high,while those for theNigerian and easternintermediate altitude populations are lower. The UM3 and LM2 arepoor classifiers of the eastern highland gorillas, whereas the unad-justed UM1, UM2 and LM1 have higher classificatory power.
The dental dimensions characterizing the eastern and westerngorillas and the subgroups within these regions are shown inSupplementary Online Material Table 2. Several dimensions differsignificantly between the groups (one-way ANOVA, p< 0.05), evenwhen adjusted for overall dental size. These are also the dimensionswith high correlations on the first two discriminant functions (Table4). Eastern gorillas differ from western gorillas in having longermolars that are splayed out distally and mesiolingual cusps placeddistal to themesiobuccal cusps (Fig. 5). The eastern gorillas also havelonger premetaconid cristids and postentoconid cristids, but shorterpostmetaconid cristids on the lowermolars compared to thewesterngorillas.
The proportion of differences for the subgroups within the twomain geographical groups is smaller, yet a few traits can be found to
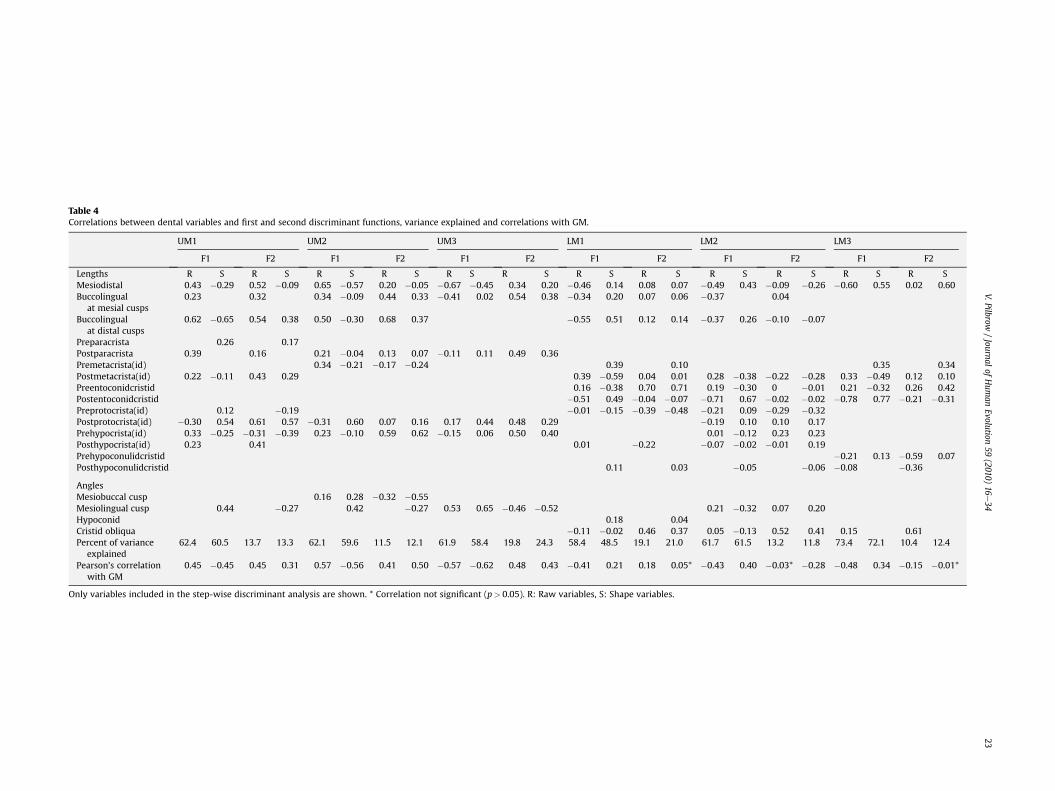
Table 4Correlations between dental variables and first and second discriminant functions, variance explained and correlations with GM.
UM1 UM2 UM3 LM1 LM2 LM3
F1 F2 F1 F2 F1 F2 F1 F2 F1 F2 F1 F2
Lengths R S R S R S R S R S R S R S R S R S R S R S R SMesiodistal 0.43 �0.29 0.52 �0.09 0.65 �0.57 0.20 �0.05 �0.67 �0.45 0.34 0.20 �0.46 0.14 0.08 0.07 �0.49 0.43 �0.09 �0.26 �0.60 0.55 0.02 0.60Buccolingual
at mesial cusps0.23 0.32 0.34 �0.09 0.44 0.33 �0.41 0.02 0.54 0.38 �0.34 0.20 0.07 0.06 �0.37 0.04
Buccolingualat distal cusps
0.62 �0.65 0.54 0.38 0.50 �0.30 0.68 0.37 �0.55 0.51 0.12 0.14 �0.37 0.26 �0.10 �0.07
Preparacrista 0.26 0.17Postparacrista 0.39 0.16 0.21 �0.04 0.13 0.07 �0.11 0.11 0.49 0.36Premetacrista(id) 0.34 �0.21 �0.17 �0.24 0.39 0.10 0.35 0.34Postmetacrista(id) 0.22 �0.11 0.43 0.29 0.39 �0.59 0.04 0.01 0.28 �0.38 �0.22 �0.28 0.33 �0.49 0.12 0.10Preentoconidcristid 0.16 �0.38 0.70 0.71 0.19 �0.30 0 �0.01 0.21 �0.32 0.26 0.42Postentoconidcristid �0.51 0.49 �0.04 �0.07 �0.71 0.67 �0.02 �0.02 �0.78 0.77 �0.21 �0.31Preprotocrista(id) 0.12 �0.19 �0.01 �0.15 �0.39 �0.48 �0.21 0.09 �0.29 �0.32Postprotocrista(id) �0.30 0.54 0.61 0.57 �0.31 0.60 0.07 0.16 0.17 0.44 0.48 0.29 �0.19 0.10 0.10 0.17Prehypocrista(id) 0.33 �0.25 �0.31 �0.39 0.23 �0.10 0.59 0.62 �0.15 0.06 0.50 0.40 0.01 �0.12 0.23 0.23Posthypocrista(id) 0.23 0.41 0.01 �0.22 �0.07 �0.02 �0.01 0.19Prehypoconulidcristid �0.21 0.13 �0.59 0.07Posthypoconulidcristid 0.11 0.03 �0.05 �0.06 �0.08 �0.36
AnglesMesiobuccal cusp 0.16 0.28 �0.32 �0.55Mesiolingual cusp 0.44 �0.27 0.42 �0.27 0.53 0.65 �0.46 �0.52 0.21 �0.32 0.07 0.20Hypoconid 0.18 0.04Cristid obliqua �0.11 �0.02 0.46 0.37 0.05 �0.13 0.52 0.41 0.15 0.61Percent of variance
explained62.4 60.5 13.7 13.3 62.1 59.6 11.5 12.1 61.9 58.4 19.8 24.3 58.4 48.5 19.1 21.0 61.7 61.5 13.2 11.8 73.4 72.1 10.4 12.4
Pearson’s correlationwith GM
0.45 �0.45 0.45 0.31 0.57 �0.56 0.41 0.50 �0.57 �0.62 0.48 0.43 �0.41 0.21 0.18 0.05* �0.43 0.40 �0.03* �0.28 �0.48 0.34 �0.15 �0.01*
Only variables included in the step-wise discriminant analysis are shown. * Correlation not significant (p> 0.05). R: Raw variables, S: Shape variables.
V.Pilbrow/Journal
ofHum
anEvolution
59(2010)
16e34
23
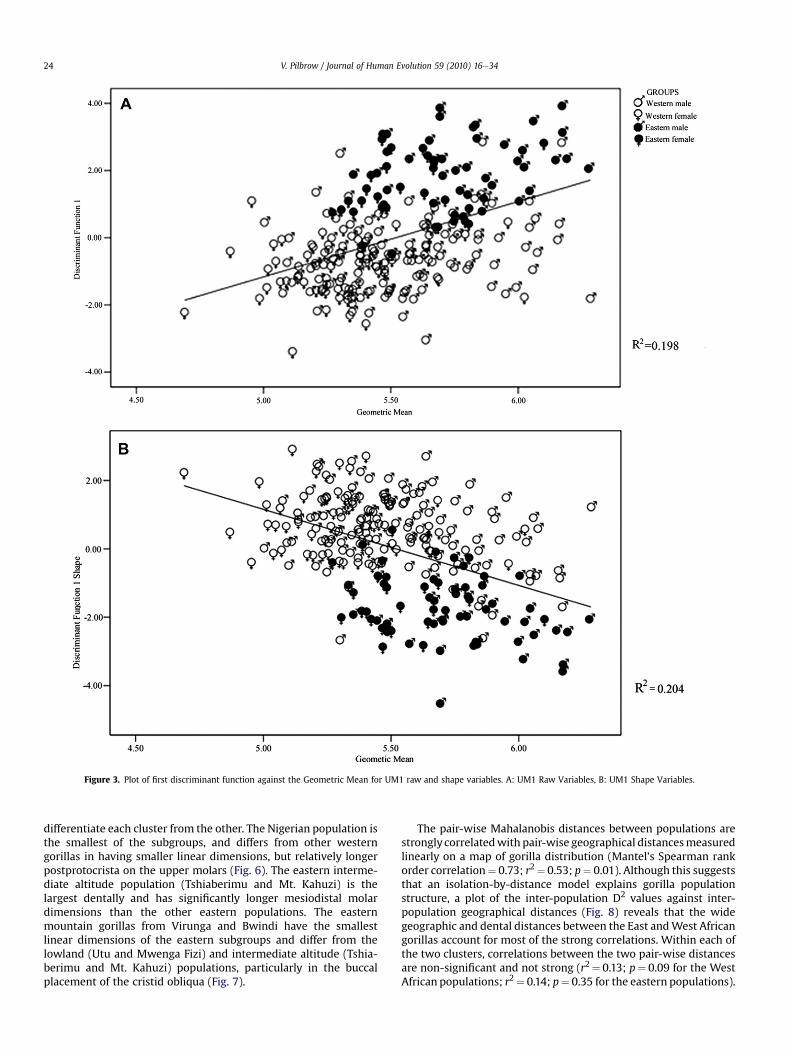
Figure 3. Plot of first discriminant function against the Geometric Mean for UM1 raw and shape variables. A: UM1 Raw Variables, B: UM1 Shape Variables.
V. Pilbrow / Journal of Human Evolution 59 (2010) 16e3424
differentiate each cluster from the other. The Nigerian population isthe smallest of the subgroups, and differs from other westerngorillas in having smaller linear dimensions, but relatively longerpostprotocrista on the upper molars (Fig. 6). The eastern interme-diate altitude population (Tshiaberimu and Mt. Kahuzi) is thelargest dentally and has significantly longer mesiodistal molardimensions than the other eastern populations. The easternmountain gorillas from Virunga and Bwindi have the smallestlinear dimensions of the eastern subgroups and differ from thelowland (Utu and Mwenga Fizi) and intermediate altitude (Tshia-berimu and Mt. Kahuzi) populations, particularly in the buccalplacement of the cristid obliqua (Fig. 7).
The pair-wise Mahalanobis distances between populations arestrongly correlatedwith pair-wise geographical distancesmeasuredlinearly on a map of gorilla distribution (Mantel’s Spearman rankorder correlation¼ 0.73; r2¼ 0.53; p¼ 0.01). Although this suggeststhat an isolation-by-distance model explains gorilla populationstructure, a plot of the inter-population D2 values against inter-population geographical distances (Fig. 8) reveals that the widegeographic and dental distances between the East andWest Africangorillas account for most of the strong correlations. Within each ofthe two clusters, correlations between the two pair-wise distancesare non-significant and not strong (r2¼ 0.13; p¼ 0.09 for the WestAfrican populations; r2¼ 0.14; p¼ 0.35 for the eastern populations).
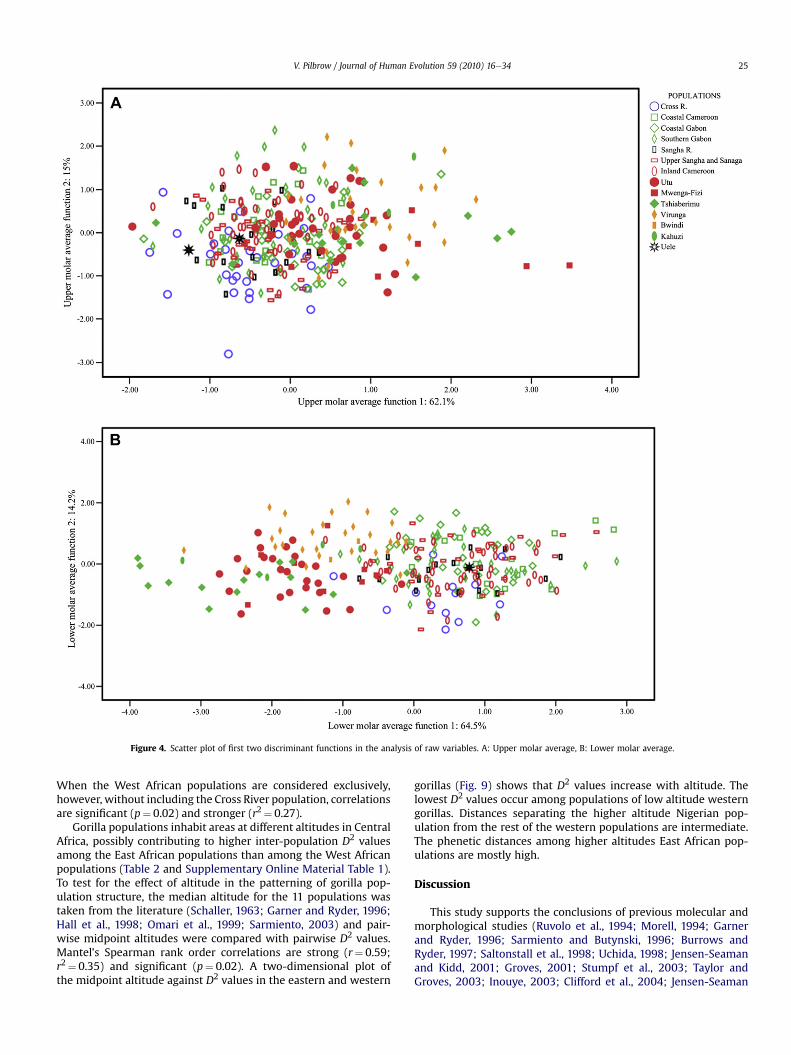
Figure 4. Scatter plot of first two discriminant functions in the analysis of raw variables. A: Upper molar average, B: Lower molar average.
V. Pilbrow / Journal of Human Evolution 59 (2010) 16e34 25
When the West African populations are considered exclusively,however, without including the Cross River population, correlationsare significant (p¼ 0.02) and stronger (r2¼ 0.27).
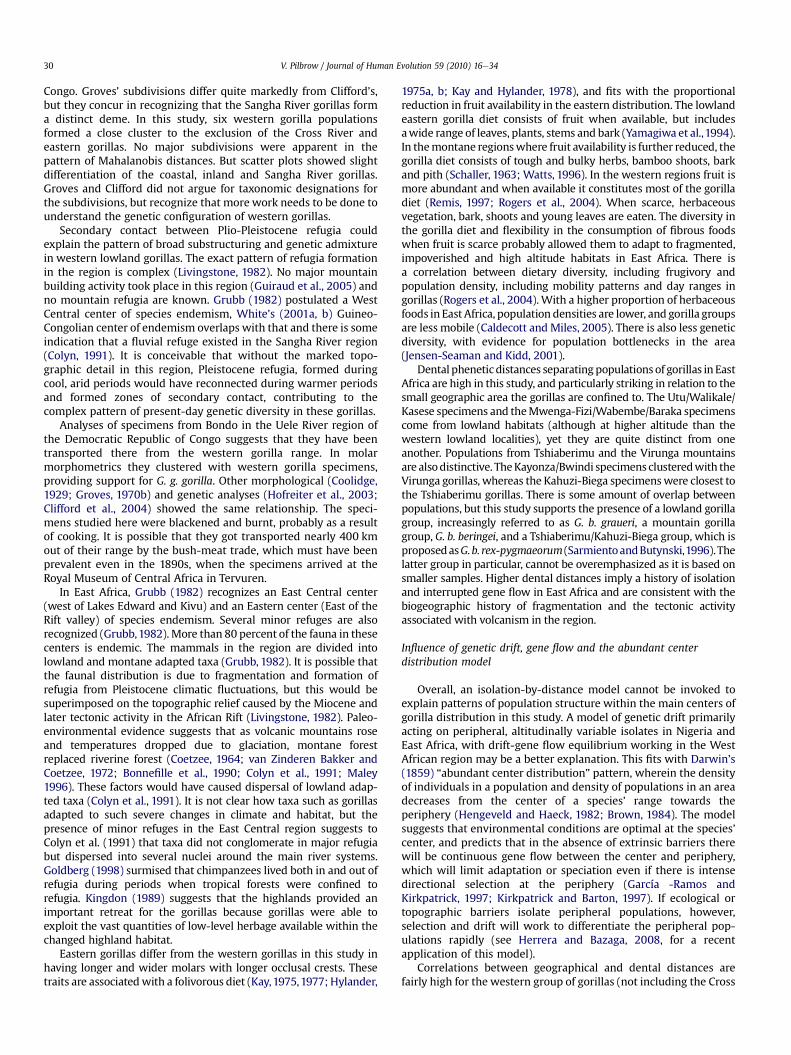
Gorilla populations inhabit areas at different altitudes in CentralAfrica, possibly contributing to higher inter-population D2 valuesamong the East African populations than among the West Africanpopulations (Table 2 and Supplementary Online Material Table 1).To test for the effect of altitude in the patterning of gorilla pop-ulation structure, the median altitude for the 11 populations wastaken from the literature (Schaller, 1963; Garner and Ryder, 1996;Hall et al., 1998; Omari et al., 1999; Sarmiento, 2003) and pair-wise midpoint altitudes were compared with pairwise D2 values.Mantel’s Spearman rank order correlations are strong (r¼ 0.59;r2¼ 0.35) and significant (p¼ 0.02). A two-dimensional plot ofthe midpoint altitude against D2 values in the eastern and western
gorillas (Fig. 9) shows that D2 values increase with altitude. Thelowest D2 values occur among populations of low altitude westerngorillas. Distances separating the higher altitude Nigerian pop-ulation from the rest of the western populations are intermediate.The phenetic distances among higher altitudes East African pop-ulations are mostly high.
Discussion
This study supports the conclusions of previous molecular andmorphological studies (Ruvolo et al., 1994; Morell, 1994; Garnerand Ryder, 1996; Sarmiento and Butynski, 1996; Burrows andRyder, 1997; Saltonstall et al., 1998; Uchida, 1998; Jensen-Seamanand Kidd, 2001; Groves, 2001; Stumpf et al., 2003; Taylor andGroves, 2003; Inouye, 2003; Clifford et al., 2004; Jensen-Seaman
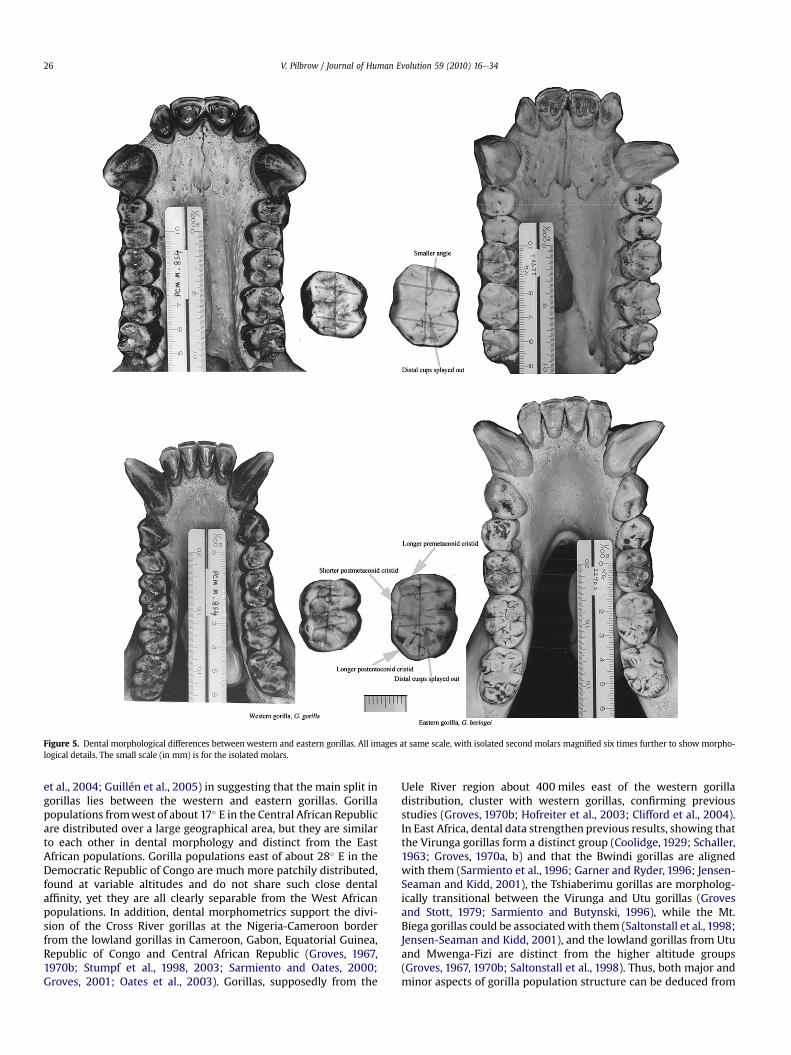
Figure 5. Dental morphological differences between western and eastern gorillas. All images at same scale, with isolated second molars magnified six times further to show morpho-logical details. The small scale (in mm) is for the isolated molars.
V. Pilbrow / Journal of Human Evolution 59 (2010) 16e3426
et al., 2004; Guillén et al., 2005) in suggesting that the main split ingorillas lies between the western and eastern gorillas. Gorillapopulations fromwest of about 17� E in the Central African Republicare distributed over a large geographical area, but they are similarto each other in dental morphology and distinct from the EastAfrican populations. Gorilla populations east of about 28� E in theDemocratic Republic of Congo are much more patchily distributed,found at variable altitudes and do not share such close dentalaffinity, yet they are all clearly separable from the West Africanpopulations. In addition, dental morphometrics support the divi-sion of the Cross River gorillas at the Nigeria-Cameroon borderfrom the lowland gorillas in Cameroon, Gabon, Equatorial Guinea,Republic of Congo and Central African Republic (Groves, 1967,1970b; Stumpf et al., 1998, 2003; Sarmiento and Oates, 2000;Groves, 2001; Oates et al., 2003). Gorillas, supposedly from the
Uele River region about 400 miles east of the western gorilladistribution, cluster with western gorillas, confirming previousstudies (Groves, 1970b; Hofreiter et al., 2003; Clifford et al., 2004).In East Africa, dental data strengthen previous results, showing thatthe Virunga gorillas form a distinct group (Coolidge, 1929; Schaller,1963; Groves, 1970a, b) and that the Bwindi gorillas are alignedwith them (Sarmiento et al., 1996; Garner and Ryder, 1996; Jensen-Seaman and Kidd, 2001), the Tshiaberimu gorillas are morpholog-ically transitional between the Virunga and Utu gorillas (Grovesand Stott, 1979; Sarmiento and Butynski, 1996), while the Mt.Biega gorillas could be associatedwith them (Saltonstall et al.,1998;Jensen-Seaman and Kidd, 2001), and the lowland gorillas from Utuand Mwenga-Fizi are distinct from the higher altitude groups(Groves, 1967, 1970b; Saltonstall et al., 1998). Thus, both major andminor aspects of gorilla population structure can be deduced from
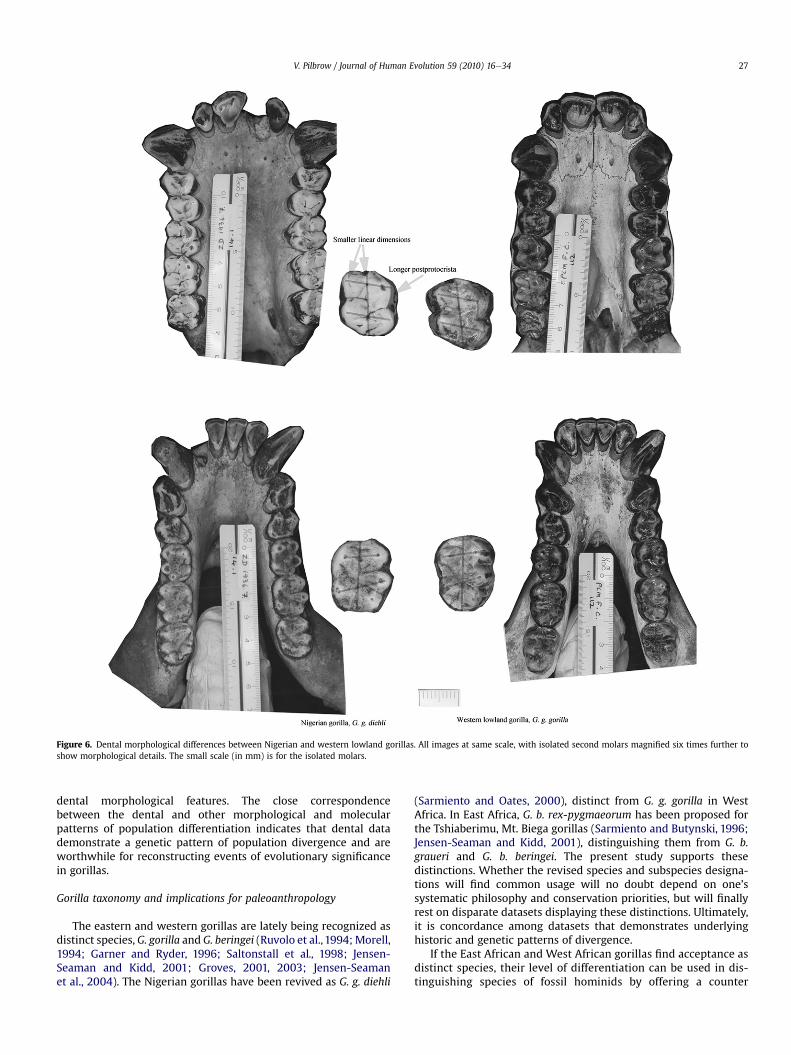
Figure 6. Dental morphological differences between Nigerian and western lowland gorillas. All images at same scale, with isolated second molars magnified six times further toshow morphological details. The small scale (in mm) is for the isolated molars.
V. Pilbrow / Journal of Human Evolution 59 (2010) 16e34 27
dental morphological features. The close correspondencebetween the dental and other morphological and molecularpatterns of population differentiation indicates that dental datademonstrate a genetic pattern of population divergence and areworthwhile for reconstructing events of evolutionary significancein gorillas.
Gorilla taxonomy and implications for paleoanthropology
The eastern and western gorillas are lately being recognized asdistinct species, G. gorilla and G. beringei (Ruvolo et al., 1994;Morell,1994; Garner and Ryder, 1996; Saltonstall et al., 1998; Jensen-Seaman and Kidd, 2001; Groves, 2001, 2003; Jensen-Seamanet al., 2004). The Nigerian gorillas have been revived as G. g. diehli
(Sarmiento and Oates, 2000), distinct from G. g. gorilla in WestAfrica. In East Africa, G. b. rex-pygmaeorum has been proposed forthe Tshiaberimu, Mt. Biega gorillas (Sarmiento and Butynski, 1996;Jensen-Seaman and Kidd, 2001), distinguishing them from G. b.graueri and G. b. beringei. The present study supports thesedistinctions. Whether the revised species and subspecies designa-tions will find common usage will no doubt depend on one’ssystematic philosophy and conservation priorities, but will finallyrest on disparate datasets displaying these distinctions. Ultimately,it is concordance among datasets that demonstrates underlyinghistoric and genetic patterns of divergence.
If the East African and West African gorillas find acceptance asdistinct species, their level of differentiation can be used in dis-tinguishing species of fossil hominids by offering a counter
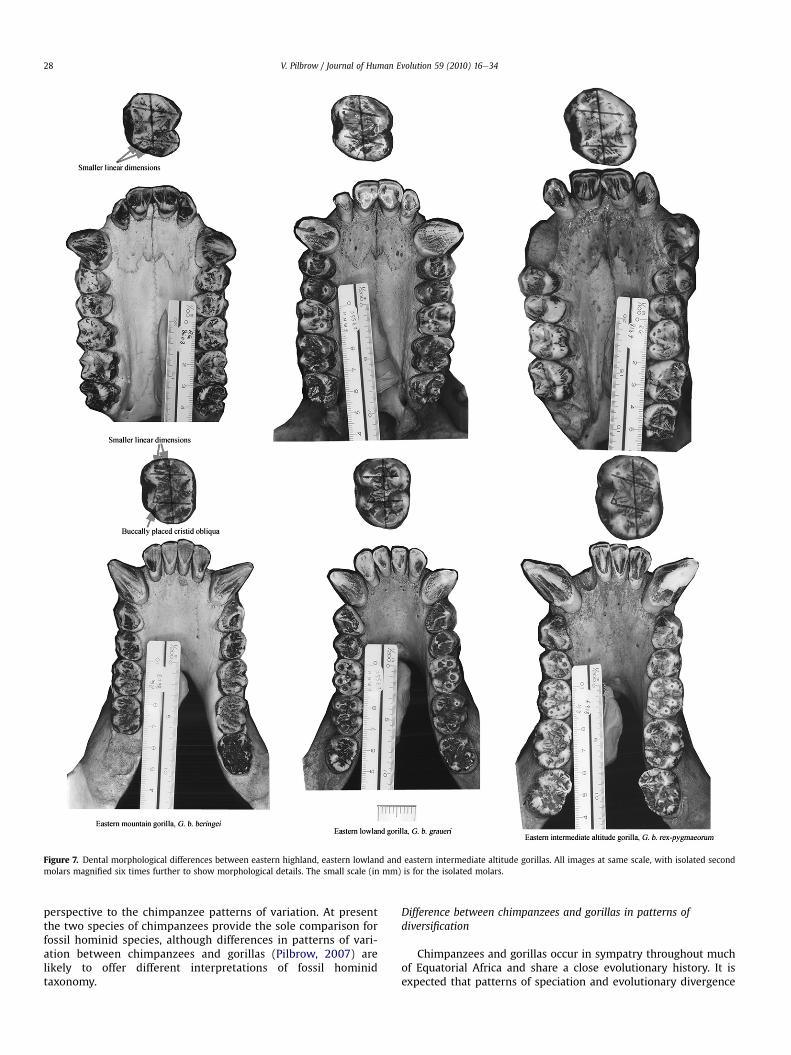
Figure 7. Dental morphological differences between eastern highland, eastern lowland and eastern intermediate altitude gorillas. All images at same scale, with isolated secondmolars magnified six times further to show morphological details. The small scale (in mm) is for the isolated molars.
V. Pilbrow / Journal of Human Evolution 59 (2010) 16e3428
perspective to the chimpanzee patterns of variation. At presentthe two species of chimpanzees provide the sole comparison forfossil hominid species, although differences in patterns of vari-ation between chimpanzees and gorillas (Pilbrow, 2007) arelikely to offer different interpretations of fossil hominidtaxonomy.
Difference between chimpanzees and gorillas in patterns ofdiversification
Chimpanzees and gorillas occur in sympatry throughout muchof Equatorial Africa and share a close evolutionary history. It isexpected that patterns of speciation and evolutionary divergence
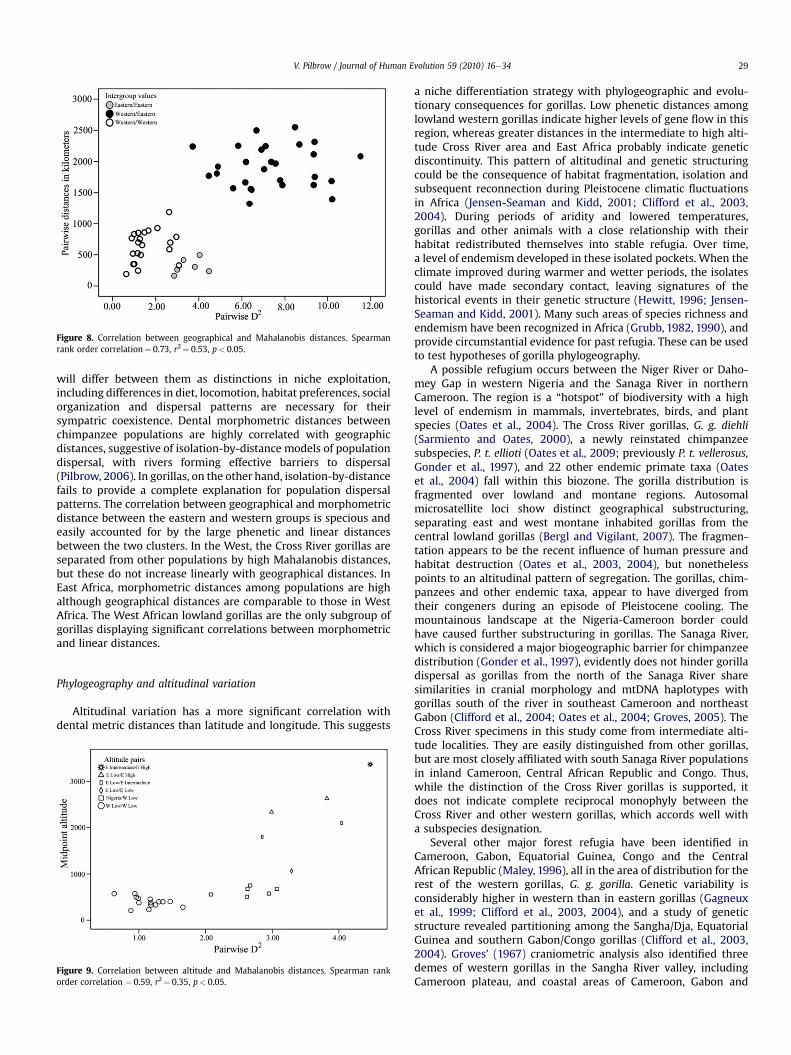
Figure 8. Correlation between geographical and Mahalanobis distances. Spearmanrank order correlation¼ 0.73, r2¼ 0.53, p< 0.05.
V. Pilbrow / Journal of Human Evolution 59 (2010) 16e34 29
will differ between them as distinctions in niche exploitation,including differences in diet, locomotion, habitat preferences, socialorganization and dispersal patterns are necessary for theirsympatric coexistence. Dental morphometric distances betweenchimpanzee populations are highly correlated with geographicdistances, suggestive of isolation-by-distance models of populationdispersal, with rivers forming effective barriers to dispersal(Pilbrow, 2006). In gorillas, on the other hand, isolation-by-distancefails to provide a complete explanation for population dispersalpatterns. The correlation between geographical and morphometricdistance between the eastern and western groups is specious andeasily accounted for by the large phenetic and linear distancesbetween the two clusters. In the West, the Cross River gorillas areseparated from other populations by high Mahalanobis distances,but these do not increase linearly with geographical distances. InEast Africa, morphometric distances among populations are highalthough geographical distances are comparable to those in WestAfrica. The West African lowland gorillas are the only subgroup ofgorillas displaying significant correlations between morphometricand linear distances.
Phylogeography and altitudinal variation
Altitudinal variation has a more significant correlation withdental metric distances than latitude and longitude. This suggests
Figure 9. Correlation between altitude and Mahalanobis distances. Spearman rankorder correlation ¼ 0.59, r2¼ 0.35, p< 0.05.
a niche differentiation strategy with phylogeographic and evolu-tionary consequences for gorillas. Low phenetic distances amonglowland western gorillas indicate higher levels of gene flow in thisregion, whereas greater distances in the intermediate to high alti-tude Cross River area and East Africa probably indicate geneticdiscontinuity. This pattern of altitudinal and genetic structuringcould be the consequence of habitat fragmentation, isolation andsubsequent reconnection during Pleistocene climatic fluctuationsin Africa (Jensen-Seaman and Kidd, 2001; Clifford et al., 2003,2004). During periods of aridity and lowered temperatures,gorillas and other animals with a close relationship with theirhabitat redistributed themselves into stable refugia. Over time,a level of endemism developed in these isolated pockets. When theclimate improved during warmer and wetter periods, the isolatescould have made secondary contact, leaving signatures of thehistorical events in their genetic structure (Hewitt, 1996; Jensen-Seaman and Kidd, 2001). Many such areas of species richness andendemism have been recognized in Africa (Grubb, 1982, 1990), andprovide circumstantial evidence for past refugia. These can be usedto test hypotheses of gorilla phylogeography.
A possible refugium occurs between the Niger River or Daho-mey Gap in western Nigeria and the Sanaga River in northernCameroon. The region is a “hotspot” of biodiversity with a highlevel of endemism in mammals, invertebrates, birds, and plantspecies (Oates et al., 2004). The Cross River gorillas, G. g. diehli(Sarmiento and Oates, 2000), a newly reinstated chimpanzeesubspecies, P. t. ellioti (Oates et al., 2009; previously P. t. vellerosus,Gonder et al., 1997), and 22 other endemic primate taxa (Oateset al., 2004) fall within this biozone. The gorilla distribution isfragmented over lowland and montane regions. Autosomalmicrosatellite loci show distinct geographical substructuring,separating east and west montane inhabited gorillas from thecentral lowland gorillas (Bergl and Vigilant, 2007). The fragmen-tation appears to be the recent influence of human pressure andhabitat destruction (Oates et al., 2003, 2004), but nonethelesspoints to an altitudinal pattern of segregation. The gorillas, chim-panzees and other endemic taxa, appear to have diverged fromtheir congeners during an episode of Pleistocene cooling. Themountainous landscape at the Nigeria-Cameroon border couldhave caused further substructuring in gorillas. The Sanaga River,which is considered a major biogeographic barrier for chimpanzeedistribution (Gonder et al., 1997), evidently does not hinder gorilladispersal as gorillas from the north of the Sanaga River sharesimilarities in cranial morphology and mtDNA haplotypes withgorillas south of the river in southeast Cameroon and northeastGabon (Clifford et al., 2004; Oates et al., 2004; Groves, 2005). TheCross River specimens in this study come from intermediate alti-tude localities. They are easily distinguished from other gorillas,but are most closely affiliated with south Sanaga River populationsin inland Cameroon, Central African Republic and Congo. Thus,while the distinction of the Cross River gorillas is supported, itdoes not indicate complete reciprocal monophyly between theCross River and other western gorillas, which accords well witha subspecies designation.
Several other major forest refugia have been identified inCameroon, Gabon, Equatorial Guinea, Congo and the CentralAfrican Republic (Maley, 1996), all in the area of distribution for therest of the western gorillas, G. g. gorilla. Genetic variability isconsiderably higher in western than in eastern gorillas (Gagneuxet al., 1999; Clifford et al., 2003, 2004), and a study of geneticstructure revealed partitioning among the Sangha/Dja, EquatorialGuinea and southern Gabon/Congo gorillas (Clifford et al., 2003,2004). Groves’ (1967) craniometric analysis also identified threedemes of western gorillas in the Sangha River valley, includingCameroon plateau, and coastal areas of Cameroon, Gabon and
V. Pilbrow / Journal of Human Evolution 59 (2010) 16e3430
Congo. Groves’ subdivisions differ quite markedly from Clifford’s,but they concur in recognizing that the Sangha River gorillas forma distinct deme. In this study, six western gorilla populationsformed a close cluster to the exclusion of the Cross River andeastern gorillas. No major subdivisions were apparent in thepattern of Mahalanobis distances. But scatter plots showed slightdifferentiation of the coastal, inland and Sangha River gorillas.Groves and Clifford did not argue for taxonomic designations forthe subdivisions, but recognize that more work needs to be done tounderstand the genetic configuration of western gorillas.
Secondary contact between Plio-Pleistocene refugia couldexplain the pattern of broad substructuring and genetic admixturein western lowland gorillas. The exact pattern of refugia formationin the region is complex (Livingstone, 1982). No major mountainbuilding activity took place in this region (Guiraud et al., 2005) andno mountain refugia are known. Grubb (1982) postulated a WestCentral center of species endemism, White’s (2001a, b) Guineo-Congolian center of endemism overlaps with that and there is someindication that a fluvial refuge existed in the Sangha River region(Colyn, 1991). It is conceivable that without the marked topo-graphic detail in this region, Pleistocene refugia, formed duringcool, arid periods would have reconnected during warmer periodsand formed zones of secondary contact, contributing to thecomplex pattern of present-day genetic diversity in these gorillas.
Analyses of specimens from Bondo in the Uele River region ofthe Democratic Republic of Congo suggests that they have beentransported there from the western gorilla range. In molarmorphometrics they clustered with western gorilla specimens,providing support for G. g. gorilla. Other morphological (Coolidge,1929; Groves, 1970b) and genetic analyses (Hofreiter et al., 2003;Clifford et al., 2004) showed the same relationship. The speci-mens studied here were blackened and burnt, probably as a resultof cooking. It is possible that they got transported nearly 400 kmout of their range by the bush-meat trade, which must have beenprevalent even in the 1890s, when the specimens arrived at theRoyal Museum of Central Africa in Tervuren.
In East Africa, Grubb (1982) recognizes an East Central center(west of Lakes Edward and Kivu) and an Eastern center (East of theRift valley) of species endemism. Several minor refuges are alsorecognized (Grubb,1982). More than 80 percent of the fauna in thesecenters is endemic. The mammals in the region are divided intolowland and montane adapted taxa (Grubb, 1982). It is possible thatthe faunal distribution is due to fragmentation and formation ofrefugia from Pleistocene climatic fluctuations, but this would besuperimposed on the topographic relief caused by the Miocene andlater tectonic activity in the African Rift (Livingstone, 1982). Paleo-environmental evidence suggests that as volcanic mountains roseand temperatures dropped due to glaciation, montane forestreplaced riverine forest (Coetzee, 1964; van Zinderen Bakker andCoetzee, 1972; Bonnefille et al., 1990; Colyn et al., 1991; Maley1996). These factors would have caused dispersal of lowland adap-ted taxa (Colyn et al., 1991). It is not clear how taxa such as gorillasadapted to such severe changes in climate and habitat, but thepresence of minor refuges in the East Central region suggests toColyn et al. (1991) that taxa did not conglomerate in major refugiabut dispersed into several nuclei around the main river systems.Goldberg (1998) surmised that chimpanzees lived both in and out ofrefugia during periods when tropical forests were confined torefugia. Kingdon (1989) suggests that the highlands provided animportant retreat for the gorillas because gorillas were able toexploit the vast quantities of low-level herbage available within thechanged highland habitat.
Eastern gorillas differ from the western gorillas in this study inhaving longer and wider molars with longer occlusal crests. Thesetraits are associatedwith a folivorous diet (Kay,1975,1977; Hylander,
1975a, b; Kay and Hylander, 1978), and fits with the proportionalreduction in fruit availability in the eastern distribution. The lowlandeastern gorilla diet consists of fruit when available, but includesawide range of leaves, plants, stems and bark (Yamagiwa et al.,1994).In themontane regionswhere fruit availability is further reduced, thegorilla diet consists of tough and bulky herbs, bamboo shoots, barkand pith (Schaller, 1963; Watts, 1996). In the western regions fruit ismore abundant and when available it constitutes most of the gorilladiet (Remis, 1997; Rogers et al., 2004). When scarce, herbaceousvegetation, bark, shoots and young leaves are eaten. The diversity inthe gorilla diet and flexibility in the consumption of fibrous foodswhen fruit is scarce probably allowed them to adapt to fragmented,impoverished and high altitude habitats in East Africa. There isa correlation between dietary diversity, including frugivory andpopulation density, including mobility patterns and day ranges ingorillas (Rogers et al., 2004).With a higher proportion of herbaceousfoods in East Africa, population densities are lower, and gorilla groupsare less mobile (Caldecott and Miles, 2005). There is also less geneticdiversity, with evidence for population bottlenecks in the area(Jensen-Seaman and Kidd, 2001).
Dental pheneticdistances separatingpopulations of gorillas in EastAfrica are high in this study, and particularly striking in relation to thesmall geographic area the gorillas are confined to. The Utu/Walikale/Kasese specimens and theMwenga-Fizi/Wabembe/Baraka specimenscome from lowland habitats (although at higher altitude than thewestern lowland localities), yet they are quite distinct from oneanother. Populations from Tshiaberimu and the Virunga mountainsare alsodistinctive. TheKayonza/Bwindi specimens clusteredwith theVirunga gorillas, whereas the Kahuzi-Biega specimenswere closest tothe Tshiaberimu gorillas. There is some amount of overlap betweenpopulations, but this study supports the presence of a lowland gorillagroup, increasingly referred to as G. b. graueri, a mountain gorillagroup, G. b. beringei, and a Tshiaberimu/Kahuzi-Biega group, which isproposedasG.b. rex-pygmaeorum (SarmientoandButynski,1996).Thelatter group in particular, cannot be overemphasized as it is based onsmaller samples. Higher dental distances imply a history of isolationand interrupted gene flow in East Africa and are consistent with thebiogeographic history of fragmentation and the tectonic activityassociated with volcanism in the region.
Influence of genetic drift, gene flow and the abundant centerdistribution model
Overall, an isolation-by-distance model cannot be invoked toexplain patterns of population structure within the main centers ofgorilla distribution in this study. A model of genetic drift primarilyacting on peripheral, altitudinally variable isolates in Nigeria andEast Africa, with drift-gene flow equilibrium working in the WestAfrican region may be a better explanation. This fits with Darwin’s(1859) “abundant center distribution” pattern, wherein the densityof individuals in a population and density of populations in an areadecreases from the center of a species’ range towards theperiphery (Hengeveld and Haeck, 1982; Brown, 1984). The modelsuggests that environmental conditions are optimal at the species’center, and predicts that in the absence of extrinsic barriers therewill be continuous gene flow between the center and periphery,which will limit adaptation or speciation even if there is intensedirectional selection at the periphery (García -Ramos andKirkpatrick, 1997; Kirkpatrick and Barton, 1997). If ecological ortopographic barriers isolate peripheral populations, however,selection and drift will work to differentiate the peripheral pop-ulations rapidly (see Herrera and Bazaga, 2008, for a recentapplication of this model).
Correlations between geographical and dental distances arefairly high for the western group of gorillas (not including the Cross
V. Pilbrow / Journal of Human Evolution 59 (2010) 16e34 31
River gorillas), indicating that isolation-by-distance and gene flowmay play a significant role in maintaining dental morphologicalsimilarity in this region. Genetic diversity and population densitiesare also high (Wolfheim, 1983; Doran and McNeilage, 1998; Cliffordet al., 2003, 2004; Vigilant and Bradley, 2004b; Thalmann et al.,2007), suggesting that the West African region may have been atthe historical center of gorilla distribution. Fruit trees are moreabundant, providing gorillas with a greater opportunity to acquiretheir preferred food, although their diet also includes a diverserange offibrous plant fallback foods (Remis,1997;Doran et al., 2002;Cippolletta, 2004; Rogers et al., 2004), additionally suggesting thatthe western region could have provided the optimal foragingconditions for gorilla survival and niche differentiation fromchimpanzees (Stanford, 2006). Cranial, dental and genetic sub-structuring is evident in the region (Groves, 1967; Clifford et al.,2003, 2004), but as outlined above, it is probably a signature ofpast climate related fragmentation events and provides someevidence for drift. Without extrinsic barriers separating previouslydivided populations, gene flow would have resumed, resulting inthe present day drift-gene flow equilibrium.
In both Nigeria and East Africa, high dental distances relative togeographic distances, low genetic diversity (at least for the Easterngorillas – Gagneux et al., 1999; Jensen-Seaman and Kidd, 2001,Jensen-Seaman et al., 2003), and low population densities (Oateset al., 2003; Sarmiento, 2003) support the premise that the Niger-ian and East African gorillas fall at the periphery of gorilla distri-bution. A greater reliance on lower quality herbaceous foods witha reduced fruit component, despite a preference for fruit (Oateset al., 2003; Ganas et al., 2004; Nkurunungi et al., 2004) onceagain points to their marginal status. A historically diverse dietaryregime, along with folivorous fallback options would have allowedgorillas to adapt to impoverished ecological conditions at higheraltitudes. The abundant center distribution model predicts thatbarriers imposed by Pleistocene refugia and especially the altitu-dinal pattern of segregation resulting from mountain building inEast Africa and Nigeria promoted isolation and genetic drift in theseperipheral areas even though gorillas are large, terrestrial, vagileanimals and are likely to have resumed genetic contact when theecological barriers were less stringent. Thalmann et al. (2007) statethat there was male-mediated gene flow predominantly from theeastern to the western region until about 80e200 ka.
This model of gorilla population structure has importantimplications for conservation. It implies that conservation effortsshould be directed towards peripheral populations, where lowpopulation density, pauperized genetic diversity, and ecologicalisolation put gorillas at greater risk of extinction. It also suggeststhat corridors of genetic contact should be kept open to allowcontinued genetic exchange between isolated populations. Finally,it demonstrates the immense evolutionary resilience and adapt-ability of peripheral gorilla isolates, which is an encouragingprospect for conservation efforts.
Similar environmental and ecological influences can be envis-aged for chimpanzees and early hominins in Plio-Pleistocene Africa.Chimpanzee population structure does not conform to a climaterefugia pattern. Goldberg (1998) found little evidence for Plio-Pleistocene refugia in the genetic structure of chimpanzees in EastAfrica. Pilbrow (2006) supported an isolation-by-distance model,with strong correlation between dental morphometric distancesand geographical distances, and rivers presenting barriers fordispersal. Gagneux et al. (2001) and Goldberg (1998) suggest, basedon elevated levels of genetic diversity and panmixia, that chim-panzees are extremely vagile and capable ofmaintaining high levelsof genetic contact across varied habitats. The highest levels ofgenetic diversity are detected in central African chimpanzees(Kaessmann et al., 1999; Yu et al., 2003; Fischer et al., 2004, 2006),
raising the likelihood that chimpanzees spread out from that centralcore (Groves et al., 1992; Kaessmann et al., 1999; Yu et al., 2003).
Early hominin diversification, on the other hand, appears tohave taken place from the eastern and southern part of Africa, asimplied by abundant fossil material from the region. The lack ofhominin fossil material should not be taken as evidence for theabsence of hominins from elsewhere in Africa, but in a studyextending over 40 years at Amboseli National Park, Kenya, Beh-rensmeyer found close fidelity between recent bone assemblagesand density of parent vertebrate populations (Western andBehrensmeyer, 2009). This lends credence to the idea that homi-nin fossil density reflects original population density in the region.Genetic diversity of present day humans is also greatest in thisregion, as reported by studies on dental traits (Irish, 1998; Irish andGuatelli-Steinberg, 2003) and Y chromosome DNA (Chiaroni et al.,2009). By entertaining the possibility that chimpanzees, gorillasand humans had divergent centers of diversification in Plio-Pleis-tocene Africa we can understand the adaptive and niche differen-tiation strategies of these sympatric hominids. Genetic diversity inpresent-day humans is considerably reduced compared to chim-panzees and gorillas (Vigilant and Bradley, 2004b; Fischer et al.,2006). It is possible that cyclical climatic rhythms and local fault-ing caused genetic diversification and population dispersal of earlyhominins in East and South Africa.
Conclusions
This study reveals a primary split between the East and WestAfrican gorillas based on molar morphometrics, which may be usedto support the distinction between G. gorilla and G. beringei. Twoadditional subgroups are recognized in West Africa, one in the CrossRiver area and the other encompassing southern Cameroon, Gabon,Equatorial Guinea, Republic of Congo and Central African Republic.These correspond with the subspecies, G. g. diehli and G. g. gorilla. InEast Africa, a lowland gorilla subgroup, G. b. graueri, is recognizedaround the Itombwe and Mwenga-Fizi regions. This is distinct fromthehighland gorilla subgroup fromVirunga andBwindi,G. b. beringei.The Tshiaberimu gorillas are distinct from the other eastern gorillasubspecies, and together with the Kahuzi-Biega gorillas, providepreliminary support for G. b. rex-pygmaeorum.
These patterns of molar differentiation match those recentlyrevealed by othermorphological andmolecular data, suggesting thatgeographic patterning of dental variation reflects underlying geneticrelationships among populations. There is little correlation betweengeographic and dental distances in the two main centers of gorilladistribution, but patterns of altitudinal variation provide a betterexplanation for gorilla patterns of segregation. This suggests thatPleistocene climatic fluctuations and mountain building activities inNigeria and East Africa affected gorilla phylogeography. Thus, gorillapopulation structure most closely resembles an abundant centerdistribution pattern, with western gorillas at the historical center ofgorilla distribution and altitudinally variable populations fromNigeria and East Africa at the periphery. The harsh climatic events inEast Africa and Nigeria hastened the genetic differentiation ofperipheral populations, primarily through the influence of drift.
Acknowledgments
I would like to thank the American Museum of Natural History,NY; Anthropologisches Institüt und Museum der Universität Zürich-Irchel, Zürich; British Museum of Natural History, London; FieldMuseum of Natural History, Chicago; Museum of ComparativeZoology, Harvard; Muséum National d’Histoire Naturelle, Paris;Powell-Cotton Museum, Kent; Peabody Museum of Anthropology,Harvard; United States National Museum, Washington, D.C.; Musée
V. Pilbrow / Journal of Human Evolution 59 (2010) 16e3432
Royal de l’Afrique Centrale, Tervuren; Zoologisches Museum, Berlin;Anthropologische und Zoologische Staassammlung, Münich forproviding access to gorilla dental specimens. The project was fundedby grants from the LSB Leakey Foundation, National Science Foun-dation (SBR-9815546), the Wenner-Gren Foundation and researchsupport of the department of Anatomy and Cell Biology at theUniversity of Melbourne. The comments of reviewers and editorsgreatly strengthened the paper.
Appendix. Supplementary data
Supplementary data associated with this article can be found inthe online version, at doi:10.1016/j.jhevol.2010.01.009.
References
Altheide, T.K., Hammer, M.F., 1999. Y chromosome variation in the Hominoidea. Am.J. Phys. Anthropol. Suppl. 28, 83.
Altheide, T.K., Hammer, M.F., 2000. Comparing patterns of Y chromosome andmitochondrial DNA variation in the Hominoidea. Am. J. Phys. Anthropol. Suppl.30, 95.
Anthony, N.M., Clifford, S.L., Bawe-Johnson, M., Abernethy, K.A., Bruford, M.W.,Wickings, E.J., 2007. Distinguishing gorilla mitochondrial sequences fromnuclear integrations and PCR recombinants: guidelines for their diagnosis incomplex sequence databases. Mol. Phylogenet. Evol. 43, 553e566.
Avise, J.C., Walker, D., Johns, G.C., 1998. Speciation durations and Pleistocene effectson vertebrate phylogeography. Proc. Roy. Soc. B 265, 1707e1712.
Bailey, S.E., Pilbrow, V.C., Wood, B.A., 2004. Interobserver error involved in inde-pendent attempts to measure cusp base areas of PanM1s. J. Anat. 205, 323e331.
Bergl, R.A., Vigilant, L., 2007. Genetic analysis reveals population structure andrecent migration within the highly fragmented range of the Cross River gorilla(Gorilla gorilla diehli). Mol. Ecol. 16, 501e516.
Bermejo, M., Rodriguez-Teijero, J.D., Illera, G., Barosso, A., Vila, C., Walsh, P.D., 2006.Ebola outbreak killed 5000 gorillas. Science 314, 1564.
Bonnefille, R., Roeland, J.C., Guiot, J., 1990. Temperature and rainfall estimates forthe past 40,000 years in equatorial Africa. Nature 346, 347e349.
Braga, J.C., 1995. Définition de certains caractères discrets crâniens chez Pongo,Gorilla, et Pan. Perspectives taxonomiques et phylogénétiques. Ph.D. Disserta-tion, University of Bordeaux.
Brown, J.H., 1984. On the relationship between abundance and distribution ofspecies. Am. Nat. 124, 255e279.
Burrows, W., Ryder, O.A., 1997. Y chromosome variation in great apes. Nature 385,125e126.
Butynski, T., Kalina, J., 1993. Three new mountain National Parks for Uganda. Oryx27, 214e224.
Caldecott, J., Miles, L., 2005. World Atlas of Great Apes and their Conservation.University of California Press, Berkeley.
Casimir, M.J., 1975. Some data on the systematic position of the eastern gorillapopulation of the Mt. Kahuzi region (Republique du Zaire). Z. Morphol.Anthropol. 66, 188e201.
Chiaroni, J., Underhill, P.A., Cavalli-Sforza, L.L., 2009. Y chromosome diversity,human expansion, drift, and cultural evolution. Proc. Natl. Acad. Sci. 106,20174e20179.
Cippolletta, C., 2004. Effects of group dynamics and diet on the ranging patterns ofa western gorilla group (Gorilla gorilla gorilla) at Bai Hokou, Central AfricanRepublic. Am. J. Primatol. 64, 193e205.
Coetzee, J.A., 1964. Evidence for a considerable depression of the vegetation beltsduring the Upper Pleistocene on the East African mountains. Nature 204,564e566.
Colyn, M., 1991. L'importance zoogeographique du basin du fleuve Zaire pour laspeciation. Ann. Sci. Zool. 264, 180e185.
Colyn, M., Gautier-Hion, A., Verheyen, W., 1991. A re-appraisal of paleaenvir-onmental history in central Africa: evidence for a major fluvial refuge in theZaire basin. J. Biogeogr 18, 403e407.
Coolidge, H.J., 1929. A revision of the genus Gorilla. Mem. Mus. Comparat. Zool.Harvard 50, 293e381.
Clifford, S.L., Abernethy, K.A., White, L.J.T., Tutin, C.E.G., Bruford, M.W., Wickings, J.E.,2003. Genetic studies of western gorillas. In: Taylor, A.B., Goldsmith, M.L. (Eds.),Gorilla Biology: A Multidisciplinary Perspective. Cambridge University Press,Cambridge, pp. 269e292.
Clifford, S.L., Anthony, N.M., Bawe-Johnson, M., Abernethy, K.A., Tutin, C.E.J.,White, L.J.T., Bermejo, M., Goldsmith, M.L., McFarland, K., Jeffery, K.J., Bruford, M.W., Wickings, J.E., 2004. Mitochondrial DNA phylogeography of westernlowland gorillas (Gorilla gorilla gorilla). Mol. Ecol. 13, 1551e1565.
Darroch, J.N., Mosimann, J.E., 1985. Canonical and principal components of shape.Biometrika 72, 241e252.
Darwin, C., 1859. On the Origin of Species by Means of Natural Selection. JohnMurray, London.
deMenocal, P.B., 1995. Plio-Pleistocene African climate. Science 270, 53e59.
deMenocal, P.B., Rind, D., 1993. Sensitivity of Asian and African climate to variationsin seasonal insolation, glacial ice cover, sea-surface temperature, and Asianorography. J. Geophys. Res. 98, 7265e7287.
Doran, D.M., McNeilage, A., 1998. Gorilla ecology and behavior. Evol. Anthropol. 6,120e131.
Doran, D.M., McNeilage, A., Greer, D., Bocian, C., Mehlman, P., Shah, N., 2002.Western lowland gorilla diet and resource availability: new evidence, cross-sitecomparisons and reflections on indirect sampling methods. Am. J. Primatol. 58,91e116.
Eggert, S.L., Rasner, C.A., Woodruff, D.S., 2002. The evolution and phylogeography ofthe African elephant inferred from mitochondrial DNA sequence and nuclearmicrosatellite markers. Proc. Roy. Soc. Lond. B 269, 1993e2006.
Falsetti, A.B., Jungers, W.L., Cole III, T.M., 1993. Morphometrics of the callitrichidforelimb: a case study in size and shape. Int. J. Primatol. 14, 551e572.
Fischer, A., Wiebe, V., Pääbo, S., Przeworski, M., 2004. Evidence for a complexdemographic history of chimpanzees. Mol. Biol. Evol. 21, 799e808.
Fischer, A., Pollack, J., Thalmann, O., Nickel, B., Pääbo, S., 2006. Demographic historyand genetic differentiation among apes. Curr. Biol. 16, 1133e1138.
Gagneux, P., Wills, C., Gerloff, U., Tautz, D., Morin, P.A., Boesch, C., Fruth, B.,Hohmann, G., Ryder, O., Woodruff, D.S., 1999. Mitochondrial sequences showdiverse evolutionary histories of African hominoids. Proc. Natl. Acad. Sci. 96,5077e5082.
Gagneux, P., Gonder, M.K., Goldberg, T.L., Morin, P.A., 2001. Gene flow in wildchimpanzee populations: what genetic data tells us about chimpanzee move-ment over space and time. Phil. Trans. R. Soc. Lond. B 356, 889e897.
Ganas, J., Robbins, M.M., Nkurunungi, J.B., Kaplin, B.A., McNeilage, A., 2004. Dietaryvariability of mountain gorillas in Bwindi Impenetrable National Park, Uganda.Int. J. Primatol. 25, 1043e1072.
García-Ramos, G., Kirkpatrick, M., 1997. Genetic models of adaptation and gene flowin peripheral populations. Evolution 51, 21e28.
Garner, K.J., Ryder, O.A., 1996. Mitochondrial DNA diversity in gorillas. Mol. Phylo-genet. Evol. 6, 39e48.
Goldberg, T.L., 1998. Biogeographic predictors of genetic diversity in populations ofeastern African chimpanzees (Pan troglodytes schweinfurthii). Int. J. Primatol. 19,237e254.
Gonder, M.K., Oates, J.E., Disotell, T.R., Forstner, M.R.J., Morales, J.C., Melnick, D.J.,1997. A new West African chimpanzee subspecies? Nature 388, 337.
Groves, C.P., 1967. Ecology and taxonomy of the Gorilla. Nature 213, 890e893.Groves, C.P., 1970a. Gigantopithecus and the mountain gorilla. Nature 226,
973e974.Groves, C.P., 1970b. Population systematics of the Gorilla. J. Zool. 161, 287e300.Groves, C.P., 2001. PrimateTaxonomy. SmithsonianUniversity Press,Washington,D.C.Groves, C.P., 2003. A history of gorilla taxonomy. In: Taylor, A.B., Goldsmith, M.L.
(Eds.), Gorilla Biology: a Multidisciplinary Perspective. Cambridge UniversityPress, Cambridge, pp. 15e34.
Groves, C.P., 2005. A note on the affinities of the Ebo forest gorillas. Gorilla J. 31,19e21.
Groves, C.P., Stott, K.W., 1979. Systematic relationships of gorillas from Kahuzi,Tshiaberimu and Kayonza. Folia Primatol. 32, 161e179.
Groves, C.P., Westwood, C., Shea, B.T., 1992. Unfinished business: Mahalonobis anda clockwork orang. J. Hum. Evol. 22, 327e340.
Grubb, P., 1982. Refuges and dispersals in the speciation of African forest mammals.In: Prance, G.T. (Ed.), Biological Diversification in the Tropics. ColumbiaUniversity Press, New York, pp. 537e553.
Grubb, P., 1990. Primate geography in the Afro-tropical forest biome. In: Peters, G.,Hutterer, R. (Eds.), Vertebrates in the Tropics. Museum Alexander Koenig, Bonn,pp. 187e214.
Guillén, A.K.Z., Barrett, G.M., Takenaka, O., 2005. Genetic diversity among Africangreat apes based on mitochondrial DNA sequences. Biodivers. Conserv. 14,2221e2233.
Guiraud, R., Bosworth, W., Thierry, J., Delplanque, A., 2005. Phanerozoic geologicalevolution of Northern and Central Africa: An overview. J. Afr. Ear. Sci. 43,83e143.
Haffer, J., 1982. General aspects of the refuge theory. In: Prance, G.T. (Ed.), BiologicalDiversification in the tropics. Columbia University Press, New York, pp. 6e24.
Hall, J.S., Saltonstall, K., Inogwabini, B.-I., Omari, I., 1998. Distribution, abundanceand conservation status of Grauer's gorilla. Oryx 32, 122e130.
Hamilton, A.C., 1992. History of forests and climate. In: Sayer, J., Harcourt, C.S.,Collins, N.M. (Eds.), Conservation Atlas of Tropical Forests, Africa. Macmillan,New York, pp. 17e25.
Hengeveld, R., Haeck, J., 1982. The distribution of abundance. I. Measurements. J.Biogeogr. 9, 303e316.
Herrera, C.M., Bazaga, P., 2008. Adding a third dimension to the edge of a species'range: altitude and genetic structuring in mountainous landscapes. Heredity100, 275e285.
Hewitt, G.M., 1996. Some genetic consequences of ices ages, and their role indivergence and speciation. Biol. J. Linn. Soc. 58, 27e276.
Hofreiter, M., Siedel, H., Van Neer, W., Vigilant, L., 2003. Mitochondrial DNAsequence from an enigmatic gorilla population (Gorilla gorilla uellensis). Am. J.Phys. Anthropol. 121, 361e368.
Huijbregts, B., de Wachter, P., Obiang, L.S.N., Akou, M.E., 2003. Ebola and the declineof gorilla, Gorilla gorilla gorilla and chimpanzee, Pan troglodytes troglodytes inMinkebe Forest, north-eastern Gabon. Oryx 37, 437e443.
Hylander, W., 1975a. Incisor size and diet in Cercopithecoidea. Am. J. Phys.Anthropol. Suppl. 42, 309.
V. Pilbrow / Journal of Human Evolution 59 (2010) 16e34 33
Hylander, W., 1975b. Incisor size and diet in anthropoids with special reference toCercopithecoidea. Science 189, 1095e1098.
Inouye, S.E., 1992. Ontogeny and allometry of African ape manual rays. J. Hum. Evol.23, 107e138.
Inouye, S.E., 2003. Intraspecific andontogenetic variation in the forelimbmorphologyof Gorilla. In: Taylor, A.B., Goldsmith, M.L. (Eds.), Gorilla Biology: A Multidisci-plinary Perspective. Cambridge University Press, Cambridge, pp. 194e235.
Irish, J.D., 1998. Ancestral dental traits in recent sub-Saharan Africans and theorigins of modern humans. J. Hum. Evol. 34, 81e98.
Irish, J.D., Guatelli-Steinberg, D., 2003. Ancient teeth and modern human origins: anexpanded comparison of African Plio-Pleistocene and recent world dentalsamples. J. Hum. Evol. 45, 113e144.
James, F.C., McCullough, C.E., 1990. Multivariate statistical methods in ecology andsystematics: Panacea or Pandora's box. Ann. Rev. Ecol. Syst. 211, 129e166.
Jenkins, P., 1990. Catalogue of Primates in the British Museum (Natural History).Part V. Natural History Museum Publications, London.
Jensen-Seaman, M.I., Kidd, K.K., 2001. Mitochondrial DNA variability and biogeog-raphy of eastern gorillas. Mol. Ecol. 10, 2241e2247.
Jensen-Seamen, M.I., Deinard, A.S., Kidd, K.K., 2003. Mitochondrial and nuclear DNAestimates of divergence between western and eastern gorillas. In: Taylor, A.B.,Goldsmith, M.L. (Eds.), Gorilla Biology: A Multidisciplinary Perspective. Cam-bridge University Press, Cambridge, pp. 247e268.
Jensen-Seamen, M.I., Sarmiento, E.E., Deinard, A.S., Kidd, K.K., 2004. Nuclear inte-grations of mitochondrial DNA in gorillas. Am. J. Primatol. 63, 139e147.
Kaessmann, H., Wiebe, V., Pääbo, S., 1999. Extensive nuclear DNA sequence diversityamong chimpanzees. Science 286, 1159e1162.
Kay, R.F., 1975. The functional adaptations of primate molar teeth. Am. J. Phys.Anthropol. 43, 195e216.
Kay, R.F., 1977. The diet of early Miocene African hominoids. Nature 268, 628e630.Kay, R.F., Hylander, W.L., 1978. The dental structure of mammalian folivores with
special reference to Primate and Phalangeroidea (Marsupialia). In:Montgomery, G.C. (Ed.), The Ecology of Arboreal Folivores. Smithsonian Insti-tution Press, Washington, D.C, pp. 173e196.
Kingdon, J., 1989. Island Africa. Princeton University Press, Princeton.Kirkpatrick, M., Barton, N.H., 1997. Evolution of a species' range. Am. Nat. 150, 1e23.Kuroda, S., Nishihara, T., Suzuki, S., Oko, R.A., 1996. Sympatric chimpanzees and
gorillas in the Ndoki Forest, Congo. In: McGrew, W.C., Marchant, L., Nishida, T.(Eds.), Great Ape Societies. Cambridge University Press, Cambridge, pp. 71e81.
Leigh, S.R., Relethford, J.H., Park, P.B., Konigsberg, L.W., 2003. Morphologicaldifferentiation of Gorilla subspecies. In: Taylor, A.B., Goldsmith, M.L. (Eds.),Gorilla Biology: A Multidisciplinary Perspective. Cambridge University Press,Cambridge, pp. 104e131.
Leroy, E.M., Rouquet, P., Formenty, P., Souquiere, S., Kilbourne, A., Froment, J.,Bermejo, M., Smit, S., Karesh, W., Swanepoel, R., Zaki, S., Rollin, P., 2004.Multiple ebola virus transmission events and rapid decline of central Africanwildlife. Science 303, 387e390.
Livingstone, D.A., 1975. Late Quaternary climatic change in Africa. Ann. Rev. Ecol.Syst. 6, 249e280.
Livingstone, D.A., 1982. Quaternary geography of Africa and the refuge theory. In:Prance, G.T. (Ed.), Biological Diversification in the Tropics. Columbia UniversityPress, New York, pp. 523e536.
Livingstone, D.A., 1993. Evolution of African climate. In: Goldblatt, P. (Ed.), BiologicalRelationships between Africa and South America. Yale University Press, NewHaven, pp. 455e472.
Maley, J., 1991. The African rainforest vegetation and paleoenvironments during thelate Quaternary. Clim. Change 19, 79e98.
Maley, J., 1996. The African rainforest e main characteristics of changes in vege-tation and climate from the Upper Cretaceous to the Quaternary. Proc. Roy. Soc.Edinb. 104B, 31e73.
Manly, B.F.J., 1994. Multivariate Statistical Methods: A Primer. Chapman and Hall,London.
Matschie, P., 1904. Bemerkungen über die Schimpansen. Sber. Ges. Naturf. FreundeBerl. 4, 55e69.
McNeilage, A.A.F., Robbins, M.M.B., Gray, M.C., Olupot, W.A.F., Babaasa, D.A.,Bitariho, R.A., Kasangaki, A.A., Rainer, H.C., Asuma, S.C., Mugiri, G.D., Baker, J.E.,2006. Census of the mountain gorilla Gorilla beringei beringei population inBwindi Impenetrable National Park, Uganda. Oryx 40, 419e427.
Morell, V., 1994. Will primate genetics split one gorilla into two? Science 265, 1661.Mosimann, J.E., James, F.C., 1979. New statistical methods for allometry with
application to Florida red-winged blackbirds. Evolution 33, 444e459.Nichol, J.E., 1999. Geomorphological evidence and Pleistocene refugia in Africa.
Geogr. J. 165, 79e89.Nkurunungi, J.B., Ganas, J., Robbins, M.M., Stanford, C.B., 2004. A comparison of two
mountain gorilla habitats in Bwindi Impenetrable National Park, Uganda. Afr. J.Ecol. 42, 289e297.
Oates, J.F., McFarland, K.L., Groves, J.L., Bergl, R.A., Linder, J.M., Disotell, T.D., 2003. TheCross River gorillas: Natural history and status of a neglected and critically endan-gered subspecies. In: Taylor, A.B., Goldsmith, M.L. (Eds.), Gorilla Biology: a Multi-disciplinary Perspective. Cambridge University Press, Cambridge, pp. 472e497.
Oates, J.F., Bergl, R.A., Linder, J.M., 2004. Africa's Gulf of Guinea Forests: BiodiversityPatterns and Conservation Priorities. Advances in Applied Biodiversity Science.Conservation International, Washington, D.C.
Oates, J.F., Groves, C.P., Jenkins, P.D., 2009. The type locality of Pan troglodytes vel-lerosus (Gray, 1862), and implications for the nomenclature of West Africanchimpanzees. Primates 50, 78e80.
Omari, I., Hart, J.A., Butynski, T.M., Birhashirwa, N.R., Upoki, A., M'Keyo, Y.,Bengana, F., Bashonga, M., Bagurubumwe, N., 1999. The Itombwe Massif,Democratic Republic of Congo: Biological surveys and conservation, with anemphasis on Grauer's gorilla and birds endemic to the Albertine Rift. Oryx 33,301e322.
Partridge, T.C., Bond, G.C., Hartnady, C.J.H., deMonacal, P.B., Ruddiman, W.F., 1995.Climatic effects of late Neogene tectonism and volcanism. In: Vrba, E.S.,Denton, G.H., Partridge, T.C., Burkle, L.H. (Eds.), Paleoclimate and Evolution,with Emphasis on Human Origins. Yale University Press, New Haven, pp. 8e23.
Pilbrow, V.C., 2003. Dental Variation in African Apes with Implications for Under-standing Patterns of Variation in Species of Fossil Apes. Ph.D. Dissertation, NewYork University.
Pilbrow, V.C., 2006. Population systematics of chimpanzees using molar morpho-metrics. J. Hum. Evol. 51, 646e662.
Pilbrow, V.C., 2007. Patterns of dental variation in extant apes with particularreference to the subspecies category in hominin taxonomy. In: Bailey, S.E.,Hublin, J.-J. (Eds.), Dental Perspectives on Human Evolution: State of the ArtResearch in Dental Paleoanthropology. Springer, New York, pp. 9e32.
Remis, M.J., 1997. Western lowland gorillas (Gorilla gorilla gorilla) as seasonalfrugivores: use of variable resources. Int. J. Primatol. 43, 87e109.
Rogers, M.E., Abernethy, K., Bermejo, M., Cipolletta, C., Doran, D., Mcfarland, K.,Nishihara, T., Remis, M., Tutin, C.E.G., 2004. Western gorilla diet: a synthesisfrom six sites. Am. J. Primatol. 64, 173e192.
Ruvolo, M., Pan, D., Zehr, S., Goldberg, T., Disotell, T.R., 1994. Gene trees andhominoid phylogeny. Proc. Natl. Acad. Sci. 91, 8900e8904.
Saltonstall, K., Amato, G., Powell, J., 1998. Mitochondrial DNA variability in Grauer'sgorillas of Kahuzi-Biega National Park. J. Hered. 89, 129e135.
Sarmiento, E.E., 1992. Terrestrial traits in the hands and feet of gorillas. Am. J. Phys.Anthropol. Suppl. 14, 146e147.
Sarmiento, E.E., 1994. Terrestrial traits in the hands and feet of gorillas. Am. Mus.Novit. 3091.
Sarmiento, E.E., 2003. Distribution, taxonomy, genetics, ecology, and causal links ofgorilla survival: the need to develop practical knowledge for gorilla conserva-tion. In: Taylor, A.B., Goldsmith, M.L. (Eds.), Gorilla Biology: a MultidisciplinaryPerspective. Cambridge University Press, Cambridge, pp. 432e471.
Sarmiento, E.E., Butynski, T., 1996. Present problems in gorilla taxonomy. Gorilla J.19, 5e7.
Sarmiento, E.E., Butynski, T.M., Kalina, J., 1996. Gorillas of the Bwindi-ImpenetrableForest and the Virunga Volcanoes: Taxonomic implications of morphologicaland ecological differences. Am. J. Primatol. 40, 1e21.
Sarmiento, E.E., Oates, J.F., 2000. The Cross River gorillas: A distinct subspecies,Gorilla gorilla diehli Matschie 1904. Am. Mus. Novit. 3250.
Schaller, G.B., 1963. The Mountain Gorilla: Ecology and Behavior. University ofChicago Press, Chicago.
Schwarz, E., 1927. Un Gorille nouveau de la forêt de l'Ituri. Revue de ZoologieAfricaine 14, 333e336.
Stanford, C.B., 2006. The behavioral ecology of sympatric African apes: Implicationsfor understanding fossil hominoid ecology. Primates 47, 91e101.
Stumpf, R.M., Fleagle, J.G., Jungers, W.L., Oates, J.F., Groves, C.P., 1998. Morpho-logical distinctiveness of Nigerian gorilla crania. Am. J. Phys. Anthropol. Suppl.26, 213.
Stumpf, R.M., Polk, J.D., Oates, J.F., Jungers, W.L., Heesy, C.P., Groves, C.P., Fleagle, J.G.,2003. Patterns of diversity in gorilla cranial morphology. In: Taylor, A.B.,Goldsmith, M.L. (Eds.), Gorilla Biology: A Multidisciplinary Perspective. Cam-bridge University Press, Cambridge, pp. 35e61.
Talbot, M.R., Livingstone, D.A., Palmer, P.G., Maley, J., Melack, J.M., Delibrias, G.,Gulliksen, S., 1984. Preliminary results from sediment cores for Lake Bosumtwi,Ghana. Paleoecol. Afr. 16, 173e192.
Taylor, A.B., 2002. Masticatory form and function in the African apes. Am. J. Phys.Anthropol. 117, 133e156.
Taylor, A.B., 2003. Ontogeny and function of the masticatory complex in Gorilla:Functional, evolutionary, and taxonomic implications. In: Taylor, A.B.,Goldsmith, M.L. (Eds.), Gorilla Biology: a Multidisciplinary Perspective. Cam-bridge University Press, Cambridge, pp. 132e193.
Taylor, A.B., Groves, C.P., 2003. Patterns of mandibular variation in Pan and Gorillaand implications for African ape taxonomy. J. Hum. Evol. 44, 529e561.
Thalmann, O., Fischer, A., Lankester, F., Pääbo, S., Vigilant, L., 2007. The complexevolutionary history of Gorillas: Insights from genomic data. Mol. Biol. Evol. 24,146e158.
Tutin, C.E.G., Fernandez, M., Rogers, M.E., Williamson, E.A., McGrew, W.C., 1991.Foraging profiles of sympatric lowland gorillas and chimpanzees in the LopéReserve, Gabon. Phil. Trans. R. Soc. B 334, 179e186.
Uchida, A., 1998. Variation in tooth morphology of Gorilla gorilla. J. Hum. Evol. 34,55e70.
van Zinderen Bakker, E.M., Coetzee, J.A., 1972. A re-appraisal of late Quaternaryclimatic evidence from tropical Africa. Paleoecol. Afr. 7, 151e181.
Vigilant, L., Bradley, B.J., 2004a. Genetic variation in gorillas. Am. J. Primatol. 64,161e172.
Vigilant, L., Bradley, B.J., 2004b. Gorillas. Curr. Biol. 14, R826eR827.Vogel, V.C., 1961. Zür systematischen untergleiderung der gattung Gorilla anhand
van Untersuchungen Mandible. Z. Saugertierk. 26, 1e12.Vrba, E.S., 1992. Mammals as a key to evolutionary theory. J. Mammal. 73, 1e28.Western, D., Behrensmeyer, A.K., 2009. Bone assemblages track animal community
structure over 40 years in an African savannah ecocystem. Science 324,1061e1064.

V. Pilbrow / Journal of Human Evolution 59 (2010) 16e3434
Williamson, E.A., Tutin, C.E., Rogers, M.E., Fernandez, M., 1990. Composition of thediet of the lowland gorillas at Lopé in Gabon. Am. J. Primatol. 21, 265e277.
Wolfheim, J.H., 1983. Primates of the World: Distribution, Abundance and Conser-vation. University of Washington Press, Seattle and London.
Watts, D.P., 1996. Comparative socio-ecology of gorillas. In: McGrew, W.C.,Marchant, L.F., Nishida, T. (Eds.), Great Ape Societies. Cambridge UniversityPress, Cambridge, pp. 16e28.
White, L.J.T., 2001a. The African rain forest. In: Weber, W., White, L.J.T., Vedder, A.,Naughton-Treves, L. (Eds.), African Rain Forest Ecology, Conservation. YaleUniversity Press, New Haven, London, pp. 3e29.
White, L.J.T., 2001b. Forest-savanna dynamics and the origins of Marantaceae forestin central Gabon. In: Weber, W., White, L.J.T., Vedder, A., Naughton-Treves, L.(Eds.), African Rain Forest Ecology, Conservation. Yale University Press, NewHaven, London, pp. 165e182.
Yamagiwa, J., Mwanza, N., Yumoto, T., Murahashi, T., 1994. Seasonal changesin the composition of the diet of eastern lowland gorillas. Primates 35,1e14.
Yu, N., Jensen-Seaman,M.I., Chemnick, L., Kidd, J.R., Deinard, A.S., Ryder, O., Kidd, K.K.,Li, W.H., 2003. Low nucleotide diversity in chimpanzees and bonobos. Genetics164, 1511e1518.