Embed Size (px)
Citation preview

Determination of Environmental Quality of a Drinking WaterReservoir by Remote Sensing, GIS and Regression Analysis
H. Gonca Coskun & Aysegul Tanik & Ugur Alganci &H. Kerem Cigizoglu
Received: 7 January 2008 /Accepted: 15 April 2008 / Published online: 25 May 2008# Springer Science + Business Media B.V. 2008
Abstract Istanbul, housing a population over tenmillion and with population increase rate of approx-imately twice that of Turkey, is one of the greatestmetropolitan cities of the world. As a consequence ofrapid population growth and industrial development,Omerli watershed is highly affected by wastewaterdischarges from the residential areas and industrialplants. The main objective of this study is to
investigate the temporal assessment of the land-use/cover of the Omerli Watershed and the water qualitychanges in the Reservoir. The study is mainly focusedon the acquisition and analysis of the SatelliteProbatoire de l'Observation de la Terre (SPOT)(1993), Indian Remote Sensing satellite (IRS) (1996and 2000) and Landsat Thematic Mapper (TM) (2004,2005, and 2006) satellite images that reflect the drasticland-use/cover changes utilizing the ground truthmeasurements. The rapid, uncontrolled, and illegalurbanization coupled with insufficient infrastructurehas caused the deterioration of the water quality withinthe past two decades in the Omerli watershed. The waterquality analysis of the drinking water Reservoir withinthe watershed is investigated using 2006 dated LandsatTM satellite digital data. The results are compiled andcompared with the water quality measurements ofparameters like total nitrogen (TN), the total phosphorus(TP), chlorophyll a (CL) and total dissolved solids(TDS). The observed reflectance shows a strongrelationship with the water quality parameters and thus,the satellite data proved to provide a useful index of TN,TP, CL and TDS. Moreover, the linkage between thewater quality parameters and the individual bandreflectance values are supported by multiple regressionanalysis.
Keywords Remote sensing .Multitemporal data .
Classification . Urban growth .Water quality .
Regression analysis
Water Air Soil Pollut (2008) 194:275–285DOI 10.1007/s11270-008-9716-x
DO09716; No of Pages
H. G. Coskun (*) :U. AlganciDepartment of Geodesy and Photogrammetry,Faculty of Civil Engineering,Istanbul Technical University (ITU),34469 Maslak,Istanbul, Turkeye-mail: [email protected]
U. Algancie-mail: [email protected]
A. TanikDepartment of Environmental Engineering,Faculty of Civil Engineering,Istanbul Technical University (ITU),34469 Maslak,Istanbul, Turkeye-mail: [email protected]
H. K. CigizogluDepartment of Hydraulics, Faculty of Civil Engineering,Istanbul Technical University (ITU),34469 Maslak,Istanbul, Turkeye-mail: [email protected]

1 Introduction
Most of the developing countries face rapid urbanizationproblem in major cities, especially in those that lie alongthe edge of water bodies. Such water bodies are beingadversely affected by the wastewater discharges fromthe industrial plants and the residential areas in additionto other natural inputs. As these cities are in need ofpotable water supply, there is a necessity to use atechnique to obtain more reliable data permittinginterpretations in water quality with the aim of assistingwater management activities and efforts. The remotesensing (RS) technique has a high potential forachieving such a goal due to its advantages regardingdata synchronicity, low cost, and large spatial coverage,compared to point sampling methods (Hua et al. 2004;Vignolo et al. 2006; Chen et al. 2007). Passive opticalsensors from satellites can measure the amount of solarradiation at various wavelengths reflected by surfacewater, which can be correlated to water qualityparameters (e.g. total suspended solids (TSS) andchlorophyll a (CL) concentrations) (Hellwegera et al.2004; Wang et al. 2004).
Istanbul is one of the provinces of Turkey with thehighest population. Latest Demography World Newsfrom the most comprehensive global news networkstated that Istanbul’s current population is 12,249,536as of 30 November 2007 (DWN 2007). As a result ofpopulation explosion faced within the recent years,residential areas have extremely expanded beyond theplanned urbanization program, and thus in turn,illegal housing became a common and major envi-ronmental concern. It is obvious that urbanization,either legal or illegal, consumes a vast amount ofagricultural land and other green areas leading todeterioration of the environment (Maktav and Erbek2005). Istanbul Metropolis already has eight surfacewater reservoirs among which six are used fordrinking water supply to the city. The most importantreservoir regarding the water holding capacity is theOmerli Reservoir located at the Asian side of the city,supplying 40% of the overall drinking water demandof the mega city. Irrigation, urbanization and othernatural conditions further influence the water qualitystatus in the Omerli Reservoir. Almost one-sixth ofIstanbul’s population resides within the Omerliwatershed. Its annual population increase rate of4.6% is almost twice the average of the country(Tanik et al. 2000). Such a huge population causes
some administrative, social and economical problemsin Istanbul, together with deterioration of surfacewater qualities. In order to control and monitor thewater quality, routine field studies are necessary forthe protection of such vulnerable water bodies.However, the regular inventories conducted with theclassical methods are not sufficient enough comparedto Remote Sensing and Geographical InformationSystems (GIS) techniques as they are modern toolsused to determine and update information on pollu-tion loads and land-use changes in the watersheds andwater quality (Brivio et al. 2001).
In literature, quite a lot of studies exist on therecent applications of RS and GIS technologies onenvironmental issues. Matejicek et al. (2006)presented a case study illustrating the application ofspatial analysis to the urban areas of Prague. Thisinvolved the incorporation of environmental datagathered from the monitoring networks and fieldmeasurements into digital map layers. Most recently,Alexandridis et al. (2007) emphasized on the utility ofvarious RS and GIS techniques, such as digital imageprocessing and geographic overlay, to fill the gaps ofspatial environmental, hydrological, and hydro-geological data in the planning process of therestoration of Lake Koronia, following the Ramsarguidelines. Wu et al. (2007) focused on how to usethe RS technology effectively to monitor and evaluatethe heated water pollution using thermal-infraredbands of some Thematic Mapper (TM) images atdifferent times to obtain the inverse water surfacetemperature. Yuan et al. (2007) presented detailsconcerning the development of an integrated model-ing system for managing water quality in coastalbasins. The system includes a model linking thepollution input loads to land-use, and a model forsimulating surface flow and chemical and biologicalprocesses. Focardi et al. (2006) applied an integratingRS approach with pollution monitoring tools foraquatic ecosystem risk assessment and managementof Lake Victoria (Uganda).
The main objective of this study is to describe theapplication of multi-temporal satellite data for monitoringthe land-use changes of the Omerli Reservoir watershedalong with determination of some typical characteristicsand water quality changes of the Reservoir using RStechniques. Moreover, another aim of the study is topresent the findings to the decision-makers in order toinform them on the current situation of both the land-use
276 Water Air Soil Pollut (2008) 194:275–285
distribution and the corresponding water quality, and toemphasize on the changes in environmental quality withthe reasons of occurrence based on scientific invento-ries. The water pollution problem can be examined byprocessing and classifying the satellite data. Whenconceptions of the final images taken from Landsat-5TM data are compared with the water quality referencedata, it can be observed that both residential andindustrial discharges are displayed on the satelliteimagery.
2 The Study Area
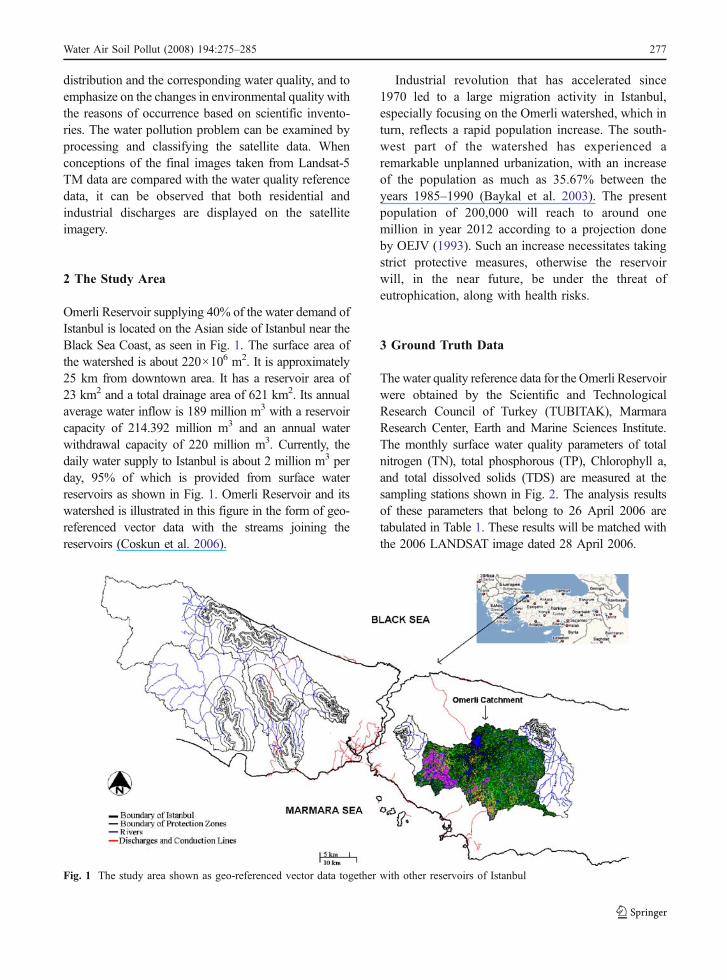
Omerli Reservoir supplying 40% of the water demand ofIstanbul is located on the Asian side of Istanbul near theBlack Sea Coast, as seen in Fig. 1. The surface area ofthe watershed is about 220×106 m2. It is approximately25 km from downtown area. It has a reservoir area of23 km2 and a total drainage area of 621 km2. Its annualaverage water inflow is 189 million m3 with a reservoircapacity of 214.392 million m3 and an annual waterwithdrawal capacity of 220 million m3. Currently, thedaily water supply to Istanbul is about 2 million m3 perday, 95% of which is provided from surface waterreservoirs as shown in Fig. 1. Omerli Reservoir and itswatershed is illustrated in this figure in the form of geo-referenced vector data with the streams joining thereservoirs (Coskun et al. 2006).
Industrial revolution that has accelerated since1970 led to a large migration activity in Istanbul,especially focusing on the Omerli watershed, which inturn, reflects a rapid population increase. The south-west part of the watershed has experienced aremarkable unplanned urbanization, with an increaseof the population as much as 35.67% between theyears 1985–1990 (Baykal et al. 2003). The presentpopulation of 200,000 will reach to around onemillion in year 2012 according to a projection doneby OEJV (1993). Such an increase necessitates takingstrict protective measures, otherwise the reservoirwill, in the near future, be under the threat ofeutrophication, along with health risks.
3 Ground Truth Data
The water quality reference data for the Omerli Reservoirwere obtained by the Scientific and TechnologicalResearch Council of Turkey (TUBITAK), MarmaraResearch Center, Earth and Marine Sciences Institute.The monthly surface water quality parameters of totalnitrogen (TN), total phosphorous (TP), Chlorophyll a,and total dissolved solids (TDS) are measured at thesampling stations shown in Fig. 2. The analysis resultsof these parameters that belong to 26 April 2006 aretabulated in Table 1. These results will be matched withthe 2006 LANDSAT image dated 28 April 2006.
Fig. 1 The study area shown as geo-referenced vector data together with other reservoirs of Istanbul
Water Air Soil Pollut (2008) 194:275–285 277

The correlation between observed reflectance andwater quality values of TN, TP, CL and TDS at thesampling stations will further be investigated by useof multiple regression analyses. Results will then beused as reference data for water quality classification.
The nitrogen load in the reservoir corresponds tohuman activities based on land-use. It may arise fromfertilizer and animal manure application on agricul-tural lands, domestic wastewater effluents fromwastewater treatment plants and/or septic tanks.Nitrogen may enter the water body either through
surface run-off or through groundwater. Phosphorusoriginates from a variety of sources, many of whichare related to human activities. Major sources includehuman and animal wastes, soil erosion, detergents,septic tank effluents and run-off from farmland orlawns. Total phosphorous is considered as a goodindicator of a reservoir's nutrient status because itslevels remain more stable than soluble reactivephosphorus. It includes soluble phosphorus and thephosphorus in plant and animal fragments suspendedin the water. Chlorophyll-a concentration is anindicator of phytoplankton abundance and biomassin water. It is an effective measure of trophic statusand a potential indicator of maximum photosyntheticrate. It is a commonly used measure of water quality.High levels often indicate poor water quality and lowlevels often suggest good conditions. Chlorophyll-aconcentrations are often higher after rainfall, particu-larly if the rain has flushed nutrients into the water(Ozcoasts website 20071). Total dissolved solids are ameasure of the amount of material dissolved in water.A certain level of these ions in water is necessary forthe aquatic life. Changes in TDS concentrations canbe harmful because of the water density. However, ifTDS concentrations are too high or too low, thegrowth of many aquatic lives can be limited, anddeath may occur. Similar to TSS, high concentrationsof TDS may also reduce water clarity, contribute to adecrease in photosynthesis, and combine with toxiccompounds and heavy metals (Zhao et al. 2005; Wanget al. 2006; Murphy 2007).
In Greater Metropolitan Istanbul, the watershedregulation declared by Istanbul Water and SewerageAdministration (ISKI) have led to the establishmentof four protection zones around reservoirs; absolute(0–300 m), short-range (300–1,000 m), medium-range (1,000–2,000 m) and long-range protectionzones (2,000 m-the watershed boundary) (ISKI2006). The settlement characteristics of the watershedaccording to protection zones are given in Table 2.Unfortunately, more recent data is unavailable. It canbe stated that based on the more strict rules applied
Fig. 2 The location of the water quality sampling stations inthe Omerli Reservoir
Table 1 Surface water quality measurement values at OmerliReservoir sampling stations dated 26.04.2006 (provided byTUBITAK)
Station number TP(μg/l)
TN(mg/l)
Chlorophyll-a(mg/m3)
TDS(mg/l)
Sta.1 0.096 1.33 64.9 266Sta.2 0.086 1.02 20.1 250Sta.3 0.089 1.35 67.0 254Sta.4 0.093 1.46 64.2 248Sta.5 0.1 1.24 29.6 234Sta.6 0.086 1.36 56.4 222
1 Chlorophyll a concentrations. (n.d.). Retrieved December 25,2007, from http://www.ozcoasts.org.au/indicators/chlorophyll_a.jsp.
278 Water Air Soil Pollut (2008) 194:275–285

after year 2000, no remarkable adverse change isexpected in the figures.
Current significant problems associated with theseprotection areas include unplanned, uncontrolled andillegal housing, industries and motorways passingthrough the protection zones. There are 26 urbansettlements, out of which 74% are located within thelong-range protection zone, 10% at the mediumrange, 9% at the short-range and 7% at the absoluteprotection zones. The settlements within the absoluteand short-range protection zones have a major impacton the deterioration of the water quality and on theecology of the watershed. This is contradictory to thecurrent Turkish Regulations which prohibit the use ofthese highly protected areas for any type of settlement(Tanik et al. 2000).
The high population increase rate in the Omerliwatershed is remarkable, and decreasing reservoirwater quality is the response to this occurrence. Ascan be seen from Table 2, there are three settlementsin the absolute protection zone. This contradicts with thecurrent regulation, and 1% of the watershed populationresides there. The number of settlements in the short andmedium-range protection zones are negligible, and 96%of the population lives in the long-range protection zone.Omerli watershed is one of the highly polluted water-sheds of Istanbul with a population distribution having anannual increase rate of 4.6%.
There are about 244 industrial plants belonging to27 different sectors in the watershed. Evaluation ofthe conventional pollutant loads originating from theindustries indicate that almost 3/4 of the biologicaloxygen demand (BOD5), TN, and TP loads are due tothe industries that cover almost 10% of the watershedarea. The nutrient loads arise also from non-pointsources of pollutants like run-off from forests andmeadows, agricultural land, urbanized areas, andfinally through atmospheric deposition (Tanik et al.2000). In terms of the actual land-use analysis basedon the ground truth measurements, 51% of thewatershed is covered by forests, 35% by meadowsand agriculture, whereas 10% consists of the residentialareas and the lake itself covers 4% (Baykal et al.2000). Agricultural land is scattered all throughout thewatershed.
The environmental evaluation of the watershedemphasizes the significance of the point sources,especially of domestic origin, as the most relevantpolluting sources. Table 3 lists the TN and TP valuesof both the point and non-point pollutants.
Table 3 indicates the pollution loads from thesettlements and the industries that address the pointsources of pollutants, and intermittent non-point loadsinclude run-off from agricultural activities, forests,meadows, urbanized areas and from atmosphericdeposition in the study area.
Table 2 Area and settlement characteristics of the Omerli Reservoir (Baykal et al. 2000)
Protection zone Area km2 Percent Settlements (N) Population (capita) Percent Density(persons/km2)
Industries (N)
Absolute 40 7 3 1438 1 36 3Short 55 9 2 2545 2 46 5Medium 63 10 4 963 1 15 10Long 440 74 17 145964 96 332 226Total 598 100 26 150910 100 252 (overall) 244
Table 3 Distribution of the point and non-point sources of pollutants in the Omerli Watershed (Tanik et al. 2000)
Point sources Total nitrogen (kg/day) % distribution Total phosphorus (kg/day) % distribution
Domestic 2.700 660Industrial 179 127Sub-total (point loads) 2.879 79 787 97Forests and meadows 263 4.4Agricultural land 420 12Urban run-off 48.5 8.1Atmospheric deposition 16 1.3Sub-total (non-point loads) 747.5 21 25.8 3
Water Air Soil Pollut (2008) 194:275–285 279

The water quality classification of Omerli Reser-voir as seen on Table 4 is based on three categories ofcriteria, and again the more recent comprehensivestudy is not available.
The overall quality class is determined from theaverage of the classes belonging to the three catego-ries. The technical standards also list the suitability ofeach class for various beneficial uses. Based onoverall quality classes, Class 1 is assumed to be awater quality that can be used for supplying drinkingwater after filtration and disinfecting. Class 2 will beusable for drinking after a typical water treatmentscheme and Class 3 may only be used for drinkingafter complex advanced treatment techniques. Anyother body with an overall quality class exceedingthat of Class 3 cannot be used for this purpose(Baykal et al. 2000).
4 Methodology Used
4.1 Image Processing
Image processing of the satellite data on the OmerliWatershed was performed by using the Erdas ImagineSoftware. Initially, the digital satellite data set wastransformed into the Universal Transverse Mercatorcoordinate system using the 1:5,000 digital topo-graphic maps in order to achieve the necessarygeometric registration. Taking 400 ground controlpoints from the maps, the images are registered andthen geometrically corrected before applying imagemerging and classification. From a test of theregistration accuracy on the test points, the resultingroot mean square error (RMSE) amounted to ±0.1pixels. A coordinate transformation was applied usinga polynomial transformation equation and resamplingis done using the nearest neighbor algorithm. Theimage enhancement and classification techniques are
applied to the images to assess the study area usingqueries via GIS.
The results were obtained by the LANDSAT TMdata of 2006 for water quality analysis, and SatelliteProbatoire de l'Observation de la Terre (SPOT) dataof 1993; Indian Remote Sensing satellite (IRS) data of1996, 2000; and Landsat TM data of 2004, 2005, and2006 for the urban sprawl analysis controlled by theground truth samples taken from the study area. Land-use change is presented in areal units for controllingthe future development of the watershed. Besides,GIS techniques are applied to illustrate the establishedmodels of the four protection zones. The results ofland-use and water quality changes for the protectedbands of the prohibited watershed zones are visual-ized in the form of graphical representation anddisplayed as the numerical values.
4.2 Land-Use/Cover Analysis
The rectified images were subjected to a classificationprocedure with 13 classes, using the supervisedMaximum Likelihood Classification algorithm. Thesethirteen classes were verified using pattern recognition,referring to the ground truth data and fieldwork. Theclassification results were then evaluated. In the accuracyassessment 100 random pixels were chosen for eachclassification up to three different years, and these pixelswere compared with the results of the field study.
Accuracy assessment results for all classes ofSPOT (1993), IRS (1996 and 2000) and LandsatTM (2004, 2005, and 2006) satellite data are 81.00%,83.00%, 80.00%, 79.78%, 79.71% and 80.33%,respectively. Figure 3 shows the result images of thevisual differences of the land cover only for 1993 and2006 in Omerli Watershed as an example. On theother hand, Fig. 4 shows the graphical presentation ofurban expansion analysis within years. The classifi-cation results were evaluated as urban areas as givenin Table 5.
From these analyses, it is clearly observed that themost remarkable change in the land-use distributionof the watershed is the increase in urbanized areaswithin years.
4.3 Water Quality Analysis
The water quality status in the Omerli Reservoir isquite complex. With the synoptic view capabilities
Table 4 Classification of the Omerli drinking water reservoiraccording to the technical standards (Baykal et al. 2000)
Hydrographicand territorialcriteria
Trophiccriteria
Salinity, specialcriteria, andhygienicallyrelevant criteria
Overallevaluation
Omerli 2 3(2.9) 2 2
280 Water Air Soil Pollut (2008) 194:275–285

Fig. 3 Classified images of the water basin area. (a) 21 June1993 dated SPOT-PAN and SPOT-XS; (b) 28 April 2006 dated Landsat 5TM image of the study area
Water Air Soil Pollut (2008) 194:275–285 281

and image processing methods, RS data combinedwith the ground truth measurements can be regardedas a useful tool for monitoring the water quality. Thisstudy investigates the water pollutants with hydrody-namic conditions in the Omerli Reservoir usingsatellite images based on Landsat 5 Thematic Mapper2006 dated data on multi-spectral bands.
The eight main creeks feeding the Reservoir canclearly be observed, each carrying some pollutingloads like total suspended sediments, residential fall-out, nutrients, phosphorus, and others depending onthe land-use activity of the surrounding area. Whenthe creek passes through a forest area for instance, thephosphorus load will show a higher concentrationthan the other water quality parameters. Theseprocesses can clearly be followed from the supervisedclassification result (Fig. 5) of Omerli reservoiraccording to minimum distance algorithm.
Legend for water quality classification can beexplained as;
& yellow: nutrient pollution loaded mainly withagricultural wastewater,
& green: phosphorous pollution loaded mainly withrun-off from forest areas,
& red: TSS pollution loaded with a mixture ofdomestic and industrial wastewater, and agricul-tural run-off,
& blue: natural lake water.
In the Sultanbeyli region, the East SultanbeyliWastewater Collection and Pumping Station wasconstructed by ISKI at the eastern side of OmerliReservoir’s left leg. This system has been underoperation since March 2000. Therefore, the positiveeffect of this system on the water quality can be seenclearly on the classified image of July 2006 (Fig. 5)on the left leg of the Omerli Reservoir.
A bridge was constructed at the lower end of theleft leg having many colons in the water carrying theconduction line from Darlik Dam to Omerli Dam.This case hinders the water circulation and hinders thewater coming from Uzundere and Topcayirlar Creekson the left leg of Omerli Reservoir. TSS load that canbe detected by the red colour at the right legs’entrance of the main reservoir is due to a soft clay soilstructure.
4.4 Multiple Regression Analysis
The regression analysis was used to examine therelationship between the water quality parametersgiven in Table 1 and the reflectance values presentedin Table 6. The necessary values are provided assingle pixel values for each band at all the samplingstations in the Reservoir. These two data setsrepresenting the reflectance and water quality mea-surements are analyzed, and the regression coeffi-cients (a, b, c, d, and e) are tested. During theregression analysis, water quality measurements at thesampling stations are taken as the independentvariables Xj; and the values of reflectance on the
Table 5 Urbanized area analysis within years
1993 1996 2000 2004 2005 2006
Urbanized area 1,608.25 2,932.82 2,916.05 4,635.28 5,431.58 6,011.84Differences1996−1993 1324.572000−1996 −16.772004−2000 1719.232005−2004 796.302006−2005 580.26
Fig. 4 Graphical presentation of urban area analysis
282 Water Air Soil Pollut (2008) 194:275–285

same points for each band are the dependent variablesYi. The resulting regression relation is as follows:
Yi ¼ ai þ biX1 þþciX2 þ diX3 þ eiX4
where Yi represents the band reflectance value, andX1, X2, X3, X4 correspond to parameters TP, TN, CLand TDS parameters, respectively. Accordingly foreach band, there are six reflectance values for all thesix stations representing the Y variable values in theregression relation. There are also six values for eachof the water quality parameter representing each Xi
variable in the regression equation. The regressioncoefficients obtained for each band are listed inTable 7. The corresponding regression correlationcoefficients vary between 0.72 and 0.98. Five bandshave correlation either equal to or higher than 0.94(Table 7). These results show that the obtained
regressions capture the relation between the waterquality parameters and the band reflectance values.
The obtained regression equations have quite highcorrelation coefficients proving that the relationbetween water quality parameters and the bandreflectance values are modeled effectively. Theserelations can be used as reliable tools to computethe missing values of one or more water qualityparameters in the corresponding stations.
5 Results and Discussions
A thorough analysis on the land-use distribution ofOmerli Reservoir presents a typical example of awatershed that is highly under the effect of rapidurban sprawl and industrialization. This fact is
Fig. 5 Minimum distance supervised classification result of 2006 dated data at water body of Omerli Reservoir
Table 6 Digital numbers for each band of LANDSAT 5 TM data belonging to year 2006 at the sampling stations
Station number Band 1 Band 2 Band 3 Band 4 Band 5 Band 6 Band 7
Sta.1 59 23 19 13 7 109 5Sta.2 61 25 20 13 9 111 4Sta.3 56 23 19 12 7 109 6Sta.4 64 25 21 13 9 107 5Sta.5 65 26 19 11 7 105 5Sta.6 59 26 19 12 8 110 4
Water Air Soil Pollut (2008) 194:275–285 283

basically due to the location of the watershed in theheart of a metropolitan area coupled with ease oftransportation, and employment opportunities. Thehigh population increase rate in the watershed isremarkable, and decreasing reservoir water quality isthe response to this occurrence (Table 1). Accordingto an evaluation of water quality regarding TechnicalStandards, it is clearly seen that even the overallclassification depicts Class 2 characteristics, theclassification of trophic criteria presents that the Class3 conditions prevail in the reservoir indicating theexistence of high nutrient loads (Table 4). The currentenvironmental problems faced in the watershed arehighly based on the establishment of illegal residentialareas especially in the absolute and short-rangeprotection zones in contradiction to the currentlegislation of ISKI (Table 2). Lack of insufficientinfrastructure is considered to be the main cause ofpollution in the reservoir. Industries in the watershedalso add to the pollution budget of the reservoir as isshown in Table 3. Still the point pollutant loadsdominate over the non-point sources of pollution.This situation is a typical reflectance of urban sprawlin mega cities of developing countries.
This study utilizes the modern technologies like GISand RS to inform the decision-makers on the land-usechanges. It is clearly observed from land-use classifi-cation analyses that the most remarkable change in theland-use distribution of the watershed is the increase inurbanized areas within years (Table 5; Fig. 4).
RS data makes it easier to understand how thecreeks joining the reservoir carry high polluting loadswith surface run-off (Fig. 5). The positive effect ofoperating a wastewater collection system on the waterquality in year 2000 shown by the RS data strength-ens this impact.
The obtained regression equations reflect a highcorrelation between water quality parameters and theband reflectance values. These relations can be usedto give better information to the decision-makers onthe prevailing conditions. As such, it is important tonote that utilization of GIS, RS techniques andregression analyses aid to display and visualize thefindings that are supported by field studies.
6 Concluding Remarks
This study forms an example of how modern tools ofGIS and RS are integrated in the determination oflarge scale watershed land-uses within years and howthe water quality measurements are coupled with RSreflectance values. It is presented that investigation ofwater pollution is possible by processing the digitalimages taken from the data in conjunction with theRS technology as it permits large regions of theenvironment to be studied, and thus it enables todetermine the pollution problems faster and precisely.When the final images from LANDSAT-5 TM dataare compared with the water quality reference data, itcan be observed that the polluted water carried by thecreeks is displayed on satellite imagery. This observedreflectance shows a strong relationship with the TP,TN, CL, and TDS data. Satellite data provides auseful index of TP, TN, CL, and TDS. As thereflectance (in the turbidity area) in the longer redand near IR wavelength increases faster than thereflectance in shorter blue and green wavelengths, itcan be seen that turbidity levels are positively relatedto reflectance. The relationship between the waterquality parameters and the individual band reflectanceare supported by the regression analysis.
The land-use analyses are carried out for each ofthe images using maximum likelihood classification,making it possible for decision-makers to understandthe main causes of such remarkable changes in thequality conditions of the reservoir.
References
Alexandridis, T. K., Takavakoglou, V., Crisman, T. L., &Zalidis, G. C. (2007). Remote sensing and GIS techniquesfor selecting a sustainable scenario for Lake Koronia,Greece. Environmental Management, 39(2), 278–290.
Table 7 Multiple regression results between pixel values andwater quality measurements
Band Regression parameters
a b C D e R
1 −17.79 −98.99 58.31 −0.50 0.15 0.982 28.41 −53.64 10.81 −0.10 −0.03 0.983 −6.25 −209.20 23.18 −0.17 0.10 0.994 0.47 −135.67 8.28 −0.06 0.07 0.855 −7.14 −258.26 21.03 −0.17 0.08 0.946 148.73 −209.05 −18.28 0.12 −0.01 0.967 −3.01 49.21 −0.45 0.02 0.01 0.72
284 Water Air Soil Pollut (2008) 194:275–285

Baykal, B. B., Tanik, A., & Gonenc, E. (2000). Water qualityin drinking water reservoirs of a Megacity, Istanbul.Environmental Management, 26(6), 607–614.
Baykal, B. B., Tanik, A., & Gonenc, E. (2003). The impact ofwatershed land-use on maintaining acceptable qualityinfluents for water treatment plants. Journal of WaterSupply: Research and Technology-AQUA, 52(8), 587–596.
Brivio, P. A., Giardino, C., & Zilioli, E. (2001). Validation ofsatellite data for quality assurance in lake monitoringapplications. Science of Total Environment, 268, 3–13.
Chen, C., Tang, S., Pan, Z., Zhan, H., Larson, M., & Jönsson,L. (2007). Remotely sensed assessment of water qualitylevels in the Pearl River Estuary, China. Marine PollutionBulletin, 54, 1267–1272.
Coskun, H. G., Bayraktar, O., & Yilmaz, L. (2006). Monitoringof protected bands of Terkos drinking water reservoir ofmetropolitan Istanbul near the Black Sea coast usingsatellite data. International Journal of Applied EarthObservation and Geoinformation, 8(1), 49–60.
Demography World News (DWN) (2007). Retrieved December23, 2007, from http://population.wn.com/country/Turkey/Istanbul.
Focardi, S., Corsi, I., Mazzuoli, S., Vignoli, L., Loiselle, S. A.,& Focardi, S. (2006). Integrating remote sensing approachwith pollution monitoring tools for aquatic ecosystem riskassessment and management: a case study of LakeVictoria (Uganda). Environmental Monitoring and Assess-ment, 122(1–3), 275–287.
Hellwegera, F. L., Schlossera, P., Lalla, U., & Weissel, J. K.(2004). Use of satellite imagery for water quality studies inNew York Harbor. Estuarine, Coastal and Shelf Science,61, 437–448.
Hua, C., Chena, Z., Claytonb, T. D., Swarzenskib, P.,Brockb, J. C., & Muller-Kargera, F. E. (2004).Assessment of estuarine water-quality indicators usingMODIS medium-resolution bands: Initial results fromTampa Bay, FL. Remote Sensing of Environment, 93,423–441.
Istanbul Water and Sewerage Administration (ISKI) (2006),Drinking water watersheds regulation, revised in25.05.2006
Maktav, D., & Erbek, F. S. (2005). Analysis of urban growthusing multi-temporal satellite data in Istanbul, Turkey.International Journal of Remote Sensing, 26(4), 797–810.
Matejicek, L., Engst, P., & Janour, Z. (2006). A GIS-basedapproach to spatio–temporal analysis of environmentalpollution in urban areas: a case study of Prague’s environ-ment extended by LIDAR data. Ecological Modeling, 199(3), 261–277.
Murphy, S. (2007). General information on solids. RetrievedDecember 25, 2007, from http://bcn.boulder.co.us/basin/data/COBWQ/info/TSS.html.
Omerli–Elmali Joint Venture (OEJV) (1993). Project on Omerli–Elmali protection project, feasibility study, progress report,Istanbul Water and Sewerage Administration, Turkey.
Tanik, A., Baykal, B. B., & Gonenc, I. E. (2000). A long-termmanagement plan for a watershed in a world metropolis-Istanbul. Environmental Management and Health, 11(3),208–215.
Vignolo, A., Pochettino, A., & Cicerone, D. (2006). Waterquality assessment using remote sensing techniques:Medrano Creek, Argentina. Journal of EnvironmentalManagement, 81(4), 429–433.
Wang, F., Han, L., & Kung, H. T. (2006). Applications ofLandsat-5 TM imagery in assessing and mapping waterquality in Reelfoot Lake, Tennessee. International Journalof Remote Sensing, 27(23–24), 5269–5283.
Wang, Y., Xia, H., Fu, J., & Sheng, G. (2004). Water qualitychange in reservoirs of Shenzhen, China: detection usingLANDSAT-TM data. Science of the Total Environment,328, 195–206.
Wu, C., Wang, Q., Yang, Z., & Wang, W. (2007). Monitoringheated water pollution of the DaYaWan nuclear powerplant using TM images. International Journal of RemoteSensing, 28(5), 885–890.
Yuan, D., Lin, B., Falconer, R. A., & Tao, J. (2007). Developmentof an integrated model for assessing the impact of diffuse andpoint source pollution on coastal waters. EnvironmentalModelling & Software, 22(6), 871–879.
Zhao, W., Sasaki, T., & Fujita, S. (2005). Environmentalmonitoring of industrial waste using remote sensing.Phyton-Annales Rei Botanicae, 45(4), 529–534.
Water Air Soil Pollut (2008) 194:275–285 285