Embed Size (px)
Citation preview
Journal of Radioanalytical and Nuclear Chemistry, Articles, VoL 142, No. 2, (1990} 393-402
DETERMINATION OF LANTHANIDES IN URANIUM SOLUTIONS BY X-RAY FLUORESCENCE SPECTROMETRY
M. SALEEM, M. AFZAL, JAVED HANIF, RIAZ QADEER, IMTIAZ HANIF
Department of Chemistry, Quaid-i-Azam University lslamabad (Pakistan)
(Received January 9, 1990)
An XRF-method for the determination of Sm, Gd, Dy, Er and Eu in uranium solution by use of simple polyethylene bottles has been established. Spectral interferences and matrix effects like absorption enhancement have been rectified Using standards of similar composition in the absence of internal standard. Analytical application of the method used has been established on the basis of statistical evaluation.
Introduction
Traces of lanthanides not only occur in uranium ore but are also part of fission
products. The determination of lanthanides in uranium matr ix is important due to
their high neutron absorption cross-section. Their determination in presence of each
other at trace level by conventional analytical methods is difficult. X-ray fluorescence
(XRF) spectroscopy is the most prospective technique for this purpose. 1 In the past
XRF has been successfully applied for the determination of lanthanides in bulk as
well as trace level, in pure or mixed state with other lanthanides. 2 -12 Other excita-
tion techniques used for the determination of lanthanides are described elsewhere. 12,13-20
The interelement effect or spectral interferences from the matrix were minimized by use of internal s tandards) 1-2 s
The wavelength dispersive X-ray fluorescence (WDXRF) spectrometric technique
has been used here for the determination of Sin, Eu, Gd, Dy and Er in uranium-
lanthanide solutions. In our studies, the sample solutions were presented to the
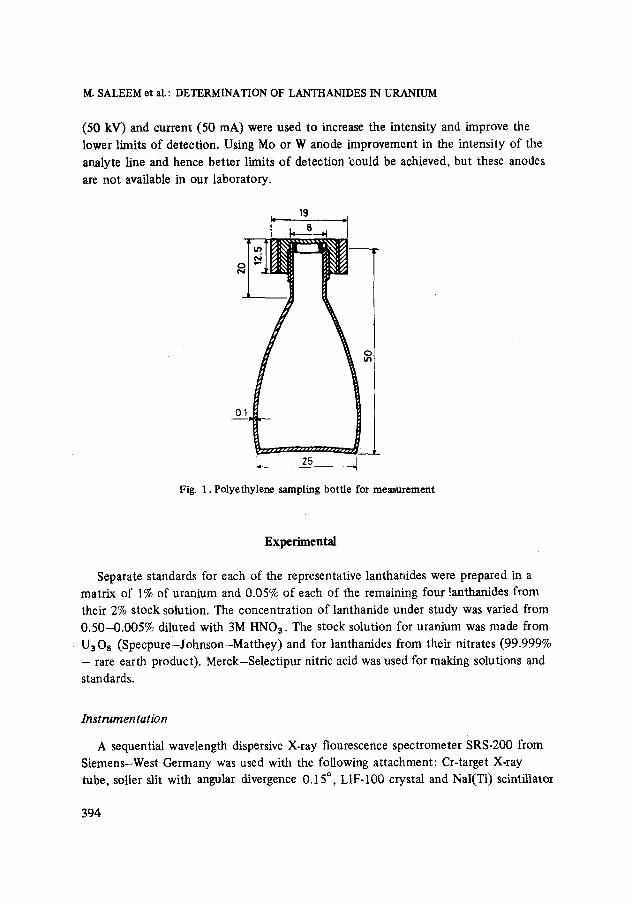
spectrometer in 0.1 mm thick walled polyethylene bott le, shown in Fig. 1. This is
unlike the techniques such as pelletization, 2 -12 bead.formation,S2 deposition on
filter paper as a thin sample, 22 -2 s solvent extraction 26 and precipitation. 27-2 s The
calibration curves with the analyte line having no interferences from matrix elements
were made to eliminate the interelement effect or spectral interferences. High voltage
Elsevier Sequoia S. A., Lausanne Akad~miai Kiad6, Budapest
M. SALEEM et al." DETERMINATION OF LANTHANIDES IN URANIUM
(50 kV) and current (50 mA) were used to increase the intensity and improve the lower limits of detection. Using Mo or W anode improvement in the intensity of the analyte line and hence better limits of detection "could be achieved, but these anodes
are not available in our laboratory.
19
0~__2 ;_
~. 25 . . . . I
Fig. 1. Polyethylene sampling bottle for measurement
Experimental
Separate standards for each of the representative lanthanides were prepared in a matrix of 1% of uranium and 0.05% of each of the remaining four lanthanides from their 2% stock solution. The concentration of lanthanide under study was varied from 0.50-0.005% diluted with 3M HNO3. The stock solution for uranium was made from U3Os (Specpure-Johnson-Matthey) and for lanthanides from their nitrates (99.999% - rare earth product). Merck-Selectipur nitric acid was used for making solutions and
standards.
Instrumentation
A sequential wavelength dispersive X-ray flourescence spectrometer SRS-200 from Siemens-West Germany was used with the following attachment: Cr-target X-ray tube, soller slit with angular divergence 0.15 ~ LIF-100 crystal and NaI(TI) scintillator
394
M. SALEEM et al.: DETERMINATION OF LANTHANIDES IN URANIUM
counter. The instrument is coupled with a computer PDP-11/04 through a universal
interface called Logic-Controller LC-200. The software OLD TV-80 in BASIC, a
modified version of RASBERRY-HEINRICH approach developed by PLESCH and THIEL was used. 29
Optimization of spectral lines and their measuring conditions
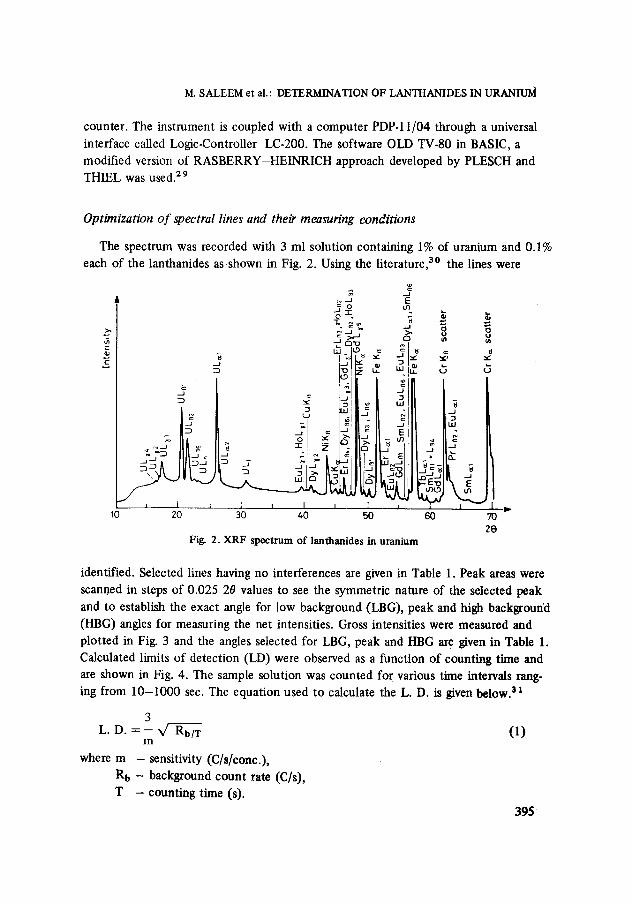
The spectrum was recorded with 3 ml solution containing 1% of uranium and 0.1% each of the lanthanides as shown in Fig. 2. Using the literature, 3~ the lines were
�9 ~ r 7 ~
INLYi._lll -~- "" ~1 "< "r "r E
I "" t = l l l ~ I ,,!11 I "~
.:,, I P II ~ ! 2 N i t s I I E i l l + fl IIl I1+ :':.1 7 P+ll 'lb I1:11
10 20 30 40 50 60 70 28
Fig. 2. XRF spectrum of lanthanides in uranium
identified. Selected lines having no interferences are given in Table 1. Peak areas were
scanoed in steps of 0.025 20 values to see the symmetric nature of the selected peak
and to establish the exact angle for low background (LBG), peak and high baekgrourid
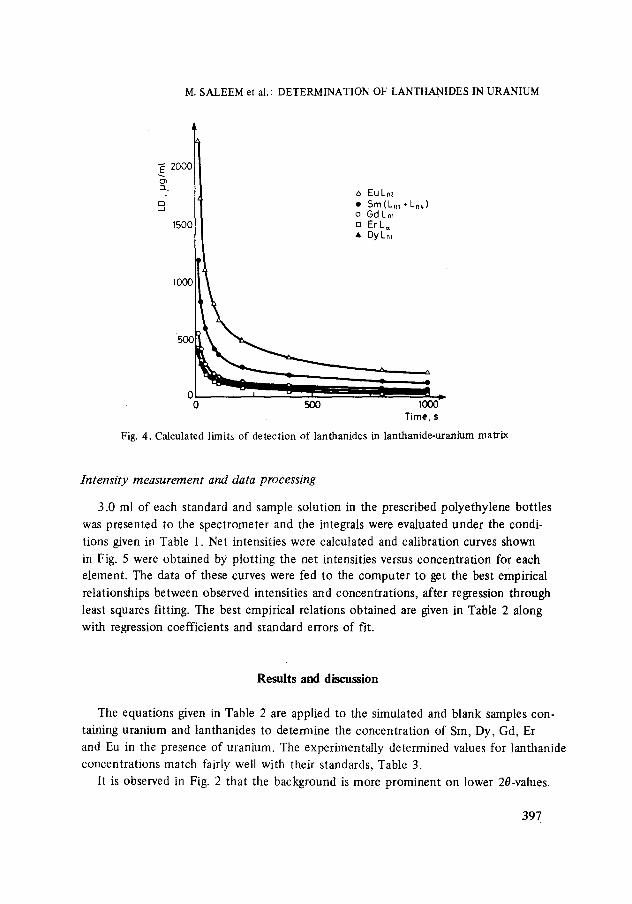
(HBG) angles for measuring the net intensities. Gross intensities were measured and plotted in Fig. 3 and the angles selected for LBG, peak and HBG are given in Table 1. Calculated limits of detection (LD) were observed as a function of counting time and are shown in Fig. 4. The sample solution was counted for various time intervals rang- ing from 10-1000 sec. The equation used to calculate the L. D. is given below, at
3 L. D. = - X/ Rb/T (1)
m
where m - sensitivity (C/s/cone.),
Rb - background count rate (C/s), T - counting time (s).
395
M. SALEEM et al.: DETERMINATION OF LANTHANIDES IN URANIUM
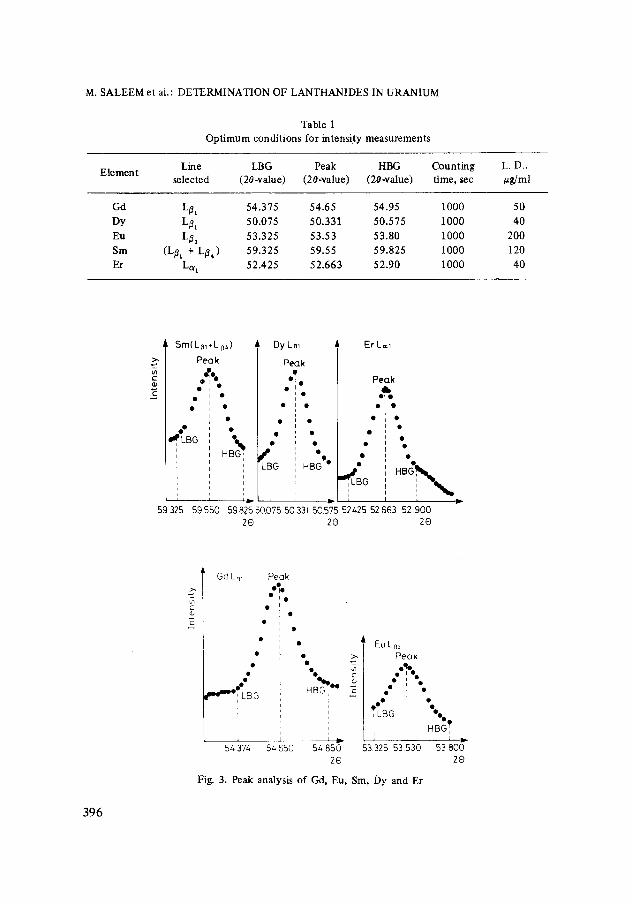
Table 1 Optimum conditions for intensity measurements
Line LBG Peak HBG Counting L.D., Element
selected (2e-value) (2e-value) (2e-value) time, sec #g/ml
Gd L#, 54.375 54.65 54.95 1000 50 Dy L/31 50.075 50.331 50.575 1000 40 Eu L/32 53.325 53.53 53.80 1000 200 Sm (L#, + L#4) 59,325 59.55 59.825 1000 120 Er Lal 52.425 52.663 52.90 1000 40
i Sm(L~l. Lr~ ~)
Peak
- ,.'T", E ' 2 i
I I I
I
59325
Dy Lm
Peok
59 550
Er L=I
Peclk
i : i " i �9
I �9 I F �9
,' ..~ t HBG,'ff~o~ i ; --LBG I I ! "~0~11,. -
, I ', : " ~ , ~ i
59825 50,0"75 5033~ 50.575 52.425 52 663 52.900 2e 2e 2e
E
Gd L,~, Peak
~ e ~ G
�9 A Eu L r~z Peak :%
Q �9
t H
54374 54 650 54 850 53 325 53530 53 800 2(3 2(9
Fig. 3. Peak analysis of Gd, Eu, Sm, Dy and Er
396
M. SALEEM et al.: DETERMINATION OF LANTHANIDES IN URANIUM
-~ 2OOO c~ :L
S
1500
EuLnz �9 Srn(L.~ * L.4) o Gd L.~ [] EFL~; �9 DyL.~
1000
500
0 0 500 1000
Time, s
Fig. 4. Calculated limits of detection of lanthanides in lanthanide-uranium matrix
Intensity measurement and data processing
3.0 ml of each standard and sample solution in the prescribed polyethylene bottles
was presented to the spectrometer and the integrals were evaluated under the condi-
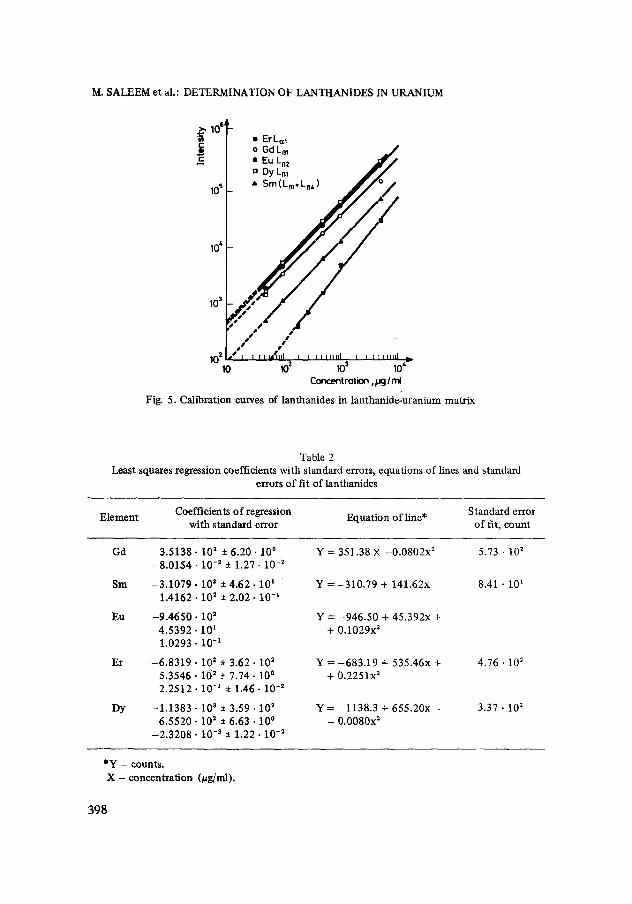
tions given in Table 1. Net intensities were calculated and calibration curves shown
in Fig. 5 were obtained by plotting the net intensities versus concentration for each element. The data of these curves were fed to the computer to get the best empirical
relationships between observed intensities and concentrations, after regression through least squares fitting. The best empirical relations obtained are given in Table 2 along
with regression coefficients and standard errors of fit.
Results and discussion
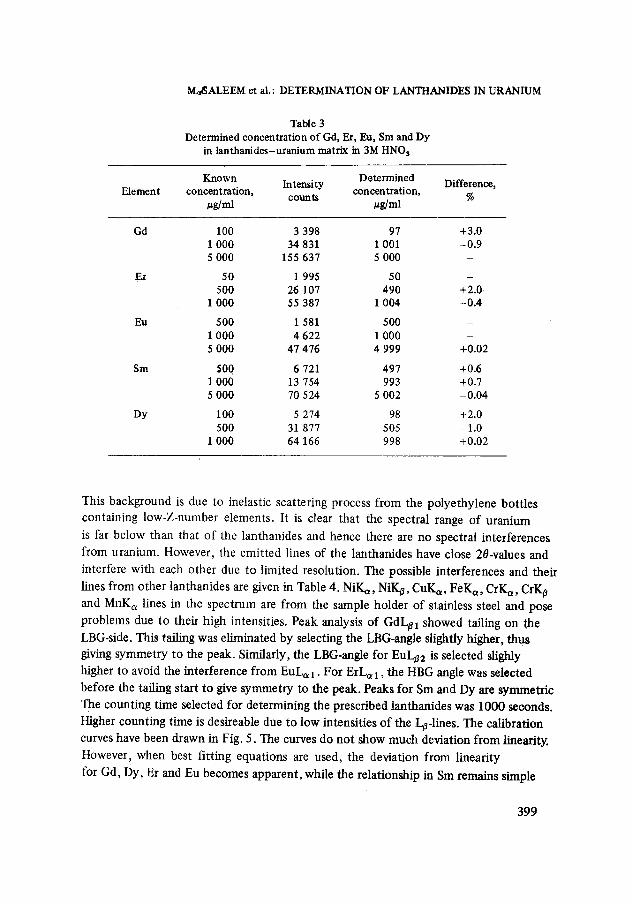
The equations given in Table 2 are applied to the simulated and blank samples con-
taining uranium and lanthanides to determine the concentration of Sm, Dy, Gd, Er and Eu in the presence of uranium. The experimentally determined values for lanthanide concentrations match fairly well with their standards, Table 3.
It is observed in Fig. 2 that the background is more prominent on lower 20-values.
397
M. S A L E E M et al.: D E T E R M I N A T I O N OF L A N T H A N I D E S IN U R A N I U M
10~ - '~ �9 Er Lcxa
o Gd L m �9 Eu Loz o Dy Lm
I0 s- �9 Sm (Lm. Lr~) o
10~ / ~
10 3
/ / 10 2 m # I I I I MJIIII I I I l l l l l l l I 1 I I l l l l l J
10 ~2 ~3 10 ~- Concentration ,pg/ml
Fig. 5. Ca l ib ra t ion curves of l an than ide s in l a n t h a n i d e - u r a n i u m m a t r i x
Table 2 Leas t squares regress ion coeff ic ien ts w i t h s t andard errors, equa t ions o f lines and s tandard
errors o f f i t o f l an than ides
E l e m e n t Coeff ic ien ts o f regression E q u a t i o n o f l ine* S t anda rd er ror w i t h s t anda rd er ror o f fit, c o u n t
Gd 3 . 5 1 3 8 - 102 �9 6 . 2 0 " 10 ~ Y = 351 .38 X - 0 . 0 8 0 2 x 2 5.73 �9 102 - 8 . 0 1 5 4 �9 10 -2 • 1.27 �9 10 -2
Sm - 3 . 1 0 7 9 �9 102 �9 4 .62 �9 101 Y = - 3 1 0 . 7 9 + 141 .62x 8.41 �9 101 1 . 4 1 6 2 . 1 0 2 • 2 . 0 2 . 1 0 -1
Eu - 9 . 4 6 5 0 �9 102 Y = - 9 4 6 . 5 0 + 4 5 . 3 9 2 x + 4 . 5 3 9 2 . 1 0 1 + 0 . 1 0 2 9 x 2
1 .0293 �9 10 -1
Er - 6 . 8 3 1 9 . 1 0 2 • 3 .62 �9 102 Y = - 6 8 3 . 1 9 + 5 3 5 . 4 6 x + 4 .76 �9 102 5 .3546 �9 102 • 7 . 7 4 . 10 ~ + 0 . 2 2 5 1 x 2 2 . 2 5 1 2 . 1 0 -1 • 1 . 4 6 . 10 -2
Dy - 1 . 1 3 8 3 �9 103 • 3.59 �9 102 Y = - 1 1 3 8 . 3 + 6 5 5 . 2 0 x - 3.37 �9 102
6 .5520 �9 102 �9 6 .63 �9 10 ~ - 0 . 0 0 8 0 x 2 - 2 . 3 2 0 8 �9 10 -3 �9 1.22 �9 10 -2
*Y - counts.
X - concentration (/~g/ml).
3 9 8
M.~IALEEM et al.: DETERMINATION OF LANTHANIDES IN URANIUM
Table 3 Determined concentration of Gd, Er, Eu, Sm and Dy
in lanthanides-uranium matrix in 3M HNO~
Element Known Determined
Intensity concentration, Difference, concentration, counts % /ag]ml ug]ml
Gd 100 3 398 97 +3.0 1 000 34 831 1 001 -0.9 5 000 155 637 5 000 -
Er 50 1 995 50 - 500 26 107 490 +2.0
1 000 55 387 1 004 -0.4
Eu 500 1 581 500 - 1 000 4 622 1 000 - 5 000 47 476 4 999 +0.02
Sm $0Q 6 721 497 +0.6 1 000 13 754 993 +0.7 5 000 70 524 5 002 -0.04
Dy 100 5 274 98 +2.0 500 31 877 505 -1.0
1 000 64 166 998 +0.02
This background is due to inelastic scattering process from the polyethylene bott les containing low-Z-number elements. It is clear that the spectral range of uranium
is far below than that o f the lanthanides and hence there are no spectral interferences
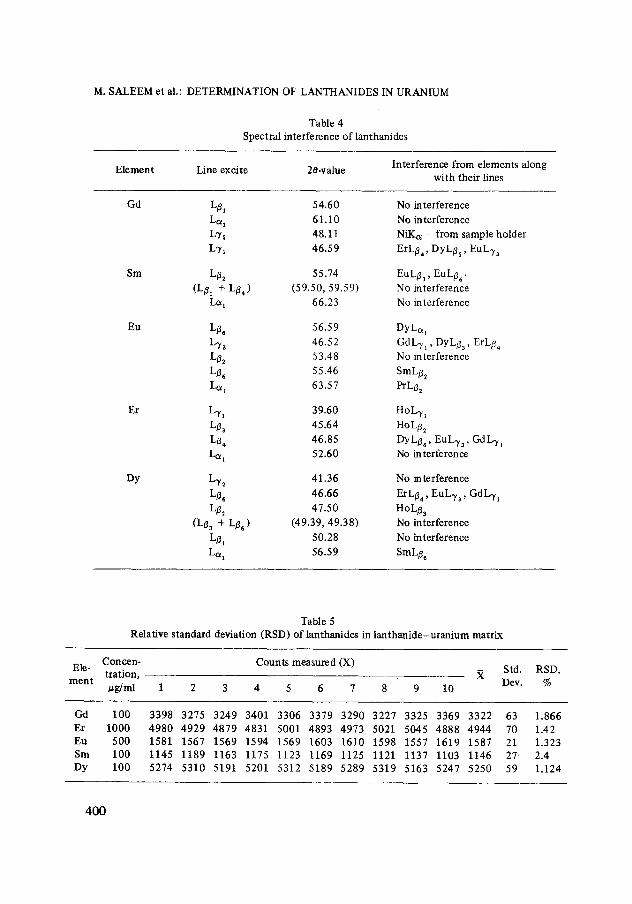
from uranium. However, the emitted lines of the lanthanides have close 20-values and
interfere with each other due to l imited resolution. The possible interferences and their
lines from other lanthanides are given in Table 4. NiKa, NiK#, CuKa, FeKa, CrKa, CrK#
and MnKa lines in the spectrum are from the sample holder of stainless steel and pose
problems due to their high intensities. Peak analysis of GdLt~ 1 showed tailing on the LBG-side. This tailing was eliminated by selecting the LBG-angle slightly higher, thus
giving symmetry to the peak. Similarly, the LBG-angle for EuLa2 is selected slighly
higher to avoid the interference from EuLa I. For ErL,~ 2, the HBG angle was selected
before the tailing start to give symmetry to the peak. Peaks for Sm and Dy are symmetric.
The counting time selected for determining the prescribed lanthanides was 1000 seconds.
Higher counting time is desireable due to low intensities of the L~-lines. The calibration
curves have been drawn in Fig. 5. The curves do not show much deviation from linearity,
However, when best fitting equations are used, the deviation from linearity
for Gd, Dy, Er and Eu becomes apparent, while the relationship in Sm remains simple
399
M. SALEEM et al.: DETERMINATION OF LANTHANIDES IN URANIUM
Table 4 Spectral interference of lanthanides
Element Line excite 28-value Interference from elements along with their lines
Gd L#1 54.60 No interference Lal 61.10 No interference LT~ 48.11 NiKcz - from sample holder L'y~ 46.59 ErL3, , DyL~3s, EuL73
Sm L32 55.74 EuL~3, EuLi36 �9 (Lfll + Lfl,) (59.50, 59.59) No interference
La~ 66.23 No interference
Eu L~ 56.59 DyLa~ LT~ 46.52 GdL71 , DyLt33, ErL/3, L#2 53.48 No interference L#6 55.46 SmL/3~ Laj 63.57 PrLfl~
Er L~h 39.60 HoL7~ Lfl3 45.64 HoLt32 L~4 46.85 DyLfl6, EuL73, Gd I_71 Lc h 52.60 No interference
Dy L72 41.36 No interference L/~ 46.66 ErL/34, EuL73 , GdL% Lfl2 47.50 HoL#3
(L~a + L#6) (49.39, 49.38) No interference L/3~ 50.28 No interference La I 56.59 SmL~
Table 5 Relative standard deviation (RSD) of lanthanides in lanthanide-uranium matrix
Concen- Counts measured (X) Ele- tration, ~, Std. RSD,
ment ~g/ml 1 2 3 4 5 6 7 8 9 10 Dev. %
Gd 100 3398 3275 3249 3401 3306 3379 3290 3227 3325.3369 3322 63 1.866 Er 1000 4980 4929 4879 4831 5001 4893 4973 5021 5045 4888 4944 70 1.42 Eu 500 1581 1567 1569 1594 1569 1603 1610 1598 1557 1619 1587 21 1.323 Sm 100 1145 1189 1163 1175 1123 1169 1125 1121 1137 1103 1146 27 2.4 Dy 100 5274 5310 5191 5201 5312 5189 5289 5319 5163 5247 5250 59 1.124
400
M. SALEEM et al.: DETERMINATION OF LANTHANIDES IN URANIUM
and linear. It is no ted that for Gd, Dy, Er and Eu the equat ions become essentially
quadrat ic , showing the complex i ty o f such eases. Precision was de te rmined by making
ten measurements at o p t i m u m condi t ions , shown in the Table 1. In Table 5, the relative
standard deviat ions (RSD) are given determined by using established statistical methods .
Thanks to Mr. Abdul MAJEED for providing the encouragement and necessary research facilities during this work. The valuable assistance of Mr. M. KHAN is gratefully acknowledged. Thanks axe due to Mr, Massod AHMAD for typing the manuscript.
References
1. J. D. WEINFORDNER, Trace Analysis Spectroscopic Method for Elements, John Wiley and Sons, 1970.
2. V. B. RYABININ, I. L. AGAFONOV, N. V. LARIN, Poluch. Anal. Chist.-Veschestv., 1 (1976) 51.
3. R. A. FASSEL, Anal. Chem., 32 (1960) 19A. 4. R. M. DIXIT, Bull. Mater. Sci., 3 (1981) 371. 5. L. V. AGAPOVA, A. V. ANTONOV, N. V. TRONEV, N. V. BAGAEV, Zavod. Lab., 47
(1981) 45. 6. V. A. POBEDONOSTSEV, L. A. RADKEVICH, T. E. SHCHUR, Tekhnal. i. Izueh. Soedin.
Redkevich, Elementov. Apatity. (1983) 49. 7. D. CHOPRA, H. NARAGHI, J. Less-Common Met., 93 (1983) 203. 8. LU SHAOLON, XU PEIZHEN, LI SHIZHEN, LI JIANHUA, Zhongguo Xitu Xuebao., 2
(1984) 88. 9. LU SHAOLON, XU PEIZHEN, LI SHIZHEN, LI JIANHUA, LI MINGJIE, New Front. Rare
Earth Sci. Appl., Proc. Int. Conf. Rare Earth Appl., 1 (1985) 553. 10. L. C. CHANDOLA, P. P. KHANNAS, Report BARC-1246, 1985. 11. R. M. DIXIT, S. S. DESHPANDE, Report BARC-1275, 1985. 12. L. C. CHANDOLA, P. P. KHANNA, J. Radioanal. Nucl. Chem., 121 (1988) 53. 13. E. L. CHUPP, J. W. M. DU MOND, F. J. GORDON, R. C. JOPSON, HANS MARK, Physical
Review, 112 (1958) 1183. 14. T. HUGHES, C. MCKENZIE, J. WASCHL, Proc. 2nd Aust. Conf. Nucl. Anal., 1978, p. 30. 15. C. S. SASTRI, P. MOELLER, Radiochem. Radioanal. Letters, 40 (1979) 103. 16. R. P. H. GARTEN, K. O. GROENVELD, K. H. KOENING, Fresen. Z. Anal. Chem., 307
(1981) 97. 17. A. V. GUREVICH, Z. V. VIKHROVA, V. Ya. VYROPAYEV, V. I. DRYNKIN, D. I. LEIPUN-
SKAYA, I. Ya. SHIROKOVA, J. Radioanal. Chem., 57 (1980)417. 18. J. J. LABRECQUE, Anal. China. Acta, 188 (1986) 9. 19. G. LAGARDE, J. LARCHER, J. Radioanal. NucL Chem., 105 (1986) 341. 20. MANDAN LAL, R. K. CHOUDHURY, R. M. AGRAWAL, X-Ray Speetrom., 16 (1987) 23. 21. T. A. KUADA, de raios-X, 1984. 22. WANG ZIYAO, LIN" JINGWIANG, HE CHUNFU, LI YING, Fenxi Huaxue, 12 (1984) 749. 53. WANG ZIYAO, HE CHUNFU, LIN JINGXIANG, LI PEIXIN, Fenxi Huaxue, 13 (1985) 105. 24. I. M. CITRON, Report ANL-81-85-Pt, 1982. 25. R. M. AGRAWAL, S. K. KAPOOR, X-Ray Speetrom., 16 (1987) 81.
401
M. SALEEM et al.: DETERMINATION OF LANTHANIDES IN URANIUM
26. A. B. BLANK, L. E. BELENKO, N. I. 8HEVTSOV, Zh. Analit. Khim., 41 (1986) 286. 27. M. K. KEYA, D. A. SERRA, Cicnc. Cult. Sulp., 31 (1979) 334. 28. V. A. RYABUKHIN, N. G. GATINSKAYA, A. N. ERMAKOV, S. D. SHEVALEEVSKII, Zh.
Analit. Iflxim., 38 (1983) 1626. 29. R. PLESCH, B. THIEL, Siemens. Anal. Appl. Note 196. 30. X-Ray Wavelength and 20-Table, N. V. Philips Gloeilampenfabfieken Holland, X-Ray Applica-
tion Laboratories. 31. R. JENKINS, J. L. DEVRIES, Worked Example in X-Ray Anal. Philips Technical Library, Mac-
Millan Press Ltd., 2nd ed., 1978. 32. V. MACHACEK, D. WEISS, X-Ray Spectrom., 15 (1985) $3.
402


