Embed Size (px)
Citation preview

1
Development and Validation of the Cannabis Refusal Self-Efficacy
Questionnaire (CRSEQ) in adult cannabis users in treatment
Ross McD. Young a,b,c, Matthew J. Gullo b, Gerald F.X. Feeney a,b,*, Jason P. Connor
a,b,d
a Alcohol and Drug Assessment Unit, Princess Alexandra Hospital, Brisbane, QLD
4102, Australia b Centre for Youth Substance Abuse Research, Faculty of Health, The University of Queensland, Brisbane, QLD 4029, Australia c Institute of Health and Biomedical Innovation, Queensland University of Technology, Brisbane QLD 4059, Australia d Discipline of Psychiatry, The University of Queensland, Brisbane, QLD 4029, Australia
* Corresponding Author: Associate Professor Gerald Feeney Medical Director
Alcohol and Drug Assessment Unit Princess Alexandra Hospital Brisbane, Queensland
Australia, 4102
Ph: 0011 61 7 32405191
Fax: 0011 61 7 32407211
E-mail: [email protected]
Word Count: 3582
Note: This is the preprint version of a published journal article. Please cite as:
Young, R. M., Gullo, M. J., Feeney, G. F. X., & Connor, J. P. (2012). Development and validation of the Cannabis Refusal Self-Efficacy Questionnaire (CRSEQ) in adult
cannabis users in treatment. Drug and Alcohol Dependence, 125, 244-251. doi:10.1016/j.drugalcdep.2012.02.018

2
ABSTRACT
Background: There are few valid clinical assessment instruments for cannabis. Self-
Efficacy, or the ability of users to resist temptation, is a central feature of social
cognitive theory. This study outlines the development and validation of the Cannabis
Refusal Self-Efficacy Questionnaire (CRSEQ), which measures the situational
confidence to refuse cannabis. Method: One thousand two hundred and forty-six
patients referred for cannabis assessment completed the CRSEQ including measures
of cannabis consumption and dependence severity (Severity of Dependence Scale-
Cannabis, SDS-C). The CRSEQ was subject to independent exploratory (n= 621,
mean age 26.88, 78.6% male) and confirmatory (n= 625, mean age 27.51, 76.8%
male) factor analysis. Results: Three factors: Emotional Relief, Opportunistic and
Social Facilitation were identified. They provided a good statistical and conceptual fit
for the data. Emotional Relief cannabis refusal self-efficacy was identified as most
predictive of cannabis dependence, after controlling for cannabis consumption.
Conclusions: The CRSEQ is recommended as a psychometrically sound and clinically
useful measure for cannabis misuse treatment planning and assessment.
Key words: cannabis; marijuana; self-efficacy; psychometric; validation

3
1. Introduction
Cannabis remains the most commonly used illicit substance. One-third of the adult
Australian population have tried cannabis (Australian Institute of Health and Welfare,
2011) with 1 in 10 reporting use during the past year (Roxburgh et al., 2010). The
subjective reinforcing effects of cannabis include relaxation, positive mood and
sensory enhancement, but these effects show considerable inter-individual situational
variability (Green, et al., 2003). Significant adverse effects include injury, possible
reduced birthweight with use in pregnancy and cognitive impairment and depression
(Hall and Degenhardt, 2009). Chronic use incurs a significant risk of dependence with
associated psychosocial morbidity (Copeland, et al., 2001; Feeney, et.al., 2005). A
high prevalence of cannabis use occurs amongst presentations with psychosis (Green,
et al. 2005; Hides, et al., 2006).
Social cognitive theory continues as a useful theoretical framework to study
substance use (Bandura, 1977a, 1977b, 1997). It includes the confidence of users to
resist temptation. This is typically conceptualized as the ability to resist or refuse a
substance in specific situations, described as ‘drug refusal self-efficacy’ (e.g. Young,
et al., 2007). Other subtypes of self-efficacy include the ability to avoid relapse (Litt,
et al., 2005), coping self-efficacy (Sklar and Turner, 1999) and anticipatory efficacy
to deal with relapse crisis situations (Sklar, et al., 1997). Additionally, judgments
made generic to all drugs of abuse (Schell, et al., 2005), or a focus on self-efficacy for
therapeutic goal attainment (Lozano, et al., 2006) have been described. These
definitions have both strengths and weaknesses particularly with lower levels of
dependence or abuse. Drug refusal self-efficacy (Young et al., 1991) makes fewer
assumptions about the nature of drug use as it is not defined by relapse risk. This has
broad applicability as a construct in survey work, prevention initiatives and also as a

4
clinical tool. The Drinking Refusal Self-efficacy Questionnaire (DRSEQ: Young, et
al., 1991; Young and Oei, 1996) has three factors (Social Pressure self-efficacy,
Opportunistic self-efficacy, Emotional Relief self-efficacy) with good validity and
reliability (Oei, et al., 2005). The DRSEQ has been used widely in investigating the
association between drinking refusal self-efficacy and drinking behavior. DRSEQ
factors are associated with frequency of alcohol consumption in university students
(Baldwin et al., 1993) and there is a confirmed association between DRSEQ factor
scores and both frequency and volume of consumption (Connor et al., 2000; Young,
et al., 2006). These findings are maintained across prospective studies (Connor, et al.,
2011; Young and Oei, 2000) .The DRSEQ differentiates problem/non-problem
drinkers (Oei et al., 1998; Young, 1994) and high/ low risk community drinkers (Lee
et al., 1999; Ricciardelli et al., 2001). It mediates the relationship between impulsivity
and alcohol use in patients undergoing residential treatment (Gullo, et al., 2010).
Cannabis specific self-efficacy scales are available. Stephens, et al., (1993)
developed a self-efficacy measure for avoiding cannabis on 167 cannabis using adults.
The scale was based on Marlatt and Gordon’s (1985) categories of relapse. The 19-
item scale applied a summary score with an internal reliability of .89. No further
psychometric assessment was undertaken. After controlling for demographics and
consumption, the total score was not associated with cannabis problems at baseline or
post-treatment. A subsequent study (Stephens, et al., 1995) in 210 treatment seeking
cannabis users confirmed the single factor solution of the measure. The cognitive-
behavioral based treatment improved reported self-efficacy beliefs post-intervention.
The Cannabis Situational Confidence Questionnaire (modeled on Annis and
Graham’s [1988] Smoking Situational Confidence Questionnaire) was purpose-built
for a cannabis intervention study (n=229) by Copeland et al. (2001). Although no

5
psychometric testing was undertaken, the scale did demonstrate a significant
proportion of patients used cannabis for stress relief. Adapting the smoking
Situational Confidence Questionnaire, Burleson and Kaminer (2005) applied the same
smoking factor structure as Annis and Graham. This structure was not validated
through either exploratory or confirmatory factor analyses. Increased self-efficacy
predicted cannabis abstinence. Litt and colleagues (2008) found that increasing self-
efficacy was the primary mechanism through which most effective treatments for
cannabis dependence operate, irrespective of the specific approach (e.g., motivational
interviewing, contingency management).
A rigorously validated measure of cannabis refusal self-efficacy would
benefit treatment evaluation and research. Recognizing the advantages of the DRSEQ
(Young and Oei, 1996; Oei, et al, 2005), this study develops and validates a parallel
Cannabis Refusal Self-Efficacy Questionnaire (CRSEQ).
Cannabis-related self-efficacy measures have not previously undergone
comprehensive psychometric evaluation. Here we include both exploratory factor
analysis and confirmatory factor analysis using structural equation modeling
(Hopwood and Donellan, 2010; Tabachnick, and Fidell, 2007). Concurrent validity
testing with levels of cannabis consumption and dependence severity is conducted to
assess the clinical utility of the CRSEQ.
2. Method
2.1 Participants
Data were obtained from 1250 consecutive adult individuals who were
referred for cannabis assessment as part of the Queensland Illicit Drug Diversion
Initiative (QIDDI). The QIDDI is a Queensland Police diversion program for

6
individuals charged with cannabis-related offences. The program involves a two-hour
comprehensive assessment of substance use and psychosocial functioning and
incorporates a motivational interviewing component. Referral to further treatment is
provided if indicated.
The mean age of the sample was 27.21 years (SD = 8.56). There were 971
(77.7%) males and 279 (22.3%) females. The majority of participants were born in
Australia (1012; 81.0%) or New Zealand (94; 7.5%), with 42 (3.4%) identifying
themselves as Indigenous Australians. In order to conduct exploratory factor analysis
(EFA) and confirmatory factor analysis (CFA) on the new measure, data were
randomly split (via SPSS select random cases function) into half with data from 625
participants used for the EFA, and 625 participants for the CFA. Descriptive data
regarding drug and alcohol use are reported separately for each sample below.
2.2 Measures
2.2.1Demographics. Information regarding age, gender, martial status, level of
education, employment, and country of origin were recorded.
2.2.2 Cannabis Refusal Self-Efficacy Questionnaire (CRSEQ) (Young and
Kavanagh, 1997). The CRSEQ is a 28-item questionnaire assessing an individual’s
belief in their ability to resist smoking cannabis across a range of situations.
Participants are asked to rate their ability to resist smoking cannabis on a 6-point
Likert-type scale ranging from 1 (I am very sure I could NOT resist smoking
cannabis) to 6 (I am very sure I could resist smoking cannabis). Item content was
adapted from the DRSEQ) (Young et al., 1991), a reliable and valid measure of self-
efficacy regarding refusal of alcohol in cued situations. The adaptation primarily
involved substituting the word “drinking” for “smoking,” as well as removing items

7
deemed inappropriate when applied to cannabis, given its status as an illicit substance,
or deemed to be of low relevance to cannabis use.
2.2.3 Severity of Dependence Scale-Cannabis (SDS-C) (Gossop et al., 1995).
The SDS-C is a 5-item scale that measures the degree of dependence experienced by
individuals who use different types of substances. The SDS-C is sensitive to severity
of cannabis dependence (Swift et al., 2000). Using Australian normative data, the
SDS-C cut-off for likely cannabis dependence is ≥ 2 (Swift et al., 1998).
2.3.4 Cannabis Consumption was clinically assessed by Masters and PhD
qualified clinical psychologists (with between 2 and 25 years alcohol and drug
treatment experience; M = 10.5 years) using a retrospective diary approach over the
past week. If cannabis was not consumed in the past week, clinical staff assessed the
typical weekly level of consumption for the respondent. For the purposes of this
study, ‘joints’ (cannabis cigarette) were quantified as 0.25 grams of cannabis and
‘cones’ (use of ‘bong’ or ‘pipe’), 0.10 grams of cannabis.
2.3 Procedure
As part of the assessment protocol, individuals participating in the QIDDI
program completed the CRSEQ and SDS-C. Human ethics approval was obtained for
this study.
3. Study 1: Exploratory Factor Analysis (EFA) of the Cannabis Refusal Self-
Efficacy Questionnaire (CRSEQ) (n= 625)
All analyses were performed in SPSS (version 17). Of the original sample, 4 (0.6%)
participants did not respond to at least 50% of CRSEQ items and were excluded,
leaving 621 cases for analysis. The average age of participants was 26.88 (SD = 8.48)

8
years. There were 488 (78.6%) males and 133 (21.4%) females. Average weekly
cannabis consumption was reported at 3.45 (SD = 5.28) grams and the average SDS-C
score was 3.35 (SD = 3.25). Approximately 64% of participants met the SDS-C
dependence criteria (≥ 2, Swift et al., 1998). The majority of participants (80.2%)
reported alcohol use in the previous month. Participants reported an average of 7.08
(SD = 8.31) drinking days in the past month, consuming an average of 85.69 (SD =
146.83) grams of alcohol on each drinking day. A total of 367 (59.1%) participants
were also current tobacco smokers, smoking an average of 11.55 (SD = 9.71)
cigarettes per day.
3.1 Principal Components Analysis
Each of the 28 CRSEQ items had 17 (2.7%) or fewer cases with missing data.
Therefore, the missing data (pairwise) correlation matrix was analyzed (Tabachnick
and Fidell, 2007). An initial principal components analysis (PCA) with oblique (direct
oblimin) rotation was used to estimate number of principal components and
factorability of the correlation matrices. The Kaiser-Meyer-Olkin (KMO) measure of
sampling adequacy was .97, suggesting suitable factorability of correlation matrices.
This parallels the initial analysis of the DRSEQ (Young, et al., 1991).
Three components with eigenvalues > 1 were identified and examination of
the scree plot also suggested the presence of three principal components. Therefore,
PCAs specifying 2, 3, and 4 components were conducted. Of these PCAs, the three-
component analysis provided the optimal solution in terms of percentage of variance
explained, number of items per factor, and absence of cross-loadings. Extracted
components were moderately-to-highly correlated, confirming the use of oblique
rotation (direct oblimin; rs ranged from .47 to .67).

9
In total, the three extracted components accounted for 73.80% of the variance.
Communalities suggested the three-component solution accounted for more than 50%
of the variance in each item (range = .55 - .89). Component loadings revealed 11
items significantly cross-loaded (≥ .30) on more than one component and were
excluded from the final solution. Item 22 (“Within 30 minutes of getting out of bed”)
and 23 (“When my medication side effects are bad”) were also removed because of
poor response discrimination, and theoretical considerations.
The PCAs were then re-run on the remaining 15 items. The result of these
analyses also suggested a three-factor solution with oblique (direct oblimin) rotation
was optimal. In total, the three extracted components accounted for 80.12% of the
variance. Communalities suggested the three-component solution accounted for more
than 60% variance in each item (ranging from .63 - .90). Item loadings are presented
in Table 1. Based on the item loadings, the first component was labeled Emotional
Relief self-efficacy, the second labeled Opportunistic self-efficacy, and the third
labeled Social Facilitation self-efficacy. Table 1 also shows the three components
were found to have high internal consistency. As with the DRSEQ, the three
components of the CRSEQ were significantly inter-correlated (rs range from .55 to
.71). In summary, initial validation of the CRSEQ suggests a three-component
structure similar to the DRSEQ. Each of the extracted components has high internal
reliability.
_______________
Insert Table 1 here
_______________
10
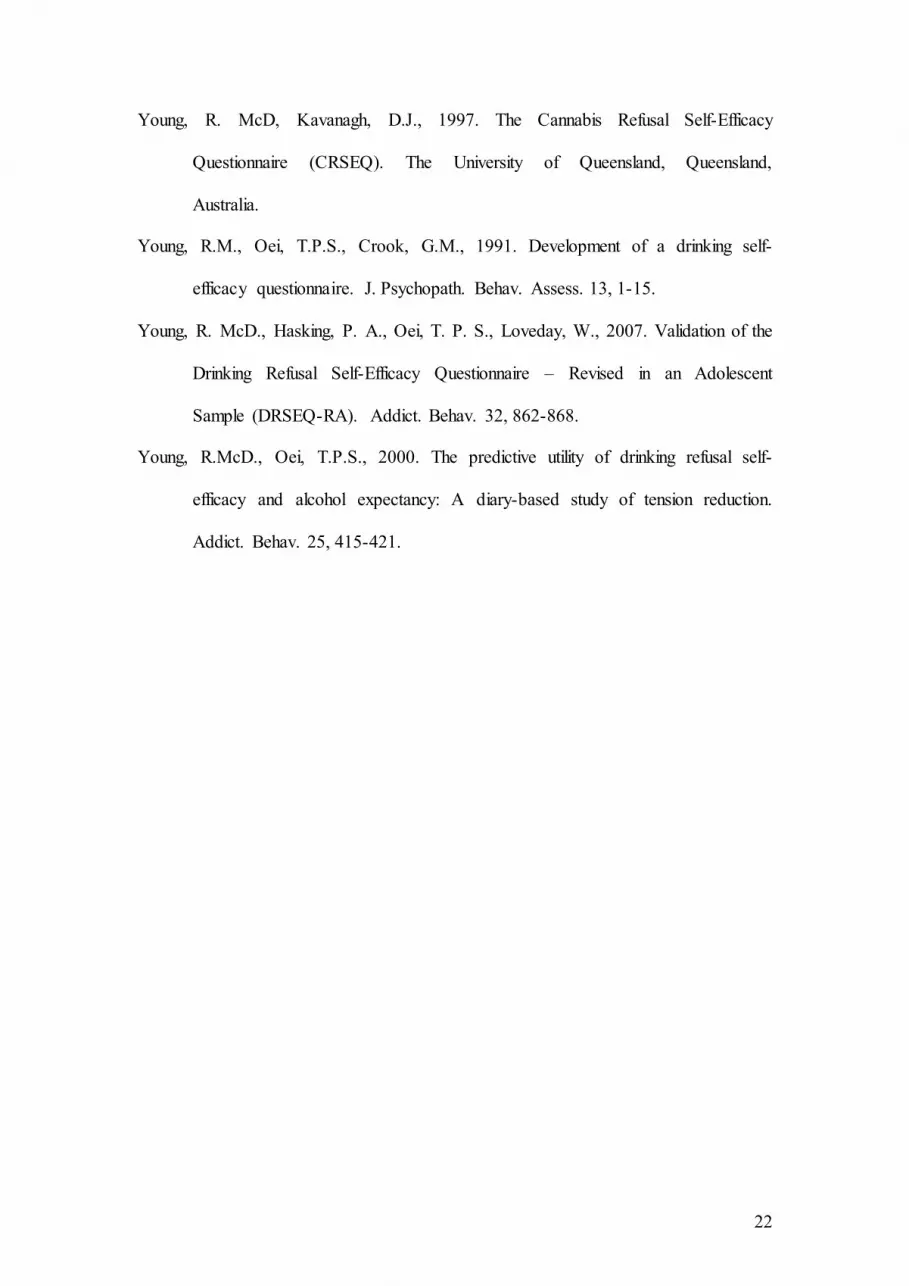
4. Study 2: Confirmatory Factor Analysis (CFA) of the Cannabis Refusal Self-
Efficacy Questionnaire (CRSEQ) (n=625)
Study 2 aimed to confirm the factor structure of the 15-item CRSEQ on an
independent sample of cannabis users in treatment. The study also sought to establish
the clinical utility of the measure by exploring its application to current cannabis use
and dependence.
All analyses were performed in SPSS and AMOS (version 17). Of the total
625 participants, 480 (76.8%) were male and 145 (23.2%) female. The average age of
participants was 27.51 (SD = 8.62) years. Average weekly cannabis consumption was
reported at 3.89 (SD = 5.15) grams and the average SDS-C score was 3.16 (SD =
3.17). Approximately 60% of participants met SDS-C criteria for cannabis
dependence (≥ 2, Swift et al., 1998). The majority of participants (87.8%) reported
alcohol use within the last month. Participants reported an average of 7.22 (SD =
8.59) drinking days in the past month, consuming an average of 83.16 (SD = 84.86)
grams of alcohol on each drinking day. A total of 360 (57.6%) participants were also
current tobacco smokers, smoking an average of 11.77 (SD = 10.14) cigarettes per
day.
4.1 Model Estimation and Evaluation
Confirmatory factor analysis (CFA) was conducted using maximum likelihood
estimation. Model fit was evaluated in several ways. In accordance with the
recommendations of Hu and Bentler (Bentler, 2007; Hu and Bentler, 1999), χ2 test
was selected as a statistical test of model fit (α = .05). However, given the sensitivity
of this test to trivial deviations from fit in large samples, the “normed” χ2 (χ2/df) was
also utilized. Values of χ2/df between 1.00 and 3.00 are indicative of good fit.
However, some researchers have argued values as high as 5.00 are acceptable (Kline,

11
2005). The comparative fit index (CFI) and root mean-square error of approximation
(RMSEA) were also used to evaluate fit (Bentler, 2007). The following cut-offs were
used for “good” fit: CFI ≥ .95 and RMSEA ≤ .06 (Hu and Bentler, 1999). For
“acceptable” fit, cut-offs used were CFI ≥ .90 and RMSEA ≤ .10 (Hu and Bentler,
1999). However, it should be noted that it is difficult to set specific criteria for the
evaluation of model fit as fit indices are not equally effective across different
conditions (Hu and Bentler, 1999; Marsh, et al., 2004). Therefore, the hypothesized
model was compared to a non-hypothesized alternative. The Akaike Information
Criterion (AIC) was examined to assist model comparison (Akaike, 1987). The AIC
has no conventional cut-off. Instead, smaller values indicate a model is better-fitting
and more parsimonious.
4.2 Confirmatory Factor Analysis (CFA)
Based on the results of exploratory factor analysis in Study 1, the
hypothesized measurement model included Emotional Relief self-efficacy as latent
variable with seven items as indicators, Opportunistic self-efficacy as a latent variable
with five items as indicators, and Social Facilitation self-efficacy as a latent variable
with three items as indicators (see Table 1 for item listing). The three latent variables
were hypothesized to “load” or serve as indicators of a higher-order Cannabis Refusal
Self-Efficacy latent factor.
No variable was missing more than 5% data (range: 0.32 – 3.04%). Missing
data was imputed using Full Information Maximum Likelihood (FIML) estimation, an
optimal strategy for handling missing data (Graham, 2009). Six items were found to
have significantly skewed distributions and were transformed using square-root or log
transformation before testing the model (Kline, 2005). The hypothesized

12
measurement model was found to provide an overall “acceptable-to-poor” fit to the
data (see Table 2, Model 1). Closer inspection of model output suggested the fit of the
model could be improved by specifying a residual covariance between item 14
(“When I am feeling lonely”) and item 15 (“When I feel sad”). That is, variance in
these two items not explained by the latent Emotional Relief self-efficacy variable
was significantly related. Given the relatively low standardized loading of item 14
(.87), and its skewed distribution, this item was removed from the model.
The revised model, presented in Figure 1, was found to provide an overall
“acceptable-to-good” fit to the data (see Table 2, Model 2) and change in AIC scores
suggested it provided a better fit than the originally specified model. All items loaded
highly on their respective factors. As post-hoc model modifications were made, a
correlation between the item loadings of the original and revised models was
conducted, r (623) = .997, p < .001. This showed that the model parameters were only
marginally changed. The revised measurement model was compared to a non-
hypothesized, alternative model in which all items were specified to serve as
indicators of a single Cannabis Refusal Self-Efficacy factor. This model was found to
provide a poor fit to the data (see Table 2, Model 3). This result, combined with the
revised model’s lower AIC, suggested the revised three-factor model provided a better
fit to the data.
_______________
Insert Table 2 here
_______________
_______________
Insert Figure 1 here
_______________

13
4.3 Gender Invariance
The influence of gender on parameter estimates and model fit was examined in
a multi-group CFA. The revised three-factor multi-group model provided a
“moderately good” fit to the data (see Table 2, Model 4). Invariance testing was
conducted to evaluate whether there were any gender differences in the measurement
model (e.g., smaller factor loadings in males). This was performed by constraining all
parameters, factor variances, and error variances to equality across gender. The fit of
the constrained (invariance) model was not significantly different to the unconstrained
model (Δχ2 [31] = 40.15, p > .05), suggesting invariance across gender. That is, there
were no significant differences in the factor structure of the CRSEQ between male
and female cannabis users. Similarly, independent-groups t test revealed no mean
differences on any of the subscales across gender (α = .05). Normative data for the 14-
item CRSEQ are presented in Table 3. This table also shows that the internal
reliability of the CRSEQ subscales and total score were good-to-excellent.
_______________
Insert Table 3 here
_______________
4.4 Prediction of cannabis use and dependence
In order to explore the utility of the CRSEQ in predicting current cannabis use
and dependence, a path model was tested in which each of the three CRSEQ subscales
were hypothesized to contribute to prediction (see Figure 2). Cannabis use was
operationalized as participants’ reported average weekly cannabis use (in grams), and

14
cannabis dependence was operationalized as participants’ SDS-C total score. Age and
gender were also included in the model as covariates, and weekly cannabis used was
also hypothesized to predict level of dependence. The hypothesized model showed a
very good fit to the data, χ2 (7) = 18.68, p = .01, χ2/df = 2.67, CFI = .99, RMSEA =
.05, AIC = 74.68. As predicted, all CRSEQ subscales contributed unique variance to
the prediction of weekly cannabis use. In total, the CRSEQ accounted for 22% of the
variance in weekly cannabis use, indicating a medium-to-large effect size. Consistent
with the findings of Copeland et al. (2001), Emotional Relief Self-Efficacy was the
only significant predictor of cannabis dependence (unstandarized coefficient = -0.08,
p = .003). However, there was a non-significant trend for Opportunistic Self-Efficacy
to predict cannabis dependence as well (unstandarized coefficient = -0.06, p = .06). In
total, the model accounted for 20% variance in severity of cannabis dependence.
_______________
Insert Figure 2 here
_______________
5. Discussion
These two studies provide strong support for the validity of a new measure of
cannabis refusal self-efficacy. The findings of Study 1 revealed a three-factor
structure for the Cannabis Refusal Self-Efficacy Questionnaire (CRSEQ): Emotional
Relief self-efficacy, Opportunistic self-efficacy, and Social Facilitation self-efficacy.
This factor structure is broadly consistent with that of the established Drinking
Refusal Self-Efficacy Questionnaire (DRSEQ; Young et al., 1991) and the Heroin
Refusal Self-Efficacy Questionnaire (Young, et al.,, 2006). Each of the three factors
has good internal reliability.

15
Study 2 confirmed the three-factor structure of the CRSEQ in an independent
sample of cannabis users in treatment. Results of Study 2 showed no gender
differences in the structure or mean scores of the measure. This study also
demonstrated the predictive value of the measure. Each of the three subscales
uniquely predicted weekly cannabis use. Therefore, while the three subcomponents of
cannabis refusal self-efficacy are related, they represent distinct constructs. This is
supported by results of the EFA and CFA, which suggested a three-factor structure
was optimal.
Results of the path analysis also confirm that Emotional Relief refusal self-
efficacy plays a more prominent role in severity of cannabis dependence, after
controlling for weekly consumption. While low Emotional Relief self-efficacy is also
important in predicting early drinking behavior (eg Young, et al., 2007), for those
with established alcohol problems, low Opportunistic drinking refusal self-efficacy is
a more powerful predictor. This difference may reflect pharmacological and social
learning differences as well as the environmental context of substance use given that
the opportunities to use an illicit drug in many settings are restricted. Poor self-
efficacy to resist cannabis during heightened negative affect is more strongly related
to dependence than availability of the drug or its (perceived) ability to facilitate social
interactions. These results are consistent with Copeland et al.’s (2001) finding that
stress relief is an important motivator of cannabis use in dependent persons. The
potential implications for treatment are that increasing an individual’s confidence to
manage negative affect may be a greater priority in those with more severe cannabis
dependence. This could be achieved through behavioral strategies aimed at building a
patient’s repertoire of coping skills, or focusing treatment on comorbid mood or
anxiety disorders (DeMarce, et al., 2005). While the cross-sectional associations

16
reported here cannot establish that a change in self-efficacy would result in a change
in cannabis use or dependence, there is evidence suggesting that effective
psychosocial treatments primarily operate through improving self-efficacy (Litt et al.,
2008).
This research has some limitations. First, the sample of adult, court-referred
cannabis users may not be generalizable to all clinical samples seeking treatment.
Second, cannabis use was measured over the past week and monthly consumption or
biological drug screening data would have provided a more robust assessment. Third,
cross-sectional data limits the extent one can draw casual inferences. Further
prospective studies are required to determine the influence of cannabis refusal self-
efficacy on consumption and dependence severity. There are also several key
advantages to this work relating to a large clinical sample and a robust psychometric
evaluation involving CFA and EFA.
The CRSEQ is a clinically useful, validated assessment to assist with
treatment planning and pre-and-post treatment measurement. Prospective studies are
required to assess the CRSEQ’s utility as a prognostic tool for cannabis treatment
outcome.

17
References
Akaike, H., 1987. Factor analysis and AIC. Psychometrika. 52, 317-332.
Annis H.M., Graham J.M., 1988. Situational Confidence Questionnaire (SCQ-39):
User's Guide. Addiction Research Foundation, Toronto
Australian Institute of Health and Welfare, 2011. 2010 National Drug Strategy
Household Survey Report, Drug Statistics Series 25, Australian Institute of
Health & Welfare, Canberra.
Baldwin, A.R., Oei, T.P S., Young, R. McD., 1993. To drink or not to drink: the
differential role of alcohol expectancies and drinking refusal self-efficacy in
quantity and frequency of alcohol consumption. Cognitive Ther. Res. 17, 511-
530.
Bandura, A. (1977a). Self-efficacy: Toward a unifying theory of behavioural change.
Psychol Rev. 84, 191-215.
Bandura, A. (1997a). Self-Efficacy: The exercise of control. New York, Freeman.
Bandura, A. (1977b). Social learning theory. New Jersey, Prentice-Hall.
Bentler, P.M., 2007. On tests and indices for evaluating structural models. Pers
Individ. Dif. 42, 825-829.
Burleson, J.A., Kaminer, Y., 2005. Self-efficacy as a predictor of treatment outcome
in adolescent substance use disorders. Addict. Behav. 30, 1751-1764.
Connor, J.P., George, S.M., Gullo, M., Kelly, A.B, Young. R.McD., 2011. A
prospective study of alcohol expectancies and self-efficacy as predictors of
young adolescent alcohol misuse. Alcohol Alcohol. 46, 161-169.
Connor, J.P, Young, R. McD., Williams, R.J., & Ricciardelli, L.A,. 2000. Drinking
restraint versus alcohol expectancies: Which is the better indicator of alcohol
problems? J. Stud. Alcohol. 61, 352-359.

18
Copeland, J., Swift, W., Rees, V., 2001. Clinical profile of participants in a brief
intervention program for cannabis use disorder. J. Subst Abuse Treat. 20, 45-
52.
DeMarce, J.M., Stephens, R.S., Roffman, R.A., 2005. Psychological distress and
marijuana use before and after treatment: testing cognitive-behavioral
matching hypotheses. Addict Behav. 30, 1055-1059.
Feeney, G. F. X., Connor, J. P., Young, R. McD., Tucker, J., McPherson, A., 2005.
Cannabis dependence and mental health perception amongst people diverted
by police after arrest for cannabis-related offending behavior in Australia.
Crim. Behav. Ment. Health 15, 249-260.
Gossop, M., Darke, S., Griffiths, P., Hando, J., Powis, B., Hall, W., Strang, J., 1995.
Psychometric properties of the SDS in English and Australian samples of
heroin, cocaine and amphetamine users. Addiction 90, 607-614.
Graham, J.W., 2009. Missing data analysis: Making it work in the real world. Annu
Rev. Psychol. 60, 549-576.
Green, B., Kavanagh, D.J., & Young, R.M., 2003. Being stoned: a review of self-
reported cannabis effects. Drug Alcohol Rev 22, 453-460.
Green, B., Young, R., & Kavanagh, D., 2005. Cannabis use and misuse prevalence
among people with psychosis. Br. J. Psychiatry 187, 306-313.
Gullo, M.J., Dawe, S., Kambouropoulos, N., Staiger, P.K., Jackson, C.J., 2010.
Alcohol expectancies and drinking refusal self-efficacy mediate the
association of impulsivity with alcohol misuse. Alcohol. Clin. Exp. Res. 34,
1386-1399.
Hall, W., Degenhardt, L., 2009. Adverse health effects of non-medical cannabis use.
Lancet, 374, 1383-91.

19
Hides, L., Dawe, S., Kavanagh, D.J., Young, R.M., 2006. Psychotic symptom and
cannabis relapse in recent-onset psychosis. Br. J. Psychiatry 189, 137-143.
Hopwood, C.J., Donnellan, M.B., 2010. How should the internal structure inventories
be evaluated? Pers. Soc. Psychol. Rev. 14, 332-346.
Hu, L., Bentler, P.M., 1999. Cutoff criteria for fit indexes in covariance structure
analysis: Conventional criteria versus new alternatives. Struct. Equat. Model.
6, 1-55.
Kline, R.B., 2005. Principles and practice of structural equation modeling (2nd ed.).
New York, Guilford Press.
Lee, N.K., Greeley, J., Oei, T.P.S. 1999. The relationship of positive and negative
alcohol expectancies to patterns of consumption of alcohol in social drinkers.
Addict. Behav., 24, 359-369.
Litt, M.D., Kadden, R.M., Kabela-Cormier, E., Petry, N.M., 2008. Coping Skills
Training and Contingency Management Treatments for Marijuana
Dependence: Exploring Mechanisms of Behavior Change. Addiction. 103,
638-648.
Litt, M., Kadden, R.M., & Stephens, R.S., 2005. Coping and Self-Efficacy in
Marijuana Treatment: Results From the Marijuana Treatment Project. J.
Consult. Clin. Psychol. 73, 1015-1025.
Lozano, B. E., Stephens, R.S., Roffman R.A., 2006. Abstinence and moderate use
goals in the treatment of marijuana dependence. Addiction 101, 1589-1597.
Marlatt, G.A., Gordon, J.R. 1985. Relapse prevention: Maintenance strategies in the
treatment of addictive behaviors. New York, Guilford.
Marsh, H.W., Hau, K.-T., & Wen, Z. 2004. In search of golden rules: Comment on
hypothesis-testing approaches to setting cutoff values for fit indexes and

20
dangers in overgeneralizing Hu and Bentler's (1999) findings. Struct. Equat.
Model. 11, 320-341.
Oei, T.P.S., Fergusson, S., & Lee, N.K., 1998. The differential role of alcohol
expectancies and drinking refusal self-efficacy in problem and non-problem
drinkers. J. Stud. Alcohol. 59, 704-711.
Oei, T. P. S., Hasking, P. A., & Young, R. McD., 2005. Drinking refusal self-efficacy
questionnaire-revised (DRSEQ-R): a new factor structure with confirmatory
factor analysis. Drug Alcohol Depend. 78, 297-307.
Ricciardelli, L.A., Connor, J.P., Williams, R.J., Young, R.McD., 2001. Gender
stereotypes and drinking cognitions as indicators of moderate and high risk
drinking among young women and men. Drug Alcohol Depend. 61, 129-136.
Rotgers, F., 2002. Clinically useful, research validated assessment of persons with
alcohol problems. Behav. Res. Ther. 40, 1425-1441.
Roxburgh, A., Hall, W.D., Degenhardt, L., McLaren, J., Black, E., Copeland, J.,
Mattick, R.P., 2010. The epidemiology of cannabis use and cannabis-related
harm in Australia 1993-2007. Addiction 105, 1071-1079.
Schell, T.L., Orlando, M., Morral, A.R., 2005. Dynamic Effects among Patients’
Treatment Needs, Beliefs, and Utilization: A Prospective Study of
Adolescents in Drug Treatment. Health Serv. Res. 40, 1128-47.
Sklar, S. M., Annis, H. M., Turner, N. E., 1997. Development and Validation of the
Drug-Taking Confidence Questionnaire: A Measure of Coping Self-Efficacy.
Addict. Behav. 22, 655-670.
Sklar, S.M., Turner, N.E., 1999. A brief measure for the assessment of coping self-
efficacy among alcohol and other drug users. Addiction, 94, 723-729.

21
Stephens, R.S., Wertz, J.S., Roffman, R.A., 1993. Predictors of Marijuana Treatment
Outcomes: The Role of Self-Efficacy. J. Subst. Abuse 5, 341-353.
Stephens, R.S., Wertz, J.S., Roffman, R.A., 1995. Self-Efficacy and Marijuana
Cessation: A construct Validity Analysis. J. Consult. Clin. Psychol. 63, 1022-
1031.
Swift, W., Copeland, J., Hall, W., 1998. Choosing a cut-off for cannabis dependence.
Addiction. 93, 1681-1692.
Swift, W., Hall, W., Copeland, J., 2000. One year follow-up of cannabis dependence
among long term users in Sydney, Australia. Drug Alcohol Depend. 59, 309-
318.
Tabachnick, B.G., Fidell, L.S., 2007. Using multivariate statistics (5th ed.). Allyn and
Bacon, Boston.
Young, R.McD., 1994. Expectancies and drinking behaviour: the measurement of
alcohol expectancies and drinking refusal self-efficacy. Unpublished doctoral
dissertation, University of Queensland, Brisbane, Australia.
Young, R.McD., Oei, T.P.S., 1996. Drinking Expectancy Profile: Test Manual,
Department of Psychiatry, University of Queensland, Royal Brisbane Hospital,
Herston, Queensland, Australia.
Young, R.M, Connor, J.P., Ricciardelli, L.A. Saunders, J.B., 2006. The role of alcohol
expectancy and drinking refusal self-efficacy beliefs in a university student
drinking. Alcohol Alcohol. 41, 70-75.
Young R. McD, Jones B.T., Walmsley C., Nutting A., 2006. Opiate Cognitions. In
M. Munafo & I.F. Albery (Eds). Cognition and Addiction, Oxford University
Press, Oxford.
22
Young, R. McD, Kavanagh, D.J., 1997. The Cannabis Refusal Self-Efficacy
Questionnaire (CRSEQ). The University of Queensland, Queensland,
Australia.
Young, R.M., Oei, T.P.S., Crook, G.M., 1991. Development of a drinking self-
efficacy questionnaire. J. Psychopath. Behav. Assess. 13, 1-15.
Young, R. McD., Hasking, P. A., Oei, T. P. S., Loveday, W., 2007. Validation of the
Drinking Refusal Self-Efficacy Questionnaire – Revised in an Adolescent
Sample (DRSEQ-RA). Addict. Behav. 32, 862-868.
Young, R.McD., Oei, T.P.S., 2000. The predictive utility of drinking refusal self-
efficacy and alcohol expectancy: A diary-based study of tension reduction.
Addict. Behav. 25, 415-421.

23
Figure Legends
Figure 1. Confirmatory Factor Analysis (CFA) of the Cannabis Refusal Self-Efficacy
Questionnaire (CRSEQ; N = 625).
Note. Ellipses represent latent constructs or factors, and rectangles indicate measured
variables (items). Circles (e) reflect residuals or (d) disturbances; numbers above or
near endogenous variables represent the amount of variance explained (R2).
Standardized parameter estimates are presented and all are statistically significant at p
< .05.
Figure 2. Path model of the Cannabis Refusal Self-Efficacy Questionnaire (CRSEQ)
predicting current cannabis use and dependence severity (N = 625).
Note. Ellipses represent latent constructs or factors, and rectangles indicate measured
variables (items). Circles (e) reflect residuals or (d) disturbances; numbers above or
near endogenous variables represent the amount of variance explained (R2).
Standardized parameter estimates are presented. SDS-C = Severity of Dependence
Scale-Cannabis.
*p < .05; **p < .01; ***p < .001; †p = .06.

24
Figure 1
Cannabis Refusal Self-Efficacy
.81
Emotional Relief
.71
Opportunistic
.70
Social
Facilitation
.70
CRSEQ8 e6
.80 CRSEQ11 e5
.78
CRSEQ9 e4
.79
CRSEQ15 e3
.90
CRSEQ13 e2
.88
CRSEQ12 e1
.65
CRSEQ16 e11
.46 CRSEQ28 e10
.72
CRSEQ3 e9
.79
CRSEQ4 e8
.80
CRSEQ18 e7
.56 CRSEQ10 e14
.69 CRSEQ5 e13
.54
CRSEQ27 e12
.90
.84
.84
d1
d2
d3
.94 .95
.89
.88
.89
.84
.90
.89
.85
.68
.81
.74
.83
.75

25
Emotional Relief Self-Efficacy
Opportunistic Self-Efficacy
Social Facilitation Self-Efficacy
R2 = .22
Average Weekly Cannabis Use
(grams)
e1
.73***
.59***
.68***
age
gender
R2 = .20
SDS-C Total Score
e2
-.26***
-.14*
-.12*
.16**
-.24**
-.14†
.02
.00
-.10*
-.05
-.02
Figure 2

26
Table 1
Psychopathology
Mean SD
Study 1: Exploratory Factor Analysis (N = 621)
GHQ-28 Somatic Symptoms 0.95 1.52
GHQ-28 Anxiety 1.09 1.80
GHQ-28 Social Dysfunction 0.80 1.54
GHQ-28 Depression 1.62 3.72
Brief Psychiatric Rating Scale Total 24.21 6.79
Study 2: Confirmatory Factor Analysis (N = 625)
GHQ-28 Somatic Symptoms 0.92 1.51
GHQ-28 Anxiety 1.07 1.69
GHQ-28 Social Dysfunction 0.72 1.38
GHQ-28 Depression 1.66 3.64
Brief Psychiatric Rating Scale Total 1.91 3.75
Note. GHQ-28 = General Health Questionnaire (28-item version).

27
Table 2
Item loadings from principal components analysis (PCA) of the Cannabis Refusal Self-Efficacy Questionnaire (N = 621)
Item
Emotional
Relief
Opportunistic Social
Facilitation
12. When I feel upset 1.00 13. When I feel down .97
15. When I feel sad .96 9. When I am ashamed .89 11. When I am worried .87
14. When I am feeling lonely .82 8. When I feel restless .77
18. When my friends are smoking .92
4. When someone offers me a smoke
.92
3. When I am at a party .83 28. When I have been drinking .80
16. When my spouse or partner is smoking
.73
27. When I am going to meet or am meeting people for the first time
.87
5. When I want to feel more
confident
.83 10. When I want to feel more
accepted by friends
.82 % variance 65.14 8.46 6.5
Cronbach’s α .97 .91 .84
Mean 28.52 17.89 14.86 Standard deviation (SD) 11.25 7.51 3.71
Note. Item loadings lower than .30 not shown for clarity of exposition.

28
Table 3
Fit Indices for Confirmatory Factor Analysis of the Cannabis Refusal Self-Efficacy Questionnaire (CRSEQ; N = 625)
Model χ2 (df) χ2/df CFI RMSEA AIC ΔAIC
1. Hypothesised measurement model 561.45* (87) 6.45 .95 .09 657.45
2. Revised measurement model 365.96* (74) 4.95 .96 .08 455.96
3. Non-hypothesized, one-factor
alternative model
1481.14* (77) 19.24 .83 .17 1565.14
4. Multi-group model comparing
gender
503.61* (148) 3.40 .96 .06 683.61
Difference between
Model 2 & Model 1
201.49
Difference between
Model 3 & Model 2
1109.18
Note. CFI = Comparative Fit Index; RMSEA = Root Mean-Square Error of Approximation; AIC = Akaike Information Criterion
* p < .05.

29
Table 4
Normative data for the Cannabis Refusal Self-Efficacy Questionnaire (CRSEQ; N =
625)
α Mean SD
CRSEQ: Emotional Relief (6 items) .96 23.82 9.61
CRSEQ: Opportunistic (5 items) .91 17.87 7.63
CRSEQ: Social Facilitation (3 items) .79 14.94 3.50
CRSEQ Total Score (14 items) .95 56.88 18.68