Embed Size (px)
Citation preview

ISSN: 1524-4636 Copyright © 2009 American Heart Association. All rights reserved. Print ISSN: 1079-5642. Online
7272 Greenville Avenue, Dallas, TX 72514Arteriosclerosis, Thrombosis, and Vascular Biology is published by the American Heart Association.
DOI: 10.1161/ATVBAHA.109.200154 published online Dec 30, 2009; Arterioscler Thromb Vasc Biol
Madeddu Gaia Spinetti, Nicolle Kraenkel, Lucia Prezioso, Costanza Emanueli and Paolo
Katare, Andrea Caporali, Jaap D. van Buul, Floris P.J. van Alphen, Gallia Graiani, Atsuhiko Oikawa, Mauro Siragusa, Federico Quaini, Giuseppe Mangialardi, Rajesh G.
Diabetes Mellitus Induces Bone Marrow Microangiopathy
http://atvb.ahajournals.org/cgi/content/full/ATVBAHA.109.200154/DC1Data Supplement (unedited) at:
http://atvb.ahajournals.org
located on the World Wide Web at: The online version of this article, along with updated information and services, is
http://www.lww.com/reprintsReprints: Information about reprints can be found online at
[email protected]. E-mail:
Fax:Kluwer Health, 351 West Camden Street, Baltimore, MD 21202-2436. Phone: 410-528-4050. Permissions: Permissions & Rights Desk, Lippincott Williams & Wilkins, a division of Wolters
http://atvb.ahajournals.org/subscriptions/Biology is online at Subscriptions: Information about subscribing to Arteriosclerosis, Thrombosis, and Vascular
by on May 18, 2011 atvb.ahajournals.orgDownloaded from
Diabetes Mellitus Induces Bone Marrow MicroangiopathyAtsuhiko Oikawa; Mauro Siragusa; Federico Quaini; Giuseppe Mangialardi; Rajesh G. Katare;
Andrea Caporali; Jaap D. van Buul; Floris P.J. van Alphen; Gallia Graiani; Gaia Spinetti;Nicolle Kraenkel; Lucia Prezioso; Costanza Emanueli; Paolo Madeddu
Objective—The impact of diabetes on the bone marrow (BM) microenvironment was not adequately explored. Weinvestigated whether diabetes induces microvascular remodeling with negative consequence for BM homeostasis.
Methods and Results—We found profound structural alterations in BM from mice with type 1 diabetes with depletion ofthe hematopoietic component and fatty degeneration. Blood flow (fluorescent microspheres) and microvascular density(immunohistochemistry) were remarkably reduced. Flow cytometry verified the depletion of MECA-32� endothelialcells. Cultured endothelial cells from BM of diabetic mice showed higher levels of oxidative stress, increased activityof the senescence marker �-galactosidase, reduced migratory and network-formation capacities, and increasedpermeability and adhesiveness to BM mononuclear cells. Flow cytometry analysis of lineage� c-Kit� Sca-1� celldistribution along an in vivo Hoechst-33342 dye perfusion gradient documented that diabetes depletes lineage� c-Kit�
Sca-1� cells predominantly in the low-perfused part of the marrow. Cell depletion was associated to increased oxidativestress, DNA damage, and activation of apoptosis. Boosting the antioxidative pentose phosphate pathway bybenfotiamine supplementation prevented microangiopathy, hypoperfusion, and lineage� c-Kit� Sca-1� cell depletion.
Conclusions—We provide novel evidence for the presence of microangiopathy impinging on the integrity of diabetic BM.These discoveries offer the framework for mechanistic solutions of BM dysfunction in diabetes. (Arterioscler ThrombVasc Biol. 2010;30:00-00.)
Key Words: diabetes � microangiopathy � oxidative stress � progenitor cells
Diabetic patients have ischemic complications more fre-quently than nondiabetic subjects and also show a worse
clinical outcome after an ischemic event. This prognosticdisadvantage is partly dependent on diabetes-induced impair-ment of reparative angiogenesis. The contribution of circu-lating cells in maintenance of vascular integrity and recoveryfrom ischemic complications has been also acknowledged.Tissue injury triggers the bone marrow (BM) to releaseprogenitor cells (PC) and monocytes with proangiogeniccapacities into the peripheral circulation.1–3 A default versionof this cellular response may account for the weakenedhealing capacity in diabetes. However, whether diabetes maydamage stem cells (SC) inside the BM either directly or byaltering their microenvironment remains to be elucidated.
Maintenance of BM homeostasis is dependent on theinteraction between SC and cells of the supportive microen-vironment, where SC self-renew, differentiate, or die. Regu-latory components of the niche include endothelial cells (EC),mesenchymal cells, and adipocytes. The cellular compositionand location of the niche are associated with specializedfunctions. For instance, the vascular niche, composed of
lineage-committed PC, mature hematopoietic cells, stromalcells, and cells of the fenestrated sinusoidal endothelium,preside over the trafficking of cells and solutes between themarrow and circulation.4 The osteoblastic niche, located nearthe endosteal bone and its trabecular projections, is regardedas the main repository of primitive SC of the marrow.5 Thelow-oxygenated osteoblastic microenvironment is ideal tomaintenance of SC quiescence, with SC differentiation oc-curring along the oxygen ascent toward the vasculature.6,7
However, some endosteal niches are well-perfused, beingenmeshed in microvessels that penetrate the bone, and arethereby equally influenced by signals from osteoblasts andEC and by chemical cues from the circulation.8 Furthermore,SC scattered between the 2 main niches may representtransition entities moving back and forward between theendosteum and vasculature.9
In this study we investigated the status of vascular cells,hematopoietic cells, and their niches in BM of diabetic mice.Results show profound marrow remodeling with depletion ofthe hematopoietic component and presence of a so-far-unreported form of microangiopathy. Importantly, cell deple-
Received November 9, 2009; revision accepted December 21, 2009.From Experimental Cardiovascular Medicine (A.O., M.S., G.M., R.G.K., A.C., N.K., C.E., P.M.), University of Bristol, UK; Department of Internal
Medicine and Biomedical Science (F.Q., G.G., L.P.), University of Parma, Parma, Italy; Department of Molecular Cell Biology (J.D.B., F.P.J.v.A.),University of Amsterdam, the Netherlands; IRCCS MultiMedica (G.S.), Milan, Italy.
A.O. and M.S. contributed equally to the study.Correspondence to Professor Paolo Madeddu, MD, Chair of Experimental Cardiovascular Medicine, University of Bristol, Bristol BS2 8HW, United
Kingdom. E-mail [email protected]© 2009 American Heart Association, Inc.
Arterioscler Thromb Vasc Biol is available at http://atvb.ahajournals.org DOI: 10.1161/ATVBAHA.109.200154
1 by on May 18, 2011 atvb.ahajournals.orgDownloaded from
tion more prominently affected the osteoblastic niche becauseof the generation of a steeper perfusion gradient across themarrow. Inhibition of oxidative stress prevented BM mi-croangiopathy, hypoperfusion, and hematopoietic celldepletion.
Materials and MethodsA detailed, expanded Materials Methods section is available (avail-able online at http://atvb.ahajournals.org).
Animal ProceduresExperiments were performed in accordance with the Guide for theCare and Use of Laboratory Animals (the Institute of LaboratoryAnimal Resources, 1996) and with approval of the British HomeOffice. Type 1 diabetes (T1D) was induced in male CD1 mice(Charles River) by streptozotocin.10 Age-matched male CD1 miceinjected with the vehicle of streptozotocin served as controls.Diabetes was assessed by measurement of glycemia at fast andglycosuria.
At 4 weeks from diabetes induction, T1D subgroups were ran-domly assigned to receive benfotiamine (BFT; 70 mg/kg bodyweight per day) or vehicle (1 mmol/L HCl) in drinking water for 24weeks. Nondiabetic age-matched vehicle-treated male mice servedas controls.
Measurement of Marrow Blood FlowBlood flow was assessed by fluorescent microspheres.
Bone Fixation, Decalcification, and SectioningBones were cleaned from muscle and connective tissue, fixed,decalcified, and finally processed for paraffin embedding.
Morphometric MeasurementsTotal volume of the marrow was computed from longitudinal andcross BM sections on an Olympus BX40 microscope. Giemsa,Trichrome Masson, and Gomori staining were performed to identifythe structural composition of BM.
ImmunostainingTo determine capillary and sinusoid density, BM sections werestained with Isolectin IB4 (endothelial marker). Capillaries wererecognized as small, regular endothelial structures whose lumen-sizedoes not exceed the diameter of an erythrocyte, whereas sinusoidswere identified as irregular vessels, lined by a thin layer of IsolectinIB4-positive EC, and able to contain several erythrocytes (Supple-mentary Figure I, available online at http://atvb.ahajournals.org).Arterioles were recognized by the vascular smooth muscle cellmarker �-smooth muscle actin and Isolectin IB4. The number ofcapillaries, sinusoids, and arterioles was counted through the entirearea of marrow and expressed as average density per mm2 of tissue.Additionally, VE-cadherin-2 was used to visualize vascular niches.The endosteal surface lined by osteoblasts was visualized by ananti-N-cadherin antibody.11 Mouse c-Kit and Sca-1 antigens wereused to identify hematopoietic PC, and Ter119 was used to identifyerythroid cells. DNA damage was assessed by staining for
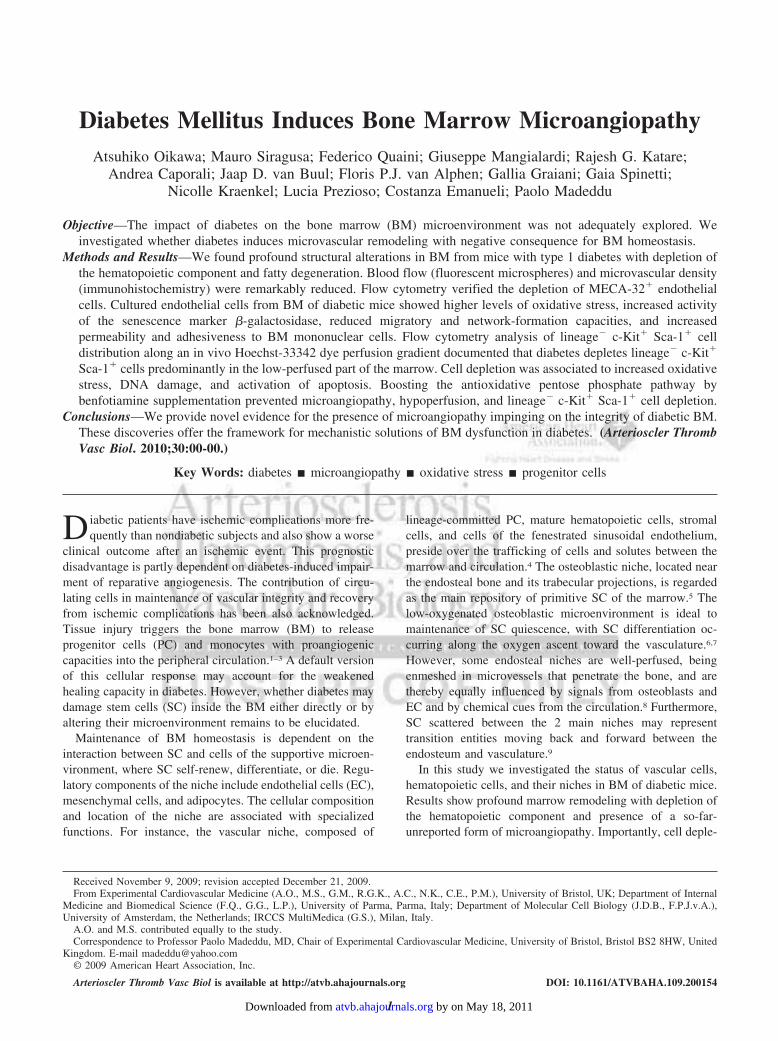
Figure 1. BM remodeling in T1D mice. A,Representative images of hematoxylinand eosin staining of femurs from controland T1D mice (scale bars, 500 �m). Highmagnifications of epiphysis and metaphy-sis show decreased cell density andempty spaces corresponding to fat accu-mulation in the marrow of the T1D mouse(scale bars, 100 �m). Box and whiskersgraphs show minimum to maximum val-ues of marrow volume (B), marrow cellulardensity (C), relative abundance of fat (D),and bone thickness (E). n�7 mice pergroup. *P�0.05 and **P�0.01 vs controls.
2 Arterioscler Thromb Vasc Biol March 2010
by on May 18, 2011 atvb.ahajournals.orgDownloaded from

p-H2AX.12 A list of used antibodies is reported in SupplementaryTable I (available online at http://atvb.ahajournals.org).
Selection of BM ECFreshly harvested BM cells were immunomagnetically depleted ofCD11b-expressing cells to eliminate myeloid/monocyte fraction andcultured on 0.1% gelatin in DMEM 20% fetal bovine serumsupplemented with AcSDKP to avoid SC and fibroblasts contami-nation.13 When confluent, cells were analyzed by flow cytometry and
immunocytochemistry to assess the expression of endothelium-specific markers. Using the same isolation protocol, confluent BMEC were used in functional studies.
Functional and Western Blot Assays on BM ECCell senescence was assessed by measuring �-Gal activityand reactive oxygen species (ROS) using MitoTracker RedCM-H2XROS probe. Migration was assayed using a 24-well trans-well set-up and in vitro network formation on matrigel.14 For static
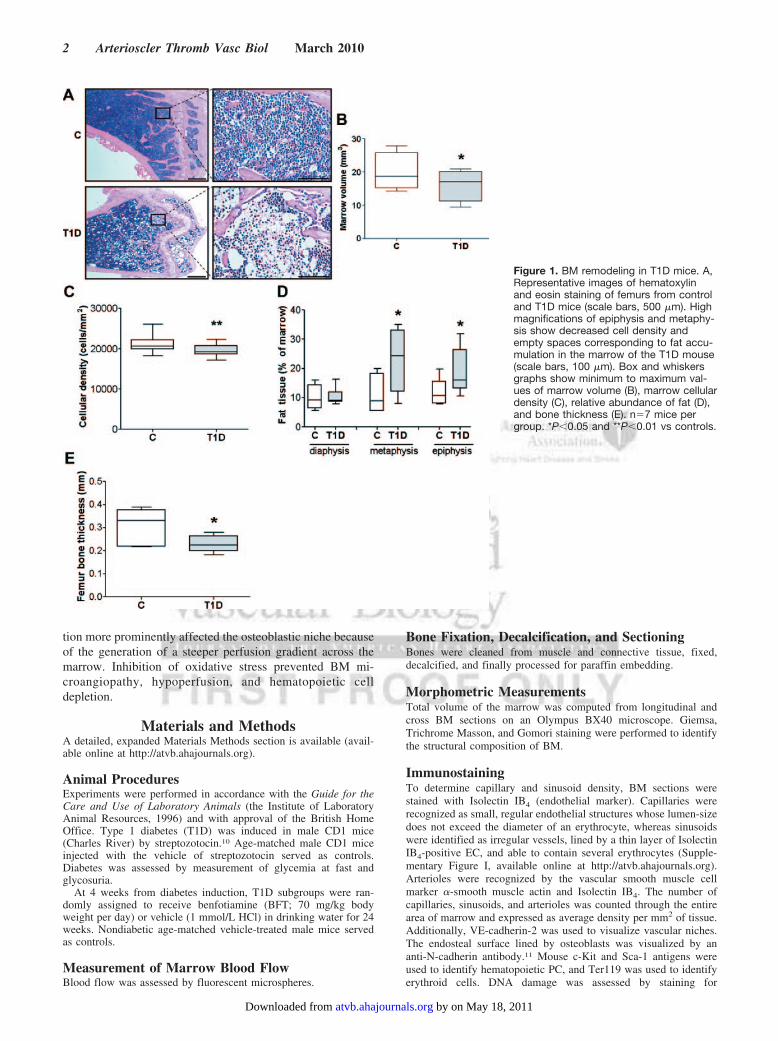
Figure 2. Microangiopathy in BM of T1Dmice. Reduced vascular density anderythrocyte extravasation in T1D BM(A–D). Arrowheads point to vascular struc-tures. Scale bars, 100 �m and 20 �m (Iand II). BM EC depletion and increasedBM EC apoptosis in diabetes (E, F). n�8mice per group. *P�0.05 and **P�0.01 vscontrols.
Oikawa et al Diabetes Damages Marrow Vascular Cells 3
by on May 18, 2011 atvb.ahajournals.orgDownloaded from

adhesion, BM EC were cultured to confluence on 0.1% gelatin-coated glass covers and treated overnight with tumor necrosisfactor-� (10 ng/mL). Next, BM mononuclear cells (MNC) fromcontrols mice were prelabeled with calcein-AM, resulting in greenfluorescence, and allowed to adhere for 30 minutes on BM EC.Samples were then washed and adherent BM MNC were countedusing confocal fluorescent microscopy. To study the influence offlow, confluent BM EC were stimulated as described and mountedonto the microscope stage using a POC mini chamber system(LaCon) and connected to a perfusion pump. Adhesion was visual-ized by phase-contrast microscopy and recorded in real time.Transendothelial electric resistance was evaluated by electric cell-substrate impedance sensing. To study transendothelial migration ofBM MNC prepared from controls or T1D mice, cells were prelabeledwith PKH67 (Sigma) and then left to migrate toward SDF-1 orvehicle through BM EC monolayers on coated transwell filters.Finally, protein expression of phosphorylated VE-cadherin andprotein tyrosine kinase 2 in BM EC was measured by Western blot.
Isolation of Marrow Cells From Trabecular BoneHematopoietic stem cell isolation kit (Millipore UK) was used forisolation of marrow cells from trabecular bone.
Colony-Forming Cell AssayFreshly harvested BM cells from trabecular bone were seeded onmethylcellulose (1�104 cells/dish) and cultured for 14 days beforescoring colonies.
Flow Cytometry AnalysisFreshly harvested BM cells were washed with ice-cold Hankbalanced salt solution containing 0.5% bovine serum albumin and0.02% sodium azide. BM cells were then stained in the samebuffer with anti-lineage mixture (Alexa 488), anti-Sca-1 (PE),anti-CD34 (Alexa 647), and antic-Kit (Alexa 750 or Alexa 647when CD34 was omitted). To recognize EC, BM cells werestained with anti-MECA-32 (Biotin), followed by streptavidin-APC conjugate. To detect apoptosis, BM cells were stained withAnnexin V (FITC). ROS-positive cells were identified usingCM-H2DCFDA. Distribution of BM cells according to BMperfusion gradient was evaluated using the Hoechst 33342 (Hoe)dye.7 Briefly, Hoe was injected through the tail vein and theanimals were euthanized 10 minutes later to collect the hind limbBM. Cells in microenvironments that are well-perfused by bloodare those exposed to the highest concentrations of Hoe, whereas
Figure 3. T1D-induced phenotypic alter-ations of BM EC. Microphotographs(scale bars, 100 �m) and bar graph illus-trating ROS levels (A) and �-Gal activity(B) in BM EC. C, Migration of BM ECtoward SDF-1 and vascular endothelialgrowth factor A. D, Endothelial networkformation by BM EC plated on matrigel(scale bars, 500 �m). Adhesion of BMMNC to nondiabetic (C) BM EC or T1DBM EC under static conditions (E) andunder the influence of shear flow (F).Western blot analysis of VE-cadherin-pY731 and protein tyrosine kinase2-pY402 (G). Transendothelial migrationof BM MNC toward SDF-1 (100 ng/mL)or vehicle (V) using BM EC isolated fromcontrols (H, left) or T1D mice (H, right)seeded on transwell inserts. For eachassay, 3 separate experiments in tripli-cates were averaged. *P�0.05,**P�0.01, and ***P�0.001 vs controls.
4 Arterioscler Thromb Vasc Biol March 2010
by on May 18, 2011 atvb.ahajournals.orgDownloaded from

cells in microenvironments that are less perfused are exposed tolower concentrations of Hoe. Flow cytometry identification ofcells stained high or low with Hoe (Hoehigh and Hoelow, respec-tively) allowed for recognition of cell distribution in high-perfused vs low-perfused regions of BM (Supplementary FigureII). Flow cytometry was performed on FACSCanto II andFACSLSRII (BD Biosciences) equipped with FACSDiva soft-ware (BD Biosciences). Data were represented using “logical”displays. A list of used antibodies is reported in SupplementaryTable II.
StatisticsDifferences between multiple groups were compared by analysis ofvariance, followed by a Holm-Sidak multiple comparison test.Two-group analysis was performed by t test (paired or unpaired asappropriate). P�0.05 was considered significant.
ResultsDiabetes Reduces BM Volume and CellularityFirst, we compared the BM structure of T1D mice at 27 to 30weeks from the onset of diabetes to age-matched nondiabeticcontrols. Diabetes remarkably reduced the hematopoieticfraction and caused fat accumulation and osteopenia (Figure 1).No structural alteration was observed at 10 days after diabetesinduction (data not shown), discounting an acute toxic effectof streptozotocin on the BM.
Microangiopathy in Diabetic BMCumulative vascular density was reduced by 2.9-fold in BMof T1D mice (P�0.001 vs controls). Analysis of perfusedvessels, identified by binding of intracardially injected isolec-tin IB4, revealed a consistent reduction of sinusoids, capillar-ies, and arterioles. Furthermore, the microvasculature ap-peared fragmented with bleeding into the surroundingmarrow (Figure 2A–D).
Flow cytometry analysis of BM single-cell suspensions,using an antibody specific for the EC marker MECA-32,confirmed BM EC depletion and increased BM EC apoptosisin diabetes (Figure 2E, F).
Functional Alterations of Diabetic BM ECBM EC were isolated from T1D and control mice and theirpurity was confirmed by flow cytometry and immunocyto-chemistry (Supplementary Figure III). We found that T1DBM EC express higher levels of mitochondrial ROS (Figure3A) and cell senescence marker �-galactosidase (Figure 3B),are unresponsive to chemoattractant stimuli, like SDF-1 andvascular endothelial growth factor A (Figure 3C), and fail toform network structures on matrigel (Figure 3D). Further-more, we observed an increased adhesion of BM MNC toT1D BM EC under static conditions and after introduction ofshear flow (Figure 3E, F).
Another hallmark of diabetic microvasculature is itsaugmented permeability. Confluent T1D BM EC showed a14%�2% reduction in transendothelial resistance com-pared to controls BM EC (P�0.05), which was abrogatedby the ROS scavenger N-Acetyl-cysteine, pinpointingoxidative stress as a determinant of altered cell– cellinteraction. ROS facilitates transendothelial migration ofBM-derived PC through phosphorylation of VE-cadherinby the redox-sensitive protein tyrosine kinase 2.15,16 Wefound that T1D BM EC have higher phosphorylation levelsof VE-cadherin (at tyrosine 731, the �-catenin bindingsite) and protein tyrosine kinase 2 (at tyrosine 402, whichis the autophosphorylation site for protein tyrosine kinase 2)compared with control BM EC (Figure 3G). Furthermore,T1D BM MNC transmigrate as efficiently as control BMMNC in the presence of nondiabetic endothelium (Figure3H, left). In contrast, nonspecific migration of BM MNCwas enhanced and SDF-1–stimulated migration was abol-
Figure 4. T1D reduces the abundance of SK cells. Microphoto-graphs (A, B) and graphs (C, D) showing SK cells of the osteo-blastic (N-cadherin) and vascular niche (VE-cadherin). An indi-vidual cell* and clusters of cells (arrows) expressing c-Kit (II) andSca-1 (III). Double-positive cells (purple fluorescence, IV). Onecell expresses Sca-1 only (#). Scale bars, 20 �m. n�7 mice pergroup. *P�0.05, **P�0.01, and ***P�0.001 vs controls.
Oikawa et al Diabetes Damages Marrow Vascular Cells 5
by on May 18, 2011 atvb.ahajournals.orgDownloaded from

ished in the presence of diabetic endothelium, thus sug-gesting endothelial barrier dysfunction in T1D (Figure 3H,right).
Diabetes Causes Depletion of BMSca-1posc-Kitpos CellsImmunohistochemical analysis documented the reduction ofSca-1posc-Kitpos (SK) cells in BM of T1D, especially at thelevel of the osteoblastic niche, identified by staining osteo-blast lining with N-cadherin (Figure 4, Supplementary FigureIV). Furthermore, considering longitudinal and coronal sec-tions of BM, we verified that the distance of SK cell clustersof the osteoblastic niche to sinusoids is longer in marrow ofT1D mice (9.0�0.4 cell diameters) compared to that incontrols (5.5�0.4 cell diameters; P�0.001).
Flow cytometry analysis confirmed the effect of diabeteson reducing the relative frequency of Lineage� SK (LSK)cells in marrow of the femoral cavity or trabecular bone, a
porous plexus enriched with SC and osteoblasts (Figure 5A).5
We also found that the subfraction of primitive CD34�LSKcells is remarkably reduced in T1D marrow (3.6�0.7 per100 000 BM cells) compared to controls (27.0�3.0 per100 000 BM cells; P�0.01). Concordantly, colony-forming-unit assays showed a reduced formation of multipotent PCcolonies (colony forming units; GEMM) by trabecular BMcells of T1D mice (Figure 5B). However, the colony-formingactivity of lineage-committed PC was similar in diabetic andcontrol mice, suggesting compensation downstream to mul-tipotent PC.
Diabetes Reduces BM PerfusionT1D mice showed a remarkably reduced BM perfusion at thelevel of femur (0.17�0.01 vs 0.27�0.02 mL/min per gram incontrols; P�0.01) and tibia (0.11�0.01 vs 0.18�0.03 mL/min per gram in controls; P�0.01).
Figure 5. T1D depletes BM LSK cells. A, Flow cytometry analysis of PI� lineage� c-Kit� Sca-1� cells. n�7 mice per group. B, Colonyforming unit (cfu) assay of marrow cells harvested from trabecular bone. n�5 mice per group. *P�0.05 and **P�0.01 vs controls.
6 Arterioscler Thromb Vasc Biol March 2010
by on May 18, 2011 atvb.ahajournals.orgDownloaded from

Predominant LSK Cell Depletion in theHypoperfused Part of the MarrowWe then determined the relative position of LSK cells withrespect to in vivo Hoe dye perfusion gradient.7 Hoe wasinjected intravenously and then the degree of uptake of the
dye by BM cells from different locations was evaluated byflow cytometry. We found that 53% of total LSK cells arelocated in the Hoelow perfusion region of controls BM, butthis fraction decreased to 21% in T1D BM (Figure 6A, centralpanel). Reversing the gating procedure, we analyzed the
Figure 6. Depletion of LSK cells follows perfusion gradient in diabetic BM. A, Representative plots of Hoe uptake by BM cells and per-cent distribution of cells across the perfusion gradient. Abundance of LSK cells (B) and MECA32� EC (C) in each level of perfusion gra-dient. n�7 mice per group. *P�0.05, **P�0.01 vs controls.
Oikawa et al Diabetes Damages Marrow Vascular Cells 7
by on May 18, 2011 atvb.ahajournals.orgDownloaded from

abundance of LSK cells in total cells and lymphomonocytefraction of each Hoe perfusion area (Figure 6B). Resultsconfirmed the selective depletion of LSK cells of the low-perfused zone of T1D BM, whereas the high-perfused zone,which corresponds to the predominant localization of MECA-32pos
BM EC (eg, the vascular niche), was relatively preserved.MECA32� EC were reduced overall in T1D BM (Figure 6C)and, considering their relative distribution, also shifted from thelow to the high Hoe perfusion area (Figure 6A, right).
Increased Oxidative Stress in Diabetic BMNext, we measured levels of oxidative stress in BM cellsusing CM-H2DCFDA, a cell-permeable intracellular ROSindicator. Flow cytometry analysis showed that ROShigh SKcells are greatly increased in T1D BM (Figure 7A). We alsoverified the presence of higher mitochondrial ROS levels inBM MNC from T1D trabecular marrow using MitoTrackerRed CM-H2XROS (Figure 7B).
Excessive oxidative stress reportedly causes DNA damageand reduces the lifespan of BM SC.17 Levels of p-H2AX(Ser139), a marker of double DNA strand breaks, were
2.5-fold higher in T1D BM cells compared to controls (Figure7C). Because H2AX is phosphorylated by ATM, we analyzedATM expression by quantitative polymerase chain reactionand found it 2.6-fold higher in T1D BM cells compared tocontrols. Furthermore, flow cytometry analysis of AnnexinV-positive cells unraveled the increased apoptosis of SK cellsfrom BM of T1D mice (Figure 7D).
Stimulation of Antioxidative Mechanism PreventsMicroangiopathy and LSK Cell DepletionWe found that diabetes reduces the activity of transketolaseand G6PDH, the rate-limiting enzymes of the pentose phos-phate pathway, which represents a fundamental source ofantioxidant equivalents and substrates for DNA synthesis andrepair (Figure 8A, B).
We then asked whether activation of this antioxidativemechanism may protect BM from diabetes-induced damage.Boosting the thiamine-dependent enzyme transketolase byBFT supplementation (Figure 8A) restored G6PDH activity(Figure 8B) and prevented microangiopathy (Figure 8C) andhypoperfusion of diabetic BM (Figure 8D). Furthermore,
Figure 7. Diabetes activatesoxidative stress. A, IntracellularROS assessed byCM-H2DCFDA. *P�0.05 and***P�0.001 vs ROSlow;#P�0.05 and ##P�0.01 vscontrols. B, Mitochondrial ROSassessed by MitoTracker RedCM-H2XROS. C, Levels ofp-H2AX (I, controls; II, T1D.Scale bars, 50 �m). D, AnnexinV� SK cells. n�7 mice pergroup. *P�0.05, **P�0.01, and***P�0.001 vs controls.
8 Arterioscler Thromb Vasc Biol March 2010
by on May 18, 2011 atvb.ahajournals.orgDownloaded from

BFT prevented oxidative stress (Figure 8E) and p-H2AXelevation (Figure 8F) in T1D BM cells. Importantly, theseeffects of BFT were associated to prevention of LSK celldepletion, both in terms of absolute number (Figure 8G) andrelative proportion to total BM cells (Figure 8H), and inhi-bition of apoptosis (Figure 8I). Analysis of cell distributionacross the Hoe perfusion gradient confirmed the protectiveaction of BFT against diabetes-induced LSK cell depletion(Figure 8J, K).
DiscussionHere we show for the first time to our knowledge the presenceof diabetic microangiopathy altering the marrow milieu.Microvascular rarefaction was associated with endothelialdysfunction, encompassing reduced migratory capacity, im-paired angiogenic activity, increased adhesiveness, and endo-
thelial barrier disruption. Importantly, these defects wereobserved after culturing diabetic BM EC in normal glucose,in line with the recent demonstration of epigenetic changescaused by transient hyperglycemia.18
Previous studies have documented the important role of theBM endothelium in maintenance of marrow homeostasisthrough paracrine and physical interaction with other cells ofthe marrow.19,20 Another important function of BM vascula-ture is to deliver nutrients and oxygen to marrow cells. Thepeculiar distribution of microvasculature creates differen-tially perfused environments across the marrow. The mostprimitive stem cells are believed to reside in the osteoblasticniche at the lowest end of the physiological perfusiongradient, protected from oxidative stress.6,7 However, recentstudies demonstrated that a large fraction of endosteal stemcells is enmeshed in vessel networks.21 In diabetic BM, the
Figure 8. BFT preventsmicroangiopathy. Effect of BFTon transketolase (A) andG6PDH activity (B), sinusoiddensity (C), blood flow (D),ROS (E), and p-H2AX in BMMNC (F). BFT preventsdiabetes-induced depletion ofLSK cells, assessed as abso-lute number (G) or percent oftotal BM cells (H), and reducesapoptosis (I). Bar graphs rep-resent the percent of LSK cellsin total BM cells (J) orlymphomonocyte (K) acrossthe Hoe perfusion gradient.n�7 mice per group. *P�0.05,**P�0.01, and ***P�0.001 vscontrols; #P�0.05, ##P�0.01,and ###P�0.001 vs vehicle.
Oikawa et al Diabetes Damages Marrow Vascular Cells 9
by on May 18, 2011 atvb.ahajournals.orgDownloaded from

ongoing microvascular rarefaction inevitably alters the path-length for oxygen and nutrient diffusion, and, as a conse-quence, an increasing fraction of marrow becomes criticallyhypoperfused and secluded from the influence of the vascularniche. Our results indicate that LSK cells of the osteoblasticniche can barely survive in such a harsh environment.However, the BM vasculature can offer an ultimate shelter, asdocumented by the relative conservation of LSK cells in theperivascular space. To the best of our knowledge, the onlyprecedent for marrow cell depletion in the hypoxic microen-vironment, often identified with the osteoblastic niche, isrepresented by the hematopoietic decline described in agingrodents.6 The model of accelerated senescence fits well withdiabetic BM remodeling, because in both conditions fataccumulation occurs along with osteopenia. The mechanismthat underpins aging-induced and diabetes-induced increasesin adipocyte abundance remains unknown. Fat accumulationcould serve not only to fill the empty marrow, pushingmarrow cells toward the vasculature, but also to participate inthe ongoing diabetic remodeling by secreting paracrine fac-tors and proinflammatory cytokines.22 Of note, a similarremodeling was observed in obese leptin-receptor mutantmice, a model of insulin-resistant type 2 diabetes (P. Mad-eddu, unpublished observations, 2009).
The physiological gradient of ROS acts as a signalingmechanism governing functional compartmentalization ofstem cells. Those precious cells, necessary for regenerationof almost all the rest of the whole organism, reside in the“low-risk zone,” ideal for maintenance of quiescence. Thefunction of the ROShigh zone adjacent to the marrowvasculature instead is to facilitate stem cell maturation.6
Under pathological conditions, however, excessive pro-duction of ROS might endanger the viability of stem cells.Genetically modified mice, lacking essential componentsof the regulatory system that maintain ROS within thephysiological range, show accelerated stem cell senes-cence and progressive bone marrow failure,23–25 replicat-ing the situation observed in mice exposed to the oxidantbuthionine sulfoxime.17 Our data show that an elevation inintracellular ROS infringes on DNA integrity and compro-mises marrow cell function in a model of common humandisease. Different mechanisms might contribute to increas-ing oxidative stress in LSK cells, including critical hypo-perfusion and high glucose, which are both potent activa-tors of ROS generation by mitochondrial complex III,26,27
and to exposure to ROS from other cellular sources. Forinstance, transition metal iron from extravasated erythro-cytes can be a potent source of ROS via the Fentonreaction. Another mechanism consists of the reducedactivity of antioxidative mechanisms, such as the pentosephosphate pathway. In line with the latter, benfotiaminebuffered the diabetes-induced disruptive effect on LSKcells.
The extensive remodeling of bone marrow observed indiabetic mice may not inspire therapeutic optimism. How-ever, previous studies showed that glucose-lowering therapiescan restore progenitor cell function to some extent.28 Simi-larly, in genetically modified animals unable to modulateROS production, antioxidant administration restored the re-
constitutive capacity of hematopoietic stem cells, therebypreventing bone marrow failure.23,24 Our study newly showsthat benfotiamine stimulates antioxidative defense throughactivation of transketolase and protects vascular and LSKcells from oxidative stress and apoptosis.
ConclusionIn conclusion, our results demonstrate the deleterious effectof diabetes on bone marrow homeostasis. Our characteriza-tion of the molecular and cellular signature of diabeticpathology in bone marrow along with successful results ofBFT treatment may lead to beneficial therapies for humandisease. Whether thiamine derivatives may clinically reverseBM failure in diabetes represents the objective of futureinvestigation.
Sources of FundingWellcome Trust (083018/Z/07/Z), BHF (PG/06/096/21325, FS/06/083/21828), and EC-FP7–53861 to P.M.; the Dutch Heart Founda-tion (2005T039) and NWO Veni grant (916.76.053) to J.D.v.B. andF.P.J.v.A.; BIOSCENT FP7-NMP-214539, MIUR grant (AL2YNC),and THEAPPL to F.Q. C.E. holds a BHF Basic Science fellowship(BS/05/01).
DisclosureNone.
References1. Asahara T, Kawamoto A. Endothelial progenitor cells for postnatal vas-
culogenesis. Am J Physiol Cell Physiol. 2004;287:C572–C579.2. Dimmeler S. ATVB in focus: novel mediators and mechanisms in angio-
genesis and vasculogenesis. Arterioscler Thromb Vasc Biol. 2005;25:2245.
3. Fischer C, Schneider M, Carmeliet P. Principles and therapeutic impli-cations of angiogenesis, vasculogenesis and arteriogenesis. Handb ExpPharmacol. 2006:157–212.
4. Jin DK, Shido K, Kopp HG, Petit I, Shmelkov SV, Young LM, HooperAT, Amano H, Avecilla ST, Heissig B, Hattori K, Zhang F, Hicklin DJ,Wu Y, Zhu Z, Dunn A, Salari H, Werb Z, Hackett NR, Crystal RG, LydenD, Rafii S. Cytokine-mediated deployment of SDF-1 induces revascular-ization through recruitment of CXCR4� hemangiocytes. Nat Med. 2006;12:557–567.
5. Calvi LM, Adams GB, Weibrecht KW, Weber JM, Olson DP, KnightMC, Martin RP, Schipani E, Divieti P, Bringhurst FR, Milner LA,Kronenberg HM, Scadden DT. Osteoblastic cells regulate the haemato-poietic stem cell niche. Nature. 2003;425:841–846.
6. Jang YY, Sharkis SJ. A low level of reactive oxygen species selects forprimitive hematopoietic stem cells that may reside in the low-oxygenicniche. Blood. 2007;110:3056–3063.
7. Parmar K, Mauch P, Vergilio JA, Sackstein R, Down JD. Distribution ofhematopoietic stem cells in the bone marrow according to regional hyp-oxia. Proc Natl Acad Sci U S A. 2007;104:5431–5436.
8. Lo Celso C, Fleming HE, Wu JW, Zhao CX, Miake-Lye S, Fujisaki J,Cote D, Rowe DW, Lin CP, Scadden DT. Live-animal tracking ofindividual haematopoietic stem/progenitor cells in their niche. Nature.2009;457:92–96.
9. Kiel MJ, Morrison SJ. Uncertainty in the niches that maintain haemato-poietic stem cells. Nat Rev Immunol. 2008;8:290–301.
10. Gadau S, Emanueli C, Van Linthout S, Graiani G, Todaro M, Meloni M,Campesi I, Invernici G, Spillmann F, Ward K, Madeddu P. Benfotiamineaccelerates the healing of ischaemic diabetic limbs in mice throughprotein kinase B/Akt-mediated potentiation of angiogenesis and inhi-bition of apoptosis. Diabetologia. 2006;49:405–420.
11. Zhang J, Niu C, Ye L, Huang H, He X, Tong WG, Ross J, Haug J,Johnson T, Feng JQ, Harris S, Wiedemann LM, Mishina Y, Li L.Identification of the haematopoietic stem cell niche and control of theniche size. Nature. 2003;425:836–841.
12. Li XM, Hu Z, Jorgenson ML, Wingard JR, Slayton WB. Bone marrowsinusoidal endothelial cells undergo nonapoptotic cell death and are
10 Arterioscler Thromb Vasc Biol March 2010
by on May 18, 2011 atvb.ahajournals.orgDownloaded from

replaced by proliferating sinusoidal cells in situ to maintain the vascularniche following lethal irradiation. Exp Hematol. 2008;36:1143–1156.
13. Wang QR, Wang BH, Huang YH, Dai G, Li WM, Yan Q. Purificationand growth of endothelial progenitor cells from murine bone marrowmononuclear cells. J Cell Biochem. 2008;103:21–29.
14. Krankel N, Katare RG, Siragusa M, Barcelos LS, Campagnolo P, Mang-ialardi G, Fortunato O, Spinetti G, Tran N, Zacharowski K, WojakowskiW, Mroz I, Herman A, Manning Fox JE, MacDonald PE, Schanstra JP,Bascands JL, Ascione R, Angelini G, Emanueli C, Madeddu P. Role ofkinin B2 receptor signaling in the recruitment of circulating progenitorcells with neovascularization potential. Circ Res. 2008;103:1335–1343.
15. van Buul JD, Voermans C, van den Berg V, Anthony EC, Mul FP, vanWetering S, van der Schoot CE, Hordijk PL. Migration of human hema-topoietic progenitor cells across bone marrow endothelium is regulated byvascular endothelial cadherin. J Immunol. 2002;168:588–596.
16. Allingham MJ, van Buul JD, Burridge K. ICAM-1-mediated, Src- andPyk2-dependent vascular endothelial cadherin tyrosine phosphorylation isrequired for leukocyte transendothelial migration. J Immunol. 2007;179:4053–4064.
17. Ito K, Hirao A, Arai F, Takubo K, Matsuoka S, Miyamoto K, Ohmura M,Naka K, Hosokawa K, Ikeda Y, Suda T. Reactive oxygen species actthrough p38 MAPK to limit the lifespan of hematopoietic stem cells. NatMed. 2006;12:446–451.
18. El-Osta A, Brasacchio D, Yao D, Pocai A, Jones PL, Roeder RG, CooperME, Brownlee M. Transient high glucose causes persistent epigeneticchanges and altered gene expression during subsequent normoglycemia.J Exp Med. 2008;205:2409–2417.
19. Avecilla ST, Hattori K, Heissig B, Tejada R, Liao F, Shido K, Jin DK,Dias S, Zhang F, Hartman TE, Hackett NR, Crystal RG, Witte L, HicklinDJ, Bohlen P, Eaton D, Lyden D, de Sauvage F, Rafii S. Chemokine-mediated interaction of hematopoietic progenitors with the bone marrowvascular niche is required for thrombopoiesis. Nat Med. 2004;10:64–71.
20. Levesque JP, Hendy J, Takamatsu Y, Simmons PJ, Bendall LJ. Dis-ruption of the CXCR4/CXCL12 chemotactic interaction during hemato-poietic stem cell mobilization induced by GCSF or cyclophosphamide.J Clin Invest. 2003;111:187–196.
21. Kiel MJ, Yilmaz OH, Iwashita T, Yilmaz OH, Terhorst C, Morrison SJ.SLAM family receptors distinguish hematopoietic stem and progenitorcells and reveal endothelial niches for stem cells. Cell. 2005;121:1109–1121.
22. Naveiras O, Nardi V, Wenzel PL, Hauschka PV, Fahey F, Daley GQ.Bone-marrow adipocytes as negative regulators of the haematopoieticmicroenvironment. Nature. 2009;460:259–263.
23. Tothova Z, Kollipara R, Huntly BJ, Lee BH, Castrillon DH, Cullen DE,McDowell EP, Lazo-Kallanian S, Williams IR, Sears C, Armstrong SA,Passegue E, DePinho RA, Gilliland DG. FoxOs are critical mediators ofhematopoietic stem cell resistance to physiologic oxidative stress. Cell.2007;128:325–339.
24. Ito K, Hirao A, Arai F, Matsuoka S, Takubo K, Hamaguchi I, NomiyamaK, Hosokawa K, Sakurada K, Nakagata N, Ikeda Y, Mak TW, Suda T.Regulation of oxidative stress by ATM is required for self-renewal ofhaematopoietic stem cells. Nature. 2004;431:997–1002.
25. Chen C, Liu Y, Liu R, Ikenoue T, Guan KL, Liu Y, Zheng P. TSC-mTORmaintains quiescence and function of hematopoietic stem cells byrepressing mitochondrial biogenesis and reactive oxygen species. J ExpMed. 2008;205:2397–2408.
26. Du X, Matsumura T, Edelstein D, Rossetti L, Zsengeller Z, Szabo C,Brownlee M. Inhibition of GAPDH activity by poly(ADP-ribose) poly-merase activates three major pathways of hyperglycemic damage inendothelial cells. J Clin Invest. 2003;112:1049–1057.
27. Klimova T, Chandel NS. Mitochondrial complex III regulates hypoxicactivation of HIF. Cell Death Differ. 2008;15:660–666.
28. Fadini GP. An underlying principle for the study of circulating progenitorcells in diabetes and its complications. Diabetologia. 2008;51:1091–1094.
Oikawa et al Diabetes Damages Marrow Vascular Cells 11
by on May 18, 2011 atvb.ahajournals.orgDownloaded from

SUPPLEMENTARY MATERIAL
DETAILED METHODS
Animal procedures - The experiments were performed in accordance with the Guide for the Care and
Use of Laboratory Animals (the Institute of Laboratory Animal Resources, 1996) and with approval of the
British Home Office. Type 1 diabetes (T1D) was induced in male CD1 mice (Charles River) by
streptozotocin (STZ).1 Non diabetic controls consisted in age-matched CD1 male mice injected with the
vehicle of STZ. Measurements of glycemia at fast and glycosuria were performed during follow-up to
confirm the persistence of diabetes.
Benfotiamine (BFT) supplementation - At 4 wk from diabetes induction, T1D mice were randomly
assigned to receive BFT (70mg/kg body weight daily) or vehicle (1mmol/L HCl) in drinking water for 24
wk. Non-diabetic age-matched vehicle-treated mice were studied as a control reference. BFT
concentration in drinking water was modified according to consumption. The effect of diabetes and BFT
treatment on the activity of the thiamine-dependent enzyme transketolase and glucose-6-phosphate
dehydrogenase (G6PDH) was measured in enriched bone marrow (BM) mononuclear cells (MNCs), as
described.2, 3
Measurement of marrow blood flow (BF) - BF to the femur and tibia BM was assessed by fluorescent
microspheres as reported.4
Bone fixation, decalcification and sectioning - Femoral bones were cleaned from muscle and
connective tissue and fixed with 4% buffered formalin for 24 h at room temperature (RT). Bones were
decalcified in 10% formic acid for 24 h at RT and then kept in PBS and processed for paraffin-embedding.
Paraffin sections of marrow were cut at 3 m thickness for histological analyses.
Morphometric measurements - Total volume of the marrow was computed from longitudinal and cross
BM sections on an Olympus BX40 microscope using an ocular objective provided with a 42 points grid
(Wild Heerbrugg Instruments Inc.), which defines an area of 0.2 mm2. The following parameters were
obtained using Giemsa, Trichrome Masson and Gomori staining:
-Fractional Volume (%) of bone, hematopoietic component, fatty tissue and collagen
-Bone Thickness (m)
Immunofluorescence on marrow and analysis of vascular profiles - Paraffin embedded BM sections
(3m thick) were kept at 60°C for 10 min and deparaffinized in xylene and rehydrated through passages
in alcohol (100% to 70%) and distilled water. Heat-induced antigen retrieval was carried out in 10 mM
sodium citrate buffer (pH 6) for 15 min in a microwave oven. Sections were cooled down to RT, washed
in distilled water and then rinsed in PBS. In order to block unspecific binding of antibodies, samples were
incubated for 30 min with 1% bovine serum albumin (BSA) or 10% goat serum in PBS. For isolectin
staining of endothelial cells (ECs), sections of BM obtained from mice, which received an intracardiac
(i.c.) injection of biotin-conjugated isolectin IB4 20 min before sacrifice, were incubated with
streptavidin-AlexaFluor-488 or -AlexaFluor-568 for 1 h at RT. A double staining for Isolectin IB4 and α-
smooth muscle actin (α-SMA) was performed to recognize arterioles, by adding to the above an
additional 2h-incubation step with a monoclonal α-SMA-Cy3 antibody at RT. To recognize erythrocytes,
BM sections were incubated with a rat anti-mouse monoclonal antibody against TER119, followed by
goat anti-rat secondary antibody Alexa-488-conjugated. The antibody identifies also erythroblasts, but the
two cell types can be distinguished because erythroblasts are nucleated whereas erythrocytes are non-
nucleated. Perfused vessels were visualized with Isolectin IB4 as above. In all staining procedures, nuclei
were visualized by DAPI (4’,6-diamidino-2-phenylindole) staining. Slides were finally mounted with
Fluoromount-G mounting medium.
by on May 18, 2011 atvb.ahajournals.orgDownloaded from

Analysis of BM cells by immunofluorescence - In order to reduce non-specific antibody binding, BM
sections were exposed to 10%-20% serum of the species in which secondary antibodies were developed.
Quenching of autofluorescence was achieved by immersion of sections in an alcoholic solution of Sudan
Black. In addition, each primary antibody solution contained 10% BSA and 10% specific serum. Sections
were incubated with isotype-matched controls or specific primary antibodies to detect marrow
hematopoietic cells (CD45) and Sca-1pos
c-Kitpos
(SK) cells. The reactions were visualized by Fluorescein
isothiocyanate-IgG (FITC), tetramethyl rhodamine isothiocyanate -IgG (TRITC) and Cy5-IgG conjugated
secondary antibodies to allow the simultaneous detection of multiple antigens. Nuclei were stained by
DAPI. The analysis of putative SC niches was conducted on the entire femur. Moreover, LK cells were
found as individual elements or nested in clusters of two or more (range 2 to 5; average 2.3 cell/cluster)
closely adjacent cells, predominantly located in the epiphysis and metaphysis. This cellular configuration,
strongly suggestive of a niche, was confirmed by the documentation of the engagement of LK cells with
the osteoblastic and vascular aspects of the BM through the adherens junctions, N-cadherin and VE-
cadherin, respectively. A list of Abs and reagents used for immunohistochemistry can be found in the
Supplementary Table I.
Detection of DNA double-strand breaks - DNA damage was assessed by immunohistochemistry
exposing BM sections to anti-phospho histone 2AX (p-H2AX) antibody followed by biotin/strepatavidin
reaction and visualized by DAB precipitation (ABC system).5 Nuclei were counterstained with
hematoxylin.
Culture and characterization of BMECs used for functional studies - Freshly harvested BM cells
were immunomagnetically depleted of CD11b-expressing cells to eliminate myeloid/monocyte fraction
and cultured on 0.1% gelatin in DMEM 20% FBS, supplemented with tetrapeptide Ac-Ser-Asp-Lys-Pro
(AcSDKP) in order to avoid SCs and fibroblasts contamination.6 Cells were then analyzed by flow
cytometry and immunocytochemistry to assess the percentage of cells expressing endothelium-specific
markers (vWF, VCAM-1 or NOS3, isolectin IB4, DiI-acLDL).
FACS Sorting of BMECs- BM cells were stained with anti MECA-32 (Biotin) followed by Streptavidin-
PE and anti CD45 (APC). Sorting was performed on FACS vantage cell sorter (BD Biosciences). MECA-
32pos
CD45neg
BMECs were separated on a FACS vantage cell sorter using the following gating procedure.
Total BM cells were first gated for propidium iodide (P1, PIneg
) and then PIneg
BM cells were divided in
MECA-32pos
CD45neg
(P2) and MECA-32pos
CD45pos
(P3). Only MECA-32pos
CD45neg
BMECs were used.
Immunofluorescence on BMECs - BMECs were seeded on 8-well chamber slides coated with 0.1%
gelatin at a density of 4x10⁴
cells/well and incubated overnight in a humidified incubator at 37°C in an
atmosphere containing 5% CO2 to allow adhesion. Cells were then fixed in 2% paraformaldehyde in PBS
for 15 min and incubated in 5% normal serum of the same species as secondary antibody diluted in 0.1%
TritonX-100/PBS for 30 min at RT. Cells were then incubated overnight with primary antibodies against
vWF, VCAM-1 or NOS3, followed by AlexaFluor 488-conjugated goat anti-rabbit secondary antibodies
for 1 h at RT, in the dark. Matched isotype controls were included in each staining to check for unspecific
binding of primary antibodies. After staining for vWF, cells were incubated in 1% BSA/PBS for 20 min
at RT and then exposed to biotin-conjugated isolectin IB4 for 1 h at 37°C, followed by Alexa Fluor 568-
conjugated streptavidin for 1 h at RT. Slides were mounted with fluorescence mounting medium
containing DAPI and analyzed using an Olympus BX40 fluorescence microscope.
Adherent cells growing in 8-well slides were also assessed for the uptake of 1,1-dioctadecyl-3,3,3',3'-
tetra-methyl-indo-carbo-cyanine labelled acetylated low density lipoproteins (DiI-acLDL) and binding of
FITC-labelled isolectin IB4 and then mounted as described above.
Detection of senescent BMECs by staining for -Galactosidase (-Gal) activity - BMECs were seeded
on 8-well chamber slides as described above and assessed for -Gal activity at pH 6 using Senescence
Detection Kit (Calbiochem) according to the manufacturer’s instructions. Briefly, cells were fixed in
by on May 18, 2011 atvb.ahajournals.orgDownloaded from

fixative solution and then incubated with a staining solution containing 1 mg/mL X-gal in N-N-
dimethylformamide at 37°C overnight. Cells were then observed under a day light microscope for
development of blue colour. Five microphotographs/well were taken at x200 magnification and the
number of positive cells per microphotograph (tot area: 0.2 mm2) was quantified and expressed as
percentage of the total number of cells in the same microphotograph. Three separate experiments in
triplicates were analyzed and averaged.
MitoTracker assay - BMECs were seeded on 8-well chamber slides as described above and then
assessed for reactive oxygen species (ROS) production using MitoTracker® Red CM-H2XROS, a
mitochondria-selective
ROS scavenger and fluorescent probe (Molecular Probes), according to
manufacturer’s instruction. MitoTracker® Red CM-H2XROS is a reduced, non-fluorescent compound
that fluoresces when oxidized by ROS after uptake into the mitochondrial matrix of respiring cells.
7
Fluorescent images were captured using an Olympus BX40 fluorescence microscope applying identical
exposure settings to all conditions. Fluorescence intensity was evaluated by Image Pro® Plus software.
Three separate experiments in triplicates were analysed and averaged.
Migration assay - Migration was assayed using a 24-well transwell setup (Costar) using polycarbonate
filters (membrane pore size: 8 μm).8 Three separate experiments in triplicates were analysed and averaged.
Matrigel assay - Cultured BMECs (3x10⁴ cells in a total volume of 100L EBM-2) were added on top of
100L gelified, growth-factors-enriched matrigel. After 16 h at 37°C, gels were washed gently with PBS
and fixed with 2% paraformaldehyde, followed by H&E staining (to visualize cells) and then mounting
with glycerol. Five random view fields were photographed for each sample (40X magnification) in phase
contrast (Olympus). A number of n=3 samples per group was analyzed in triplicate.8
Static adhesion of BMMNCs to BMECs - Non diabetic (C) or T1D murine BMECs were cultured to
confluence on 0.1% gelatin-coated glass covers and treated with TNF- (10 ng/mL) overnight. Next, C
murine BMMNCs, pre-labelled with Calcein-AM, resulting in green-fluorescence, were allowed to adhere
for 30 min on BMECs. Samples were then washed 5 times carefully with PBS supplemented with 1mM
CaCl2 and 1mM MgCl2. Samples were fixed, permeabilized and stained for F-actin using fluorescent
phalloidin. Adherent BMMNCs were counted in 5 random view-fields using confocal fluorescent
microscopy.9
Adhesion of BMMNCs to BMECs-under flow - C or T1D BMECs were cultured to confluence and
stimulated with TNF-, as described above. Next, cells were mounted onto the microscope stage using a
POC-mini chamber system (LaCon) and connected to a perfusion pump. Using low physiological flow
conditions, 1x10⁶ C BMMNCs per mL were perfused over the BMECs. Next, fluid-flow was increased
every 5 min. Adhesion was visualized by phase-contrast microscopy and recorded in real-time. From each
experiment, 5 view-fields were analyzed.9
Electric Cell-substrate Impedance Sensing (ECIS) - C or T1D BMECs were added at 1x10⁴ cells per
well (0.8 cm2) to a 0.1% gelatin-coated electrode-array, containing 10 gold-electrodes per array, and
grown to confluence. After the electrode-check of the array and the basal transendothelial electrical
resistance (TER) of the endothelial monolayer, N-Acetyl cysteine (N-Ac) or DMSO (vehicle) were added
and TER was measured on line at 37C at 5% CO2 with the ECIS-Model-100 Controller from Applied
BioPhysics, Inc. (Troy, NY, USA). After 8 h, data were collected and changes in resistance of endothelial
monolayer were analyzed as described previously.10
Western blotting of BMECs - BMECs were grown to confluence on 0.1% gelatin-coated dishes (50 cm
2),
washed twice gently with ice-cold Ca
2+- and Mg
2+-containing PBS, and lysed
in lysis buffer (25 mM Tris,
150 mM NaCl, 10 mM MgCl2, 2mM EDTA, 0.02% (w/v) SDS, 0.2% (w/v) deoxycholate, 1% Nonidet
P-
40, 0.5 mM orthovanadate with the addition of fresh protease-inhibitor-mixture tablets (Roche Applied
by on May 18, 2011 atvb.ahajournals.orgDownloaded from

Science). After 30 min on ice, cell lysates were collected and the supernatant was separated from the
insoluble fraction by centrifugation (14,000 g, 10 min at 4°C). Supernatant was diluted with boiling 2x
SDS-sample buffer containing 4% 2-mercaptoethanol (Bio-Rad). The samples were analyzed by SDS-
PAGE. Proteins were transferred to 0.45-µm nitrocellulose and the blots were blocked with 5% BSA in
Tris-buffered saline with Tween-20 (TBS-T) for 1 h and subsequently incubated at RT with
phospho-
specific antibodies against VE-cadherin-Y731 and Pyk2-Y402 and with a monoclonal antibody against
Tubulin, followed by incubation with goat--rabbit-IgG-horseradish peroxidase for 1 h at RT. Between
the various incubation steps, the blots were washed 5 times with TBS-T and finally developed with an
enhanced chemiluminescence detection system (Amersham Biosciences).
Trans-endothelial migration (TEM) - BMMNC TEM was performed using transwell cell culture inserts
equipped with 3µm pore size filters (BD Biosciences).11
Inserts were pre-coated with 0.5 μg/mL
fibronectin in 0.1% gelatin. BMECs were seeded on coated transwell filters (8x10⁴/well) and cultured for
24 h before the experiment was performed in a humidified atmosphere (37°C, 5% CO2). SDF-1
(100ng/mL) or vehicle alone was added to the lower compartment of the transwell system in DMEM
containing 0.1% BSA. Freshly isolated BMMNCs from C and T1D mice were labeled with PKH67
(Green Fluorescent Cell marker) following the manufacturer´s instruction, re-suspended at 106
cell/mL
and then added to the top compartment (3x10⁵ cells per well in 300 µL). After 24 h incubation at 37°C,
non-migrated cells on the upper side of the membrane were removed by scraping, all inserts were fixed
for 10 min in methanol, and mounted on slides using Vectashield with DAPI. The number of fluorescent
BMMNCs transmigrated to the lower side of the membrane was quantified in duplicates. Five random
viewfields at x200 magnification were captured and the number of PKH67-positive BMMNCs was
determined. In addition, green fluorescent PKH67-stained BMMNCs migrated to the lower chamber were
counted using flow cytometry. Two separate experiments in triplicates were analyzed and averaged.
Isolation of marrow cells from trabecular bone - Hematopoietic Stem Cell Isolation Kit (Millipore
UK) was used for isolation of marrow cells from trabecular bone of femurs and tibia. Briefly, the marrow-
flushed bones were ground thoroughly with pestle in PBS with 2% FBS so that the bones were opened
and broken into small fragments. The bone fragments were washed twice and filtered through a 40µm
nylon cell strainer. Bone fragments were incubated in 2 mL of enzyme solution (3 mg/mL Collagenase I
& 4 mg/mL Dispase II) for 5 min at 37°C in an orbital shaker at 750 rpm. The bone fragments were then
washed with PBS containing 2% FBS and filtered through a 40 µm nylon cell strainer. All collected cells
were washed by centrifuging at 400g for 5 min at 4°C, resuspended in PBS containing 2% FBS, filtered
through a 40 µm nylon cell strainer and pooled.
Mouse Colony-Forming Cell Assays - BM cells harvested from trabecular bone were washed with PBS
containing 2 % FBS and plated in 35mm tissue culture dishes in 1.1mL Methylucellulose-Based Medium
(StemCell Technologies) according to manufacturer’s instructions. Cells were seeded at 1x10⁴ cells/dish
and cultured for 14d before scoring colonies. Colonies were distinguished as colony forming unit-
erythroid (CFU-E), burst forming unit-erythroid (BFU-E), colony forming unit-granulocyte (CFU-G),
colony forming unit-macrophage (CFU-M), colony forming unit-granulocyte-macrophage (CFC-GM), or
colony forming unit-granulocyte-erythroid-macrophage-megakaryocyte (CFC-GEMM) based on their
morphological appearance.
Flow cytometry analysis of freshly isolated total BM cells - Total BM cells were washed with ice-cold
Hank’s balanced salt solution containing 0.5% bovine serum albumin and 0.02% sodium azide. BM cells
were then stained in the same buffer with anti Lineage Mixture (Alexa 488), anti Sca-1 (PE) and anti c-
Kit (Alexa 647). To recognize ECs, BM cells were stained with anti-MECA-32 (Biotin) followed by
Streptavidin-APC. After washing, stained cells were examined by flow cytometry on FACSCanto II (BD
Biosciences) equipped with FACSDiva software (BD Biosciences). Data were represented using
“Logical” displays, as previously reported.12
by on May 18, 2011 atvb.ahajournals.orgDownloaded from

Annexin V staining: To detect apoptosis, BM cells were stained with Annexin V (FITC) together with
PI. Total BM cells (1x10⁶) were resuspended in Annexin V binding buffer (BD Biosciences) prior to
adding 2.5g Annexin V and were incubated for 30 min at 37°C in the dark.
ROS staining: Total BM cells were incubated with 100 nM CM-H2DCFDA for 30 min at 37°C in the
dark. Cells were washed and resuspended in PBS, containing 1mM CaCl2, 0.5mM MgCl
2, 0.1% (Wt/vol)
D-glucose, and 50M L-arginine.
Flow cytometry analysis of BMEC cultures - Adherent cells were detached by trypsinization and
washed in PBS. The staining method described above was carried out. A list of the primary and secondary
Abs can be found in the Supplementary Table II.
Measurement of in vivo BM cell perfusion using Hoechst gradient - The Hoe dye perfusion gradient in
murine BM was evaluated as described previously.13
Briefly, mice were injected with Hoechst 33342 dye
(Hoe, Sigma-Aldrich, 0.8mg/mouse, via the tail vein) and then sacrificed exactly 10 min after Hoe
injection, a time sufficient to avoid that cells extrude the dye.13
Marrow cells were immediately flushed
out from bones, filtered and suspended in cold Hank’s balanced salt solution (HBSS) containing 2 % FBS
and 10 mM Hepes buffer. The dual emission wavelengths were assessed on a logarithmic scale by
FACSLSRII (BD Biosciences).
Real-time quantitative RT-PCR (qPCR) - Total RNA was isolated from murine BMMNCs (RNeasy,
Qiagen) and RNA quality confirmed using the RNA Nano LabChip in a bioanalyzer (Agilent). RNA was
reverse transcribed (Sensiscript reverse transcriptase, Qiagen) and quantitative PCR was performed in a
LightCycler (Roche). Primers for PCR amplification for ATM gene are: forward -
GATCTGCTCATTTGCTGCCG; reverse - GTGTGGTGGCTGATACATTTGAT. 18SrRNA was
used as housekeeping gene. The Ct obtained was used to find the gene relative expression according to
the formula: relative expression=2- C
t, where Ct= Ct of those genes in experimental groups— Ct of
the same genes in control group. The analyses were performed on at least 4 samples per time and repeated
three times.
Supplemental references
1. Gadau S, Emanueli C, Van Linthout S, Graiani G, Todaro M, Meloni M, Campesi I, Invernici G,
Spillmann F, Ward K, Madeddu P. Benfotiamine accelerates the healing of ischaemic diabetic
limbs in mice through protein kinase B/Akt-mediated potentiation of angiogenesis and inhibition
of apoptosis. Diabetologia. 2006;49:405-420.
2. Hammes HP, Du X, Edelstein D, Taguchi T, Matsumura T, Ju Q, Lin J, Bierhaus A, Nawroth P,
Hannak D, Neumaier M, Bergfeld R, Giardino I, Brownlee M. Benfotiamine blocks three major
pathways of hyperglycemic damage and prevents experimental diabetic retinopathy. Nat Med.
2003;9:294-299.
3. Kanji MI, Toews ML, Carper WR. Glucose-6-phosphate dehydrogenase. Purification and partial
characterization. J Biol Chem. 1976;251:2255-2257.
4. Smith RS, Jr., Gao L, Chao L, Chao J. Tissue kallikrein and kinin infusion promotes
neovascularization in limb ischemia. Biol Chem. 2008;389:725-730.
5. Li XM, Hu Z, Jorgenson ML, Wingard JR, Slayton WB. Bone marrow sinusoidal endothelial
cells undergo nonapoptotic cell death and are replaced by proliferating sinusoidal cells in situ to
maintain the vascular niche following lethal irradiation. Exp Hematol. 2008;36:1143-1156.
6. Wang QR, Wang BH, Huang YH, Dai G, Li WM, Yan Q. Purification and growth of endothelial
progenitor cells from murine bone marrow mononuclear cells. J Cell Biochem. 2008;103:21-29.
7. Bailey SR, Mitra S, Flavahan S, Flavahan NA. Reactive oxygen species from smooth muscle
mitochondria initiate cold-induced constriction of cutaneous arteries. Am J Physiol Heart Circ
Physiol. 2005;289:H243-250.
by on May 18, 2011 atvb.ahajournals.orgDownloaded from

8. Krankel N, Katare RG, Siragusa M, Barcelos LS, Campagnolo P, Mangialardi G, Fortunato O,
Spinetti G, Tran N, Zacharowski K, Wojakowski W, Mroz I, Herman A, Manning Fox JE,
MacDonald PE, Schanstra JP, Bascands JL, Ascione R, Angelini G, Emanueli C, Madeddu P.
Role of kinin B2 receptor signaling in the recruitment of circulating progenitor cells with
neovascularization potential. Circ Res. 2008;103:1335-1343.
9. van Buul JD, Voermans C, van Gelderen J, Anthony EC, van der Schoot CE, Hordijk PL.
Leukocyte-endothelium interaction promotes SDF-1-dependent polarization of CXCR4. J Biol
Chem. 2003;278:30302-30310.
10. Lorenowicz MJ, Fernandez-Borja M, Kooistra MR, Bos JL, Hordijk PL. PKA and Epac1 regulate
endothelial integrity and migration through parallel and independent pathways. Eur J Cell Biol.
2008;87:779-792.
11. van Buul JD, Kanters E, Hordijk PL. Endothelial signaling by Ig-like cell adhesion molecules.
Arterioscler Thromb Vasc Biol. 2007;27:1870-1876.
12. Herzenberg LA, Tung J, Moore WA, Herzenberg LA, Parks DR. Interpreting flow cytometry
data: a guide for the perplexed. Nat Immunol. 2006;7:681-685.
13. Parmar K, Mauch P, Vergilio JA, Sackstein R, Down JD. Distribution of hematopoietic stem cells
in the bone marrow according to regional hypoxia. Proc Natl Acad Sci U S A. 2007;104:5431-
5436.
by on May 18, 2011 atvb.ahajournals.orgDownloaded from

Supplemental Tables and Figures with Legends
Supplementary Table I: Antibodies and reagents.
Antibodies/reagents Label Supplier
Isolectin IB4 ( i.c. injected) biotin-conjugated Invitrogen
Isolectin IB4 FITC Vector Laboratories
vWF unconjugated Dako
-SMA Cy-3 Sigma-Aldrich
VCAM-1 unconjugated S.C. Biotechnology
NOS3 unconjugated S.C. Biotechnology
DiI-acLDL Invitrogen
c-Kit unconjugated R&D
Sca-1 unconjugated Cedarlane
CD45 unconjugated R&D and Abcam
TER119 unconjugated Lifespan Bioscience
VE-cadherin-2 unconjugated S.C. Biotechnology
N-cadherin unconjugated Calbiochem
CD34 unconjugated Novocastra
Anti-pH2AX unconjugated Bethyl
Streptavidin AlexaFluor-488 or 568 Invitrogen
Goat anti-rabbit IgG AlexaFluor-488 or 568 Invitrogen
donkey anti-goat FITC or TRITC Jakson Labs
goat anti-rat AlexaFluor-488 Invitrogen
donkey anti-rabbit FITC Jakson Labs
donkey anti-rat Cy5 Jakson Labs
donkey anti-mouse Cy5 Jakson Labs
Vectashield with DAPI Vector Laboratories
DAPI Sigma-Aldrich
Fluoromount-G SouthernBiotech
Fibronectin Sigma-Aldrich
SDF-1 R&D Systems
VEGF-A StemCells Technologies
Matrigel BD Bioscience
Glycerol Sigma-Aldrich
Calcein-AM Invitrogen
Phalloidin Invitrogen
VE-cadherin-Y731 Biosource
by on May 18, 2011 atvb.ahajournals.orgDownloaded from

Pyk2-Y402 Biosource
Tubulin Sigma-Aldrich
Gelatin Sigma-Aldrich
PKH67 Sigma-Aldrich
Fluorescent microspheres Molecular Probes
by on May 18, 2011 atvb.ahajournals.orgDownloaded from

Supplementary Table II: Flow cytometry antibodies
Antibodies/reagents Label Supplier
anti-Lineage Mixture Alexa 488 Caltag
anti-Ly-6A/E (Sca-1) PE Caltag
anti-CD117 (c-Kit); Alexa 647 or Alexa 750 Caltag
anti-pan-endothelial cell antigen
(MECA-32) Biotin BD Biosciences
Streptavidin APC BD Biosciences
Streptavidin PE BD Biosciences
Annexin V FITC BD Biosciences
CM-H2DCFDA FITC Invitrogen
anti-CD90.2 FITC BD Biosciences
anti-CD106 (VCAM-1) FITC BD Biosciences
anti-CD14 PE BD Biosciences
anti-CD105 (Endoglin) PE BD Biosciences
anti-CD45 APC BD Biosciences
anti-CD144 Alexa 647 eBioscience
anti-CD11b APC-Cy7 BD Biosciences
Anti-CD34 Alexa 647 BD Biosciences
by on May 18, 2011 atvb.ahajournals.orgDownloaded from

Supplementary Figure I. Immunofluorescence identification of marrow microvasculature. (a)
Microphotographs showing vascular sinusoids (S, panel i and ii) and capillaries (C, panel i) stained red
with Isolectin IB4 (b) Microphotographs showing marrow arterioles, whose endothelial cell layer is
stained green with Isolectin IB4 and smooth muscle cell layer is stained red with α-SMA.
by on May 18, 2011 atvb.ahajournals.orgDownloaded from

Supplementary Figure II. Distribution of BM cells across the Hoe gradient. Hoe was injected through the
tail vein and the animals sacrificed 10min later to collect the hindlimb BM. Cells in microenvironments that
are well perfused by blood are those exposed to the highest concentrations of Hoe, whereas cells in
microenvironments that are less perfused are exposed to much lower concentrations of Hoe. Flow cytometry
identification of LSK cells staining with high (Hoehigh
) or low levels of Hoe (Hoelow
) allowed for recognition
of hematopoietic cell abundance in high-perfused vs. low-perfused regions of BM. Sinusoid (S),
hematopoietic stem cell (HSC), osteoblast (OB), osteoclast (OC).
by on May 18, 2011 atvb.ahajournals.orgDownloaded from

Supplementary Figure III. Isolation and characterization of ECs from murine BM. Freshly collected
BM cells were either FACS-sorted to isolate MECA-32pos
CD45neg
cells (a) or depleted of CD11b cells by
immunomagnetic columns to eliminate the myeloid/monocyte fraction and then cultured in DMEM 10%
FBS in the presence of AcSDKP to avoid SC and fibroblast contamination. The purity of culture-isolated
cells was analysed by flow cytometry (b). Isolated BMECs were also characterized using
immunofluorescence microscopy analysis of endothelial markers (c). Scale bars: 50m.
by on May 18, 2011 atvb.ahajournals.orgDownloaded from

Supplementary Figure IV. Diabetes alters the abundance of SK cells. (a) Immunofluorescence
staining of c-Kitpos
(green) and CD45pos
(red) cells in BM: arrowheads point to c-Kitpos
cells and arrows
point to c-Kit/CD45 double positive cells. c-Kitpos
are randomly distributed in the marrow (i) or clustered
in groups (ii). (iii) Localization of c-Kitpos
cell clusters (green) in the osteoblastic (upper panel) and
vascular niche (lower panel). High-magnification inserts show clusters of c-Kitpos
cells in contact with the
paratrabecular bone or a vWF-labeled sinusoid (S, red). Megakaryocytes are also stained in red by vWF.
(iv) Immunofluorescence staining of Sca-1pos
(green, arrowhead) and vWFpos
(red). (v,vi) Arrows indicate
Sca-1 (green) c-Kit (red) double positive cells (SK, yellow fluorescence); arrowheads indicate Sca-1neg
c-
Kitpos
cells. About 80% of c-Kitpos
cells coexpress Sca-1, whereas 60% of Sca-1pos
cells coexpress c-Kit.
Scale bars: i,iii: 50 m; ii,iv,v,vi: 20 m. (b) Bar graphs show the distribution of SK cells at the level of
epiphysis, metaphysis and diaphysis Values are mean±s.e.m.; n=7 per group. *P<0.05 and ***P<0.001
vs. C.
by on May 18, 2011 atvb.ahajournals.orgDownloaded from


