Embed Size (px)
Citation preview
13
Review of the Relationship Between Renal and Retinal Microangiopathy in Type 1
Diabetes Mellitus Patients
Pedro Romero-Aroca1 , Juan Fernández-Ballart2, Nuria Soler1, Marc Baget-Bernaldiz1 and Isabel Mendez-Marin1
1Department of Ophthalmology, University Hospital Sant Joan, Institut de Investigació Sanitaria Pere Virgili (IISPV), Reus,
2Epidemiology, Department of Basic Sciences, University Rovira i Virgili (Tarragona), Spain
1. Introduction
Diabetes mellitus is a group of metabolic disorders of carbohydrate metabolism in which glucose is underutilized, producing hyperglycemia. The disease is classified into several categories. The revised classification, published in 1997 (ADA, 1997; The Expert Comitee on the Diagnosis and Classification of Diabetes mellitus, 2000), defines Type 1 diabetes mellitus (formerly known as the insulin-dependent diabetes mellitus or juvenile-onset diabetes mellitus) as a disorder caused by autoimmune destruction of pancreatic h-cells, rendering the pancreas unable to synthesize and secrete insulin. In 85–90% of cases, antibodies appear against pancreatic h-cells (ICA), acting as anti-insulin (IAA), or others such as GAD, IA-2 and IA-2h (Geiss et al 1997). The latter complications of diabetes mellitus include both microvascular complications (predominantly retinopathy, nephropathy and neuropathy) and macrovascular complications, particularly stroke and coronary artery disease. Together, these make diabetes the seventh most common cause of death in the developed world (Geiss et al 1997). The major microvascular complications, retinopathy and nephropathy, are the more important causes of blindness and end-stage renal disease in Europe. There are few similarities in the coexistence of DR and DN being both as microvascular disease and microscopically both have capillary basement membrane thickening. However, capillary closure is apparent in the retina and kidney after sufficient exposure to disease with duration. The pathophysiology of DN and DR are more or less similar, which commence with increase in vascular permeability. The selective increase in permeability to albumin in early DN is caused by loss of polarity across the glomerular basement membrane (Myers et al, 1982) and the disease mechanism in the eye is probably a breakdown of tight junctions between cells. The onset of proteinuria and proliferative retinopathy are both related to previous poor glycemic control, duration of diabetes and hypertension. The detection of retinopathy is easy (by the use of fundus periodical retinographies), but the diagnosis of the early stages of nephropathy needs microalbuminuria to be determined in
Type 1 Diabetes Complications
282
urinalysis. Microalbuminuria has prognostic significance; thus, in 80% of people with Type 1 diabetes mellitus and microalbuminuria, urinary albumin excretion increases at a rate of 10–20% per year, with the development of clinical proteinuria within 10– 15 years. After the development of clinical grade proteinuria (>80%), patients go on to develop decreased glomerular filtration rate and, given enough time, end-stage renal disease (Geiss et al 1997). Several factors appear to influence susceptibility to the microvascular complications of diabetes mellitus, but our knowledge of the role and the importance of these genetic and environmental factors are still incomplete. The most powerful risk factor for microvascular complications was the duration of diabetes, but frequency of both retinopathy and nephropathy was impressively related to the level of plasma glucose at the time of examination. From the recent studies, it is evident that the presence of retinopathy itself may reveal patients at risk for nephropathy (Estacio et al, 1998; El Asrar et al, 2002; Rossing et al, 2002; Villar et al, 1999). In a cross sectional study, patients with DR were 5.68, 13.39 and 3.51 times as likely to have DN among type1 and type2 diabetic patients (El-Asrar et al, 2002). However, there is lack of evidence that determine the association of retinal-renal complications using the gold standard methods. The DR is characterized by microvascular abnormalities, proliferation of retinal vessels and increased retinal vascular permeability leading to the development of non-proliferative and proliferative DR, and macular edema (Williams et al 2004). The DN is a life threatening complication which predisposes to excess morbidity and mortality resulting from renal failure and cardiovascular disease (Ritz et al, 1999; Adler at al, 2003). Our hypothesis was that the severity of DR correlates with the presence and severity of DN in people with type 1 diabetes. Studies in other populations documented a well-known association between advanced DR stages and overt nephropathy in type 1 diabetic patient (Looker et al, 2003; Gall et al, 1997). Similarly, our results provide further support to the close relationship between presence of DR and severity of DN in type1 diabetic patients. It was reported that at least one fifth of the diabetic individuals are affected by multiple complications and the frequency increases with increasing age and duration of diabetes. In the study of WESDR, there was a strong correlation between DN and severity of DR in all age groups (Klein et al, 1984; Klein et al 1984). In the present study we determine the epidemiological risk factors that influence the appearance of diabetic retinopathy, and overt nephropathy, in a seventeen -year follow-up of a population sample of 112 patients who did not have diabetic retinopathy or microalbuminuria at the beginning of the study.
2. Methods
2.1 Sample size and study population Since 1987 a register has been kept of any new cases of type I diabetes mellitus in Catalonia (Spain). The incidence of new cases over that period has been 11.4 cases per 100000 inhabitants (13.2 cases in men and 9.6 cases in women) (Castell et al, 1999). Since 1990, there has been an ongoing registration of all diabetic patients (type I and 2) at St Joan Hospital, which is the only surgical ophthalmology centre in Reus (Spain), and having a dependent population of around 207,500 inhabitants. In 1999, there were 1495 patients with diabetes mellitus type I (Castell et al, 1999).
Review of the Relationship Between Renal and Retinal Microangiopathy in Type 1 Diabetes Mellitus Patients
283
2.2 Design The present study is prospective and was initiated in 1990 with 126 patients recruited with type I diabetes mellitus. The initial conditions included the absence of retinopathy and nephropathy (determined by the absence of microalbuminuria in three consecutive measures taken at one month intervals). Two previous results were obtained at 5 and 10 years of the study (Romero-Aroca et al, 2000; Romero-Aroca et al, 2003). At the end of the study in 2007 only 112 patients were still being controlled (14 patients had dropped out during the follow up). At the end of the study (seventeen years of follow-up) the authors have determined the incidence of diabetic macular oedema and their risk factors, related to the appearance of renal overt nephropathy.
2.3 Diagnostic methods Diabetic retinopathy was evaluated by retinal photographs through dilated pupils, of two 50º fields of each eye centred firstly at the temporal to the macula and secondly at the nasal to the papilla (Aldington et al, 1995 ). The results were then classified into four groups (Wilkinson et al 2003): Mild non proliferative Moderate non proliferative Severe non proliferative Proliferative Macular edema was diagnosed under stereoscopic viewing of the macula with a slit lamp and Goldmann fundus contact lens, and was considered present if we found: retinal thickening involving or within 500 μ m of the centre of the macula hard exudates at or within 500 μ m of the centre of the macula, if associated with
thickening of adjacent retina (but no hard exudates remaining after retinal thickening disappeared)
a zone or zones of retinal thickening, one disc area or larger in size, any part of which is within 1 disc diameter of the centre of the macula.
The clinical classification used was the international clinical diabetic retinopathy disease severity scale, proposed by the American Academy of Ophthalmology in 2002 (Wilkinson et al 2003). In all patients with diabetic macular oedema, a fluorescein angiography was obtained, centred on macular region to determine the leakage in that area. The fluorescein angiographic findings were categorized into three types: focal leakage type, which was predominantly well-defined focal areas of leakage from
microaneurysm or localized dilated capillaries; diffuse leakage type, predominantly widespread and ill-defined leakage involving the
whole circumference of the fovea; cystoid leakage type, predominantly diffuse leakage but with pooling of dye in the
cystic spaces of the macula in the late phase. Since 2000, all patients with diabetic macular oedema have been given an optical coherence tomography OCT), repeated every 4 months as a control test. Optical coherence tomography was performed with a OCT model TOPCON TRC NW 7SF. The retinal map algorithm uses measurements along 6 radial lines, 6 mm in length, to produce a circular plot in which the foveal zone is the central circular zone of 1.00 mm in diameter. Macular edema measured by OCT was defined as a retinal thickening of more than 216 microns, and was classified as follows, using the Otani et al patterns amplified by the two tractional forms
Type 1 Diabetes Complications
284
described later (Otani et al, 1999 ): Sponge-like retinal thickness, defined as increased retinal thickness with reduced intra retinal reflectivity and expanded areas of lower reflectivity; cystoid macular oedema, characterized by the intra retinal cystoid spaces at the macular area; serous retinal detachment was thought to be present if the posterior surface of the retina was elevated above the outer border of the highly reflective band, regarded as the signal generated mainly by the retinal pigment epithelium. Only patients with a visible separation between the layer of photoreceptors and the pigment epithelium, was classified as serous detachment; if we observed the photoreceptor layer adjacent to pigment epithelium, we classified the case as cystoid macular oedema.
2.4 Inclusion criteria Patients with type I diabetes mellitus (insulin dependent or young-onset diabetes mellitus)
2.5 Exclusion criteria Presence of diabetic retinopathy at the beginning of study, presence of diabetic nephropathy at the beginning of study, presence of microalbuminuria at the beginning of study, patients with LADA diabetes (latent autoimmune adult diabetes), patients with type 2 diabetes mellitus (not insulin-dependent or older-onset diabetes mellitus), patients with type 2 diabetes mellitus appeared before 30 years of age (MODY diabetes mellitus)
2.6 Definition of variables Visual acuity in each eye was measured on the Snellen chart and recorded as a decimal value, with best refraction for distance. All data manipulations were performed on visual acuities expressed in log MAR form. The legal blind subject was defined as corrected visual acuity less than or equal to 0.1 in the better eye; reduced visual acuity as less than or equal to 0.4 and greater than 0.1 in the better eye. The epidemiological risk factors included in the study were: Gender and current age. Duration of diabetes mellitus, classified in the statistical study in two groups: below 20
years of duration and equal to or more than 20 years duration. Type of diabetic retinopathy classified into two groups: first with a diabetic retinopathy
lower than severe pattern, and the second with patients with severe or proliferative pattern, patients who need scattered photocoagulation were classified in tis second group.
Arterial hypertension, which indicates a systolic measurement above or equal to 140 mm Hg and the diastolic measurement above or equal to 90 mm Hg, or when the patient is taking anti-hypertensive medications.
Levels of glycated haemoglobin (HbA1c) as recommended i by the American Diabetes Association (ADA, 1997) as the major component of HbA1c (accounting for 80% of HbA1c), was measured every 3 months. The control of glycaemia was considered in concordance with the European Diabetes Policy Group, into two groups of patients i.e. over or under 7.0% (European Diabetes Policy Group, 1999). The value included in the statistical analysis was the mean of all values obtained over the 15 years.
Presence of microalbuminuria, defined as increased albumin excretion (30-300 mg of albumin/24 h or 20-200 µg/min of creatinine) on two of three tests repeated at intervals of 3-6 months as well as exclusion of conditions that invalidate the test (Geiss et al,
Review of the Relationship Between Renal and Retinal Microangiopathy in Type 1 Diabetes Mellitus Patients
285
1997). The test was performed annually. After microalbuminuria was diagnosed, repeated testing was made within a period of 3-4 months.
Presence of diabetic nephropathy, defined as clinical albuminuria or overt nephropathy by the American Diabetes Association, corresponding to protein excretion >300 mg/24h (>200 µg/min or >300 µg/mg of albumin: creatinine ratio). Measurement of creatinine clearance as an index of glomerular filtration rate was performed on the same urine collection (Geiss et al, 1997).
Patients were classified as having macro vascular disease if one or more of the following were present: symptoms of angina pectoris, history of myocardial infarction, coronary artery by pass grafting, percutaneous tranluminal coronary angioplasty, symptoms of or operation for intermittent claudication, history of amputation, transient ischemic attack, stroke.
Levels of triglycerides and fractions of cholesterol (HDL-cholesterol and LDL-chorlesterol). In the statistical analysis, we classified the patient into normal or higher values, according to the ADA categories as patients with high risk if LDL-cholesterol 3.35 mmol/L (130 mg/dl), HDL-cholesterol 0.90 mmol/L for men and >1.15 mmol/L for women (35 mg/dL for men and 45 mg/dL for women), and triglycerides 1.5 mmol/dL (400 mg/dL), (Expert Panel on Detection, Evaluation, And Treatment of high Blood Cholesterol in Adults, 2001).
2.7 Statistical methods All statistical analyses were carried out using the SPSS software package (version 18.0), results are expressed as mean±standard error, a P-value of less than 0.05 was considered to indicate statistical significance. Differences between those included in analyses were examined using the two sample Student T-tests or one-way ANOVA, for continuous or quantitative data, as visual acuity or current age. For the qualitative or categorical data we used the Chi-square test in the univariate phase of study, with determination of Odds ratio for each variable. The Kruskal-Wallis test and the least significant difference test using ranks for multiple comparisons were carried out to evaluate the correlation between best-corrected visual acuity an OCT findings. In the multivariate phase of analysis the relationship of diabetic retinopathy, microalbuminuria and overt nephropathy, to various demographic and other risk factors were examined using logistic regression analysis; the full model was built including gender and age a priori.
3. Results
Demographic variables of the patients
Gender: 54 patients were men (48.2%) and 58 were women (51.8%) The mean of age was 39.94 10.53 years old (24 – 61 years), the mean of diabetes mellitus type I duration was 23.42 7.57 years (12 – 45 years). The arterial hypertension was present in 44 patients (39.3%). The means of the different quantitative data were: Glycosylated haemoglobin A1c: 7.69% 1.24 (4.50% – 11.40%) LDL-Cholesterol: 3.50 0,57 mmol/l (3.00 – 4.00)
Type 1 Diabetes Complications
286
HDL-Cholesterol: 1.12 0,42 mmol/l (0.70 – 2.02) Triglycerides: 1.47 0.76 mmol/l (0.90 – 3.00)
Visual acuity study
Mean visual acuity after 17 years was 0.77 0.34 ( 0,02 – 1) in the Snellen chart test; and +0.37 +0.72 (+ 1.7 - + 0) in the Log MAR test. Low vision (defined as vision in the best eye >0,1 and < 0.4 in the Snellen chart) was detected in 13 patients (11.6%) and blindness (AV < 0.1 in Snellen chart) in 14 patients (12.5%).
Incidence of diabetic retinopathy (Table 1)
After 17 years there were 62 patients (55.4%) with different types of diabetic retinopathy. The Rate of progression was 8.30 person-year. Mild diabetic retinopathy in31 patients (27.7%) Moderate diabetic retinopathy in 7 patients (6.3%) Severe diabetic retinopathy in 5 patients (4.5%) Proliferative diabetic retinopathy in 18 patients (16.1%) There were 23 patients (20.5%) with diabetic macular edema after 17 years, the Rate of progression was 3.08 person-year. The mild or moderate form of diabetic macular edema was present in 13 patients (11.6%) and the severe form of macular edema in 10 patients (8.9%). In the 62 patients with diabetic retinopathy 17 (27.42%) developed overt nephropathy, with a rate of progression 4.11 person-year. In patients with proliferative form of diabetic retinopathy (23 patients) 11 developed microalbuminuria (47.82%), the rate of progression was 7.17 person-year.
Statistical study of diabetic retinopathy
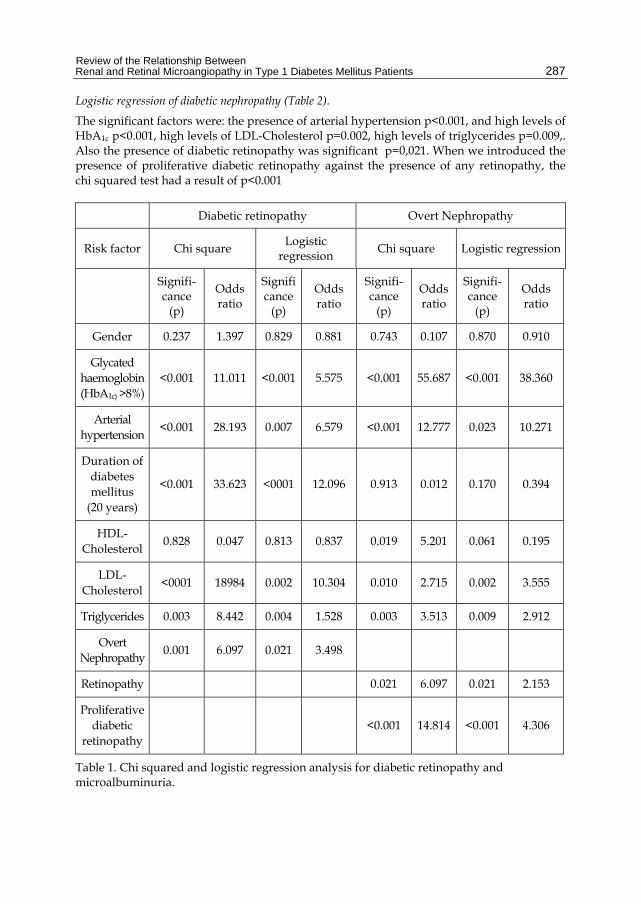
Univariate study with the application of chi squared test (Table 1). The factors significant in the appearance of diabetic retinopathy were as follows: duration of diabetic retinopathy p<0.001, presence of arterial hypertension p<0.001, levels of glycated haemoglobin (HbA1c) > 7.5% p<0.001, high levels of LDL-cholesterol p<0.001, high levels of tryglicerides p=0.003 and presence of overt nephropathy p= 0.001.
Logistic regression of diabetic retinopathy (Table 2).
The followings factors studied were significant in the appearance of diabetic retinopathy: Duration of diabetes mellitus more than 20 years p< 0.001, presence of arterial hypertension p<0.001, high levels of HbA1c p< 0.001, high levels of tryglicerides p=0.004, high levels of LDL-Cholesterol p= 0.002, and overt nephropathy p=0.021.
Statistical study of diabetic nephropathy
Univariate analysis with the application of chi squared test(Table 1). The factors significant in the apparition of overt nephropathy were: presence of arterial hypertension p<0.001, high levels of HbA1c p<0.001, high levels of LDL-Cholesterol p=0.010, high levels of triglycerides p=0.003, and presence of diabetic retinopathy p=0.021. When we introduced the presence of proliferative diabetic retinopathy against the presence of any retinopathy, the chi squared test had a result of p<0.001, and for proliferative diabetic retinopathy p< 0.001.
Review of the Relationship Between Renal and Retinal Microangiopathy in Type 1 Diabetes Mellitus Patients
287
Logistic regression of diabetic nephropathy (Table 2).
The significant factors were: the presence of arterial hypertension p<0.001, and high levels of HbA1c p<0.001, high levels of LDL-Cholesterol p=0.002, high levels of triglycerides p=0.009,. Also the presence of diabetic retinopathy was significant p=0,021. When we introduced the presence of proliferative diabetic retinopathy against the presence of any retinopathy, the chi squared test had a result of p<0.001
Diabetic retinopathy Overt Nephropathy
Risk factor Chi square Logistic
regression Chi square Logistic regression
Signifi-cance
(p)
Odds ratio
Significance
(p)
Odds ratio
Signifi-cance
(p)
Odds ratio
Signifi-cance
(p)
Odds ratio
Gender 0.237 1.397 0.829 0.881 0.743 0.107 0.870 0.910
Glycated haemoglobin (HbA1c) >8%)
<0.001 11.011 <0.001 5.575 <0.001 55.687 <0.001 38.360
Arterial hypertension
<0.001 28.193 0.007 6.579 <0.001 12.777 0.023 10.271
Duration of diabetes mellitus
(20 years)
<0.001 33.623 <0001 12.096 0.913 0.012 0.170 0.394
HDL-Cholesterol
0.828 0.047 0.813 0.837 0.019 5.201 0.061 0.195
LDL-Cholesterol
<0001 18984 0.002 10.304 0.010 2.715 0.002 3.555
Triglycerides 0.003 8.442 0.004 1.528 0.003 3.513 0.009 2.912
Overt Nephropathy
0.001 6.097 0.021 3.498
Retinopathy 0.021 6.097 0.021 2.153
Proliferative diabetic
retinopathy <0.001 14.814 <0.001 4.306
Table 1. Chi squared and logistic regression analysis for diabetic retinopathy and microalbuminuria.
Type 1 Diabetes Complications
288
Patients only with retinopathy
Patients only with overt nephropathy
Patients with retinopathy and overt nephropathy
Duration of diabetes mellitus (4.679)*
High levels of HbA1c (7.250)*
High levels of HbA1c (6.471)*
High levels of HbA1c (2.250)*
High levels of triglycerides (1.713)*
High levels of triglycerides (2.810)*
Arterial hypertension (2.668)*
Duration of diabetes mellitus (1.029)*
Arterial hypertension (2.657)*
High levels of LDL-cholesterol (1.277)*
Arterial hypertension (0.742)*
Duration of diabetes mellitus (2.269)*
High levels of triglycerides (1.254)*
High levels of LDL-cholesterol (-1.360)*
High levels of LDL-cholesterol (1.232)*
* = Function of classification coefficients.
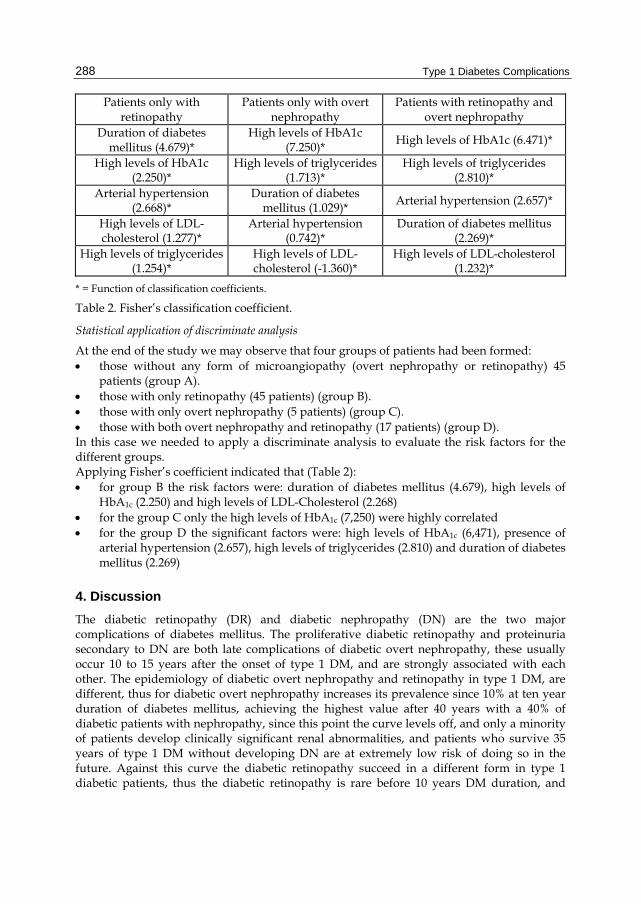
Table 2. Fisher’s classification coefficient.
Statistical application of discriminate analysis
At the end of the study we may observe that four groups of patients had been formed: those without any form of microangiopathy (overt nephropathy or retinopathy) 45
patients (group A). those with only retinopathy (45 patients) (group B). those with only overt nephropathy (5 patients) (group C). those with both overt nephropathy and retinopathy (17 patients) (group D). In this case we needed to apply a discriminate analysis to evaluate the risk factors for the different groups. Applying Fisher’s coefficient indicated that (Table 2): for group B the risk factors were: duration of diabetes mellitus (4.679), high levels of
HbA1c (2.250) and high levels of LDL-Cholesterol (2.268) for the group C only the high levels of HbA1c (7,250) were highly correlated for the group D the significant factors were: high levels of HbA1c (6,471), presence of
arterial hypertension (2.657), high levels of triglycerides (2.810) and duration of diabetes mellitus (2.269)
4. Discussion
The diabetic retinopathy (DR) and diabetic nephropathy (DN) are the two major complications of diabetes mellitus. The proliferative diabetic retinopathy and proteinuria secondary to DN are both late complications of diabetic overt nephropathy, these usually occur 10 to 15 years after the onset of type 1 DM, and are strongly associated with each other. The epidemiology of diabetic overt nephropathy and retinopathy in type 1 DM, are different, thus for diabetic overt nephropathy increases its prevalence since 10% at ten year duration of diabetes mellitus, achieving the highest value after 40 years with a 40% of diabetic patients with nephropathy, since this point the curve levels off, and only a minority of patients develop clinically significant renal abnormalities, and patients who survive 35 years of type 1 DM without developing DN are at extremely low risk of doing so in the future. Against this curve the diabetic retinopathy succeed in a different form in type 1 diabetic patients, thus the diabetic retinopathy is rare before 10 years DM duration, and
Review of the Relationship Between Renal and Retinal Microangiopathy in Type 1 Diabetes Mellitus Patients
289
increases the prevalence, since this point to a levels upper 80% after 20 years diabetes duration, without a decreases after these 20 years of duration, as we observed in our study. The incidence of DR was 55.4%, and was lower than in other studies such as Klein et al 1998 (Klein et al, 1998), but this may be because the sample studied did not present diabetic retinopathy at the beginning and patient controls were stricter than in the rest of the patients with diabetes mellitus type I (controls every 3 months), we could concluded that the mean level of HbA1c was 7.69% 1.24 (4.50% – 11.40%) is better than the achieved by WESDR (Klein et al, 1998). The diabetic macular edema appeared in 20.5% of patients, which was more similar to the findings in the Klein study at 14 years (26%). In the present study the incidence of diabetic macular edema is higher than the proliferative form of diabetic retinopathy in type I diabetes mellitus patients, as was observed in other studies. With regard to nephropathy diabetes accountings for more than 19.6% of all cases of DN. The DN presents initially as intermittent microalbuminuria that progresses to persistent microalbuminuria, and is accompanied by a decline in the glomerular filtration rate. These dates were in agreement with other studies published in our country on renal failure in diabetes mellitus type I patients Smatjes et al (Esmatjes et al, 1998) found an incidence of 44.5% with some form of renal failure at 20 years in type I diabetes mellitus. The relationship between DN and DR was well described, thus the Wisconsin Epidemiologic Study of Diabetic Retinopathy (Klein et al, 1993) associated the presence of gross-proteinuria at baseline examination with a 96% increase in the risk of progression to proliferative retinopathy. Also in the Steno study (Kofoed-Enevoldsen et al, 1987), people with type I diabetes mellitus and gross-proteinuria at baseline had an increase risk of progression to proliferative retinopathy (12% annually) compared to those without proteinuria (1%-2% annually). At the end of our study we can see that four groups of patients had formed: those without overt nephropathy or diabetic retinopathy (45 patients), patients with only overt nephropathy (5 patients), those with only diabetic retinopathy (45 patients), and those with overt nephropathy and diabetic retinopathy (17 patients). The statistical test used for examining these data was a discriminate test, which allowed us to identify the risk factors that influence any of these groups. In the group of patients with only DR the duration of diabetes mellitus was the more important risk factor and for the group with Dr and DN the most important risk factor is the high levels of HbA1c. We may assume then, that for the development of only retinal lesions in diabetes mellitus, the duration of the disease is the most important followed by and in a second level of importance the levels of HbA1c and arterial hypertension; and for the development of renal and retinal lesion simultaneously poor control of glycaemia measured by levels of HbA1c were more important than the duration of diabetes mellitus. Two broader groups of patients can be assumed to have been formed in this study, the first being those patients who developed only diabetic retinopathy, and the second those with both diabetic retinopathy and renal lesion (overt nephropathy). This conclusion is consistent with previous studies as that of Lövestam-Adrian in 1998 (Lövestam-Adrian, et al, 1998), in which after a 10-year follow-up of a population of 24 patients, with proliferative diabetic retinopathy at the beginning of the study, only two developed microalbuminuria, That study concluded that there are, at least partly, different pathogenic mechanisms behind diabetic retinopathy and overt nephropathy.
Type 1 Diabetes Complications
290
5. Conclusion
Despite there being a poor relationship between overt nephropathy and diabetic retinopathy (p=0.021 in the present study), the presence of overt nephropathy correlated well with severe forms of diabetic retinopathy (as proliferative Dr p<0.001 in the present study); and in addition, at the end of study two broad group of patients had been configured, the first those who developed only diabetic retinopathy, and the second with diabetic retinopathy and renal lesion (overt nephropathy). For the first group with only DR , duration of diabetes mellitus is the most important risk factor, and for the second group (patients with DR and DN) the levels of HbA1c and blood pressure are the most important.
6. References
Adler AI, Stevens RJ, Manley SE, Bilous RW, Cull CA & Holman RR (2003). UKPDS Group. Development and progression of nephropathy in type2 diabetes. The United Kingdom Prospective Diabetes Study (UKPDS 64). Kidney Int; 63:225-232. ISSN 0085-2538
Aldington SJ, Kohner EM, Meuer S, Klein R & Sjolie AK (1995). Methodology for retinal photography and assessment of diabetic retinopathy , The EURODIAB IDDM complications study. Diabetologia, 38 , 437-444 ISSN 0012-186X
American Diabetes Association (1997). Report of the Expert Committee on the diagnosis and classification of diabetes mellitus. Diabetes Care; 20:1183-1201. ISSN 0149-5992
Castell C, Tresserras R, Lloveras G, Goday A, Serra J & Salleras L (1999). Prevalence of diabetes in Catalonia, an OGTT-based population study. Diab Res Clin Prac, 43, 33-40 ISSN 0168-8227
El-Asrar AM, Al Rubeaan KA, Al-Amor SA, Moharram OA & Kangave D (2000). Retinopathy as a predictor of other diabetic complications. International Ophthalmology;24:1-11. ISSN 0161-6420
Esmatjes E, Castell C, Goday A, Montanya E, Pou JM & cols (1998). Prevalence of nephropathy in type I diabetes Med Clin (Barc). 1998 17; 110(1):6-10. ISSN 0025-7753
Estacio RO, McFarling E, Biggerstaff S, Jeffers BW, Johnson D & Schrier RW (1998). Overt albuminuria predicts diabetic retinopathy in Hispanics with NIDDM. Am J of Kidney Disease; 31:947-953. ISSN 0272-6386
European Diabetes Policy Group (1999). A Desktop guide to type I (insulin-dependent) diabetes mellitus. 1998-199. Guidelines for Diabetes care. Diabetic Med, 16, 253-266. ISSN 1464-5491
Expert Panel on Detection, Evaluation, And Treatment of high Blood Cholesterol in Adults (Adult Treatment Panel III) (2001). Executive summary of the third report of the National Cholesterol Education Program (NCEP). JAMA, 285, 2486-2497 ISSN 0098-7484
Gall MA, Hougaard P, Borch-Johnsen K & Parving HH (1997). Risk factors for development of incipient and overt diabetic nephropathy in patients with non-insulin dependent diabetes mellitus: prospective, observational study. BMJ;314:783-789. ISSN 0959-8138
Review of the Relationship Between Renal and Retinal Microangiopathy in Type 1 Diabetes Mellitus Patients
291
Geiss L, Engelgau M, Fraizer E & Tierney E (1997). Diabetes surveillance, 1997. Centers for Disease Control and Prevention. U.S. Departement of Health and Human Services Atlanta GA.
Klein R, Klein BEK, Moss SE & Cruickshanks KJ (1998). The 14-year incidence and progression of diabetic retinopathy an associate risk factors in type I diabetes. The Wisconsin Epidemiologic Study of Diabetic Retinopathy XVII. Ophthalmology, 105, 1801-1815. ISSN 0161-6420
Klein R, Klein BEK, Moss SE, Davis MD & DeMets DL (1984). The Wisconsin Epidemiologic Study of Diabetic Retinopathy II: prevalence and risk of diabetic retinopathy when age at diagnosis is less than 30 years. Arch Ophthalmology;102:520-526. ISSN 0093-0326
Klein R, Klein BEK, Moss SE, Davis MD & DeMets DL (1984). The Wisconsin Epidemiologic Study of Diabetic Retinopathy II: prevalence and risk of diabetic retinopathy when age at diagnosis is 30 or more years. Arch Ophthalmology;102:527-32. ISSN 0093-0326
Klein R, Moss SE & Klein BEK (1993). Is gross proteinuria a risk factor for the incidence of proliferative diabetic retinopathy?. Ophthalmology, 100: 1140-1146 ISSN0161-6420
Kofoed-Enevoldsen A, Jensen T, Borch-Johnsen K & Deckert T (1987). Incidence of retinopathy in type I (insulin-dependent) diabetes: association with clinical nephropathy. J Diabet Complications,1, 96-99. ISSN 1056-8727
Looker HC, Krakoff J, Knowler WC, Bennett PH, Klein R & Hanson RL (2003). Longitudinal studies of incidence and progression of diabetic retinopathy assessed by retinal photography in Pima Indians. Diabetes Care;26:320-326. ISSN 0149-5992
Lövestam-Adrian M, Agardh E & Agardh CD (1998). The incidence of nephropathy in type 1 diabetic patients with prol iferative retinopathy: a 10-year follow-up study. Diabetes Res Clin Pract.;39(1):11-17. ISSN 0168-8227
Myers BD, Winetz JA, Chui F, Michaels AS. Mechanism of proteinuria in diabetic nephropathy: A study of glomerular barrier functions. Kidney Int 1982;21:633-41 ISSN 1523-1755
Otani T, Kishi S & Maruyana Y (1999). Patterns of diabetic macular edema with optical coherence tomography. Am J Ophthalmol , 127, 688-693. ISSN 0002- 939
Ritz E, Orth SR. Nephropathy in patients with type2 diabetes mellitus. N Eng J Med 1999; 341:1127-33. ISSN 1533-4406
Romero-Aroca P, Espeso-Sentis O, Sarda-Aure P & del Castillo-Dejardin D (2000). Relationship between microalbuminuria and diabetic retinopathy in type I diabetes mellitus. Rev Clin Esp. 200,351-354. ISSN 0014-2565
Romero-Aroca P, Salvat-Serra M, Mendez-Marin I & Martinez-Salcedo I (2003). Is microalbuminuria a risk factor for diabetic retinopathy?. J Fr Ophtalmol, 26, 7, 680-684. ISSN 0181-5512
Rossing P, Hougaard P & Parving HH (2002). Risk factors for the development of incipient and overt diabetic nephropathy in type 1 diabetic patients: A 10 year prospective observational study. Diabetes Care 2002;25:859-864. ISSN 0149-5992
The Expert Comitee on the Diagnosis and Classification of Diabetes mellitus (2000). Report of the Expert Committee on the Diagnosis and classification of Diabetes Mellitus. Diabetes Care; 23: S4-S19 ISSN 0149-5992

Type 1 Diabetes Complications
292
Villar G, Gracia Y, Goicolea I & Barquees J (1999). Determinants of development of microalbuminuria in normotensive patients with type 1 and type 2 diabetes. Diabetes and Metabolism; 25:246-254. ISSN 1520-7560
Wilkinson CP, Ferris FL, Klein RE, Lee PP, Agardh CD, Davis M, Dills D, Kampic A, Pararajasegaram R & Verdaguer JT, representing the Global Diabetic Retinopathy Project Group (2003). Proposed international clinical diabetic retinopathy and diabetic macular edema disease severity scales. Ophthalmology, 110, 1677-1682 ISSN 0161-6420
Williams R, Airey M, Baxter H, Forrester J, Kennedy-Martin T & Giarach A (2004). Epidemiology of diabetic retinopathy and macular edema: a systematic review. Eye; 18:963-983. ISSN 0950-222X


