Embed Size (px)
Citation preview
Palaeogeography, Palaeoclimatology, Palaeoecology 396 (2014) 132–154
Contents lists available at ScienceDirect
Palaeogeography, Palaeoclimatology, Palaeoecology
j ourna l homepage: www.e lsev ie r .com/ locate /pa laeo
Did the Variscan relief influence the Permian climate of Mesoeurope?Insights from geochemical and mineralogical proxies fromSardinia (Italy)
Rosa Sinisi a,⁎, Giovanni Mongelli b, Paola Mameli a, Giacomo Oggiano a
a Department of Nature and Land Sciences, University of Sassari, via Piandanna 4, 07100 Sassari, Italyb Department of Sciences, University of Basilicata, via Ateneo Lucano 10, 85100 Potenza, Italy
⁎ Corresponding author. Tel.: +39 0971 206181.E-mail address: [email protected] (R. Sinisi).
0031-0182/$ – see front matter © 2013 Elsevier B.V. All rihttp://dx.doi.org/10.1016/j.palaeo.2013.12.030
a b s t r a c t
a r t i c l e i n f oArticle history:Received 10 September 2013Received in revised form 3 December 2013Accepted 19 December 2013Available online 7 January 2014
Keywords:Permian–Triassic red bedsVariscan reliefPalaeoclimate proxiesSedimentary recyclingDiagenetic K-metasomatism
Red beds deposits of Permian–Triassic basins of Sardinia (western Italy), where a wide segment of the Variscanorogen is exposed, were studied. The basins were selected according to their positionwithin the structural zonesof Variscan orogen, i.e. from the external to the inner sectors of the chain. Detailedmineralogical, petrographical,and chemical analyses were performed on shale and calcrete layers laying along the sedimentary sequences, toexamine their compositional features and stratigraphic variation. In this regard, enrichment factors (F(e)) formajor and trace elements (relative to the PAAS composition)were calculated and discussed. Several geochemicalproxies were also calculated and used to assess the palaeoclimate conditions during the red beds deposition. Theweathering indices (CIA and CIW) accounted formore humid conditions in the basins of the axial zone relative tothe basins those of the foreland, which instead were characterised by an arid climate. However, the presence ofcarbonates, albeit discontinuous, and the values of calcification, salinity, and hydrolysis indices suggest that, inthe axial zone, dry and hot periods also occurred. Compositional data of the sedimentary recordswere correlatedto the Sardinia geological setting and significant informationwere obtained on the palaeoenvironment character-izing the south-westernMesoeurope during Permian and Triassic. Al2O3–TiO2–Zr ternary plot and Zr/Sc vs. Th/Scdiagram show that both sorting and sedimentary recycling affected the studied basins. Precisely, our data lead usto suppose that a wide regional subsidence caused both the recycling of uplifted Variscan rocks and the diageneticK-metasomatism of Permian sediments revealed by the A–CN–K diagram. Finally, a supply fromupper continentalsource has been suggested by the provenance proxies (such as (Gd/Yb)N and Eu/Eu*) and the La-Th-Sc plot thatalso reflect the paucity of mafic rocks in feeding areas.
© 2013 Elsevier B.V. All rights reserved.
1. Introduction
The interval between the early Permian and Early Triassic was a pe-riod of significant environmental change and lithospheric activity thattriggered a sequence of palaeogeographical changes affecting most ofthe planet (Lόpez-Gόmez et al., 2005; Shen, 2013). With respect to thePermian–Triassic Pangaean regime, many factors have been proposedto account for regional and global climatic changes towards wetter aswell as drier conditions. Global factors include alternating periods ofgreenhouse conditions (Roy and Roser, 2013) resulting from spikes inCO2 and CH4, related to oxidation and/or thermogenic cracking ofcoal-rich Carboniferous–Permian deposits (Retallack, 2013) and erup-tion of basalt in the Siberian Traps (Chen et al., 2013). In theMesoeuropean sector of Pangaea, local factors include the final Tethysopening and the Zechstein transgression, which are thought to havemade the climate wetter (van Wees et al., 2000), whereas theChina–Siberia collision, the onset of cool streams along the Palaeotethys
ghts reserved.
and the hindering of moisture transport from this ocean are consideredto have been responsible for a drier climate (Isozaki et al., 2011;Kossovaya, 2009). Only a few authors (e.g., Fluteau et al., 2001) haveargued that the relief of the Variscan Chain had a significant effecton the regional climate of this sector of Pangaea, in contrast to others(e.g., Roscher and Schneider, 2006) who claim that the chain provid-ed a negligible east–west orographic barrier across Mesoeurope.
The Mesoeuropean crust, which after the early Permian Pangaeaamalgamation was located in the western Mediterranean area, becamepart of a dextral strike-slip tectonic setting as the African and Eurasianplates moved apart. Throughout the Permian, several intracratonic ba-sins developed under tensile to transtensile stress, and were filledwith clastic and volcanic successions (Broutin et al., 1994; Bertoluzzaand Perotti, 1997; Cortesogno et al., 1998; Zeh et al., 2000).
Subsequently, sedimentation of grey (mainly lacustrine) deposits ofthe Autunian facies gave way to the deposition of red beds consisting ofreddish alluvial conglomerates, sandstones, and shales that are ascribedto a generic Permian–Triassic age. Most of the Permian–Triassic sedi-mentary sequences of southwestern Europe are characterised by alack of paleontological evidence, making it very difficult to assign an
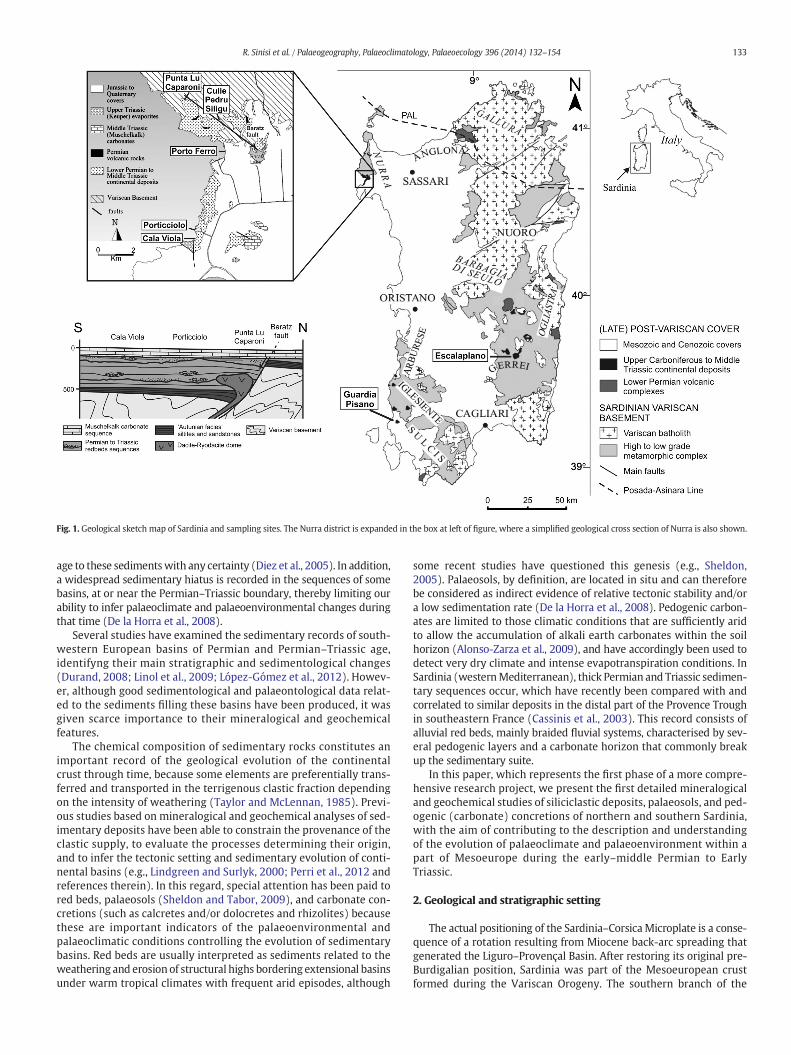
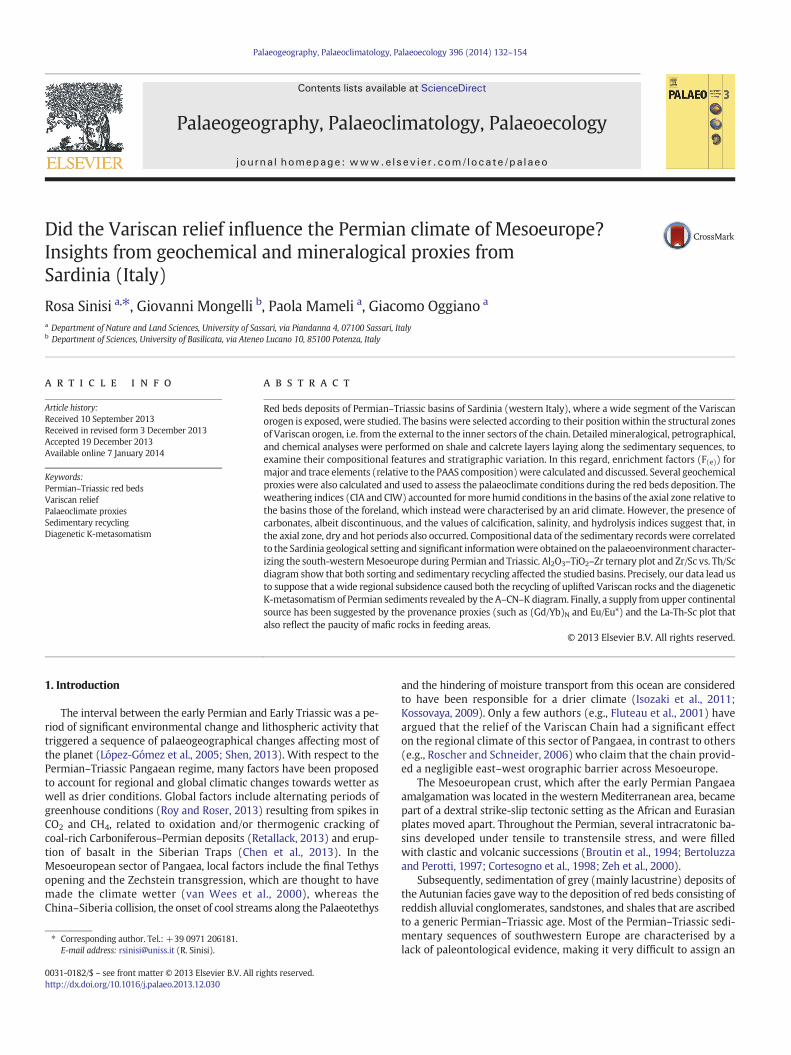
Fig. 1. Geological sketch map of Sardinia and sampling sites. The Nurra district is expanded in the box at left of figure, where a simplified geological cross section of Nurra is also shown.
133R. Sinisi et al. / Palaeogeography, Palaeoclimatology, Palaeoecology 396 (2014) 132–154
age to these sedimentswith any certainty (Diez et al., 2005). In addition,a widespread sedimentary hiatus is recorded in the sequences of somebasins, at or near the Permian–Triassic boundary, thereby limiting ourability to infer palaeoclimate and palaeoenvironmental changes duringthat time (De la Horra et al., 2008).
Several studies have examined the sedimentary records of south-western European basins of Permian and Permian–Triassic age,identifyng their main stratigraphic and sedimentological changes(Durand, 2008; Linol et al., 2009; Lόpez-Gόmez et al., 2012). Howev-er, although good sedimentological and palaeontological data relat-ed to the sediments filling these basins have been produced, it wasgiven scarce importance to their mineralogical and geochemicalfeatures.
The chemical composition of sedimentary rocks constitutes animportant record of the geological evolution of the continentalcrust through time, because some elements are preferentially trans-ferred and transported in the terrigenous clastic fraction dependingon the intensity of weathering (Taylor and McLennan, 1985). Previ-ous studies based on mineralogical and geochemical analyses of sed-imentary deposits have been able to constrain the provenance of theclastic supply, to evaluate the processes determining their origin,and to infer the tectonic setting and sedimentary evolution of conti-nental basins (e.g., Lindgreen and Surlyk, 2000; Perri et al., 2012 andreferences therein). In this regard, special attention has been paid tored beds, palaeosols (Sheldon and Tabor, 2009), and carbonate con-cretions (such as calcretes and/or dolocretes and rhizolites) becausethese are important indicators of the palaeoenvironmental andpalaeoclimatic conditions controlling the evolution of sedimentarybasins. Red beds are usually interpreted as sediments related to theweathering and erosion of structural highs bordering extensional basinsunder warm tropical climates with frequent arid episodes, although
some recent studies have questioned this genesis (e.g., Sheldon,2005). Palaeosols, by definition, are located in situ and can thereforebe considered as indirect evidence of relative tectonic stability and/ora low sedimentation rate (De la Horra et al., 2008). Pedogenic carbon-ates are limited to those climatic conditions that are sufficiently aridto allow the accumulation of alkali earth carbonates within the soilhorizon (Alonso-Zarza et al., 2009), and have accordingly been used todetect very dry climate and intense evapotranspiration conditions. InSardinia (westernMediterranean), thick Permian and Triassic sedimen-tary sequences occur, which have recently been compared with andcorrelated to similar deposits in the distal part of the Provence Troughin southeastern France (Cassinis et al., 2003). This record consists ofalluvial red beds, mainly braided fluvial systems, characterised by sev-eral pedogenic layers and a carbonate horizon that commonly breakup the sedimentary suite.
In this paper, which represents the first phase of a more compre-hensive research project, we present the first detailed mineralogicaland geochemical studies of siliciclastic deposits, palaeosols, and ped-ogenic (carbonate) concretions of northern and southern Sardinia,with the aim of contributing to the description and understandingof the evolution of palaeoclimate and palaeoenvironment within apart of Mesoeurope during the early–middle Permian to EarlyTriassic.
2. Geological and stratigraphic setting
The actual positioning of the Sardinia–Corsica Microplate is a conse-quence of a rotation resulting from Miocene back-arc spreading thatgenerated the Liguro–Provençal Basin. After restoring its original pre-Burdigalian position, Sardinia was part of the Mesoeuropean crustformed during the Variscan Orogeny. The southern branch of the
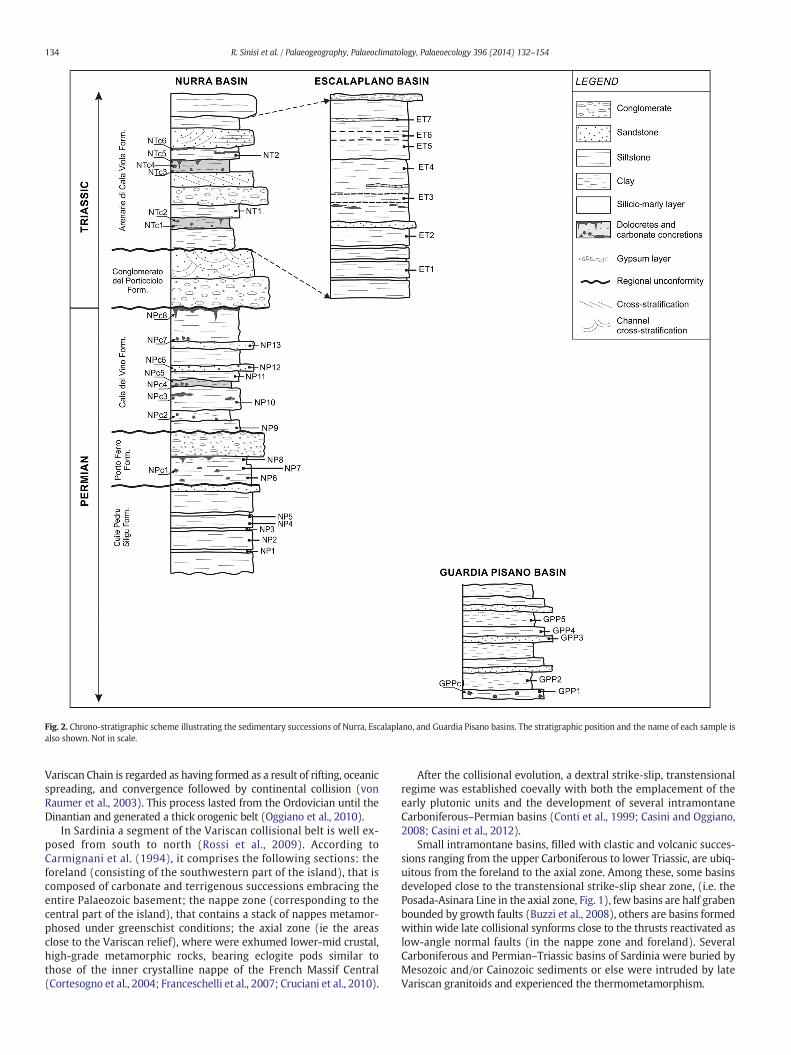
Fig. 2. Chrono-stratigraphic scheme illustrating the sedimentary successions of Nurra, Escalaplano, and Guardia Pisano basins. The stratigraphic position and the name of each sample isalso shown. Not in scale.
134 R. Sinisi et al. / Palaeogeography, Palaeoclimatology, Palaeoecology 396 (2014) 132–154
Variscan Chain is regarded as having formed as a result of rifting, oceanicspreading, and convergence followed by continental collision (vonRaumer et al., 2003). This process lasted from the Ordovician until theDinantian and generated a thick orogenic belt (Oggiano et al., 2010).
In Sardinia a segment of the Variscan collisional belt is well ex-posed from south to north (Rossi et al., 2009). According toCarmignani et al. (1994), it comprises the following sections: theforeland (consisting of the southwestern part of the island), that iscomposed of carbonate and terrigenous successions embracing theentire Palaeozoic basement; the nappe zone (corresponding to thecentral part of the island), that contains a stack of nappes metamor-phosed under greenschist conditions; the axial zone (ie the areasclose to the Variscan relief), where were exhumed lower-mid crustal,high-grade metamorphic rocks, bearing eclogite pods similar tothose of the inner crystalline nappe of the French Massif Central(Cortesogno et al., 2004; Franceschelli et al., 2007; Cruciani et al., 2010).
After the collisional evolution, a dextral strike-slip, transtensionalregime was established coevally with both the emplacement of theearly plutonic units and the development of several intramontaneCarboniferous–Permian basins (Conti et al., 1999; Casini and Oggiano,2008; Casini et al., 2012).
Small intramontane basins, filled with clastic and volcanic succes-sions ranging from the upper Carboniferous to lower Triassic, are ubiq-uitous from the foreland to the axial zone. Among these, some basinsdeveloped close to the transtensional strike-slip shear zone, (i.e. thePosada-Asinara Line in the axial zone, Fig. 1), few basins are half grabenbounded by growth faults (Buzzi et al., 2008), others are basins formedwithin wide late collisional synforms close to the thrusts reactivated aslow-angle normal faults (in the nappe zone and foreland). SeveralCarboniferous and Permian–Triassic basins of Sardinia were buried byMesozoic and/or Cainozoic sediments or else were intruded by lateVariscan granitoids and experienced the thermometamorphism.
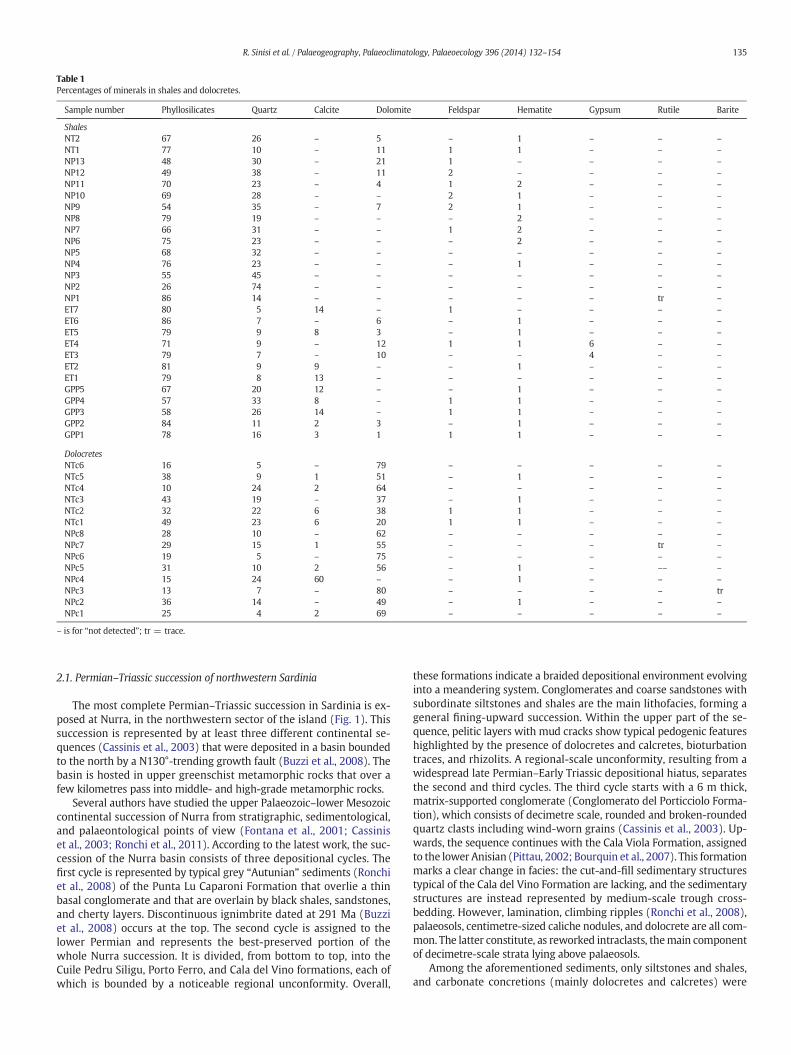
Table 1Percentages of minerals in shales and dolocretes.
Sample number Phyllosilicates Quartz Calcite Dolomite Feldspar Hematite Gypsum Rutile Barite
ShalesNT2 67 26 – 5 – 1 – – –
NT1 77 10 – 11 1 1 – – –
NP13 48 30 – 21 1 – – – –
NP12 49 38 – 11 2 – – – –
NP11 70 23 – 4 1 2 – – –
NP10 69 28 – – 2 1 – – –
NP9 54 35 – 7 2 1 – – –
NP8 79 19 – – – 2 – – –
NP7 66 31 – – 1 2 – – –
NP6 75 23 – – – 2 – – –
NP5 68 32 – – – – – – –
NP4 76 23 – – – 1 – – –
NP3 55 45 – – – – – – –
NP2 26 74 – – – – – – –
NP1 86 14 – – – – – tr –
ET7 80 5 14 – 1 – – – –
ET6 86 7 – 6 – 1 – – –
ET5 79 9 8 3 – 1 – – –
ET4 71 9 – 12 1 1 6 – –
ET3 79 7 – 10 – – 4 – –
ET2 81 9 9 – – 1 – – –
ET1 79 8 13 – – – – – –
GPP5 67 20 12 – – 1 – – –
GPP4 57 33 8 – 1 1 – – –
GPP3 58 26 14 – 1 1 – – –
GPP2 84 11 2 3 – 1 – – –
GPP1 78 16 3 1 1 1 – – –
DolocretesNTc6 16 5 – 79 – – – – –
NTc5 38 9 1 51 – 1 – – –
NTc4 10 24 2 64 – – – – –
NTc3 43 19 – 37 – 1 – – –
NTc2 32 22 6 38 1 1 – – –
NTc1 49 23 6 20 1 1 – – –
NPc8 28 10 – 62 – – – – –
NPc7 29 15 1 55 – – – tr –
NPc6 19 5 – 75 – – – – –
NPc5 31 10 2 56 – 1 – –– –
NPc4 15 24 60 – – 1 – – –
NPc3 13 7 – 80 – – – – trNPc2 36 14 – 49 – 1 – – –
NPc1 25 4 2 69 – – – – –
– is for “not detected”; tr = trace.
135R. Sinisi et al. / Palaeogeography, Palaeoclimatology, Palaeoecology 396 (2014) 132–154
2.1. Permian–Triassic succession of northwestern Sardinia
The most complete Permian–Triassic succession in Sardinia is ex-posed at Nurra, in the northwestern sector of the island (Fig. 1). Thissuccession is represented by at least three different continental se-quences (Cassinis et al., 2003) that were deposited in a basin boundedto the north by a N130°-trending growth fault (Buzzi et al., 2008). Thebasin is hosted in upper greenschist metamorphic rocks that over afew kilometres pass into middle- and high-grade metamorphic rocks.
Several authors have studied the upper Palaeozoic–lower Mesozoiccontinental succession of Nurra from stratigraphic, sedimentological,and palaeontological points of view (Fontana et al., 2001; Cassiniset al., 2003; Ronchi et al., 2011). According to the latest work, the suc-cession of the Nurra basin consists of three depositional cycles. Thefirst cycle is represented by typical grey “Autunian” sediments (Ronchiet al., 2008) of the Punta Lu Caparoni Formation that overlie a thinbasal conglomerate and that are overlain by black shales, sandstones,and cherty layers. Discontinuous ignimbrite dated at 291 Ma (Buzziet al., 2008) occurs at the top. The second cycle is assigned to thelower Permian and represents the best-preserved portion of thewhole Nurra succession. It is divided, from bottom to top, into theCuile Pedru Siligu, Porto Ferro, and Cala del Vino formations, each ofwhich is bounded by a noticeable regional unconformity. Overall,
these formations indicate a braided depositional environment evolvinginto a meandering system. Conglomerates and coarse sandstones withsubordinate siltstones and shales are the main lithofacies, forming ageneral fining-upward succession. Within the upper part of the se-quence, pelitic layers with mud cracks show typical pedogenic featureshighlighted by the presence of dolocretes and calcretes, bioturbationtraces, and rhizolits. A regional-scale unconformity, resulting from awidespread late Permian–Early Triassic depositional hiatus, separatesthe second and third cycles. The third cycle starts with a 6 m thick,matrix-supported conglomerate (Conglomerato del Porticciolo Forma-tion), which consists of decimetre scale, rounded and broken-roundedquartz clasts including wind-worn grains (Cassinis et al., 2003). Up-wards, the sequence continues with the Cala Viola Formation, assignedto the lower Anisian (Pittau, 2002; Bourquin et al., 2007). This formationmarks a clear change in facies: the cut-and-fill sedimentary structurestypical of the Cala del Vino Formation are lacking, and the sedimentarystructures are instead represented by medium-scale trough cross-bedding. However, lamination, climbing ripples (Ronchi et al., 2008),palaeosols, centimetre-sized caliche nodules, and dolocrete are all com-mon. The latter constitute, as reworked intraclasts, themain componentof decimetre-scale strata lying above palaeosols.
Among the aforementioned sediments, only siltstones and shales,and carbonate concretions (mainly dolocretes and calcretes) were
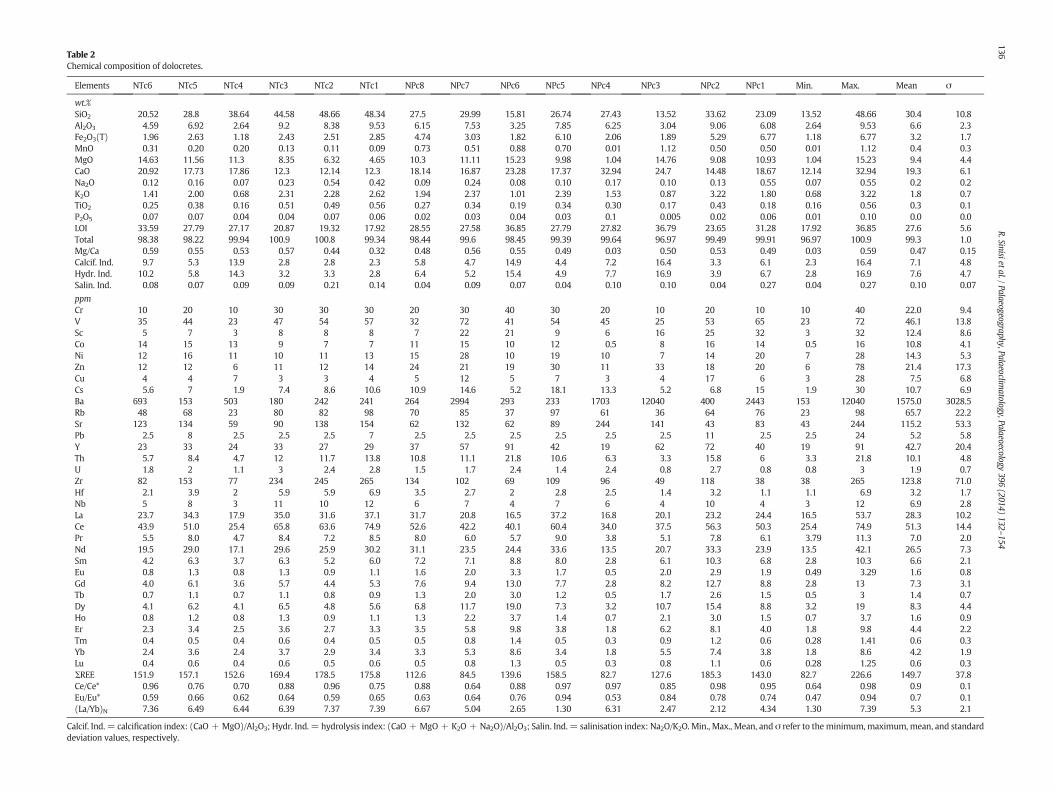
Table 2Chemical composition of dolocretes.
Elements NTc6 NTc5 NTc4 NTc3 NTc2 NTc1 NPc8 NPc7 NPc6 NPc5 NPc4 NPc3 NPc2 NPc1 Min. Max. Mean σ
wt.%SiO2 20.52 28.8 38.64 44.58 48.66 48.34 27.5 29.99 15.81 26.74 27.43 13.52 33.62 23.09 13.52 48.66 30.4 10.8Al2O3 4.59 6.92 2.64 9.2 8.38 9.53 6.15 7.53 3.25 7.85 6.25 3.04 9.06 6.08 2.64 9.53 6.6 2.3Fe2O3(T) 1.96 2.63 1.18 2.43 2.51 2.85 4.74 3.03 1.82 6.10 2.06 1.89 5.29 6.77 1.18 6.77 3.2 1.7MnO 0.31 0.20 0.20 0.13 0.11 0.09 0.73 0.51 0.88 0.70 0.01 1.12 0.50 0.50 0.01 1.12 0.4 0.3MgO 14.63 11.56 11.3 8.35 6.32 4.65 10.3 11.11 15.23 9.98 1.04 14.76 9.08 10.93 1.04 15.23 9.4 4.4CaO 20.92 17.73 17.86 12.3 12.14 12.3 18.14 16.87 23.28 17.37 32.94 24.7 14.48 18.67 12.14 32.94 19.3 6.1Na2O 0.12 0.16 0.07 0.23 0.54 0.42 0.09 0.24 0.08 0.10 0.17 0.10 0.13 0.55 0.07 0.55 0.2 0.2K2O 1.41 2.00 0.68 2.31 2.28 2.62 1.94 2.37 1.01 2.39 1.53 0.87 3.22 1.80 0.68 3.22 1.8 0.7TiO2 0.25 0.38 0.16 0.51 0.49 0.56 0.27 0.34 0.19 0.34 0.30 0.17 0.43 0.18 0.16 0.56 0.3 0.1P2O5 0.07 0.07 0.04 0.04 0.07 0.06 0.02 0.03 0.04 0.03 0.1 0.005 0.02 0.06 0.01 0.10 0.0 0.0LOI 33.59 27.79 27.17 20.87 19.32 17.92 28.55 27.58 36.85 27.79 27.82 36.79 23.65 31.28 17.92 36.85 27.6 5.6Total 98.38 98.22 99.94 100.9 100.8 99.34 98.44 99.6 98.45 99.39 99.64 96.97 99.49 99.91 96.97 100.9 99.3 1.0Mg/Ca 0.59 0.55 0.53 0.57 0.44 0.32 0.48 0.56 0.55 0.49 0.03 0.50 0.53 0.49 0.03 0.59 0.47 0.15Calcif. Ind. 9.7 5.3 13.9 2.8 2.8 2.3 5.8 4.7 14.9 4.4 7.2 16.4 3.3 6.1 2.3 16.4 7.1 4.8Hydr. Ind. 10.2 5.8 14.3 3.2 3.3 2.8 6.4 5.2 15.4 4.9 7.7 16.9 3.9 6.7 2.8 16.9 7.6 4.7Salin. Ind. 0.08 0.07 0.09 0.09 0.21 0.14 0.04 0.09 0.07 0.04 0.10 0.10 0.04 0.27 0.04 0.27 0.10 0.07
ppmCr 10 20 10 30 30 30 20 30 40 30 20 10 20 10 10 40 22.0 9.4V 35 44 23 47 54 57 32 72 41 54 45 25 53 65 23 72 46.1 13.8Sc 5 7 3 8 8 8 7 22 21 9 6 16 25 32 3 32 12.4 8.6Co 14 15 13 9 7 7 11 15 10 12 0.5 8 16 14 0.5 16 10.8 4.1Ni 12 16 11 10 11 13 15 28 10 19 10 7 14 20 7 28 14.3 5.3Zn 12 12 6 11 12 14 24 21 19 30 11 33 18 20 6 78 21.4 17.3Cu 4 4 7 3 3 4 5 12 5 7 3 4 17 6 3 28 7.5 6.8Cs 5.6 7 1.9 7.4 8.6 10.6 10.9 14.6 5.2 18.1 13.3 5.2 6.8 15 1.9 30 10.7 6.9Ba 693 153 503 180 242 241 264 2994 293 233 1703 12040 400 2443 153 12040 1575.0 3028.5Rb 48 68 23 80 82 98 70 85 37 97 61 36 64 76 23 98 65.7 22.2Sr 123 134 59 90 138 154 62 132 62 89 244 141 43 83 43 244 115.2 53.3Pb 2.5 8 2.5 2.5 2.5 7 2.5 2.5 2.5 2.5 2.5 2.5 11 2.5 2.5 24 5.2 5.8Y 23 33 24 33 27 29 37 57 91 42 19 62 72 40 19 91 42.7 20.4Th 5.7 8.4 4.7 12 11.7 13.8 10.8 11.1 21.8 10.6 6.3 3.3 15.8 6 3.3 21.8 10.1 4.8U 1.8 2 1.1 3 2.4 2.8 1.5 1.7 2.4 1.4 2.4 0.8 2.7 0.8 0.8 3 1.9 0.7Zr 82 153 77 234 245 265 134 102 69 109 96 49 118 38 38 265 123.8 71.0Hf 2.1 3.9 2 5.9 5.9 6.9 3.5 2.7 2 2.8 2.5 1.4 3.2 1.1 1.1 6.9 3.2 1.7Nb 5 8 3 11 10 12 6 7 4 7 6 4 10 4 3 12 6.9 2.8La 23.7 34.3 17.9 35.0 31.6 37.1 31.7 20.8 16.5 37.2 16.8 20.1 23.2 24.4 16.5 53.7 28.3 10.2Ce 43.9 51.0 25.4 65.8 63.6 74.9 52.6 42.2 40.1 60.4 34.0 37.5 56.3 50.3 25.4 74.9 51.3 14.4Pr 5.5 8.0 4.7 8.4 7.2 8.5 8.0 6.0 5.7 9.0 3.8 5.1 7.8 6.1 3.79 11.3 7.0 2.0Nd 19.5 29.0 17.1 29.6 25.9 30.2 31.1 23.5 24.4 33.6 13.5 20.7 33.3 23.9 13.5 42.1 26.5 7.3Sm 4.2 6.3 3.7 6.3 5.2 6.0 7.2 7.1 8.8 8.0 2.8 6.1 10.3 6.8 2.8 10.3 6.6 2.1Eu 0.8 1.3 0.8 1.3 0.9 1.1 1.6 2.0 3.3 1.7 0.5 2.0 2.9 1.9 0.49 3.29 1.6 0.8Gd 4.0 6.1 3.6 5.7 4.4 5.3 7.6 9.4 13.0 7.7 2.8 8.2 12.7 8.8 2.8 13 7.3 3.1Tb 0.7 1.1 0.7 1.1 0.8 0.9 1.3 2.0 3.0 1.2 0.5 1.7 2.6 1.5 0.5 3 1.4 0.7Dy 4.1 6.2 4.1 6.5 4.8 5.6 6.8 11.7 19.0 7.3 3.2 10.7 15.4 8.8 3.2 19 8.3 4.4Ho 0.8 1.2 0.8 1.3 0.9 1.1 1.3 2.2 3.7 1.4 0.7 2.1 3.0 1.5 0.7 3.7 1.6 0.9Er 2.3 3.4 2.5 3.6 2.7 3.3 3.5 5.8 9.8 3.8 1.8 6.2 8.1 4.0 1.8 9.8 4.4 2.2Tm 0.4 0.5 0.4 0.6 0.4 0.5 0.5 0.8 1.4 0.5 0.3 0.9 1.2 0.6 0.28 1.41 0.6 0.3Yb 2.4 3.6 2.4 3.7 2.9 3.4 3.3 5.3 8.6 3.4 1.8 5.5 7.4 3.8 1.8 8.6 4.2 1.9Lu 0.4 0.6 0.4 0.6 0.5 0.6 0.5 0.8 1.3 0.5 0.3 0.8 1.1 0.6 0.28 1.25 0.6 0.3ΣREE 151.9 157.1 152.6 169.4 178.5 175.8 112.6 84.5 139.6 158.5 82.7 127.6 185.3 143.0 82.7 226.6 149.7 37.8Ce/Ce* 0.96 0.76 0.70 0.88 0.96 0.75 0.88 0.64 0.88 0.97 0.97 0.85 0.98 0.95 0.64 0.98 0.9 0.1Eu/Eu* 0.59 0.66 0.62 0.64 0.59 0.65 0.63 0.64 0.76 0.94 0.53 0.84 0.78 0.74 0.47 0.94 0.7 0.1(La/Yb)N 7.36 6.49 6.44 6.39 7.37 7.39 6.67 5.04 2.65 1.30 6.31 2.47 2.12 4.34 1.30 7.39 5.3 2.1
Calcif. Ind. = calcification index: (CaO + MgO)/Al2O3; Hydr. Ind. = hydrolysis index: (CaO + MgO + K2O + Na2O)/Al2O3; Salin. Ind. = salinisation index: Na2O/K2O. Min., Max., Mean, and σ refer to the minimum, maximum, mean, and standarddeviation values, respectively.
136R.Sinisietal./Palaeogeography,Palaeoclim
atology,Palaeoecology396
(2014)132
–154
137R. Sinisi et al. / Palaeogeography, Palaeoclimatology, Palaeoecology 396 (2014) 132–154
regarded as suitable subjects for the purposes of this research. Theywere sampled for mineralogical and geochemical analyses.
2.2. Permian and Triassic successions of southern Sardinia
Continental sediments of Triassic age, comparable with those ofNurra (Pecorini, 1974), occur in the central and southeastern areas ofSardinia, namely Escalaplano and Guardia Pisano (Fig. 1). TheEscalaplano Formation represents the base of the Triassic sedimentarycycle of southeastern Sardinia, which is developed from the upperAnisian to lower Ladinian (Costamagna et al., 2000). This formation isdivided into four lithofacies that define a fining-upward trend. Upwardsthrough the sequence, coarse sediments of an alluvial fan system show atransition to a 20 m thick alternation of thin plane-parallel clayey, siltyand marly layers. Gypsum deposits, indicating an alluvial plain deposi-tional environment where ephemeral lakes and/or weakly evaporitelagoons formed, mark the top of the sequence.
The final group of clastic deposits considered in this paper belongs tothe Guardia Pisano Basin, which is located in the external zone of thechain (close to the foreland), likely bounded by a collisional backthrust(Funedda, 2009) that acts as low-angle normal fault. These lower–middlePermian deposits are composed of sediments similar to the Permian andTriassic red beds of the Nurra and Escalaplano basins. Detailed strati-graphic descriptions and facies analysis of the Guardia Pisano successionwere made by Barca and Costamagna (2006) and Ronchi et al. (2008),who subdivided the succession into three and four lithostratigraphicunits, respectively, describing a discontinuous volcano-sedimentary suc-cession interrupted by high stratigraphic gaps. The succession comprisesconglomerate and micro-conglomerate layers or lenses within thicksandstones and siltstone red beds. The sampled shales and siltstonescharacterise the lithofacies D, sensu Ronchi et al. (2008), which is com-posed of grey to red sandstones and shales typical of a floodplain deposi-tional system.
3. Sampling and methods
Fortyone samples were collected from the bottom to the top of thesequences described above (Fig. 2). As shown in Fig. 2, most of the sam-ples were taken from the Nurra succession due to its widespread expo-sure. Twenty-seven samples were shales and sandstones. Of these, 15were collected from the Permian–Triassic Nurra succession (NT andNP samples), seven were from the Triassic Escalaplano succession(ET), and five from the Permian Guardia Pisano sediments (GPP). Four-teen samples were carbonate concretions developed within shales ofthe Nurra succession (NTc and NPc based on their Triassic or Permianage) and locally associated with palaeosol horizons (dolocretes orcalcretes).
All samples were first dried and then milled in a planetary mill(Retsch) equipped with two agate jars and agate milling balls to obtaina very fine powder suitable for the chemical andmineralogical analyses.Whole-rock mineralogy was determined by X-ray powder diffraction(XRPD) using a Siemens D5000 powder diffractometer (Cu-Kα radia-tion, 40 kV, 30 mA, step size 0.02° (2θ)). Quantitative mineralogicalanalysis was performed on random powders by measuring peak areasusing DIFFRACplus EVA software (Bruker AXS). The strongest reflectionof each mineral was considered, except for quartz for which theline at 4.26 Å was used instead of the peak at 3.34 Å to avoid super-imposition with the 10-Å mineral peak. Following Laviano (1987)and Cavalcante et al. (2007), the amount of phyllosilicates (clay min-erals and muscovite) was estimated by measuring the 4.5 Å peakarea. Elemental analyses for major, trace, and rare earth element con-centrations were obtained by inductively coupled plasma–mass spec-trometry (ICP-MS) and instrumental neutron activation analysis(INAA) at Activation Laboratories (Ancaster, Canada). Analytical uncer-tainties were less than ±5%, except for those elements occurring at aconcentration of 10 ppm or lower, for which the uncertainties were
±5%–10%. Total loss on ignition (LOI) was gravimetrically estimatedafter overnight heating at 950 °C. W-2a, DNC-1, BIR-1a, LKSD-3,WMG-1, NCS DC700009 (GBW 07241), NCS DC70014, NCS DC86312,OREAS 100a, OREAS 101a, CTC-AC-1, TDB-1, GXR-2, and JR-1 are thestandard reference materials that were used for the instrumental cali-bration and direct rock comparison.
The texture, mineralogy, and microchemistry of polished sections ofrepresentative samples were analyzed using an EVO LS10 Zeiss LaB6
environmental scanning electron microscope (ESEM) equipped with anenergy dispersion spectrometer (EDS). Before applying palaeoweatheringproxies to the analyzed red beds, the CaO fraction related to carbonatephases (calcite and dolomite detected and quantified by XRD analysis)was extracted from the measured CaO percentage of all samples.
4. Results
The mineralogical and chemical data of the analyzed sediments arepresented in Tables 1–3 respectively. These data refer to the siltstonesand shales of the three studied successions and to the dolocrete and car-bonate concretions of Nurra. The data have been arranged according tothe stratigraphic positions of samples, from the top to the bottom of thesuccessions.
4.1. Whole-rock mineralogy
4.1.1. Carbonate concretionsThe carbonate concretions sampled from the Triassic and Permian
Nurra shales show amineralogical association dominated by carbonates(calcite and dolomite) and silicate minerals (clay minerals and quartz).Very high contents of dolomite and minor calcite were detected in allsamples. Dolomite makes up 20%–79% of the Triassic samples and49%–75% of the Permian samples. Calcite is found chiefly inmicroscopicveins cross-cutting both dolomite and Fe oxides, making up 1%–6% and1%–2% of the rock mass, respectively, in Triassic and Permian concre-tions, except for the sample NPc4 in which the calcite content is 60%.In most of the concretions, scarce amounts of Fe oxide (hematite, 1%)are also found. Very low percentages of feldspar (1%) are observed intwo Triassic concretions (NTc2 and NTc1). Barite content is below 1%and locally is concentrated in centimetre-scale crystals and rosettes.Traces of rutile are also founded in the samples NPc3 and NPc7. ESEM-EDS analyses of the Triassic samples show dolomite concretionsrimmed by radial intergrowths of dolomite and mostly dissolved,ghost-mineral phases (most likely chlorides) rich in Cl, Mg, and Ca. Be-cause of their very similar compositions and to simplify discussion, thecarbonate concretions of the Nurra succession are herein regarded asdolocretes.
4.1.2. Siliciclastic sedimentsThe Permian and Triassic siltstones and shales of the sedimentary
basins of northwestern and southern Sardinia are characterised by sim-ilar mineralogical compositions. The Triassic sediments of the Nurrasuccession are composed of phyllosilicates (such as illite and musco-vite) and quartz as the main mineral phases (Table 1). Dolomite is thesole carbonate phase in these samples. Feldspars (mainly plagioclaseand K-feldspar) and hematite occur as accessory minerals.
The Triassic shales of the Escalaplano Basin, aswell as those of Nurra,are composed mainly of phyllosilicates (mostly illite and muscovite)predominant over quartz, calcite, and/or dolomite, and hematite andminor amounts of feldspars. Phyllosilicates are the main minerals inthe shales (71%–86%). Quartz (ranging from 5% to 9%), calcite (rangingfrom 8% to 14%), and dolomite (3% and 12%) are the most abundantphases among the non-phyllosilicate minerals. Hematite and feldsparsare scarce and their concentrations do not exceed 1%. Two samples con-tain gypsum (ET4 = 7% and ET3 = 5%).
The Permian siliciclastic sediments of the Nurra succession show amineralogical composition including only phyllosilicates (26% to 86%)
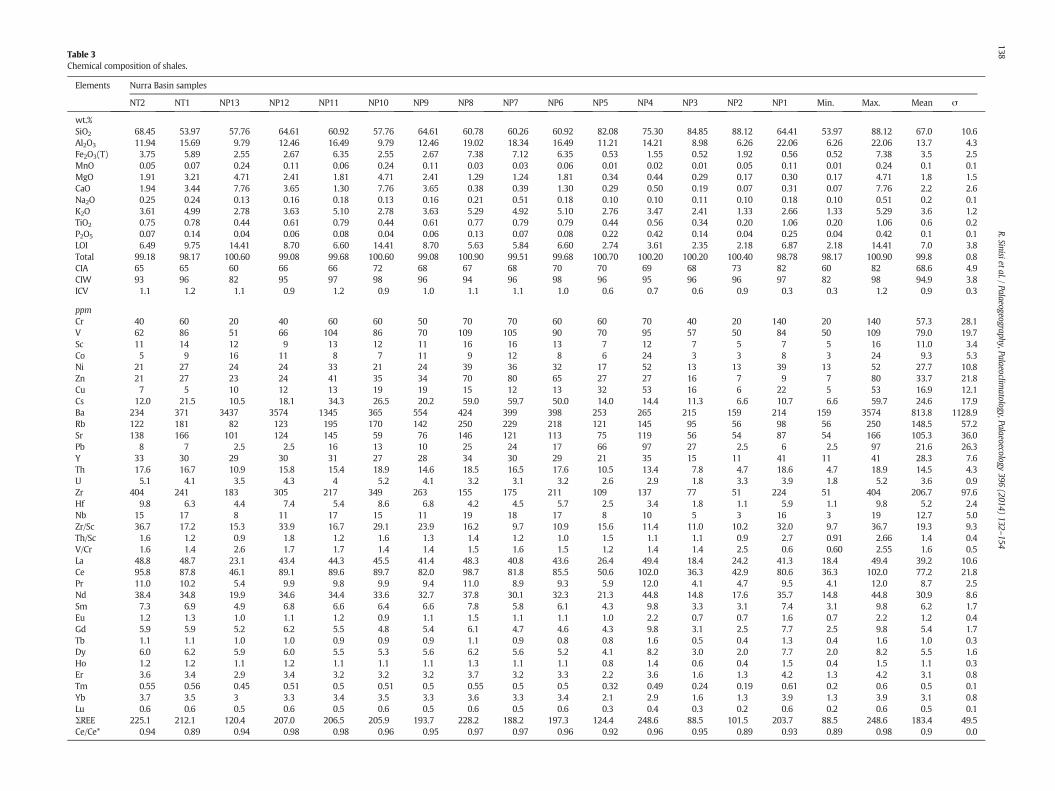
Table 3Chemical composition of shales.
Elements Nurra Basin samples
NT2 NT1 NP13 NP12 NP11 NP10 NP9 NP8 NP7 NP6 NP5 NP4 NP3 NP2 NP1 Min. Max. Mean σ
wt.%SiO2 68.45 53.97 57.76 64.61 60.92 57.76 64.61 60.78 60.26 60.92 82.08 75.30 84.85 88.12 64.41 53.97 88.12 67.0 10.6Al2O3 11.94 15.69 9.79 12.46 16.49 9.79 12.46 19.02 18.34 16.49 11.21 14.21 8.98 6.26 22.06 6.26 22.06 13.7 4.3Fe2O3(T) 3.75 5.89 2.55 2.67 6.35 2.55 2.67 7.38 7.12 6.35 0.53 1.55 0.52 1.92 0.56 0.52 7.38 3.5 2.5MnO 0.05 0.07 0.24 0.11 0.06 0.24 0.11 0.03 0.03 0.06 0.01 0.02 0.01 0.05 0.11 0.01 0.24 0.1 0.1MgO 1.91 3.21 4.71 2.41 1.81 4.71 2.41 1.29 1.24 1.81 0.34 0.44 0.29 0.17 0.30 0.17 4.71 1.8 1.5CaO 1.94 3.44 7.76 3.65 1.30 7.76 3.65 0.38 0.39 1.30 0.29 0.50 0.19 0.07 0.31 0.07 7.76 2.2 2.6Na2O 0.25 0.24 0.13 0.16 0.18 0.13 0.16 0.21 0.51 0.18 0.10 0.10 0.11 0.10 0.18 0.10 0.51 0.2 0.1K2O 3.61 4.99 2.78 3.63 5.10 2.78 3.63 5.29 4.92 5.10 2.76 3.47 2.41 1.33 2.66 1.33 5.29 3.6 1.2TiO2 0.75 0.78 0.44 0.61 0.79 0.44 0.61 0.77 0.79 0.79 0.44 0.56 0.34 0.20 1.06 0.20 1.06 0.6 0.2P2O5 0.07 0.14 0.04 0.06 0.08 0.04 0.06 0.13 0.07 0.08 0.22 0.42 0.14 0.04 0.25 0.04 0.42 0.1 0.1LOI 6.49 9.75 14.41 8.70 6.60 14.41 8.70 5.63 5.84 6.60 2.74 3.61 2.35 2.18 6.87 2.18 14.41 7.0 3.8Total 99.18 98.17 100.60 99.08 99.68 100.60 99.08 100.90 99.51 99.68 100.70 100.20 100.20 100.40 98.78 98.17 100.90 99.8 0.8CIA 65 65 60 66 66 72 68 67 68 70 70 69 68 73 82 60 82 68.6 4.9CIW 93 96 82 95 97 98 96 94 96 98 96 95 96 96 97 82 98 94.9 3.8ICV 1.1 1.2 1.1 0.9 1.2 0.9 1.0 1.1 1.1 1.0 0.6 0.7 0.6 0.9 0.3 0.3 1.2 0.9 0.3
ppmCr 40 60 20 40 60 60 50 70 70 60 60 70 40 20 140 20 140 57.3 28.1V 62 86 51 66 104 86 70 109 105 90 70 95 57 50 84 50 109 79.0 19.7Sc 11 14 12 9 13 12 11 16 16 13 7 12 7 5 7 5 16 11.0 3.4Co 5 9 16 11 8 7 11 9 12 8 6 24 3 3 8 3 24 9.3 5.3Ni 21 27 24 24 33 21 24 39 36 32 17 52 13 13 39 13 52 27.7 10.8Zn 21 27 23 24 41 35 34 70 80 65 27 27 16 7 9 7 80 33.7 21.8Cu 7 5 10 12 13 19 19 15 12 13 32 53 16 6 22 5 53 16.9 12.1Cs 12.0 21.5 10.5 18.1 34.3 26.5 20.2 59.0 59.7 50.0 14.0 14.4 11.3 6.6 10.7 6.6 59.7 24.6 17.9Ba 234 371 3437 3574 1345 365 554 424 399 398 253 265 215 159 214 159 3574 813.8 1128.9Rb 122 181 82 123 195 170 142 250 229 218 121 145 95 56 98 56 250 148.5 57.2Sr 138 166 101 124 145 59 76 146 121 113 75 119 56 54 87 54 166 105.3 36.0Pb 8 7 2.5 2.5 16 13 10 25 24 17 66 97 27 2.5 6 2.5 97 21.6 26.3Y 33 30 29 30 31 27 28 34 30 29 21 35 15 11 41 11 41 28.3 7.6Th 17.6 16.7 10.9 15.8 15.4 18.9 14.6 18.5 16.5 17.6 10.5 13.4 7.8 4.7 18.6 4.7 18.9 14.5 4.3U 5.1 4.1 3.5 4.3 4 5.2 4.1 3.2 3.1 3.2 2.6 2.9 1.8 3.3 3.9 1.8 5.2 3.6 0.9Zr 404 241 183 305 217 349 263 155 175 211 109 137 77 51 224 51 404 206.7 97.6Hf 9.8 6.3 4.4 7.4 5.4 8.6 6.8 4.2 4.5 5.7 2.5 3.4 1.8 1.1 5.9 1.1 9.8 5.2 2.4Nb 15 17 8 11 17 15 11 19 18 17 8 10 5 3 16 3 19 12.7 5.0Zr/Sc 36.7 17.2 15.3 33.9 16.7 29.1 23.9 16.2 9.7 10.9 15.6 11.4 11.0 10.2 32.0 9.7 36.7 19.3 9.3Th/Sc 1.6 1.2 0.9 1.8 1.2 1.6 1.3 1.4 1.2 1.0 1.5 1.1 1.1 0.9 2.7 0.91 2.66 1.4 0.4V/Cr 1.6 1.4 2.6 1.7 1.7 1.4 1.4 1.5 1.6 1.5 1.2 1.4 1.4 2.5 0.6 0.60 2.55 1.6 0.5La 48.8 48.7 23.1 43.4 44.3 45.5 41.4 48.3 40.8 43.6 26.4 49.4 18.4 24.2 41.3 18.4 49.4 39.2 10.6Ce 95.8 87.8 46.1 89.1 89.6 89.7 82.0 98.7 81.8 85.5 50.6 102.0 36.3 42.9 80.6 36.3 102.0 77.2 21.8Pr 11.0 10.2 5.4 9.9 9.8 9.9 9.4 11.0 8.9 9.3 5.9 12.0 4.1 4.7 9.5 4.1 12.0 8.7 2.5Nd 38.4 34.8 19.9 34.6 34.4 33.6 32.7 37.8 30.1 32.3 21.3 44.8 14.8 17.6 35.7 14.8 44.8 30.9 8.6Sm 7.3 6.9 4.9 6.8 6.6 6.4 6.6 7.8 5.8 6.1 4.3 9.8 3.3 3.1 7.4 3.1 9.8 6.2 1.7Eu 1.2 1.3 1.0 1.1 1.2 0.9 1.1 1.5 1.1 1.1 1.0 2.2 0.7 0.7 1.6 0.7 2.2 1.2 0.4Gd 5.9 5.9 5.2 6.2 5.5 4.8 5.4 6.1 4.7 4.6 4.3 9.8 3.1 2.5 7.7 2.5 9.8 5.4 1.7Tb 1.1 1.1 1.0 1.0 0.9 0.9 0.9 1.1 0.9 0.8 0.8 1.6 0.5 0.4 1.3 0.4 1.6 1.0 0.3Dy 6.0 6.2 5.9 6.0 5.5 5.3 5.6 6.2 5.6 5.2 4.1 8.2 3.0 2.0 7.7 2.0 8.2 5.5 1.6Ho 1.2 1.2 1.1 1.2 1.1 1.1 1.1 1.3 1.1 1.1 0.8 1.4 0.6 0.4 1.5 0.4 1.5 1.1 0.3Er 3.6 3.4 2.9 3.4 3.2 3.2 3.2 3.7 3.2 3.3 2.2 3.6 1.6 1.3 4.2 1.3 4.2 3.1 0.8Tm 0.55 0.56 0.45 0.51 0.5 0.51 0.5 0.55 0.5 0.5 0.32 0.49 0.24 0.19 0.61 0.2 0.6 0.5 0.1Yb 3.7 3.5 3 3.3 3.4 3.5 3.3 3.6 3.3 3.4 2.1 2.9 1.6 1.3 3.9 1.3 3.9 3.1 0.8Lu 0.6 0.6 0.5 0.6 0.5 0.6 0.5 0.6 0.5 0.6 0.3 0.4 0.3 0.2 0.6 0.2 0.6 0.5 0.1ΣREE 225.1 212.1 120.4 207.0 206.5 205.9 193.7 228.2 188.2 197.3 124.4 248.6 88.5 101.5 203.7 88.5 248.6 183.4 49.5Ce/Ce* 0.94 0.89 0.94 0.98 0.98 0.96 0.95 0.97 0.97 0.96 0.92 0.96 0.95 0.89 0.93 0.89 0.98 0.9 0.0
138R.Sinisietal./Palaeogeography,Palaeoclim
atology,Palaeoecology396
(2014)132
–154
Elements
Nurra Basin samples
NT2 NT1 NP13 NP12 NP11 NP10 NP9 NP8 NP7 NP6 NP5 NP4 NP3 NP2 NP1 Min. Max. Mean σ
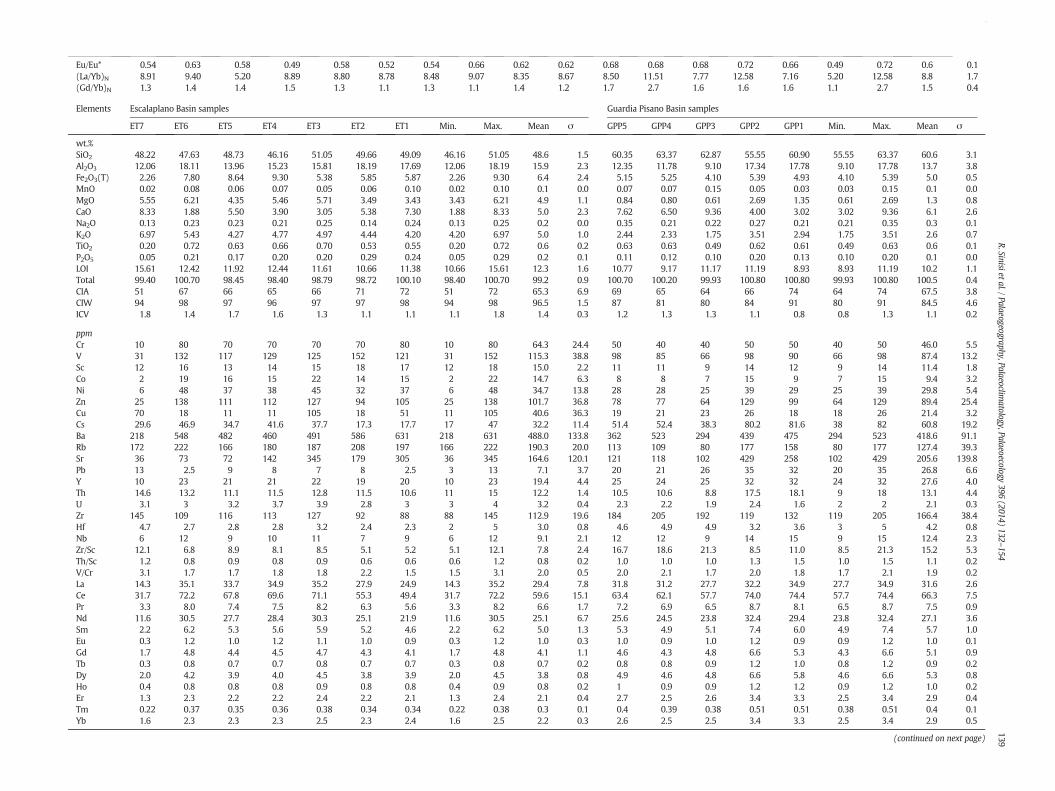
Eu/Eu* 0.54 0.63 0.58 0.49 0.58 0.52 0.54 0.66 0.62 0.62 0.68 0.68 0.68 0.72 0.66 0.49 0.72 0.6 0.1(La/Yb)N 8.91 9.40 5.20 8.89 8.80 8.78 8.48 9.07 8.35 8.67 8.50 11.51 7.77 12.58 7.16 5.20 12.58 8.8 1.7(Gd/Yb)N 1.3 1.4 1.4 1.5 1.3 1.1 1.3 1.1 1.4 1.2 1.7 2.7 1.6 1.6 1.6 1.1 2.7 1.5 0.4
Elements Escalaplano Basin samples Guardia Pisano Basin samples
ET7 ET6 ET5 ET4 ET3 ET2 ET1 Min. Max. Mean σ GPP5 GPP4 GPP3 GPP2 GPP1 Min. Max. Mean σ
wt.%SiO2 48.22 47.63 48.73 46.16 51.05 49.66 49.09 46.16 51.05 48.6 1.5 60.35 63.37 62.87 55.55 60.90 55.55 63.37 60.6 3.1Al2O3 12.06 18.11 13.96 15.23 15.81 18.19 17.69 12.06 18.19 15.9 2.3 12.35 11.78 9.10 17.34 17.78 9.10 17.78 13.7 3.8Fe2O3(T) 2.26 7.80 8.64 9.30 5.38 5.85 5.87 2.26 9.30 6.4 2.4 5.15 5.25 4.10 5.39 4.93 4.10 5.39 5.0 0.5MnO 0.02 0.08 0.06 0.07 0.05 0.06 0.10 0.02 0.10 0.1 0.0 0.07 0.07 0.15 0.05 0.03 0.03 0.15 0.1 0.0MgO 5.55 6.21 4.35 5.46 5.71 3.49 3.43 3.43 6.21 4.9 1.1 0.84 0.80 0.61 2.69 1.35 0.61 2.69 1.3 0.8CaO 8.33 1.88 5.50 3.90 3.05 5.38 7.30 1.88 8.33 5.0 2.3 7.62 6.50 9.36 4.00 3.02 3.02 9.36 6.1 2.6Na2O 0.13 0.23 0.23 0.21 0.25 0.14 0.24 0.13 0.25 0.2 0.0 0.35 0.21 0.22 0.27 0.21 0.21 0.35 0.3 0.1K2O 6.97 5.43 4.27 4.77 4.97 4.44 4.20 4.20 6.97 5.0 1.0 2.44 2.33 1.75 3.51 2.94 1.75 3.51 2.6 0.7TiO2 0.20 0.72 0.63 0.66 0.70 0.53 0.55 0.20 0.72 0.6 0.2 0.63 0.63 0.49 0.62 0.61 0.49 0.63 0.6 0.1P2O5 0.05 0.21 0.17 0.20 0.20 0.29 0.24 0.05 0.29 0.2 0.1 0.11 0.12 0.10 0.20 0.13 0.10 0.20 0.1 0.0LOI 15.61 12.42 11.92 12.44 11.61 10.66 11.38 10.66 15.61 12.3 1.6 10.77 9.17 11.17 11.19 8.93 8.93 11.19 10.2 1.1Total 99.40 100.70 98.45 98.40 98.79 98.72 100.10 98.40 100.70 99.2 0.9 100.70 100.20 99.93 100.80 100.80 99.93 100.80 100.5 0.4CIA 51 67 66 65 66 71 72 51 72 65.3 6.9 69 65 64 66 74 64 74 67.5 3.8CIW 94 98 97 96 97 97 98 94 98 96.5 1.5 87 81 80 84 91 80 91 84.5 4.6ICV 1.8 1.4 1.7 1.6 1.3 1.1 1.1 1.1 1.8 1.4 0.3 1.2 1.3 1.3 1.1 0.8 0.8 1.3 1.1 0.2
ppmCr 10 80 70 70 70 70 80 10 80 64.3 24.4 50 40 40 50 50 40 50 46.0 5.5V 31 132 117 129 125 152 121 31 152 115.3 38.8 98 85 66 98 90 66 98 87.4 13.2Sc 12 16 13 14 15 18 17 12 18 15.0 2.2 11 11 9 14 12 9 14 11.4 1.8Co 2 19 16 15 22 14 15 2 22 14.7 6.3 8 8 7 15 9 7 15 9.4 3.2Ni 6 48 37 38 45 32 37 6 48 34.7 13.8 28 28 25 39 29 25 39 29.8 5.4Zn 25 138 111 112 127 94 105 25 138 101.7 36.8 78 77 64 129 99 64 129 89.4 25.4Cu 70 18 11 11 105 18 51 11 105 40.6 36.3 19 21 23 26 18 18 26 21.4 3.2Cs 29.6 46.9 34.7 41.6 37.7 17.3 17.7 17 47 32.2 11.4 51.4 52.4 38.3 80.2 81.6 38 82 60.8 19.2Ba 218 548 482 460 491 586 631 218 631 488.0 133.8 362 523 294 439 475 294 523 418.6 91.1Rb 172 222 166 180 187 208 197 166 222 190.3 20.0 113 109 80 177 158 80 177 127.4 39.3Sr 36 73 72 142 345 179 305 36 345 164.6 120.1 121 118 102 429 258 102 429 205.6 139.8Pb 13 2.5 9 8 7 8 2.5 3 13 7.1 3.7 20 21 26 35 32 20 35 26.8 6.6Y 10 23 21 21 22 19 20 10 23 19.4 4.4 25 24 25 32 32 24 32 27.6 4.0Th 14.6 13.2 11.1 11.5 12.8 11.5 10.6 11 15 12.2 1.4 10.5 10.6 8.8 17.5 18.1 9 18 13.1 4.4U 3.1 3 3.2 3.7 3.9 2.8 3 3 4 3.2 0.4 2.3 2.2 1.9 2.4 1.6 2 2 2.1 0.3Zr 145 109 116 113 127 92 88 88 145 112.9 19.6 184 205 192 119 132 119 205 166.4 38.4Hf 4.7 2.7 2.8 2.8 3.2 2.4 2.3 2 5 3.0 0.8 4.6 4.9 4.9 3.2 3.6 3 5 4.2 0.8Nb 6 12 9 10 11 7 9 6 12 9.1 2.1 12 12 9 14 15 9 15 12.4 2.3Zr/Sc 12.1 6.8 8.9 8.1 8.5 5.1 5.2 5.1 12.1 7.8 2.4 16.7 18.6 21.3 8.5 11.0 8.5 21.3 15.2 5.3Th/Sc 1.2 0.8 0.9 0.8 0.9 0.6 0.6 0.6 1.2 0.8 0.2 1.0 1.0 1.0 1.3 1.5 1.0 1.5 1.1 0.2V/Cr 3.1 1.7 1.7 1.8 1.8 2.2 1.5 1.5 3.1 2.0 0.5 2.0 2.1 1.7 2.0 1.8 1.7 2.1 1.9 0.2La 14.3 35.1 33.7 34.9 35.2 27.9 24.9 14.3 35.2 29.4 7.8 31.8 31.2 27.7 32.2 34.9 27.7 34.9 31.6 2.6Ce 31.7 72.2 67.8 69.6 71.1 55.3 49.4 31.7 72.2 59.6 15.1 63.4 62.1 57.7 74.0 74.4 57.7 74.4 66.3 7.5Pr 3.3 8.0 7.4 7.5 8.2 6.3 5.6 3.3 8.2 6.6 1.7 7.2 6.9 6.5 8.7 8.1 6.5 8.7 7.5 0.9Nd 11.6 30.5 27.7 28.4 30.3 25.1 21.9 11.6 30.5 25.1 6.7 25.6 24.5 23.8 32.4 29.4 23.8 32.4 27.1 3.6Sm 2.2 6.2 5.3 5.6 5.9 5.2 4.6 2.2 6.2 5.0 1.3 5.3 4.9 5.1 7.4 6.0 4.9 7.4 5.7 1.0Eu 0.3 1.2 1.0 1.2 1.1 1.0 0.9 0.3 1.2 1.0 0.3 1.0 0.9 1.0 1.2 0.9 0.9 1.2 1.0 0.1Gd 1.7 4.8 4.4 4.5 4.7 4.3 4.1 1.7 4.8 4.1 1.1 4.6 4.3 4.8 6.6 5.3 4.3 6.6 5.1 0.9Tb 0.3 0.8 0.7 0.7 0.8 0.7 0.7 0.3 0.8 0.7 0.2 0.8 0.8 0.9 1.2 1.0 0.8 1.2 0.9 0.2Dy 2.0 4.2 3.9 4.0 4.5 3.8 3.9 2.0 4.5 3.8 0.8 4.9 4.6 4.8 6.6 5.8 4.6 6.6 5.3 0.8Ho 0.4 0.8 0.8 0.8 0.9 0.8 0.8 0.4 0.9 0.8 0.2 1 0.9 0.9 1.2 1.2 0.9 1.2 1.0 0.2Er 1.3 2.3 2.2 2.2 2.4 2.2 2.1 1.3 2.4 2.1 0.4 2.7 2.5 2.6 3.4 3.3 2.5 3.4 2.9 0.4Tm 0.22 0.37 0.35 0.36 0.38 0.34 0.34 0.22 0.38 0.3 0.1 0.4 0.39 0.38 0.51 0.51 0.38 0.51 0.4 0.1Yb 1.6 2.3 2.3 2.3 2.5 2.3 2.4 1.6 2.5 2.2 0.3 2.6 2.5 2.5 3.4 3.3 2.5 3.4 2.9 0.5
(continued on next page)
139R.Sinisietal./Palaeogeography,Palaeoclim
atology,Palaeoecology396
(2014)132
–154
Table 3 (continued)
Elements Escalaplano Basin samples Guardia Pisano Basin samples
ET7 ET6 ET5 ET4 ET3 ET2 ET1 Min. Max. Mean σ GPP5 GPP4 GPP3 GPP2 GPP1 Min. Max. Mean σ
Lu 0.3 0.4 0.4 0.4 0.4 0.4 0.4 0.3 0.4 0.4 0.0 0.4 0.4 0.4 0.5 0.5 0.4 0.5 0.5 0.1ΣREE 71.1 169.2 157.9 162.4 168.3 135.6 121.9 71.1 169.2 140.9 35.5 151.7 147.0 139.1 179.3 174.7 139.1 179.3 158.4 17.7Ce/Ce* 1.06 0.98 0.97 0.97 0.96 0.95 0.95 0.95 1.06 1.0 0.0 0.95 0.96 0.98 1.03 1.01 0.95 1.03 1.0 0.0Eu/Eu* 0.49 0.69 0.65 0.70 0.64 0.61 0.63 0.49 0.70 0.6 0.1 0.62 0.61 0.64 0.54 0.51 0.51 0.64 0.6 0.1(La/Yb)N 6.04 10.31 9.90 10.25 9.51 8.20 7.01 6.04 10.31 8.7 1.7 8.26 8.43 7.49 6.40 7.15 6.40 8.43 7.5 0.8(Gd/Yb)N 0.9 1.7 1.6 1.6 1.5 1.5 1.4 0.9 1.7 1.4 0.3 1.4 1.4 1.6 1.6 1.3 1.3 1.6 1.5 0.1
Min., Max., Mean, and σ refer to the minimum, maximum, mean, and standard deviation values respectively.
140R.Sinisietal./Palaeogeography,Palaeoclim
atology,Palaeoecology396
(2014)132
–154
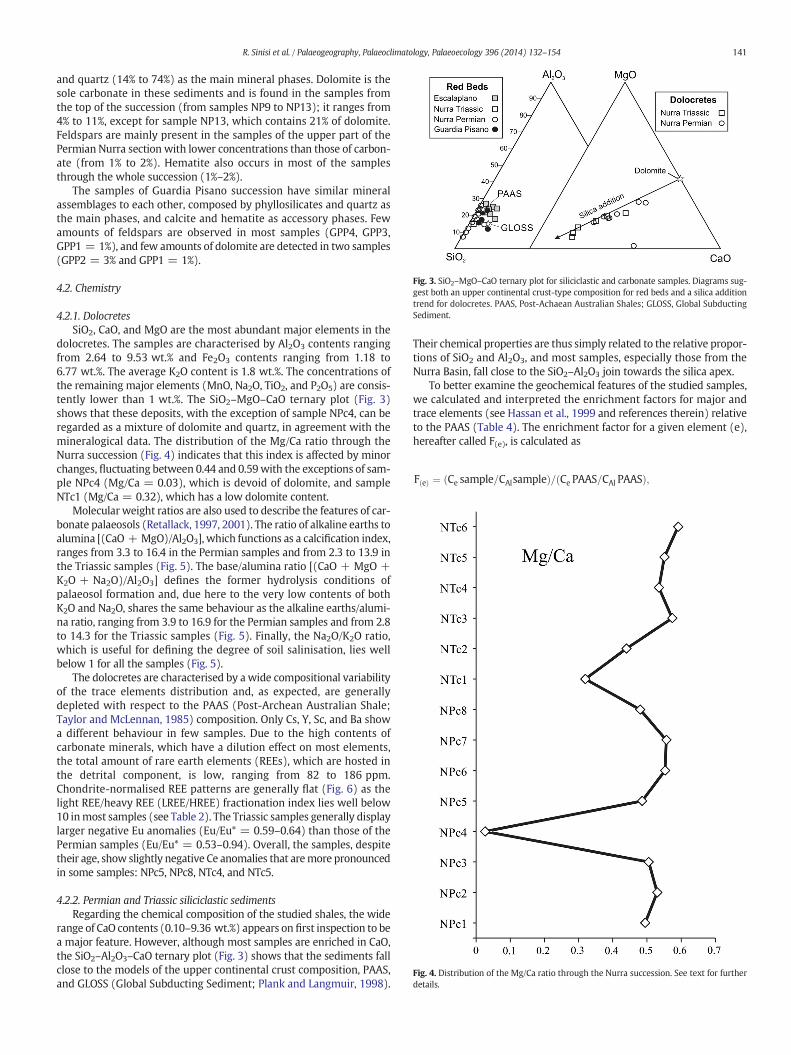
Fig. 4. Distribution of the Mg/Ca ratio through the Nurra succession. See text for furtherdetails.
Fig. 3. SiO2–MgO–CaO ternary plot for siliciclastic and carbonate samples. Diagrams sug-gest both an upper continental crust-type composition for red beds and a silica additiontrend for dolocretes. PAAS, Post-Achaean Australian Shales; GLOSS, Global SubductingSediment.
141R. Sinisi et al. / Palaeogeography, Palaeoclimatology, Palaeoecology 396 (2014) 132–154
and quartz (14% to 74%) as the main mineral phases. Dolomite is thesole carbonate in these sediments and is found in the samples fromthe top of the succession (from samples NP9 to NP13); it ranges from4% to 11%, except for sample NP13, which contains 21% of dolomite.Feldspars are mainly present in the samples of the upper part of thePermian Nurra section with lower concentrations than those of carbon-ate (from 1% to 2%). Hematite also occurs in most of the samplesthrough the whole succession (1%–2%).
The samples of Guardia Pisano succession have similar mineralassemblages to each other, composed by phyllosilicates and quartz asthe main phases, and calcite and hematite as accessory phases. Fewamounts of feldspars are observed in most samples (GPP4, GPP3,GPP1 = 1%), and few amounts of dolomite are detected in two samples(GPP2 = 3% and GPP1 = 1%).
4.2. Chemistry
4.2.1. DolocretesSiO2, CaO, and MgO are the most abundant major elements in the
dolocretes. The samples are characterised by Al2O3 contents rangingfrom 2.64 to 9.53 wt.% and Fe2O3 contents ranging from 1.18 to6.77 wt.%. The average K2O content is 1.8 wt.%. The concentrations ofthe remaining major elements (MnO, Na2O, TiO2, and P2O5) are consis-tently lower than 1 wt.%. The SiO2–MgO–CaO ternary plot (Fig. 3)shows that these deposits, with the exception of sample NPc4, can beregarded as a mixture of dolomite and quartz, in agreement with themineralogical data. The distribution of the Mg/Ca ratio through theNurra succession (Fig. 4) indicates that this index is affected by minorchanges, fluctuating between 0.44 and 0.59 with the exceptions of sam-ple NPc4 (Mg/Ca = 0.03), which is devoid of dolomite, and sampleNTc1 (Mg/Ca = 0.32), which has a low dolomite content.
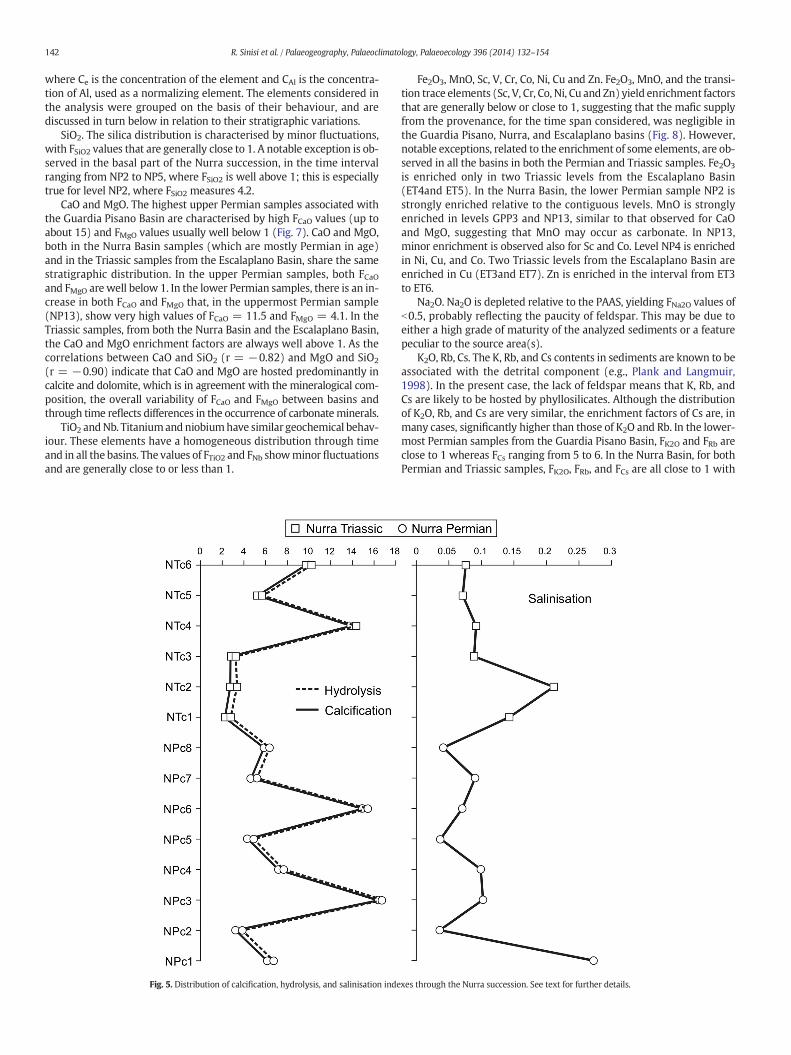
Molecular weight ratios are also used to describe the features of car-bonate palaeosols (Retallack, 1997, 2001). The ratio of alkaline earths toalumina [(CaO + MgO)/Al2O3], which functions as a calcification index,ranges from 3.3 to 16.4 in the Permian samples and from 2.3 to 13.9 inthe Triassic samples (Fig. 5). The base/alumina ratio [(CaO + MgO +K2O + Na2O)/Al2O3] defines the former hydrolysis conditions ofpalaeosol formation and, due here to the very low contents of bothK2O and Na2O, shares the same behaviour as the alkaline earths/alumi-na ratio, ranging from 3.9 to 16.9 for the Permian samples and from 2.8to 14.3 for the Triassic samples (Fig. 5). Finally, the Na2O/K2O ratio,which is useful for defining the degree of soil salinisation, lies wellbelow 1 for all the samples (Fig. 5).
The dolocretes are characterised by a wide compositional variabilityof the trace elements distribution and, as expected, are generallydepleted with respect to the PAAS (Post-Archean Australian Shale;Taylor and McLennan, 1985) composition. Only Cs, Y, Sc, and Ba showa different behaviour in few samples. Due to the high contents ofcarbonate minerals, which have a dilution effect on most elements,the total amount of rare earth elements (REEs), which are hosted inthe detrital component, is low, ranging from 82 to 186 ppm.Chondrite-normalised REE patterns are generally flat (Fig. 6) as thelight REE/heavy REE (LREE/HREE) fractionation index lies well below10 inmost samples (see Table 2). The Triassic samples generally displaylarger negative Eu anomalies (Eu/Eu* = 0.59–0.64) than those of thePermian samples (Eu/Eu* = 0.53–0.94). Overall, the samples, despitetheir age, show slightly negative Ce anomalies that aremore pronouncedin some samples: NPc5, NPc8, NTc4, and NTc5.
4.2.2. Permian and Triassic siliciclastic sedimentsRegarding the chemical composition of the studied shales, the wide
range of CaO contents (0.10–9.36 wt.%) appears on first inspection to bea major feature. However, although most samples are enriched in CaO,the SiO2–Al2O3–CaO ternary plot (Fig. 3) shows that the sediments fallclose to the models of the upper continental crust composition, PAAS,and GLOSS (Global Subducting Sediment; Plank and Langmuir, 1998).
Their chemical properties are thus simply related to the relative propor-tions of SiO2 and Al2O3, and most samples, especially those from theNurra Basin, fall close to the SiO2–Al2O3 join towards the silica apex.
To better examine the geochemical features of the studied samples,we calculated and interpreted the enrichment factors for major andtrace elements (see Hassan et al., 1999 and references therein) relativeto the PAAS (Table 4). The enrichment factor for a given element (e),hereafter called F(e), is calculated as
F eð Þ ¼ Ce sample=CAlsampleð Þ= Ce PAAS=CAl PAASð Þ;
142 R. Sinisi et al. / Palaeogeography, Palaeoclimatology, Palaeoecology 396 (2014) 132–154
where Ce is the concentration of the element and CAl is the concentra-tion of Al, used as a normalizing element. The elements considered inthe analysis were grouped on the basis of their behaviour, and arediscussed in turn below in relation to their stratigraphic variations.
SiO2. The silica distribution is characterised by minor fluctuations,with FSiO2 values that are generally close to 1. A notable exception is ob-served in the basal part of the Nurra succession, in the time intervalranging from NP2 to NP5, where FSiO2 is well above 1; this is especiallytrue for level NP2, where FSiO2 measures 4.2.
CaO and MgO. The highest upper Permian samples associated withthe Guardia Pisano Basin are characterised by high FCaO values (up toabout 15) and FMgO values usually well below 1 (Fig. 7). CaO and MgO,both in the Nurra Basin samples (which are mostly Permian in age)and in the Triassic samples from the Escalaplano Basin, share the samestratigraphic distribution. In the upper Permian samples, both FCaOand FMgO are well below 1. In the lower Permian samples, there is an in-crease in both FCaO and FMgO that, in the uppermost Permian sample(NP13), show very high values of FCaO = 11.5 and FMgO = 4.1. In theTriassic samples, from both the Nurra Basin and the Escalaplano Basin,the CaO and MgO enrichment factors are always well above 1. As thecorrelations between CaO and SiO2 (r = −0.82) and MgO and SiO2
(r = −0.90) indicate that CaO and MgO are hosted predominantly incalcite and dolomite, which is in agreement with the mineralogical com-position, the overall variability of FCaO and FMgO between basins andthrough time reflects differences in the occurrence of carbonateminerals.
TiO2 andNb. Titaniumandniobiumhave similar geochemical behav-iour. These elements have a homogeneous distribution through timeand in all the basins. The values of FTiO2 and FNb showminor fluctuationsand are generally close to or less than 1.
Fig. 5. Distribution of calcification, hydrolysis, and salinisation inde
Fe2O3, MnO, Sc, V, Cr, Co, Ni, Cu and Zn. Fe2O3, MnO, and the transi-tion trace elements (Sc, V, Cr, Co, Ni, Cu and Zn) yield enrichment factorsthat are generally below or close to 1, suggesting that the mafic supplyfrom the provenance, for the time span considered, was negligible inthe Guardia Pisano, Nurra, and Escalaplano basins (Fig. 8). However,notable exceptions, related to the enrichment of some elements, are ob-served in all the basins in both the Permian and Triassic samples. Fe2O3
is enriched only in two Triassic levels from the Escalaplano Basin(ET4and ET5). In the Nurra Basin, the lower Permian sample NP2 isstrongly enriched relative to the contiguous levels. MnO is stronglyenriched in levels GPP3 and NP13, similar to that observed for CaOand MgO, suggesting that MnO may occur as carbonate. In NP13,minor enrichment is observed also for Sc and Co. Level NP4 is enrichedin Ni, Cu, and Co. Two Triassic levels from the Escalaplano Basin areenriched in Cu (ET3and ET7). Zn is enriched in the interval from ET3to ET6.
Na2O. Na2O is depleted relative to the PAAS, yielding FNa2O values ofb0.5, probably reflecting the paucity of feldspar. This may be due toeither a high grade of maturity of the analyzed sediments or a featurepeculiar to the source area(s).
K2O, Rb, Cs. The K, Rb, and Cs contents in sediments are known to beassociated with the detrital component (e.g., Plank and Langmuir,1998). In the present case, the lack of feldspar means that K, Rb, andCs are likely to be hosted by phyllosilicates. Although the distributionof K2O, Rb, and Cs are very similar, the enrichment factors of Cs are, inmany cases, significantly higher than those of K2O and Rb. In the lower-most Permian samples from the Guardia Pisano Basin, FK2O and FRb areclose to 1 whereas FCs ranging from 5 to 6. In the Nurra Basin, for bothPermian and Triassic samples, FK2O, FRb, and FCs are all close to 1 with
xes through the Nurra succession. See text for further details.
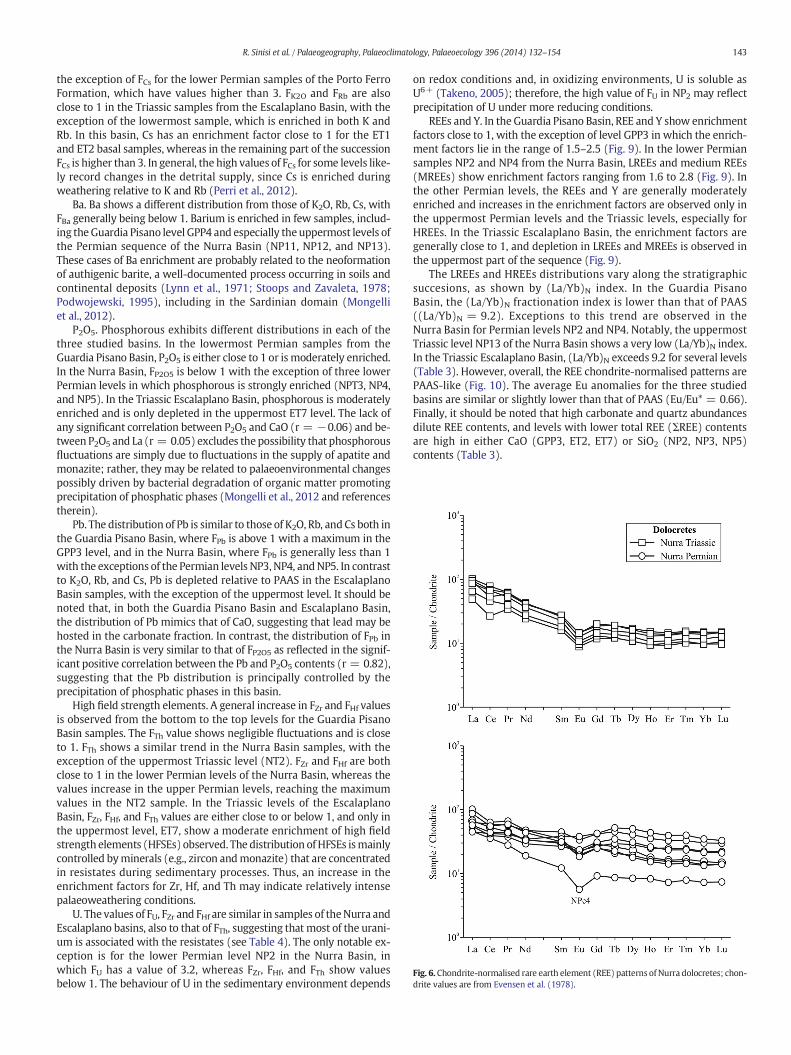
Fig. 6. Chondrite-normalised rare earth element (REE) patterns of Nurra dolocretes; chon-drite values are from Evensen et al. (1978).
143R. Sinisi et al. / Palaeogeography, Palaeoclimatology, Palaeoecology 396 (2014) 132–154
the exception of FCs for the lower Permian samples of the Porto FerroFormation, which have values higher than 3. FK2O and FRb are alsoclose to 1 in the Triassic samples from the Escalaplano Basin, with theexception of the lowermost sample, which is enriched in both K andRb. In this basin, Cs has an enrichment factor close to 1 for the ET1and ET2 basal samples, whereas in the remaining part of the successionFCs is higher than 3. In general, the high values of FCs for some levels like-ly record changes in the detrital supply, since Cs is enriched duringweathering relative to K and Rb (Perri et al., 2012).
Ba. Ba shows a different distribution from those of K2O, Rb, Cs, withFBa generally being below 1. Barium is enriched in few samples, includ-ing theGuardia Pisano level GPP4 and especially theuppermost levels ofthe Permian sequence of the Nurra Basin (NP11, NP12, and NP13).These cases of Ba enrichment are probably related to the neoformationof authigenic barite, a well-documented process occurring in soils andcontinental deposits (Lynn et al., 1971; Stoops and Zavaleta, 1978;Podwojewski, 1995), including in the Sardinian domain (Mongelliet al., 2012).
P2O5. Phosphorous exhibits different distributions in each of thethree studied basins. In the lowermost Permian samples from theGuardia Pisano Basin, P2O5 is either close to 1 or is moderately enriched.In the Nurra Basin, FP2O5 is below 1 with the exception of three lowerPermian levels in which phosphorous is strongly enriched (NPT3, NP4,and NP5). In the Triassic Escalaplano Basin, phosphorous is moderatelyenriched and is only depleted in the uppermost ET7 level. The lack ofany significant correlation between P2O5 and CaO (r = −0.06) and be-tween P2O5 and La (r = 0.05) excludes the possibility that phosphorousfluctuations are simply due to fluctuations in the supply of apatite andmonazite; rather, they may be related to palaeoenvironmental changespossibly driven by bacterial degradation of organic matter promotingprecipitation of phosphatic phases (Mongelli et al., 2012 and referencestherein).
Pb. The distribution of Pb is similar to those of K2O, Rb, and Cs both inthe Guardia Pisano Basin, where FPb is above 1 with a maximum in theGPP3 level, and in the Nurra Basin, where FPb is generally less than 1with the exceptions of the Permian levels NP3, NP4, andNP5. In contrastto K2O, Rb, and Cs, Pb is depleted relative to PAAS in the EscalaplanoBasin samples, with the exception of the uppermost level. It should benoted that, in both the Guardia Pisano Basin and Escalaplano Basin,the distribution of Pb mimics that of CaO, suggesting that lead may behosted in the carbonate fraction. In contrast, the distribution of FPb inthe Nurra Basin is very similar to that of FP2O5 as reflected in the signif-icant positive correlation between the Pb and P2O5 contents (r = 0.82),suggesting that the Pb distribution is principally controlled by theprecipitation of phosphatic phases in this basin.
High field strength elements. A general increase in FZr and FHf valuesis observed from the bottom to the top levels for the Guardia PisanoBasin samples. The FTh value shows negligible fluctuations and is closeto 1. FTh shows a similar trend in the Nurra Basin samples, with theexception of the uppermost Triassic level (NT2). FZr and FHf are bothclose to 1 in the lower Permian levels of the Nurra Basin, whereas thevalues increase in the upper Permian levels, reaching the maximumvalues in the NT2 sample. In the Triassic levels of the EscalaplanoBasin, FZr, FHf, and FTh values are either close to or below 1, and only inthe uppermost level, ET7, show a moderate enrichment of high fieldstrength elements (HFSEs) observed. The distribution ofHFSEs ismainlycontrolled byminerals (e.g., zircon andmonazite) that are concentratedin resistates during sedimentary processes. Thus, an increase in theenrichment factors for Zr, Hf, and Th may indicate relatively intensepalaeoweathering conditions.
U. The values of FU, FZr and FHf are similar in samples of theNurra andEscalaplano basins, also to that of FTh, suggesting that most of the urani-um is associated with the resistates (see Table 4). The only notable ex-ception is for the lower Permian level NP2 in the Nurra Basin, inwhich FU has a value of 3.2, whereas FZr, FHf, and FTh show valuesbelow 1. The behaviour of U in the sedimentary environment depends
on redox conditions and, in oxidizing environments, U is soluble asU6+ (Takeno, 2005); therefore, the high value of FU in NP2 may reflectprecipitation of U under more reducing conditions.
REEs and Y. In the Guardia Pisano Basin, REE and Y show enrichmentfactors close to 1, with the exception of level GPP3 in which the enrich-ment factors lie in the range of 1.5–2.5 (Fig. 9). In the lower Permiansamples NP2 and NP4 from the Nurra Basin, LREEs and medium REEs(MREEs) show enrichment factors ranging from 1.6 to 2.8 (Fig. 9). Inthe other Permian levels, the REEs and Y are generally moderatelyenriched and increases in the enrichment factors are observed only inthe uppermost Permian levels and the Triassic levels, especially forHREEs. In the Triassic Escalaplano Basin, the enrichment factors aregenerally close to 1, and depletion in LREEs and MREEs is observed inthe uppermost part of the sequence (Fig. 9).
The LREEs and HREEs distributions vary along the stratigraphicsuccesions, as shown by (La/Yb)N index. In the Guardia PisanoBasin, the (La/Yb)N fractionation index is lower than that of PAAS((La/Yb)N = 9.2). Exceptions to this trend are observed in theNurra Basin for Permian levels NP2 and NP4. Notably, the uppermostTriassic level NP13 of the Nurra Basin shows a very low (La/Yb)N index.In the Triassic Escalaplano Basin, (La/Yb)N exceeds 9.2 for several levels(Table 3). However, overall, the REE chondrite-normalised patterns arePAAS-like (Fig. 10). The average Eu anomalies for the three studiedbasins are similar or slightly lower than that of PAAS (Eu/Eu* = 0.66).Finally, it should be noted that high carbonate and quartz abundancesdilute REE contents, and levels with lower total REE (ΣREE) contentsare high in either CaO (GPP3, ET2, ET7) or SiO2 (NP2, NP3, NP5)contents (Table 3).
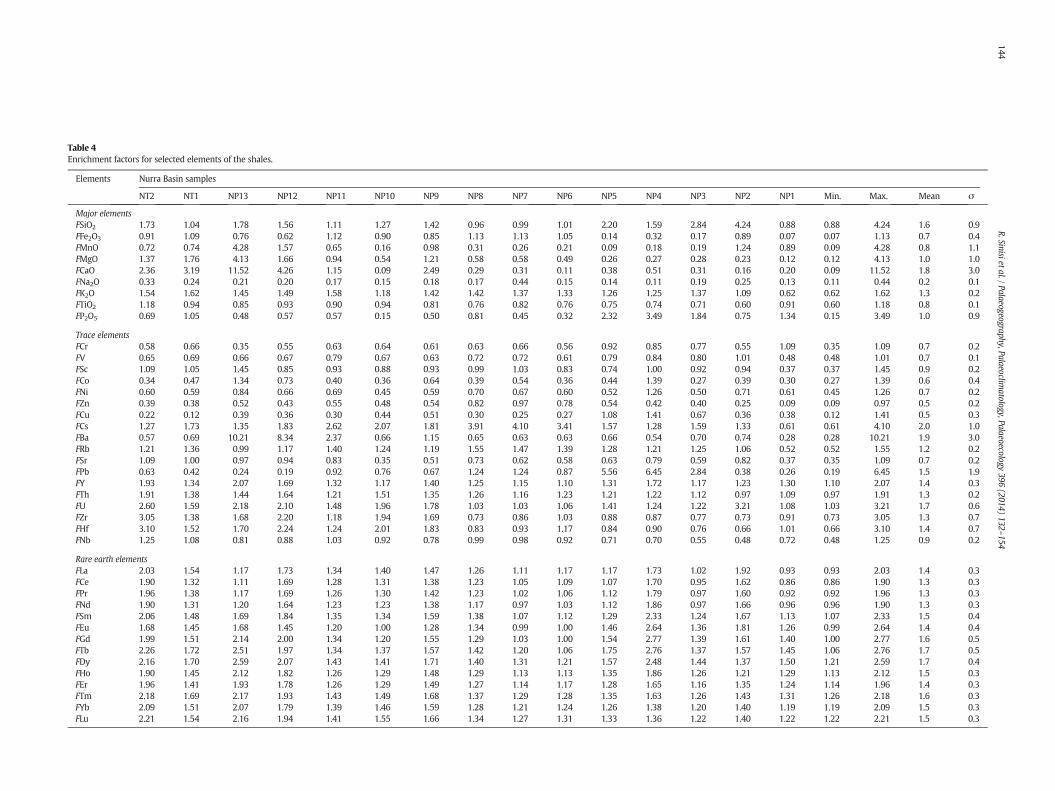
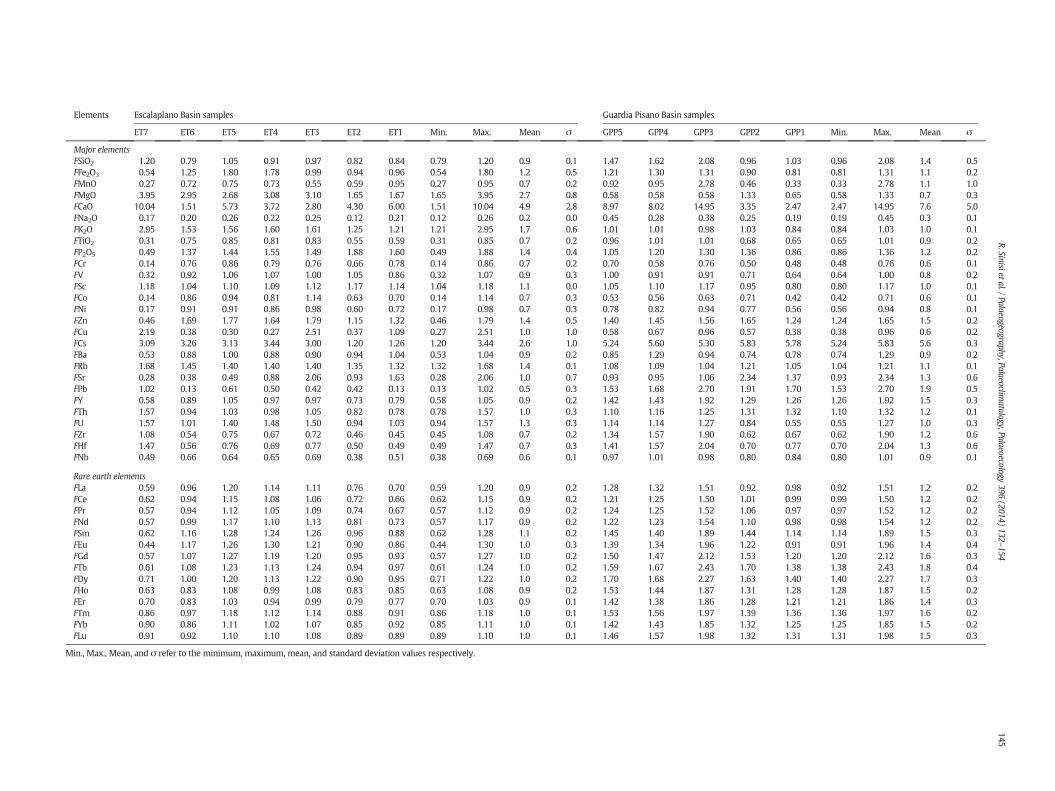
Table 4Enrichment factors for selected elements of the shales.
Elements Nurra Basin samples
NT2 NT1 NP13 NP12 NP11 NP10 NP9 NP8 NP7 NP6 NP5 NP4 NP3 NP2 NP1 Min. Max. Mean σ
Major elementsFSiO2 1.73 1.04 1.78 1.56 1.11 1.27 1.42 0.96 0.99 1.01 2.20 1.59 2.84 4.24 0.88 0.88 4.24 1.6 0.9FFe2O3 0.91 1.09 0.76 0.62 1.12 0.90 0.85 1.13 1.13 1.05 0.14 0.32 0.17 0.89 0.07 0.07 1.13 0.7 0.4FMnO 0.72 0.74 4.28 1.57 0.65 0.16 0.98 0.31 0.26 0.21 0.09 0.18 0.19 1.24 0.89 0.09 4.28 0.8 1.1FMgO 1.37 1.76 4.13 1.66 0.94 0.54 1.21 0.58 0.58 0.49 0.26 0.27 0.28 0.23 0.12 0.12 4.13 1.0 1.0FCaO 2.36 3.19 11.52 4.26 1.15 0.09 2.49 0.29 0.31 0.11 0.38 0.51 0.31 0.16 0.20 0.09 11.52 1.8 3.0FNa2O 0.33 0.24 0.21 0.20 0.17 0.15 0.18 0.17 0.44 0.15 0.14 0.11 0.19 0.25 0.13 0.11 0.44 0.2 0.1FK2O 1.54 1.62 1.45 1.49 1.58 1.18 1.42 1.42 1.37 1.33 1.26 1.25 1.37 1.09 0.62 0.62 1.62 1.3 0.2FTiO2 1.18 0.94 0.85 0.93 0.90 0.94 0.81 0.76 0.82 0.76 0.75 0.74 0.71 0.60 0.91 0.60 1.18 0.8 0.1FP2O5 0.69 1.05 0.48 0.57 0.57 0.15 0.50 0.81 0.45 0.32 2.32 3.49 1.84 0.75 1.34 0.15 3.49 1.0 0.9
Trace elementsFCr 0.58 0.66 0.35 0.55 0.63 0.64 0.61 0.63 0.66 0.56 0.92 0.85 0.77 0.55 1.09 0.35 1.09 0.7 0.2FV 0.65 0.69 0.66 0.67 0.79 0.67 0.63 0.72 0.72 0.61 0.79 0.84 0.80 1.01 0.48 0.48 1.01 0.7 0.1FSc 1.09 1.05 1.45 0.85 0.93 0.88 0.93 0.99 1.03 0.83 0.74 1.00 0.92 0.94 0.37 0.37 1.45 0.9 0.2FCo 0.34 0.47 1.34 0.73 0.40 0.36 0.64 0.39 0.54 0.36 0.44 1.39 0.27 0.39 0.30 0.27 1.39 0.6 0.4FNi 0.60 0.59 0.84 0.66 0.69 0.45 0.59 0.70 0.67 0.60 0.52 1.26 0.50 0.71 0.61 0.45 1.26 0.7 0.2FZn 0.39 0.38 0.52 0.43 0.55 0.48 0.54 0.82 0.97 0.78 0.54 0.42 0.40 0.25 0.09 0.09 0.97 0.5 0.2FCu 0.22 0.12 0.39 0.36 0.30 0.44 0.51 0.30 0.25 0.27 1.08 1.41 0.67 0.36 0.38 0.12 1.41 0.5 0.3FCs 1.27 1.73 1.35 1.83 2.62 2.07 1.81 3.91 4.10 3.41 1.57 1.28 1.59 1.33 0.61 0.61 4.10 2.0 1.0FBa 0.57 0.69 10.21 8.34 2.37 0.66 1.15 0.65 0.63 0.63 0.66 0.54 0.70 0.74 0.28 0.28 10.21 1.9 3.0FRb 1.21 1.36 0.99 1.17 1.40 1.24 1.19 1.55 1.47 1.39 1.28 1.21 1.25 1.06 0.52 0.52 1.55 1.2 0.2FSr 1.09 1.00 0.97 0.94 0.83 0.35 0.51 0.73 0.62 0.58 0.63 0.79 0.59 0.82 0.37 0.35 1.09 0.7 0.2FPb 0.63 0.42 0.24 0.19 0.92 0.76 0.67 1.24 1.24 0.87 5.56 6.45 2.84 0.38 0.26 0.19 6.45 1.5 1.9FY 1.93 1.34 2.07 1.69 1.32 1.17 1.40 1.25 1.15 1.10 1.31 1.72 1.17 1.23 1.30 1.10 2.07 1.4 0.3FTh 1.91 1.38 1.44 1.64 1.21 1.51 1.35 1.26 1.16 1.23 1.21 1.22 1.12 0.97 1.09 0.97 1.91 1.3 0.2FU 2.60 1.59 2.18 2.10 1.48 1.96 1.78 1.03 1.03 1.06 1.41 1.24 1.22 3.21 1.08 1.03 3.21 1.7 0.6FZr 3.05 1.38 1.68 2.20 1.18 1.94 1.69 0.73 0.86 1.03 0.88 0.87 0.77 0.73 0.91 0.73 3.05 1.3 0.7FHf 3.10 1.52 1.70 2.24 1.24 2.01 1.83 0.83 0.93 1.17 0.84 0.90 0.76 0.66 1.01 0.66 3.10 1.4 0.7FNb 1.25 1.08 0.81 0.88 1.03 0.92 0.78 0.99 0.98 0.92 0.71 0.70 0.55 0.48 0.72 0.48 1.25 0.9 0.2
Rare earth elementsFLa 2.03 1.54 1.17 1.73 1.34 1.40 1.47 1.26 1.11 1.17 1.17 1.73 1.02 1.92 0.93 0.93 2.03 1.4 0.3FCe 1.90 1.32 1.11 1.69 1.28 1.31 1.38 1.23 1.05 1.09 1.07 1.70 0.95 1.62 0.86 0.86 1.90 1.3 0.3FPr 1.96 1.38 1.17 1.69 1.26 1.30 1.42 1.23 1.02 1.06 1.12 1.79 0.97 1.60 0.92 0.92 1.96 1.3 0.3FNd 1.90 1.31 1.20 1.64 1.23 1.23 1.38 1.17 0.97 1.03 1.12 1.86 0.97 1.66 0.96 0.96 1.90 1.3 0.3FSm 2.06 1.48 1.69 1.84 1.35 1.34 1.59 1.38 1.07 1.12 1.29 2.33 1.24 1.67 1.13 1.07 2.33 1.5 0.4FEu 1.68 1.45 1.68 1.45 1.20 1.00 1.28 1.34 0.99 1.00 1.46 2.64 1.36 1.81 1.26 0.99 2.64 1.4 0.4FGd 1.99 1.51 2.14 2.00 1.34 1.20 1.55 1.29 1.03 1.00 1.54 2.77 1.39 1.61 1.40 1.00 2.77 1.6 0.5FTb 2.26 1.72 2.51 1.97 1.34 1.37 1.57 1.42 1.20 1.06 1.75 2.76 1.37 1.57 1.45 1.06 2.76 1.7 0.5FDy 2.16 1.70 2.59 2.07 1.43 1.41 1.71 1.40 1.31 1.21 1.57 2.48 1.44 1.37 1.50 1.21 2.59 1.7 0.4FHo 1.90 1.45 2.12 1.82 1.26 1.29 1.48 1.29 1.13 1.13 1.35 1.86 1.26 1.21 1.29 1.13 2.12 1.5 0.3FEr 1.96 1.41 1.93 1.78 1.26 1.29 1.49 1.27 1.14 1.17 1.28 1.65 1.16 1.35 1.24 1.14 1.96 1.4 0.3FTm 2.18 1.69 2.17 1.93 1.43 1.49 1.68 1.37 1.29 1.28 1.35 1.63 1.26 1.43 1.31 1.26 2.18 1.6 0.3FYb 2.09 1.51 2.07 1.79 1.39 1.46 1.59 1.28 1.21 1.24 1.26 1.38 1.20 1.40 1.19 1.19 2.09 1.5 0.3FLu 2.21 1.54 2.16 1.94 1.41 1.55 1.66 1.34 1.27 1.31 1.33 1.36 1.22 1.40 1.22 1.22 2.21 1.5 0.3
144R.Sinisietal./Palaeogeography,Palaeoclim
atology,Palaeoecology396
(2014)132
–154
Elements
Nurra Basin samples
NT2 NT1 NP13 NP12 NP11 NP10 NP9 NP8 NP7 NP6 NP5 NP4 NP3 NP2 NP1 Min. Max. Mean σ
Elements Escalaplano Basin samples Guardia Pisano Basin samples
ET7 ET6 ET5 ET4 ET3 ET2 ET1 Min. Max. Mean σ GPP5 GPP4 GPP3 GPP2 GPP1 Min. Max. Mean σ
Major elementsFSiO2 1.20 0.79 1.05 0.91 0.97 0.82 0.84 0.79 1.20 0.9 0.1 1.47 1.62 2.08 0.96 1.03 0.96 2.08 1.4 0.5FFe2O3 0.54 1.25 1.80 1.78 0.99 0.94 0.96 0.54 1.80 1.2 0.5 1.21 1.30 1.31 0.90 0.81 0.81 1.31 1.1 0.2FMnO 0.27 0.72 0.75 0.73 0.55 0.59 0.95 0.27 0.95 0.7 0.2 0.92 0.95 2.78 0.46 0.33 0.33 2.78 1.1 1.0FMgO 3.95 2.95 2.68 3.08 3.10 1.65 1.67 1.65 3.95 2.7 0.8 0.58 0.58 0.58 1.33 0.65 0.58 1.33 0.7 0.3FCaO 10.04 1.51 5.73 3.72 2.80 4.30 6.00 1.51 10.04 4.9 2.8 8.97 8.02 14.95 3.35 2.47 2.47 14.95 7.6 5.0FNa2O 0.17 0.20 0.26 0.22 0.25 0.12 0.21 0.12 0.26 0.2 0.0 0.45 0.28 0.38 0.25 0.19 0.19 0.45 0.3 0.1FK2O 2.95 1.53 1.56 1.60 1.61 1.25 1.21 1.21 2.95 1.7 0.6 1.01 1.01 0.98 1.03 0.84 0.84 1.03 1.0 0.1FTiO2 0.31 0.75 0.85 0.81 0.83 0.55 0.59 0.31 0.85 0.7 0.2 0.96 1.01 1.01 0.68 0.65 0.65 1.01 0.9 0.2FP2O5 0.49 1.37 1.44 1.55 1.49 1.88 1.60 0.49 1.88 1.4 0.4 1.05 1.20 1.30 1.36 0.86 0.86 1.36 1.2 0.2FCr 0.14 0.76 0.86 0.79 0.76 0.66 0.78 0.14 0.86 0.7 0.2 0.70 0.58 0.76 0.50 0.48 0.48 0.76 0.6 0.1FV 0.32 0.92 1.06 1.07 1.00 1.05 0.86 0.32 1.07 0.9 0.3 1.00 0.91 0.91 0.71 0.64 0.64 1.00 0.8 0.2FSc 1.18 1.04 1.10 1.09 1.12 1.17 1.14 1.04 1.18 1.1 0.0 1.05 1.10 1.17 0.95 0.80 0.80 1.17 1.0 0.1FCo 0.14 0.86 0.94 0.81 1.14 0.63 0.70 0.14 1.14 0.7 0.3 0.53 0.56 0.63 0.71 0.42 0.42 0.71 0.6 0.1FNi 0.17 0.91 0.91 0.86 0.98 0.60 0.72 0.17 0.98 0.7 0.3 0.78 0.82 0.94 0.77 0.56 0.56 0.94 0.8 0.1FZn 0.46 1.69 1.77 1.64 1.79 1.15 1.32 0.46 1.79 1.4 0.5 1.40 1.45 1.56 1.65 1.24 1.24 1.65 1.5 0.2FCu 2.19 0.38 0.30 0.27 2.51 0.37 1.09 0.27 2.51 1.0 1.0 0.58 0.67 0.96 0.57 0.38 0.38 0.96 0.6 0.2FCs 3.09 3.26 3.13 3.44 3.00 1.20 1.26 1.20 3.44 2.6 1.0 5.24 5.60 5.30 5.83 5.78 5.24 5.83 5.6 0.3FBa 0.53 0.88 1.00 0.88 0.90 0.94 1.04 0.53 1.04 0.9 0.2 0.85 1.29 0.94 0.74 0.78 0.74 1.29 0.9 0.2FRb 1.68 1.45 1.40 1.40 1.40 1.35 1.32 1.32 1.68 1.4 0.1 1.08 1.09 1.04 1.21 1.05 1.04 1.21 1.1 0.1FSr 0.28 0.38 0.49 0.88 2.06 0.93 1.63 0.28 2.06 1.0 0.7 0.93 0.95 1.06 2.34 1.37 0.93 2.34 1.3 0.6FPb 1.02 0.13 0.61 0.50 0.42 0.42 0.13 0.13 1.02 0.5 0.3 1.53 1.68 2.70 1.91 1.70 1.53 2.70 1.9 0.5FY 0.58 0.89 1.05 0.97 0.97 0.73 0.79 0.58 1.05 0.9 0.2 1.42 1.43 1.92 1.29 1.26 1.26 1.92 1.5 0.3FTh 1.57 0.94 1.03 0.98 1.05 0.82 0.78 0.78 1.57 1.0 0.3 1.10 1.16 1.25 1.31 1.32 1.10 1.32 1.2 0.1FU 1.57 1.01 1.40 1.48 1.50 0.94 1.03 0.94 1.57 1.3 0.3 1.14 1.14 1.27 0.84 0.55 0.55 1.27 1.0 0.3FZr 1.08 0.54 0.75 0.67 0.72 0.46 0.45 0.45 1.08 0.7 0.2 1.34 1.57 1.90 0.62 0.67 0.62 1.90 1.2 0.6FHf 1.47 0.56 0.76 0.69 0.77 0.50 0.49 0.49 1.47 0.7 0.3 1.41 1.57 2.04 0.70 0.77 0.70 2.04 1.3 0.6FNb 0.49 0.66 0.64 0.65 0.69 0.38 0.51 0.38 0.69 0.6 0.1 0.97 1.01 0.98 0.80 0.84 0.80 1.01 0.9 0.1
Rare earth elementsFLa 0.59 0.96 1.20 1.14 1.11 0.76 0.70 0.59 1.20 0.9 0.2 1.28 1.32 1.51 0.92 0.98 0.92 1.51 1.2 0.2FCe 0.62 0.94 1.15 1.08 1.06 0.72 0.66 0.62 1.15 0.9 0.2 1.21 1.25 1.50 1.01 0.99 0.99 1.50 1.2 0.2FPr 0.57 0.94 1.12 1.05 1.09 0.74 0.67 0.57 1.12 0.9 0.2 1.24 1.25 1.52 1.06 0.97 0.97 1.52 1.2 0.2FNd 0.57 0.99 1.17 1.10 1.13 0.81 0.73 0.57 1.17 0.9 0.2 1.22 1.23 1.54 1.10 0.98 0.98 1.54 1.2 0.2FSm 0.62 1.16 1.28 1.24 1.26 0.96 0.88 0.62 1.28 1.1 0.2 1.45 1.40 1.89 1.44 1.14 1.14 1.89 1.5 0.3FEu 0.44 1.17 1.26 1.30 1.21 0.90 0.86 0.44 1.30 1.0 0.3 1.39 1.34 1.96 1.22 0.91 0.91 1.96 1.4 0.4FGd 0.57 1.07 1.27 1.19 1.20 0.95 0.93 0.57 1.27 1.0 0.2 1.50 1.47 2.12 1.53 1.20 1.20 2.12 1.6 0.3FTb 0.61 1.08 1.23 1.13 1.24 0.94 0.97 0.61 1.24 1.0 0.2 1.59 1.67 2.43 1.70 1.38 1.38 2.43 1.8 0.4FDy 0.71 1.00 1.20 1.13 1.22 0.90 0.95 0.71 1.22 1.0 0.2 1.70 1.68 2.27 1.63 1.40 1.40 2.27 1.7 0.3FHo 0.63 0.83 1.08 0.99 1.08 0.83 0.85 0.63 1.08 0.9 0.2 1.53 1.44 1.87 1.31 1.28 1.28 1.87 1.5 0.2FEr 0.70 0.83 1.03 0.94 0.99 0.79 0.77 0.70 1.03 0.9 0.1 1.42 1.38 1.86 1.28 1.21 1.21 1.86 1.4 0.3FTm 0.86 0.97 1.18 1.12 1.14 0.88 0.91 0.86 1.18 1.0 0.1 1.53 1.56 1.97 1.39 1.36 1.36 1.97 1.6 0.2FYb 0.90 0.86 1.11 1.02 1.07 0.85 0.92 0.85 1.11 1.0 0.1 1.42 1.43 1.85 1.32 1.25 1.25 1.85 1.5 0.2FLu 0.91 0.92 1.10 1.10 1.08 0.89 0.89 0.89 1.10 1.0 0.1 1.46 1.57 1.98 1.32 1.31 1.31 1.98 1.5 0.3
Min., Max., Mean, and σ refer to the minimum, maximum, mean, and standard deviation values respectively.
145R.Sinisietal./Palaeogeography,Palaeoclim
atology,Palaeoecology396
(2014)132
–154
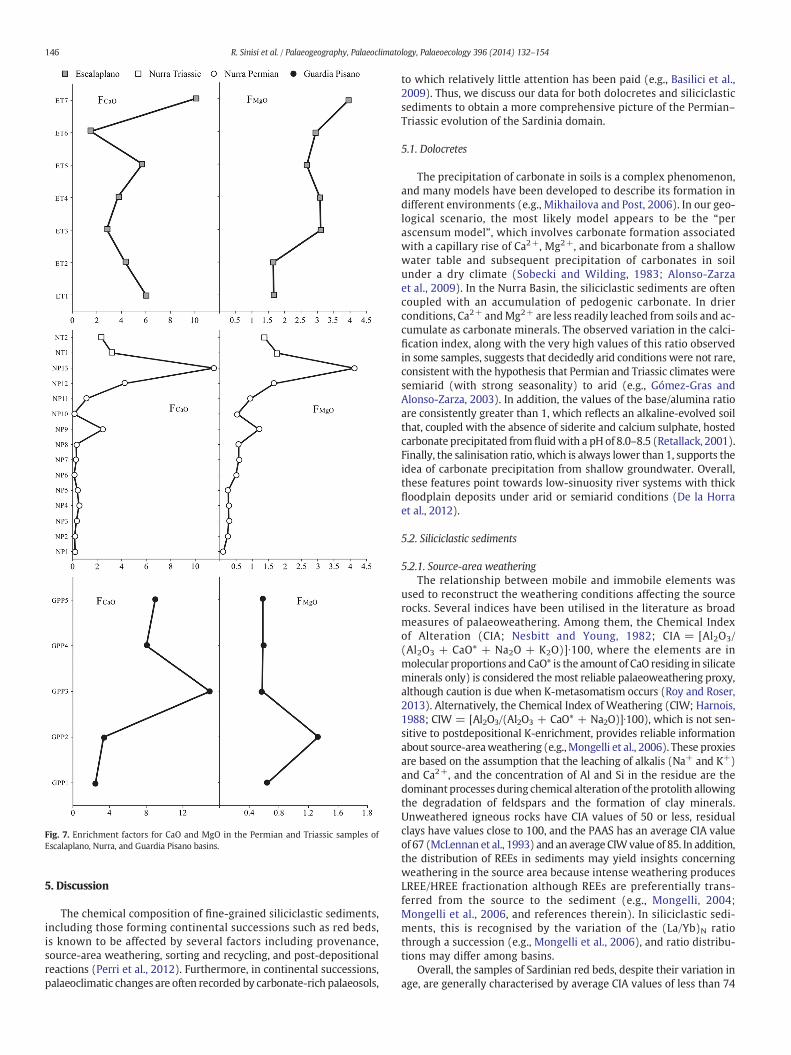
Fig. 7. Enrichment factors for CaO and MgO in the Permian and Triassic samples ofEscalaplano, Nurra, and Guardia Pisano basins.
146 R. Sinisi et al. / Palaeogeography, Palaeoclimatology, Palaeoecology 396 (2014) 132–154
5. Discussion
The chemical composition of fine-grained siliciclastic sediments,including those forming continental successions such as red beds,is known to be affected by several factors including provenance,source-area weathering, sorting and recycling, and post-depositionalreactions (Perri et al., 2012). Furthermore, in continental successions,palaeoclimatic changes are often recorded by carbonate-rich palaeosols,
to which relatively little attention has been paid (e.g., Basilici et al.,2009). Thus, we discuss our data for both dolocretes and siliciclasticsediments to obtain a more comprehensive picture of the Permian–Triassic evolution of the Sardinia domain.
5.1. Dolocretes
The precipitation of carbonate in soils is a complex phenomenon,and many models have been developed to describe its formation indifferent environments (e.g., Mikhailova and Post, 2006). In our geo-logical scenario, the most likely model appears to be the “perascensum model”, which involves carbonate formation associatedwith a capillary rise of Ca2+, Mg2+, and bicarbonate from a shallowwater table and subsequent precipitation of carbonates in soilunder a dry climate (Sobecki and Wilding, 1983; Alonso-Zarzaet al., 2009). In the Nurra Basin, the siliciclastic sediments are oftencoupled with an accumulation of pedogenic carbonate. In drierconditions, Ca2+ andMg2+ are less readily leached from soils and ac-cumulate as carbonate minerals. The observed variation in the calci-fication index, along with the very high values of this ratio observedin some samples, suggests that decidedly arid conditions were not rare,consistent with the hypothesis that Permian and Triassic climates weresemiarid (with strong seasonality) to arid (e.g., Gómez-Gras andAlonso-Zarza, 2003). In addition, the values of the base/alumina ratioare consistently greater than 1, which reflects an alkaline-evolved soilthat, coupled with the absence of siderite and calcium sulphate, hostedcarbonate precipitated from fluidwith a pH of 8.0–8.5 (Retallack, 2001).Finally, the salinisation ratio, which is always lower than 1, supports theidea of carbonate precipitation from shallow groundwater. Overall,these features point towards low-sinuosity river systems with thickfloodplain deposits under arid or semiarid conditions (De la Horraet al., 2012).
5.2. Siliciclastic sediments
5.2.1. Source-area weatheringThe relationship between mobile and immobile elements was
used to reconstruct the weathering conditions affecting the sourcerocks. Several indices have been utilised in the literature as broadmeasures of palaeoweathering. Among them, the Chemical Indexof Alteration (CIA; Nesbitt and Young, 1982; CIA = [Al2O3/(Al2O3 + CaO* + Na2O + K2O)]∙100, where the elements are inmolecular proportions and CaO* is the amount of CaO residing in silicateminerals only) is considered the most reliable palaeoweathering proxy,although caution is due when K-metasomatism occurs (Roy and Roser,2013). Alternatively, the Chemical Index of Weathering (CIW; Harnois,1988; CIW = [Al2O3/(Al2O3 + CaO* + Na2O)]∙100), which is not sen-sitive to postdepositional K-enrichment, provides reliable informationabout source-areaweathering (e.g.,Mongelli et al., 2006). These proxiesare based on the assumption that the leaching of alkalis (Na+ and K+)and Ca2+, and the concentration of Al and Si in the residue are thedominant processes during chemical alteration of the protolith allowingthe degradation of feldspars and the formation of clay minerals.Unweathered igneous rocks have CIA values of 50 or less, residualclays have values close to 100, and the PAAS has an average CIA valueof 67 (McLennan et al., 1993) and an average CIWvalue of 85. In addition,the distribution of REEs in sediments may yield insights concerningweathering in the source area because intense weathering producesLREE/HREE fractionation although REEs are preferentially trans-ferred from the source to the sediment (e.g., Mongelli, 2004;Mongelli et al., 2006, and references therein). In siliciclastic sedi-ments, this is recognised by the variation of the (La/Yb)N ratiothrough a succession (e.g., Mongelli et al., 2006), and ratio distribu-tions may differ among basins.
Overall, the samples of Sardinian red beds, despite their variation inage, are generally characterised by average CIA values of less than 74
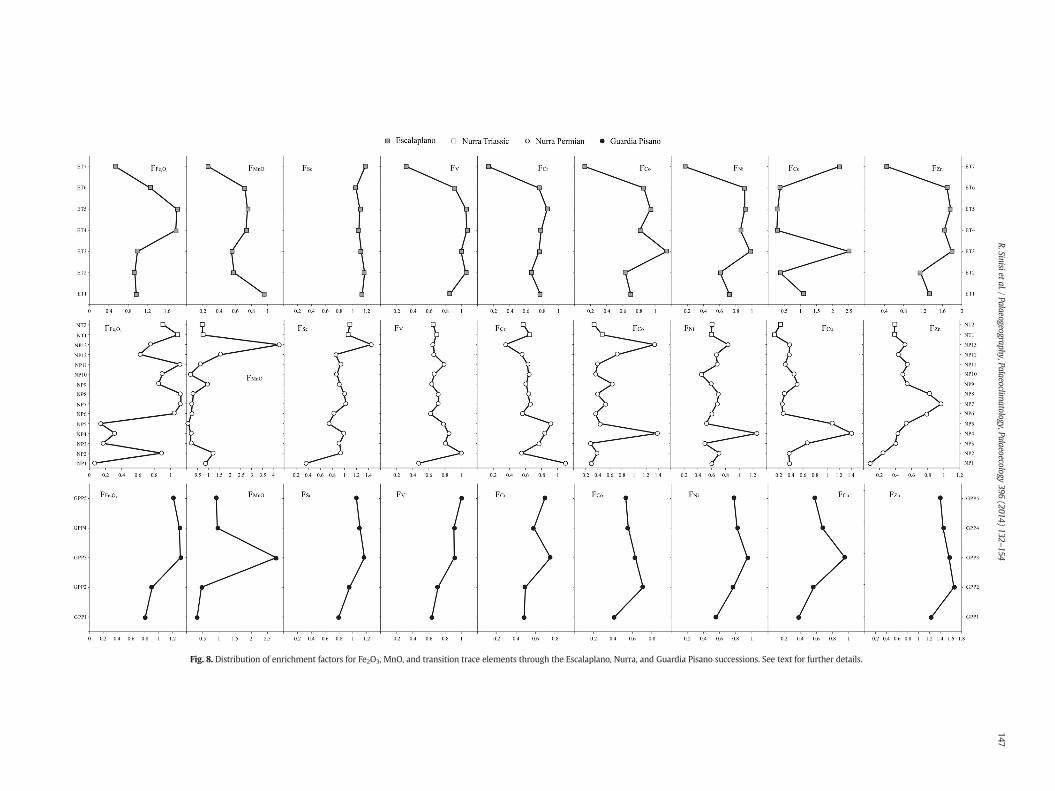
Fig. 8. Distribution of enrichment factors for Fe2O3, MnO, and transition trace elements through the Escalaplano, Nurra, and Guardia Pisano successions. See text for further details.
147R.Sinisietal./Palaeogeography,Palaeoclim
atology,Palaeoecology396
(2014)132
–154
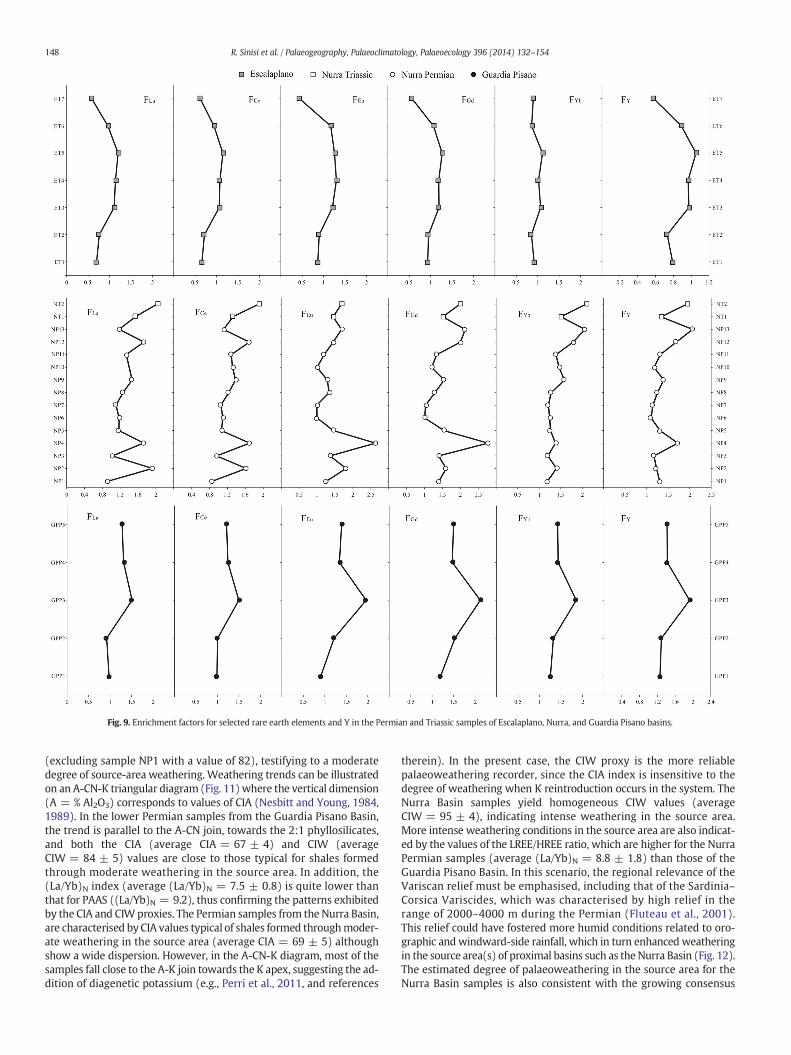
Fig. 9. Enrichment factors for selected rare earth elements and Y in the Permian and Triassic samples of Escalaplano, Nurra, and Guardia Pisano basins.
148 R. Sinisi et al. / Palaeogeography, Palaeoclimatology, Palaeoecology 396 (2014) 132–154
(excluding sample NP1 with a value of 82), testifying to a moderatedegree of source-area weathering. Weathering trends can be illustratedon an A-CN-K triangular diagram (Fig. 11)where the vertical dimension(A = % Al2O3) corresponds to values of CIA (Nesbitt and Young, 1984,1989). In the lower Permian samples from the Guardia Pisano Basin,the trend is parallel to the A-CN join, towards the 2:1 phyllosilicates,and both the CIA (average CIA = 67 ± 4) and CIW (averageCIW = 84 ± 5) values are close to those typical for shales formedthrough moderate weathering in the source area. In addition, the(La/Yb)N index (average (La/Yb)N = 7.5 ± 0.8) is quite lower thanthat for PAAS ((La/Yb)N = 9.2), thus confirming the patterns exhibitedby the CIA and CIW proxies. The Permian samples from the Nurra Basin,are characterised by CIA values typical of shales formed throughmoder-ate weathering in the source area (average CIA = 69 ± 5) althoughshow a wide dispersion. However, in the A-CN-K diagram, most of thesamples fall close to the A-K join towards the K apex, suggesting the ad-dition of diagenetic potassium (e.g., Perri et al., 2011, and references
therein). In the present case, the CIW proxy is the more reliablepalaeoweathering recorder, since the CIA index is insensitive to thedegree of weathering when K reintroduction occurs in the system. TheNurra Basin samples yield homogeneous CIW values (averageCIW = 95 ± 4), indicating intense weathering in the source area.More intense weathering conditions in the source area are also indicat-ed by the values of the LREE/HREE ratio, which are higher for the NurraPermian samples (average (La/Yb)N = 8.8 ± 1.8) than those of theGuardia Pisano Basin. In this scenario, the regional relevance of theVariscan relief must be emphasised, including that of the Sardinia–Corsica Variscides, which was characterised by high relief in therange of 2000–4000 m during the Permian (Fluteau et al., 2001).This relief could have fostered more humid conditions related to oro-graphic andwindward-side rainfall, which in turn enhancedweatheringin the source area(s) of proximal basins such as the Nurra Basin (Fig. 12).The estimated degree of palaeoweathering in the source area for theNurra Basin samples is also consistent with the growing consensus
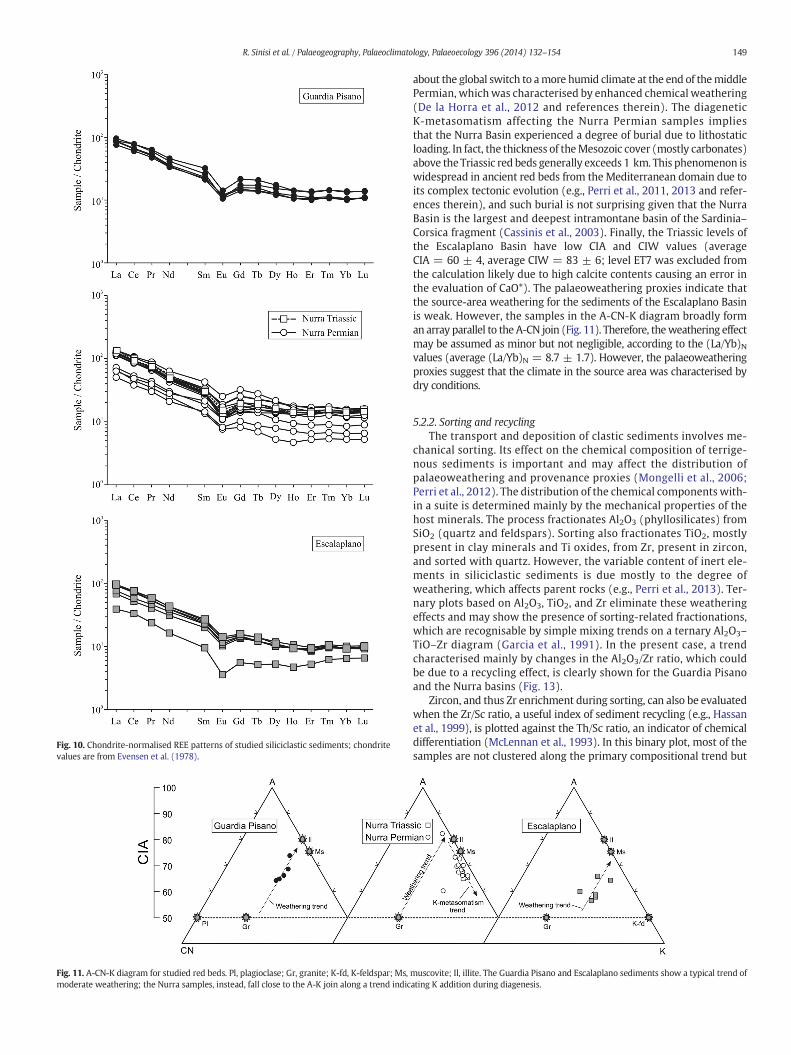
Fig. 10. Chondrite-normalised REE patterns of studied siliciclastic sediments; chondritevalues are from Evensen et al. (1978).
Fig. 11. A-CN-K diagram for studied red beds. Pl, plagioclase; Gr, granite; K-fd, K-feldspar; Ms,moderate weathering; the Nurra samples, instead, fall close to the A-K join along a trend indic
149R. Sinisi et al. / Palaeogeography, Palaeoclimatology, Palaeoecology 396 (2014) 132–154
about the global switch to amore humid climate at the end of themiddlePermian, whichwas characterised by enhanced chemical weathering(De la Horra et al., 2012 and references therein). The diageneticK-metasomatism affecting the Nurra Permian samples impliesthat the Nurra Basin experienced a degree of burial due to lithostaticloading. In fact, the thickness of theMesozoic cover (mostly carbonates)above the Triassic red beds generally exceeds 1 km. This phenomenon iswidespread in ancient red beds from theMediterranean domain due toits complex tectonic evolution (e.g., Perri et al., 2011, 2013 and refer-ences therein), and such burial is not surprising given that the NurraBasin is the largest and deepest intramontane basin of the Sardinia–Corsica fragment (Cassinis et al., 2003). Finally, the Triassic levels ofthe Escalaplano Basin have low CIA and CIW values (averageCIA = 60 ± 4, average CIW = 83 ± 6; level ET7 was excluded fromthe calculation likely due to high calcite contents causing an error inthe evaluation of CaO*). The palaeoweathering proxies indicate thatthe source-area weathering for the sediments of the Escalaplano Basinis weak. However, the samples in the A-CN-K diagram broadly forman array parallel to the A-CN join (Fig. 11). Therefore, theweathering effectmay be assumed as minor but not negligible, according to the (La/Yb)Nvalues (average (La/Yb)N = 8.7 ± 1.7). However, the palaeoweatheringproxies suggest that the climate in the source area was characterised bydry conditions.
5.2.2. Sorting and recyclingThe transport and deposition of clastic sediments involves me-
chanical sorting. Its effect on the chemical composition of terrige-nous sediments is important and may affect the distribution ofpalaeoweathering and provenance proxies (Mongelli et al., 2006;Perri et al., 2012). The distribution of the chemical components with-in a suite is determined mainly by the mechanical properties of thehost minerals. The process fractionates Al2O3 (phyllosilicates) fromSiO2 (quartz and feldspars). Sorting also fractionates TiO2, mostlypresent in clay minerals and Ti oxides, from Zr, present in zircon,and sorted with quartz. However, the variable content of inert ele-ments in siliciclastic sediments is due mostly to the degree ofweathering, which affects parent rocks (e.g., Perri et al., 2013). Ter-nary plots based on Al2O3, TiO2, and Zr eliminate these weatheringeffects and may show the presence of sorting-related fractionations,which are recognisable by simple mixing trends on a ternary Al2O3–
TiO–Zr diagram (Garcia et al., 1991). In the present case, a trendcharacterised mainly by changes in the Al2O3/Zr ratio, which couldbe due to a recycling effect, is clearly shown for the Guardia Pisanoand the Nurra basins (Fig. 13).
Zircon, and thus Zr enrichment during sorting, can also be evaluatedwhen the Zr/Sc ratio, a useful index of sediment recycling (e.g., Hassanet al., 1999), is plotted against the Th/Sc ratio, an indicator of chemicaldifferentiation (McLennan et al., 1993). In this binary plot, most of thesamples are not clustered along the primary compositional trend but
muscovite; Il, illite. The Guardia Pisano and Escalaplano sediments show a typical trend ofating K addition during diagenesis.
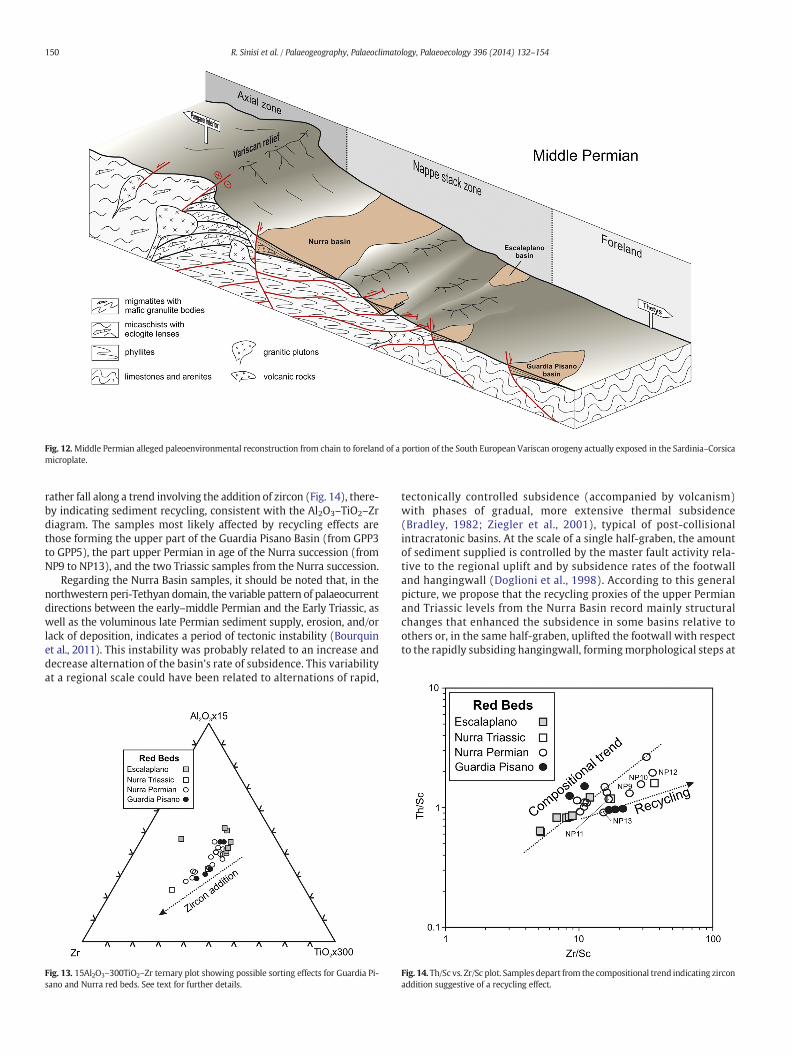
Fig. 12.Middle Permian alleged paleoenvironmental reconstruction from chain to foreland of a portion of the South European Variscan orogeny actually exposed in the Sardinia–Corsicamicroplate.
150 R. Sinisi et al. / Palaeogeography, Palaeoclimatology, Palaeoecology 396 (2014) 132–154
rather fall along a trend involving the addition of zircon (Fig. 14), there-by indicating sediment recycling, consistent with the Al2O3–TiO2–Zrdiagram. The samples most likely affected by recycling effects arethose forming the upper part of the Guardia Pisano Basin (from GPP3to GPP5), the part upper Permian in age of the Nurra succession (fromNP9 to NP13), and the two Triassic samples from the Nurra succession.
Regarding the Nurra Basin samples, it should be noted that, in thenorthwestern peri-Tethyan domain, the variable pattern of palaeocurrentdirections between the early–middle Permian and the Early Triassic, aswell as the voluminous late Permian sediment supply, erosion, and/orlack of deposition, indicates a period of tectonic instability (Bourquinet al., 2011). This instability was probably related to an increase anddecrease alternation of the basin's rate of subsidence. This variabilityat a regional scale could have been related to alternations of rapid,
Fig. 13. 15Al2O3–300TiO2–Zr ternary plot showing possible sorting effects for Guardia Pi-sano and Nurra red beds. See text for further details.
tectonically controlled subsidence (accompanied by volcanism)with phases of gradual, more extensive thermal subsidence(Bradley, 1982; Ziegler et al., 2001), typical of post-collisionalintracratonic basins. At the scale of a single half-graben, the amountof sediment supplied is controlled by the master fault activity rela-tive to the regional uplift and by subsidence rates of the footwalland hangingwall (Doglioni et al., 1998). According to this generalpicture, we propose that the recycling proxies of the upper Permianand Triassic levels from the Nurra Basin record mainly structuralchanges that enhanced the subsidence in some basins relative toothers or, in the same half-graben, uplifted the footwall with respectto the rapidly subsiding hangingwall, formingmorphological steps at
Fig. 14. Th/Sc vs. Zr/Sc plot. Samples depart from the compositional trend indicating zirconaddition suggestive of a recycling effect.
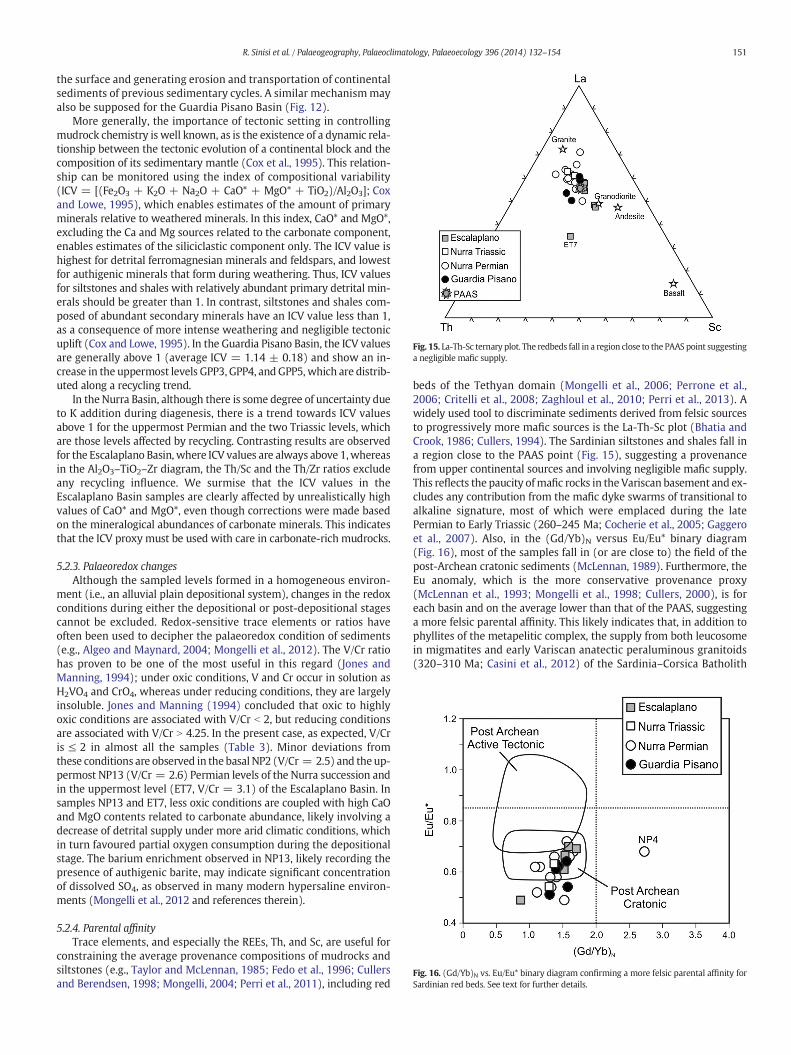
Fig. 15. La-Th-Sc ternary plot. The redbeds fall in a region close to the PAAS point suggestinga negligible mafic supply.
Fig. 16. (Gd/Yb)N vs. Eu/Eu* binary diagram confirming a more felsic parental affinity forSardinian red beds. See text for further details.
151R. Sinisi et al. / Palaeogeography, Palaeoclimatology, Palaeoecology 396 (2014) 132–154
the surface and generating erosion and transportation of continentalsediments of previous sedimentary cycles. A similar mechanismmayalso be supposed for the Guardia Pisano Basin (Fig. 12).
More generally, the importance of tectonic setting in controllingmudrock chemistry is well known, as is the existence of a dynamic rela-tionship between the tectonic evolution of a continental block and thecomposition of its sedimentary mantle (Cox et al., 1995). This relation-ship can be monitored using the index of compositional variability(ICV = [(Fe2O3 + K2O + Na2O + CaO* + MgO* + TiO2)/Al2O3]; Coxand Lowe, 1995), which enables estimates of the amount of primaryminerals relative to weathered minerals. In this index, CaO* and MgO*,excluding the Ca and Mg sources related to the carbonate component,enables estimates of the siliciclastic component only. The ICV value ishighest for detrital ferromagnesian minerals and feldspars, and lowestfor authigenic minerals that form during weathering. Thus, ICV valuesfor siltstones and shales with relatively abundant primary detrital min-erals should be greater than 1. In contrast, siltstones and shales com-posed of abundant secondary minerals have an ICV value less than 1,as a consequence of more intense weathering and negligible tectonicuplift (Cox and Lowe, 1995). In the Guardia Pisano Basin, the ICV valuesare generally above 1 (average ICV = 1.14 ± 0.18) and show an in-crease in the uppermost levels GPP3, GPP4, and GPP5, which are distrib-uted along a recycling trend.
In the Nurra Basin, although there is some degree of uncertainty dueto K addition during diagenesis, there is a trend towards ICV valuesabove 1 for the uppermost Permian and the two Triassic levels, whichare those levels affected by recycling. Contrasting results are observedfor the Escalaplano Basin, where ICV values are always above 1,whereasin the Al2O3–TiO2–Zr diagram, the Th/Sc and the Th/Zr ratios excludeany recycling influence. We surmise that the ICV values in theEscalaplano Basin samples are clearly affected by unrealistically highvalues of CaO* and MgO*, even though corrections were made basedon the mineralogical abundances of carbonate minerals. This indicatesthat the ICV proxy must be used with care in carbonate-rich mudrocks.
5.2.3. Palaeoredox changesAlthough the sampled levels formed in a homogeneous environ-
ment (i.e., an alluvial plain depositional system), changes in the redoxconditions during either the depositional or post-depositional stagescannot be excluded. Redox-sensitive trace elements or ratios haveoften been used to decipher the palaeoredox condition of sediments(e.g., Algeo and Maynard, 2004; Mongelli et al., 2012). The V/Cr ratiohas proven to be one of the most useful in this regard (Jones andManning, 1994); under oxic conditions, V and Cr occur in solution asH2VO4 and CrO4, whereas under reducing conditions, they are largelyinsoluble. Jones and Manning (1994) concluded that oxic to highlyoxic conditions are associated with V/Cr b 2, but reducing conditionsare associated with V/Cr N 4.25. In the present case, as expected, V/Cris ≤ 2 in almost all the samples (Table 3). Minor deviations fromthese conditions are observed in the basal NP2 (V/Cr = 2.5) and the up-permost NP13 (V/Cr = 2.6) Permian levels of the Nurra succession andin the uppermost level (ET7, V/Cr = 3.1) of the Escalaplano Basin. Insamples NP13 and ET7, less oxic conditions are coupled with high CaOand MgO contents related to carbonate abundance, likely involving adecrease of detrital supply under more arid climatic conditions, whichin turn favoured partial oxygen consumption during the depositionalstage. The barium enrichment observed in NP13, likely recording thepresence of authigenic barite, may indicate significant concentrationof dissolved SO4, as observed in many modern hypersaline environ-ments (Mongelli et al., 2012 and references therein).
5.2.4. Parental affinityTrace elements, and especially the REEs, Th, and Sc, are useful for
constraining the average provenance compositions of mudrocks andsiltstones (e.g., Taylor and McLennan, 1985; Fedo et al., 1996; Cullersand Berendsen, 1998; Mongelli, 2004; Perri et al., 2011), including red
beds of the Tethyan domain (Mongelli et al., 2006; Perrone et al.,2006; Critelli et al., 2008; Zaghloul et al., 2010; Perri et al., 2013). Awidely used tool to discriminate sediments derived from felsic sourcesto progressively more mafic sources is the La-Th-Sc plot (Bhatia andCrook, 1986; Cullers, 1994). The Sardinian siltstones and shales fall ina region close to the PAAS point (Fig. 15), suggesting a provenancefrom upper continental sources and involving negligible mafic supply.This reflects the paucity ofmafic rocks in the Variscan basement and ex-cludes any contribution from the mafic dyke swarms of transitional toalkaline signature, most of which were emplaced during the latePermian to Early Triassic (260–245 Ma; Cocherie et al., 2005; Gaggeroet al., 2007). Also, in the (Gd/Yb)N versus Eu/Eu* binary diagram(Fig. 16), most of the samples fall in (or are close to) the field of thepost-Archean cratonic sediments (McLennan, 1989). Furthermore, theEu anomaly, which is the more conservative provenance proxy(McLennan et al., 1993; Mongelli et al., 1998; Cullers, 2000), is foreach basin and on the average lower than that of the PAAS, suggestinga more felsic parental affinity. This likely indicates that, in addition tophyllites of the metapelitic complex, the supply from both leucosomein migmatites and early Variscan anatectic peraluminous granitoids(320–310 Ma; Casini et al., 2012) of the Sardinia–Corsica Batholith
152 R. Sinisi et al. / Palaeogeography, Palaeoclimatology, Palaeoecology 396 (2014) 132–154
was not negligible. The significant component of lower Permian volcanicrocks of the Nurra succession (in the Porto Ferro and Cala del Vinoformations) should be considered and testifies to the increase inthe subsidence rate of this basin during the middle–late Permianand the recycling of its relatively uplifted basal portion to the northof the Baratz Fault (Fig. 1).
6. Summary
Measurements of geochemical and mineralogical proxies for thePermian and Triassic sequences of Sardinia studied in this paper haveallowed important palaeoenvironmental inferences to be madeconcerning the early–middle Permian to Early Triassic transition fromPangaea B configuration to Pangaea A at the northern Gondwana mar-gin (Muttoni et al., 2009). This has contributed to the unravelling ofthe palaeoclimatic conditions related to the South European VariscanChain during its post-collisional denudation and erosion.
During the late Carboniferous–early Permian, the Variscan relieflikely had significant elevation because the axial zone of the chain, innorthern Sardinia, was subjected to exhumation rates greater than1 mm/yr (Cortesogno et al., 1998). This hypothesis agrees with Becq-Giraudon et al. (1996) which proved that during the Carboniferous-Permian transition, theMassif Central in France had an elevation higherthan 4500 m. In contrast, in western Pangaea, where the PanthalassaOcean was forming at the same time, terranes were affected by verylow exhumation rates (Eusden and Lux, 1994). As proposed byFluteau et al. (2001) for other sectors of the South Variscan domain,also in the axial zone of Sardinia, where deep crustal levels were ex-humed, high relief may have endured through to the middle Permian,that in the Nurra basin is dated on the basis of the finding of a hugecaseid (Ronchi et al., 2011).
The presence of the South European Variscan Chain involvedmore humid conditions (punctuated by more arid episodes as testi-fied by dolocretes) in the axial zone relative to the foreland, on ac-count of windward-side orographic rainfalls, consistent with theweathering indices calculated for the studied sediments. Further-more, the palaeoweathering proxy (CIW) for the Nurra Basin sam-ples is also consistent with a change towards a more humidclimate at the end of the middle Permian, which produced moreintense chemical weathering. Tectonic instability at a regionalscale plays also an important role, since it promoted structuralchanges that allowed sedimentary recycling and subsidence, whichin turn caused diagenetic K-metasomatism. The increase in therate of subsidence in some basins during the middle–late Permianand the recycling of the uplifted basement are also suggested byevaluation of the source-area(s) lithologies, which likely include,in addition to the metapelitic rocks from the green schist faciesbasement, the migmatitic leucosomes and Early Variscan anatecticgranitoids, and the lower Permian volcanic rocks of the Nurrasuccession.
Acknowledgements
Authors wish to thank two referees (F. Perri and anonymous) fortheir helpful and constructive comments and suggestions. This workwas financially supported by a Banco di Sardegna Foundation grant.
References
Algeo, T.J., Maynard, J.B., 2004. Trace-element behavior and redox facies in core shales ofUpper Pennsylvanian Kansas-type cyclothems. Chem. Geol. 206, 289–318.
Alonso-Zarza, A.M., Zhao, Z., Song, C.H., Li, J.J., Zhang, J., Martin-Perez, A., Martin-Garcia, R.,Wang, X.X., Zhang, Y., Zhang, M.H., 2009. Mudflat/distal fan and shallow lake sedi-mentation (upper Vallesian–Turolian) in the Tianshui Basin, Central China: evidenceagainst the late Miocene eolian loess. Sediment. Geol. 222 (1), 42–51.
Barca, S., Costamagna, L.G., 2006. Stratigrafia, analisi di facies ed architetturadeposizionale della successione Permiana di Guardia Pisano (Sulcis, Sardegna SW).Boll. Soc. Geol. Ital. 125, 3–19.
Basilici, G., Dal Bò, P.F.F., Bernardes Ladeira, F.S., 2009. Climate-induced sediment-palaeosol cycles in a Late Cretaceous dry aeolian sand sheet: Marilia Formation(North-West Bauru Basin, Brazil). Sedimentology 56 (6), 1876–1904.
Becq-Giraudon, J.F., Montenat, C., Van Den Driessche, J., 1996. Hercynian high-altitudephenomena in the French Massif Central: tectonic implications. Palaeogeogr.Palaeoclimatol. Palaeoecol. 122 (14), 227–241.
Bertoluzza, L., Perotti, C.R., 1997. A finite-element model of the stress field in strike-slipbasins: implications for the Permian tectonics of the Southern Alps (Italy).Tectonophysics 280 (1–2), 185–197.
Bhatia, M.R., Crook, K.A.W., 1986. Trace element characteristics of graywackes and tecton-ic setting discrimination of sedimentary basins. Contrib. Mineral. Petrol. 92, 181–193.
Bourquin, S., Bercovici, A., López-Gómez, J., Diez, J.B., Broutin, J., Ronchi, A., Durand, M.,Arché, A., Linol, B., Amour, F., 2011. The Permian–Triassic transition and the onsetof Mesozoic sedimentation at the northwestern peri-Tethyan domain scale:palaeogeographic maps and geodynamic implications. Palaeogeogr. Palaeoclimatol.Palaeoecol. 299, 265–280.
Bourquin, S., Durand, M., Diez, J.B., Broutin, J., Fluteau, F., 2007. The Permian–Triassicboundary and Early Triassic sedimentation inWestern European basins: an overview.J. Iber. Geol. 33 (2), 221–236.
Bradley, D.C., 1982. Subsidence in late Paleozoic basins in the northern Appalachians.Tectonics 1 (1), 107–123.
Broutin, J., Cabanis, B., Châteauneuf, J.J., Deroin, J.P., 1994. Évolution biostratigraphique,magmatique et tectonique du domaine paléotéthysien occidental (SW de l'Europe):implications paléogéographiques au Permien inférieur. Bull. Soc. Geol. Fr. 165,163–179.
Buzzi, L., Gaggero, L., Oggiano, G., 2008. The Santa Giusta ignimbrite (NW Sardinia): a cluefor the magmatic, structural and sedimentary evolution of a Variscan segment be-tween Early Permian and Triassic. Boll. Soc. Geol. Ital. 127 (3), 683–695.
Carmignani, L., Carosi, R., Di Pisa, A., Gattiglio, M., Musumeci, G., Oggiano, G., Pertusati,P.C., 1994. The Hercynian chain in Sardinia (Italy). Geodin. Acta 7 (1), 31–47.
Casini, L., Cuccuru, S., Maino, M., Oggiano, G., Tiepolo, M., 2012. Emplacement of theArzachena Pluton (Corsica–Sardinia Batholith) and the geodynamics of incomingPangaea. Tectonophysics 544, 31–49.
Casini, L., Oggiano, G., 2008. Late orogenic collapse and thermal doming in the northernGondwana margin incorporated in the Variscan Chain: a case study from the OzieriMetamorphic Complex, northern Sardinia, Italy. Gondwana Res. 13 (3), 396–406.
Cassinis, G., Durand, M., Ronchi, A., 2003. Permian–Triassic continental sequencesof Northwest Sardinia and South Provence: stratigraphic correlations andpalaeogeographical implications. Boll. Soc. Geol. Ital. (Spec. Vol.) 2, 119–129.
Cavalcante, F., Fiore, S., Lettino, A., Piccarreta, G., Tateo, F., 2007. Illite-smectite mixedlayers in sicilide shales and piggy-back deposits of the Gorgoglione Formation(Southern Apeninnes): geological inferences. Boll. Soc. Geol. Ital. (Ital. J. Geosci.)126 (2), 241–254.
Chen, B., Joachimski, M.M., Shen, S., Lambert, L.L., Lai, X., Wang, X., Chen, X., Yuan, D., 2013.Permian ice volume and palaeoclimate history: oxygen isotope proxies revisited.Gondwana Res. 24 (1), 77–89.
Cocherie, A., Rossi, P., Fanning, C.M., Guerrot, C., 2005. Comparative use of TIMS andSHRIMP for U–Pb zircon dating of A-type granites and mafic tholeiitic layeredcomplexes and dykes from the Corsican Batholith (France). Lithos 82, 185–219.
Conti, P., Carmignani, L., Oggiano, G., Funedda, A., Cerbai, N., Eltrudis, A., 1999. Fromthickening to extension in the Variscan belt—kinematic evidence from Sardinia(Italy). Terra Nova 11 (2–3), 93–99.
Cortesogno, L., Cassinis, G., Dallagiovanna, G., Gaggero, L., Oggiano, G., Ronchi, A., Seno, S.,Vanossi, M., 1998. The Variscan post-collisional volcanism in Late Carboniferous–Permian sequences of Ligurian Alps, Southern Alps and Sardinia (Italy): a synthesis.Lithos 45 (1–4), 305–328.
Cortesogno, L., Gaggero, L., Oggiano, G., Paquette, J.L., 2004. Different tectono-thermalevolutionary paths in eclogitic rocks from the axial zone of the Variscan chain inSardinia (Italy) compared with the Ligurian Alps. Ofioliti 29, 125–144.
Costamagna, L.G., Barca, S., Del Rio, M., Pittau, P., 2000. Stratigrafia, paleogeografia edanalisi di facies deposizionale del Trias del Sarcidano-Gerrei (Sardegna SE). Boll.Soc. Geol. Ital. 119, 437–496.
Cox, R., Lowe, D.R., 1995. Controls on sediment composition on a regional scale. Conceptualview. J. Sediment. Res. 65, 1–12.
Cox, R., Lowe, D.R., Cullers, R.L., 1995. The Influence of sediment recycling and basementcomposition on evolution of mudrock chemistry in Southwestern United States.Geochim. Cosmochim. Acta 59, 2919–2940.
Critelli, S.,Mongelli, G., Perri, F.,Martìn-Algarra, A.,Martìn-Martìn,M., Perrone, V., Dominici,R., Sonnino, M., Zaghloul, M.N., 2008. Compositional and geochemical signatures forthe sedimentary evolution of the Middle Triassic–Lower Jurassic continental redbedsfromWestern-Central Mediterranean Alpine Chains. J. Geol. 116, 375–386.
Cruciani, G., Dini, A., Franceschelli, M., Puxeddu, M., Utzeri, D., 2010. Metabasite from theVariscan belt in NE Sardinia, Italy: within-plate OIB-like melts with very high Sr andlow Nd isotope ratios. Eur. J. Mineral. 22 (4), 509–523.
Cullers, R.L., 1994. The controls on the major and trace element variation of shales,siltstones, and sandstones of Pennsylvanian–Permian age from uplifted continentalblocks in Colorado to platform sediments in Kansas, USA. Geochim. Cosmochim.Acta 58, 4955–4972.
Cullers, R.L., 2000. The geochemistry of shales, siltstones and sandstones of Pennsylvian–Permian age, Colorado, USA: implications for provenance and metamorphic studies.Lithos 51, 181–203.
Cullers, R.L., Berendsen, P., 1998. The provenance and chemical variation of sandstonesassociated with the Mid-continent Rift System, U.S.A. Eur. J. Mineral. 10, 987–1002.
153R. Sinisi et al. / Palaeogeography, Palaeoclimatology, Palaeoecology 396 (2014) 132–154
De la Horra, R., Benito, M.I., López-Gómez, J., Arché, A., Barrenechea, J.F., Luque, J., 2008.Palaeoenvironmental significance of Late Permian palaeosols in the South-EasternIberian Ranges, Spain. Sedimentology 55, 1849–1873.
De la Horra, R., Galan-Abellan, A.B., Lopez-Gomez, J., Sheldon, N.D., Barrenechea, J.F.,Luque, J., Arché, A., Benito, M.I., 2012. Paleoecological and paleoenvironmental chang-es during the continental Middle–Late Permian transition at the SE Iberian Ranges,Spain. Global Planet. Change 94–95, 46–61.
Diez, J.B., Broutin, J., Ferrer, J., 2005. Difficulties encountered in defining the Permian–Triassicboundary in Buntsandstein facies of the western Peritethyan domain based on palyno-logical data. Palaeogeogr. Palaeoclimatol. Palaeoecol. 229, 40–53.
Doglioni, C., Dagostino, N., Mariotti, G., 1998. Normal faulting vs regional subsidence andsedimentation rate. Mar. Pet. Geol. 15 (8), 737–750.
Durand, M., 2008. Permian to Triassic continental successions in southern Provence(France): an overview. Boll. Soc. Geol. Ital. 127 (3), 697–716.
Eusden Jr., J.D., Lux, D.R., 1994. Slow late Paleozoic exhumation in the Presidential Rangeof New Hampshire as determined by the 40Ar/39Ar relief method. Geology 22 (10),909–912.
Evensen, N.M., Hamilton, P.J., O'Nions, R.K., 1978. Rare earth abundances in chondriticmeteorites. Geochim. Cosmochim. Acta 42, 1199–1212.
Fedo, C.M., Eriksson, K.A., Krogstad, E.J., 1996. Geochemistry of shales from the Archean(≈3.0 Ga) Buhwa Greenstone belt, Zimbabwe: implication for provenance andsource area weathering. Geochim. Cosmochim. Acta 60, 1751–1763.
Fluteau, F., Besse, J., Broutin, J., Ramstein, G., 2001. The Late Permian climate. What can beinferred from climate modelling concerning Pangea scenarios and Hercynian rangealtitude? Palaeogeogr. Palaeoclimatol. Palaeoecol. 167 (1–2), 39–71.
Fontana, D., Neri, C., Ronchi, A., Stefani, C., 2001. Stratigraphic architecture and compositionof the Permian and Triassic siliciclastic succession of Nurra (northwestern Sardinia).In: Cassinis, G. (Ed.), Permian Continental Deposits of Europe and other areas. Regionalreports and correlations. Proc. Intern. Field Conf. on «The continental Permian of theSouthern Alps and Sardinia (Italy). Regional reports and general correlations», 15–25Sept. 1999, Brescia, Italy. «Natura Bresciana». Ann. Mus. Civ. Sc. Nat., Brescia (Italy),Monografia, 25, pp. 149–161.
Franceschelli, M., Puxeddu, M., Cruciani, G., Utzeri, D., 2007. Metabasites with eclogitefacies relics from Variscides in Sardinia, Italy: a review. Int. J. Earth Sci. 96 (5),795–815.
Funedda, A., 2009. Foreland- and hinterland-verging structures in fold-and-thrust belt: anexample from the Variscan foreland of Sardinia. Int. J. Earth Sci. 98 (7), 1625–1642.
Gaggero, L., Oggiano, G., Buzzi, L., Slejko, F., Cortesogno, L., 2007. Post-variscan mafic dikesfrom the late orogenic collapse to the Tethyan rift: evidence from Sardinia. Ofioliti 32(1), 15–37.
Garcia, D., Coehlo, J., Perrin, M., 1991. Fractionation between TiO2 and Zr as a measure ofsorting within shale and sandstone series (northern Portugal). Eur. J. Mineral. 3,401–414.
Gómez-Gras, D., Alonso-Zarza, A.M., 2003. Reworked calcretes: their significance in thereconstruction of alluvial sequences (Permian and Triassic, Minorca, Balearic Islands,Spain). Sediment. Geol. 158, 299–319.
Harnois, L., 1988. The CIW index: a new chemical index of weathering. Sediment. Geol.55, 319–322.
Hassan, S., Ishiga, H., Roser, B.P., Dozen, K., Naka, T., 1999. Geochemistry of Permian–Triassicshales in the Salt Range, Pakistan: implications for provenance and tectonism at theGondwana margin. Chem. Geol. 158, 293–314.
Isozaki, Y., Aljinovic, D., Kawahata, H., 2011. The Guadalupian (Permian) Kamura event inEuropean Tethys. Palaeogeogr. Palaeoclimatol. Palaeoecol. 308, 12–21.
Jones, B., Manning, D.A.C., 1994. Comparison of geochemical indices used for the interpre-tation of palaeoredox conditions in ancient mudstones. Chem. Geol. 111, 111–129.
Kossovaya, O.L., 2009. Artinskian–Wordian antitropical rugose coral associations: apalaeogeographical approach. Palaeoworld 18, 136–151.
Laviano, R., 1987. Analisi mineralogica quantitativa di argille mediante diffrattometria diraggi X, in Procedure di analisi di materiali argillosi. Atti del workshop del CentroRicerche Energia Ambiente, Roma, Ente Nazionale Energie Alternative (ENEA)215–234.
Lindgreen, H., Surlyk, F., 2000. Upper Permian–Lower Cretaceous clay mineralogy of EastGreenland: provenance, palaeoclimate and vulcanicity. Clay Miner. 35, 791–806.
Linol, B., Bercovici, A., Bourquin, S., Diez, J.B., Lopez-Gomez, J., Broutin, J., Durand, M.,Villanueva-Amadoz, U., 2009. Late Permian to Middle Triassic correlations andpalaeogeographical reconstructions in south-western European basins: new sedi-mentological data from Minorca (Balearic Islands, Spain). Sediment. Geol. 220(1–2), 77–94.
Lynn, W.C., Tu, H.Y., Franzmeier, D.P., 1971. Authigenic barite in soils. Soil Sci. Soc. Am. J.35, 160–161.
Lόpez-Gόmez, J., Arche, A., Marzo, M., Durand, M., 2005. Stratigraphical andpalaeogeographical significance of the continental sedimentary transition across thePermian–Triassic boundary in Spain. Palaeogeogr. Palaeoclimatol. Palaeoecol. 229,3–23.
Lόpez-Gόmez, J., Galan-Abellan, B., de la Horra, R., Barrenechea, J.F., Arche, A., Bourquin, S.,Marzo, M., Durand, M., 2012. Sedimentary evolution of the continental Early–MiddleTriassic Canizar Formation (Central Spain): implications for life recovery after thePermian–Triassic crisis. Sediment. Geol. 249, 26–44.
McLennan, S.M., 1989. Rare earth elements in sedimentary rocks: influence of prov-enance and sedimentary processes. In: Lipin, B.R., McKay, G.A. (Eds.), Geochem-istry and Mineralogy of Rare Earth Elements. Min. Soc. Am. Rev. Mineral., 21,pp. 169–200.
McLennan, S.M., Hemming, D.K., Hanson, G.N., 1993. Geochemical approaches to sedi-mentation, provenance and tectonics. Geol. Soc. Am. Spec. Pap. 284, 284, 21–284, 40.
Mikhailova, E.A., Post, C.J., 2006. Organic carbon stocks in the Russian Chernozem. Eur.J. Soil Sci. 57, 330–336.
Mongelli, G., 2004. Rare-earth elements in Oligo-Miocenic pelitic sediments fromLagonegro basin, southern Apennines, Italy: implications for provenance andsource-area weathering. Int. J. Earth Sci. 93, 612–620.
Mongelli, G., Critelli, S., Perri, F., Sonnino, M., Perrone, V., 2006. Sedimentary recycling,provenance and paleoweathering from chemistry and mineralogy of Mesozoic conti-nental redbed mudrocks, Peloritani mountains, southern Italy. Geochem. J. 40,197–209.
Mongelli, G., Cullers, R.L., Dinelli, E., Rottura, A., 1998. Elemental mobility during theweathering of exposed lower crust: the kinzigitic paragneisses from the Serre, Calabria,southern Italy. Terra Nova 10 (4), 190–195.
Mongelli, G., Mameli, P., Oggiano, G., Sinisi, R., 2012. Messinian palaeoclimate and palaeo-environment in the western Mediterranean realm: insights from the geochemistry ofcontinental deposits of NW Sardinia (Italy). Int. Geol. Rev. 54, 971–990.
Muttoni, G., Gaetani, M., Kent, D.V., Sciunnach, D., Angiolini, L., Berra, F., Garzanti, E.,Mattei, M., Zanchi, A., 2009. Opening of the Neo-Tethys Ocean and the Pangea B toPangea A transformation during the Permian. GeoArabia 14 (4), 17–48.
Nesbitt, H.W., Young, G.M., 1982. Early Proterozoic climates and plate motions inferredfrom major element chemistry of lutites. Nature 299, 715–717.
Nesbitt, H.W., Young, G.M., 1984. Prediction of some weathering trends of plutonic andvolcanic rocks based on thermodynamic and kinetic considerations. Geochim.Cosmochim. Acta 48, 1523–1534.
Nesbitt, H.W., Young, G.M., 1989. Formation and diagenesis of weathering profiles. J. Geol.97, 129–147.
Oggiano, G., Gaggero, L., Funedda, A., Buzzi, L., Tiepolo, M., 2010. Multiple early Paleozoicvolcanic events at the northern Gondwana margin: U–Pb age evidence from theSouthern Variscan branch (Sardinia, Italy). Gondwana Res. 17 (1), 44–58.
Pecorini, G., 1974. Nuove osservazioni sul Permo-Trias di Escalaplano (Sardegna sud-orientale). Boll. Soc. Geol. Ital. 93, 991–999.
Perri, F., Critelli, S., Cavalcante, F., Mongelli, G., Dominici, R., Sonnino, M., De Rosa, R., 2012.Provenance signatures for the Miocene volcaniclastic succession of the Tufiti di TusaFormation, southern Apennines, Italy. Geol. Mag. 149, 423–442.
Perri, F., Critelli, S., Martín-Algarra, A., Martín-Martín, M., Perrone, V., Mongelli, G., Zattin,M., 2013. Triassic redbeds in the Malaguide Complex (Betic Cordillera—Spain):petrography, geochemistry and geodynamic implications. Earth Sci. Rev. 117, 1–28.
Perri, F., Critelli, S., Mongelli, G., Cullers, R.L., 2011. Sedimentary evolution of the Mesozoiccontinental redbeds using geochemical and mineralogical tools: the case of UpperTriassic to Lowermost Jurassic Monte di Gioiosa mudrocks (Sicily, southern Italy).Int. J. Earth Sci. 100 (7), 1569–1587.
Perrone, V., Martin-Algarra, A., Critelli, S., Decandia, F.A., D'Errico, M., Estevez, A., Iannace,A., Lazzarotto, A., Martin-Martin, M., Martin-Rojas, I., Mazzoli, S., Messina, A.,Mongelli, G., Vitale, S., Zaghlou, M.N., 2006. “Verrucano” and “Pseudoverrucano” inthe centralwestern Mediterranean Alpine chains: palaegeographic evolution andgeodynamic significance. In: Chalouan, A., Moratti, G. (Eds.), Geology and Active Tec-tonics of the Western Mediterranean Region and North Africa. Geological Society(London), Special Publication, 262, pp. 1–46.
Pittau, P., 2002. Palynofloral biostratigraphy of the Permian and Triassic sequences ofSardinia. Rend. Soc. Paleontol. Ital. 1, 93–109.
Plank, T., Langmuir, C.H., 1998. The chemical composition of subducting sediment and itscomposition for the crust and mantle. Chem. Geol. 145, 325–394.
Podwojewski, P., 1995. The occurrence and interpretation of carbonate and sulfateminerals in a sequence of Vertisols in New Caledonia. Geoderma 65, 223–248.
Retallack, G.J., 1997. A Colour Guide to Paleosols. John Wiley and Sons, Chichester(175 pp.).
Retallack, G.J., 2001. Scoyenia burrows from Ordovician palaeosols of the Juniata Formationin Pennsylvania. Palaeontology 44 (2), 209–235.
Retallack, G.J., 2013. Permian and Triassic greenhouse crises. Gondwana Res. 24 (1),90–103.
Ronchi, A., Sacchi, E., Romano, M., Nicosia, U., 2011. A huge caseid pelycosaur from north-western Sardinia and its bearing on European Permian stratigraphy andpalaeobiogeography. Acta Palaeontol. Pol. 56 (4), 723–738.
Ronchi, A., Sarria, E., Broutin, J., 2008. The “Autuniano Sardo”: basic features for a correla-tion through the Western Mediterranean and Paleoeurope. Boll. Soc. Geol. Ital. (Ital.J. Geosci.) 127 (3), 655–681.
Roscher, M., Schneider, J.W., 2006. Permo-Carboniferous climate: Early Pennsylvanian toLate Permian climate development of Central Europe in a regional and global context.Geol. Soc. Spec. Pub. 265, 95–136.
Rossi, P., Oggiano, G., Cocherie, A., 2009. A restored section of the “southernVariscan realm” across the Corsica–Sardinia microcontinent. C. R. Geosci. 341,224–238.
Roy, D.K., Roser, B.P., 2013. Climatic control on the composition of Carboniferous–Permian Gondwana sediments, Khalaspir basin, Bangladesh. Gondwana Res. 23(3), 1163–1171.
Sheldon, N.D., 2005. Do red beds indicate paleoclimatic conditions? A Permian case study.Palaeogeogr. Palaeoclimatol. Palaeoecol. 228 (3–4), 305–319.
Sheldon, N.D., Tabor, N.J., 2009. Quantitative paleoenvironmental and paleoclimatic re-construction using paleosols. Earth Sci. Rev. 95, 1–52.
Shen, S.Z., 2013. Late Paleozoic deep Gondwana and its peripheries: stratigraphy, biolog-ical events, paleoclimate and paleogeography. Gondwana Res. 24 (1), 1–4.
Sobecki, T.M., Wilding, L.P., 1983. Formation of calcic and argillic horizons in selected soilsof the Texas Coast Prairie. Soil Sci. Soc. Am. J. 47, 707–715.
Stoops, G.J., Zavaleta, A., 1978. Micromorphological evidence of barite neoformation insoils. Geoderma 20, 63–70.
Takeno, N., 2005. Atlas of Eh-pH diagrams. Intercomparison of thermodynamic databases.Geol. Surv. Jpn 419, 287.
Taylor, S.R., McLennan, S.M., 1985. The Continental Crust: Its Composition and Evolution.Blackwell, Oxford.

154 R. Sinisi et al. / Palaeogeography, Palaeoclimatology, Palaeoecology 396 (2014) 132–154
van Wees, J.D., Stephenson, R.A., Ziegler, P.A., Bayer, U., McCann, T., Dadlez, R., Gaupp, R.,Narkiewicz, M., Bitzer, F., Scheck, M., 2000. On the origin of the Southern PermianBasin, Central Europe. Mar. Pet. Geol. 17 (1), 43–59.
von Raumer, J.F., Stampfli, G.A., Bussy, F., 2003. Gondwana-derivedmicrocontinents—the con-stituents of the Variscan and Alpine collisional orogens. Tectonophysics 365 (1–4), 7–22.
Zaghloul, M.N., Critelli, S., Perri, F., Mongelli, G., Perrone, V., Sonnino,M., Tucker, M., Aiello,M., Ventimiglia, C., 2010. Depositional systems, composition and geochemistry of Tri-assic rifted-continental margin redbeds of the Internal Rif Chain, Morocco. Sedimen-tology 57, 312–350.
Zeh, A., Cosca, M.A., Bratz, H., Okrusch, M., Tichomirowa, M., 2000. Simultaneous horst-basin formation and magmatism during Late Variscan transtension: evidence fromAr-40/Ar-39 and Pb-207/Pb-206 geochronology in the Ruhla Crystalline Complex.Int. J. Earth Sci. 89 (1), 52–71.
Ziegler, P.A., Cloetingh, S., Guiraud, R., Stampfli, G.M., 2001. Peri-Tethyan platforms:constraints on dynamics of rifting and basin inversion. In: Ziegler, P.A., Cavazza,W., Robertson, A.H.F., Crasquin-Soleau, S. (Eds.), Peri-Tethys Mem. 6: Peri-Tethyan Rift/Wrench Basins and Passive Margins. Mém. Mus. Natn. Hist. Nat.,Paris, 186, pp. 9–49.


