Embed Size (px)
Citation preview
IOP PUBLISHING PHYSICS IN MEDICINE AND BIOLOGY
Phys. Med. Biol. 54 (2009) 6823–6836 doi:10.1088/0031-9155/54/22/005
Diffusion and near-equilibrium distribution of MRIand CT contrast agents in articular cartilage
Tuomo S Silvast1,2, Harri T Kokkonen2, Jukka S Jurvelin2,Thomas M Quinn3, Miika T Nieminen4 and Juha Toyras1,2
1 Department of Clinical Neurophysiology, Kuopio University Hospital, PO Box 1777,70211 Kuopio, Finland2 Department of Physics, University of Kuopio, PO Box 1627, 70211 Kuopio, Finland3 Department of Chemical Engineering, McGill University, 3610 University Street, Montreal,Quebec H3A 2B2, Canada4 Department of Diagnostic Radiology, Oulu University Hospital, PO Box 50, 90029, Oulu,Finland
E-mail: [email protected]
Received 13 July 2009, in final form 18 September 2009Published 28 October 2009Online at stacks.iop.org/PMB/54/6823
AbstractCharged contrast agents have been used both in vitro and in vivo for estimationof the fixed charge density (FCD) in articular cartilage. In the present study,the effects of molecular size and charge on the diffusion and equilibriumdistribution of several magnetic resonance imaging (MRI) and computedtomography (CT) contrast agents were investigated. Full thickness cartilagedisks (Ø = 4.0 mm, n = 64) were prepared from fresh bovine patellae. Contrastagent (gadopentetate: Magnevist R!, gadodiamide: OmniscanTM, ioxaglate:HexabrixTM or sodium iodide: NaI) diffusion was allowed either through thearticular surface or through the deep cartilage. CT imaging of the sampleswas conducted before contrast agent administration and after 1, 5, 9, 16, 25and 29 h (and with three samples after 2, 3, 4 and 5 days) diffusion usinga clinical peripheral quantitative computed tomography (pQCT) instrument.With all contrast agents, the diffusion through the deep cartilage was slowerwhen compared to the diffusion through the articular surface. With ioxaglate,gadopentetate and gadodiamide it took over 29 h for diffusion to reach thenear-equilibrium state. The slow diffusion of the contrast agents raise concernsregarding the validity of techniques for FCD estimation, as these contrast agentsmay not reach the equilibrium state that is assumed. However, since cartilagecomposition, i.e. deep versus superficial, had a significant effect on diffusion,imaging of the nonequilibrium diffusion process might enable more accurateassessment of cartilage integrity.
(Some figures in this article are in colour only in the electronic version)
0031-9155/09/226823+14$30.00 © 2009 Institute of Physics and Engineering in Medicine Printed in the UK 6823
6824 T S Silvast et al
1. Introduction
Osteoarthritis is a cause of moderate or severe disability for over 40 million people worldwide(WHO 2008). Since advanced degeneration of articular cartilage is believed to be irreversible(Buckwalter and Mankin 1997b), there is a need for sensitive and noninvasive cartilage imagingmethods to detect early degenerative changes. Degenerated cartilage typically exhibits lossof proteoglycans (PGs), disruption of the collagen network and increase in water content(Armstrong and Mow 1982, Venn and Maroudas 1977). Due to these compositional andstructural changes, cartilage mechanical stiffness decreases and its permeability increases(Buckwalter and Mankin 1997b). With conventional radiographic imaging, early osteoarthriticchanges cannot be detected (Duncan et al 2006, Chan et al 1991) due to low x-ray attenuationin cartilage.
The composition and structure of superficial versus deep cartilage are different. In intactcartilage, the glycosaminoglycan (GAG) content, fixed charge density (FCD) and collagencontent increase with depth from the articular surface, while water content tends to decreasewith depth (Maroudas et al 1980, Bi et al 2006). Furthermore, the predominant collagenorientation changes from horizontal in the superficial zone to random in the intermediate zoneto vertical in deep zone cartilage (Buckwalter and Mankin 1997a). In addition, collagen fibrildiameter has been shown to increase toward the deep cartilage (Hunziker et al 1997). Dueto these compositional and structural features, it is reasonable to expect that contrast agentdiffusion rates may be different in superficial versus deep cartilage. This is supported bytheoretical predictions (Zhang and Szeri 2008) and experimental findings (Leddy and Guilak2003, Nimer et al 2003, Evans and Quinn 2005, Arkill and Winlove 2008) which indicatedependence of solute diffusion rates on cartilage composition.
Delayed gadolinium-enhanced magnetic resonance imaging of cartilage (dGEMRIC) is aclinical technique developed for imaging of tissue PG content and distribution. The techniqueutilizes the anionic contrast agent gadopentetate, which is assumed to distribute inversely tothe spatial FCD at equilibrium (Bashir et al 1997). The equilibrium distribution of mobileanions, according to Donnan–Gibbs theory, is controlled by the distribution of fixed chargesand water content in the tissue (Donnan 1924, Maroudas 1968). It has been reported thatdiffusion rates of the common clinical contrast agents, gadopentetate and ioxaglate, are so lowthat diffusion equilibrium in thick (2–4 mm) cartilage is not reached until 8–12 h (Kallioniemiet al 2007, Silvast et al 2009a, 2009b). As the times allowed for diffusion in a clinical contextare considerably shorter, typically <2 h, the true diffusion equilibrium is likely not attainedat the time of imaging (Fleming et al 2009). Thus, prediction of FCD distribution may becompromised.
In clinical practice, joint loading, e.g. kneeling or stair climbing, is applied to enhancecontrast agent penetration by means of interstitial fluid flows and solute convection (Bursteinet al 2001). However, the type of loading (static versus dynamic), and loading frequency andstrain can significantly affect contrast agent penetration (Maroudas 1968, Mauck et al 2003).Furthermore, it has been shown that solute uptake through compression-induced convectionmay exceed that reachable through diffusion alone (Albro et al 2008). These factors mayfurther compromise the accuracy of estimation of FCD based on the assumption of Donnan–Gibbs equilibrium.
In the present study, we apply contrast-enhanced cartilage tomography (CECT) toinvestigate the effect of molecular size and charge on the diffusion and equilibrium distributionof four contrast agents. Furthermore, by allowing contrast agent penetration either through thearticular surface or through deep cartilage, we investigate the effect of cartilage compositionon the diffusion and equilibrium distribution.
Contrast agent diffusion in articular cartilage 6825
Silicone tube
Ø 4.0 mm
10 mmCartilage-support tubeCartilage disk
PBS-soaked wad
70 mm pQCTslice
1 2 3 4
2.3 mm
4.0 mm
(A)
(B)
(C)
(D)
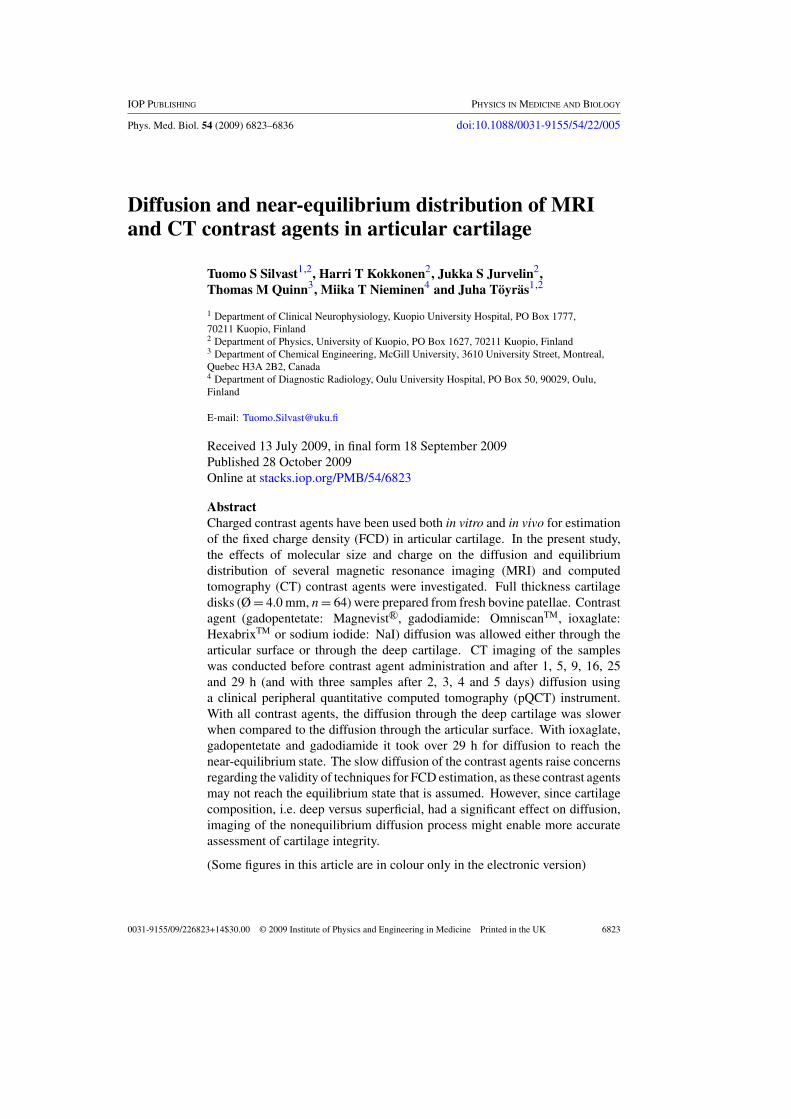
Figure 1. CECT experiment protocol. (A) Cartilage disks (Ø = 4.0 mm) were detached fromthe bovine patella within 6 h after slaughtering. (B) A basin (Ø = 70 mm) carried six sampleholders (inner Ø = 4.0 mm) with one cartilage disk in each. Tubes denoted with odd numbers hada disk with articular surface upward, and tubes with even numbers had a disk with deep cartilageupward. The basin contained a 50 ml contrast agent solution adjusted to have isotonic osmolarity.(C) A cotton wad soaked in physiological saline was placed inside the tube to keep themicroenvironment moist. A rigid tube inside the silicone tube supported the cartilage disk duringthe experiment. (D) The pQCT slice thickness was 2.3 mm, and the in-plane pixel size was0.20 " 0.20 mm2. Each slice was imaged five times and averaged.
2. Material and methods
Visually intact bovine patellae (n = 8) were dissected within 6 h after slaughtering. Allanimals were 16–24 months of age. Eight full thickness cartilage disks (Ø = 4.0 mm) weredetached from each patella with a dermal biopsy punch and a razor blade (figure 1(A)); thetotal sample number was 64. In order to minimize effects of spatial variations in cartilageproperties, cartilage disks were extracted as close to each other as possible. Thicknesses ofcartilage discs, measured with an optical microscope (SMZ-10, Nikon, Japan), were 1.95 ±0.7 mm (mean ± SD). Water contents, determined from the difference between wet weightsand dry weights after lyophilization for 17 h, were 78.4 ± 1.0%.
For CECT experiments, cartilage disks were exposed to contrast agents (figure 1(B))while mounted on custom-made sample holders which established the boundary conditionsfor diffusion. Sample holders (figure 1(C)) consisted of a silicone tube of inner diameter4 mm, with a rigid support tube inside such that cartilage disks sat on the hollow support tubewith their radial edges pressed against the silicone boundary. The interior of the rigid supporttube was kept humid with a PBS-soaked cotton wad, but contrast agent transport could not occurthrough the lower cartilage surface since it was essentially a cartilage–air interface. Therefore,the contrast agent could only enter the cartilage disk through its upper surface. The sampleholders themselves were mounted within a basin containing contrast agent solutions; diffusionwas allowed either through the articular surface or through the deep cartilage by adjusting theorientation of cartilage disks within the sample holders. The basin was covered with a twofoldParafilm R! layer to prevent evaporation. Four different contrast agents were used (table 1).Two adjacent cartilage disks from each patella, one in which diffusion was allowed through
6826 T S Silvast et al
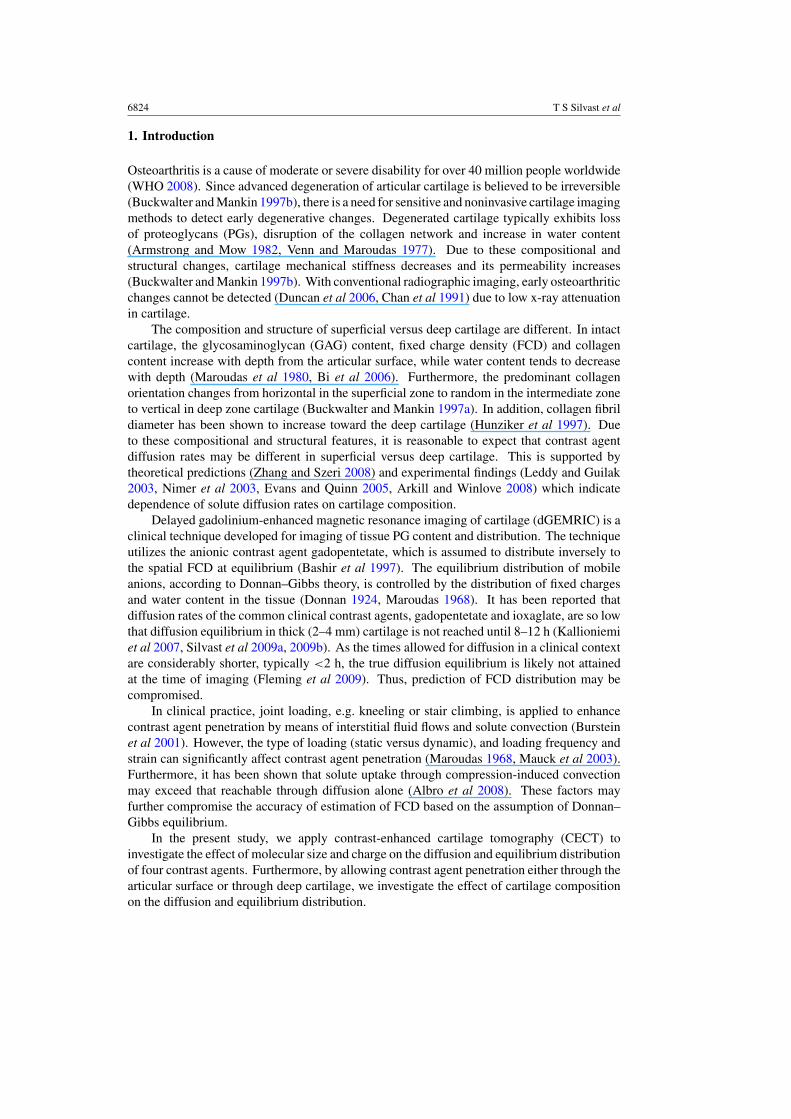
Table 1. Contrast agents were diluted in phosphate buffered physiological saline (PBS) to a volumeof 50 ml. Concentrations were chosen to provide similar signal-to-noise ratios, and each solutionwas adjusted to have isotonic osmolarity (280–330 mOsm) and pH 7.4. The toxicity of contrastagent is given as LD50 values for rats after intravenous injection. The toxicity of all four contrastagents is low enough to enable clinical use in e.g. knee joint arthrography.
M LD50 Molecular Trade nameCharge (g mol#1) c (mM) (mmol kg#1) formula and manufacturer
Gadopentetate #2 548 100 8a C28H54GdN5O20 Magnevist R! BayerSchering Pharma,Berlin, Germany
Gadodiamide 0 574 180 > 20b C16H28GdN5O9 OmniscanTM
Amersham Health,Oslo, Norway
Ioxaglate #1 1269 21 > 6c C24H21I6N5O8 HexabrixTM
Mallinckrodt,St Louis, MO, USA
Sodium iodide #1 150 134 7d NaI Sodium iodideSigma-Aldrich,St Louis, MO, USA
M = molecular mass, c = contrast agent bath concentration.a Bartolini et al 2003.b Omniscan product monograph, June 2006, GE Healthcare Canada Inc.c Hexabrix data sheet, July 2002, Mallinkrodt Inc.d Sodium iodide, Material safety data sheet, Sigma Chemical Co.
the articular surface and one in which diffusion was allowed through the deep cartilage,were in each contrast agent bath. The study was conducted at room temperature (20 $C),and the contrast agent solution was manually agitated at approximately the time points ofimaging. To prevent degradation of the samples, an inhibitor for proteolytic enzymes (5 mMethylenediaminetetraacetic acid disodium salt, EDTA; VWR International, Fontenay, France)and penicillin–streptomycin (100 units ml#1 penicillin, 100 µg ml#1 streptomycin; EuroClone,Siziano, Italy) were added to solutions. Cartilage disks were fixed in 10% formalin beforepreparation of histological samples.
All samples (n = 64) were imaged before immersion in the contrast agent bath, and after1, 5, 9, 16, 25 and 29 h in the bath (50 ml) using a clinical peripheral quantitative computedtomographic (pQCT) instrument (XCT 2000, Stratec Medizintechnik GmbH, Pforzheim,Germany). In addition, three sample pairs were left in each contrast agent bath solutionfor 5 days and were imaged after 2, 3, 4 and 5 days. A tube voltage of 58.0 kVp, a slicethickness of 2.3 mm, an in-plane pixel size of 0.20 " 0.20 mm2, and 360 imaging projectionswere applied. To minimize background noise, each slice was imaged five times and averaged.At each time point the total imaging time was about 25 min.
The measurement of outward diffusion was started after 33 h of inward diffusion. Thebath solutions were changed to PBS, and samples (n = 40) were imaged after 1, 5, 9, 16, 25,29 and 35 h in the PBS bath.
X-ray absorption maps of contrast agent-free cartilage disks were subtracted from thoseacquired within contrast agent baths. X-ray absorption maps were then transformed linearly toobtain contrast agent distribution maps. The linear conversion equations were obtained fromcalibration series of six different dilutions of each contrast agent (table 2).
Contrast agent diffusion in articular cartilage 6827
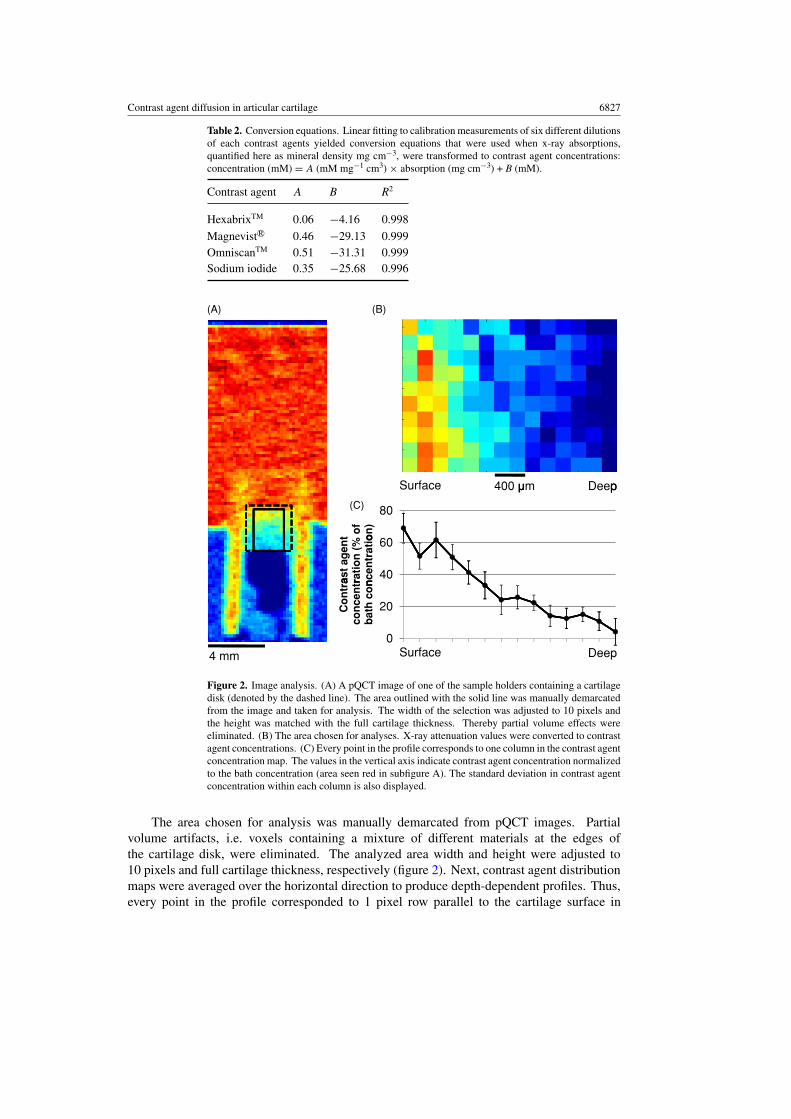
Table 2. Conversion equations. Linear fitting to calibration measurements of six different dilutionsof each contrast agents yielded conversion equations that were used when x-ray absorptions,quantified here as mineral density mg cm#3, were transformed to contrast agent concentrations:concentration (mM) = A (mM mg#1 cm3) " absorption (mg cm#3) + B (mM).
Contrast agent A B R2
HexabrixTM 0.06 #4.16 0.998Magnevist R! 0.46 #29.13 0.999OmniscanTM 0.51 #31.31 0.999Sodium iodide 0.35 #25.68 0.996
400 mSurface Deepp
80
of
on
)
40
60
ast a
gen
t ra
tion
(%
nce
ntr
atio
20Co
ntr
aco
nce
ntr
bat
h c
on
0Surface Deep4 mm
(A) (B)
(C)
Figure 2. Image analysis. (A) A pQCT image of one of the sample holders containing a cartilagedisk (denoted by the dashed line). The area outlined with the solid line was manually demarcatedfrom the image and taken for analysis. The width of the selection was adjusted to 10 pixels andthe height was matched with the full cartilage thickness. Thereby partial volume effects wereeliminated. (B) The area chosen for analyses. X-ray attenuation values were converted to contrastagent concentrations. (C) Every point in the profile corresponds to one column in the contrast agentconcentration map. The values in the vertical axis indicate contrast agent concentration normalizedto the bath concentration (area seen red in subfigure A). The standard deviation in contrast agentconcentration within each column is also displayed.
The area chosen for analysis was manually demarcated from pQCT images. Partialvolume artifacts, i.e. voxels containing a mixture of different materials at the edges ofthe cartilage disk, were eliminated. The analyzed area width and height were adjusted to10 pixels and full cartilage thickness, respectively (figure 2). Next, contrast agent distributionmaps were averaged over the horizontal direction to produce depth-dependent profiles. Thus,every point in the profile corresponded to 1 pixel row parallel to the cartilage surface in
6828 T S Silvast et al
SurfaceSurface1h 5h 16h 29h
DD
Surface
Deep
Surface
Deep
DeepDeep DeepDeep400 m1h 5h 16h 29h
Normalized contrast agent concentration (%)0 30 50 70 9010
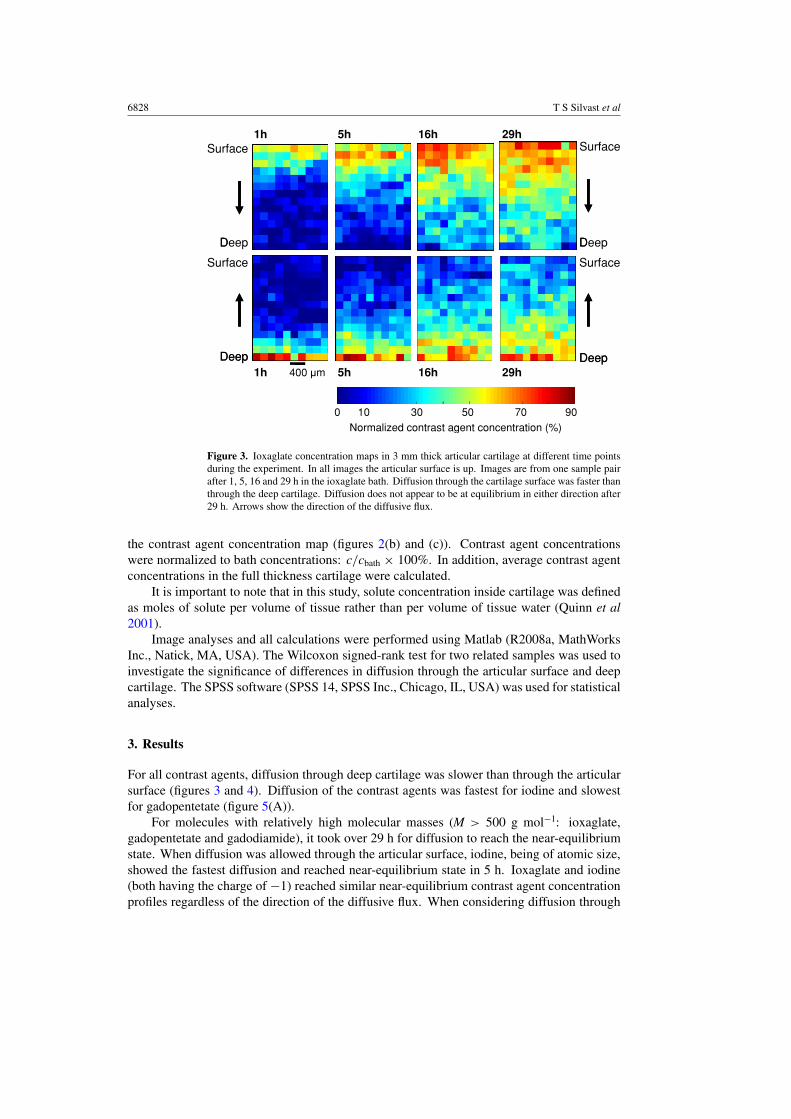
Figure 3. Ioxaglate concentration maps in 3 mm thick articular cartilage at different time pointsduring the experiment. In all images the articular surface is up. Images are from one sample pairafter 1, 5, 16 and 29 h in the ioxaglate bath. Diffusion through the cartilage surface was faster thanthrough the deep cartilage. Diffusion does not appear to be at equilibrium in either direction after29 h. Arrows show the direction of the diffusive flux.
the contrast agent concentration map (figures 2(b) and (c)). Contrast agent concentrationswere normalized to bath concentrations: c/cbath " 100%. In addition, average contrast agentconcentrations in the full thickness cartilage were calculated.
It is important to note that in this study, solute concentration inside cartilage was definedas moles of solute per volume of tissue rather than per volume of tissue water (Quinn et al2001).
Image analyses and all calculations were performed using Matlab (R2008a, MathWorksInc., Natick, MA, USA). The Wilcoxon signed-rank test for two related samples was used toinvestigate the significance of differences in diffusion through the articular surface and deepcartilage. The SPSS software (SPSS 14, SPSS Inc., Chicago, IL, USA) was used for statisticalanalyses.
3. Results
For all contrast agents, diffusion through deep cartilage was slower than through the articularsurface (figures 3 and 4). Diffusion of the contrast agents was fastest for iodine and slowestfor gadopentetate (figure 5(A)).
For molecules with relatively high molecular masses (M > 500 g mol#1: ioxaglate,gadopentetate and gadodiamide), it took over 29 h for diffusion to reach the near-equilibriumstate. When diffusion was allowed through the articular surface, iodine, being of atomic size,showed the fastest diffusion and reached near-equilibrium state in 5 h. Ioxaglate and iodine(both having the charge of #1) reached similar near-equilibrium contrast agent concentrationprofiles regardless of the direction of the diffusive flux. When considering diffusion through
Contrast agent diffusion in articular cartilage 6829
6080
100 Gadopentetate Gadopentetate
ion)
THROUGH SURFACE THROUGH DEEP CARTILAGE
0204060
conc
entra
ti
406080
100 Ioxaglate Ioxaglate
(% o
f bat
h
02040
100 G d di id Gntra
st a
gent
406080
100 Gadodiamide Gadodiamide
atio
n of
con
020
80100 Iodine Iodined
conc
entr
a
20406080
Nor
mal
ize
0Surface Deep Surface Deep
1 hour 5 hours 29 hours 5 days
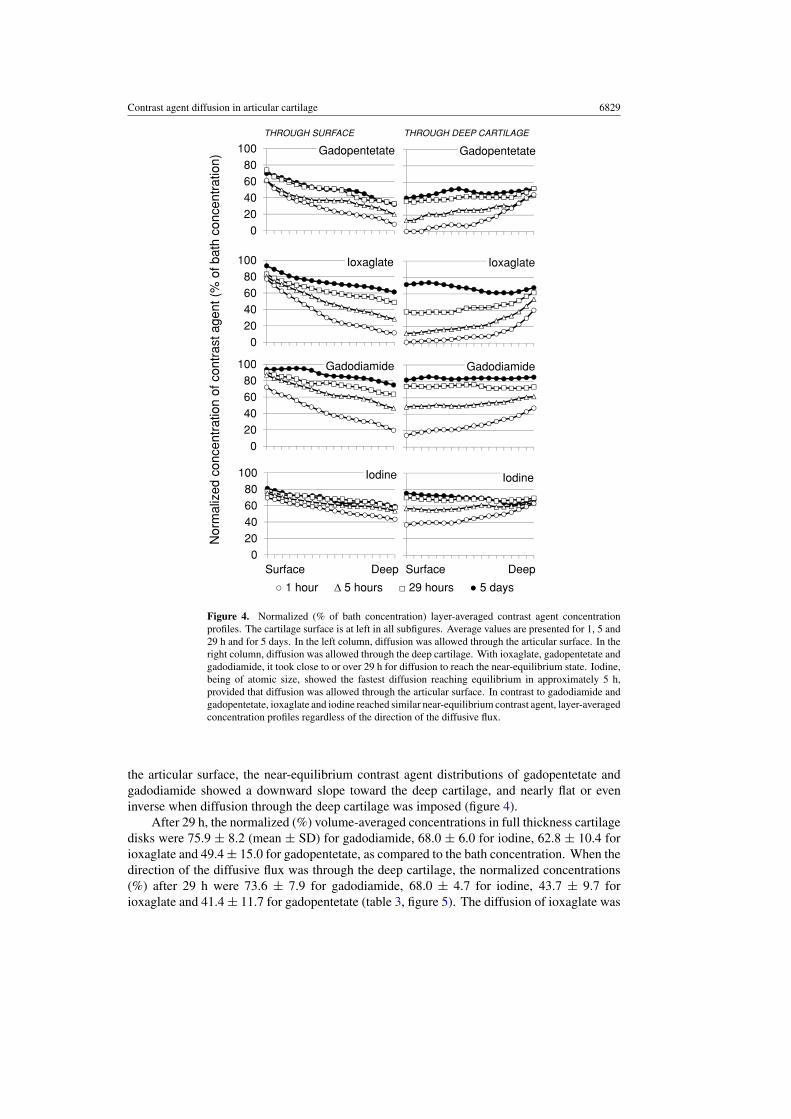
Figure 4. Normalized (% of bath concentration) layer-averaged contrast agent concentrationprofiles. The cartilage surface is at left in all subfigures. Average values are presented for 1, 5 and29 h and for 5 days. In the left column, diffusion was allowed through the articular surface. In theright column, diffusion was allowed through the deep cartilage. With ioxaglate, gadopentetate andgadodiamide, it took close to or over 29 h for diffusion to reach the near-equilibrium state. Iodine,being of atomic size, showed the fastest diffusion reaching equilibrium in approximately 5 h,provided that diffusion was allowed through the articular surface. In contrast to gadodiamide andgadopentetate, ioxaglate and iodine reached similar near-equilibrium contrast agent, layer-averagedconcentration profiles regardless of the direction of the diffusive flux.
the articular surface, the near-equilibrium contrast agent distributions of gadopentetate andgadodiamide showed a downward slope toward the deep cartilage, and nearly flat or eveninverse when diffusion through the deep cartilage was imposed (figure 4).
After 29 h, the normalized (%) volume-averaged concentrations in full thickness cartilagedisks were 75.9 ± 8.2 (mean ± SD) for gadodiamide, 68.0 ± 6.0 for iodine, 62.8 ± 10.4 forioxaglate and 49.4 ± 15.0 for gadopentetate, as compared to the bath concentration. When thedirection of the diffusive flux was through the deep cartilage, the normalized concentrations(%) after 29 h were 73.6 ± 7.9 for gadodiamide, 68.0 ± 4.7 for iodine, 43.7 ± 9.7 forioxaglate and 41.4 ± 11.7 for gadopentetate (table 3, figure 5). The diffusion of ioxaglate was
6830 T S Silvast et al
80tratio
n) IN OUT100
60
40ba
th c
once
nt
h h h h h h d d d d h h h h h h h
20
0
atio
n (%
of b
1 5 9 16 25 29 2 3 4 5 1 5 9 16 25 29 35
nt c
once
ntra
IN OUT100
cont
rast
age
60
80
Nor
mal
ized
c 40
20
0
1h 5h 9h 16h
25h
29h
35h
N 0
Gadopentetate Ioxaglate Iodine Gadodiamide
1h 5h 9h 16h
25h
29h 2d 3d 4d 5d
(A) (B)
(C) (D)
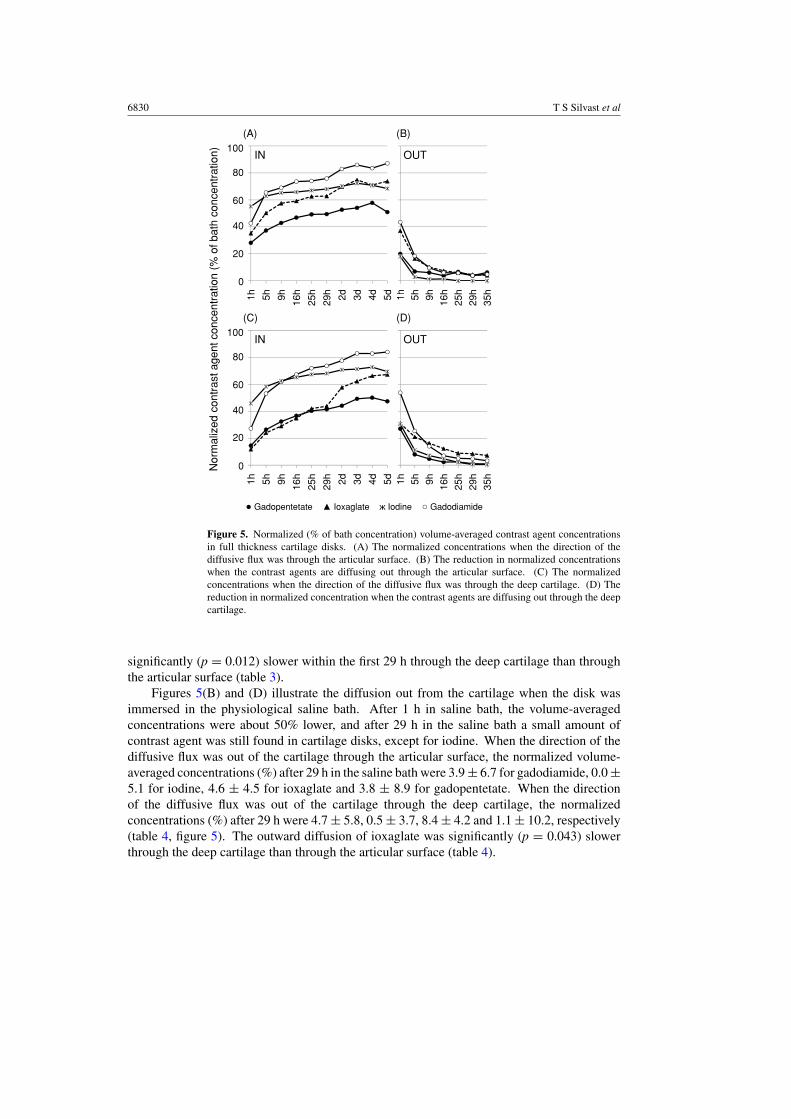
Figure 5. Normalized (% of bath concentration) volume-averaged contrast agent concentrationsin full thickness cartilage disks. (A) The normalized concentrations when the direction of thediffusive flux was through the articular surface. (B) The reduction in normalized concentrationswhen the contrast agents are diffusing out through the articular surface. (C) The normalizedconcentrations when the direction of the diffusive flux was through the deep cartilage. (D) Thereduction in normalized concentration when the contrast agents are diffusing out through the deepcartilage.
significantly (p = 0.012) slower within the first 29 h through the deep cartilage than throughthe articular surface (table 3).
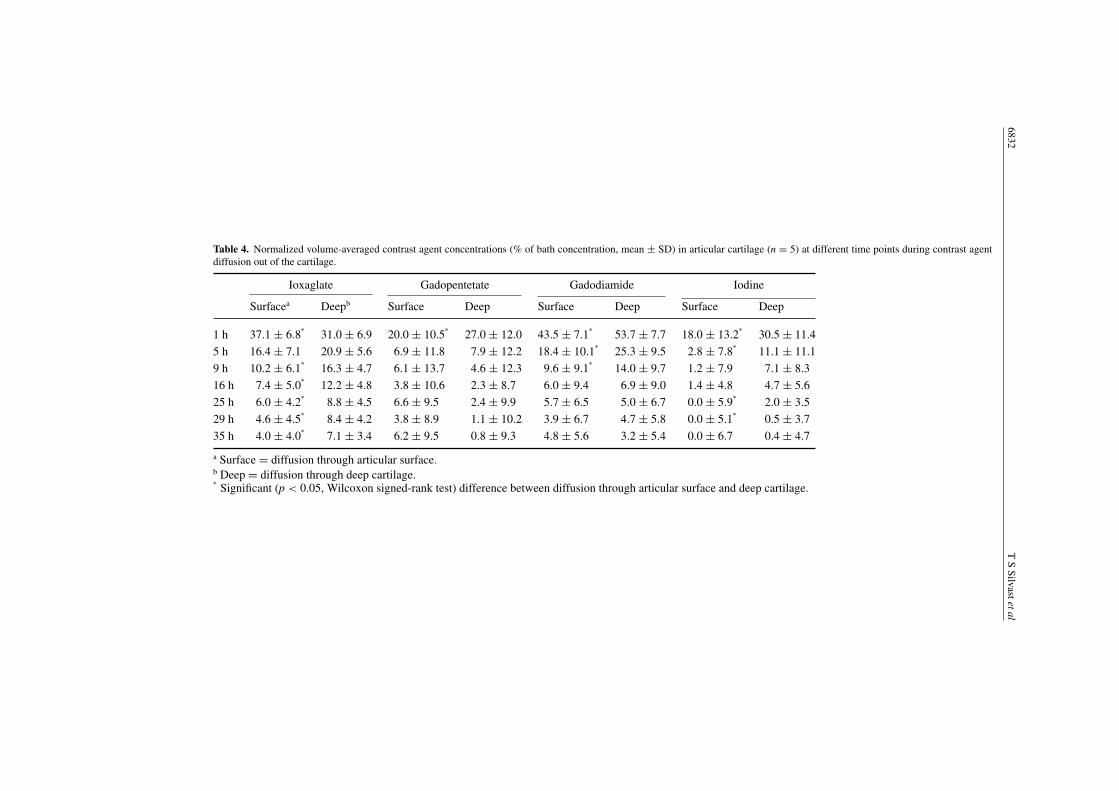
Figures 5(B) and (D) illustrate the diffusion out from the cartilage when the disk wasimmersed in the physiological saline bath. After 1 h in saline bath, the volume-averagedconcentrations were about 50% lower, and after 29 h in the saline bath a small amount ofcontrast agent was still found in cartilage disks, except for iodine. When the direction of thediffusive flux was out of the cartilage through the articular surface, the normalized volume-averaged concentrations (%) after 29 h in the saline bath were 3.9 ± 6.7 for gadodiamide, 0.0 ±5.1 for iodine, 4.6 ± 4.5 for ioxaglate and 3.8 ± 8.9 for gadopentetate. When the directionof the diffusive flux was out of the cartilage through the deep cartilage, the normalizedconcentrations (%) after 29 h were 4.7 ± 5.8, 0.5 ± 3.7, 8.4 ± 4.2 and 1.1 ± 10.2, respectively(table 4, figure 5). The outward diffusion of ioxaglate was significantly (p = 0.043) slowerthrough the deep cartilage than through the articular surface (table 4).
Contrastagentdiffusion
inarticularcartilage
6831
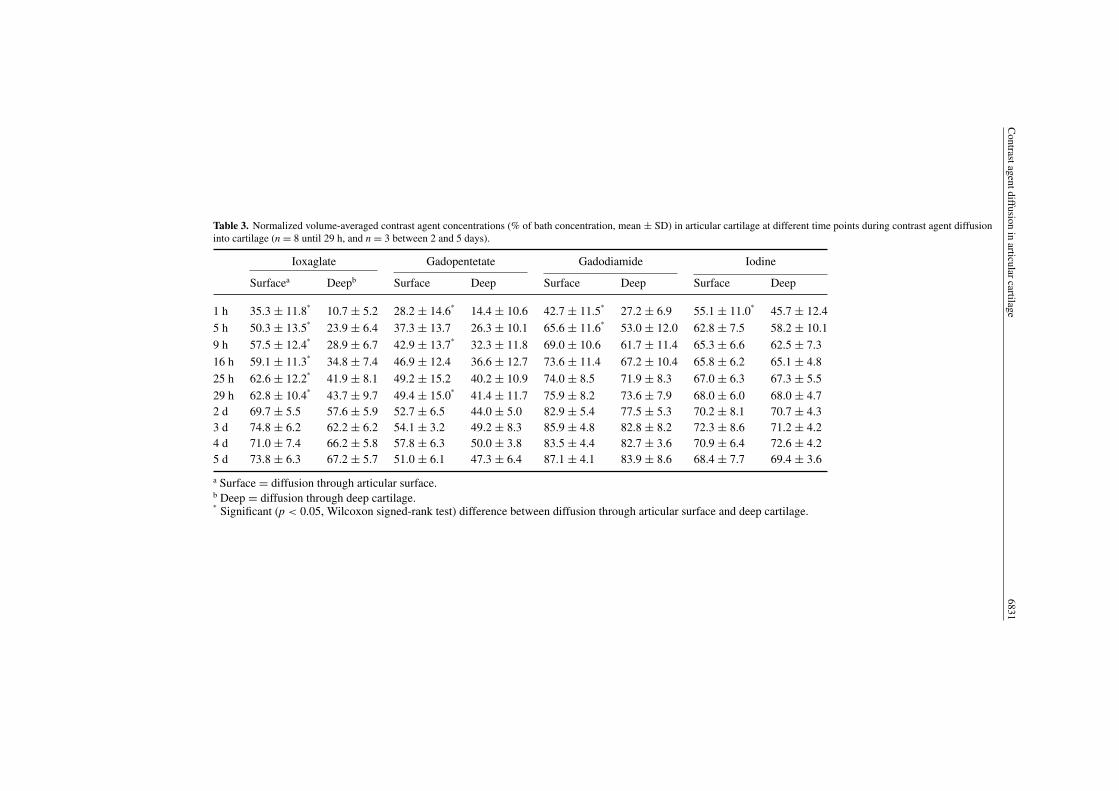
Table 3. Normalized volume-averaged contrast agent concentrations (% of bath concentration, mean ± SD) in articular cartilage at different time points during contrast agent diffusioninto cartilage (n = 8 until 29 h, and n = 3 between 2 and 5 days).
Ioxaglate Gadopentetate Gadodiamide Iodine
Surfacea Deepb Surface Deep Surface Deep Surface Deep
1 h 35.3 ± 11.8%
10.7 ± 5.2 28.2 ± 14.6%
14.4 ± 10.6 42.7 ± 11.5%
27.2 ± 6.9 55.1 ± 11.0%
45.7 ± 12.45 h 50.3 ± 13.5
%23.9 ± 6.4 37.3 ± 13.7 26.3 ± 10.1 65.6 ± 11.6
%53.0 ± 12.0 62.8 ± 7.5 58.2 ± 10.1
9 h 57.5 ± 12.4%
28.9 ± 6.7 42.9 ± 13.7%
32.3 ± 11.8 69.0 ± 10.6 61.7 ± 11.4 65.3 ± 6.6 62.5 ± 7.316 h 59.1 ± 11.3
%34.8 ± 7.4 46.9 ± 12.4 36.6 ± 12.7 73.6 ± 11.4 67.2 ± 10.4 65.8 ± 6.2 65.1 ± 4.8
25 h 62.6 ± 12.2%
41.9 ± 8.1 49.2 ± 15.2 40.2 ± 10.9 74.0 ± 8.5 71.9 ± 8.3 67.0 ± 6.3 67.3 ± 5.529 h 62.8 ± 10.4
%43.7 ± 9.7 49.4 ± 15.0
%41.4 ± 11.7 75.9 ± 8.2 73.6 ± 7.9 68.0 ± 6.0 68.0 ± 4.7
2 d 69.7 ± 5.5 57.6 ± 5.9 52.7 ± 6.5 44.0 ± 5.0 82.9 ± 5.4 77.5 ± 5.3 70.2 ± 8.1 70.7 ± 4.33 d 74.8 ± 6.2 62.2 ± 6.2 54.1 ± 3.2 49.2 ± 8.3 85.9 ± 4.8 82.8 ± 8.2 72.3 ± 8.6 71.2 ± 4.24 d 71.0 ± 7.4 66.2 ± 5.8 57.8 ± 6.3 50.0 ± 3.8 83.5 ± 4.4 82.7 ± 3.6 70.9 ± 6.4 72.6 ± 4.25 d 73.8 ± 6.3 67.2 ± 5.7 51.0 ± 6.1 47.3 ± 6.4 87.1 ± 4.1 83.9 ± 8.6 68.4 ± 7.7 69.4 ± 3.6
a Surface = diffusion through articular surface.b Deep = diffusion through deep cartilage.%
Significant (p < 0.05, Wilcoxon signed-rank test) difference between diffusion through articular surface and deep cartilage.
6832T
SSilvastetal
Table 4. Normalized volume-averaged contrast agent concentrations (% of bath concentration, mean ± SD) in articular cartilage (n = 5) at different time points during contrast agentdiffusion out of the cartilage.
Ioxaglate Gadopentetate Gadodiamide Iodine
Surfacea Deepb Surface Deep Surface Deep Surface Deep
1 h 37.1 ± 6.8%
31.0 ± 6.9 20.0 ± 10.5%
27.0 ± 12.0 43.5 ± 7.1%
53.7 ± 7.7 18.0 ± 13.2%
30.5 ± 11.45 h 16.4 ± 7.1 20.9 ± 5.6 6.9 ± 11.8 7.9 ± 12.2 18.4 ± 10.1
%25.3 ± 9.5 2.8 ± 7.8
%11.1 ± 11.1
9 h 10.2 ± 6.1%
16.3 ± 4.7 6.1 ± 13.7 4.6 ± 12.3 9.6 ± 9.1%
14.0 ± 9.7 1.2 ± 7.9 7.1 ± 8.316 h 7.4 ± 5.0
%12.2 ± 4.8 3.8 ± 10.6 2.3 ± 8.7 6.0 ± 9.4 6.9 ± 9.0 1.4 ± 4.8 4.7 ± 5.6
25 h 6.0 ± 4.2%
8.8 ± 4.5 6.6 ± 9.5 2.4 ± 9.9 5.7 ± 6.5 5.0 ± 6.7 0.0 ± 5.9%
2.0 ± 3.529 h 4.6 ± 4.5
%8.4 ± 4.2 3.8 ± 8.9 1.1 ± 10.2 3.9 ± 6.7 4.7 ± 5.8 0.0 ± 5.1
%0.5 ± 3.7
35 h 4.0 ± 4.0%
7.1 ± 3.4 6.2 ± 9.5 0.8 ± 9.3 4.8 ± 5.6 3.2 ± 5.4 0.0 ± 6.7 0.4 ± 4.7
a Surface = diffusion through articular surface.b Deep = diffusion through deep cartilage.%
Significant (p < 0.05, Wilcoxon signed-rank test) difference between diffusion through articular surface and deep cartilage.
Contrast agent diffusion in articular cartilage 6833
Control Ioxaglate Gadopentetate Gadodiamide Sodium iodide
0.5 mm
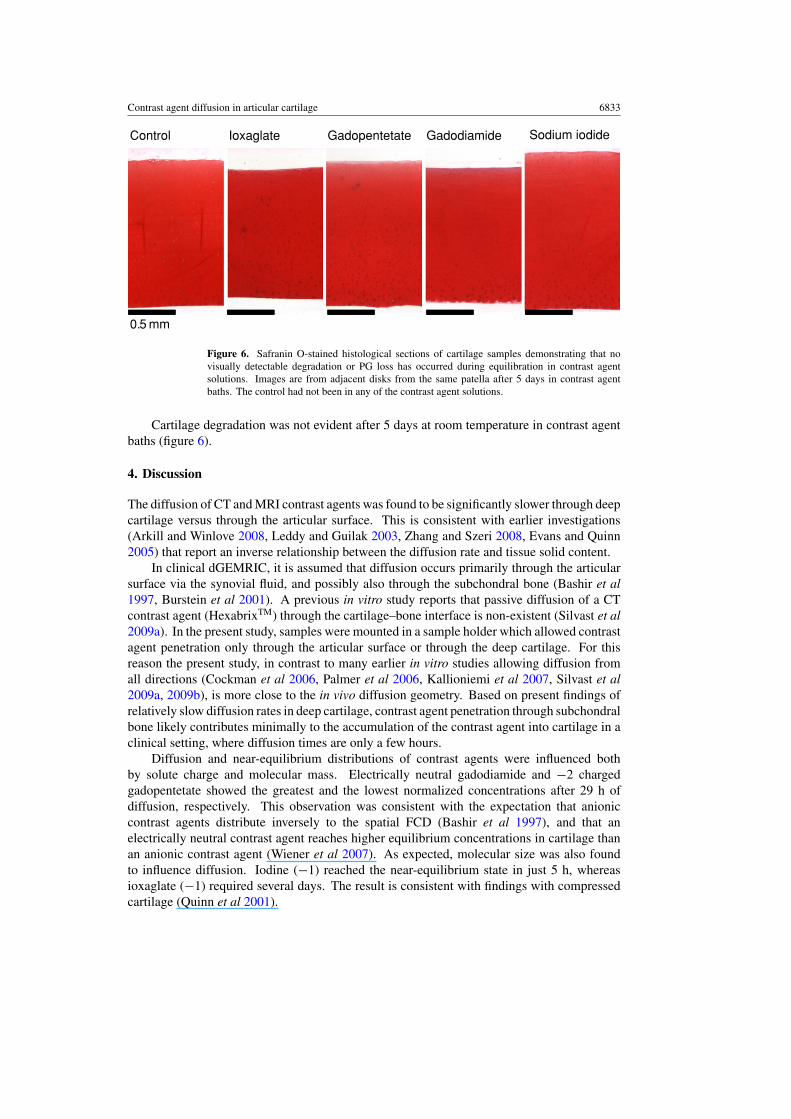
Figure 6. Safranin O-stained histological sections of cartilage samples demonstrating that novisually detectable degradation or PG loss has occurred during equilibration in contrast agentsolutions. Images are from adjacent disks from the same patella after 5 days in contrast agentbaths. The control had not been in any of the contrast agent solutions.
Cartilage degradation was not evident after 5 days at room temperature in contrast agentbaths (figure 6).
4. Discussion
The diffusion of CT and MRI contrast agents was found to be significantly slower through deepcartilage versus through the articular surface. This is consistent with earlier investigations(Arkill and Winlove 2008, Leddy and Guilak 2003, Zhang and Szeri 2008, Evans and Quinn2005) that report an inverse relationship between the diffusion rate and tissue solid content.
In clinical dGEMRIC, it is assumed that diffusion occurs primarily through the articularsurface via the synovial fluid, and possibly also through the subchondral bone (Bashir et al1997, Burstein et al 2001). A previous in vitro study reports that passive diffusion of a CTcontrast agent (HexabrixTM) through the cartilage–bone interface is non-existent (Silvast et al2009a). In the present study, samples were mounted in a sample holder which allowed contrastagent penetration only through the articular surface or through the deep cartilage. For thisreason the present study, in contrast to many earlier in vitro studies allowing diffusion fromall directions (Cockman et al 2006, Palmer et al 2006, Kallioniemi et al 2007, Silvast et al2009a, 2009b), is more close to the in vivo diffusion geometry. Based on present findings ofrelatively slow diffusion rates in deep cartilage, contrast agent penetration through subchondralbone likely contributes minimally to the accumulation of the contrast agent into cartilage in aclinical setting, where diffusion times are only a few hours.
Diffusion and near-equilibrium distributions of contrast agents were influenced bothby solute charge and molecular mass. Electrically neutral gadodiamide and #2 chargedgadopentetate showed the greatest and the lowest normalized concentrations after 29 h ofdiffusion, respectively. This observation was consistent with the expectation that anioniccontrast agents distribute inversely to the spatial FCD (Bashir et al 1997), and that anelectrically neutral contrast agent reaches higher equilibrium concentrations in cartilage thanan anionic contrast agent (Wiener et al 2007). As expected, molecular size was also foundto influence diffusion. Iodine (#1) reached the near-equilibrium state in just 5 h, whereasioxaglate (#1) required several days. The result is consistent with findings with compressedcartilage (Quinn et al 2001).
6834 T S Silvast et al
According to the Gibbs–Donnan theory, the direction of the diffusive flux should notaffect the equilibrium distribution of contrast agents. The near-equilibrium distributionsof ioxaglate and iodine, both having similar charges, were independent of the direction ofthe diffusive flux after 5 days and showed similar distributions (figure 4). In contrast, theconcentration distributions of gadopentetate and gadodiamide, when diffused through thesuperficial cartilage and deep cartilage, were still dependent upon the diffusion direction evenafter 5 days. Differences in contrast agent distribution profiles at near-equilibrium suggestthat the equilibration may also be strongly influenced by factors such as steric hindrance,particularly in deep tissue with higher solid content. In articular cartilage, the water contentdecreases with tissue depth, and all contrast agents followed this trend when diffusion occurredthrough the articular surface. When diffusion progressed through the deep cartilage, the reasonfor the constant, depth-independent, near-equilibrium distribution of gadodiamide remainsunclear. However, it may be explained if diffusion never reached equilibrium during theexperiment.
These questions could be addressed by means of modeling contrast agent diffusion inarticular cartilage. However, as cartilage is a highly complex, anisotropic and multiphasictissue, accurate modeling of diffusion of contrast agent molecules is a demanding task. Ifsuch a model could be created, it would enable analysis of the relationships between cartilagestructural and diffusion properties. This could enable functional imaging of articular cartilageproperties.
Equilibration times of over 29 h with the large molecules (ioxaglate, gadopentetate, andgadodiamide) suggest that the Gibbs–Donnan equilibrium may not be reached within clinicallyfeasible diffusion times (90–120 min). Thus, clinical quantification of FCD distributions maynot be accurate with these molecules. The observation of long equilibration times is consistentwith the finding that the diffusion equilibrium in thick (2–4 mm) cartilage is not reached until8–12 h (Kallioniemi et al 2007, Silvast et al 2009a, 2009b).
The present contrast agent concentrations (21–180 mM) were significantly highercompared to those applied clinically in dGEMRIC (1–2 mM). This may affect diffusionand the near-equilibrium distribution. We gently stirred the contrast agent baths only at thetime points of imaging. More active stirring of the bath may increase the diffusion, sincestirring reduces the potential film formation at the liquid–cartilage interface and homogenizespossible concentration differences in the bath (Maroudas et al 1968).
For practical reasons, the present experiment was performed at room temperature (20 $C).Diffusion is generally faster at higher temperatures because of quicker Brownian motion anddecreased viscosity of contrast agents. Thus, conducting the experiment at body temperaturewould likely accelerate contrast agent diffusion. However, since several previous studiesinvestigating contrast-enhanced imaging of cartilage have been conducted at room temperature(Cockman et al 2006, Kallioniemi et al 2007, Silvast et al 2009a, Nieminen et al 2004,Kurkijarvi et al 2007, Lammentausta et al 2007, Nissi et al 2007, Wiener et al 2007), presentresults are fully comparable with previous results reported in the literature.
Diffusion of contrast agents was significantly different through the deep cartilage whencompared to diffusion through the articular surface. These findings are consistent with previousreports of cartilage composition having a significant effect on diffusion rates (Piscaer et al2008, Evans and Quinn 2005, Roberts et al 1996). For this reason, the imaging of solutediffusion in cartilage could have potential in the diagnosis of cartilage integrity. The diffusionrate may reflect the composition, and indirectly the functional properties, of the articularcartilage.
Contrast agent diffusion in articular cartilage 6835
Acknowledgments
Financial support from the Kuopio University Hospital (EVO 5041715), Finland, andSigrid Juselius Foundation, Finland, is acknowledged. The Bone and Cartilage ResearchUnit, University of Kuopio, Finland, is acknowledged for providing the pQCT instrument.Mikko Lammi is acknowledged for contributing in designing the study. Sanna Miettinenis acknowledged for water content measurements, and Eija Rahunen is acknowledged forpreparing histological sections. The authors thank Atria Lihakunta Oyj, Kuopio, Finland, forproviding the fresh bovine joints.
References
Albro M B, Chahine N O, Li R, Yeager K, Hung C T and Ateshian G A 2008 Dynamic loading of deformable porousmedia can induce active solute transport J. Biomech. 41 3152–7
Arkill K P and Winlove C P 2008 Solute transport in the deep and calcified zones of articular cartilage OsteoarthritisCartilage 16 708–14
Armstrong C G and Mow V C 1982 Variations in the intrinsic mechanical properties of human articular cartilage withage, degeneration, and water content J. Bone Joint Surg. Am. 64 88–94
Bartolini M E, Pekar J, Chettle D R, McNeill F, Scott A, Sykes J, Prato F S and Moran G R 2003 An investigation ofthe toxicity of gadolinium based MRI contrast agents Magn. Reson. Imaging 21 541–4
Bashir A, Gray M L, Boutin R D and Burstein D 1997 Glycosaminoglycan in articular cartilage: in vivo assessmentwith delayed Gd(DTPA)(2-)-enhanced MR imaging Radiology 205 551–8
Bi X, Yang X, Bostrom M P and Camacho N P 2006 Fourier transform infrared imaging spectroscopy investigationsin the pathogenesis and repair of cartilage Biochim. Biophys. Acta 1758 934–41
Buckwalter J A and Mankin H J 1997a Instructional Course Lectures, The American Academy of OrthopaedicSurgeons—Articular cartilage: Part I. Tissue design and chondrocyte-matrix interactions J. Bone Joint Surg.Am. 79 600–11
Buckwalter J A and Mankin H J 1997b Instructional course lectures, The American Academy of OrthopaedicSurgeons—Articular cartilage: Part II. Degeneration and osteoarthrosis, repair, regeneration, and transplantationJ. Bone Joint Surg. Am. 79 612–32
Burstein D, Velyvis J, Scott K T, Stock K W, Kim Y-J, Jaramillo D, Boutin R D and Gray M L 2001 Protocol issues fordelayed Gd(DTPA)2—enhanced MRI (dGEMRIC) for clinical evaluation of articular cartilage Magn. Reson.Med. 45 36–41
Chan W P, Lang P, Stevens M P, Sack K, Majumdar S, Stoller D W, Basch C and Genant H K 1991 Osteoarthritis ofthe knee: comparison of radiography, CT, and MR imaging to assess extent and severity AJR Am. J. Roentgenol.157 799–806
Cockman M D, Blanton C A, Chmielewski P A, Dong L, Dufresne T E, Hookfin E B, Karb M J, Liu S andWehmeyer K R 2006 Quantitative imaging of proteoglycan in cartilage using a gadolinium probe and microCTOsteoarthritis Cartilage 14 210–14
Donnan F G 1924 The theory of membrane equilibria Chem. Rev. 1 73–90Duncan R C, Hay E M, Saklatvala J and Croft P R 2006 Prevalence of radiographic osteoarthritis—it all depends on
your point of view Rheumatology (Oxford) 45 757–60Evans R C and Quinn T M 2005 Solute diffusivity correlates with mechanical properties and matrix density of
compressed articular cartilage Arch. Biochem. Biophys. 442 1–10Fleming B C, Portney R, Tung G A, Fadale P D, Hulstyn M J, Bowers M E, Machan J T and Oksendahl H L 2009
Delayed gadolinium enhanced MRI of cartilage (dGEMRIC) following ACL injury 55th Annual Meeting of theOrthopaedic Research Society (Las Vegas, NV, The Orthopaedic Research Society)
Hunziker E B, Michel M and Studer D 1997 Ultrastructure of adult human articular cartilage matrix after cryotechnicalprocessing Microsc. Res. Tech. 37 271–84
Kallioniemi A S, Jurvelin J S, Nieminen M T, Lammi M J and Toyras J 2007 Contrast agent enhanced pQCT ofarticular cartilage Phys. Med. Biol. 52 1209–19
Kurkijarvi J E, Nissi M J, Rieppo J, Toyras J, Kiviranta I, Nieminen M T and Jurvelin J S 2008 The zonal architectureof human articular cartilage described by T(2) relaxation time in the presence of Gd-DTPA(2-) Magn. Reson.Imag. 26 602–7
Lammentausta E, Kiviranta P, Toyras J, Hyttinen M M, Kiviranta I, Nieminen M T and Jurvelin J S 2007 QuantitativeMRI of parallel changes of articular cartilage and underlying trabecular bone in degeneration OsteoarthritisCartilage 15 1149–57
6836 T S Silvast et al
Leddy H A and Guilak F 2003 Site-specific molecular diffusion in articular cartilage measured using fluorescencerecovery after photobleaching Ann. Biomed. Eng. 31 753–60
Maroudas A 1968 Physicochemical properties of cartilage in the light of ion exchange theory Biophys. J. 8 575–95Maroudas A, Bayliss M T and Venn M F 1980 Further studies on the composition of human femoral head cartilage
Ann. Rheum. Dis. 39 514–23Maroudas A, Bullough P, Swanson S A and Freeman M A 1968 The permeability of articular cartilage J. Bone Joint
Surg. Br. 50 166–77Mauck R L, Hung C T and Ateshian G A 2003 Modeling of neutral solute transport in a dynamically loaded
porous permeable gel: implications for articular cartilage biosynthesis and tissue engineering J. Biomech.Eng. 125 602–14
Nieminen M T, Toyras J, Laasanen M S, Silvennoinen J, Helminen H J and Jurvelin J S 2004 Prediction ofbiomechanical properties of articular cartilage with quantitative magnetic resonance imaging J. Biomech.37 321–8
Nimer E, Schneiderman R and Maroudas A 2003 Diffusion and partition of solutes in cartilage under static loadBiophys. Chem. 106 125–46
Nissi M J, Rieppo J, Toyras J, Laasanen M S, Kiviranta I, Nieminen M T and Jurvelin J S 2007 Estimation ofmechanical properties of articular cartilage with MRI—dGEMRIC, T2 and T1 imaging in different species withvariable stages of maturation Osteoarthritis Cartilage 15 1141–8
Palmer A W, Guldberg R E and Levenston M E 2006 Analysis of cartilage matrix fixed charge density andthree-dimensional morphology via contrast-enhanced microcomputed tomography Proc. Natl Acad. Sci.USA 103 19255–60
Piscaer T M, Waarsing J H, Kops N, Pavljasevic P, Verhaar J A, Van Osch G J and Weinans H 2008 In vivo imagingof cartilage degeneration using muCT-arthrography Osteoarthritis Cartilage 16 1011–7
Quinn T M, Morel V and Meister J J 2001 Static compression of articular cartilage can reduce solute diffusivity andpartitioning: implications for the chondrocyte biological response J. Biomech. 34 1463–9
Roberts S, Urban J P, Evans H and Eisenstein S M 1996 Transport properties of the human cartilage endplate inrelation to its composition and calcification Spine 21 415–20
Silvast T S, Jurvelin J S, Aula A S, Lammi M J and Toyras J 2009a Contrast agent-enhanced computed tomographyof articular cartilage: association with tissue composition and properties Acta Radiol. 50 78–85
Silvast T S, Jurvelin J S, Lammi M J and Toyras J 2009b pQCT study on diffusion and equilibrium distribution ofiodinated anionic contrast agent in human articular cartilage—associations to matrix composition and integrityOsteoarthritis Cartilage 17 26–32
Venn M and Maroudas A 1977 Chemical composition and swelling of normal and osteoarthrotic femoral head cartilageI. Chemical composition Ann. Rheum. Dis. 36 121–9
WHO 2008 The Global Burden of Disease: 2004 Update World Health OrganizationWiener E, Woertler K, Weirich G, Rummeny E J and Settles M 2007 Contrast enhanced cartilage imaging: comparison
of ionic and non-ionic contrast agents Eur. J. Radiol. 63 110–9Zhang L and Szeri A Z 2008 Transport of neutral solute in articular cartilage: effect of microstructure anisotropy
J. Biomech. 41 430–7


