Embed Size (px)
Citation preview
178 CHAPTER 2: Elementary and Secondary EducationHigh School Seniors, Completions, and Dropouts
gh Sch
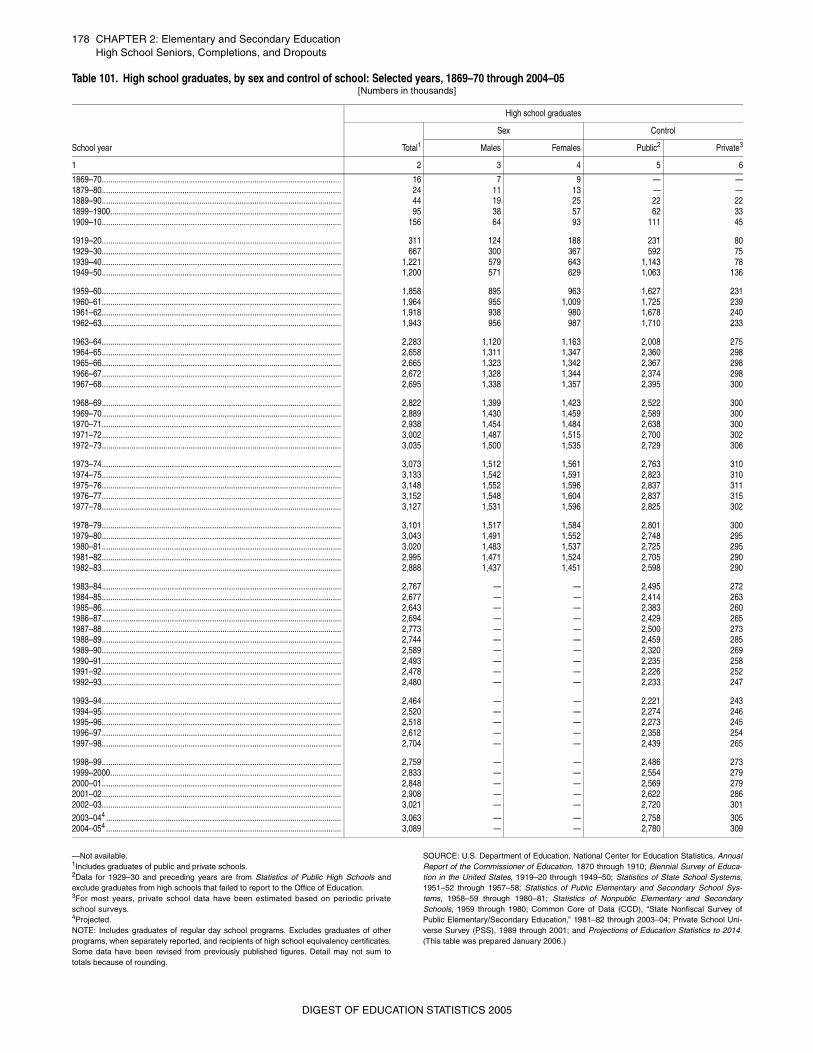
—Not available.1Includes graduates of public and private schools.2Data for 1929–30 and preceding years are from Statistics of Public High Schools andexclude graduates from high schools that failed to report to the Office of Education.3For most years, private school data have been estimated based on periodic privateschool surveys.4Projected. NOTE: Includes graduates of regular day school programs. Excludes graduates of otherprograms, when separately reported, and recipients of high school equivalency certificates.Some data have been revised from previously published figures. Detail may not sum tototals because of rounding.
SOURCE: U.S. Department of Education, National Center for Education Statistics, AnnualReport of the Commissioner of Education, 1870 through 1910; Biennial Survey of Educa-tion in the United States, 1919–20 through 1949–50; Statistics of State School Systems,1951–52 through 1957–58; Statistics of Public Elementary and Secondary School Sys-tems, 1958–59 through 1980–81; Statistics of Nonpublic Elementary and SecondarySchools, 1959 through 1980; Common Core of Data (CCD), “State Nonfiscal Survey ofPublic Elementary/Secondary Education,” 1981–82 through 2003–04; Private School Uni-verse Survey (PSS), 1989 through 2001; and Projections of Education Statistics to 2014.(This table was prepared January 2006.)
Hi Table 101. High school graduates, by sex and control of school: Selected years, 1869–70 through 2004–05[Numbers in thousands]
School year
High school graduates
Total1
Sex Control
Males Females Public2 Private3
1 2 3 4 5 6
1869–70................................................................................................................. 16 7 9 — —1879–80................................................................................................................. 24 11 13 — —1889–90................................................................................................................. 44 19 25 22 221899–1900............................................................................................................. 95 38 57 62 331909–10................................................................................................................. 156 64 93 111 45
1919–20................................................................................................................. 311 124 188 231 801929–30................................................................................................................. 667 300 367 592 751939–40................................................................................................................. 1,221 579 643 1,143 781949–50................................................................................................................. 1,200 571 629 1,063 136
1959–60................................................................................................................. 1,858 895 963 1,627 2311960–61................................................................................................................. 1,964 955 1,009 1,725 2391961–62................................................................................................................. 1,918 938 980 1,678 2401962–63................................................................................................................. 1,943 956 987 1,710 233
1963–64................................................................................................................. 2,283 1,120 1,163 2,008 2751964–65................................................................................................................. 2,658 1,311 1,347 2,360 2981965–66................................................................................................................. 2,665 1,323 1,342 2,367 2981966–67................................................................................................................. 2,672 1,328 1,344 2,374 2981967–68................................................................................................................. 2,695 1,338 1,357 2,395 300
1968–69................................................................................................................. 2,822 1,399 1,423 2,522 3001969–70................................................................................................................. 2,889 1,430 1,459 2,589 3001970–71................................................................................................................. 2,938 1,454 1,484 2,638 3001971–72................................................................................................................. 3,002 1,487 1,515 2,700 3021972–73................................................................................................................. 3,035 1,500 1,535 2,729 306
1973–74................................................................................................................. 3,073 1,512 1,561 2,763 3101974–75................................................................................................................. 3,133 1,542 1,591 2,823 3101975–76................................................................................................................. 3,148 1,552 1,596 2,837 3111976–77................................................................................................................. 3,152 1,548 1,604 2,837 3151977–78................................................................................................................. 3,127 1,531 1,596 2,825 302
1978–79................................................................................................................. 3,101 1,517 1,584 2,801 3001979–80................................................................................................................. 3,043 1,491 1,552 2,748 2951980–81................................................................................................................. 3,020 1,483 1,537 2,725 2951981–82................................................................................................................. 2,995 1,471 1,524 2,705 2901982–83................................................................................................................. 2,888 1,437 1,451 2,598 290
1983–84................................................................................................................. 2,767 — — 2,495 2721984–85................................................................................................................. 2,677 — — 2,414 2631985–86................................................................................................................. 2,643 — — 2,383 2601986–87................................................................................................................. 2,694 — — 2,429 2651987–88................................................................................................................. 2,773 — — 2,500 2731988–89................................................................................................................. 2,744 — — 2,459 2851989–90................................................................................................................. 2,589 — — 2,320 2691990–91................................................................................................................. 2,493 — — 2,235 2581991–92................................................................................................................. 2,478 — — 2,226 2521992–93................................................................................................................. 2,480 — — 2,233 247
1993–94................................................................................................................. 2,464 — — 2,221 2431994–95................................................................................................................. 2,520 — — 2,274 2461995–96................................................................................................................. 2,518 — — 2,273 2451996–97................................................................................................................. 2,612 — — 2,358 2541997–98................................................................................................................. 2,704 — — 2,439 265
1998–99................................................................................................................. 2,759 — — 2,486 2731999–2000............................................................................................................. 2,833 — — 2,554 2792000–01................................................................................................................. 2,848 — — 2,569 2792001–02................................................................................................................. 2,908 — — 2,622 2862002–03................................................................................................................. 3,021 — — 2,720 3012003–044 ............................................................................................................... 3,063 — — 2,758 3052004–054 ............................................................................................................... 3,089 — — 2,780 309
DIGEST OF EDUCATION STATISTICS 2005
CHAPTER 2: Elementary and Secondary Education 179High School Seniors, Completions, and Dropouts
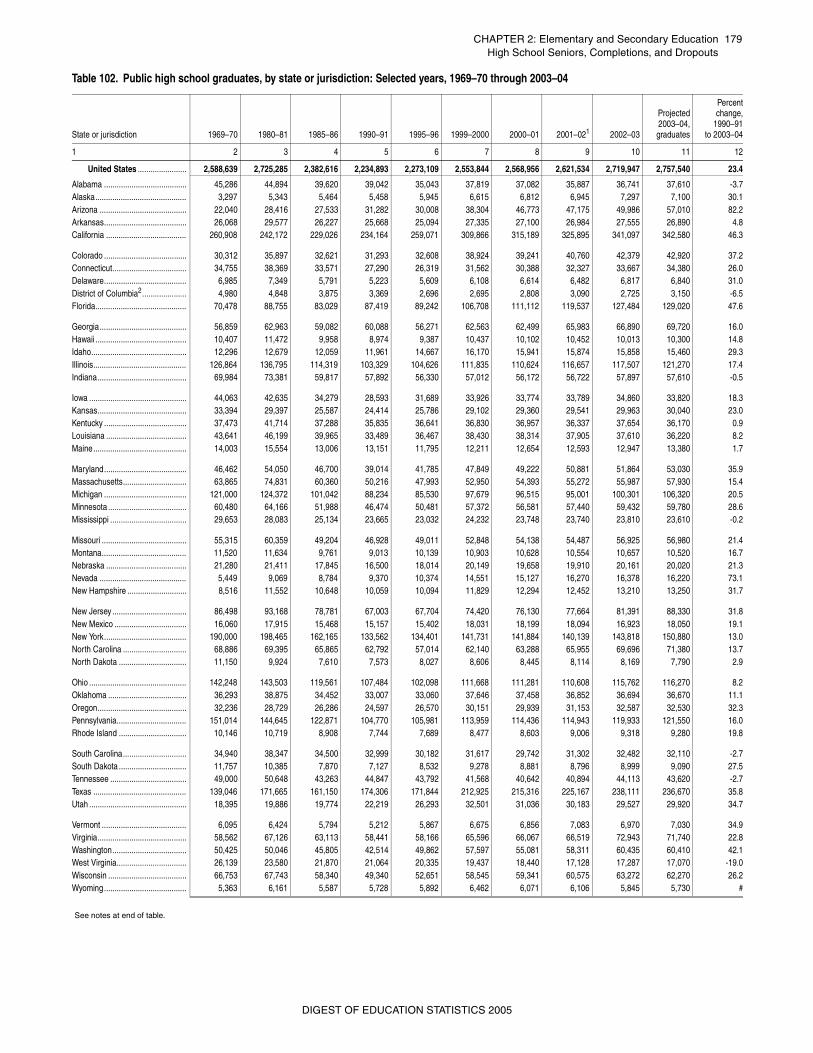
Table 102. Public high school graduates, by state or jurisdiction: Selected years, 1969–70 through 2003–04
State or jurisdiction 1969–70 1980–81 1985–86 1990–91 1995–96 1999–2000 2000–01 2001–021 2002–03
Projected2003–04,graduates
Percentchange,
1990–91to 2003–04
1 2 3 4 5 6 7 8 9 10 11 12
United States ....................... 2,588,639 2,725,285 2,382,616 2,234,893 2,273,109 2,553,844 2,568,956 2,621,534 2,719,947 2,757,540 23.4
Alabama ....................................... 45,286 44,894 39,620 39,042 35,043 37,819 37,082 35,887 36,741 37,610 -3.7Alaska........................................... 3,297 5,343 5,464 5,458 5,945 6,615 6,812 6,945 7,297 7,100 30.1Arizona ......................................... 22,040 28,416 27,533 31,282 30,008 38,304 46,773 47,175 49,986 57,010 82.2Arkansas....................................... 26,068 29,577 26,227 25,668 25,094 27,335 27,100 26,984 27,555 26,890 4.8California ...................................... 260,908 242,172 229,026 234,164 259,071 309,866 315,189 325,895 341,097 342,580 46.3
Colorado ....................................... 30,312 35,897 32,621 31,293 32,608 38,924 39,241 40,760 42,379 42,920 37.2Connecticut................................... 34,755 38,369 33,571 27,290 26,319 31,562 30,388 32,327 33,667 34,380 26.0Delaware....................................... 6,985 7,349 5,791 5,223 5,609 6,108 6,614 6,482 6,817 6,840 31.0District of Columbia2..................... 4,980 4,848 3,875 3,369 2,696 2,695 2,808 3,090 2,725 3,150 -6.5Florida........................................... 70,478 88,755 83,029 87,419 89,242 106,708 111,112 119,537 127,484 129,020 47.6
Georgia......................................... 56,859 62,963 59,082 60,088 56,271 62,563 62,499 65,983 66,890 69,720 16.0Hawaii ........................................... 10,407 11,472 9,958 8,974 9,387 10,437 10,102 10,452 10,013 10,300 14.8Idaho............................................. 12,296 12,679 12,059 11,961 14,667 16,170 15,941 15,874 15,858 15,460 29.3Illinois............................................ 126,864 136,795 114,319 103,329 104,626 111,835 110,624 116,657 117,507 121,270 17.4Indiana.......................................... 69,984 73,381 59,817 57,892 56,330 57,012 56,172 56,722 57,897 57,610 -0.5
Iowa .............................................. 44,063 42,635 34,279 28,593 31,689 33,926 33,774 33,789 34,860 33,820 18.3Kansas.......................................... 33,394 29,397 25,587 24,414 25,786 29,102 29,360 29,541 29,963 30,040 23.0Kentucky ....................................... 37,473 41,714 37,288 35,835 36,641 36,830 36,957 36,337 37,654 36,170 0.9Louisiana ...................................... 43,641 46,199 39,965 33,489 36,467 38,430 38,314 37,905 37,610 36,220 8.2Maine............................................ 14,003 15,554 13,006 13,151 11,795 12,211 12,654 12,593 12,947 13,380 1.7
Maryland....................................... 46,462 54,050 46,700 39,014 41,785 47,849 49,222 50,881 51,864 53,030 35.9Massachusetts.............................. 63,865 74,831 60,360 50,216 47,993 52,950 54,393 55,272 55,987 57,930 15.4Michigan ....................................... 121,000 124,372 101,042 88,234 85,530 97,679 96,515 95,001 100,301 106,320 20.5Minnesota ..................................... 60,480 64,166 51,988 46,474 50,481 57,372 56,581 57,440 59,432 59,780 28.6Mississippi .................................... 29,653 28,083 25,134 23,665 23,032 24,232 23,748 23,740 23,810 23,610 -0.2
Missouri ........................................ 55,315 60,359 49,204 46,928 49,011 52,848 54,138 54,487 56,925 56,980 21.4Montana........................................ 11,520 11,634 9,761 9,013 10,139 10,903 10,628 10,554 10,657 10,520 16.7Nebraska ...................................... 21,280 21,411 17,845 16,500 18,014 20,149 19,658 19,910 20,161 20,020 21.3Nevada ......................................... 5,449 9,069 8,784 9,370 10,374 14,551 15,127 16,270 16,378 16,220 73.1New Hampshire ............................ 8,516 11,552 10,648 10,059 10,094 11,829 12,294 12,452 13,210 13,250 31.7
New Jersey ................................... 86,498 93,168 78,781 67,003 67,704 74,420 76,130 77,664 81,391 88,330 31.8New Mexico .................................. 16,060 17,915 15,468 15,157 15,402 18,031 18,199 18,094 16,923 18,050 19.1New York....................................... 190,000 198,465 162,165 133,562 134,401 141,731 141,884 140,139 143,818 150,880 13.0North Carolina .............................. 68,886 69,395 65,865 62,792 57,014 62,140 63,288 65,955 69,696 71,380 13.7North Dakota ................................ 11,150 9,924 7,610 7,573 8,027 8,606 8,445 8,114 8,169 7,790 2.9
Ohio .............................................. 142,248 143,503 119,561 107,484 102,098 111,668 111,281 110,608 115,762 116,270 8.2Oklahoma ..................................... 36,293 38,875 34,452 33,007 33,060 37,646 37,458 36,852 36,694 36,670 11.1Oregon.......................................... 32,236 28,729 26,286 24,597 26,570 30,151 29,939 31,153 32,587 32,530 32.3Pennsylvania................................. 151,014 144,645 122,871 104,770 105,981 113,959 114,436 114,943 119,933 121,550 16.0Rhode Island ................................ 10,146 10,719 8,908 7,744 7,689 8,477 8,603 9,006 9,318 9,280 19.8
South Carolina.............................. 34,940 38,347 34,500 32,999 30,182 31,617 29,742 31,302 32,482 32,110 -2.7South Dakota ................................ 11,757 10,385 7,870 7,127 8,532 9,278 8,881 8,796 8,999 9,090 27.5Tennessee .................................... 49,000 50,648 43,263 44,847 43,792 41,568 40,642 40,894 44,113 43,620 -2.7Texas ............................................ 139,046 171,665 161,150 174,306 171,844 212,925 215,316 225,167 238,111 236,670 35.8Utah .............................................. 18,395 19,886 19,774 22,219 26,293 32,501 31,036 30,183 29,527 29,920 34.7
Vermont ........................................ 6,095 6,424 5,794 5,212 5,867 6,675 6,856 7,083 6,970 7,030 34.9Virginia.......................................... 58,562 67,126 63,113 58,441 58,166 65,596 66,067 66,519 72,943 71,740 22.8Washington................................... 50,425 50,046 45,805 42,514 49,862 57,597 55,081 58,311 60,435 60,410 42.1West Virginia................................. 26,139 23,580 21,870 21,064 20,335 19,437 18,440 17,128 17,287 17,070 -19.0Wisconsin ..................................... 66,753 67,743 58,340 49,340 52,651 58,545 59,341 60,575 63,272 62,270 26.2Wyoming....................................... 5,363 6,161 5,587 5,728 5,892 6,462 6,071 6,106 5,845 5,730 #
See notes at end of table.
DIGEST OF EDUCATION STATISTICS 2005
180 CHAPTER 2: Elementary and Secondary EducationHigh School Seniors, Completions, and Dropouts
—Not available. #Rounds to zero.1Revised from previously published figures. 2Beginning in 1985–86, graduates from adult programs are excluded.3Data are for 1970–71. NOTE: Data include graduates of regular day school programs, but exclude graduates ofother programs and persons receiving high school equivalency certificates. Detail may
not sum to totals because of rounding. Some data have been revised from previouslypublished figures. SOURCE: U.S. Department of Education, National Center for Education Statistics, Statis-tics of Public Elementary and Secondary Day Schools, 1969–70; Common Core of Data(CCD), “State Nonfiscal Survey of Public Elementary/Secondary Education,” 1981–82through 2003–04; and Projections of Education Statistics to 2014. (This table was preparedJanuary 2006.)
Bureau of Indian Affairs ................ — — — — — — — — — — —
Department of Defense dependents schools
Overseas schools ..................... — — — — 2,674 2,642 2,621 2,554 3,231 — —Domestic schools...................... — — — — — 560 568 565 — — —
Other jurisdictionsAmerican Samoa ...................... 3 367 — 608 597 719 698 722 823 832 — —Guam ........................................ 972 — 840 1,014 987 1,406 1,371 — 1,502 — —Northern Marianas.................... — — — 273 325 360 361 416 422 — —Puerto Rico ............................... 24,917 — 31,597 29,329 29,499 30,856 30,154 30,278 31,408 — —Virgin Islands ............................ 3 432 — 1,044 981 937 1,060 966 883 886 — —
Table 102. Public high school graduates, by state or jurisdiction: Selected years, 1969–70 through 2003–04—Continued
State or jurisdiction 1969–70 1980–81 1985–86 1990–91 1995–96 1999–2000 2000–01 2001–021 2002–03
Projected2003–04,graduates
Percentchange,
1990–91to 2003–04
1 2 3 4 5 6 7 8 9 10 11 12
DIGEST OF EDUCATION STATISTICS 2005
CHAPTER 2: Elementary and Secondary Education 181High School Seniors, Completions, and Dropouts
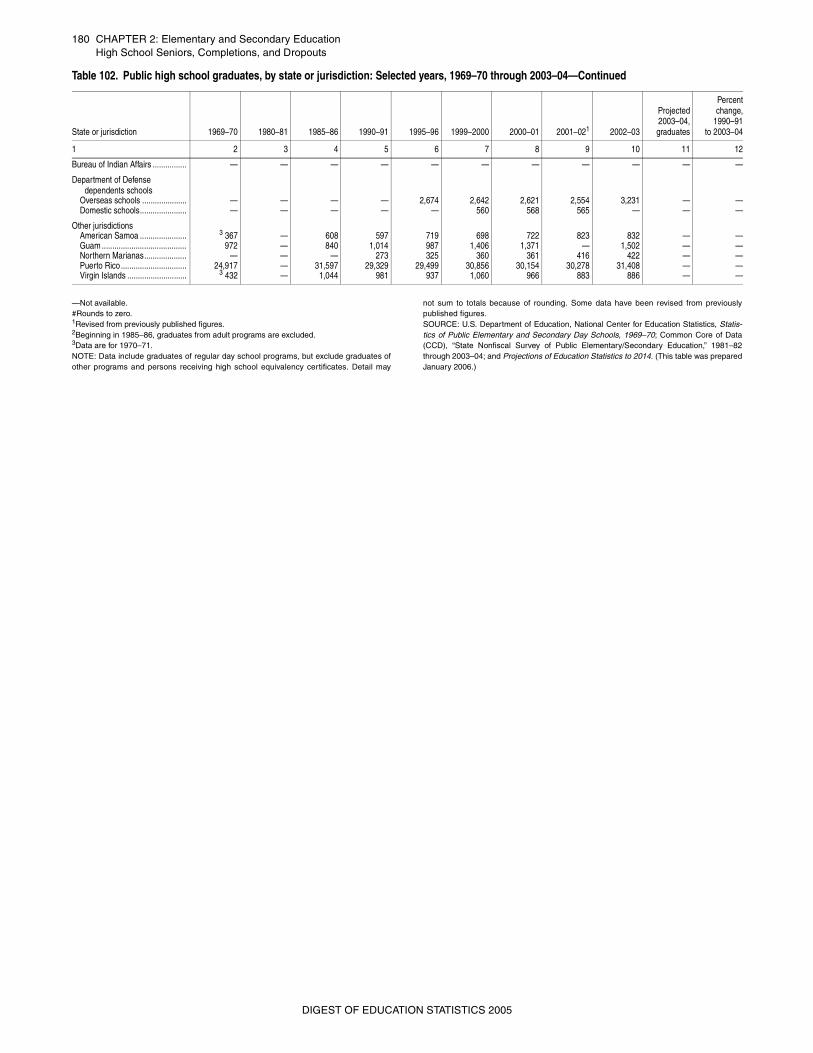
Table 103. Public high school graduates and dropouts, by race/ethnicity and state or jurisdiction: 2001–02
State or other jurisdiction
High school graduates, by race/ethnicity, 2001–02 Percent of 9th- to 12th-graders who dropped out during 2001–02, by race/ethnicity1
TotalWhite, non-
HispanicBlack, non-
Hispanic Hispanic
Asian/Pacific
Islander
AmericanIndian/AlaskaNative Total
White, non-Hispanic
Black, non-Hispanic Hispanic
Asian/Pacific
Islander
AmericanIndian/AlaskaNative
1 2 3 4 5 6 7 8 9 10 11 12 13
United States2,3 ......... 2,618,941 1,800,190 345,497 314,093 132,040 27,121 — — — — — —
Alabama ............................. 35,887 23,462 11,374 245 347 459 3.7 3.6 3.9 4.5 1.6 2.1Alaska................................. 6,945 4,734 252 197 422 1,340 8.1 6.2 11.4 8.9 6.7 13.4Arizona ............................... 47,175 28,640 2,008 12,479 1,286 2,762 10.5 6.8 13.4 15.2 3.9 19.0Arkansas............................. 26,984 20,138 5,779 626 323 118 5.3 4.6 7.0 7.7 4.3 6.9California ............................ 324,152 140,421 23,451 109,038 48,206 3,036 — — — — — —
Colorado ............................. 40,760 31,506 1,798 5,700 1,442 314 — — — — — —Connecticut......................... 32,327 24,721 3,617 2,886 1,029 74 2.6 1.9 4.0 5.3 2.4 4.9Delaware2 ........................... 6,482 4,358 1,683 241 185 15 6.2 4.6 9.0 11.6 3.5 5.1District of Columbia ............ 3,090 128 2,684 209 66 3 — — — — — —Florida................................. 119,537 70,862 24,960 20,067 3,345 303 3.7 3.0 4.9 4.5 1.9 3.6
Georgia............................... 65,983 40,801 21,357 1,593 2,151 81 6.5 5.8 7.6 9.8 3.6 7.5Hawaii ................................. 10,452 2,013 167 467 7,771 34 5.1 5.5 5.5 6.4 4.9 6.6Idaho................................... 15,874 14,296 76 1,063 248 191 3.9 — — — — —Illinois.................................. 116,657 82,454 16,294 12,242 5,234 433 6.4 3.7 13.6 10.4 2.6 5.7Indiana................................ 56,722 49,846 4,650 1,428 657 141 2.3 2.1 3.1 4.0 1.1 2.8
Iowa .................................... 33,789 31,608 756 660 657 108 2.4 2.1 6.8 7.1 2.7 6.6Kansas................................ 29,541 25,219 1,856 1,498 685 283 3.1 2.6 5.3 5.9 2.4 5.4Kentucky ............................. 36,337 32,556 3,151 249 350 31 3.9 3.8 5.3 4.0 1.7 0.0Louisiana ............................ 37,905 21,252 15,322 484 622 225 7.0 5.0 9.5 6.9 5.1 7.3Maine.................................. 12,593 12,201 110 61 144 77 2.8 2.8 4.4 3.7 2.7 5.0
Maryland............................. 50,881 29,363 16,745 1,890 2,725 158 3.9 3.0 5.5 3.7 1.4 4.1Massachusetts.................... 55,272 44,973 3,944 3,526 2,693 136 — — — — — —Michigan ............................. 95,001 77,947 11,619 2,284 2,250 901 — — — — — —Minnesota ........................... 57,440 51,052 2,122 1,032 2,573 661 3.8 2.7 9.9 14.5 4.4 14.2Mississippi .......................... 23,740 12,174 11,195 120 219 32 3.9 3.1 4.7 4.1 2.2 2.2
Missouri .............................. 54,487 45,627 7,195 696 821 148 3.6 3.2 5.8 5.8 1.6 4.8Montana.............................. 10,554 9,537 34 158 112 713 3.9 3.2 6.7 5.2 2.0 10.3Nebraska ............................ 19,910 17,851 796 756 357 150 4.2 3.1 11.3 11.7 3.3 11.9Nevada ............................... 16,270 10,879 1,285 2,728 1,123 255 6.4 5.0 8.9 9.3 5.2 5.6New Hampshire .................. 12,452 — — — — — 4.0 3.9 6.5 7.8 3.2 7.5
New Jersey ......................... 77,664 50,347 11,909 9,657 5,619 132 2.5 1.5 4.9 4.7 0.9 2.2New Mexico ........................ 18,094 — — — — — 5.2 3.5 2.6 6.4 3.4 5.8New York............................. 140,139 94,528 19,686 15,524 9,946 455 7.1 3.3 12.9 14.2 5.9 9.4North Carolina .................... 65,955 44,888 17,385 1,559 1,410 713 5.7 4.9 7.0 9.4 3.7 9.9North Dakota ...................... 8,114 7,564 58 68 62 362 2.0 1.5 2.7 3.4 1.9 8.0
Ohio2 .................................. 110,090 95,036 11,945 1,441 1,568 100 3.1 2.4 7.2 6.6 2.0 7.1Oklahoma ........................... 36,852 25,385 3,299 1,562 650 5,956 4.4 3.8 6.7 9.4 3.2 3.8Oregon2 .............................. 30,821 26,464 594 1,990 1,283 490 4.6 4.0 9.9 10.5 3.6 0.0Pennsylvania....................... 114,943 97,397 11,655 3,093 2,696 102 3.3 2.4 7.0 8.9 2.9 3.3Rhode Island ...................... 9,006 7,132 657 857 317 43 4.3 3.3 6.9 8.2 4.6 5.9
South Carolina.................... 31,302 — — — — — 3.3 3.1 3.7 3.9 1.7 3.1South Dakota ...................... 8,796 8,232 49 62 99 354 2.8 2.0 7.3 6.1 1.9 13.0Tennessee .......................... 40,894 — — — — — 3.8 — — — — —Texas .................................. 225,167 112,386 30,030 74,466 7,707 578 3.8 2.2 4.9 5.5 1.6 4.1Utah .................................... 30,183 27,307 172 1,574 817 313 3.7 3.1 8.8 8.2 5.2 8.1
Vermont .............................. 7,083 — — — — — 4.0 3.9 7.3 9.0 2.2 5.9Virginia................................ 66,519 45,485 15,084 2,454 3,353 143 2.9 2.3 4.0 5.8 2.0 4.1Washington......................... 58,311 45,918 2,306 3,937 5,030 1,120 7.1 5.6 16.8 12.3 6.6 15.2West Virginia....................... 17,128 16,281 600 70 148 29 3.7 3.7 3.9 1.8 1.8 8.9Wisconsin ........................... 60,575 53,255 3,148 1,792 1,757 623 1.9 1.2 8.3 5.6 1.8 4.1Wyoming............................. 6,106 5,569 60 324 51 102 5.8 5.2 9.9 12.3 2.7 13.0
See notes at end of table.
DIGEST OF EDUCATION STATISTICS 2005
182 CHAPTER 2: Elementary and Secondary EducationHigh School Seniors, Completions, and Dropouts
—Not available. 1Alabama, Alaska, Arizona, Florida, Illinois, Maryland, New Jersey, New York, Tennessee,Vermont, and Puerto Rico reported data on an alternative July through June cycle, ratherthan the specified October through September cycle for dropout data.2Includes estimates for nonreporting states, based on 2001 12th-grade enrollment racial/ethnicdistribution reported by state.
3Data differ slightly from figures reported in other tables due to varying reporting practicesfor racial/ethnic survey data.SOURCE: U.S. Department of Education, National Center for Education Statistics, CommonCore of Data (CCD), “State Nonfiscal Survey of Public Elementary/Secondary Education,”2002–03, and “Local Education Agency Universe Survey Dropout and Completion Data File,”2001–02; and unpublished tabulations. (This table was prepared January 2006.)
Bureau of Indian Affairs schools ......................... — — — — — — — — — — — —
Department of Defense dependents schools
Overseas schools .......... 2,052 1,130 417 163 342 0 — — — — — —Domestic schools........... 498 193 101 187 17 0 — — — — — —
Other jurisdictionsAmerican Samoa ........... 823 0 0 0 823 0 1.1 — — — 1.1 —Guam ............................. — — — — — — — — — — — —Northern Marianas......... 416 1 0 0 415 0 7.1 0.0 16.7 — 7.2 —Puerto Rico .................... 30,278 0 0 30,278 0 0 1.2 — — 1.2 — —Virgin Islands ................. 883 3 811 68 0 1 — — — — — —
Table 103. Public high school graduates and dropouts, by race/ethnicity and state or jurisdiction: 2001–02—Continued
State or other jurisdiction
High school graduates, by race/ethnicity, 2001–02 Percent of 9th- to 12th-graders who dropped out during 2001–02, by race/ethnicity1
TotalWhite, non-
HispanicBlack, non-
Hispanic Hispanic
Asian/Pacific
Islander
AmericanIndian/AlaskaNative Total
White, non-Hispanic
Black, non-Hispanic Hispanic
Asian/Pacific
Islander
AmericanIndian/AlaskaNative
1 2 3 4 5 6 7 8 9 10 11 12 13
DIGEST OF EDUCATION STATISTICS 2005
CHAPTER 2: Elementary and Secondary Education 183High School Seniors, Completions, and Dropouts
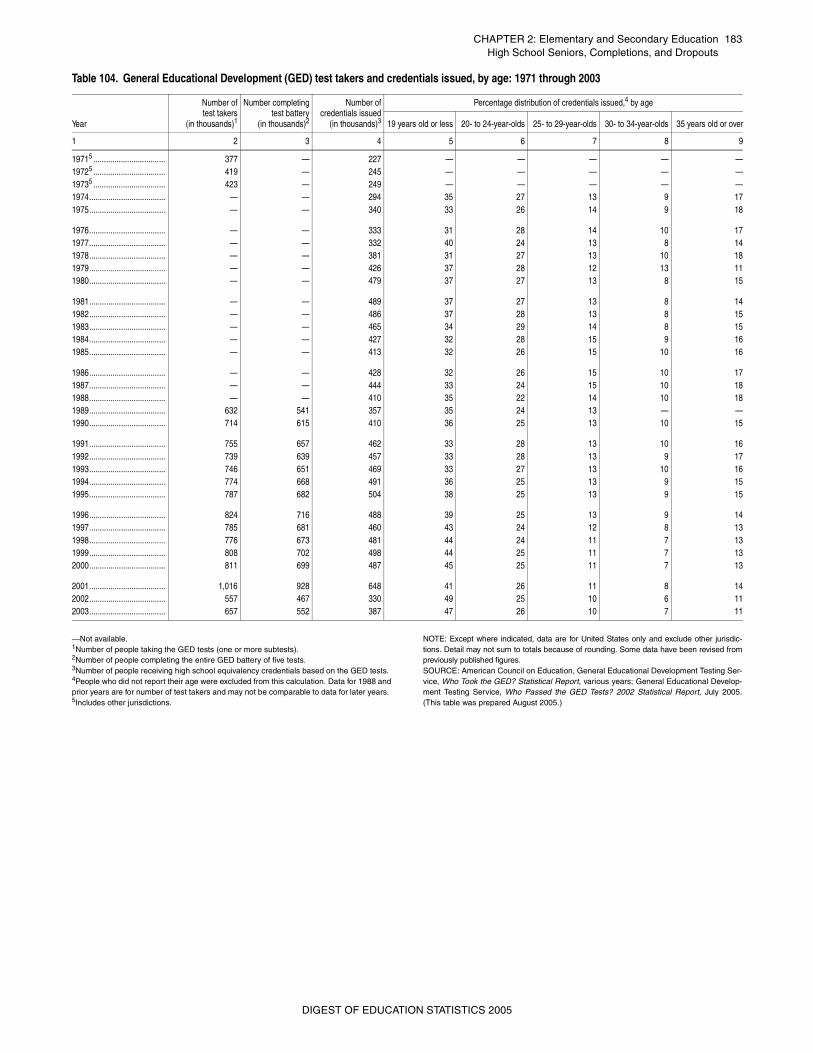
—Not available.1Number of people taking the GED tests (one or more subtests). 2Number of people completing the entire GED battery of five tests. 3Number of people receiving high school equivalency credentials based on the GED tests. 4People who did not report their age were excluded from this calculation. Data for 1988 andprior years are for number of test takers and may not be comparable to data for later years. 5Includes other jurisdictions.
NOTE: Except where indicated, data are for United States only and exclude other jurisdic-tions. Detail may not sum to totals because of rounding. Some data have been revised frompreviously published figures. SOURCE: American Council on Education, General Educational Development Testing Ser-vice, Who Took the GED? Statistical Report, various years; General Educational Develop-ment Testing Service, Who Passed the GED Tests? 2002 Statistical Report, July 2005.(This table was prepared August 2005.)
Table 104. General Educational Development (GED) test takers and credentials issued, by age: 1971 through 2003
Year
Number oftest takers
(in thousands)1
Number completingtest battery
(in thousands)2
Number ofcredentials issued
(in thousands)3
Percentage distribution of credentials issued,4 by age
19 years old or less 20- to 24-year-olds 25- to 29-year-olds 30- to 34-year-olds 35 years old or over
1 2 3 4 5 6 7 8 9
19715 .................................. 377 — 227 — — — — —19725 .................................. 419 — 245 — — — — —19735 .................................. 423 — 249 — — — — —1974.................................... — — 294 35 27 13 9 171975.................................... — — 340 33 26 14 9 18
1976.................................... — — 333 31 28 14 10 171977.................................... — — 332 40 24 13 8 141978.................................... — — 381 31 27 13 10 181979.................................... — — 426 37 28 12 13 111980.................................... — — 479 37 27 13 8 15
1981.................................... — — 489 37 27 13 8 141982.................................... — — 486 37 28 13 8 151983.................................... — — 465 34 29 14 8 151984.................................... — — 427 32 28 15 9 161985.................................... — — 413 32 26 15 10 16
1986.................................... — — 428 32 26 15 10 171987.................................... — — 444 33 24 15 10 181988.................................... — — 410 35 22 14 10 181989.................................... 632 541 357 35 24 13 — —1990.................................... 714 615 410 36 25 13 10 15
1991.................................... 755 657 462 33 28 13 10 161992.................................... 739 639 457 33 28 13 9 171993.................................... 746 651 469 33 27 13 10 161994.................................... 774 668 491 36 25 13 9 151995.................................... 787 682 504 38 25 13 9 15
1996.................................... 824 716 488 39 25 13 9 141997.................................... 785 681 460 43 24 12 8 131998.................................... 776 673 481 44 24 11 7 131999.................................... 808 702 498 44 25 11 7 132000.................................... 811 699 487 45 25 11 7 13
2001.................................... 1,016 928 648 41 26 11 8 142002.................................... 557 467 330 49 25 10 6 112003.................................... 657 552 387 47 26 10 7 11
DIGEST OF EDUCATION STATISTICS 2005
184C
HA
PT
ER
2: Elem
entary and Secondary E
ducationH
igh School S
eniors, Com
pletions, and Dropouts
DIG
ES
T O
F E
DU
CAT
ION
STAT
IST
ICS
2005
Female
aces1White,
non-HispanicBlack,
non-Hispanic Hispanic origin
10 11 12 13
(—) — (†) — (†) — (†)
(—) 16.1 (—) 26.9 (—) — (†)
(—) 15.0 (—) 27.6 (—) — (†)
(—) 14.6 (—) 26.7 (—) — (†)
0.41) 14.1 (0.42) 26.6 (1.65) — (†)
0.40) 14.2 (0.42) 22.6 (1.54) — (†)
0.39) 12.8 (0.41) 20.5 (1.44) 34.8 (3.05)
0.38) 11.8 (0.39) 22.8 (1.47) 36.4 (3.16)
0.38) 11.8 (0.39) 22.1 (1.45) 32.2 (2.90)
0.38) 11.8 (0.39) 22.9 (1.44) 31.6 (2.86)
0.37) 11.8 (0.39) 19.9 (1.35) 32.3 (2.76)
0.37) 11.2 (0.38) 20.0 (1.36) 34.3 (2.83)
0.37) 11.6 (0.39) 18.3 (1.31) 33.1 (2.78)
0.37) 11.5 (0.38) 20.0 (1.35) 34.5 (2.77)
0.36) 10.5 (0.37) 17.7 (1.28) 33.2 (2.61)
0.35) 10.2 (0.36) 17.1 (1.24) 30.4 (2.48)
0.38) 10.8 (0.40) 15.9 (1.26) 32.8 (2.71)
0.37) 10.1 (0.39) 16.2 (1.28) 29.1 (2.61)
0.37) 10.1 (0.39) 14.3 (1.22) 29.0 (2.63)
0.37) 9.8 (0.39) 14.3 (1.23) 25.2 (2.68)
0.37) 9.1 (0.39) 13.5 (1.21) 27.2 (2.63)
0.38) 10.0 (0.41) 13.3 (1.21) 28.1 (2.64)
0.42) 8.9 (0.43) 14.0 (1.36) 35.4 (3.31)
0.42) 8.5 (0.43) 13.0 (1.32) 31.6 (3.11)
0.41) 8.7 (0.42) 14.4 (1.34) 30.3 (2.70)
0.41) 8.9 (0.43) 13.7 (1.31) 31.1 (2.70)
0.39) 7.4 (0.40) 14.8 (1.36) 26.6 (2.56)
0.40) 7.6 (0.41) 14.4 (1.34) 26.9 (2.52)
0.36) 7.5 (0.37) 11.3 (0.99) 28.1 (1.66)
0.37) 8.2 (0.39) 12.9 (1.05) 30.0 (1.66)
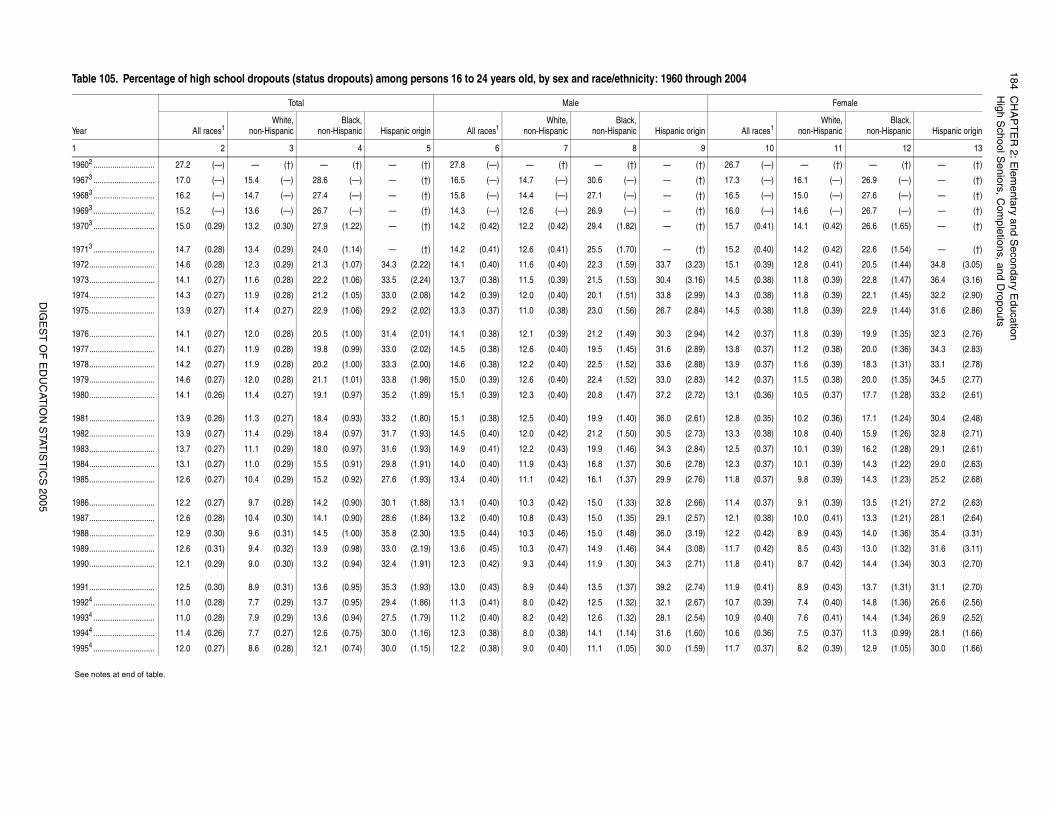
Table 105. Percentage of high school dropouts (status dropouts) among persons 16 to 24 years old, by sex and race/ethnicity: 1960 through 2004
Year
Total Male
All races1White,
non-HispanicBlack,
non-Hispanic Hispanic origin All races1White,
non-HispanicBlack,
non-Hispanic Hispanic origin All r
1 2 3 4 5 6 7 8 9
19602 ............................. 27.2 (—) — (†) — (†) — (†) 27.8 (—) — (†) — (†) — (†) 26.7
19673 ............................. 17.0 (—) 15.4 (—) 28.6 (—) — (†) 16.5 (—) 14.7 (—) 30.6 (—) — (†) 17.3
19683 ............................. 16.2 (—) 14.7 (—) 27.4 (—) — (†) 15.8 (—) 14.4 (—) 27.1 (—) — (†) 16.5
19693 ............................. 15.2 (—) 13.6 (—) 26.7 (—) — (†) 14.3 (—) 12.6 (—) 26.9 (—) — (†) 16.0
19703 ............................. 15.0 (0.29) 13.2 (0.30) 27.9 (1.22) — (†) 14.2 (0.42) 12.2 (0.42) 29.4 (1.82) — (†) 15.7 (
19713 ............................. 14.7 (0.28) 13.4 (0.29) 24.0 (1.14) — (†) 14.2 (0.41) 12.6 (0.41) 25.5 (1.70) — (†) 15.2 (
1972............................... 14.6 (0.28) 12.3 (0.29) 21.3 (1.07) 34.3 (2.22) 14.1 (0.40) 11.6 (0.40) 22.3 (1.59) 33.7 (3.23) 15.1 (
1973............................... 14.1 (0.27) 11.6 (0.28) 22.2 (1.06) 33.5 (2.24) 13.7 (0.38) 11.5 (0.39) 21.5 (1.53) 30.4 (3.16) 14.5 (
1974............................... 14.3 (0.27) 11.9 (0.28) 21.2 (1.05) 33.0 (2.08) 14.2 (0.39) 12.0 (0.40) 20.1 (1.51) 33.8 (2.99) 14.3 (
1975............................... 13.9 (0.27) 11.4 (0.27) 22.9 (1.06) 29.2 (2.02) 13.3 (0.37) 11.0 (0.38) 23.0 (1.56) 26.7 (2.84) 14.5 (
1976............................... 14.1 (0.27) 12.0 (0.28) 20.5 (1.00) 31.4 (2.01) 14.1 (0.38) 12.1 (0.39) 21.2 (1.49) 30.3 (2.94) 14.2 (
1977............................... 14.1 (0.27) 11.9 (0.28) 19.8 (0.99) 33.0 (2.02) 14.5 (0.38) 12.6 (0.40) 19.5 (1.45) 31.6 (2.89) 13.8 (
1978............................... 14.2 (0.27) 11.9 (0.28) 20.2 (1.00) 33.3 (2.00) 14.6 (0.38) 12.2 (0.40) 22.5 (1.52) 33.6 (2.88) 13.9 (
1979............................... 14.6 (0.27) 12.0 (0.28) 21.1 (1.01) 33.8 (1.98) 15.0 (0.39) 12.6 (0.40) 22.4 (1.52) 33.0 (2.83) 14.2 (
1980............................... 14.1 (0.26) 11.4 (0.27) 19.1 (0.97) 35.2 (1.89) 15.1 (0.39) 12.3 (0.40) 20.8 (1.47) 37.2 (2.72) 13.1 (
1981............................... 13.9 (0.26) 11.3 (0.27) 18.4 (0.93) 33.2 (1.80) 15.1 (0.38) 12.5 (0.40) 19.9 (1.40) 36.0 (2.61) 12.8 (
1982............................... 13.9 (0.27) 11.4 (0.29) 18.4 (0.97) 31.7 (1.93) 14.5 (0.40) 12.0 (0.42) 21.2 (1.50) 30.5 (2.73) 13.3 (
1983............................... 13.7 (0.27) 11.1 (0.29) 18.0 (0.97) 31.6 (1.93) 14.9 (0.41) 12.2 (0.43) 19.9 (1.46) 34.3 (2.84) 12.5 (
1984............................... 13.1 (0.27) 11.0 (0.29) 15.5 (0.91) 29.8 (1.91) 14.0 (0.40) 11.9 (0.43) 16.8 (1.37) 30.6 (2.78) 12.3 (
1985............................... 12.6 (0.27) 10.4 (0.29) 15.2 (0.92) 27.6 (1.93) 13.4 (0.40) 11.1 (0.42) 16.1 (1.37) 29.9 (2.76) 11.8 (
1986............................... 12.2 (0.27) 9.7 (0.28) 14.2 (0.90) 30.1 (1.88) 13.1 (0.40) 10.3 (0.42) 15.0 (1.33) 32.8 (2.66) 11.4 (
1987............................... 12.6 (0.28) 10.4 (0.30) 14.1 (0.90) 28.6 (1.84) 13.2 (0.40) 10.8 (0.43) 15.0 (1.35) 29.1 (2.57) 12.1 (
1988............................... 12.9 (0.30) 9.6 (0.31) 14.5 (1.00) 35.8 (2.30) 13.5 (0.44) 10.3 (0.46) 15.0 (1.48) 36.0 (3.19) 12.2 (
1989............................... 12.6 (0.31) 9.4 (0.32) 13.9 (0.98) 33.0 (2.19) 13.6 (0.45) 10.3 (0.47) 14.9 (1.46) 34.4 (3.08) 11.7 (
1990............................... 12.1 (0.29) 9.0 (0.30) 13.2 (0.94) 32.4 (1.91) 12.3 (0.42) 9.3 (0.44) 11.9 (1.30) 34.3 (2.71) 11.8 (
1991............................... 12.5 (0.30) 8.9 (0.31) 13.6 (0.95) 35.3 (1.93) 13.0 (0.43) 8.9 (0.44) 13.5 (1.37) 39.2 (2.74) 11.9 (
19924 ............................. 11.0 (0.28) 7.7 (0.29) 13.7 (0.95) 29.4 (1.86) 11.3 (0.41) 8.0 (0.42) 12.5 (1.32) 32.1 (2.67) 10.7 (
19934 ............................. 11.0 (0.28) 7.9 (0.29) 13.6 (0.94) 27.5 (1.79) 11.2 (0.40) 8.2 (0.42) 12.6 (1.32) 28.1 (2.54) 10.9 (
19944 ............................. 11.4 (0.26) 7.7 (0.27) 12.6 (0.75) 30.0 (1.16) 12.3 (0.38) 8.0 (0.38) 14.1 (1.14) 31.6 (1.60) 10.6 (
19954 ............................. 12.0 (0.27) 8.6 (0.28) 12.1 (0.74) 30.0 (1.15) 12.2 (0.38) 9.0 (0.40) 11.1 (1.05) 30.0 (1.59) 11.7 (
See notes at end of table.
CH
AP
TE
R 2: E
lementary and S
econdary Education
185H
igh School S
eniors, Com
pletions, and Dropouts
DIG
ES
T O
F E
DU
CAT
ION
STAT
IST
ICS
2005
t enrolled in school and who have not completed a high schoolve received GED credentials are counted as high school compl- Data are based on sample surveys of the civilian noninstitution-
urrent Population Survey (CPS), October 1967 through Octobertember 2005.)
0.38) 7.3 (0.39) 12.5 (1.08) 28.3 (1.69)
0.36) 6.7 (0.37) 13.5 (1.11) 23.4 (1.59)
0.36) 6.9 (0.37) 12.2 (1.05) 25.0 (1.56)
0.36) 6.9 (0.37) 13.0 (1.08) 26.0 (1.54)
0.35) 6.9 (0.37) 11.1 (1.00) 23.5 (1.48)
0.34) 6.7 (0.36) 9.0 (0.90) 22.1 (1.42)
0.32) 6.3 (0.34) 9.9 (0.91) 21.2 (1.27)
0.30) 5.6 (0.32) 9.5 (0.89) 20.1 (1.23)
0.31) 6.4 (0.34) 10.2 (0.92) 18.5 (1.18)
Continued
Female
aces1White,
non-HispanicBlack,
non-Hispanic Hispanic origin
10 11 12 13
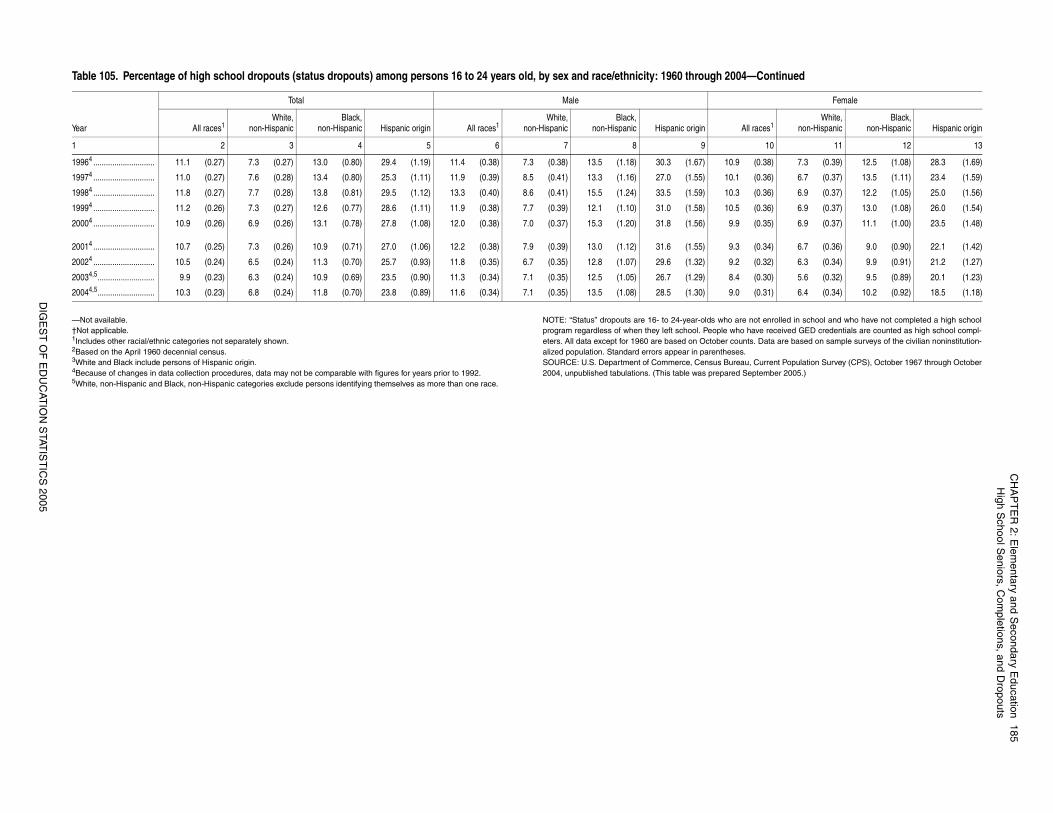
—Not available.†Not applicable. 1Includes other racial/ethnic categories not separately shown.2Based on the April 1960 decennial census.3White and Black include persons of Hispanic origin.4Because of changes in data collection procedures, data may not be comparable with figures for years prior to 1992.5White, non-Hispanic and Black, non-Hispanic categories exclude persons identifying themselves as more than one race.
NOTE: “Status” dropouts are 16- to 24-year-olds who are noprogram regardless of when they left school. People who haeters. All data except for 1960 are based on October counts.alized population. Standard errors appear in parentheses.SOURCE: U.S. Department of Commerce, Census Bureau, C2004, unpublished tabulations. (This table was prepared Sep
19964 ............................. 11.1 (0.27) 7.3 (0.27) 13.0 (0.80) 29.4 (1.19) 11.4 (0.38) 7.3 (0.38) 13.5 (1.18) 30.3 (1.67) 10.9 (
19974 ............................. 11.0 (0.27) 7.6 (0.28) 13.4 (0.80) 25.3 (1.11) 11.9 (0.39) 8.5 (0.41) 13.3 (1.16) 27.0 (1.55) 10.1 (
19984 ............................. 11.8 (0.27) 7.7 (0.28) 13.8 (0.81) 29.5 (1.12) 13.3 (0.40) 8.6 (0.41) 15.5 (1.24) 33.5 (1.59) 10.3 (
19994 ............................. 11.2 (0.26) 7.3 (0.27) 12.6 (0.77) 28.6 (1.11) 11.9 (0.38) 7.7 (0.39) 12.1 (1.10) 31.0 (1.58) 10.5 (
20004 ............................. 10.9 (0.26) 6.9 (0.26) 13.1 (0.78) 27.8 (1.08) 12.0 (0.38) 7.0 (0.37) 15.3 (1.20) 31.8 (1.56) 9.9 (
20014 ............................. 10.7 (0.25) 7.3 (0.26) 10.9 (0.71) 27.0 (1.06) 12.2 (0.38) 7.9 (0.39) 13.0 (1.12) 31.6 (1.55) 9.3 (
20024 ............................. 10.5 (0.24) 6.5 (0.24) 11.3 (0.70) 25.7 (0.93) 11.8 (0.35) 6.7 (0.35) 12.8 (1.07) 29.6 (1.32) 9.2 (
20034,5........................... 9.9 (0.23) 6.3 (0.24) 10.9 (0.69) 23.5 (0.90) 11.3 (0.34) 7.1 (0.35) 12.5 (1.05) 26.7 (1.29) 8.4 (
20044,5........................... 10.3 (0.23) 6.8 (0.24) 11.8 (0.70) 23.8 (0.89) 11.6 (0.34) 7.1 (0.35) 13.5 (1.08) 28.5 (1.30) 9.0 (
Table 105. Percentage of high school dropouts (status dropouts) among persons 16 to 24 years old, by sex and race/ethnicity: 1960 through 2004—
Year
Total Male
All races1White,
non-HispanicBlack,
non-Hispanic Hispanic origin All races1White,
non-HispanicBlack,
non-Hispanic Hispanic origin All r
1 2 3 4 5 6 7 8 9
186C
HA
PT
ER
2: Elem
entary and Secondary E
ducationH
igh School S
eniors, Com
pletions, and Dropouts
DIG
ES
T O
F E
DU
CAT
ION
STAT
IST
ICS
2005
enrolled in school and who have not completed a high school pro-eceived GED credentials are counted as high school completers.alized population. Detail may not sum to totals because of round-
urrent Population Survey (CPS), October 1970 through Octobertember 2005.)
dropouts, by labor force status and educational
age distribution of dropouts, by years of school completed
ss than 9 9 10 11 or 12
12 13 14 15
(0.88) 20.6 (0.79) 26.8 (0.87) 24.0 (0.84)(0.87) 21.7 (0.80) 27.8 (0.86) 22.7 (0.81)(0.85) 20.8 (0.77) 29.0 (0.86) 22.7 (0.80)(0.84) 20.9 (0.78) 27.4 (0.85) 25.3 (0.83)(0.82) 20.1 (0.76) 28.7 (0.85) 25.8 (0.83)
(0.80) 21.1 (0.77) 27.5 (0.85) 27.9 (0.85)(0.80) 20.1 (0.75) 27.8 (0.83) 27.8 (0.83)(0.81) 21.7 (0.78) 27.3 (0.84) 26.6 (0.83)(0.78) 20.2 (0.75) 28.2 (0.84) 28.8 (0.84)(0.77) 21.0 (0.75) 28.6 (0.83) 27.8 (0.82)
(0.79) 19.7 (0.74) 29.8 (0.85) 27.0 (0.83)(0.80) 18.6 (0.72) 30.2 (0.85) 26.9 (0.82)(0.83) 20.8 (0.80) 28.8 (0.89) 27.6 (0.88)(0.84) 19.3 (0.79) 28.8 (0.91) 28.8 (0.91)(0.88) 21.4 (0.85) 27.5 (0.92) 27.5 (0.92)
(0.91) 21.0 (0.87) 27.9 (0.96) 27.2 (0.95)(0.95) 21.5 (0.90) 25.7 (0.95) 27.4 (0.97)(0.94) 20.7 (0.87) 26.0 (0.95) 27.5 (0.96)(1.08) 19.3 (0.94) 25.1 (1.04) 26.8 (1.06)(1.11) 20.8 (0.99) 24.9 (1.06) 25.0 (1.06)
(1.08) 20.9 (0.97) 24.4 (1.03) 26.1 (1.05)(1.07) 20.5 (0.96) 26.1 (1.04) 24.9 (1.02)(1.04) 17.5 (0.96) 24.4 (1.09) 36.5 (1.22)(1.02) 16.6 (0.94) 24.1 (1.08) 38.8 (1.23)(1.04) 16.2 (0.90) 20.3 (0.98) 39.6 (1.19)
(0.99) 17.0 (0.90) 22.5 (1.00) 38.3 (1.16)(1.03) 17.7 (0.98) 22.6 (1.07) 39.4 (1.25)(1.02) 15.7 (0.93) 22.3 (1.06) 42.1 (1.26)(1.00) 14.9 (0.87) 21.4 (1.01) 42.6 (1.21)(1.03) 16.3 (0.92) 22.5 (1.04) 39.0 (1.21)
(1.03) 15.3 (0.90) 23.1 (1.06) 40.0 (1.23)(0.97) 16.8 (0.94) 23.8 (1.07) 40.9 (1.23)(1.00) 17.1 (0.90) 21.3 (0.98) 38.9 (1.17)(1.00) 18.2 (0.94) 20.7 (0.99) 40.0 (1.20)(0.97) 15.9 (0.87) 22.5 (0.99) 40.3 (1.17)
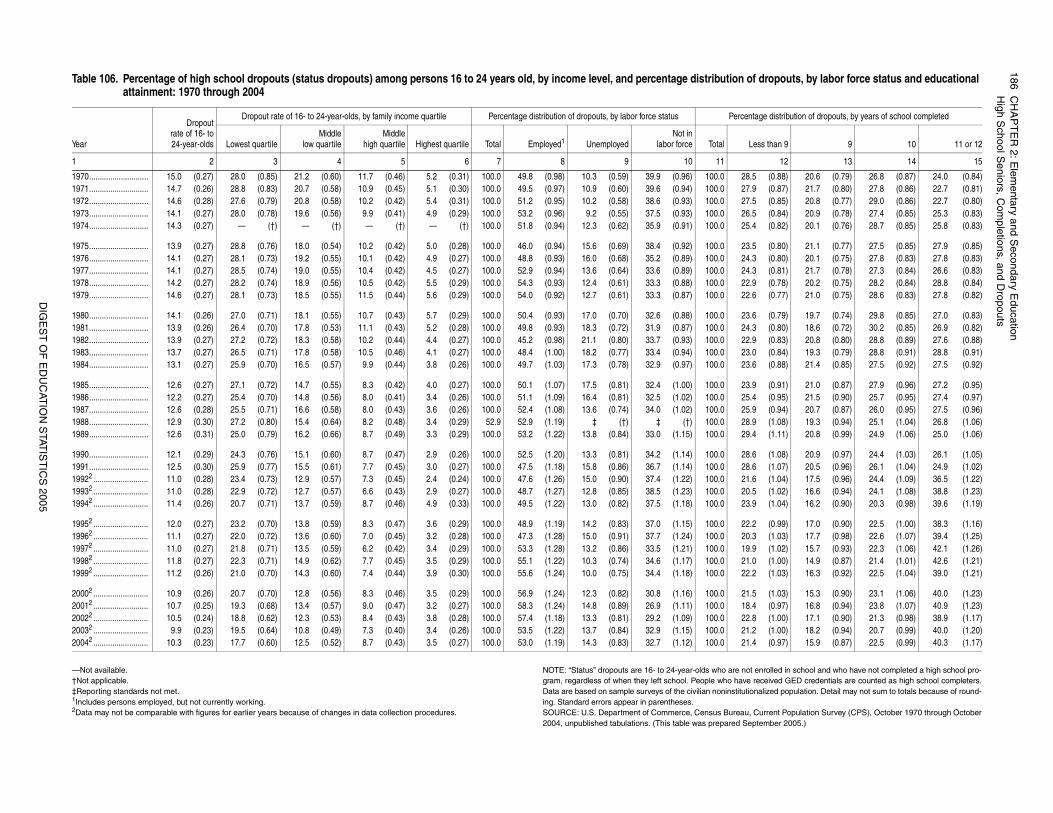
—Not available. †Not applicable. ‡Reporting standards not met. 1Includes persons employed, but not currently working.2Data may not be comparable with figures for earlier years because of changes in data collection procedures.
NOTE: “Status” dropouts are 16- to 24-year-olds who are not gram, regardless of when they left school. People who have rData are based on sample surveys of the civilian noninstitutioning. Standard errors appear in parentheses. SOURCE: U.S. Department of Commerce, Census Bureau, C2004, unpublished tabulations. (This table was prepared Sep
Table 106. Percentage of high school dropouts (status dropouts) among persons 16 to 24 years old, by income level, and percentage distribution ofattainment: 1970 through 2004
Year
Dropoutrate of 16- to24-year-olds
Dropout rate of 16- to 24-year-olds, by family income quartile Percentage distribution of dropouts, by labor force status Percent
Lowest quartileMiddle
low quartileMiddle
high quartile Highest quartile Total Employed1 UnemployedNot in
labor force Total Le
1 2 3 4 5 6 7 8 9 10 11
1970............................ 15.0 (0.27) 28.0 (0.85) 21.2 (0.60) 11.7 (0.46) 5.2 (0.31) 100.0 49.8 (0.98) 10.3 (0.59) 39.9 (0.96) 100.0 28.51971............................ 14.7 (0.26) 28.8 (0.83) 20.7 (0.58) 10.9 (0.45) 5.1 (0.30) 100.0 49.5 (0.97) 10.9 (0.60) 39.6 (0.94) 100.0 27.91972............................ 14.6 (0.28) 27.6 (0.79) 20.8 (0.58) 10.2 (0.42) 5.4 (0.31) 100.0 51.2 (0.95) 10.2 (0.58) 38.6 (0.93) 100.0 27.51973............................ 14.1 (0.27) 28.0 (0.78) 19.6 (0.56) 9.9 (0.41) 4.9 (0.29) 100.0 53.2 (0.96) 9.2 (0.55) 37.5 (0.93) 100.0 26.51974............................ 14.3 (0.27) — (†) — (†) — (†) — (†) 100.0 51.8 (0.94) 12.3 (0.62) 35.9 (0.91) 100.0 25.4
1975............................ 13.9 (0.27) 28.8 (0.76) 18.0 (0.54) 10.2 (0.42) 5.0 (0.28) 100.0 46.0 (0.94) 15.6 (0.69) 38.4 (0.92) 100.0 23.51976............................ 14.1 (0.27) 28.1 (0.73) 19.2 (0.55) 10.1 (0.42) 4.9 (0.27) 100.0 48.8 (0.93) 16.0 (0.68) 35.2 (0.89) 100.0 24.31977............................ 14.1 (0.27) 28.5 (0.74) 19.0 (0.55) 10.4 (0.42) 4.5 (0.27) 100.0 52.9 (0.94) 13.6 (0.64) 33.6 (0.89) 100.0 24.31978............................ 14.2 (0.27) 28.2 (0.74) 18.9 (0.56) 10.5 (0.42) 5.5 (0.29) 100.0 54.3 (0.93) 12.4 (0.61) 33.3 (0.88) 100.0 22.91979............................ 14.6 (0.27) 28.1 (0.73) 18.5 (0.55) 11.5 (0.44) 5.6 (0.29) 100.0 54.0 (0.92) 12.7 (0.61) 33.3 (0.87) 100.0 22.6
1980............................ 14.1 (0.26) 27.0 (0.71) 18.1 (0.55) 10.7 (0.43) 5.7 (0.29) 100.0 50.4 (0.93) 17.0 (0.70) 32.6 (0.88) 100.0 23.61981............................ 13.9 (0.26) 26.4 (0.70) 17.8 (0.53) 11.1 (0.43) 5.2 (0.28) 100.0 49.8 (0.93) 18.3 (0.72) 31.9 (0.87) 100.0 24.31982............................ 13.9 (0.27) 27.2 (0.72) 18.3 (0.58) 10.2 (0.44) 4.4 (0.27) 100.0 45.2 (0.98) 21.1 (0.80) 33.7 (0.93) 100.0 22.91983............................ 13.7 (0.27) 26.5 (0.71) 17.8 (0.58) 10.5 (0.46) 4.1 (0.27) 100.0 48.4 (1.00) 18.2 (0.77) 33.4 (0.94) 100.0 23.01984............................ 13.1 (0.27) 25.9 (0.70) 16.5 (0.57) 9.9 (0.44) 3.8 (0.26) 100.0 49.7 (1.03) 17.3 (0.78) 32.9 (0.97) 100.0 23.6
1985............................ 12.6 (0.27) 27.1 (0.72) 14.7 (0.55) 8.3 (0.42) 4.0 (0.27) 100.0 50.1 (1.07) 17.5 (0.81) 32.4 (1.00) 100.0 23.91986............................ 12.2 (0.27) 25.4 (0.70) 14.8 (0.56) 8.0 (0.41) 3.4 (0.26) 100.0 51.1 (1.09) 16.4 (0.81) 32.5 (1.02) 100.0 25.41987............................ 12.6 (0.28) 25.5 (0.71) 16.6 (0.58) 8.0 (0.43) 3.6 (0.26) 100.0 52.4 (1.08) 13.6 (0.74) 34.0 (1.02) 100.0 25.91988............................ 12.9 (0.30) 27.2 (0.80) 15.4 (0.64) 8.2 (0.48) 3.4 (0.29) 52.9 52.9 (1.19) ‡ (†) ‡ (†) 100.0 28.91989............................ 12.6 (0.31) 25.0 (0.79) 16.2 (0.66) 8.7 (0.49) 3.3 (0.29) 100.0 53.2 (1.22) 13.8 (0.84) 33.0 (1.15) 100.0 29.4
1990............................ 12.1 (0.29) 24.3 (0.76) 15.1 (0.60) 8.7 (0.47) 2.9 (0.26) 100.0 52.5 (1.20) 13.3 (0.81) 34.2 (1.14) 100.0 28.61991............................ 12.5 (0.30) 25.9 (0.77) 15.5 (0.61) 7.7 (0.45) 3.0 (0.27) 100.0 47.5 (1.18) 15.8 (0.86) 36.7 (1.14) 100.0 28.619922 .......................... 11.0 (0.28) 23.4 (0.73) 12.9 (0.57) 7.3 (0.45) 2.4 (0.24) 100.0 47.6 (1.26) 15.0 (0.90) 37.4 (1.22) 100.0 21.619932 .......................... 11.0 (0.28) 22.9 (0.72) 12.7 (0.57) 6.6 (0.43) 2.9 (0.27) 100.0 48.7 (1.27) 12.8 (0.85) 38.5 (1.23) 100.0 20.519942 .......................... 11.4 (0.26) 20.7 (0.71) 13.7 (0.59) 8.7 (0.46) 4.9 (0.33) 100.0 49.5 (1.22) 13.0 (0.82) 37.5 (1.18) 100.0 23.9
19952 .......................... 12.0 (0.27) 23.2 (0.70) 13.8 (0.59) 8.3 (0.47) 3.6 (0.29) 100.0 48.9 (1.19) 14.2 (0.83) 37.0 (1.15) 100.0 22.219962 .......................... 11.1 (0.27) 22.0 (0.72) 13.6 (0.60) 7.0 (0.45) 3.2 (0.28) 100.0 47.3 (1.28) 15.0 (0.91) 37.7 (1.24) 100.0 20.319972 .......................... 11.0 (0.27) 21.8 (0.71) 13.5 (0.59) 6.2 (0.42) 3.4 (0.29) 100.0 53.3 (1.28) 13.2 (0.86) 33.5 (1.21) 100.0 19.919982 .......................... 11.8 (0.27) 22.3 (0.71) 14.9 (0.62) 7.7 (0.45) 3.5 (0.29) 100.0 55.1 (1.22) 10.3 (0.74) 34.6 (1.17) 100.0 21.019992 .......................... 11.2 (0.26) 21.0 (0.70) 14.3 (0.60) 7.4 (0.44) 3.9 (0.30) 100.0 55.6 (1.24) 10.0 (0.75) 34.4 (1.18) 100.0 22.2
20002 .......................... 10.9 (0.26) 20.7 (0.70) 12.8 (0.56) 8.3 (0.46) 3.5 (0.29) 100.0 56.9 (1.24) 12.3 (0.82) 30.8 (1.16) 100.0 21.520012 .......................... 10.7 (0.25) 19.3 (0.68) 13.4 (0.57) 9.0 (0.47) 3.2 (0.27) 100.0 58.3 (1.24) 14.8 (0.89) 26.9 (1.11) 100.0 18.420022 .......................... 10.5 (0.24) 18.8 (0.62) 12.3 (0.53) 8.4 (0.43) 3.8 (0.28) 100.0 57.4 (1.18) 13.3 (0.81) 29.2 (1.09) 100.0 22.820032 .......................... 9.9 (0.23) 19.5 (0.64) 10.8 (0.49) 7.3 (0.40) 3.4 (0.26) 100.0 53.5 (1.22) 13.7 (0.84) 32.9 (1.15) 100.0 21.220042 .......................... 10.3 (0.23) 17.7 (0.60) 12.5 (0.52) 8.7 (0.43) 3.5 (0.27) 100.0 53.0 (1.19) 14.3 (0.83) 32.7 (1.12) 100.0 21.4
CHAPTER 2: Elementary and Secondary Education 187High School Seniors, Completions, and Dropouts
_
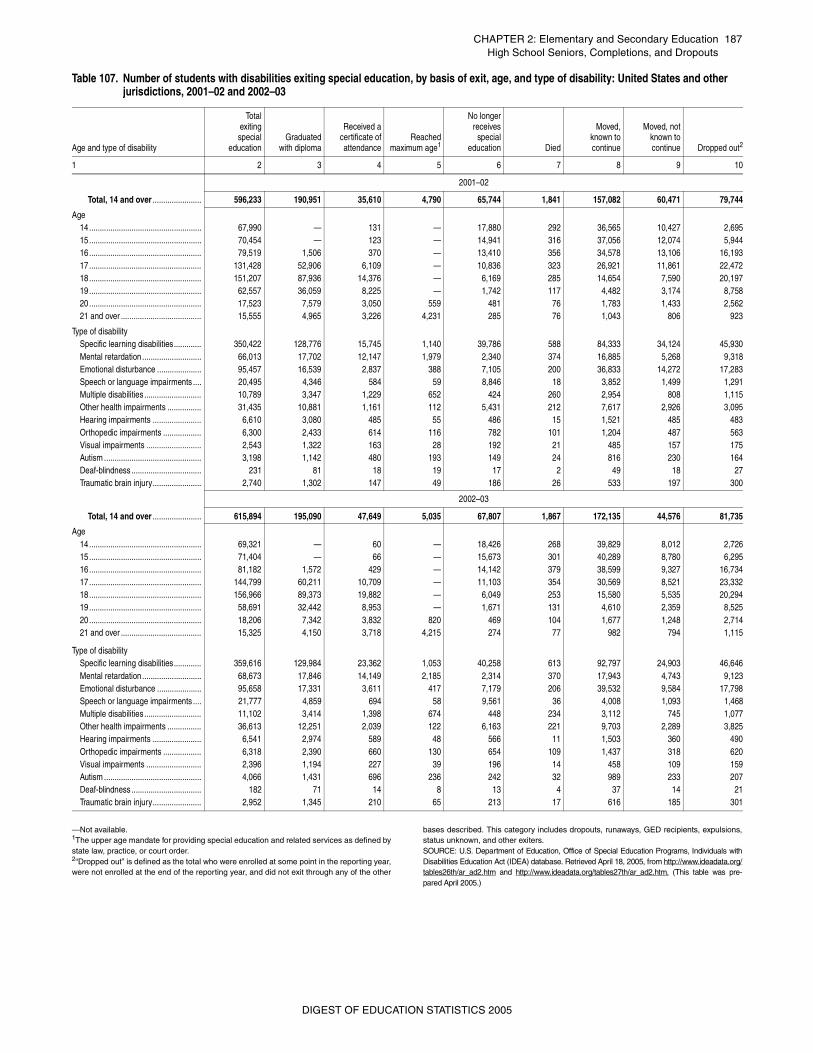
—Not available.1The upper age mandate for providing special education and related services as defined bystate law, practice, or court order.2“Dropped out” is defined as the total who were enrolled at some point in the reporting year,were not enrolled at the end of the reporting year, and did not exit through any of the other
bases described. This category includes dropouts, runaways, GED recipients, expulsions,status unknown, and other exiters.SOURCE: U.S. Department of Education, Office of Special Education Programs, Individuals withDisabilities Education Act (IDEA) database. Retrieved April 18, 2005, from http://www.ideadata.org/tables26th/ar_ad2.htm and http://www.ideadata.org/tables27th/ar_ad2.htm. (This table was pre-pared April 2005.)
Table 107. Number of students with disabilities exiting special education, by basis of exit, age, and type of disability: United States and other jurisdictions, 2001–02 and 2002–03
Age and type of disability
Totalexitingspecial
educationGraduated
with diploma
Received acertificate ofattendance
Reachedmaximum age1
No longerreceives
specialeducation Died
Moved,known tocontinue
Moved, notknown tocontinue Dropped out2
1 2 3 4 5 6 7 8 9 10
2001–02
Total, 14 and over ....................... 596,233 190,951 35,610 4,790 65,744 1,841 157,082 60,471 79,744
Age 14..................................................... 67,990 — 131 — 17,880 292 36,565 10,427 2,69515..................................................... 70,454 — 123 — 14,941 316 37,056 12,074 5,94416..................................................... 79,519 1,506 370 — 13,410 356 34,578 13,106 16,19317..................................................... 131,428 52,906 6,109 — 10,836 323 26,921 11,861 22,47218..................................................... 151,207 87,936 14,376 — 6,169 285 14,654 7,590 20,19719..................................................... 62,557 36,059 8,225 — 1,742 117 4,482 3,174 8,75820..................................................... 17,523 7,579 3,050 559 481 76 1,783 1,433 2,56221 and over ...................................... 15,555 4,965 3,226 4,231 285 76 1,043 806 923
Type of disabilitySpecific learning disabilities............. 350,422 128,776 15,745 1,140 39,786 588 84,333 34,124 45,930Mental retardation ............................ 66,013 17,702 12,147 1,979 2,340 374 16,885 5,268 9,318Emotional disturbance ..................... 95,457 16,539 2,837 388 7,105 200 36,833 14,272 17,283Speech or language impairments .... 20,495 4,346 584 59 8,846 18 3,852 1,499 1,291Multiple disabilities ........................... 10,789 3,347 1,229 652 424 260 2,954 808 1,115Other health impairments ................ 31,435 10,881 1,161 112 5,431 212 7,617 2,926 3,095Hearing impairments ....................... 6,610 3,080 485 55 486 15 1,521 485 483Orthopedic impairments .................. 6,300 2,433 614 116 782 101 1,204 487 563Visual impairments .......................... 2,543 1,322 163 28 192 21 485 157 175Autism .............................................. 3,198 1,142 480 193 149 24 816 230 164Deaf-blindness ................................. 231 81 18 19 17 2 49 18 27Traumatic brain injury....................... 2,740 1,302 147 49 186 26 533 197 300
2002–03
Total, 14 and over ....................... 615,894 195,090 47,649 5,035 67,807 1,867 172,135 44,576 81,735
Age 14..................................................... 69,321 — 60 — 18,426 268 39,829 8,012 2,72615..................................................... 71,404 — 66 — 15,673 301 40,289 8,780 6,29516..................................................... 81,182 1,572 429 — 14,142 379 38,599 9,327 16,73417..................................................... 144,799 60,211 10,709 — 11,103 354 30,569 8,521 23,33218..................................................... 156,966 89,373 19,882 — 6,049 253 15,580 5,535 20,29419..................................................... 58,691 32,442 8,953 — 1,671 131 4,610 2,359 8,52520..................................................... 18,206 7,342 3,832 820 469 104 1,677 1,248 2,71421 and over ...................................... 15,325 4,150 3,718 4,215 274 77 982 794 1,115
Type of disabilitySpecific learning disabilities............. 359,616 129,984 23,362 1,053 40,258 613 92,797 24,903 46,646Mental retardation ............................ 68,673 17,846 14,149 2,185 2,314 370 17,943 4,743 9,123Emotional disturbance ..................... 95,658 17,331 3,611 417 7,179 206 39,532 9,584 17,798Speech or language impairments .... 21,777 4,859 694 58 9,561 36 4,008 1,093 1,468Multiple disabilities ........................... 11,102 3,414 1,398 674 448 234 3,112 745 1,077Other health impairments ................ 36,613 12,251 2,039 122 6,163 221 9,703 2,289 3,825Hearing impairments ....................... 6,541 2,974 589 48 566 11 1,503 360 490Orthopedic impairments .................. 6,318 2,390 660 130 654 109 1,437 318 620Visual impairments .......................... 2,396 1,194 227 39 196 14 458 109 159Autism .............................................. 4,066 1,431 696 236 242 32 989 233 207Deaf-blindness ................................. 182 71 14 8 13 4 37 14 21Traumatic brain injury....................... 2,952 1,345 210 65 213 17 616 185 301
DIGEST OF EDUCATION STATISTICS 2005
188C
HA
PT
ER
2: Elem
entary and Secondary E
ducationE
ducational Achievem
ent
DIG
ES
T O
F E
DU
CAT
ION
STAT
IST
ICS
2005
ucation
94 1996 1999 2004
9 10 11 12
.2) 212 (1.0) 212 (1.3) 219 (1.1)
.3) 207 (1.4) 209 (1.6) 216 (1.4)
.4) 218 (1.1) 215 (1.5) 221 (1.0)
.3) 220 (1.2) 221 (1.6) 226 (1.1)
.3) 191 (2.6) 186 (2.3) 200 (2.2)
.9) 195 (3.4) 193 (2.7) 205 (1.7)
.9) 220 (1.8) 222 (3.5) 223 (2.5)
.0) 206 (2.8) 205 (2.3) 218 (1.8)
.3) 215 (2.6) 215 (3.9) 221 (2.3)
.8) 210 (1.9) 206 (1.8) 215 (1.5)
.9) 258 (1.0) 259 (1.0) 259 (1.0)
.2) 251 (1.2) 254 (1.3) 254 (1.2)
.2) 264 (1.2) 265 (1.2) 264 (1.3)
.1) 266 (1.0) 267 (1.2) 266 (1.0)
.4) 234 (2.6) 238 (2.4) 244 (2.0)
.9) 238 (2.9) 244 (2.9) 242 (1.6)
.4) 239 (2.8) 238 (3.4) 240 (2.7)
.4) 251 (1.5) 251 (1.8) 251 (1.6)
.9) 268 (2.3) 269 (2.4) 264 (2.0)
.2) 269 (1.4) 270 (1.2) 270 (1.0)
.0) 259 (2.6) 263 (2.9) 265 (1.9)
.5) 251 (3.3) 254 (2.4) 257 (2.3)
.3) 267 (1.8) 261 (1.9) 260 (2.1)
.1) 257 (1.7) 259 (2.2) 255 (1.6)
_
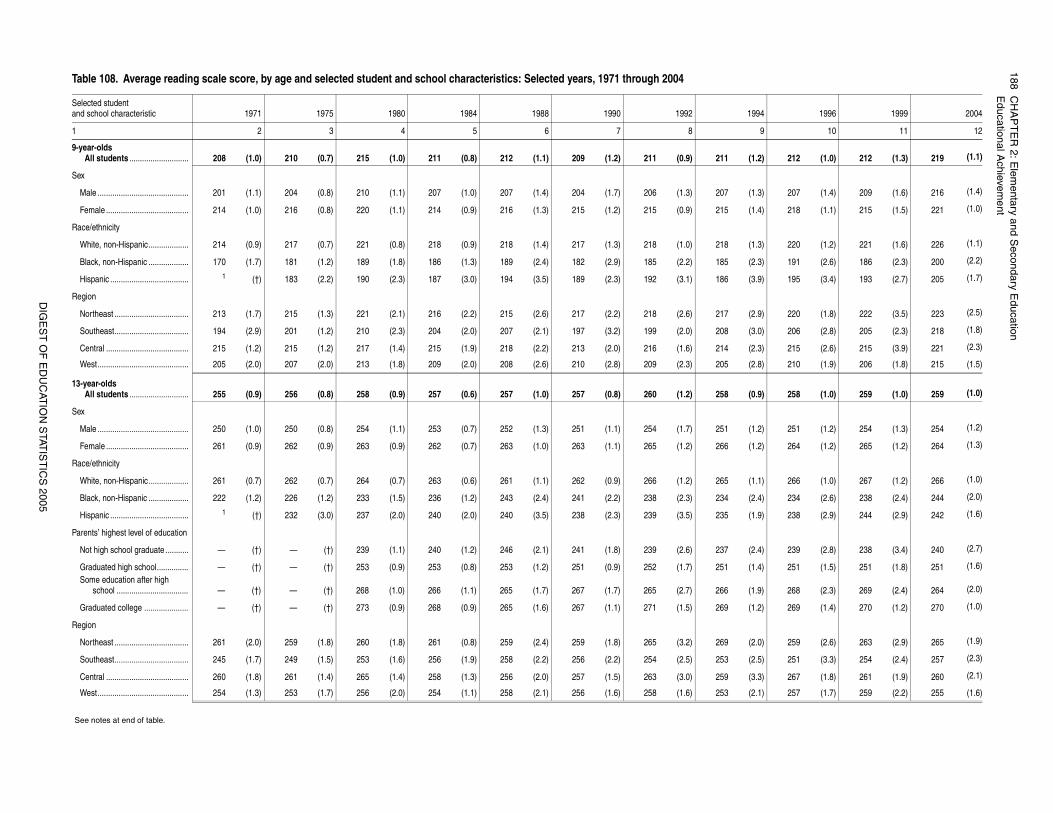
EdTable 108. Average reading scale score, by age and selected student and school characteristics: Selected years, 1971 through 2004
Selected student and school characteristic 1971 1975 1980 1984 1988 1990 1992 19
1 2 3 4 5 6 7 8
9-year-olds All students ............................ 208 (1.0) 210 (0.7) 215 (1.0) 211 (0.8) 212 (1.1) 209 (1.2) 211 (0.9) 211 (1
Sex
Male ........................................... 201 (1.1) 204 (0.8) 210 (1.1) 207 (1.0) 207 (1.4) 204 (1.7) 206 (1.3) 207 (1
Female ....................................... 214 (1.0) 216 (0.8) 220 (1.1) 214 (0.9) 216 (1.3) 215 (1.2) 215 (0.9) 215 (1
Race/ethnicity
White, non-Hispanic................... 214 (0.9) 217 (0.7) 221 (0.8) 218 (0.9) 218 (1.4) 217 (1.3) 218 (1.0) 218 (1
Black, non-Hispanic ................... 170 (1.7) 181 (1.2) 189 (1.8) 186 (1.3) 189 (2.4) 182 (2.9) 185 (2.2) 185 (2
Hispanic ..................................... 1 (†) 183 (2.2) 190 (2.3) 187 (3.0) 194 (3.5) 189 (2.3) 192 (3.1) 186 (3
Region
Northeast ................................... 213 (1.7) 215 (1.3) 221 (2.1) 216 (2.2) 215 (2.6) 217 (2.2) 218 (2.6) 217 (2
Southeast................................... 194 (2.9) 201 (1.2) 210 (2.3) 204 (2.0) 207 (2.1) 197 (3.2) 199 (2.0) 208 (3
Central ....................................... 215 (1.2) 215 (1.2) 217 (1.4) 215 (1.9) 218 (2.2) 213 (2.0) 216 (1.6) 214 (2
West........................................... 205 (2.0) 207 (2.0) 213 (1.8) 209 (2.0) 208 (2.6) 210 (2.8) 209 (2.3) 205 (2
13-year-olds All students ............................ 255 (0.9) 256 (0.8) 258 (0.9) 257 (0.6) 257 (1.0) 257 (0.8) 260 (1.2) 258 (0
Sex
Male ........................................... 250 (1.0) 250 (0.8) 254 (1.1) 253 (0.7) 252 (1.3) 251 (1.1) 254 (1.7) 251 (1
Female ....................................... 261 (0.9) 262 (0.9) 263 (0.9) 262 (0.7) 263 (1.0) 263 (1.1) 265 (1.2) 266 (1
Race/ethnicity
White, non-Hispanic................... 261 (0.7) 262 (0.7) 264 (0.7) 263 (0.6) 261 (1.1) 262 (0.9) 266 (1.2) 265 (1
Black, non-Hispanic ................... 222 (1.2) 226 (1.2) 233 (1.5) 236 (1.2) 243 (2.4) 241 (2.2) 238 (2.3) 234 (2
Hispanic ..................................... 1 (†) 232 (3.0) 237 (2.0) 240 (2.0) 240 (3.5) 238 (2.3) 239 (3.5) 235 (1
Parents’ highest level of education
Not high school graduate ........... — (†) — (†) 239 (1.1) 240 (1.2) 246 (2.1) 241 (1.8) 239 (2.6) 237 (2
Graduated high school............... — (†) — (†) 253 (0.9) 253 (0.8) 253 (1.2) 251 (0.9) 252 (1.7) 251 (1Some education after high
school .................................. — (†) — (†) 268 (1.0) 266 (1.1) 265 (1.7) 267 (1.7) 265 (2.7) 266 (1
Graduated college ..................... — (†) — (†) 273 (0.9) 268 (0.9) 265 (1.6) 267 (1.1) 271 (1.5) 269 (1
Region
Northeast ................................... 261 (2.0) 259 (1.8) 260 (1.8) 261 (0.8) 259 (2.4) 259 (1.8) 265 (3.2) 269 (2
Southeast................................... 245 (1.7) 249 (1.5) 253 (1.6) 256 (1.9) 258 (2.2) 256 (2.2) 254 (2.5) 253 (2
Central ....................................... 260 (1.8) 261 (1.4) 265 (1.4) 258 (1.3) 256 (2.0) 257 (1.5) 263 (3.0) 259 (3
West........................................... 254 (1.3) 253 (1.7) 256 (2.0) 254 (1.1) 258 (2.1) 256 (1.6) 258 (1.6) 253 (2
See notes at end of table.
CH
AP
TE
R 2: E
lementary and S
econdary Education
189E
ducational Achievem
ent
DIG
ES
T O
F E
DU
CAT
ION
STAT
IST
ICS
2005
studies materials. Students at reading score level 300 are able toed literary and informational material. Includes public and privateo were unable to be tested due to limited proficiency in English or
y published figures. Standard errors appear in parentheses. for Education Statistics, National Assessment of Educationalss; and unpublished tabulations, NAEP Data Explorer (http://. (This table was prepared February 2006.)
.3) 288 (1.1) 288 (1.3) 285 (1.2)
.2) 281 (1.3) 281 (1.6) 278 (1.5)
.5) 295 (1.2) 295 (1.4) 292 (1.3)
.5) 295 (1.2) 295 (1.4) 293 (1.1)
.9) 266 (2.7) 264 (1.7) 264 (2.7)
.9) 265 (4.1) 271 (3.9) 264 (2.9)
.7) 267 (3.2) 265 (3.6) 259 (3.4)
.9) 273 (1.7) 274 (2.1) 274 (1.6)
.6) 295 (2.2) 295 (1.8) 286 (1.9)
.7) 299 (1.5) 298 (1.3) 298 (1.3)
.2) 292 (2.8) 295 (4.0) 290 (2.5)
.8) 279 (2.6) 279 (2.4) 281 (2.1)
.7) 293 (2.1) 292 (1.5) 291 (2.2)
.8) 287 (2.4) 286 (3.0) 280 (2.5)
ucation
94 1996 1999 2004
9 10 11 12
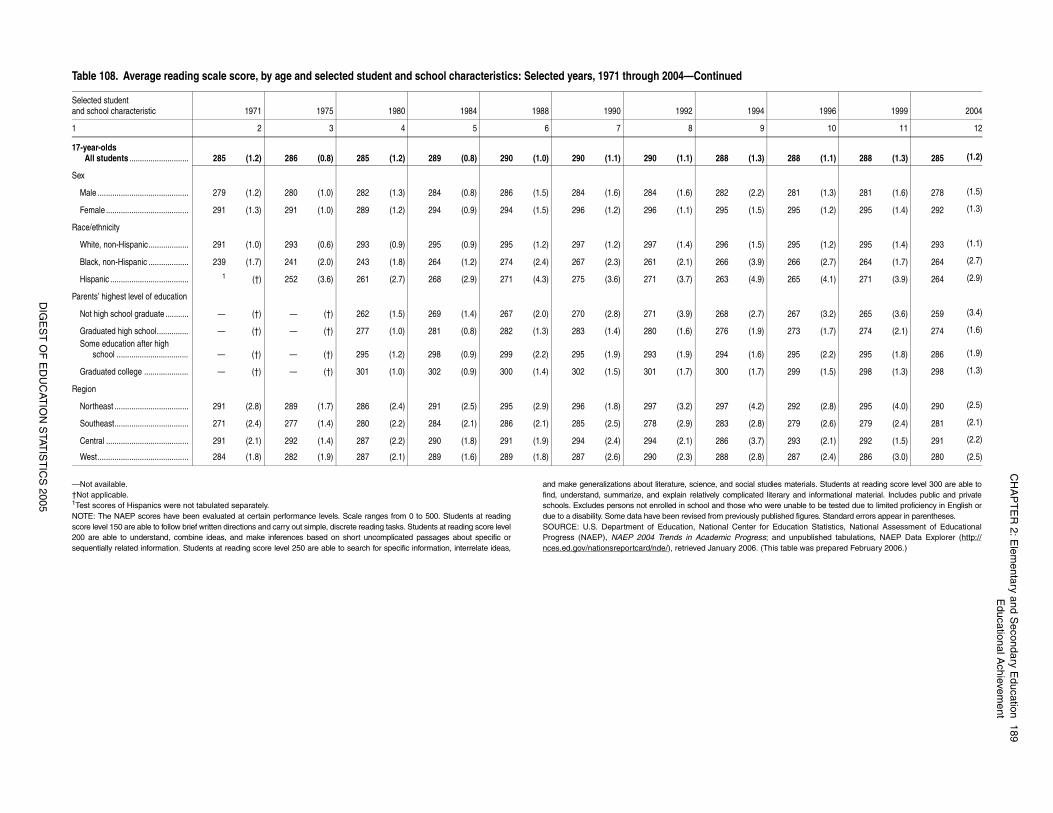
—Not available. †Not applicable. 1Test scores of Hispanics were not tabulated separately. NOTE: The NAEP scores have been evaluated at certain performance levels. Scale ranges from 0 to 500. Students at readingscore level 150 are able to follow brief written directions and carry out simple, discrete reading tasks. Students at reading score level200 are able to understand, combine ideas, and make inferences based on short uncomplicated passages about specific orsequentially related information. Students at reading score level 250 are able to search for specific information, interrelate ideas,
and make generalizations about literature, science, and socialfind, understand, summarize, and explain relatively complicatschools. Excludes persons not enrolled in school and those whdue to a disability. Some data have been revised from previouslSOURCE: U.S. Department of Education, National CenterProgress (NAEP), NAEP 2004 Trends in Academic Progrences.ed.gov/nationsreportcard/nde/), retrieved January 2006
17-year-olds All students ............................ 285 (1.2) 286 (0.8) 285 (1.2) 289 (0.8) 290 (1.0) 290 (1.1) 290 (1.1) 288 (1
Sex
Male ........................................... 279 (1.2) 280 (1.0) 282 (1.3) 284 (0.8) 286 (1.5) 284 (1.6) 284 (1.6) 282 (2
Female ....................................... 291 (1.3) 291 (1.0) 289 (1.2) 294 (0.9) 294 (1.5) 296 (1.2) 296 (1.1) 295 (1
Race/ethnicity
White, non-Hispanic................... 291 (1.0) 293 (0.6) 293 (0.9) 295 (0.9) 295 (1.2) 297 (1.2) 297 (1.4) 296 (1
Black, non-Hispanic ................... 239 (1.7) 241 (2.0) 243 (1.8) 264 (1.2) 274 (2.4) 267 (2.3) 261 (2.1) 266 (3
Hispanic ..................................... 1 (†) 252 (3.6) 261 (2.7) 268 (2.9) 271 (4.3) 275 (3.6) 271 (3.7) 263 (4
Parents’ highest level of education
Not high school graduate ........... — (†) — (†) 262 (1.5) 269 (1.4) 267 (2.0) 270 (2.8) 271 (3.9) 268 (2
Graduated high school............... — (†) — (†) 277 (1.0) 281 (0.8) 282 (1.3) 283 (1.4) 280 (1.6) 276 (1Some education after high
school .................................. — (†) — (†) 295 (1.2) 298 (0.9) 299 (2.2) 295 (1.9) 293 (1.9) 294 (1
Graduated college ..................... — (†) — (†) 301 (1.0) 302 (0.9) 300 (1.4) 302 (1.5) 301 (1.7) 300 (1
Region
Northeast ................................... 291 (2.8) 289 (1.7) 286 (2.4) 291 (2.5) 295 (2.9) 296 (1.8) 297 (3.2) 297 (4
Southeast................................... 271 (2.4) 277 (1.4) 280 (2.2) 284 (2.1) 286 (2.1) 285 (2.5) 278 (2.9) 283 (2
Central ....................................... 291 (2.1) 292 (1.4) 287 (2.2) 290 (1.8) 291 (1.9) 294 (2.4) 294 (2.1) 286 (3
West........................................... 284 (1.8) 282 (1.9) 287 (2.1) 289 (1.6) 289 (1.8) 287 (2.6) 290 (2.3) 288 (2
EdTable 108. Average reading scale score, by age and selected student and school characteristics: Selected years, 1971 through 2004—Continued
Selected student and school characteristic 1971 1975 1980 1984 1988 1990 1992 19
1 2 3 4 5 6 7 8
190C
HA
PT
ER
2: Elem
entary and Secondary E
ducationE
ducational Achievem
ent
DIG
ES
T O
F E
DU
CAT
ION
STAT
IST
ICS
2005
plain relatively complicated literary and informational material.nrolled in school and those who were unable to be tested due toa have been revised from previously published figures. Standard
for Education Statistics, National Assessment of Educationalplorer (http://nces.ed.gov/nationsreportcard/nde/), retrieved July
2004
ale Female Total Male Female
12 13 14 15 16
1.6) 215 (1.5) 219 (1.1) 216 (1.4) 221 (1.0)
0.9) 38 (0.9) — (†) — (†) — (†)
1.6) 150 (3.1) — (†) — (†) — (†)2.3) 164 (2.6) 169 (1.7) — (†) — (†)1.8) 189 (1.6) 194 (1.7) — (†) — (†)2.3) 218 (2.7) 221 (1.4) — (†) — (†)2.1) 241 (1.6) 245 (1.3) — (†) — (†)3.0) 260 (2.7) 264 (2.1) — (†) — (†)3.4) 273 (2.0) — (†) — (†) — (†)
1.3) 265 (1.2) 259 (1.0) 254 (1.2) 264 (1.3)
1.1) 37 (1.0) — (†) — (†) — (†)
3.6) 203 (3.0) — (†) — (†) — (†)1.9) 218 (2.4) 210 (1.9) — (†) — (†)2.0) 240 (1.2) 235 (1.3) — (†) — (†)1.4) 266 (1.5) 260 (1.4) — (†) — (†)2.4) 291 (2.6) 285 (1.4) — (†) — (†)2.3) 312 (2.1) 305 (1.2) — (†) — (†)1.7) 325 (2.0) — (†) — (†) — (†)
1.6) 295 (1.4) 285 (1.2) 278 (1.5) 292 (1.3)
1.2) 40 (0.8) — (†) — (†) — (†)
3.2) 229 (5.7) — (†) — (†) — (†)2.3) 244 (1.9) 227 (2.8) — (†) — (†)2.2) 268 (1.6) 258 (1.4) — (†) — (†)1.6) 295 (1.6) 287 (1.5) — (†) — (†)1.9) 322 (1.9) 315 (1.0) — (†) — (†)2.6) 345 (2.9) 338 (1.8) — (†) — (†)6.4) 359 (3.0) — (†) — (†) — (†)
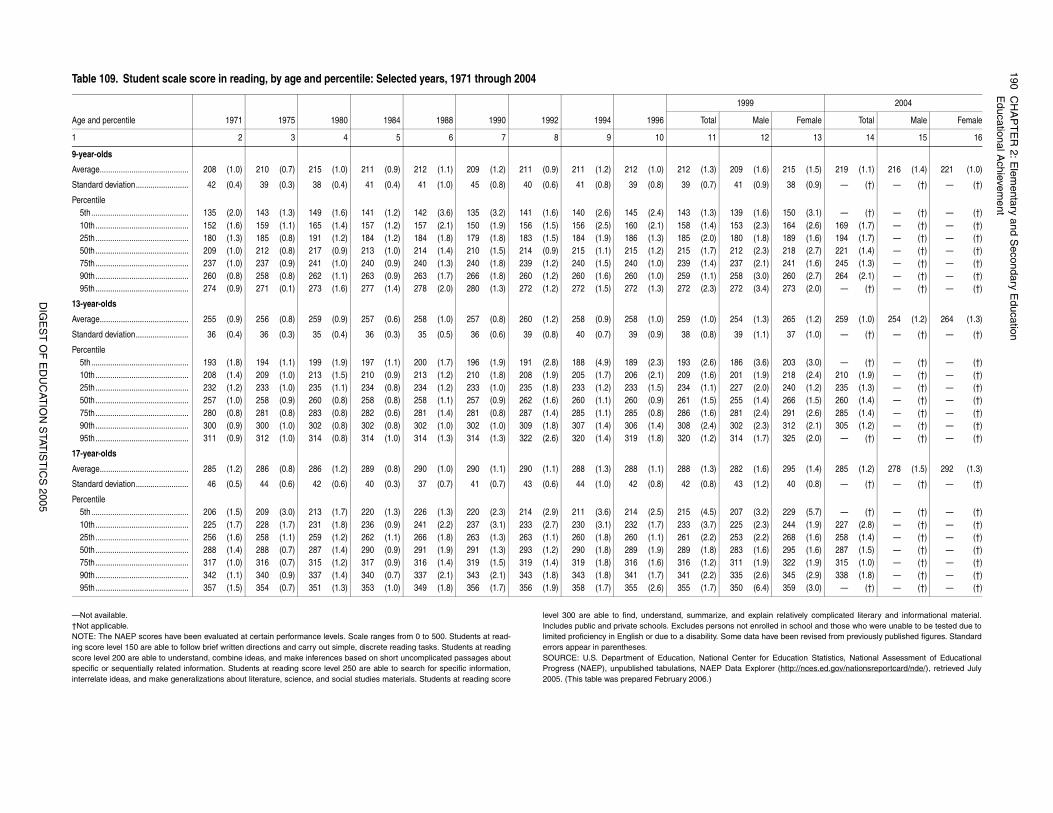
—Not available.†Not applicable.NOTE: The NAEP scores have been evaluated at certain performance levels. Scale ranges from 0 to 500. Students at read-ing score level 150 are able to follow brief written directions and carry out simple, discrete reading tasks. Students at readingscore level 200 are able to understand, combine ideas, and make inferences based on short uncomplicated passages aboutspecific or sequentially related information. Students at reading score level 250 are able to search for specific information,interrelate ideas, and make generalizations about literature, science, and social studies materials. Students at reading score
level 300 are able to find, understand, summarize, and exIncludes public and private schools. Excludes persons not elimited proficiency in English or due to a disability. Some daterrors appear in parentheses.SOURCE: U.S. Department of Education, National CenterProgress (NAEP), unpublished tabulations, NAEP Data Ex2005. (This table was prepared February 2006.)
Table 109. Student scale score in reading, by age and percentile: Selected years, 1971 through 2004
Age and percentile 1971 1975 1980 1984 1988 1990 1992 1994 1996
1999
Total M
1 2 3 4 5 6 7 8 9 10 11
9-year-olds
Average.......................................... 208 (1.0) 210 (0.7) 215 (1.0) 211 (0.9) 212 (1.1) 209 (1.2) 211 (0.9) 211 (1.2) 212 (1.0) 212 (1.3) 209 (
Standard deviation......................... 42 (0.4) 39 (0.3) 38 (0.4) 41 (0.4) 41 (1.0) 45 (0.8) 40 (0.6) 41 (0.8) 39 (0.8) 39 (0.7) 41 (
Percentile5th.............................................. 135 (2.0) 143 (1.3) 149 (1.6) 141 (1.2) 142 (3.6) 135 (3.2) 141 (1.6) 140 (2.6) 145 (2.4) 143 (1.3) 139 (10th............................................ 152 (1.6) 159 (1.1) 165 (1.4) 157 (1.2) 157 (2.1) 150 (1.9) 156 (1.5) 156 (2.5) 160 (2.1) 158 (1.4) 153 (25th............................................ 180 (1.3) 185 (0.8) 191 (1.2) 184 (1.2) 184 (1.8) 179 (1.8) 183 (1.5) 184 (1.9) 186 (1.3) 185 (2.0) 180 (50th............................................ 209 (1.0) 212 (0.8) 217 (0.9) 213 (1.0) 214 (1.4) 210 (1.5) 214 (0.9) 215 (1.1) 215 (1.2) 215 (1.7) 212 (75th............................................ 237 (1.0) 237 (0.9) 241 (1.0) 240 (0.9) 240 (1.3) 240 (1.8) 239 (1.2) 240 (1.5) 240 (1.0) 239 (1.4) 237 (90th............................................ 260 (0.8) 258 (0.8) 262 (1.1) 263 (0.9) 263 (1.7) 266 (1.8) 260 (1.2) 260 (1.6) 260 (1.0) 259 (1.1) 258 (95th............................................ 274 (0.9) 271 (0.1) 273 (1.6) 277 (1.4) 278 (2.0) 280 (1.3) 272 (1.2) 272 (1.5) 272 (1.3) 272 (2.3) 272 (
13-year-olds
Average.......................................... 255 (0.9) 256 (0.8) 259 (0.9) 257 (0.6) 258 (1.0) 257 (0.8) 260 (1.2) 258 (0.9) 258 (1.0) 259 (1.0) 254 (
Standard deviation......................... 36 (0.4) 36 (0.3) 35 (0.4) 36 (0.3) 35 (0.5) 36 (0.6) 39 (0.8) 40 (0.7) 39 (0.9) 38 (0.8) 39 (
Percentile5th.............................................. 193 (1.8) 194 (1.1) 199 (1.9) 197 (1.1) 200 (1.7) 196 (1.9) 191 (2.8) 188 (4.9) 189 (2.3) 193 (2.6) 186 (10th............................................ 208 (1.4) 209 (1.0) 213 (1.5) 210 (0.9) 213 (1.2) 210 (1.8) 208 (1.9) 205 (1.7) 206 (2.1) 209 (1.6) 201 (25th............................................ 232 (1.2) 233 (1.0) 235 (1.1) 234 (0.8) 234 (1.2) 233 (1.0) 235 (1.8) 233 (1.2) 233 (1.5) 234 (1.1) 227 (50th............................................ 257 (1.0) 258 (0.9) 260 (0.8) 258 (0.8) 258 (1.1) 257 (0.9) 262 (1.6) 260 (1.1) 260 (0.9) 261 (1.5) 255 (75th............................................ 280 (0.8) 281 (0.8) 283 (0.8) 282 (0.6) 281 (1.4) 281 (0.8) 287 (1.4) 285 (1.1) 285 (0.8) 286 (1.6) 281 (90th............................................ 300 (0.9) 300 (1.0) 302 (0.8) 302 (0.8) 302 (1.0) 302 (1.0) 309 (1.8) 307 (1.4) 306 (1.4) 308 (2.4) 302 (95th............................................ 311 (0.9) 312 (1.0) 314 (0.8) 314 (1.0) 314 (1.3) 314 (1.3) 322 (2.6) 320 (1.4) 319 (1.8) 320 (1.2) 314 (
17-year-olds
Average.......................................... 285 (1.2) 286 (0.8) 286 (1.2) 289 (0.8) 290 (1.0) 290 (1.1) 290 (1.1) 288 (1.3) 288 (1.1) 288 (1.3) 282 (
Standard deviation......................... 46 (0.5) 44 (0.6) 42 (0.6) 40 (0.3) 37 (0.7) 41 (0.7) 43 (0.6) 44 (1.0) 42 (0.8) 42 (0.8) 43 (
Percentile5th.............................................. 206 (1.5) 209 (3.0) 213 (1.7) 220 (1.3) 226 (1.3) 220 (2.3) 214 (2.9) 211 (3.6) 214 (2.5) 215 (4.5) 207 (10th............................................ 225 (1.7) 228 (1.7) 231 (1.8) 236 (0.9) 241 (2.2) 237 (3.1) 233 (2.7) 230 (3.1) 232 (1.7) 233 (3.7) 225 (25th............................................ 256 (1.6) 258 (1.1) 259 (1.2) 262 (1.1) 266 (1.8) 263 (1.3) 263 (1.1) 260 (1.8) 260 (1.1) 261 (2.2) 253 (50th............................................ 288 (1.4) 288 (0.7) 287 (1.4) 290 (0.9) 291 (1.9) 291 (1.3) 293 (1.2) 290 (1.8) 289 (1.9) 289 (1.8) 283 (75th............................................ 317 (1.0) 316 (0.7) 315 (1.2) 317 (0.9) 316 (1.4) 319 (1.5) 319 (1.4) 319 (1.8) 316 (1.6) 316 (1.2) 311 (90th............................................ 342 (1.1) 340 (0.9) 337 (1.4) 340 (0.7) 337 (2.1) 343 (2.1) 343 (1.8) 343 (1.8) 341 (1.7) 341 (2.2) 335 (95th............................................ 357 (1.5) 354 (0.7) 351 (1.3) 353 (1.0) 349 (1.8) 356 (1.7) 356 (1.9) 358 (1.7) 355 (2.6) 355 (1.7) 350 (
CH
AP
TE
R 2: E
lementary and S
econdary Education
191E
ducational Achievem
ent
DIG
ES
T O
F E
DU
CAT
ION
STAT
IST
ICS
2005
17-year-olds
984 1994 1996 1999 2004
12 13 14 15 16
1.5) 293 (2.1) 294 (2.8) 292 (2.6) — (†)1.7) 294 (2.4) 293 (2.3) 294 (2.7) — (†)1.4) 293 (2.4) 293 (2.3) 291 (2.8) — (†)1.4) 293 (2.4) 290 (2.2) 291 (2.3) — (†)1.4) 293 (2.3) 292 (2.8) 292 (2.0) — (†)
1.5) 302 (4.2) 302 (5.2) 301 (4.9) 305 (3.7)1.7) 286 (4.1) 293 (4.0) 289 (2.9) 288 (4.3)1.8) 286 (4.5) 290 (5.6) 286 (4.8) 287 (4.7)2.7) 281 (8.2) 285 (5.6) 283 (4.4) 272 (5.0)2.4) 258 (5.2) 270 (5.0) 262 (5.0) 268 (5.8)
2.0) 279 (4.0) 275 (4.5) 276 (3.8) — (†)1.5) 295 (2.8) 294 (3.2) 292 (2.2) — (†)1.9) 296 (4.0) 295 (4.8) 299 (6.5) — (†)
0.8) 273 (2.3) 274 (1.9) 275 (2.3) 270 (2.0)1.4) 285 (2.1) 281 (2.2) 282 (3.1) 279 (2.7)0.9) 288 (1.6) 289 (1.5) 291 (2.3) 287 (1.6)0.8) 297 (1.7) 296 (2.1) 296 (2.0) 295 (1.7)1.4) 306 (3.1) 307 (3.4) 300 (2.8) 304 (2.4)
1.1) 85 (2.2) 80 (1.8) 85 (2.0) — (†)1.0) 70 (2.1) 67 (1.6) 72 (2.0) — (†)1.2) 69 (1.8) 66 (1.7) 70 (1.9) — (†)1.1) 84 (1.9) 82 (2.0) 84 (1.3) — (†)0.9) 82 (2.0) 81 (1.9) 81 (2.0) — (†)
(†) 100 (†) 100 (†) 100 (†) 100 (†)0.8) 30 (2.6) 23 (2.0) 25 (1.7) 22 (2.0)1.1) 31 (1.9) 32 (2.7) 28 (2.7) 30 (1.9)0.5) 15 (1.5) 17 (1.5) 19 (1.7) 15 (1.6)0.5) 12 (1.5) 12 (1.6) 12 (1.4) 14 (1.5)0.6) 12 (1.4) 16 (2.1) 16 (2.4) 19 (1.8)
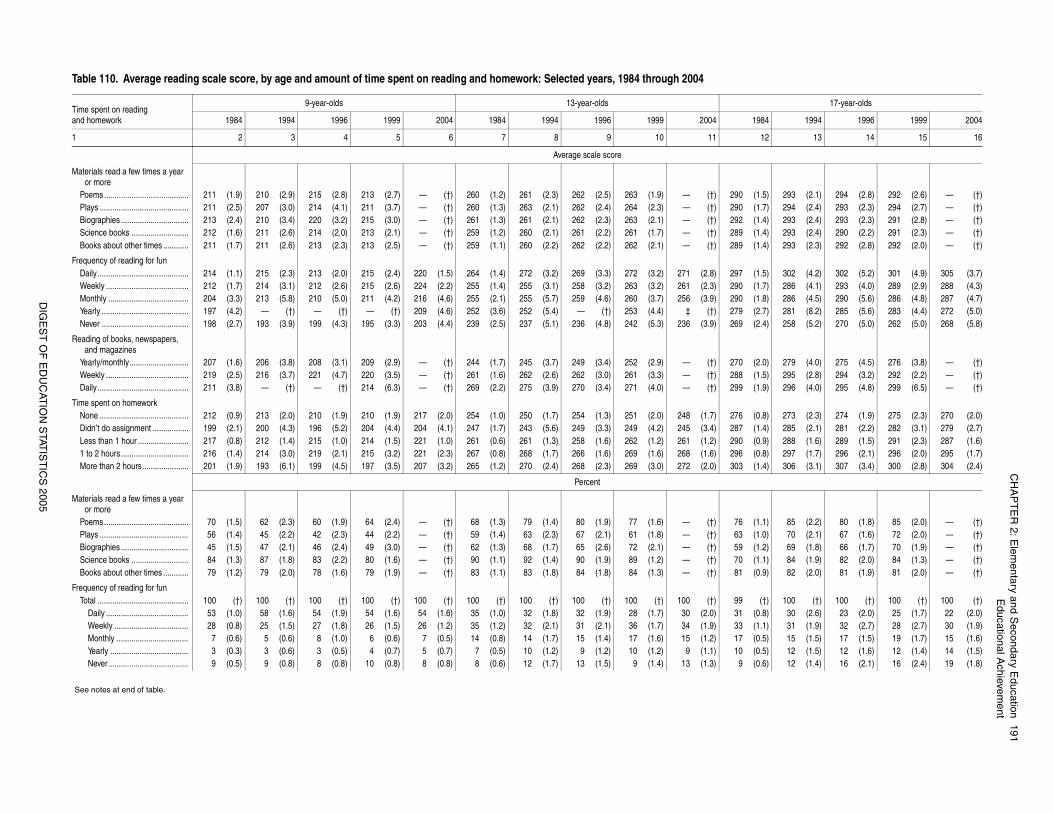
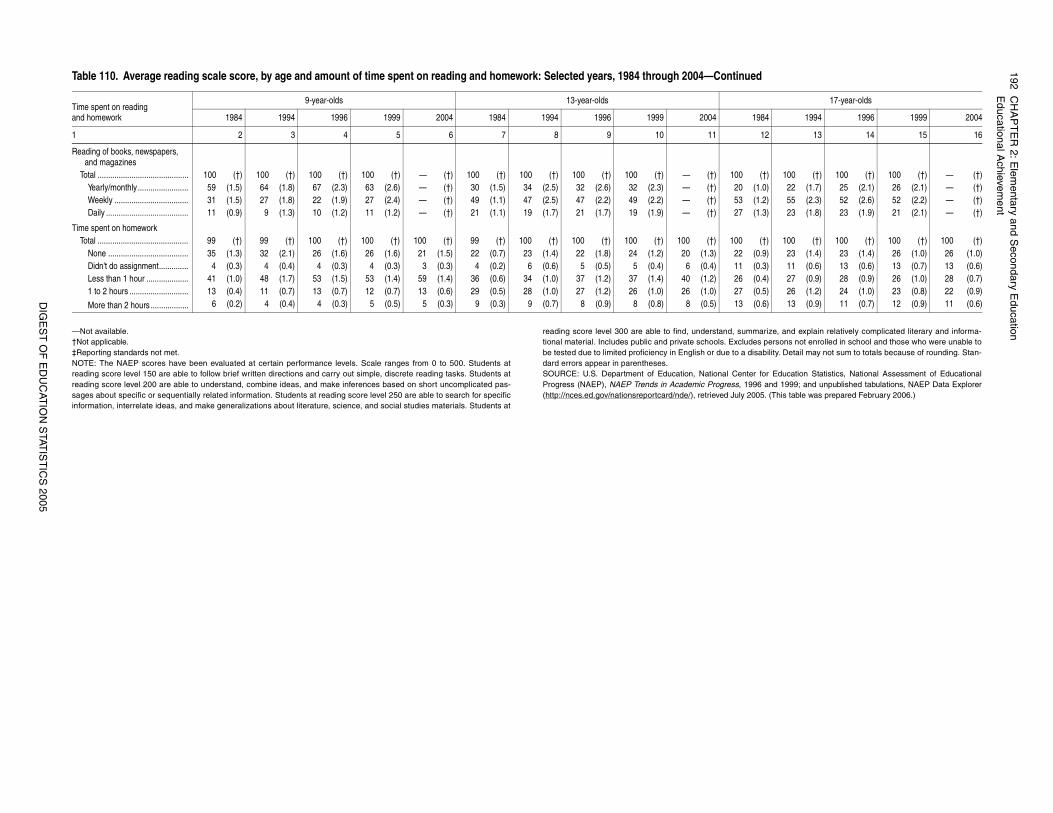
Table 110. Average reading scale score, by age and amount of time spent on reading and homework: Selected years, 1984 through 2004
Time spent on reading and homework
9-year-olds 13-year-olds
1984 1994 1996 1999 2004 1984 1994 1996 1999 2004 1
1 2 3 4 5 6 7 8 9 10 11
Average scale score
Materials read a few times a year or more
Poems........................................ 211 (1.9) 210 (2.9) 215 (2.8) 213 (2.7) — (†) 260 (1.2) 261 (2.3) 262 (2.5) 263 (1.9) — (†) 290 (Plays .......................................... 211 (2.5) 207 (3.0) 214 (4.1) 211 (3.7) — (†) 260 (1.3) 263 (2.1) 262 (2.4) 264 (2.3) — (†) 290 (Biographies ................................ 213 (2.4) 210 (3.4) 220 (3.2) 215 (3.0) — (†) 261 (1.3) 261 (2.1) 262 (2.3) 263 (2.1) — (†) 292 (Science books ........................... 212 (1.6) 211 (2.6) 214 (2.0) 213 (2.1) — (†) 259 (1.2) 260 (2.1) 261 (2.2) 261 (1.7) — (†) 289 (Books about other times ............ 211 (1.7) 211 (2.6) 213 (2.3) 213 (2.5) — (†) 259 (1.1) 260 (2.2) 262 (2.2) 262 (2.1) — (†) 289 (
Frequency of reading for funDaily ........................................... 214 (1.1) 215 (2.3) 213 (2.0) 215 (2.4) 220 (1.5) 264 (1.4) 272 (3.2) 269 (3.3) 272 (3.2) 271 (2.8) 297 (Weekly ....................................... 212 (1.7) 214 (3.1) 212 (2.6) 215 (2.6) 224 (2.2) 255 (1.4) 255 (3.1) 258 (3.2) 263 (3.2) 261 (2.3) 290 (Monthly ...................................... 204 (3.3) 213 (5.8) 210 (5.0) 211 (4.2) 216 (4.6) 255 (2.1) 255 (5.7) 259 (4.6) 260 (3.7) 256 (3.9) 290 (Yearly ......................................... 197 (4.2) — (†) — (†) — (†) 209 (4.6) 252 (3.6) 252 (5.4) — (†) 253 (4.4) ‡ (†) 279 (Never ......................................... 198 (2.7) 193 (3.9) 199 (4.3) 195 (3.3) 203 (4.4) 239 (2.5) 237 (5.1) 236 (4.8) 242 (5.3) 236 (3.9) 269 (
Reading of books, newspapers, and magazines
Yearly/monthly............................ 207 (1.6) 206 (3.8) 208 (3.1) 209 (2.9) — (†) 244 (1.7) 245 (3.7) 249 (3.4) 252 (2.9) — (†) 270 (Weekly ....................................... 219 (2.5) 216 (3.7) 221 (4.7) 220 (3.5) — (†) 261 (1.6) 262 (2.6) 262 (3.0) 261 (3.3) — (†) 288 (Daily ........................................... 211 (3.8) — (†) — (†) 214 (6.3) — (†) 269 (2.2) 275 (3.9) 270 (3.4) 271 (4.0) — (†) 299 (
Time spent on homeworkNone .......................................... 212 (0.9) 213 (2.0) 210 (1.9) 210 (1.9) 217 (2.0) 254 (1.0) 250 (1.7) 254 (1.3) 251 (2.0) 248 (1.7) 276 (Didn’t do assignment ................. 199 (2.1) 200 (4.3) 196 (5.2) 204 (4.4) 204 (4.1) 247 (1.7) 243 (5.6) 249 (3.3) 249 (4.2) 245 (3.4) 287 (Less than 1 hour ........................ 217 (0.8) 212 (1.4) 215 (1.0) 214 (1.5) 221 (1.0) 261 (0.6) 261 (1.3) 258 (1.6) 262 (1.2) 261 (1.2) 290 (1 to 2 hours................................ 216 (1.4) 214 (3.0) 219 (2.1) 215 (3.2) 221 (2.3) 267 (0.8) 268 (1.7) 266 (1.6) 269 (1.6) 268 (1.6) 296 (More than 2 hours...................... 201 (1.9) 193 (6.1) 199 (4.5) 197 (3.5) 207 (3.2) 265 (1.2) 270 (2.4) 268 (2.3) 269 (3.0) 272 (2.0) 303 (
Percent
Materials read a few times a year or more
Poems........................................ 70 (1.5) 62 (2.3) 60 (1.9) 64 (2.4) — (†) 68 (1.3) 79 (1.4) 80 (1.9) 77 (1.6) — (†) 76 (Plays .......................................... 56 (1.4) 45 (2.2) 42 (2.3) 44 (2.2) — (†) 59 (1.4) 63 (2.3) 67 (2.1) 61 (1.8) — (†) 63 (Biographies ................................ 45 (1.5) 47 (2.1) 46 (2.4) 49 (3.0) — (†) 62 (1.3) 68 (1.7) 65 (2.6) 72 (2.1) — (†) 59 (Science books ........................... 84 (1.3) 87 (1.8) 83 (2.2) 80 (1.6) — (†) 90 (1.1) 92 (1.4) 90 (1.9) 89 (1.2) — (†) 70 (Books about other times ............ 79 (1.2) 79 (2.0) 78 (1.6) 79 (1.9) — (†) 83 (1.1) 83 (1.8) 84 (1.8) 84 (1.3) — (†) 81 (
Frequency of reading for funTotal ........................................... 100 (†) 100 (†) 100 (†) 100 (†) 100 (†) 100 (†) 100 (†) 100 (†) 100 (†) 100 (†) 99
Daily ....................................... 53 (1.0) 58 (1.6) 54 (1.9) 54 (1.6) 54 (1.6) 35 (1.0) 32 (1.8) 32 (1.9) 28 (1.7) 30 (2.0) 31 (Weekly ................................... 28 (0.8) 25 (1.5) 27 (1.8) 26 (1.5) 26 (1.2) 35 (1.2) 32 (2.1) 31 (2.1) 36 (1.7) 34 (1.9) 33 (Monthly .................................. 7 (0.6) 5 (0.6) 8 (1.0) 6 (0.6) 7 (0.5) 14 (0.8) 14 (1.7) 15 (1.4) 17 (1.6) 15 (1.2) 17 (Yearly ..................................... 3 (0.3) 3 (0.6) 3 (0.5) 4 (0.7) 5 (0.7) 7 (0.5) 10 (1.2) 9 (1.2) 10 (1.2) 9 (1.1) 10 (Never...................................... 9 (0.5) 9 (0.8) 8 (0.8) 10 (0.8) 8 (0.8) 8 (0.6) 12 (1.7) 13 (1.5) 9 (1.4) 13 (1.3) 9 (
See notes at end of table.
192C
HA
PT
ER
2: Elem
entary and Secondary E
ducationE
ducational Achievem
ent
DIG
ES
T O
F E
DU
CAT
ION
STAT
IST
ICS
2005
arize, and explain relatively complicated literary and informa-s persons not enrolled in school and those who were unable toability. Detail may not sum to totals because of rounding. Stan-
for Education Statistics, National Assessment of Educational6 and 1999; and unpublished tabulations, NAEP Data Explorer05. (This table was prepared February 2006.)
(†) 100 (†) 100 (†) 100 (†) — (†)1.0) 22 (1.7) 25 (2.1) 26 (2.1) — (†)1.2) 55 (2.3) 52 (2.6) 52 (2.2) — (†)1.3) 23 (1.8) 23 (1.9) 21 (2.1) — (†)
(†) 100 (†) 100 (†) 100 (†) 100 (†)0.9) 23 (1.4) 23 (1.4) 26 (1.0) 26 (1.0)0.3) 11 (0.6) 13 (0.6) 13 (0.7) 13 (0.6)0.4) 27 (0.9) 28 (0.9) 26 (1.0) 28 (0.7)0.5) 26 (1.2) 24 (1.0) 23 (0.8) 22 (0.9)0.6) 13 (0.9) 11 (0.7) 12 (0.9) 11 (0.6)
d
17-year-olds
984 1994 1996 1999 2004
12 13 14 15 16
—Not available.†Not applicable.‡Reporting standards not met.NOTE: The NAEP scores have been evaluated at certain performance levels. Scale ranges from 0 to 500. Students atreading score level 150 are able to follow brief written directions and carry out simple, discrete reading tasks. Students atreading score level 200 are able to understand, combine ideas, and make inferences based on short uncomplicated pas-sages about specific or sequentially related information. Students at reading score level 250 are able to search for specificinformation, interrelate ideas, and make generalizations about literature, science, and social studies materials. Students at
reading score level 300 are able to find, understand, summtional material. Includes public and private schools. Excludebe tested due to limited proficiency in English or due to a disdard errors appear in parentheses.SOURCE: U.S. Department of Education, National CenterProgress (NAEP), NAEP Trends in Academic Progress, 199(http://nces.ed.gov/nationsreportcard/nde/), retrieved July 20
Reading of books, newspapers, and magazines
Total ........................................... 100 (†) 100 (†) 100 (†) 100 (†) — (†) 100 (†) 100 (†) 100 (†) 100 (†) — (†) 100Yearly/monthly ........................ 59 (1.5) 64 (1.8) 67 (2.3) 63 (2.6) — (†) 30 (1.5) 34 (2.5) 32 (2.6) 32 (2.3) — (†) 20 (Weekly ................................... 31 (1.5) 27 (1.8) 22 (1.9) 27 (2.4) — (†) 49 (1.1) 47 (2.5) 47 (2.2) 49 (2.2) — (†) 53 (Daily ....................................... 11 (0.9) 9 (1.3) 10 (1.2) 11 (1.2) — (†) 21 (1.1) 19 (1.7) 21 (1.7) 19 (1.9) — (†) 27 (
Time spent on homework Total ........................................... 99 (†) 99 (†) 100 (†) 100 (†) 100 (†) 99 (†) 100 (†) 100 (†) 100 (†) 100 (†) 100
None ...................................... 35 (1.3) 32 (2.1) 26 (1.6) 26 (1.6) 21 (1.5) 22 (0.7) 23 (1.4) 22 (1.8) 24 (1.2) 20 (1.3) 22 (Didn't do assignment.............. 4 (0.3) 4 (0.4) 4 (0.3) 4 (0.3) 3 (0.3) 4 (0.2) 6 (0.6) 5 (0.5) 5 (0.4) 6 (0.4) 11 (Less than 1 hour .................... 41 (1.0) 48 (1.7) 53 (1.5) 53 (1.4) 59 (1.4) 36 (0.6) 34 (1.0) 37 (1.2) 37 (1.4) 40 (1.2) 26 (1 to 2 hours ............................ 13 (0.4) 11 (0.7) 13 (0.7) 12 (0.7) 13 (0.6) 29 (0.5) 28 (1.0) 27 (1.2) 26 (1.0) 26 (1.0) 27 (
More than 2 hours .................. 6 (0.2) 4 (0.4) 4 (0.3) 5 (0.5) 5 (0.3) 9 (0.3) 9 (0.7) 8 (0.9) 8 (0.8) 8 (0.5) 13 (
Table 110. Average reading scale score, by age and amount of time spent on reading and homework: Selected years, 1984 through 2004—Continue
Time spent on reading and homework
9-year-olds 13-year-olds
1984 1994 1996 1999 2004 1984 1994 1996 1999 2004 1
1 2 3 4 5 6 7 8 9 10 11
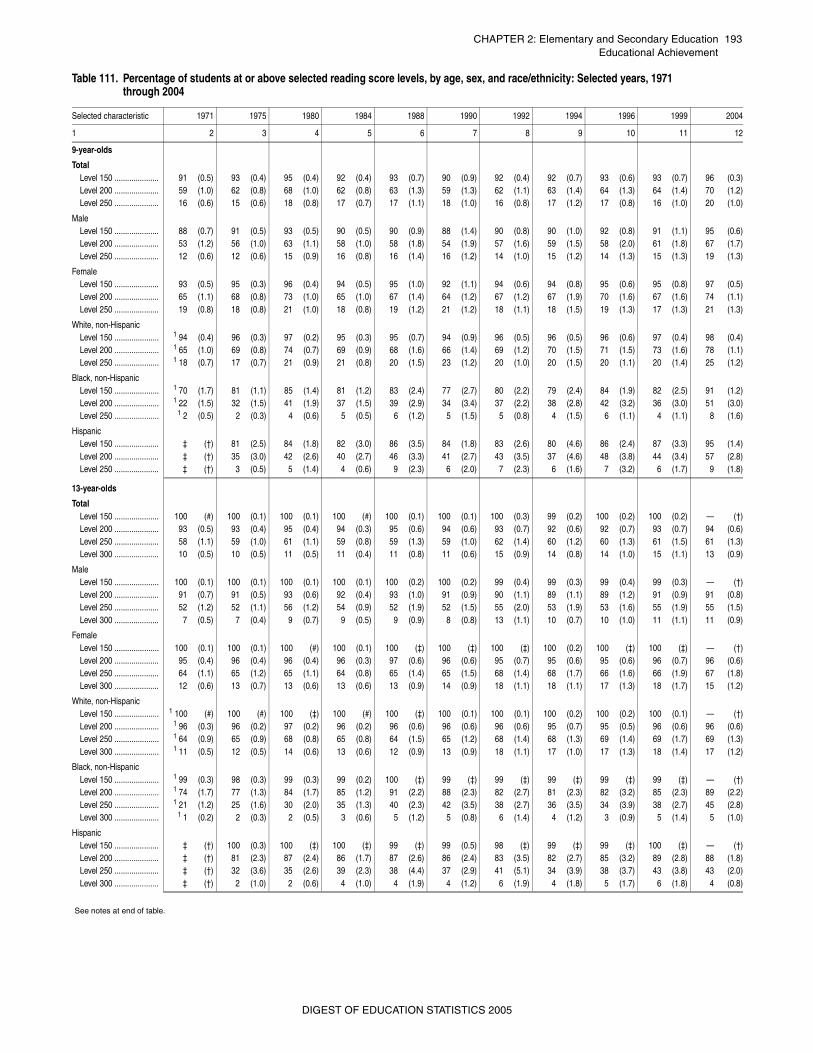
CHAPTER 2: Elementary and Secondary Education 193Educational Achievement
Table 111. Percentage of students at or above selected reading score levels, by age, sex, and race/ethnicity: Selected years, 1971 through 2004
Selected characteristic 1971 1975 1980 1984 1988 1990 1992 1994 1996 1999 2004
1 2 3 4 5 6 7 8 9 10 11 12
9-year-olds
TotalLevel 150 ..................... 91 (0.5) 93 (0.4) 95 (0.4) 92 (0.4) 93 (0.7) 90 (0.9) 92 (0.4) 92 (0.7) 93 (0.6) 93 (0.7) 96 (0.3)Level 200 ..................... 59 (1.0) 62 (0.8) 68 (1.0) 62 (0.8) 63 (1.3) 59 (1.3) 62 (1.1) 63 (1.4) 64 (1.3) 64 (1.4) 70 (1.2)Level 250 ..................... 16 (0.6) 15 (0.6) 18 (0.8) 17 (0.7) 17 (1.1) 18 (1.0) 16 (0.8) 17 (1.2) 17 (0.8) 16 (1.0) 20 (1.0)
MaleLevel 150 ..................... 88 (0.7) 91 (0.5) 93 (0.5) 90 (0.5) 90 (0.9) 88 (1.4) 90 (0.8) 90 (1.0) 92 (0.8) 91 (1.1) 95 (0.6)Level 200 ..................... 53 (1.2) 56 (1.0) 63 (1.1) 58 (1.0) 58 (1.8) 54 (1.9) 57 (1.6) 59 (1.5) 58 (2.0) 61 (1.8) 67 (1.7)Level 250 ..................... 12 (0.6) 12 (0.6) 15 (0.9) 16 (0.8) 16 (1.4) 16 (1.2) 14 (1.0) 15 (1.2) 14 (1.3) 15 (1.3) 19 (1.3)
FemaleLevel 150 ..................... 93 (0.5) 95 (0.3) 96 (0.4) 94 (0.5) 95 (1.0) 92 (1.1) 94 (0.6) 94 (0.8) 95 (0.6) 95 (0.8) 97 (0.5)Level 200 ..................... 65 (1.1) 68 (0.8) 73 (1.0) 65 (1.0) 67 (1.4) 64 (1.2) 67 (1.2) 67 (1.9) 70 (1.6) 67 (1.6) 74 (1.1)Level 250 ..................... 19 (0.8) 18 (0.8) 21 (1.0) 18 (0.8) 19 (1.2) 21 (1.2) 18 (1.1) 18 (1.5) 19 (1.3) 17 (1.3) 21 (1.3)
White, non-HispanicLevel 150 ..................... 1 94 (0.4) 96 (0.3) 97 (0.2) 95 (0.3) 95 (0.7) 94 (0.9) 96 (0.5) 96 (0.5) 96 (0.6) 97 (0.4) 98 (0.4)Level 200 ..................... 1 65 (1.0) 69 (0.8) 74 (0.7) 69 (0.9) 68 (1.6) 66 (1.4) 69 (1.2) 70 (1.5) 71 (1.5) 73 (1.6) 78 (1.1)Level 250 ..................... 1 18 (0.7) 17 (0.7) 21 (0.9) 21 (0.8) 20 (1.5) 23 (1.2) 20 (1.0) 20 (1.5) 20 (1.1) 20 (1.4) 25 (1.2)
Black, non-HispanicLevel 150 ..................... 1 70 (1.7) 81 (1.1) 85 (1.4) 81 (1.2) 83 (2.4) 77 (2.7) 80 (2.2) 79 (2.4) 84 (1.9) 82 (2.5) 91 (1.2)Level 200 ..................... 1 22 (1.5) 32 (1.5) 41 (1.9) 37 (1.5) 39 (2.9) 34 (3.4) 37 (2.2) 38 (2.8) 42 (3.2) 36 (3.0) 51 (3.0)Level 250 ..................... 1 2 (0.5) 2 (0.3) 4 (0.6) 5 (0.5) 6 (1.2) 5 (1.5) 5 (0.8) 4 (1.5) 6 (1.1) 4 (1.1) 8 (1.6)
HispanicLevel 150 ..................... ‡ (†) 81 (2.5) 84 (1.8) 82 (3.0) 86 (3.5) 84 (1.8) 83 (2.6) 80 (4.6) 86 (2.4) 87 (3.3) 95 (1.4)Level 200 ..................... ‡ (†) 35 (3.0) 42 (2.6) 40 (2.7) 46 (3.3) 41 (2.7) 43 (3.5) 37 (4.6) 48 (3.8) 44 (3.4) 57 (2.8)Level 250 ..................... ‡ (†) 3 (0.5) 5 (1.4) 4 (0.6) 9 (2.3) 6 (2.0) 7 (2.3) 6 (1.6) 7 (3.2) 6 (1.7) 9 (1.8)
13-year-olds
TotalLevel 150 ..................... 100 (#) 100 (0.1) 100 (0.1) 100 (#) 100 (0.1) 100 (0.1) 100 (0.3) 99 (0.2) 100 (0.2) 100 (0.2) — (†)Level 200 ..................... 93 (0.5) 93 (0.4) 95 (0.4) 94 (0.3) 95 (0.6) 94 (0.6) 93 (0.7) 92 (0.6) 92 (0.7) 93 (0.7) 94 (0.6)Level 250 ..................... 58 (1.1) 59 (1.0) 61 (1.1) 59 (0.8) 59 (1.3) 59 (1.0) 62 (1.4) 60 (1.2) 60 (1.3) 61 (1.5) 61 (1.3)Level 300 ..................... 10 (0.5) 10 (0.5) 11 (0.5) 11 (0.4) 11 (0.8) 11 (0.6) 15 (0.9) 14 (0.8) 14 (1.0) 15 (1.1) 13 (0.9)
MaleLevel 150 ..................... 100 (0.1) 100 (0.1) 100 (0.1) 100 (0.1) 100 (0.2) 100 (0.2) 99 (0.4) 99 (0.3) 99 (0.4) 99 (0.3) — (†)Level 200 ..................... 91 (0.7) 91 (0.5) 93 (0.6) 92 (0.4) 93 (1.0) 91 (0.9) 90 (1.1) 89 (1.1) 89 (1.2) 91 (0.9) 91 (0.8)Level 250 ..................... 52 (1.2) 52 (1.1) 56 (1.2) 54 (0.9) 52 (1.9) 52 (1.5) 55 (2.0) 53 (1.9) 53 (1.6) 55 (1.9) 55 (1.5)Level 300 ..................... 7 (0.5) 7 (0.4) 9 (0.7) 9 (0.5) 9 (0.9) 8 (0.8) 13 (1.1) 10 (0.7) 10 (1.0) 11 (1.1) 11 (0.9)
FemaleLevel 150 ..................... 100 (0.1) 100 (0.1) 100 (#) 100 (0.1) 100 (‡) 100 (‡) 100 (‡) 100 (0.2) 100 (‡) 100 (‡) — (†)Level 200 ..................... 95 (0.4) 96 (0.4) 96 (0.4) 96 (0.3) 97 (0.6) 96 (0.6) 95 (0.7) 95 (0.6) 95 (0.6) 96 (0.7) 96 (0.6)Level 250 ..................... 64 (1.1) 65 (1.2) 65 (1.1) 64 (0.8) 65 (1.4) 65 (1.5) 68 (1.4) 68 (1.7) 66 (1.6) 66 (1.9) 67 (1.8)Level 300 ..................... 12 (0.6) 13 (0.7) 13 (0.6) 13 (0.6) 13 (0.9) 14 (0.9) 18 (1.1) 18 (1.1) 17 (1.3) 18 (1.7) 15 (1.2)
White, non-HispanicLevel 150 ..................... 1 100 (#) 100 (#) 100 (‡) 100 (#) 100 (‡) 100 (0.1) 100 (0.1) 100 (0.2) 100 (0.2) 100 (0.1) — (†)Level 200 ..................... 1 96 (0.3) 96 (0.2) 97 (0.2) 96 (0.2) 96 (0.6) 96 (0.6) 96 (0.6) 95 (0.7) 95 (0.5) 96 (0.6) 96 (0.6)Level 250 ..................... 1 64 (0.9) 65 (0.9) 68 (0.8) 65 (0.8) 64 (1.5) 65 (1.2) 68 (1.4) 68 (1.3) 69 (1.4) 69 (1.7) 69 (1.3)Level 300 ..................... 1 11 (0.5) 12 (0.5) 14 (0.6) 13 (0.6) 12 (0.9) 13 (0.9) 18 (1.1) 17 (1.0) 17 (1.3) 18 (1.4) 17 (1.2)
Black, non-HispanicLevel 150 ..................... 1 99 (0.3) 98 (0.3) 99 (0.3) 99 (0.2) 100 (‡) 99 (‡) 99 (‡) 99 (‡) 99 (‡) 99 (‡) — (†)Level 200 ..................... 1 74 (1.7) 77 (1.3) 84 (1.7) 85 (1.2) 91 (2.2) 88 (2.3) 82 (2.7) 81 (2.3) 82 (3.2) 85 (2.3) 89 (2.2)Level 250 ..................... 1 21 (1.2) 25 (1.6) 30 (2.0) 35 (1.3) 40 (2.3) 42 (3.5) 38 (2.7) 36 (3.5) 34 (3.9) 38 (2.7) 45 (2.8)Level 300 ..................... 1 1 (0.2) 2 (0.3) 2 (0.5) 3 (0.6) 5 (1.2) 5 (0.8) 6 (1.4) 4 (1.2) 3 (0.9) 5 (1.4) 5 (1.0)
HispanicLevel 150 ..................... ‡ (†) 100 (0.3) 100 (‡) 100 (‡) 99 (‡) 99 (0.5) 98 (‡) 99 (‡) 99 (‡) 100 (‡) — (†)Level 200 ..................... ‡ (†) 81 (2.3) 87 (2.4) 86 (1.7) 87 (2.6) 86 (2.4) 83 (3.5) 82 (2.7) 85 (3.2) 89 (2.8) 88 (1.8)Level 250 ..................... ‡ (†) 32 (3.6) 35 (2.6) 39 (2.3) 38 (4.4) 37 (2.9) 41 (5.1) 34 (3.9) 38 (3.7) 43 (3.8) 43 (2.0)Level 300 ..................... ‡ (†) 2 (1.0) 2 (0.6) 4 (1.0) 4 (1.9) 4 (1.2) 6 (1.9) 4 (1.8) 5 (1.7) 6 (1.8) 4 (0.8)
See notes at end of table.
DIGEST OF EDUCATION STATISTICS 2005
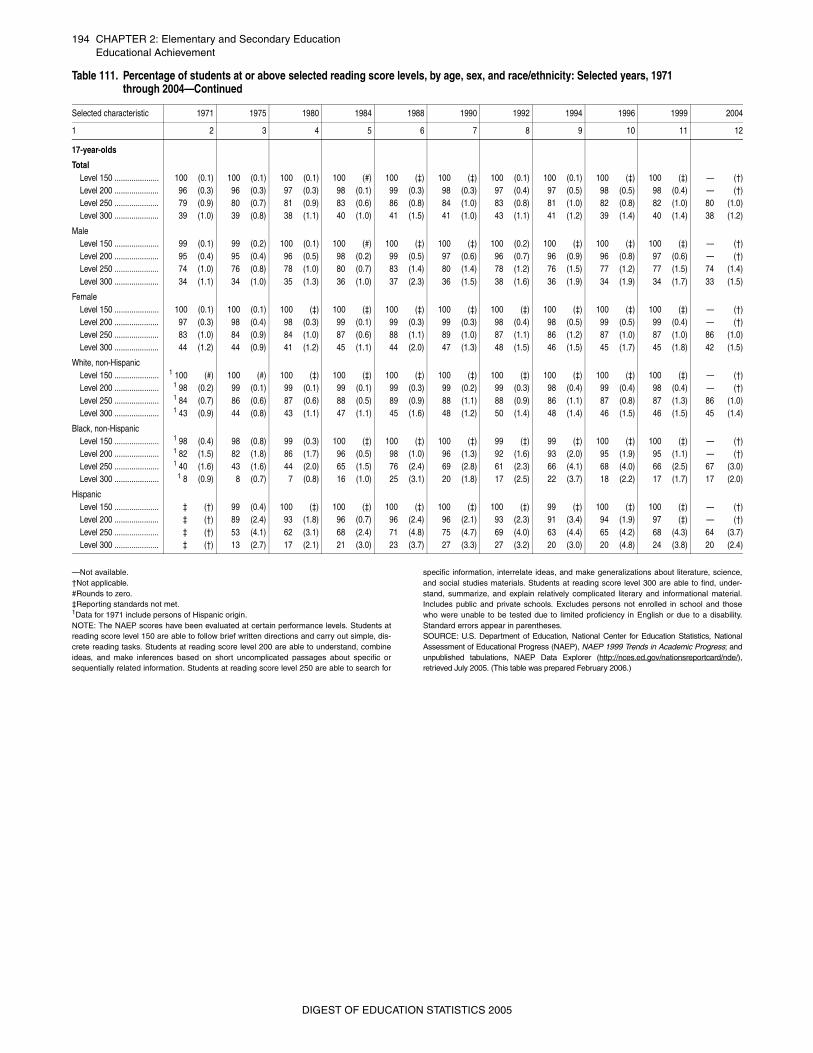
194 CHAPTER 2: Elementary and Secondary EducationEducational Achievement
—Not available.†Not applicable.#Rounds to zero.‡Reporting standards not met.1Data for 1971 include persons of Hispanic origin.NOTE: The NAEP scores have been evaluated at certain performance levels. Students atreading score level 150 are able to follow brief written directions and carry out simple, dis-crete reading tasks. Students at reading score level 200 are able to understand, combineideas, and make inferences based on short uncomplicated passages about specific orsequentially related information. Students at reading score level 250 are able to search for
specific information, interrelate ideas, and make generalizations about literature, science,and social studies materials. Students at reading score level 300 are able to find, under-stand, summarize, and explain relatively complicated literary and informational material.Includes public and private schools. Excludes persons not enrolled in school and thosewho were unable to be tested due to limited proficiency in English or due to a disability.Standard errors appear in parentheses.SOURCE: U.S. Department of Education, National Center for Education Statistics, NationalAssessment of Educational Progress (NAEP), NAEP 1999 Trends in Academic Progress; andunpublished tabulations, NAEP Data Explorer (http://nces.ed.gov/nationsreportcard/nde/),retrieved July 2005. (This table was prepared February 2006.)
17-year-olds
TotalLevel 150 ..................... 100 (0.1) 100 (0.1) 100 (0.1) 100 (#) 100 (‡) 100 (‡) 100 (0.1) 100 (0.1) 100 (‡) 100 (‡) — (†)Level 200 ..................... 96 (0.3) 96 (0.3) 97 (0.3) 98 (0.1) 99 (0.3) 98 (0.3) 97 (0.4) 97 (0.5) 98 (0.5) 98 (0.4) — (†)Level 250 ..................... 79 (0.9) 80 (0.7) 81 (0.9) 83 (0.6) 86 (0.8) 84 (1.0) 83 (0.8) 81 (1.0) 82 (0.8) 82 (1.0) 80 (1.0)Level 300 ..................... 39 (1.0) 39 (0.8) 38 (1.1) 40 (1.0) 41 (1.5) 41 (1.0) 43 (1.1) 41 (1.2) 39 (1.4) 40 (1.4) 38 (1.2)
MaleLevel 150 ..................... 99 (0.1) 99 (0.2) 100 (0.1) 100 (#) 100 (‡) 100 (‡) 100 (0.2) 100 (‡) 100 (‡) 100 (‡) — (†)Level 200 ..................... 95 (0.4) 95 (0.4) 96 (0.5) 98 (0.2) 99 (0.5) 97 (0.6) 96 (0.7) 96 (0.9) 96 (0.8) 97 (0.6) — (†)Level 250 ..................... 74 (1.0) 76 (0.8) 78 (1.0) 80 (0.7) 83 (1.4) 80 (1.4) 78 (1.2) 76 (1.5) 77 (1.2) 77 (1.5) 74 (1.4)Level 300 ..................... 34 (1.1) 34 (1.0) 35 (1.3) 36 (1.0) 37 (2.3) 36 (1.5) 38 (1.6) 36 (1.9) 34 (1.9) 34 (1.7) 33 (1.5)
FemaleLevel 150 ..................... 100 (0.1) 100 (0.1) 100 (‡) 100 (‡) 100 (‡) 100 (‡) 100 (‡) 100 (‡) 100 (‡) 100 (‡) — (†)Level 200 ..................... 97 (0.3) 98 (0.4) 98 (0.3) 99 (0.1) 99 (0.3) 99 (0.3) 98 (0.4) 98 (0.5) 99 (0.5) 99 (0.4) — (†)Level 250 ..................... 83 (1.0) 84 (0.9) 84 (1.0) 87 (0.6) 88 (1.1) 89 (1.0) 87 (1.1) 86 (1.2) 87 (1.0) 87 (1.0) 86 (1.0)Level 300 ..................... 44 (1.2) 44 (0.9) 41 (1.2) 45 (1.1) 44 (2.0) 47 (1.3) 48 (1.5) 46 (1.5) 45 (1.7) 45 (1.8) 42 (1.5)
White, non-HispanicLevel 150 ..................... 1 100 (#) 100 (#) 100 (‡) 100 (‡) 100 (‡) 100 (‡) 100 (‡) 100 (‡) 100 (‡) 100 (‡) — (†)Level 200 ..................... 1 98 (0.2) 99 (0.1) 99 (0.1) 99 (0.1) 99 (0.3) 99 (0.2) 99 (0.3) 98 (0.4) 99 (0.4) 98 (0.4) — (†)Level 250 ..................... 1 84 (0.7) 86 (0.6) 87 (0.6) 88 (0.5) 89 (0.9) 88 (1.1) 88 (0.9) 86 (1.1) 87 (0.8) 87 (1.3) 86 (1.0)Level 300 ..................... 1 43 (0.9) 44 (0.8) 43 (1.1) 47 (1.1) 45 (1.6) 48 (1.2) 50 (1.4) 48 (1.4) 46 (1.5) 46 (1.5) 45 (1.4)
Black, non-HispanicLevel 150 ..................... 1 98 (0.4) 98 (0.8) 99 (0.3) 100 (‡) 100 (‡) 100 (‡) 99 (‡) 99 (‡) 100 (‡) 100 (‡) — (†)Level 200 ..................... 1 82 (1.5) 82 (1.8) 86 (1.7) 96 (0.5) 98 (1.0) 96 (1.3) 92 (1.6) 93 (2.0) 95 (1.9) 95 (1.1) — (†)Level 250 ..................... 1 40 (1.6) 43 (1.6) 44 (2.0) 65 (1.5) 76 (2.4) 69 (2.8) 61 (2.3) 66 (4.1) 68 (4.0) 66 (2.5) 67 (3.0)Level 300 ..................... 1 8 (0.9) 8 (0.7) 7 (0.8) 16 (1.0) 25 (3.1) 20 (1.8) 17 (2.5) 22 (3.7) 18 (2.2) 17 (1.7) 17 (2.0)
HispanicLevel 150 ..................... ‡ (†) 99 (0.4) 100 (‡) 100 (‡) 100 (‡) 100 (‡) 100 (‡) 99 (‡) 100 (‡) 100 (‡) — (†)Level 200 ..................... ‡ (†) 89 (2.4) 93 (1.8) 96 (0.7) 96 (2.4) 96 (2.1) 93 (2.3) 91 (3.4) 94 (1.9) 97 (‡) — (†)Level 250 ..................... ‡ (†) 53 (4.1) 62 (3.1) 68 (2.4) 71 (4.8) 75 (4.7) 69 (4.0) 63 (4.4) 65 (4.2) 68 (4.3) 64 (3.7)Level 300 ..................... ‡ (†) 13 (2.7) 17 (2.1) 21 (3.0) 23 (3.7) 27 (3.3) 27 (3.2) 20 (3.0) 20 (4.8) 24 (3.8) 20 (2.4)
Table 111. Percentage of students at or above selected reading score levels, by age, sex, and race/ethnicity: Selected years, 1971 through 2004—Continued
Selected characteristic 1971 1975 1980 1984 1988 1990 1992 1994 1996 1999 2004
1 2 3 4 5 6 7 8 9 10 11 12
DIGEST OF EDUCATION STATISTICS 2005
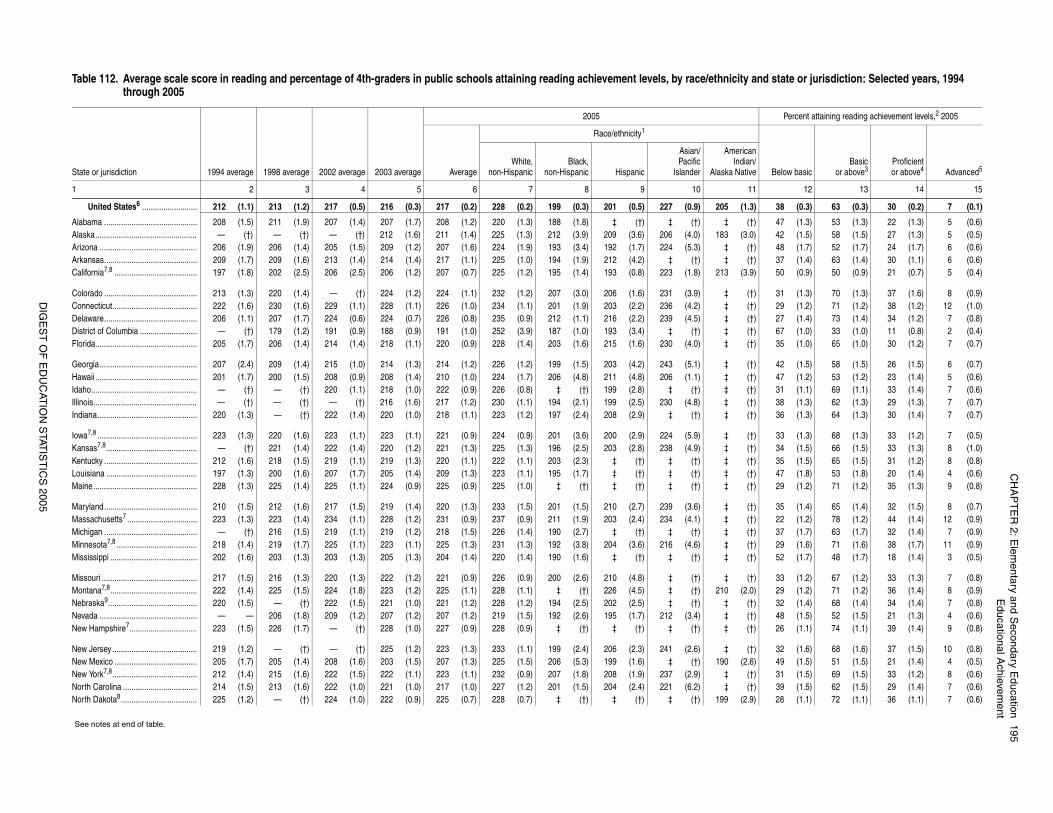
CH
AP
TE
R 2: E
lementary and S
econdary Education
195E
ducational Achievem
ent
DIG
ES
T O
F E
DU
CAT
ION
STAT
IST
ICS
2005
nd state or jurisdiction: Selected years, 1994
Percent attaining reading achievement levels,2 2005
Below basicBasic
or above3Proficientor above4 Advanced5
/
12 13 14 15
38 (0.3) 63 (0.3) 30 (0.2) 7 (0.1)
47 (1.3) 53 (1.3) 22 (1.3) 5 (0.6)42 (1.5) 58 (1.5) 27 (1.3) 5 (0.5)48 (1.7) 52 (1.7) 24 (1.7) 6 (0.6)37 (1.4) 63 (1.4) 30 (1.1) 6 (0.6)50 (0.9) 50 (0.9) 21 (0.7) 5 (0.4)
31 (1.3) 70 (1.3) 37 (1.6) 8 (0.9)29 (1.2) 71 (1.2) 38 (1.2) 12 (1.0)27 (1.4) 73 (1.4) 34 (1.2) 7 (0.8)67 (1.0) 33 (1.0) 11 (0.8) 2 (0.4)35 (1.0) 65 (1.0) 30 (1.2) 7 (0.7)
42 (1.5) 58 (1.5) 26 (1.5) 6 (0.7)47 (1.2) 53 (1.2) 23 (1.4) 5 (0.6)31 (1.1) 69 (1.1) 33 (1.4) 7 (0.6)38 (1.3) 62 (1.3) 29 (1.3) 7 (0.7)36 (1.3) 64 (1.3) 30 (1.4) 7 (0.7)
33 (1.3) 68 (1.3) 33 (1.2) 7 (0.5)34 (1.5) 66 (1.5) 33 (1.3) 8 (1.0)35 (1.5) 65 (1.5) 31 (1.2) 8 (0.8)47 (1.8) 53 (1.8) 20 (1.4) 4 (0.6)29 (1.2) 71 (1.2) 35 (1.3) 9 (0.8)
35 (1.4) 65 (1.4) 32 (1.5) 8 (0.7)22 (1.2) 78 (1.2) 44 (1.4) 12 (0.9)37 (1.7) 63 (1.7) 32 (1.4) 7 (0.9)29 (1.6) 71 (1.6) 38 (1.7) 11 (0.9)52 (1.7) 48 (1.7) 18 (1.4) 3 (0.5)
33 (1.2) 67 (1.2) 33 (1.3) 7 (0.8)29 (1.2) 71 (1.2) 36 (1.4) 8 (0.9)32 (1.4) 68 (1.4) 34 (1.4) 7 (0.8)48 (1.5) 52 (1.5) 21 (1.3) 4 (0.6)26 (1.1) 74 (1.1) 39 (1.4) 9 (0.8)
32 (1.6) 68 (1.6) 37 (1.5) 10 (0.8)49 (1.5) 51 (1.5) 21 (1.4) 4 (0.5)31 (1.5) 69 (1.5) 33 (1.2) 8 (0.6)39 (1.5) 62 (1.5) 29 (1.4) 7 (0.6)28 (1.1) 72 (1.1) 36 (1.1) 7 (0.6)
Table 112. Average scale score in reading and percentage of 4th-graders in public schools attaining reading achievement levels, by race/ethnicity athrough 2005
State or jurisdiction 1994 average 1998 average 2002 average 2003 average
2005
Average
Race/ethnicity1
White,non-Hispanic
Black,non-Hispanic Hispanic
Asian/Pacific
Islander
AmericanIndian
Alaska Native
1 2 3 4 5 6 7 8 9 10 11
United States6 .......................... 212 (1.1) 213 (1.2) 217 (0.5) 216 (0.3) 217 (0.2) 228 (0.2) 199 (0.3) 201 (0.5) 227 (0.9) 205 (1.3)
Alabama ............................................ 208 (1.5) 211 (1.9) 207 (1.4) 207 (1.7) 208 (1.2) 220 (1.3) 188 (1.8) ‡ (†) ‡ (†) ‡ (†)Alaska................................................ — (†) — (†) — (†) 212 (1.6) 211 (1.4) 225 (1.3) 212 (3.9) 209 (3.6) 206 (4.0) 183 (3.0)Arizona .............................................. 206 (1.9) 206 (1.4) 205 (1.5) 209 (1.2) 207 (1.6) 224 (1.9) 193 (3.4) 192 (1.7) 224 (5.3) ‡ (†)Arkansas............................................ 209 (1.7) 209 (1.6) 213 (1.4) 214 (1.4) 217 (1.1) 225 (1.0) 194 (1.9) 212 (4.2) ‡ (†) ‡ (†)California7,8 ....................................... 197 (1.8) 202 (2.5) 206 (2.5) 206 (1.2) 207 (0.7) 225 (1.2) 195 (1.4) 193 (0.8) 223 (1.8) 213 (3.9)
Colorado ............................................ 213 (1.3) 220 (1.4) — (†) 224 (1.2) 224 (1.1) 232 (1.2) 207 (3.0) 206 (1.6) 231 (3.9) ‡ (†)Connecticut........................................ 222 (1.6) 230 (1.6) 229 (1.1) 228 (1.1) 226 (1.0) 234 (1.1) 201 (1.9) 203 (2.2) 236 (4.2) ‡ (†)Delaware............................................ 206 (1.1) 207 (1.7) 224 (0.6) 224 (0.7) 226 (0.8) 235 (0.9) 212 (1.1) 216 (2.2) 239 (4.5) ‡ (†)District of Columbia ........................... — (†) 179 (1.2) 191 (0.9) 188 (0.9) 191 (1.0) 252 (3.9) 187 (1.0) 193 (3.4) ‡ (†) ‡ (†)Florida................................................ 205 (1.7) 206 (1.4) 214 (1.4) 218 (1.1) 220 (0.9) 228 (1.4) 203 (1.6) 215 (1.6) 230 (4.0) ‡ (†)
Georgia.............................................. 207 (2.4) 209 (1.4) 215 (1.0) 214 (1.3) 214 (1.2) 226 (1.2) 199 (1.5) 203 (4.2) 243 (5.1) ‡ (†)Hawaii ................................................ 201 (1.7) 200 (1.5) 208 (0.9) 208 (1.4) 210 (1.0) 224 (1.7) 206 (4.8) 211 (4.8) 206 (1.1) ‡ (†)Idaho.................................................. — (†) — (†) 220 (1.1) 218 (1.0) 222 (0.9) 226 (0.8) ‡ (†) 199 (2.8) ‡ (†) ‡ (†)Illinois................................................. — (†) — (†) — (†) 216 (1.6) 217 (1.2) 230 (1.1) 194 (2.1) 199 (2.5) 230 (4.8) ‡ (†)Indiana............................................... 220 (1.3) — (†) 222 (1.4) 220 (1.0) 218 (1.1) 223 (1.2) 197 (2.4) 208 (2.9) ‡ (†) ‡ (†)
Iowa7,8 ............................................... 223 (1.3) 220 (1.6) 223 (1.1) 223 (1.1) 221 (0.9) 224 (0.9) 201 (3.6) 200 (2.9) 224 (5.9) ‡ (†)Kansas7,8........................................... — (†) 221 (1.4) 222 (1.4) 220 (1.2) 221 (1.3) 225 (1.3) 196 (2.5) 203 (2.8) 238 (4.9) ‡ (†)Kentucky ............................................ 212 (1.6) 218 (1.5) 219 (1.1) 219 (1.3) 220 (1.1) 222 (1.1) 203 (2.3) ‡ (†) ‡ (†) ‡ (†)Louisiana ........................................... 197 (1.3) 200 (1.6) 207 (1.7) 205 (1.4) 209 (1.3) 223 (1.1) 195 (1.7) ‡ (†) ‡ (†) ‡ (†)Maine................................................. 228 (1.3) 225 (1.4) 225 (1.1) 224 (0.9) 225 (0.9) 225 (1.0) ‡ (†) ‡ (†) ‡ (†) ‡ (†)
Maryland............................................ 210 (1.5) 212 (1.6) 217 (1.5) 219 (1.4) 220 (1.3) 233 (1.5) 201 (1.5) 210 (2.7) 239 (3.6) ‡ (†)Massachusetts7 ................................. 223 (1.3) 223 (1.4) 234 (1.1) 228 (1.2) 231 (0.9) 237 (0.9) 211 (1.9) 203 (2.4) 234 (4.1) ‡ (†)Michigan ............................................ — (†) 216 (1.5) 219 (1.1) 219 (1.2) 218 (1.5) 226 (1.4) 190 (2.7) ‡ (†) ‡ (†) ‡ (†)Minnesota7,8 ...................................... 218 (1.4) 219 (1.7) 225 (1.1) 223 (1.1) 225 (1.3) 231 (1.3) 192 (3.8) 204 (3.6) 216 (4.6) ‡ (†)Mississippi ......................................... 202 (1.6) 203 (1.3) 203 (1.3) 205 (1.3) 204 (1.4) 220 (1.4) 190 (1.6) ‡ (†) ‡ (†) ‡ (†)
Missouri ............................................. 217 (1.5) 216 (1.3) 220 (1.3) 222 (1.2) 221 (0.9) 226 (0.9) 200 (2.6) 210 (4.8) ‡ (†) ‡ (†)Montana7,8......................................... 222 (1.4) 225 (1.5) 224 (1.8) 223 (1.2) 225 (1.1) 228 (1.1) ‡ (†) 226 (4.5) ‡ (†) 210 (2.0)Nebraska9.......................................... 220 (1.5) — (†) 222 (1.5) 221 (1.0) 221 (1.2) 228 (1.2) 194 (2.5) 202 (2.5) ‡ (†) ‡ (†)Nevada .............................................. — — 206 (1.8) 209 (1.2) 207 (1.2) 207 (1.2) 219 (1.5) 192 (2.6) 195 (1.7) 212 (3.4) ‡ (†)New Hampshire7................................ 223 (1.5) 226 (1.7) — (†) 228 (1.0) 227 (0.9) 228 (0.9) ‡ (†) ‡ (†) ‡ (†) ‡ (†)
New Jersey ........................................ 219 (1.2) — (†) — (†) 225 (1.2) 223 (1.3) 233 (1.1) 199 (2.4) 206 (2.3) 241 (2.6) ‡ (†)New Mexico ....................................... 205 (1.7) 205 (1.4) 208 (1.6) 203 (1.5) 207 (1.3) 225 (1.5) 206 (5.3) 199 (1.6) ‡ (†) 190 (2.6)New York7,8........................................ 212 (1.4) 215 (1.6) 222 (1.5) 222 (1.1) 223 (1.1) 232 (0.9) 207 (1.8) 208 (1.9) 237 (2.9) ‡ (†)North Carolina ................................... 214 (1.5) 213 (1.6) 222 (1.0) 221 (1.0) 217 (1.0) 227 (1.2) 201 (1.5) 204 (2.4) 221 (6.2) ‡ (†)North Dakota8.................................... 225 (1.2) — (†) 224 (1.0) 222 (0.9) 225 (0.7) 228 (0.7) ‡ (†) ‡ (†) ‡ (†) 199 (2.9)
See notes at end of table.
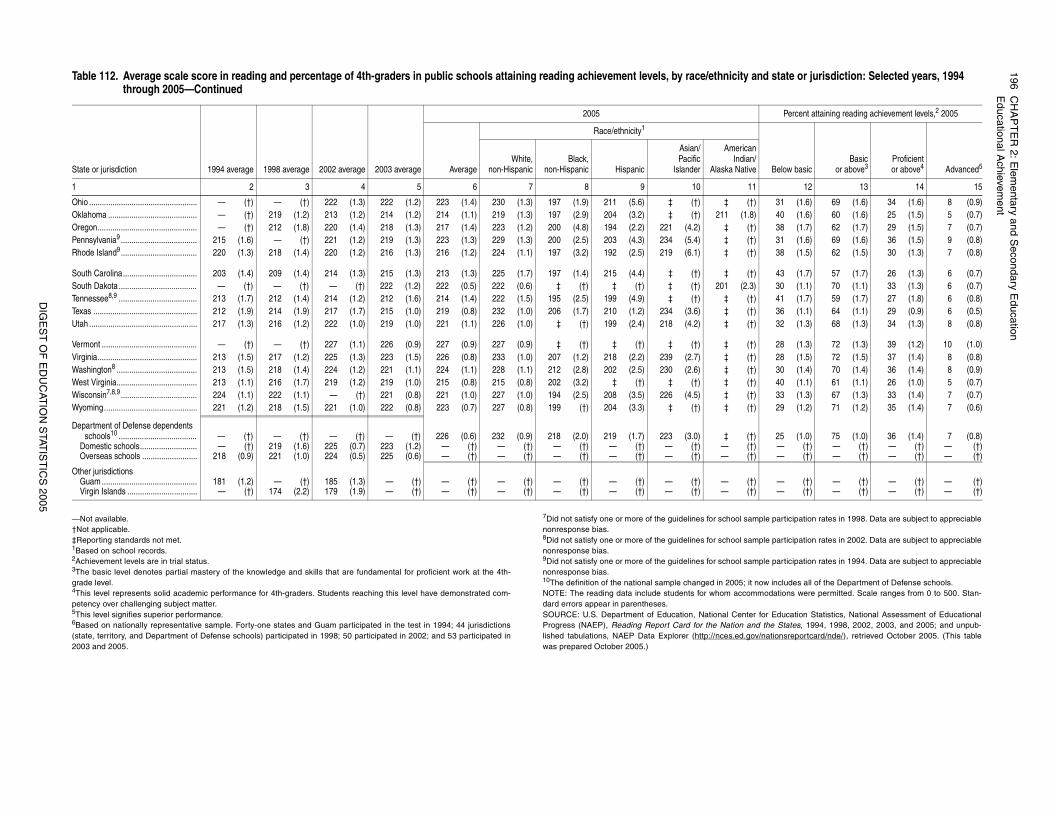
196C
HA
PT
ER
2: Elem
entary and Secondary E
ducationE
ducational Achievem
ent
DIG
ES
T O
F E
DU
CAT
ION
STAT
IST
ICS
2005
ple participation rates in 1998. Data are subject to appreciable
ple participation rates in 2002. Data are subject to appreciable
ple participation rates in 1994. Data are subject to appreciable
now includes all of the Department of Defense schools.modations were permitted. Scale ranges from 0 to 500. Stan-
for Education Statistics, National Assessment of Educationald the States, 1994, 1998, 2002, 2003, and 2005; and unpub-v/nationsreportcard/nde/), retrieved October 2005. (This table
31 (1.6) 69 (1.6) 34 (1.6) 8 (0.9)40 (1.6) 60 (1.6) 25 (1.5) 5 (0.7)38 (1.7) 62 (1.7) 29 (1.5) 7 (0.7)31 (1.6) 69 (1.6) 36 (1.5) 9 (0.8)38 (1.5) 62 (1.5) 30 (1.3) 7 (0.8)
43 (1.7) 57 (1.7) 26 (1.3) 6 (0.7)30 (1.1) 70 (1.1) 33 (1.3) 6 (0.7)41 (1.7) 59 (1.7) 27 (1.8) 6 (0.8)36 (1.1) 64 (1.1) 29 (0.9) 6 (0.5)32 (1.3) 68 (1.3) 34 (1.3) 8 (0.8)
28 (1.3) 72 (1.3) 39 (1.2) 10 (1.0)28 (1.5) 72 (1.5) 37 (1.4) 8 (0.8)30 (1.4) 70 (1.4) 36 (1.4) 8 (0.9)40 (1.1) 61 (1.1) 26 (1.0) 5 (0.7)33 (1.3) 67 (1.3) 33 (1.4) 7 (0.7)29 (1.2) 71 (1.2) 35 (1.4) 7 (0.6)
25 (1.0) 75 (1.0) 36 (1.4) 7 (0.8)— (†) — (†) — (†) — (†)— (†) — (†) — (†) — (†)
— (†) — (†) — (†) — (†)— (†) — (†) — (†) — (†)
nd state or jurisdiction: Selected years, 1994
Percent attaining reading achievement levels,2 2005
Below basicBasic
or above3Proficientor above4 Advanced5
/
12 13 14 15
—Not available.†Not applicable.‡Reporting standards not met.1Based on school records.2Achievement levels are in trial status.3The basic level denotes partial mastery of the knowledge and skills that are fundamental for proficient work at the 4th-grade level.4This level represents solid academic performance for 4th-graders. Students reaching this level have demonstrated com-petency over challenging subject matter.5This level signifies superior performance.6Based on nationally representative sample. Forty-one states and Guam participated in the test in 1994; 44 jurisdictions(state, territory, and Department of Defense schools) participated in 1998; 50 participated in 2002; and 53 participated in2003 and 2005.
7Did not satisfy one or more of the guidelines for school samnonresponse bias.8Did not satisfy one or more of the guidelines for school samnonresponse bias.9Did not satisfy one or more of the guidelines for school samnonresponse bias.10The definition of the national sample changed in 2005; it NOTE: The reading data include students for whom accomdard errors appear in parentheses.SOURCE: U.S. Department of Education, National CenterProgress (NAEP), Reading Report Card for the Nation anlished tabulations, NAEP Data Explorer (http://nces.ed.gowas prepared October 2005.)
Ohio ................................................... — (†) — (†) 222 (1.3) 222 (1.2) 223 (1.4) 230 (1.3) 197 (1.9) 211 (5.6) ‡ (†) ‡ (†)Oklahoma .......................................... — (†) 219 (1.2) 213 (1.2) 214 (1.2) 214 (1.1) 219 (1.3) 197 (2.9) 204 (3.2) ‡ (†) 211 (1.8)Oregon............................................... — (†) 212 (1.8) 220 (1.4) 218 (1.3) 217 (1.4) 223 (1.2) 200 (4.8) 194 (2.2) 221 (4.2) ‡ (†)Pennsylvania9 .................................... 215 (1.6) — (†) 221 (1.2) 219 (1.3) 223 (1.3) 229 (1.3) 200 (2.5) 203 (4.3) 234 (5.4) ‡ (†)Rhode Island9.................................... 220 (1.3) 218 (1.4) 220 (1.2) 216 (1.3) 216 (1.2) 224 (1.1) 197 (3.2) 192 (2.5) 219 (6.1) ‡ (†)
South Carolina................................... 203 (1.4) 209 (1.4) 214 (1.3) 215 (1.3) 213 (1.3) 225 (1.7) 197 (1.4) 215 (4.4) ‡ (†) ‡ (†)South Dakota ..................................... — (†) — (†) — (†) 222 (1.2) 222 (0.5) 222 (0.6) ‡ (†) ‡ (†) ‡ (†) 201 (2.3)Tennessee8,9 ..................................... 213 (1.7) 212 (1.4) 214 (1.2) 212 (1.6) 214 (1.4) 222 (1.5) 195 (2.5) 199 (4.9) ‡ (†) ‡ (†)Texas ................................................. 212 (1.9) 214 (1.9) 217 (1.7) 215 (1.0) 219 (0.8) 232 (1.0) 206 (1.7) 210 (1.2) 234 (3.6) ‡ (†)Utah ................................................... 217 (1.3) 216 (1.2) 222 (1.0) 219 (1.0) 221 (1.1) 226 (1.0) ‡ (†) 199 (2.4) 218 (4.2) ‡ (†)
Vermont ............................................. — (†) — (†) 227 (1.1) 226 (0.9) 227 (0.9) 227 (0.9) ‡ (†) ‡ (†) ‡ (†) ‡ (†)Virginia............................................... 213 (1.5) 217 (1.2) 225 (1.3) 223 (1.5) 226 (0.8) 233 (1.0) 207 (1.2) 218 (2.2) 239 (2.7) ‡ (†)Washington8 ...................................... 213 (1.5) 218 (1.4) 224 (1.2) 221 (1.1) 224 (1.1) 228 (1.1) 212 (2.8) 202 (2.5) 230 (2.6) ‡ (†)West Virginia...................................... 213 (1.1) 216 (1.7) 219 (1.2) 219 (1.0) 215 (0.8) 215 (0.8) 202 (3.2) ‡ (†) ‡ (†) ‡ (†)Wisconsin7,8,9 .................................... 224 (1.1) 222 (1.1) — (†) 221 (0.8) 221 (1.0) 227 (1.0) 194 (2.5) 208 (3.5) 226 (4.5) ‡ (†)Wyoming............................................ 221 (1.2) 218 (1.5) 221 (1.0) 222 (0.8) 223 (0.7) 227 (0.8) 199 (†) 204 (3.3) ‡ (†) ‡ (†)
Department of Defense dependents schools10 ..................................... — (†) — (†) — (†) — (†) 226 (0.6) 232 (0.9) 218 (2.0) 219 (1.7) 223 (3.0) ‡ (†)
Domestic schools........................... — (†) 219 (1.6) 225 (0.7) 223 (1.2) — (†) — (†) — (†) — (†) — (†) — (†)Overseas schools .......................... 218 (0.9) 221 (1.0) 224 (0.5) 225 (0.6) — (†) — (†) — (†) — (†) — (†) — (†)
Other jurisdictionsGuam ............................................. 181 (1.2) — (†) 185 (1.3) — (†) — (†) — (†) — (†) — (†) — (†) — (†)Virgin Islands ................................. — (†) 174 (2.2) 179 (1.9) — (†) — (†) — (†) — (†) — (†) — (†) — (†)
Table 112. Average scale score in reading and percentage of 4th-graders in public schools attaining reading achievement levels, by race/ethnicity athrough 2005—Continued
State or jurisdiction 1994 average 1998 average 2002 average 2003 average
2005
Average
Race/ethnicity1
White,non-Hispanic
Black,non-Hispanic Hispanic
Asian/Pacific
Islander
AmericanIndian
Alaska Native
1 2 3 4 5 6 7 8 9 10 11
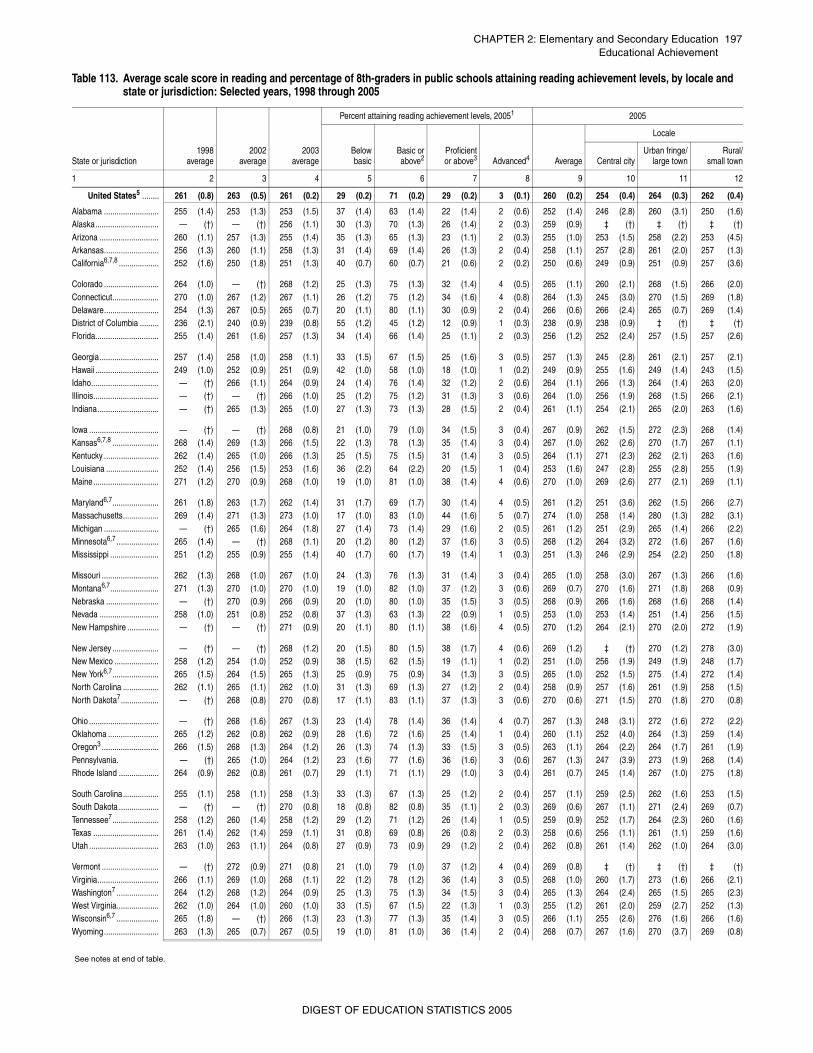
CHAPTER 2: Elementary and Secondary Education 197Educational Achievement
Table 113. Average scale score in reading and percentage of 8th-graders in public schools attaining reading achievement levels, by locale and state or jurisdiction: Selected years, 1998 through 2005
State or jurisdiction1998
average2002
average2003
average
Percent attaining reading achievement levels, 20051 2005
Belowbasic
Basic orabove2
Proficientor above3 Advanced4 Average
Locale
Central cityUrban fringe/
large townRural/
small town
1 2 3 4 5 6 7 8 9 10 11 12
United States5 ........ 261 (0.8) 263 (0.5) 261 (0.2) 29 (0.2) 71 (0.2) 29 (0.2) 3 (0.1) 260 (0.2) 254 (0.4) 264 (0.3) 262 (0.4)
Alabama .......................... 255 (1.4) 253 (1.3) 253 (1.5) 37 (1.4) 63 (1.4) 22 (1.4) 2 (0.6) 252 (1.4) 246 (2.8) 260 (3.1) 250 (1.6)Alaska.............................. — (†) — (†) 256 (1.1) 30 (1.3) 70 (1.3) 26 (1.4) 2 (0.3) 259 (0.9) ‡ (†) ‡ (†) ‡ (†)Arizona ............................ 260 (1.1) 257 (1.3) 255 (1.4) 35 (1.3) 65 (1.3) 23 (1.1) 2 (0.3) 255 (1.0) 253 (1.5) 258 (2.2) 253 (4.5)Arkansas.......................... 256 (1.3) 260 (1.1) 258 (1.3) 31 (1.4) 69 (1.4) 26 (1.3) 2 (0.4) 258 (1.1) 257 (2.8) 261 (2.0) 257 (1.3)California6,7,8 ................... 252 (1.6) 250 (1.8) 251 (1.3) 40 (0.7) 60 (0.7) 21 (0.6) 2 (0.2) 250 (0.6) 249 (0.9) 251 (0.9) 257 (3.6)
Colorado .......................... 264 (1.0) — (†) 268 (1.2) 25 (1.3) 75 (1.3) 32 (1.4) 4 (0.5) 265 (1.1) 260 (2.1) 268 (1.5) 266 (2.0)Connecticut...................... 270 (1.0) 267 (1.2) 267 (1.1) 26 (1.2) 75 (1.2) 34 (1.6) 4 (0.8) 264 (1.3) 245 (3.0) 270 (1.5) 269 (1.8)Delaware.......................... 254 (1.3) 267 (0.5) 265 (0.7) 20 (1.1) 80 (1.1) 30 (0.9) 2 (0.4) 266 (0.6) 266 (2.4) 265 (0.7) 269 (1.4)District of Columbia ......... 236 (2.1) 240 (0.9) 239 (0.8) 55 (1.2) 45 (1.2) 12 (0.9) 1 (0.3) 238 (0.9) 238 (0.9) ‡ (†) ‡ (†)Florida.............................. 255 (1.4) 261 (1.6) 257 (1.3) 34 (1.4) 66 (1.4) 25 (1.1) 2 (0.3) 256 (1.2) 252 (2.4) 257 (1.5) 257 (2.6)
Georgia............................ 257 (1.4) 258 (1.0) 258 (1.1) 33 (1.5) 67 (1.5) 25 (1.6) 3 (0.5) 257 (1.3) 245 (2.8) 261 (2.1) 257 (2.1)Hawaii .............................. 249 (1.0) 252 (0.9) 251 (0.9) 42 (1.0) 58 (1.0) 18 (1.0) 1 (0.2) 249 (0.9) 255 (1.6) 249 (1.4) 243 (1.5)Idaho................................ — (†) 266 (1.1) 264 (0.9) 24 (1.4) 76 (1.4) 32 (1.2) 2 (0.6) 264 (1.1) 266 (1.3) 264 (1.4) 263 (2.0)Illinois............................... — (†) — (†) 266 (1.0) 25 (1.2) 75 (1.2) 31 (1.3) 3 (0.6) 264 (1.0) 256 (1.9) 268 (1.5) 266 (2.1)Indiana............................. — (†) 265 (1.3) 265 (1.0) 27 (1.3) 73 (1.3) 28 (1.5) 2 (0.4) 261 (1.1) 254 (2.1) 265 (2.0) 263 (1.6)
Iowa ................................. — (†) — (†) 268 (0.8) 21 (1.0) 79 (1.0) 34 (1.5) 3 (0.4) 267 (0.9) 262 (1.5) 272 (2.3) 268 (1.4)Kansas6,7,8 ...................... 268 (1.4) 269 (1.3) 266 (1.5) 22 (1.3) 78 (1.3) 35 (1.4) 3 (0.4) 267 (1.0) 262 (2.6) 270 (1.7) 267 (1.1)Kentucky .......................... 262 (1.4) 265 (1.0) 266 (1.3) 25 (1.5) 75 (1.5) 31 (1.4) 3 (0.5) 264 (1.1) 271 (2.3) 262 (2.1) 263 (1.6)Louisiana ......................... 252 (1.4) 256 (1.5) 253 (1.6) 36 (2.2) 64 (2.2) 20 (1.5) 1 (0.4) 253 (1.6) 247 (2.8) 255 (2.8) 255 (1.9)Maine............................... 271 (1.2) 270 (0.9) 268 (1.0) 19 (1.0) 81 (1.0) 38 (1.4) 4 (0.6) 270 (1.0) 269 (2.6) 277 (2.1) 269 (1.1)
Maryland6,7...................... 261 (1.8) 263 (1.7) 262 (1.4) 31 (1.7) 69 (1.7) 30 (1.4) 4 (0.5) 261 (1.2) 251 (3.6) 262 (1.5) 266 (2.7)Massachusetts................. 269 (1.4) 271 (1.3) 273 (1.0) 17 (1.0) 83 (1.0) 44 (1.6) 5 (0.7) 274 (1.0) 258 (1.4) 280 (1.3) 282 (3.1)Michigan .......................... — (†) 265 (1.6) 264 (1.8) 27 (1.4) 73 (1.4) 29 (1.6) 2 (0.5) 261 (1.2) 251 (2.9) 265 (1.4) 266 (2.2)Minnesota6,7 .................... 265 (1.4) — (†) 268 (1.1) 20 (1.2) 80 (1.2) 37 (1.6) 3 (0.5) 268 (1.2) 264 (3.2) 272 (1.6) 267 (1.6)Mississippi ....................... 251 (1.2) 255 (0.9) 255 (1.4) 40 (1.7) 60 (1.7) 19 (1.4) 1 (0.3) 251 (1.3) 246 (2.9) 254 (2.2) 250 (1.8)
Missouri ........................... 262 (1.3) 268 (1.0) 267 (1.0) 24 (1.3) 76 (1.3) 31 (1.4) 3 (0.4) 265 (1.0) 258 (3.0) 267 (1.3) 266 (1.6)Montana6,7....................... 271 (1.3) 270 (1.0) 270 (1.0) 19 (1.0) 82 (1.0) 37 (1.2) 3 (0.6) 269 (0.7) 270 (1.6) 271 (1.8) 268 (0.9)Nebraska ......................... — (†) 270 (0.9) 266 (0.9) 20 (1.0) 80 (1.0) 35 (1.5) 3 (0.5) 268 (0.9) 266 (1.6) 268 (1.6) 268 (1.4)Nevada ............................ 258 (1.0) 251 (0.8) 252 (0.8) 37 (1.3) 63 (1.3) 22 (0.9) 1 (0.5) 253 (1.0) 253 (1.4) 251 (1.4) 256 (1.5)New Hampshire ............... — (†) — (†) 271 (0.9) 20 (1.1) 80 (1.1) 38 (1.6) 4 (0.5) 270 (1.2) 264 (2.1) 270 (2.0) 272 (1.9)
New Jersey ...................... — (†) — (†) 268 (1.2) 20 (1.5) 80 (1.5) 38 (1.7) 4 (0.6) 269 (1.2) ‡ (†) 270 (1.2) 278 (3.0)New Mexico ..................... 258 (1.2) 254 (1.0) 252 (0.9) 38 (1.5) 62 (1.5) 19 (1.1) 1 (0.2) 251 (1.0) 256 (1.9) 249 (1.9) 248 (1.7)New York6,7...................... 265 (1.5) 264 (1.5) 265 (1.3) 25 (0.9) 75 (0.9) 34 (1.3) 3 (0.5) 265 (1.0) 252 (1.5) 275 (1.4) 272 (1.4)North Carolina ................. 262 (1.1) 265 (1.1) 262 (1.0) 31 (1.3) 69 (1.3) 27 (1.2) 2 (0.4) 258 (0.9) 257 (1.6) 261 (1.9) 258 (1.5)North Dakota7.................. — (†) 268 (0.8) 270 (0.8) 17 (1.1) 83 (1.1) 37 (1.3) 3 (0.6) 270 (0.6) 271 (1.5) 270 (1.8) 270 (0.8)
Ohio ................................. — (†) 268 (1.6) 267 (1.3) 23 (1.4) 78 (1.4) 36 (1.4) 4 (0.7) 267 (1.3) 248 (3.1) 272 (1.6) 272 (2.2)Oklahoma ........................ 265 (1.2) 262 (0.8) 262 (0.9) 28 (1.6) 72 (1.6) 25 (1.4) 1 (0.4) 260 (1.1) 252 (4.0) 264 (1.3) 259 (1.4)Oregon3 ........................... 266 (1.5) 268 (1.3) 264 (1.2) 26 (1.3) 74 (1.3) 33 (1.5) 3 (0.5) 263 (1.1) 264 (2.2) 264 (1.7) 261 (1.9)Pennsylvania. — (†) 265 (1.0) 264 (1.2) 23 (1.6) 77 (1.6) 36 (1.6) 3 (0.6) 267 (1.3) 247 (3.9) 273 (1.9) 268 (1.4)Rhode Island ................... 264 (0.9) 262 (0.8) 261 (0.7) 29 (1.1) 71 (1.1) 29 (1.0) 3 (0.4) 261 (0.7) 245 (1.4) 267 (1.0) 275 (1.8)
South Carolina................. 255 (1.1) 258 (1.1) 258 (1.3) 33 (1.3) 67 (1.3) 25 (1.2) 2 (0.4) 257 (1.1) 259 (2.5) 262 (1.6) 253 (1.5)South Dakota ................... — (†) — (†) 270 (0.8) 18 (0.8) 82 (0.8) 35 (1.1) 2 (0.3) 269 (0.6) 267 (1.1) 271 (2.4) 269 (0.7)Tennessee7...................... 258 (1.2) 260 (1.4) 258 (1.2) 29 (1.2) 71 (1.2) 26 (1.4) 1 (0.5) 259 (0.9) 252 (1.7) 264 (2.3) 260 (1.6)Texas ............................... 261 (1.4) 262 (1.4) 259 (1.1) 31 (0.8) 69 (0.8) 26 (0.8) 2 (0.3) 258 (0.6) 256 (1.1) 261 (1.1) 259 (1.6)Utah ................................. 263 (1.0) 263 (1.1) 264 (0.8) 27 (0.9) 73 (0.9) 29 (1.2) 2 (0.4) 262 (0.8) 261 (1.4) 262 (1.0) 264 (3.0)
Vermont ........................... — (†) 272 (0.9) 271 (0.8) 21 (1.0) 79 (1.0) 37 (1.2) 4 (0.4) 269 (0.8) ‡ (†) ‡ (†) ‡ (†)Virginia............................. 266 (1.1) 269 (1.0) 268 (1.1) 22 (1.2) 78 (1.2) 36 (1.4) 3 (0.5) 268 (1.0) 260 (1.7) 273 (1.6) 266 (2.1)Washington7 .................... 264 (1.2) 268 (1.2) 264 (0.9) 25 (1.3) 75 (1.3) 34 (1.5) 3 (0.4) 265 (1.3) 264 (2.4) 265 (1.5) 265 (2.3)West Virginia.................... 262 (1.0) 264 (1.0) 260 (1.0) 33 (1.5) 67 (1.5) 22 (1.3) 1 (0.3) 255 (1.2) 261 (2.0) 259 (2.7) 252 (1.3)Wisconsin6,7 .................... 265 (1.8) — (†) 266 (1.3) 23 (1.3) 77 (1.3) 35 (1.4) 3 (0.5) 266 (1.1) 255 (2.6) 276 (1.6) 266 (1.6)Wyoming.......................... 263 (1.3) 265 (0.7) 267 (0.5) 19 (1.0) 81 (1.0) 36 (1.4) 2 (0.4) 268 (0.7) 267 (1.6) 270 (3.7) 269 (0.8)
See notes at end of table.
DIGEST OF EDUCATION STATISTICS 2005
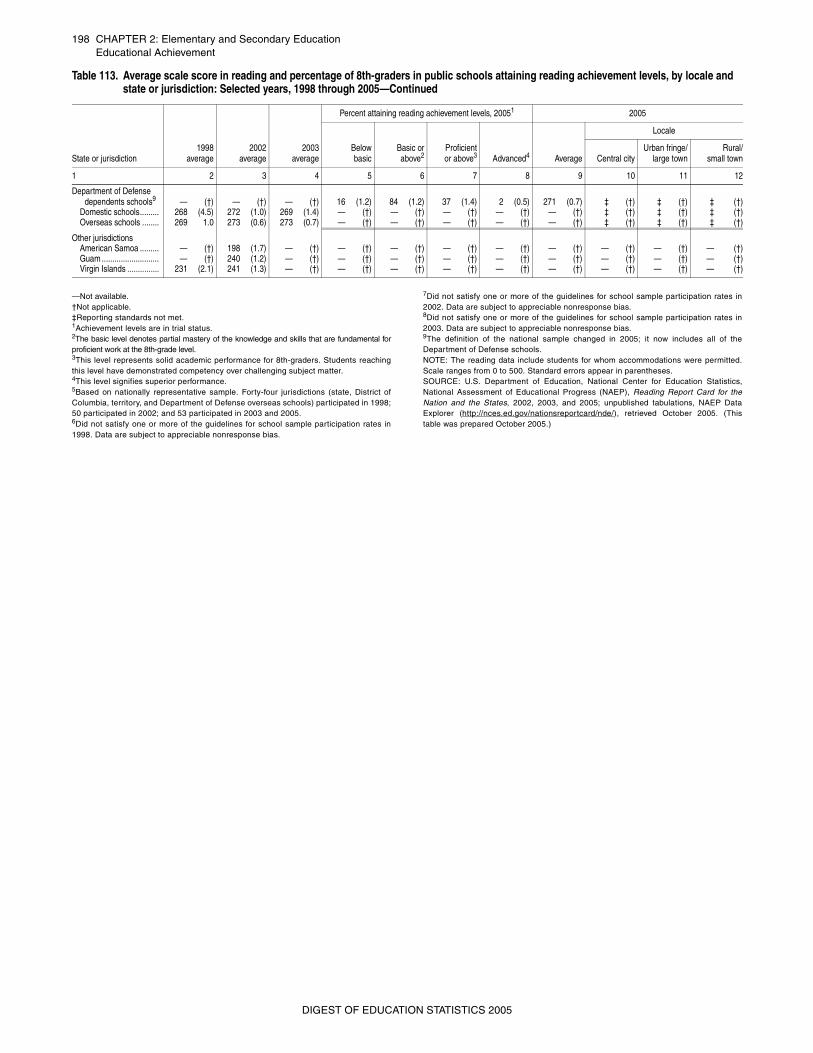
198 CHAPTER 2: Elementary and Secondary EducationEducational Achievement
—Not available.†Not applicable.‡Reporting standards not met.1Achievement levels are in trial status.2The basic level denotes partial mastery of the knowledge and skills that are fundamental forproficient work at the 8th-grade level.3This level represents solid academic performance for 8th-graders. Students reachingthis level have demonstrated competency over challenging subject matter.4This level signifies superior performance.5Based on nationally representative sample. Forty-four jurisdictions (state, District ofColumbia, territory, and Department of Defense overseas schools) participated in 1998;50 participated in 2002; and 53 participated in 2003 and 2005.6Did not satisfy one or more of the guidelines for school sample participation rates in1998. Data are subject to appreciable nonresponse bias.
7Did not satisfy one or more of the guidelines for school sample participation rates in2002. Data are subject to appreciable nonresponse bias.8Did not satisfy one or more of the guidelines for school sample participation rates in2003. Data are subject to appreciable nonresponse bias.9The definition of the national sample changed in 2005; it now includes all of theDepartment of Defense schools.NOTE: The reading data include students for whom accommodations were permitted.Scale ranges from 0 to 500. Standard errors appear in parentheses.SOURCE: U.S. Department of Education, National Center for Education Statistics,National Assessment of Educational Progress (NAEP), Reading Report Card for theNation and the States, 2002, 2003, and 2005; unpublished tabulations, NAEP DataExplorer (http://nces.ed.gov/nationsreportcard/nde/), retrieved October 2005. (Thistable was prepared October 2005.)
Department of Defense dependents schools9 — (†) — (†) — (†) 16 (1.2) 84 (1.2) 37 (1.4) 2 (0.5) 271 (0.7) ‡ (†) ‡ (†) ‡ (†)
Domestic schools......... 268 (4.5) 272 (1.0) 269 (1.4) — (†) — (†) — (†) — (†) — (†) ‡ (†) ‡ (†) ‡ (†)Overseas schools ........ 269 1.0 273 (0.6) 273 (0.7) — (†) — (†) — (†) — (†) — (†) ‡ (†) ‡ (†) ‡ (†)
Other jurisdictionsAmerican Samoa ......... — (†) 198 (1.7) — (†) — (†) — (†) — (†) — (†) — (†) — (†) — (†) — (†)Guam ........................... — (†) 240 (1.2) — (†) — (†) — (†) — (†) — (†) — (†) — (†) — (†) — (†)Virgin Islands ............... 231 (2.1) 241 (1.3) — (†) — (†) — (†) — (†) — (†) — (†) — (†) — (†) — (†)
Table 113. Average scale score in reading and percentage of 8th-graders in public schools attaining reading achievement levels, by locale and state or jurisdiction: Selected years, 1998 through 2005—Continued
State or jurisdiction1998
average2002
average2003
average
Percent attaining reading achievement levels, 20051 2005
Belowbasic
Basic orabove2
Proficientor above3 Advanced4 Average
Locale
Central cityUrban fringe/
large townRural/
small town
1 2 3 4 5 6 7 8 9 10 11 12
DIGEST OF EDUCATION STATISTICS 2005
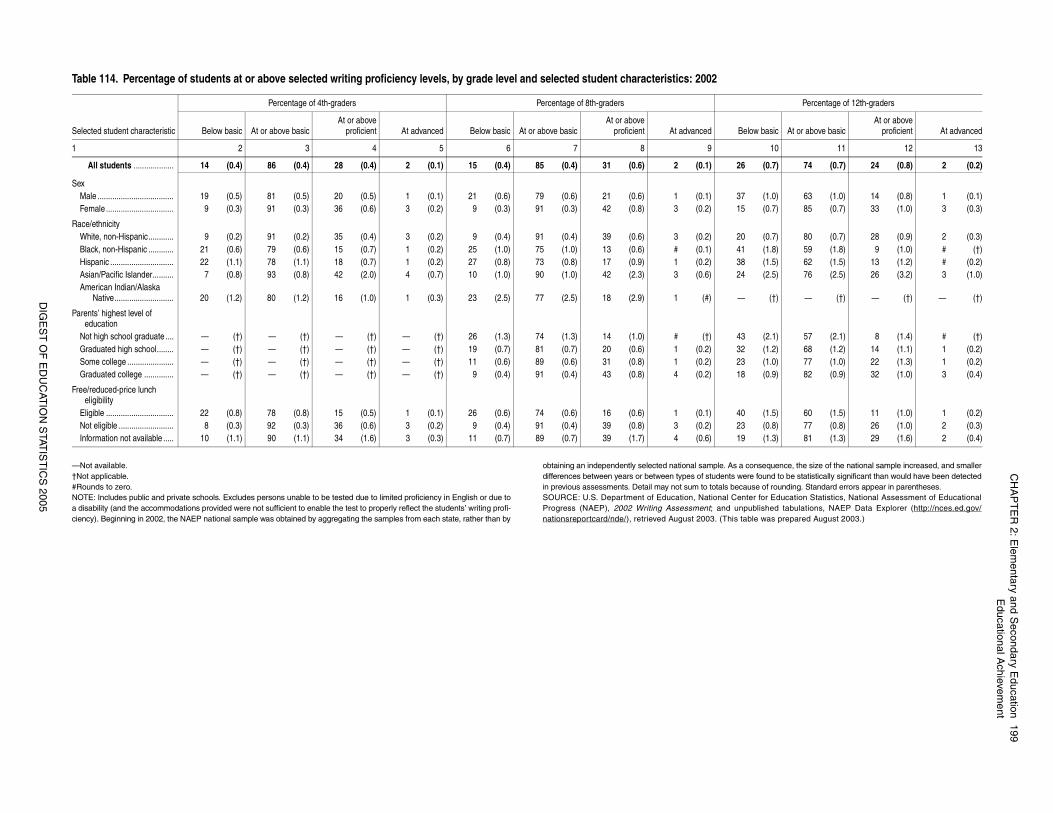
CH
AP
TE
R 2: E
lementary and S
econdary Education
199E
ducational Achievem
ent
DIG
ES
T O
F E
DU
CAT
ION
STAT
IST
ICS
2005
sequence, the size of the national sample increased, and smallerfound to be statistically significant than would have been detectede of rounding. Standard errors appear in parentheses. for Education Statistics, National Assessment of Educationallished tabulations, NAEP Data Explorer (http://nces.ed.gov/ was prepared August 2003.)
Percentage of 12th-graders
basic At or above basicAt or above
proficient At advanced
10 11 12 13
(0.7) 74 (0.7) 24 (0.8) 2 (0.2)
(1.0) 63 (1.0) 14 (0.8) 1 (0.1)(0.7) 85 (0.7) 33 (1.0) 3 (0.3)
(0.7) 80 (0.7) 28 (0.9) 2 (0.3)(1.8) 59 (1.8) 9 (1.0) # (†)(1.5) 62 (1.5) 13 (1.2) # (0.2)(2.5) 76 (2.5) 26 (3.2) 3 (1.0)
(†) — (†) — (†) — (†)
(2.1) 57 (2.1) 8 (1.4) # (†)(1.2) 68 (1.2) 14 (1.1) 1 (0.2)(1.0) 77 (1.0) 22 (1.3) 1 (0.2)(0.9) 82 (0.9) 32 (1.0) 3 (0.4)
(1.5) 60 (1.5) 11 (1.0) 1 (0.2)(0.8) 77 (0.8) 26 (1.0) 2 (0.3)(1.3) 81 (1.3) 29 (1.6) 2 (0.4)
—Not available.†Not applicable. #Rounds to zero. NOTE: Includes public and private schools. Excludes persons unable to be tested due to limited proficiency in English or due toa disability (and the accommodations provided were not sufficient to enable the test to properly reflect the students’ writing profi-ciency). Beginning in 2002, the NAEP national sample was obtained by aggregating the samples from each state, rather than by
obtaining an independently selected national sample. As a condifferences between years or between types of students were in previous assessments. Detail may not sum to totals becausSOURCE: U.S. Department of Education, National CenterProgress (NAEP), 2002 Writing Assessment; and unpubnationsreportcard/nde/), retrieved August 2003. (This table
Table 114. Percentage of students at or above selected writing proficiency levels, by grade level and selected student characteristics: 2002
Selected student characteristic
Percentage of 4th-graders Percentage of 8th-graders
Below basic At or above basicAt or above
proficient At advanced Below basic At or above basicAt or above
proficient At advanced Below
1 2 3 4 5 6 7 8 9
All students ................... 14 (0.4) 86 (0.4) 28 (0.4) 2 (0.1) 15 (0.4) 85 (0.4) 31 (0.6) 2 (0.1) 26
SexMale .................................... 19 (0.5) 81 (0.5) 20 (0.5) 1 (0.1) 21 (0.6) 79 (0.6) 21 (0.6) 1 (0.1) 37Female ................................ 9 (0.3) 91 (0.3) 36 (0.6) 3 (0.2) 9 (0.3) 91 (0.3) 42 (0.8) 3 (0.2) 15
Race/ethnicityWhite, non-Hispanic............ 9 (0.2) 91 (0.2) 35 (0.4) 3 (0.2) 9 (0.4) 91 (0.4) 39 (0.6) 3 (0.2) 20Black, non-Hispanic ............ 21 (0.6) 79 (0.6) 15 (0.7) 1 (0.2) 25 (1.0) 75 (1.0) 13 (0.6) # (0.1) 41Hispanic .............................. 22 (1.1) 78 (1.1) 18 (0.7) 1 (0.2) 27 (0.8) 73 (0.8) 17 (0.9) 1 (0.2) 38Asian/Pacific Islander.......... 7 (0.8) 93 (0.8) 42 (2.0) 4 (0.7) 10 (1.0) 90 (1.0) 42 (2.3) 3 (0.6) 24American Indian/Alaska
Native............................ 20 (1.2) 80 (1.2) 16 (1.0) 1 (0.3) 23 (2.5) 77 (2.5) 18 (2.9) 1 (#) —
Parents’ highest level of education
Not high school graduate .... — (†) — (†) — (†) — (†) 26 (1.3) 74 (1.3) 14 (1.0) # (†) 43Graduated high school........ — (†) — (†) — (†) — (†) 19 (0.7) 81 (0.7) 20 (0.6) 1 (0.2) 32Some college ...................... — (†) — (†) — (†) — (†) 11 (0.6) 89 (0.6) 31 (0.8) 1 (0.2) 23Graduated college .............. — (†) — (†) — (†) — (†) 9 (0.4) 91 (0.4) 43 (0.8) 4 (0.2) 18
Free/reduced-price lunch eligibility
Eligible ................................ 22 (0.8) 78 (0.8) 15 (0.5) 1 (0.1) 26 (0.6) 74 (0.6) 16 (0.6) 1 (0.1) 40Not eligible .......................... 8 (0.3) 92 (0.3) 36 (0.6) 3 (0.2) 9 (0.4) 91 (0.4) 39 (0.8) 3 (0.2) 23Information not available ..... 10 (1.1) 90 (1.1) 34 (1.6) 3 (0.3) 11 (0.7) 89 (0.7) 39 (1.7) 4 (0.6) 19
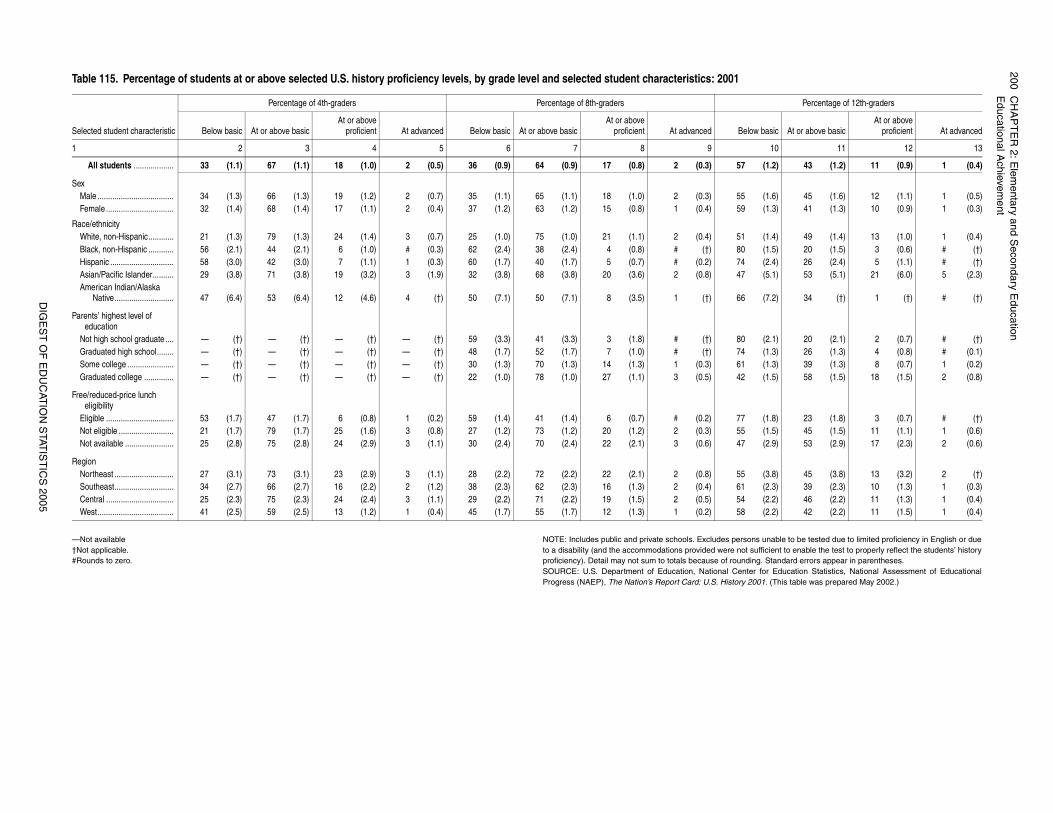
200C
HA
PT
ER
2: Elem
entary and Secondary E
ducationE
ducational Achievem
ent
DIG
ES
T O
F E
DU
CAT
ION
STAT
IST
ICS
2005
s unable to be tested due to limited proficiency in English or duefficient to enable the test to properly reflect the students’ history
g. Standard errors appear in parentheses. for Education Statistics, National Assessment of Educational01. (This table was prepared May 2002.)
Percentage of 12th-graders
basic At or above basicAt or above
proficient At advanced
10 11 12 13
(1.2) 43 (1.2) 11 (0.9) 1 (0.4)
(1.6) 45 (1.6) 12 (1.1) 1 (0.5)(1.3) 41 (1.3) 10 (0.9) 1 (0.3)
(1.4) 49 (1.4) 13 (1.0) 1 (0.4)(1.5) 20 (1.5) 3 (0.6) # (†)(2.4) 26 (2.4) 5 (1.1) # (†)(5.1) 53 (5.1) 21 (6.0) 5 (2.3)
(7.2) 34 (†) 1 (†) # (†)
(2.1) 20 (2.1) 2 (0.7) # (†)(1.3) 26 (1.3) 4 (0.8) # (0.1)(1.3) 39 (1.3) 8 (0.7) 1 (0.2)(1.5) 58 (1.5) 18 (1.5) 2 (0.8)
(1.8) 23 (1.8) 3 (0.7) # (†)(1.5) 45 (1.5) 11 (1.1) 1 (0.6)(2.9) 53 (2.9) 17 (2.3) 2 (0.6)
(3.8) 45 (3.8) 13 (3.2) 2 (†)(2.3) 39 (2.3) 10 (1.3) 1 (0.3)(2.2) 46 (2.2) 11 (1.3) 1 (0.4)(2.2) 42 (2.2) 11 (1.5) 1 (0.4)
_
—Not available †Not applicable. #Rounds to zero.
NOTE: Includes public and private schools. Excludes personto a disability (and the accommodations provided were not suproficiency). Detail may not sum to totals because of roundinSOURCE: U.S. Department of Education, National CenterProgress (NAEP), The Nation’s Report Card: U.S. History 20
Table 115. Percentage of students at or above selected U.S. history proficiency levels, by grade level and selected student characteristics: 2001
Selected student characteristic
Percentage of 4th-graders Percentage of 8th-graders
Below basic At or above basicAt or above
proficient At advanced Below basic At or above basicAt or above
proficient At advanced Below
1 2 3 4 5 6 7 8 9
All students ................... 33 (1.1) 67 (1.1) 18 (1.0) 2 (0.5) 36 (0.9) 64 (0.9) 17 (0.8) 2 (0.3) 57
SexMale .................................... 34 (1.3) 66 (1.3) 19 (1.2) 2 (0.7) 35 (1.1) 65 (1.1) 18 (1.0) 2 (0.3) 55Female ................................ 32 (1.4) 68 (1.4) 17 (1.1) 2 (0.4) 37 (1.2) 63 (1.2) 15 (0.8) 1 (0.4) 59
Race/ethnicityWhite, non-Hispanic............ 21 (1.3) 79 (1.3) 24 (1.4) 3 (0.7) 25 (1.0) 75 (1.0) 21 (1.1) 2 (0.4) 51Black, non-Hispanic ............ 56 (2.1) 44 (2.1) 6 (1.0) # (0.3) 62 (2.4) 38 (2.4) 4 (0.8) # (†) 80Hispanic .............................. 58 (3.0) 42 (3.0) 7 (1.1) 1 (0.3) 60 (1.7) 40 (1.7) 5 (0.7) # (0.2) 74Asian/Pacific Islander.......... 29 (3.8) 71 (3.8) 19 (3.2) 3 (1.9) 32 (3.8) 68 (3.8) 20 (3.6) 2 (0.8) 47American Indian/Alaska
Native............................ 47 (6.4) 53 (6.4) 12 (4.6) 4 (†) 50 (7.1) 50 (7.1) 8 (3.5) 1 (†) 66
Parents’ highest level of education
Not high school graduate .... — (†) — (†) — (†) — (†) 59 (3.3) 41 (3.3) 3 (1.8) # (†) 80Graduated high school........ — (†) — (†) — (†) — (†) 48 (1.7) 52 (1.7) 7 (1.0) # (†) 74Some college ...................... — (†) — (†) — (†) — (†) 30 (1.3) 70 (1.3) 14 (1.3) 1 (0.3) 61Graduated college .............. — (†) — (†) — (†) — (†) 22 (1.0) 78 (1.0) 27 (1.1) 3 (0.5) 42
Free/reduced-price lunch eligibility
Eligible ................................ 53 (1.7) 47 (1.7) 6 (0.8) 1 (0.2) 59 (1.4) 41 (1.4) 6 (0.7) # (0.2) 77Not eligible .......................... 21 (1.7) 79 (1.7) 25 (1.6) 3 (0.8) 27 (1.2) 73 (1.2) 20 (1.2) 2 (0.3) 55Not available ....................... 25 (2.8) 75 (2.8) 24 (2.9) 3 (1.1) 30 (2.4) 70 (2.4) 22 (2.1) 3 (0.6) 47
RegionNortheast ............................ 27 (3.1) 73 (3.1) 23 (2.9) 3 (1.1) 28 (2.2) 72 (2.2) 22 (2.1) 2 (0.8) 55Southeast............................ 34 (2.7) 66 (2.7) 16 (2.2) 2 (1.2) 38 (2.3) 62 (2.3) 16 (1.3) 2 (0.4) 61Central ................................ 25 (2.3) 75 (2.3) 24 (2.4) 3 (1.1) 29 (2.2) 71 (2.2) 19 (1.5) 2 (0.5) 54West.................................... 41 (2.5) 59 (2.5) 13 (1.2) 1 (0.4) 45 (1.7) 55 (1.7) 12 (1.3) 1 (0.2) 58
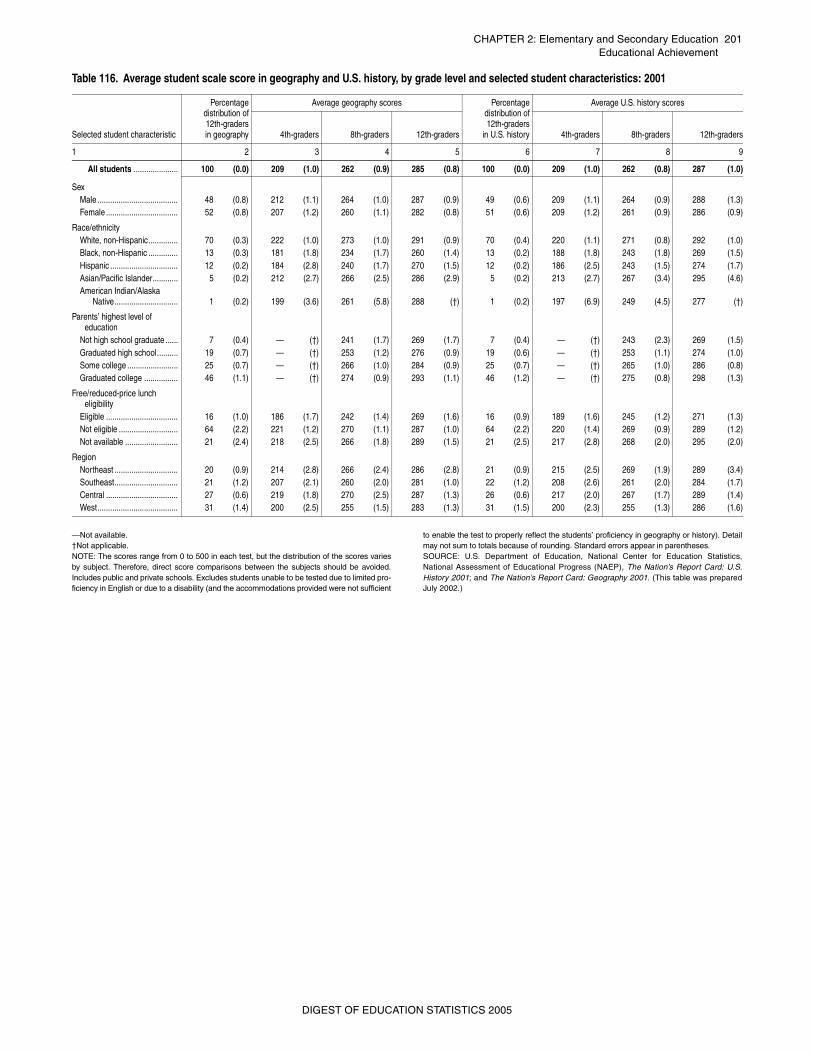
CHAPTER 2: Elementary and Secondary Education 201Educational Achievement
—Not available.†Not applicable. NOTE: The scores range from 0 to 500 in each test, but the distribution of the scores variesby subject. Therefore, direct score comparisons between the subjects should be avoided.Includes public and private schools. Excludes students unable to be tested due to limited pro-ficiency in English or due to a disability (and the accommodations provided were not sufficient
to enable the test to properly reflect the students’ proficiency in geography or history). Detailmay not sum to totals because of rounding. Standard errors appear in parentheses. SOURCE: U.S. Department of Education, National Center for Education Statistics,National Assessment of Educational Progress (NAEP), The Nation’s Report Card: U.S.History 2001; and The Nation’s Report Card: Geography 2001. (This table was preparedJuly 2002.)
Table 116. Average student scale score in geography and U.S. history, by grade level and selected student characteristics: 2001
Selected student characteristic
Percentagedistribution of12th-gradersin geography
Average geography scores Percentagedistribution of12th-graders
in U.S. history
Average U.S. history scores
4th-graders 8th-graders 12th-graders 4th-graders 8th-graders 12th-graders
1 2 3 4 5 6 7 8 9
All students ..................... 100 (0.0) 209 (1.0) 262 (0.9) 285 (0.8) 100 (0.0) 209 (1.0) 262 (0.8) 287 (1.0)
SexMale ...................................... 48 (0.8) 212 (1.1) 264 (1.0) 287 (0.9) 49 (0.6) 209 (1.1) 264 (0.9) 288 (1.3)Female .................................. 52 (0.8) 207 (1.2) 260 (1.1) 282 (0.8) 51 (0.6) 209 (1.2) 261 (0.9) 286 (0.9)
Race/ethnicityWhite, non-Hispanic.............. 70 (0.3) 222 (1.0) 273 (1.0) 291 (0.9) 70 (0.4) 220 (1.1) 271 (0.8) 292 (1.0)Black, non-Hispanic .............. 13 (0.3) 181 (1.8) 234 (1.7) 260 (1.4) 13 (0.2) 188 (1.8) 243 (1.8) 269 (1.5)Hispanic ................................ 12 (0.2) 184 (2.8) 240 (1.7) 270 (1.5) 12 (0.2) 186 (2.5) 243 (1.5) 274 (1.7)Asian/Pacific Islander............ 5 (0.2) 212 (2.7) 266 (2.5) 286 (2.9) 5 (0.2) 213 (2.7) 267 (3.4) 295 (4.6)American Indian/Alaska
Native.............................. 1 (0.2) 199 (3.6) 261 (5.8) 288 (†) 1 (0.2) 197 (6.9) 249 (4.5) 277 (†)
Parents’ highest level of education
Not high school graduate ...... 7 (0.4) — (†) 241 (1.7) 269 (1.7) 7 (0.4) — (†) 243 (2.3) 269 (1.5)Graduated high school.......... 19 (0.7) — (†) 253 (1.2) 276 (0.9) 19 (0.6) — (†) 253 (1.1) 274 (1.0)Some college ........................ 25 (0.7) — (†) 266 (1.0) 284 (0.9) 25 (0.7) — (†) 265 (1.0) 286 (0.8)Graduated college ................ 46 (1.1) — (†) 274 (0.9) 293 (1.1) 46 (1.2) — (†) 275 (0.8) 298 (1.3)
Free/reduced-price lunch eligibility
Eligible .................................. 16 (1.0) 186 (1.7) 242 (1.4) 269 (1.6) 16 (0.9) 189 (1.6) 245 (1.2) 271 (1.3)Not eligible ............................ 64 (2.2) 221 (1.2) 270 (1.1) 287 (1.0) 64 (2.2) 220 (1.4) 269 (0.9) 289 (1.2)Not available ......................... 21 (2.4) 218 (2.5) 266 (1.8) 289 (1.5) 21 (2.5) 217 (2.8) 268 (2.0) 295 (2.0)
RegionNortheast .............................. 20 (0.9) 214 (2.8) 266 (2.4) 286 (2.8) 21 (0.9) 215 (2.5) 269 (1.9) 289 (3.4)Southeast.............................. 21 (1.2) 207 (2.1) 260 (2.0) 281 (1.0) 22 (1.2) 208 (2.6) 261 (2.0) 284 (1.7)Central .................................. 27 (0.6) 219 (1.8) 270 (2.5) 287 (1.3) 26 (0.6) 217 (2.0) 267 (1.7) 289 (1.4)West...................................... 31 (1.4) 200 (2.5) 255 (1.5) 283 (1.3) 31 (1.5) 200 (2.3) 255 (1.3) 286 (1.6)
DIGEST OF EDUCATION STATISTICS 2005
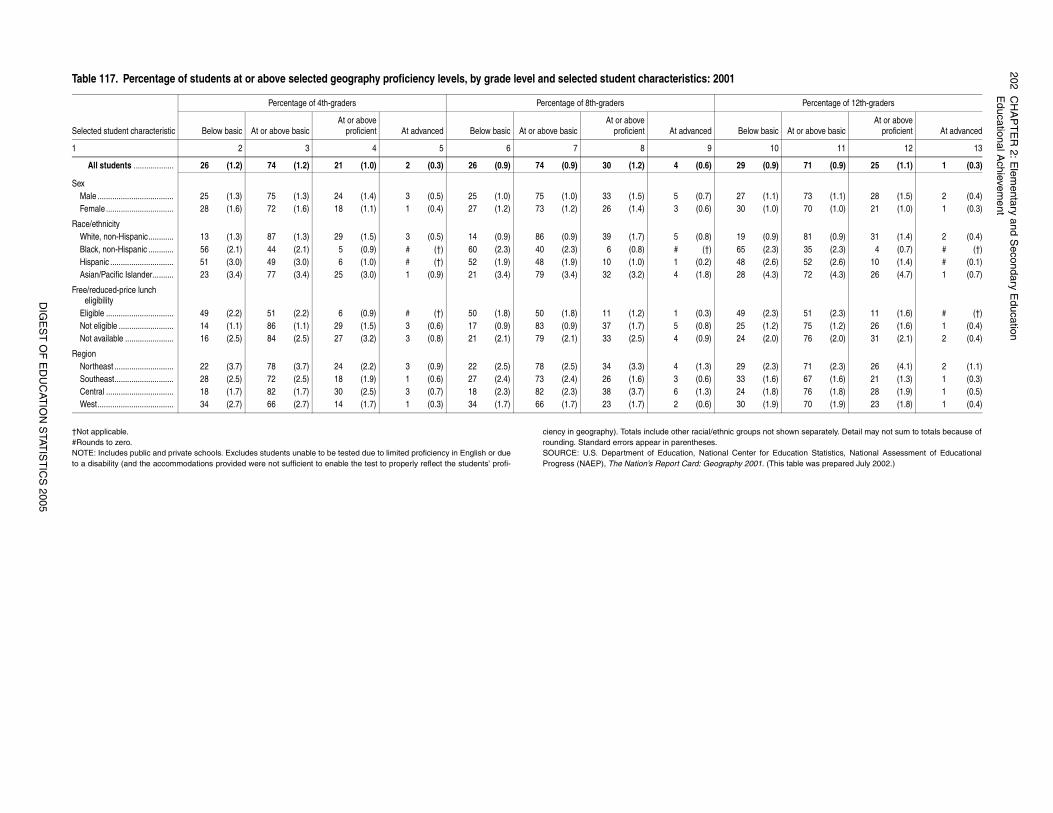
202C
HA
PT
ER
2: Elem
entary and Secondary E
ducationE
ducational Achievem
ent
DIG
ES
T O
F E
DU
CAT
ION
STAT
IST
ICS
2005
s not shown separately. Detail may not sum to totals because of
for Education Statistics, National Assessment of Educational1. (This table was prepared July 2002.)
Percentage of 12th-graders
basic At or above basicAt or above
proficient At advanced
10 11 12 13
(0.9) 71 (0.9) 25 (1.1) 1 (0.3)
(1.1) 73 (1.1) 28 (1.5) 2 (0.4)(1.0) 70 (1.0) 21 (1.0) 1 (0.3)
(0.9) 81 (0.9) 31 (1.4) 2 (0.4)(2.3) 35 (2.3) 4 (0.7) # (†)(2.6) 52 (2.6) 10 (1.4) # (0.1)(4.3) 72 (4.3) 26 (4.7) 1 (0.7)
(2.3) 51 (2.3) 11 (1.6) # (†)(1.2) 75 (1.2) 26 (1.6) 1 (0.4)(2.0) 76 (2.0) 31 (2.1) 2 (0.4)
(2.3) 71 (2.3) 26 (4.1) 2 (1.1)(1.6) 67 (1.6) 21 (1.3) 1 (0.3)(1.8) 76 (1.8) 28 (1.9) 1 (0.5)(1.9) 70 (1.9) 23 (1.8) 1 (0.4)
†Not applicable. #Rounds to zero.NOTE: Includes public and private schools. Excludes students unable to be tested due to limited proficiency in English or dueto a disability (and the accommodations provided were not sufficient to enable the test to properly reflect the students’ profi-
ciency in geography). Totals include other racial/ethnic grouprounding. Standard errors appear in parentheses.SOURCE: U.S. Department of Education, National CenterProgress (NAEP), The Nation’s Report Card: Geography 200
Table 117. Percentage of students at or above selected geography proficiency levels, by grade level and selected student characteristics: 2001
Selected student characteristic
Percentage of 4th-graders Percentage of 8th-graders
Below basic At or above basicAt or above
proficient At advanced Below basic At or above basicAt or above
proficient At advanced Below
1 2 3 4 5 6 7 8 9
All students ................... 26 (1.2) 74 (1.2) 21 (1.0) 2 (0.3) 26 (0.9) 74 (0.9) 30 (1.2) 4 (0.6) 29
Sex Male .................................... 25 (1.3) 75 (1.3) 24 (1.4) 3 (0.5) 25 (1.0) 75 (1.0) 33 (1.5) 5 (0.7) 27Female ................................ 28 (1.6) 72 (1.6) 18 (1.1) 1 (0.4) 27 (1.2) 73 (1.2) 26 (1.4) 3 (0.6) 30
Race/ethnicityWhite, non-Hispanic............ 13 (1.3) 87 (1.3) 29 (1.5) 3 (0.5) 14 (0.9) 86 (0.9) 39 (1.7) 5 (0.8) 19Black, non-Hispanic ............ 56 (2.1) 44 (2.1) 5 (0.9) # (†) 60 (2.3) 40 (2.3) 6 (0.8) # (†) 65Hispanic .............................. 51 (3.0) 49 (3.0) 6 (1.0) # (†) 52 (1.9) 48 (1.9) 10 (1.0) 1 (0.2) 48Asian/Pacific Islander.......... 23 (3.4) 77 (3.4) 25 (3.0) 1 (0.9) 21 (3.4) 79 (3.4) 32 (3.2) 4 (1.8) 28
Free/reduced-price lunch eligibility
Eligible ................................ 49 (2.2) 51 (2.2) 6 (0.9) # (†) 50 (1.8) 50 (1.8) 11 (1.2) 1 (0.3) 49Not eligible .......................... 14 (1.1) 86 (1.1) 29 (1.5) 3 (0.6) 17 (0.9) 83 (0.9) 37 (1.7) 5 (0.8) 25Not available ....................... 16 (2.5) 84 (2.5) 27 (3.2) 3 (0.8) 21 (2.1) 79 (2.1) 33 (2.5) 4 (0.9) 24
RegionNortheast ............................ 22 (3.7) 78 (3.7) 24 (2.2) 3 (0.9) 22 (2.5) 78 (2.5) 34 (3.3) 4 (1.3) 29Southeast............................ 28 (2.5) 72 (2.5) 18 (1.9) 1 (0.6) 27 (2.4) 73 (2.4) 26 (1.6) 3 (0.6) 33Central ................................ 18 (1.7) 82 (1.7) 30 (2.5) 3 (0.7) 18 (2.3) 82 (2.3) 38 (3.7) 6 (1.3) 24West.................................... 34 (2.7) 66 (2.7) 14 (1.7) 1 (0.3) 34 (1.7) 66 (1.7) 23 (1.7) 2 (0.6) 30
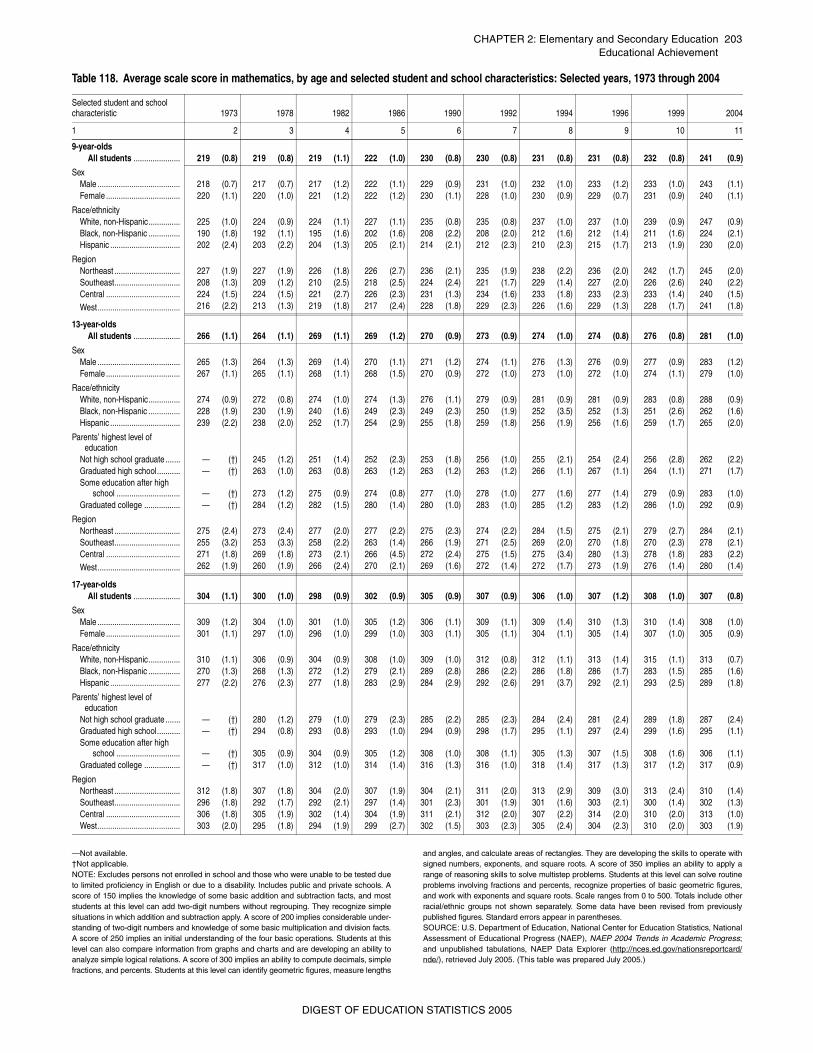
CHAPTER 2: Elementary and Secondary Education 203Educational Achievement
—Not available. †Not applicable. NOTE: Excludes persons not enrolled in school and those who were unable to be tested dueto limited proficiency in English or due to a disability. Includes public and private schools. Ascore of 150 implies the knowledge of some basic addition and subtraction facts, and moststudents at this level can add two-digit numbers without regrouping. They recognize simplesituations in which addition and subtraction apply. A score of 200 implies considerable under-standing of two-digit numbers and knowledge of some basic multiplication and division facts.A score of 250 implies an initial understanding of the four basic operations. Students at thislevel can also compare information from graphs and charts and are developing an ability toanalyze simple logical relations. A score of 300 implies an ability to compute decimals, simplefractions, and percents. Students at this level can identify geometric figures, measure lengths
and angles, and calculate areas of rectangles. They are developing the skills to operate withsigned numbers, exponents, and square roots. A score of 350 implies an ability to apply arange of reasoning skills to solve multistep problems. Students at this level can solve routineproblems involving fractions and percents, recognize properties of basic geometric figures,and work with exponents and square roots. Scale ranges from 0 to 500. Totals include otherracial/ethnic groups not shown separately. Some data have been revised from previouslypublished figures. Standard errors appear in parentheses.SOURCE: U.S. Department of Education, National Center for Education Statistics, NationalAssessment of Educational Progress (NAEP), NAEP 2004 Trends in Academic Progress;and unpublished tabulations, NAEP Data Explorer (http://nces.ed.gov/nationsreportcard/nde/), retrieved July 2005. (This table was prepared July 2005.)
Table 118. Average scale score in mathematics, by age and selected student and school characteristics: Selected years, 1973 through 2004
Selected student and school characteristic 1973 1978 1982 1986 1990 1992 1994 1996 1999 2004
1 2 3 4 5 6 7 8 9 10 11
9-year-oldsAll students ...................... 219 (0.8) 219 (0.8) 219 (1.1) 222 (1.0) 230 (0.8) 230 (0.8) 231 (0.8) 231 (0.8) 232 (0.8) 241 (0.9)
SexMale ....................................... 218 (0.7) 217 (0.7) 217 (1.2) 222 (1.1) 229 (0.9) 231 (1.0) 232 (1.0) 233 (1.2) 233 (1.0) 243 (1.1)Female ................................... 220 (1.1) 220 (1.0) 221 (1.2) 222 (1.2) 230 (1.1) 228 (1.0) 230 (0.9) 229 (0.7) 231 (0.9) 240 (1.1)
Race/ethnicityWhite, non-Hispanic............... 225 (1.0) 224 (0.9) 224 (1.1) 227 (1.1) 235 (0.8) 235 (0.8) 237 (1.0) 237 (1.0) 239 (0.9) 247 (0.9)Black, non-Hispanic ............... 190 (1.8) 192 (1.1) 195 (1.6) 202 (1.6) 208 (2.2) 208 (2.0) 212 (1.6) 212 (1.4) 211 (1.6) 224 (2.1)Hispanic ................................. 202 (2.4) 203 (2.2) 204 (1.3) 205 (2.1) 214 (2.1) 212 (2.3) 210 (2.3) 215 (1.7) 213 (1.9) 230 (2.0)
RegionNortheast ............................... 227 (1.9) 227 (1.9) 226 (1.8) 226 (2.7) 236 (2.1) 235 (1.9) 238 (2.2) 236 (2.0) 242 (1.7) 245 (2.0)Southeast............................... 208 (1.3) 209 (1.2) 210 (2.5) 218 (2.5) 224 (2.4) 221 (1.7) 229 (1.4) 227 (2.0) 226 (2.6) 240 (2.2)Central ................................... 224 (1.5) 224 (1.5) 221 (2.7) 226 (2.3) 231 (1.3) 234 (1.6) 233 (1.8) 233 (2.3) 233 (1.4) 240 (1.5)West....................................... 216 (2.2) 213 (1.3) 219 (1.8) 217 (2.4) 228 (1.8) 229 (2.3) 226 (1.6) 229 (1.3) 228 (1.7) 241 (1.8)
13-year-oldsAll students ...................... 266 (1.1) 264 (1.1) 269 (1.1) 269 (1.2) 270 (0.9) 273 (0.9) 274 (1.0) 274 (0.8) 276 (0.8) 281 (1.0)
SexMale ....................................... 265 (1.3) 264 (1.3) 269 (1.4) 270 (1.1) 271 (1.2) 274 (1.1) 276 (1.3) 276 (0.9) 277 (0.9) 283 (1.2)Female ................................... 267 (1.1) 265 (1.1) 268 (1.1) 268 (1.5) 270 (0.9) 272 (1.0) 273 (1.0) 272 (1.0) 274 (1.1) 279 (1.0)
Race/ethnicityWhite, non-Hispanic............... 274 (0.9) 272 (0.8) 274 (1.0) 274 (1.3) 276 (1.1) 279 (0.9) 281 (0.9) 281 (0.9) 283 (0.8) 288 (0.9)Black, non-Hispanic ............... 228 (1.9) 230 (1.9) 240 (1.6) 249 (2.3) 249 (2.3) 250 (1.9) 252 (3.5) 252 (1.3) 251 (2.6) 262 (1.6)Hispanic ................................. 239 (2.2) 238 (2.0) 252 (1.7) 254 (2.9) 255 (1.8) 259 (1.8) 256 (1.9) 256 (1.6) 259 (1.7) 265 (2.0)
Parents’ highest level of education
Not high school graduate ....... — (†) 245 (1.2) 251 (1.4) 252 (2.3) 253 (1.8) 256 (1.0) 255 (2.1) 254 (2.4) 256 (2.8) 262 (2.2)Graduated high school........... — (†) 263 (1.0) 263 (0.8) 263 (1.2) 263 (1.2) 263 (1.2) 266 (1.1) 267 (1.1) 264 (1.1) 271 (1.7)Some education after high
school .............................. — (†) 273 (1.2) 275 (0.9) 274 (0.8) 277 (1.0) 278 (1.0) 277 (1.6) 277 (1.4) 279 (0.9) 283 (1.0)Graduated college ................. — (†) 284 (1.2) 282 (1.5) 280 (1.4) 280 (1.0) 283 (1.0) 285 (1.2) 283 (1.2) 286 (1.0) 292 (0.9)
RegionNortheast ............................... 275 (2.4) 273 (2.4) 277 (2.0) 277 (2.2) 275 (2.3) 274 (2.2) 284 (1.5) 275 (2.1) 279 (2.7) 284 (2.1)Southeast............................... 255 (3.2) 253 (3.3) 258 (2.2) 263 (1.4) 266 (1.9) 271 (2.5) 269 (2.0) 270 (1.8) 270 (2.3) 278 (2.1)Central ................................... 271 (1.8) 269 (1.8) 273 (2.1) 266 (4.5) 272 (2.4) 275 (1.5) 275 (3.4) 280 (1.3) 278 (1.8) 283 (2.2)West....................................... 262 (1.9) 260 (1.9) 266 (2.4) 270 (2.1) 269 (1.6) 272 (1.4) 272 (1.7) 273 (1.9) 276 (1.4) 280 (1.4)
17-year-oldsAll students ...................... 304 (1.1) 300 (1.0) 298 (0.9) 302 (0.9) 305 (0.9) 307 (0.9) 306 (1.0) 307 (1.2) 308 (1.0) 307 (0.8)
SexMale ....................................... 309 (1.2) 304 (1.0) 301 (1.0) 305 (1.2) 306 (1.1) 309 (1.1) 309 (1.4) 310 (1.3) 310 (1.4) 308 (1.0)Female ................................... 301 (1.1) 297 (1.0) 296 (1.0) 299 (1.0) 303 (1.1) 305 (1.1) 304 (1.1) 305 (1.4) 307 (1.0) 305 (0.9)
Race/ethnicityWhite, non-Hispanic............... 310 (1.1) 306 (0.9) 304 (0.9) 308 (1.0) 309 (1.0) 312 (0.8) 312 (1.1) 313 (1.4) 315 (1.1) 313 (0.7)Black, non-Hispanic ............... 270 (1.3) 268 (1.3) 272 (1.2) 279 (2.1) 289 (2.8) 286 (2.2) 286 (1.8) 286 (1.7) 283 (1.5) 285 (1.6)Hispanic ................................. 277 (2.2) 276 (2.3) 277 (1.8) 283 (2.9) 284 (2.9) 292 (2.6) 291 (3.7) 292 (2.1) 293 (2.5) 289 (1.8)
Parents’ highest level of education
Not high school graduate ....... — (†) 280 (1.2) 279 (1.0) 279 (2.3) 285 (2.2) 285 (2.3) 284 (2.4) 281 (2.4) 289 (1.8) 287 (2.4)Graduated high school........... — (†) 294 (0.8) 293 (0.8) 293 (1.0) 294 (0.9) 298 (1.7) 295 (1.1) 297 (2.4) 299 (1.6) 295 (1.1)Some education after high
school .............................. — (†) 305 (0.9) 304 (0.9) 305 (1.2) 308 (1.0) 308 (1.1) 305 (1.3) 307 (1.5) 308 (1.6) 306 (1.1)Graduated college ................. — (†) 317 (1.0) 312 (1.0) 314 (1.4) 316 (1.3) 316 (1.0) 318 (1.4) 317 (1.3) 317 (1.2) 317 (0.9)
RegionNortheast ............................... 312 (1.8) 307 (1.8) 304 (2.0) 307 (1.9) 304 (2.1) 311 (2.0) 313 (2.9) 309 (3.0) 313 (2.4) 310 (1.4)Southeast............................... 296 (1.8) 292 (1.7) 292 (2.1) 297 (1.4) 301 (2.3) 301 (1.9) 301 (1.6) 303 (2.1) 300 (1.4) 302 (1.3)Central ................................... 306 (1.8) 305 (1.9) 302 (1.4) 304 (1.9) 311 (2.1) 312 (2.0) 307 (2.2) 314 (2.0) 310 (2.0) 313 (1.0)West....................................... 303 (2.0) 295 (1.8) 294 (1.9) 299 (2.7) 302 (1.5) 303 (2.3) 305 (2.4) 304 (2.3) 310 (2.0) 303 (1.9)
DIGEST OF EDUCATION STATISTICS 2005
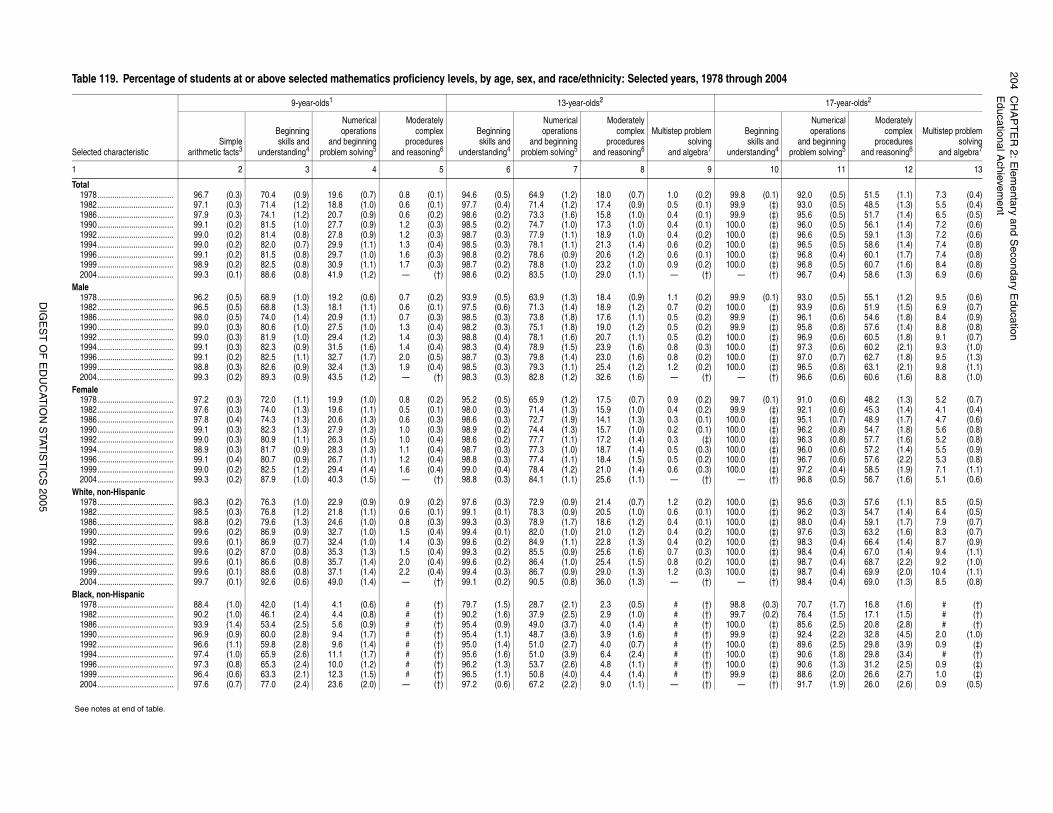
204C
HA
PT
ER
2: Elem
entary and Secondary E
ducationE
ducational Achievem
ent
DIG
ES
T O
F E
DU
CAT
ION
STAT
IST
ICS
2005
h 2004
17-year-olds2
inningills andnding4
Numericaloperations
and beginningproblem solving5
Moderatelycomplex
proceduresand reasoning6
Multistep problemsolving
and algebra7
10 11 12 13
(0.1) 92.0 (0.5) 51.5 (1.1) 7.3 (0.4)(‡) 93.0 (0.5) 48.5 (1.3) 5.5 (0.4)(‡) 95.6 (0.5) 51.7 (1.4) 6.5 (0.5)(‡) 96.0 (0.5) 56.1 (1.4) 7.2 (0.6)(‡) 96.6 (0.5) 59.1 (1.3) 7.2 (0.6)(‡) 96.5 (0.5) 58.6 (1.4) 7.4 (0.8)(‡) 96.8 (0.4) 60.1 (1.7) 7.4 (0.8)(‡) 96.8 (0.5) 60.7 (1.6) 8.4 (0.8)(†) 96.7 (0.4) 58.6 (1.3) 6.9 (0.6)
(0.1) 93.0 (0.5) 55.1 (1.2) 9.5 (0.6)(‡) 93.9 (0.6) 51.9 (1.5) 6.9 (0.7)(‡) 96.1 (0.6) 54.6 (1.8) 8.4 (0.9)(‡) 95.8 (0.8) 57.6 (1.4) 8.8 (0.8)(‡) 96.9 (0.6) 60.5 (1.8) 9.1 (0.7)(‡) 97.3 (0.6) 60.2 (2.1) 9.3 (1.0)(‡) 97.0 (0.7) 62.7 (1.8) 9.5 (1.3)(‡) 96.5 (0.8) 63.1 (2.1) 9.8 (1.1)(†) 96.6 (0.6) 60.6 (1.6) 8.8 (1.0)
(0.1) 91.0 (0.6) 48.2 (1.3) 5.2 (0.7)(‡) 92.1 (0.6) 45.3 (1.4) 4.1 (0.4)(‡) 95.1 (0.7) 48.9 (1.7) 4.7 (0.6)(‡) 96.2 (0.8) 54.7 (1.8) 5.6 (0.8)(‡) 96.3 (0.8) 57.7 (1.6) 5.2 (0.8)(‡) 96.0 (0.6) 57.2 (1.4) 5.5 (0.9)(‡) 96.7 (0.6) 57.6 (2.2) 5.3 (0.8)(‡) 97.2 (0.4) 58.5 (1.9) 7.1 (1.1)(†) 96.8 (0.5) 56.7 (1.6) 5.1 (0.6)
(‡) 95.6 (0.3) 57.6 (1.1) 8.5 (0.5)(‡) 96.2 (0.3) 54.7 (1.4) 6.4 (0.5)(‡) 98.0 (0.4) 59.1 (1.7) 7.9 (0.7)(‡) 97.6 (0.3) 63.2 (1.6) 8.3 (0.7)(‡) 98.3 (0.4) 66.4 (1.4) 8.7 (0.9)(‡) 98.4 (0.4) 67.0 (1.4) 9.4 (1.1)(‡) 98.7 (0.4) 68.7 (2.2) 9.2 (1.0)(‡) 98.7 (0.4) 69.9 (2.0) 10.4 (1.1)(†) 98.4 (0.4) 69.0 (1.3) 8.5 (0.8)
(0.3) 70.7 (1.7) 16.8 (1.6) # (†)(0.2) 76.4 (1.5) 17.1 (1.5) # (†)
(‡) 85.6 (2.5) 20.8 (2.8) # (†)(‡) 92.4 (2.2) 32.8 (4.5) 2.0 (1.0)(‡) 89.6 (2.5) 29.8 (3.9) 0.9 (‡)(‡) 90.6 (1.8) 29.8 (3.4) # (†)(‡) 90.6 (1.3) 31.2 (2.5) 0.9 (‡)(‡) 88.6 (2.0) 26.6 (2.7) 1.0 (‡)(†) 91.7 (1.9) 26.0 (2.6) 0.9 (0.5)
Table 119. Percentage of students at or above selected mathematics proficiency levels, by age, sex, and race/ethnicity: Selected years, 1978 throug
Selected characteristic
9-year-olds1 13-year-olds2
Simplearithmetic facts3
Beginningskills and
understanding4
Numericaloperations
and beginningproblem solving5
Moderatelycomplex
proceduresand reasoning6
Beginningskills and
understanding4
Numericaloperations
and beginningproblem solving5
Moderatelycomplex
proceduresand reasoning6
Multistep problemsolving
and algebra7
Begsk
understa
1 2 3 4 5 6 7 8 9
Total1978.................................... 96.7 (0.3) 70.4 (0.9) 19.6 (0.7) 0.8 (0.1) 94.6 (0.5) 64.9 (1.2) 18.0 (0.7) 1.0 (0.2) 99.81982.................................... 97.1 (0.3) 71.4 (1.2) 18.8 (1.0) 0.6 (0.1) 97.7 (0.4) 71.4 (1.2) 17.4 (0.9) 0.5 (0.1) 99.91986.................................... 97.9 (0.3) 74.1 (1.2) 20.7 (0.9) 0.6 (0.2) 98.6 (0.2) 73.3 (1.6) 15.8 (1.0) 0.4 (0.1) 99.91990.................................... 99.1 (0.2) 81.5 (1.0) 27.7 (0.9) 1.2 (0.3) 98.5 (0.2) 74.7 (1.0) 17.3 (1.0) 0.4 (0.1) 100.01992.................................... 99.0 (0.2) 81.4 (0.8) 27.8 (0.9) 1.2 (0.3) 98.7 (0.3) 77.9 (1.1) 18.9 (1.0) 0.4 (0.2) 100.01994.................................... 99.0 (0.2) 82.0 (0.7) 29.9 (1.1) 1.3 (0.4) 98.5 (0.3) 78.1 (1.1) 21.3 (1.4) 0.6 (0.2) 100.01996.................................... 99.1 (0.2) 81.5 (0.8) 29.7 (1.0) 1.6 (0.3) 98.8 (0.2) 78.6 (0.9) 20.6 (1.2) 0.6 (0.1) 100.01999.................................... 98.9 (0.2) 82.5 (0.8) 30.9 (1.1) 1.7 (0.3) 98.7 (0.2) 78.8 (1.0) 23.2 (1.0) 0.9 (0.2) 100.02004.................................... 99.3 (0.1) 88.6 (0.8) 41.9 (1.2) — (†) 98.6 (0.2) 83.5 (1.0) 29.0 (1.1) — (†) —
Male1978.................................... 96.2 (0.5) 68.9 (1.0) 19.2 (0.6) 0.7 (0.2) 93.9 (0.5) 63.9 (1.3) 18.4 (0.9) 1.1 (0.2) 99.91982.................................... 96.5 (0.5) 68.8 (1.3) 18.1 (1.1) 0.6 (0.1) 97.5 (0.6) 71.3 (1.4) 18.9 (1.2) 0.7 (0.2) 100.01986.................................... 98.0 (0.5) 74.0 (1.4) 20.9 (1.1) 0.7 (0.3) 98.5 (0.3) 73.8 (1.8) 17.6 (1.1) 0.5 (0.2) 99.91990.................................... 99.0 (0.3) 80.6 (1.0) 27.5 (1.0) 1.3 (0.4) 98.2 (0.3) 75.1 (1.8) 19.0 (1.2) 0.5 (0.2) 99.91992.................................... 99.0 (0.3) 81.9 (1.0) 29.4 (1.2) 1.4 (0.3) 98.8 (0.4) 78.1 (1.6) 20.7 (1.1) 0.5 (0.2) 100.01994.................................... 99.1 (0.3) 82.3 (0.9) 31.5 (1.6) 1.4 (0.4) 98.3 (0.4) 78.9 (1.5) 23.9 (1.6) 0.8 (0.3) 100.01996.................................... 99.1 (0.2) 82.5 (1.1) 32.7 (1.7) 2.0 (0.5) 98.7 (0.3) 79.8 (1.4) 23.0 (1.6) 0.8 (0.2) 100.01999.................................... 98.8 (0.3) 82.6 (0.9) 32.4 (1.3) 1.9 (0.4) 98.5 (0.3) 79.3 (1.1) 25.4 (1.2) 1.2 (0.2) 100.02004.................................... 99.3 (0.2) 89.3 (0.9) 43.5 (1.2) — (†) 98.3 (0.3) 82.8 (1.2) 32.6 (1.6) — (†) —
Female1978.................................... 97.2 (0.3) 72.0 (1.1) 19.9 (1.0) 0.8 (0.2) 95.2 (0.5) 65.9 (1.2) 17.5 (0.7) 0.9 (0.2) 99.71982.................................... 97.6 (0.3) 74.0 (1.3) 19.6 (1.1) 0.5 (0.1) 98.0 (0.3) 71.4 (1.3) 15.9 (1.0) 0.4 (0.2) 99.91986.................................... 97.8 (0.4) 74.3 (1.3) 20.6 (1.3) 0.6 (0.3) 98.6 (0.3) 72.7 (1.9) 14.1 (1.3) 0.3 (0.1) 100.01990.................................... 99.1 (0.3) 82.3 (1.3) 27.9 (1.3) 1.0 (0.3) 98.9 (0.2) 74.4 (1.3) 15.7 (1.0) 0.2 (0.1) 100.01992.................................... 99.0 (0.3) 80.9 (1.1) 26.3 (1.5) 1.0 (0.4) 98.6 (0.2) 77.7 (1.1) 17.2 (1.4) 0.3 (‡) 100.01994.................................... 98.9 (0.3) 81.7 (0.9) 28.3 (1.3) 1.1 (0.4) 98.7 (0.3) 77.3 (1.0) 18.7 (1.4) 0.5 (0.3) 100.01996.................................... 99.1 (0.4) 80.7 (0.9) 26.7 (1.1) 1.2 (0.4) 98.8 (0.3) 77.4 (1.1) 18.4 (1.5) 0.5 (0.2) 100.01999.................................... 99.0 (0.2) 82.5 (1.2) 29.4 (1.4) 1.6 (0.4) 99.0 (0.4) 78.4 (1.2) 21.0 (1.4) 0.6 (0.3) 100.02004.................................... 99.3 (0.2) 87.9 (1.0) 40.3 (1.5) — (†) 98.8 (0.3) 84.1 (1.1) 25.6 (1.1) — (†) —
White, non-Hispanic1978.................................... 98.3 (0.2) 76.3 (1.0) 22.9 (0.9) 0.9 (0.2) 97.6 (0.3) 72.9 (0.9) 21.4 (0.7) 1.2 (0.2) 100.01982.................................... 98.5 (0.3) 76.8 (1.2) 21.8 (1.1) 0.6 (0.1) 99.1 (0.1) 78.3 (0.9) 20.5 (1.0) 0.6 (0.1) 100.01986.................................... 98.8 (0.2) 79.6 (1.3) 24.6 (1.0) 0.8 (0.3) 99.3 (0.3) 78.9 (1.7) 18.6 (1.2) 0.4 (0.1) 100.01990.................................... 99.6 (0.2) 86.9 (0.9) 32.7 (1.0) 1.5 (0.4) 99.4 (0.1) 82.0 (1.0) 21.0 (1.2) 0.4 (0.2) 100.01992.................................... 99.6 (0.1) 86.9 (0.7) 32.4 (1.0) 1.4 (0.3) 99.6 (0.2) 84.9 (1.1) 22.8 (1.3) 0.4 (0.2) 100.01994.................................... 99.6 (0.2) 87.0 (0.8) 35.3 (1.3) 1.5 (0.4) 99.3 (0.2) 85.5 (0.9) 25.6 (1.6) 0.7 (0.3) 100.01996.................................... 99.6 (0.1) 86.6 (0.8) 35.7 (1.4) 2.0 (0.4) 99.6 (0.2) 86.4 (1.0) 25.4 (1.5) 0.8 (0.2) 100.01999.................................... 99.6 (0.1) 88.6 (0.8) 37.1 (1.4) 2.2 (0.4) 99.4 (0.3) 86.7 (0.9) 29.0 (1.3) 1.2 (0.3) 100.02004.................................... 99.7 (0.1) 92.6 (0.6) 49.0 (1.4) — (†) 99.1 (0.2) 90.5 (0.8) 36.0 (1.3) — (†) —
Black, non-Hispanic1978.................................... 88.4 (1.0) 42.0 (1.4) 4.1 (0.6) # (†) 79.7 (1.5) 28.7 (2.1) 2.3 (0.5) # (†) 98.81982.................................... 90.2 (1.0) 46.1 (2.4) 4.4 (0.8) # (†) 90.2 (1.6) 37.9 (2.5) 2.9 (1.0) # (†) 99.71986.................................... 93.9 (1.4) 53.4 (2.5) 5.6 (0.9) # (†) 95.4 (0.9) 49.0 (3.7) 4.0 (1.4) # (†) 100.01990.................................... 96.9 (0.9) 60.0 (2.8) 9.4 (1.7) # (†) 95.4 (1.1) 48.7 (3.6) 3.9 (1.6) # (†) 99.91992.................................... 96.6 (1.1) 59.8 (2.8) 9.6 (1.4) # (†) 95.0 (1.4) 51.0 (2.7) 4.0 (0.7) # (†) 100.01994.................................... 97.4 (1.0) 65.9 (2.6) 11.1 (1.7) # (†) 95.6 (1.6) 51.0 (3.9) 6.4 (2.4) # (†) 100.01996.................................... 97.3 (0.8) 65.3 (2.4) 10.0 (1.2) # (†) 96.2 (1.3) 53.7 (2.6) 4.8 (1.1) # (†) 100.01999.................................... 96.4 (0.6) 63.3 (2.1) 12.3 (1.5) # (†) 96.5 (1.1) 50.8 (4.0) 4.4 (1.4) # (†) 99.92004.................................... 97.6 (0.7) 77.0 (2.4) 23.6 (2.0) — (†) 97.2 (0.6) 67.2 (2.2) 9.0 (1.1) — (†) —
See notes at end of table.
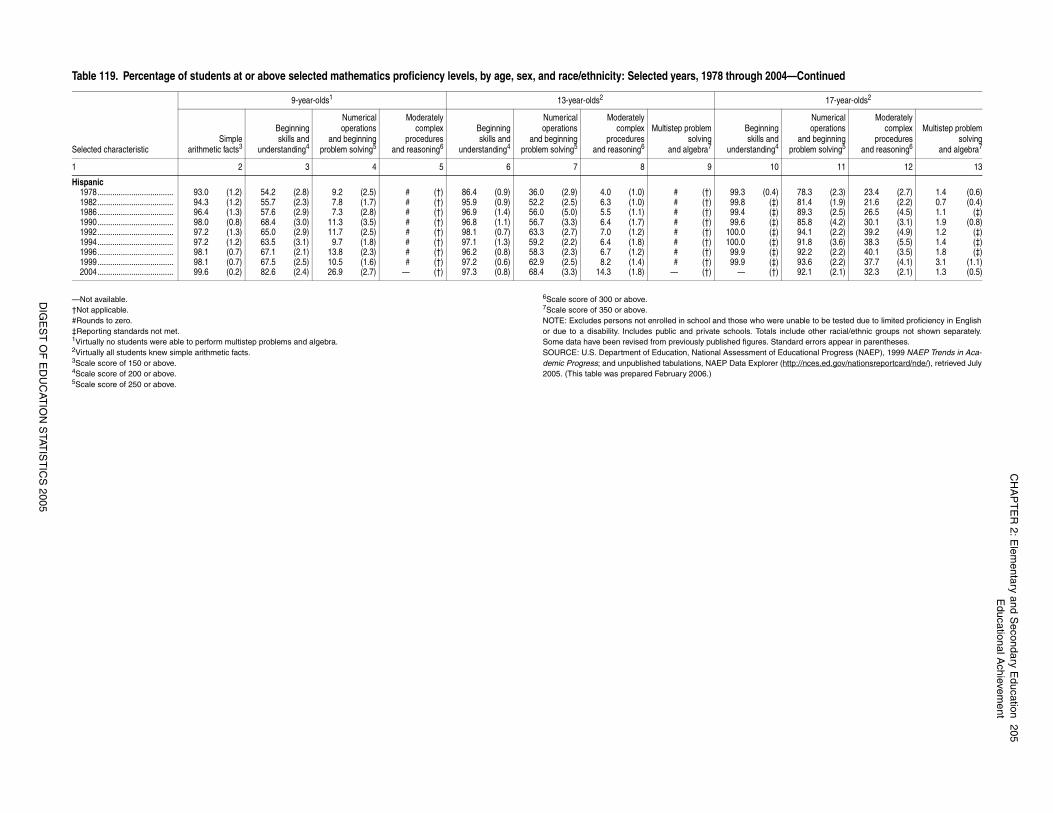
CH
AP
TE
R 2: E
lementary and S
econdary Education
205E
ducational Achievem
ent
DIG
ES
T O
F E
DU
CAT
ION
STAT
IST
ICS
2005
ho were unable to be tested due to limited proficiency in EnglishTotals include other racial/ethnic groups not shown separately.res. Standard errors appear in parentheses.ent of Educational Progress (NAEP), 1999 NAEP Trends in Aca-plorer (http://nces.ed.gov/nationsreportcard/nde/), retrieved July
(0.4) 78.3 (2.3) 23.4 (2.7) 1.4 (0.6)(‡) 81.4 (1.9) 21.6 (2.2) 0.7 (0.4)(‡) 89.3 (2.5) 26.5 (4.5) 1.1 (‡)(‡) 85.8 (4.2) 30.1 (3.1) 1.9 (0.8)(‡) 94.1 (2.2) 39.2 (4.9) 1.2 (‡)(‡) 91.8 (3.6) 38.3 (5.5) 1.4 (‡)(‡) 92.2 (2.2) 40.1 (3.5) 1.8 (‡)(‡) 93.6 (2.2) 37.7 (4.1) 3.1 (1.1)(†) 92.1 (2.1) 32.3 (2.1) 1.3 (0.5)
h 2004—Continued
17-year-olds2
inningills andnding4
Numericaloperations
and beginningproblem solving5
Moderatelycomplex
proceduresand reasoning6
Multistep problemsolving
and algebra7
10 11 12 13
—Not available. †Not applicable. #Rounds to zero. ‡Reporting standards not met.1Virtually no students were able to perform multistep problems and algebra. 2Virtually all students knew simple arithmetic facts. 3Scale score of 150 or above. 4Scale score of 200 or above. 5Scale score of 250 or above.
6Scale score of 300 or above. 7Scale score of 350 or above. NOTE: Excludes persons not enrolled in school and those wor due to a disability. Includes public and private schools. Some data have been revised from previously published figuSOURCE: U.S. Department of Education, National Assessmdemic Progress; and unpublished tabulations, NAEP Data Ex2005. (This table was prepared February 2006.)
Hispanic1978.................................... 93.0 (1.2) 54.2 (2.8) 9.2 (2.5) # (†) 86.4 (0.9) 36.0 (2.9) 4.0 (1.0) # (†) 99.31982.................................... 94.3 (1.2) 55.7 (2.3) 7.8 (1.7) # (†) 95.9 (0.9) 52.2 (2.5) 6.3 (1.0) # (†) 99.81986.................................... 96.4 (1.3) 57.6 (2.9) 7.3 (2.8) # (†) 96.9 (1.4) 56.0 (5.0) 5.5 (1.1) # (†) 99.41990.................................... 98.0 (0.8) 68.4 (3.0) 11.3 (3.5) # (†) 96.8 (1.1) 56.7 (3.3) 6.4 (1.7) # (†) 99.61992.................................... 97.2 (1.3) 65.0 (2.9) 11.7 (2.5) # (†) 98.1 (0.7) 63.3 (2.7) 7.0 (1.2) # (†) 100.01994.................................... 97.2 (1.2) 63.5 (3.1) 9.7 (1.8) # (†) 97.1 (1.3) 59.2 (2.2) 6.4 (1.8) # (†) 100.01996.................................... 98.1 (0.7) 67.1 (2.1) 13.8 (2.3) # (†) 96.2 (0.8) 58.3 (2.3) 6.7 (1.2) # (†) 99.91999.................................... 98.1 (0.7) 67.5 (2.5) 10.5 (1.6) # (†) 97.2 (0.6) 62.9 (2.5) 8.2 (1.4) # (†) 99.92004.................................... 99.6 (0.2) 82.6 (2.4) 26.9 (2.7) — (†) 97.3 (0.8) 68.4 (3.3) 14.3 (1.8) — (†) —
Table 119. Percentage of students at or above selected mathematics proficiency levels, by age, sex, and race/ethnicity: Selected years, 1978 throug
Selected characteristic
9-year-olds1 13-year-olds2
Simplearithmetic facts3
Beginningskills and
understanding4
Numericaloperations
and beginningproblem solving5
Moderatelycomplex
proceduresand reasoning6
Beginningskills and
understanding4
Numericaloperations
and beginningproblem solving5
Moderatelycomplex
proceduresand reasoning6
Multistep problemsolving
and algebra7
Begsk
understa
1 2 3 4 5 6 7 8 9
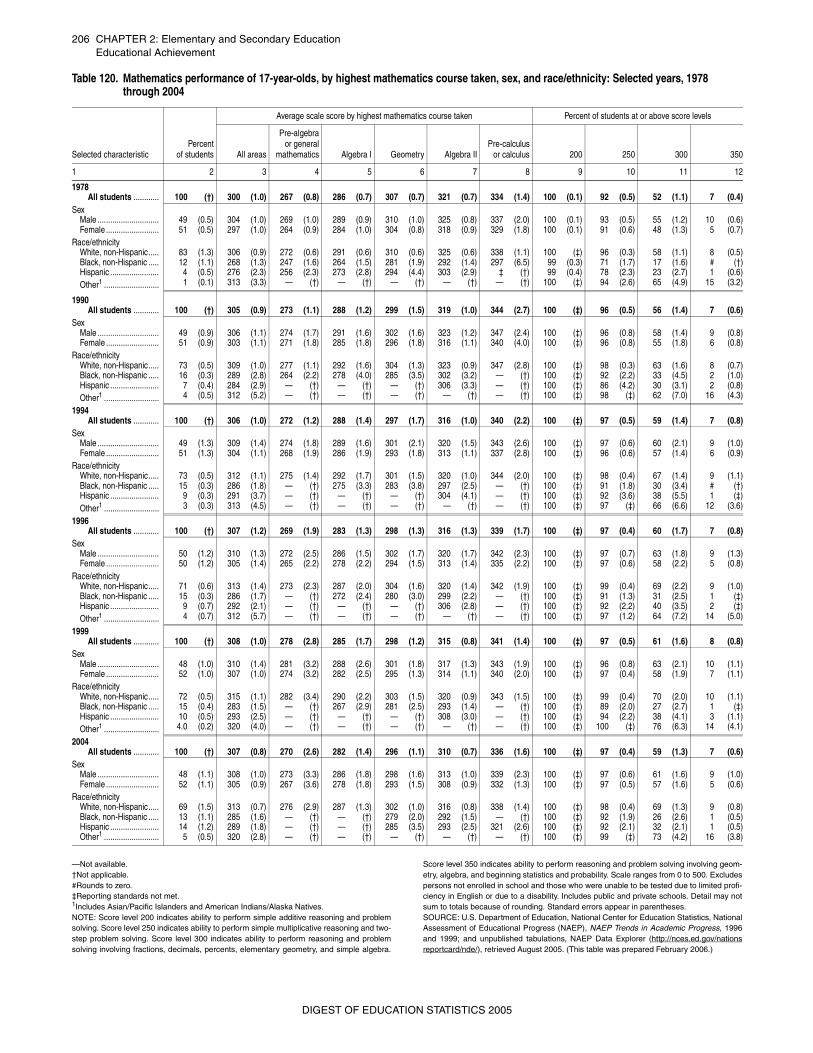
206 CHAPTER 2: Elementary and Secondary EducationEducational Achievement
—Not available. †Not applicable. #Rounds to zero.‡Reporting standards not met.1Includes Asian/Pacific Islanders and American Indians/Alaska Natives. NOTE: Score level 200 indicates ability to perform simple additive reasoning and problemsolving. Score level 250 indicates ability to perform simple multiplicative reasoning and two-step problem solving. Score level 300 indicates ability to perform reasoning and problemsolving involving fractions, decimals, percents, elementary geometry, and simple algebra.
Score level 350 indicates ability to perform reasoning and problem solving involving geom-etry, algebra, and beginning statistics and probability. Scale ranges from 0 to 500. Excludespersons not enrolled in school and those who were unable to be tested due to limited profi-ciency in English or due to a disability. Includes public and private schools. Detail may notsum to totals because of rounding. Standard errors appear in parentheses.SOURCE: U.S. Department of Education, National Center for Education Statistics, NationalAssessment of Educational Progress (NAEP), NAEP Trends in Academic Progress, 1996and 1999; and unpublished tabulations, NAEP Data Explorer (http://nces.ed.gov/nationsreportcard/nde/), retrieved August 2005. (This table was prepared February 2006.)
Table 120. Mathematics performance of 17-year-olds, by highest mathematics course taken, sex, and race/ethnicity: Selected years, 1978 through 2004
Selected characteristicPercent
of students
Average scale score by highest mathematics course taken Percent of students at or above score levels
All areas
Pre-algebraor general
mathematics Algebra I Geometry Algebra IIPre-calculus
or calculus 200 250 300 350
1 2 3 4 5 6 7 8 9 10 11 12
1978All students ............ 100 (†) 300 (1.0) 267 (0.8) 286 (0.7) 307 (0.7) 321 (0.7) 334 (1.4) 100 (0.1) 92 (0.5) 52 (1.1) 7 (0.4)
SexMale ............................. 49 (0.5) 304 (1.0) 269 (1.0) 289 (0.9) 310 (1.0) 325 (0.8) 337 (2.0) 100 (0.1) 93 (0.5) 55 (1.2) 10 (0.6)Female ......................... 51 (0.5) 297 (1.0) 264 (0.9) 284 (1.0) 304 (0.8) 318 (0.9) 329 (1.8) 100 (0.1) 91 (0.6) 48 (1.3) 5 (0.7)
Race/ethnicityWhite, non-Hispanic..... 83 (1.3) 306 (0.9) 272 (0.6) 291 (0.6) 310 (0.6) 325 (0.6) 338 (1.1) 100 (‡) 96 (0.3) 58 (1.1) 8 (0.5)Black, non-Hispanic ..... 12 (1.1) 268 (1.3) 247 (1.6) 264 (1.5) 281 (1.9) 292 (1.4) 297 (6.5) 99 (0.3) 71 (1.7) 17 (1.6) # (†)Hispanic ....................... 4 (0.5) 276 (2.3) 256 (2.3) 273 (2.8) 294 (4.4) 303 (2.9) ‡ (†) 99 (0.4) 78 (2.3) 23 (2.7) 1 (0.6)Other1 .......................... 1 (0.1) 313 (3.3) — (†) — (†) — (†) — (†) — (†) 100 (‡) 94 (2.6) 65 (4.9) 15 (3.2)
1990All students ............ 100 (†) 305 (0.9) 273 (1.1) 288 (1.2) 299 (1.5) 319 (1.0) 344 (2.7) 100 (‡) 96 (0.5) 56 (1.4) 7 (0.6)
SexMale ............................. 49 (0.9) 306 (1.1) 274 (1.7) 291 (1.6) 302 (1.6) 323 (1.2) 347 (2.4) 100 (‡) 96 (0.8) 58 (1.4) 9 (0.8)Female ......................... 51 (0.9) 303 (1.1) 271 (1.8) 285 (1.8) 296 (1.8) 316 (1.1) 340 (4.0) 100 (‡) 96 (0.8) 55 (1.8) 6 (0.8)
Race/ethnicityWhite, non-Hispanic..... 73 (0.5) 309 (1.0) 277 (1.1) 292 (1.6) 304 (1.3) 323 (0.9) 347 (2.8) 100 (‡) 98 (0.3) 63 (1.6) 8 (0.7)Black, non-Hispanic ..... 16 (0.3) 289 (2.8) 264 (2.2) 278 (4.0) 285 (3.5) 302 (3.2) — (†) 100 (‡) 92 (2.2) 33 (4.5) 2 (1.0)Hispanic ....................... 7 (0.4) 284 (2.9) — (†) — (†) — (†) 306 (3.3) — (†) 100 (‡) 86 (4.2) 30 (3.1) 2 (0.8)Other1 .......................... 4 (0.5) 312 (5.2) — (†) — (†) — (†) — (†) — (†) 100 (‡) 98 (‡) 62 (7.0) 16 (4.3)
1994All students ............ 100 (†) 306 (1.0) 272 (1.2) 288 (1.4) 297 (1.7) 316 (1.0) 340 (2.2) 100 (‡) 97 (0.5) 59 (1.4) 7 (0.8)
SexMale ............................. 49 (1.3) 309 (1.4) 274 (1.8) 289 (1.6) 301 (2.1) 320 (1.5) 343 (2.6) 100 (‡) 97 (0.6) 60 (2.1) 9 (1.0)Female ......................... 51 (1.3) 304 (1.1) 268 (1.9) 286 (1.9) 293 (1.8) 313 (1.1) 337 (2.8) 100 (‡) 96 (0.6) 57 (1.4) 6 (0.9)
Race/ethnicityWhite, non-Hispanic..... 73 (0.5) 312 (1.1) 275 (1.4) 292 (1.7) 301 (1.5) 320 (1.0) 344 (2.0) 100 (‡) 98 (0.4) 67 (1.4) 9 (1.1)Black, non-Hispanic ..... 15 (0.3) 286 (1.8) — (†) 275 (3.3) 283 (3.8) 297 (2.5) — (†) 100 (‡) 91 (1.8) 30 (3.4) # (†)Hispanic ....................... 9 (0.3) 291 (3.7) — (†) — (†) — (†) 304 (4.1) — (†) 100 (‡) 92 (3.6) 38 (5.5) 1 (‡)Other1 .......................... 3 (0.3) 313 (4.5) — (†) — (†) — (†) — (†) — (†) 100 (‡) 97 (‡) 66 (6.6) 12 (3.6)
1996All students ............ 100 (†) 307 (1.2) 269 (1.9) 283 (1.3) 298 (1.3) 316 (1.3) 339 (1.7) 100 (‡) 97 (0.4) 60 (1.7) 7 (0.8)
SexMale ............................. 50 (1.2) 310 (1.3) 272 (2.5) 286 (1.5) 302 (1.7) 320 (1.7) 342 (2.3) 100 (‡) 97 (0.7) 63 (1.8) 9 (1.3)Female ......................... 50 (1.2) 305 (1.4) 265 (2.2) 278 (2.2) 294 (1.5) 313 (1.4) 335 (2.2) 100 (‡) 97 (0.6) 58 (2.2) 5 (0.8)
Race/ethnicityWhite, non-Hispanic..... 71 (0.6) 313 (1.4) 273 (2.3) 287 (2.0) 304 (1.6) 320 (1.4) 342 (1.9) 100 (‡) 99 (0.4) 69 (2.2) 9 (1.0)Black, non-Hispanic ..... 15 (0.3) 286 (1.7) — (†) 272 (2.4) 280 (3.0) 299 (2.2) — (†) 100 (‡) 91 (1.3) 31 (2.5) 1 (‡)Hispanic ....................... 9 (0.7) 292 (2.1) — (†) — (†) — (†) 306 (2.8) — (†) 100 (‡) 92 (2.2) 40 (3.5) 2 (‡)Other1 .......................... 4 (0.7) 312 (5.7) — (†) — (†) — (†) — (†) — (†) 100 (‡) 97 (1.2) 64 (7.2) 14 (5.0)
1999All students ............ 100 (†) 308 (1.0) 278 (2.8) 285 (1.7) 298 (1.2) 315 (0.8) 341 (1.4) 100 (‡) 97 (0.5) 61 (1.6) 8 (0.8)
SexMale ............................. 48 (1.0) 310 (1.4) 281 (3.2) 288 (2.6) 301 (1.8) 317 (1.3) 343 (1.9) 100 (‡) 96 (0.8) 63 (2.1) 10 (1.1)Female ......................... 52 (1.0) 307 (1.0) 274 (3.2) 282 (2.5) 295 (1.3) 314 (1.1) 340 (2.0) 100 (‡) 97 (0.4) 58 (1.9) 7 (1.1)
Race/ethnicityWhite, non-Hispanic..... 72 (0.5) 315 (1.1) 282 (3.4) 290 (2.2) 303 (1.5) 320 (0.9) 343 (1.5) 100 (‡) 99 (0.4) 70 (2.0) 10 (1.1)Black, non-Hispanic ..... 15 (0.4) 283 (1.5) — (†) 267 (2.9) 281 (2.5) 293 (1.4) — (†) 100 (‡) 89 (2.0) 27 (2.7) 1 (‡)Hispanic ....................... 10 (0.5) 293 (2.5) — (†) — (†) — (†) 308 (3.0) — (†) 100 (‡) 94 (2.2) 38 (4.1) 3 (1.1)Other1 .......................... 4.0 (0.2) 320 (4.0) — (†) — (†) — (†) — (†) — (†) 100 (‡) 100 (‡) 76 (6.3) 14 (4.1)
2004All students ............ 100 (†) 307 (0.8) 270 (2.6) 282 (1.4) 296 (1.1) 310 (0.7) 336 (1.6) 100 (‡) 97 (0.4) 59 (1.3) 7 (0.6)
SexMale ............................. 48 (1.1) 308 (1.0) 273 (3.3) 286 (1.8) 298 (1.6) 313 (1.0) 339 (2.3) 100 (‡) 97 (0.6) 61 (1.6) 9 (1.0)Female ......................... 52 (1.1) 305 (0.9) 267 (3.6) 278 (1.8) 293 (1.5) 308 (0.9) 332 (1.3) 100 (‡) 97 (0.5) 57 (1.6) 5 (0.6)
Race/ethnicityWhite, non-Hispanic..... 69 (1.5) 313 (0.7) 276 (2.9) 287 (1.3) 302 (1.0) 316 (0.8) 338 (1.4) 100 (‡) 98 (0.4) 69 (1.3) 9 (0.8)Black, non-Hispanic ..... 13 (1.1) 285 (1.6) — (†) — (†) 279 (2.0) 292 (1.5) — (†) 100 (‡) 92 (1.9) 26 (2.6) 1 (0.5)Hispanic ....................... 14 (1.2) 289 (1.8) — (†) — (†) 285 (3.5) 293 (2.5) 321 (2.6) 100 (‡) 92 (2.1) 32 (2.1) 1 (0.5)Other1 .......................... 5 (0.5) 320 (2.8) — (†) — (†) — (†) — (†) — (†) 100 (‡) 99 (‡) 73 (4.2) 16 (3.8)
DIGEST OF EDUCATION STATISTICS 2005
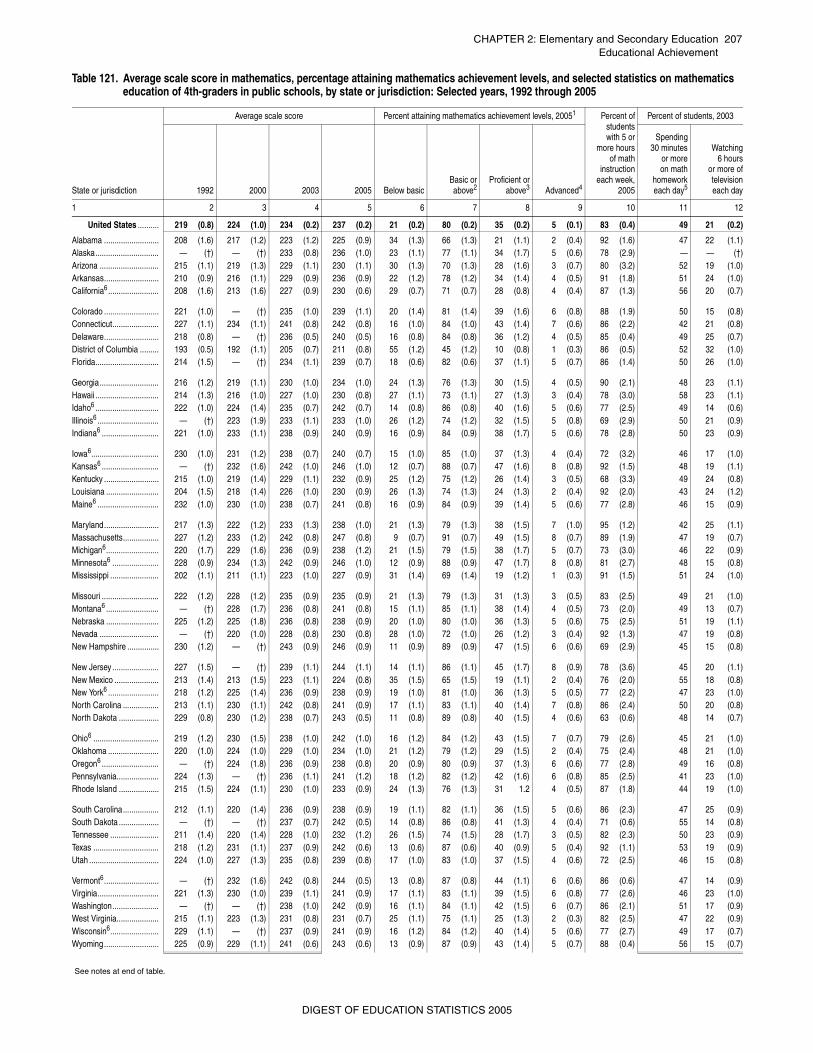
CHAPTER 2: Elementary and Secondary Education 207Educational Achievement
_
Table 121. Average scale score in mathematics, percentage attaining mathematics achievement levels, and selected statistics on mathematics education of 4th-graders in public schools, by state or jurisdiction: Selected years, 1992 through 2005
State or jurisdiction
Average scale score Percent attaining mathematics achievement levels, 20051 Percent ofstudentswith 5 or
more hoursof math
instructioneach week,
2005
Percent of students, 2003
1992 2000 2003 2005 Below basicBasic orabove2
Proficient orabove3 Advanced4
Spending30 minutes
or moreon math
homeworkeach day5
Watching6 hours
or more oftelevisioneach day
1 2 3 4 5 6 7 8 9 10 11 12
United States .......... 219 (0.8) 224 (1.0) 234 (0.2) 237 (0.2) 21 (0.2) 80 (0.2) 35 (0.2) 5 (0.1) 83 (0.4) 49 21 (0.2)
Alabama .......................... 208 (1.6) 217 (1.2) 223 (1.2) 225 (0.9) 34 (1.3) 66 (1.3) 21 (1.1) 2 (0.4) 92 (1.6) 47 22 (1.1)Alaska.............................. — (†) — (†) 233 (0.8) 236 (1.0) 23 (1.1) 77 (1.1) 34 (1.7) 5 (0.6) 78 (2.9) — — (†)Arizona ............................ 215 (1.1) 219 (1.3) 229 (1.1) 230 (1.1) 30 (1.3) 70 (1.3) 28 (1.6) 3 (0.7) 80 (3.2) 52 19 (1.0)Arkansas.......................... 210 (0.9) 216 (1.1) 229 (0.9) 236 (0.9) 22 (1.2) 78 (1.2) 34 (1.4) 4 (0.5) 91 (1.8) 51 24 (1.0)California6........................ 208 (1.6) 213 (1.6) 227 (0.9) 230 (0.6) 29 (0.7) 71 (0.7) 28 (0.8) 4 (0.4) 87 (1.3) 56 20 (0.7)
Colorado .......................... 221 (1.0) — (†) 235 (1.0) 239 (1.1) 20 (1.4) 81 (1.4) 39 (1.6) 6 (0.8) 88 (1.9) 50 15 (0.8)Connecticut...................... 227 (1.1) 234 (1.1) 241 (0.8) 242 (0.8) 16 (1.0) 84 (1.0) 43 (1.4) 7 (0.6) 86 (2.2) 42 21 (0.8)Delaware.......................... 218 (0.8) — (†) 236 (0.5) 240 (0.5) 16 (0.8) 84 (0.8) 36 (1.2) 4 (0.5) 85 (0.4) 49 25 (0.7)District of Columbia ......... 193 (0.5) 192 (1.1) 205 (0.7) 211 (0.8) 55 (1.2) 45 (1.2) 10 (0.8) 1 (0.3) 86 (0.5) 52 32 (1.0)Florida.............................. 214 (1.5) — (†) 234 (1.1) 239 (0.7) 18 (0.6) 82 (0.6) 37 (1.1) 5 (0.7) 86 (1.4) 50 26 (1.0)
Georgia............................ 216 (1.2) 219 (1.1) 230 (1.0) 234 (1.0) 24 (1.3) 76 (1.3) 30 (1.5) 4 (0.5) 90 (2.1) 48 23 (1.1)Hawaii .............................. 214 (1.3) 216 (1.0) 227 (1.0) 230 (0.8) 27 (1.1) 73 (1.1) 27 (1.3) 3 (0.4) 78 (3.0) 58 23 (1.1)Idaho6 .............................. 222 (1.0) 224 (1.4) 235 (0.7) 242 (0.7) 14 (0.8) 86 (0.8) 40 (1.6) 5 (0.6) 77 (2.5) 49 14 (0.6)Illinois6 ............................. — (†) 223 (1.9) 233 (1.1) 233 (1.0) 26 (1.2) 74 (1.2) 32 (1.5) 5 (0.8) 69 (2.9) 50 21 (0.9)Indiana6 ........................... 221 (1.0) 233 (1.1) 238 (0.9) 240 (0.9) 16 (0.9) 84 (0.9) 38 (1.7) 5 (0.6) 78 (2.8) 50 23 (0.9)
Iowa6................................ 230 (1.0) 231 (1.2) 238 (0.7) 240 (0.7) 15 (1.0) 85 (1.0) 37 (1.3) 4 (0.4) 72 (3.2) 46 17 (1.0)Kansas6 ........................... — (†) 232 (1.6) 242 (1.0) 246 (1.0) 12 (0.7) 88 (0.7) 47 (1.6) 8 (0.8) 92 (1.5) 48 19 (1.1)Kentucky .......................... 215 (1.0) 219 (1.4) 229 (1.1) 232 (0.9) 25 (1.2) 75 (1.2) 26 (1.4) 3 (0.5) 68 (3.3) 49 24 (0.8)Louisiana ......................... 204 (1.5) 218 (1.4) 226 (1.0) 230 (0.9) 26 (1.3) 74 (1.3) 24 (1.3) 2 (0.4) 92 (2.0) 43 24 (1.2)Maine6 ............................. 232 (1.0) 230 (1.0) 238 (0.7) 241 (0.8) 16 (0.9) 84 (0.9) 39 (1.4) 5 (0.6) 77 (2.8) 46 15 (0.9)
Maryland.......................... 217 (1.3) 222 (1.2) 233 (1.3) 238 (1.0) 21 (1.3) 79 (1.3) 38 (1.5) 7 (1.0) 95 (1.2) 42 25 (1.1)Massachusetts................. 227 (1.2) 233 (1.2) 242 (0.8) 247 (0.8) 9 (0.7) 91 (0.7) 49 (1.5) 8 (0.7) 89 (1.9) 47 19 (0.7)Michigan6......................... 220 (1.7) 229 (1.6) 236 (0.9) 238 (1.2) 21 (1.5) 79 (1.5) 38 (1.7) 5 (0.7) 73 (3.0) 46 22 (0.9)Minnesota6 ...................... 228 (0.9) 234 (1.3) 242 (0.9) 246 (1.0) 12 (0.9) 88 (0.9) 47 (1.7) 8 (0.8) 81 (2.7) 48 15 (0.8)Mississippi ....................... 202 (1.1) 211 (1.1) 223 (1.0) 227 (0.9) 31 (1.4) 69 (1.4) 19 (1.2) 1 (0.3) 91 (1.5) 51 24 (1.0)
Missouri ........................... 222 (1.2) 228 (1.2) 235 (0.9) 235 (0.9) 21 (1.3) 79 (1.3) 31 (1.3) 3 (0.5) 83 (2.5) 49 21 (1.0)Montana6 ......................... — (†) 228 (1.7) 236 (0.8) 241 (0.8) 15 (1.1) 85 (1.1) 38 (1.4) 4 (0.5) 73 (2.0) 49 13 (0.7)Nebraska ......................... 225 (1.2) 225 (1.8) 236 (0.8) 238 (0.9) 20 (1.0) 80 (1.0) 36 (1.3) 5 (0.6) 75 (2.5) 51 19 (1.1)Nevada ............................ — (†) 220 (1.0) 228 (0.8) 230 (0.8) 28 (1.0) 72 (1.0) 26 (1.2) 3 (0.4) 92 (1.3) 47 19 (0.8)New Hampshire ............... 230 (1.2) — (†) 243 (0.9) 246 (0.9) 11 (0.9) 89 (0.9) 47 (1.5) 6 (0.6) 69 (2.9) 45 15 (0.8)
New Jersey ...................... 227 (1.5) — (†) 239 (1.1) 244 (1.1) 14 (1.1) 86 (1.1) 45 (1.7) 8 (0.9) 78 (3.6) 45 20 (1.1)New Mexico ..................... 213 (1.4) 213 (1.5) 223 (1.1) 224 (0.8) 35 (1.5) 65 (1.5) 19 (1.1) 2 (0.4) 76 (2.0) 55 18 (0.8)New York6 ........................ 218 (1.2) 225 (1.4) 236 (0.9) 238 (0.9) 19 (1.0) 81 (1.0) 36 (1.3) 5 (0.5) 77 (2.2) 47 23 (1.0)North Carolina ................. 213 (1.1) 230 (1.1) 242 (0.8) 241 (0.9) 17 (1.1) 83 (1.1) 40 (1.4) 7 (0.8) 86 (2.4) 50 20 (0.8)North Dakota ................... 229 (0.8) 230 (1.2) 238 (0.7) 243 (0.5) 11 (0.8) 89 (0.8) 40 (1.5) 4 (0.6) 63 (0.6) 48 14 (0.7)
Ohio6 ............................... 219 (1.2) 230 (1.5) 238 (1.0) 242 (1.0) 16 (1.2) 84 (1.2) 43 (1.5) 7 (0.7) 79 (2.6) 45 21 (1.0)Oklahoma ........................ 220 (1.0) 224 (1.0) 229 (1.0) 234 (1.0) 21 (1.2) 79 (1.2) 29 (1.5) 2 (0.4) 75 (2.4) 48 21 (1.0)Oregon6 ........................... — (†) 224 (1.8) 236 (0.9) 238 (0.8) 20 (0.9) 80 (0.9) 37 (1.3) 6 (0.6) 77 (2.8) 49 16 (0.8)Pennsylvania.................... 224 (1.3) — (†) 236 (1.1) 241 (1.2) 18 (1.2) 82 (1.2) 42 (1.6) 6 (0.8) 85 (2.5) 41 23 (1.0)Rhode Island ................... 215 (1.5) 224 (1.1) 230 (1.0) 233 (0.9) 24 (1.3) 76 (1.3) 31 1.2 4 (0.5) 87 (1.8) 44 19 (1.0)
South Carolina................. 212 (1.1) 220 (1.4) 236 (0.9) 238 (0.9) 19 (1.1) 82 (1.1) 36 (1.5) 5 (0.6) 86 (2.3) 47 25 (0.9)South Dakota ................... — (†) — (†) 237 (0.7) 242 (0.5) 14 (0.8) 86 (0.8) 41 (1.3) 4 (0.4) 71 (0.6) 55 14 (0.8)Tennessee ....................... 211 (1.4) 220 (1.4) 228 (1.0) 232 (1.2) 26 (1.5) 74 (1.5) 28 (1.7) 3 (0.5) 82 (2.3) 50 23 (0.9)Texas ............................... 218 (1.2) 231 (1.1) 237 (0.9) 242 (0.6) 13 (0.6) 87 (0.6) 40 (0.9) 5 (0.4) 92 (1.1) 53 19 (0.9)Utah ................................. 224 (1.0) 227 (1.3) 235 (0.8) 239 (0.8) 17 (1.0) 83 (1.0) 37 (1.5) 4 (0.6) 72 (2.5) 46 15 (0.8)
Vermont6.......................... — (†) 232 (1.6) 242 (0.8) 244 (0.5) 13 (0.8) 87 (0.8) 44 (1.1) 6 (0.6) 86 (0.6) 47 14 (0.9)Virginia............................. 221 (1.3) 230 (1.0) 239 (1.1) 241 (0.9) 17 (1.1) 83 (1.1) 39 (1.5) 6 (0.8) 77 (2.6) 46 23 (1.0)Washington...................... — (†) — (†) 238 (1.0) 242 (0.9) 16 (1.1) 84 (1.1) 42 (1.5) 6 (0.7) 86 (2.1) 51 17 (0.9)West Virginia.................... 215 (1.1) 223 (1.3) 231 (0.8) 231 (0.7) 25 (1.1) 75 (1.1) 25 (1.3) 2 (0.3) 82 (2.5) 47 22 (0.9)Wisconsin6....................... 229 (1.1) — (†) 237 (0.9) 241 (0.9) 16 (1.2) 84 (1.2) 40 (1.4) 5 (0.6) 77 (2.7) 49 17 (0.7)Wyoming.......................... 225 (0.9) 229 (1.1) 241 (0.6) 243 (0.6) 13 (0.9) 87 (0.9) 43 (1.4) 5 (0.7) 88 (0.4) 56 15 (0.7)
See notes at end of table.
DIGEST OF EDUCATION STATISTICS 2005
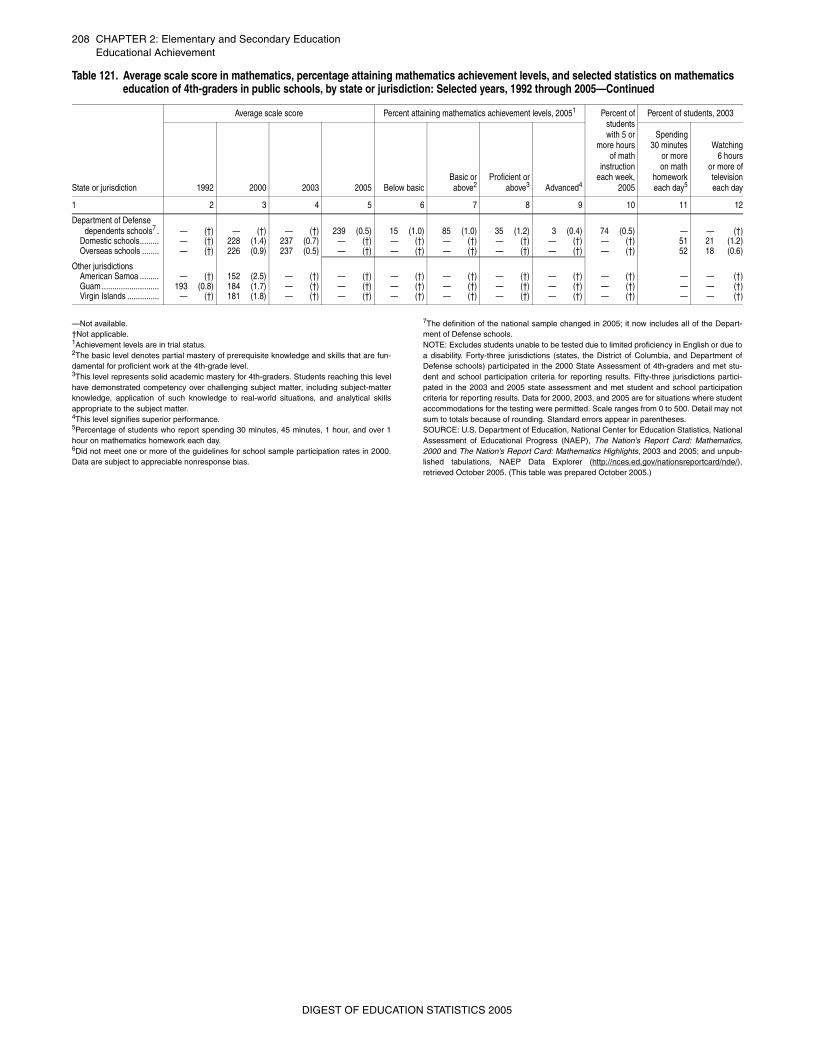
208 CHAPTER 2: Elementary and Secondary EducationEducational Achievement
—Not available. †Not applicable. 1Achievement levels are in trial status. 2The basic level denotes partial mastery of prerequisite knowledge and skills that are fun-damental for proficient work at the 4th-grade level.3This level represents solid academic mastery for 4th-graders. Students reaching this levelhave demonstrated competency over challenging subject matter, including subject-matterknowledge, application of such knowledge to real-world situations, and analytical skillsappropriate to the subject matter.4This level signifies superior performance. 5Percentage of students who report spending 30 minutes, 45 minutes, 1 hour, and over 1hour on mathematics homework each day.6Did not meet one or more of the guidelines for school sample participation rates in 2000.Data are subject to appreciable nonresponse bias.
7The definition of the national sample changed in 2005; it now includes all of the Depart-ment of Defense schools.NOTE: Excludes students unable to be tested due to limited proficiency in English or due toa disability. Forty-three jurisdictions (states, the District of Columbia, and Department ofDefense schools) participated in the 2000 State Assessment of 4th-graders and met stu-dent and school participation criteria for reporting results. Fifty-three jurisdictions partici-pated in the 2003 and 2005 state assessment and met student and school participationcriteria for reporting results. Data for 2000, 2003, and 2005 are for situations where studentaccommodations for the testing were permitted. Scale ranges from 0 to 500. Detail may notsum to totals because of rounding. Standard errors appear in parentheses.SOURCE: U.S. Department of Education, National Center for Education Statistics, NationalAssessment of Educational Progress (NAEP), The Nation's Report Card: Mathematics,2000 and The Nation's Report Card: Mathematics Highlights, 2003 and 2005; and unpub-lished tabulations, NAEP Data Explorer (http://nces.ed.gov/nationsreportcard/nde/),retrieved October 2005. (This table was prepared October 2005.)
Department of Defense dependents schools7 . — (†) — (†) — (†) 239 (0.5) 15 (1.0) 85 (1.0) 35 (1.2) 3 (0.4) 74 (0.5) — — (†)
Domestic schools......... — (†) 228 (1.4) 237 (0.7) — (†) — (†) — (†) — (†) — (†) — (†) 51 21 (1.2)Overseas schools ........ — (†) 226 (0.9) 237 (0.5) — (†) — (†) — (†) — (†) — (†) — (†) 52 18 (0.6)
Other jurisdictionsAmerican Samoa ......... — (†) 152 (2.5) — (†) — (†) — (†) — (†) — (†) — (†) — (†) — — (†)Guam ........................... 193 (0.8) 184 (1.7) — (†) — (†) — (†) — (†) — (†) — (†) — (†) — — (†)Virgin Islands ............... — (†) 181 (1.8) — (†) — (†) — (†) — (†) — (†) — (†) — (†) — — (†)
Table 121. Average scale score in mathematics, percentage attaining mathematics achievement levels, and selected statistics on mathematics education of 4th-graders in public schools, by state or jurisdiction: Selected years, 1992 through 2005—Continued
State or jurisdiction
Average scale score Percent attaining mathematics achievement levels, 20051 Percent ofstudentswith 5 or
more hoursof math
instructioneach week,
2005
Percent of students, 2003
1992 2000 2003 2005 Below basicBasic orabove2
Proficient orabove3 Advanced4
Spending30 minutes
or moreon math
homeworkeach day5
Watching6 hours
or more oftelevisioneach day
1 2 3 4 5 6 7 8 9 10 11 12
DIGEST OF EDUCATION STATISTICS 2005
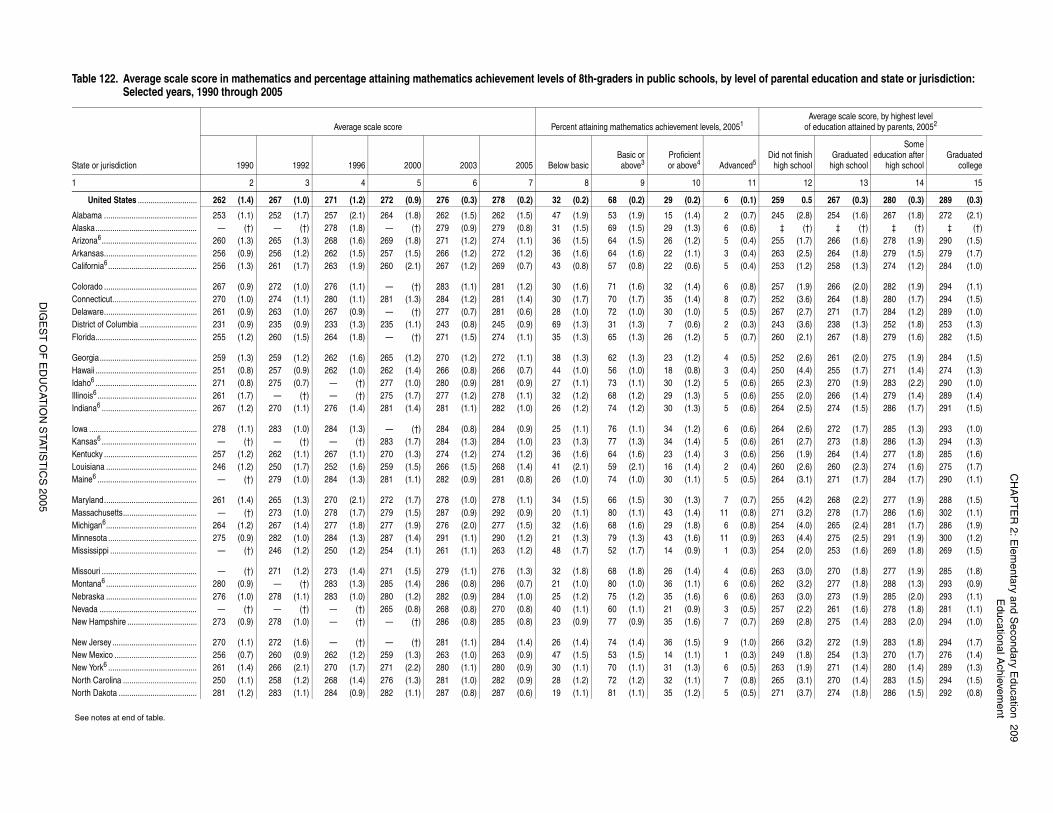
CH
AP
TE
R 2: E
lementary and S
econdary Education
209E
ducational Achievem
ent
DIG
ES
T O
F E
DU
CAT
ION
STAT
IST
ICS
2005
of parental education and state or jurisdiction:
Average scale score, by highest level of education attained by parents, 20052
Did not finishhigh school
Graduatedhigh school
Someeducation after
high schoolGraduated
college
12 13 14 15
259 0.5 267 (0.3) 280 (0.3) 289 (0.3)
245 (2.8) 254 (1.6) 267 (1.8) 272 (2.1)‡ (†) ‡ (†) ‡ (†) ‡ (†)
255 (1.7) 266 (1.6) 278 (1.9) 290 (1.5)263 (2.5) 264 (1.8) 279 (1.5) 279 (1.7)253 (1.2) 258 (1.3) 274 (1.2) 284 (1.0)
257 (1.9) 266 (2.0) 282 (1.9) 294 (1.1)252 (3.6) 264 (1.8) 280 (1.7) 294 (1.5)267 (2.7) 271 (1.7) 284 (1.2) 289 (1.0)243 (3.6) 238 (1.3) 252 (1.8) 253 (1.3)260 (2.1) 267 (1.8) 279 (1.6) 282 (1.5)
252 (2.6) 261 (2.0) 275 (1.9) 284 (1.5)250 (4.4) 255 (1.7) 271 (1.4) 274 (1.3)265 (2.3) 270 (1.9) 283 (2.2) 290 (1.0)255 (2.0) 266 (1.4) 279 (1.4) 289 (1.4)264 (2.5) 274 (1.5) 286 (1.7) 291 (1.5)
264 (2.6) 272 (1.7) 285 (1.3) 293 (1.0)261 (2.7) 273 (1.8) 286 (1.3) 294 (1.3)256 (1.9) 264 (1.4) 277 (1.8) 285 (1.6)260 (2.6) 260 (2.3) 274 (1.6) 275 (1.7)264 (3.1) 271 (1.7) 284 (1.7) 290 (1.1)
255 (4.2) 268 (2.2) 277 (1.9) 288 (1.5)271 (3.2) 278 (1.7) 286 (1.6) 302 (1.1)254 (4.0) 265 (2.4) 281 (1.7) 286 (1.9)263 (4.4) 275 (2.5) 291 (1.9) 300 (1.2)254 (2.0) 253 (1.6) 269 (1.8) 269 (1.5)
263 (3.0) 270 (1.8) 277 (1.9) 285 (1.8)262 (3.2) 277 (1.8) 288 (1.3) 293 (0.9)263 (3.0) 273 (1.9) 285 (2.0) 293 (1.1)257 (2.2) 261 (1.6) 278 (1.8) 281 (1.1)269 (2.8) 275 (1.4) 283 (2.0) 294 (1.0)
266 (3.2) 272 (1.9) 283 (1.8) 294 (1.7)249 (1.8) 254 (1.3) 270 (1.7) 276 (1.4)263 (1.9) 271 (1.4) 280 (1.4) 289 (1.3)265 (3.1) 270 (1.4) 283 (1.5) 294 (1.5)271 (3.7) 274 (1.8) 286 (1.5) 292 (0.8)
Table 122. Average scale score in mathematics and percentage attaining mathematics achievement levels of 8th-graders in public schools, by levelSelected years, 1990 through 2005
State or jurisdiction
Average scale score Percent attaining mathematics achievement levels, 20051
1990 1992 1996 2000 2003 2005 Below basicBasic orabove3
Proficientor above4 Advanced5
1 2 3 4 5 6 7 8 9 10 11
United States ............................ 262 (1.4) 267 (1.0) 271 (1.2) 272 (0.9) 276 (0.3) 278 (0.2) 32 (0.2) 68 (0.2) 29 (0.2) 6 (0.1)
Alabama ............................................ 253 (1.1) 252 (1.7) 257 (2.1) 264 (1.8) 262 (1.5) 262 (1.5) 47 (1.9) 53 (1.9) 15 (1.4) 2 (0.7)Alaska................................................ — (†) — (†) 278 (1.8) — (†) 279 (0.9) 279 (0.8) 31 (1.5) 69 (1.5) 29 (1.3) 6 (0.6)Arizona6............................................. 260 (1.3) 265 (1.3) 268 (1.6) 269 (1.8) 271 (1.2) 274 (1.1) 36 (1.5) 64 (1.5) 26 (1.2) 5 (0.4)Arkansas............................................ 256 (0.9) 256 (1.2) 262 (1.5) 257 (1.5) 266 (1.2) 272 (1.2) 36 (1.6) 64 (1.6) 22 (1.1) 3 (0.4)California6.......................................... 256 (1.3) 261 (1.7) 263 (1.9) 260 (2.1) 267 (1.2) 269 (0.7) 43 (0.8) 57 (0.8) 22 (0.6) 5 (0.4)
Colorado ............................................ 267 (0.9) 272 (1.0) 276 (1.1) — (†) 283 (1.1) 281 (1.2) 30 (1.6) 71 (1.6) 32 (1.4) 6 (0.8)Connecticut........................................ 270 (1.0) 274 (1.1) 280 (1.1) 281 (1.3) 284 (1.2) 281 (1.4) 30 (1.7) 70 (1.7) 35 (1.4) 8 (0.7)Delaware............................................ 261 (0.9) 263 (1.0) 267 (0.9) — (†) 277 (0.7) 281 (0.6) 28 (1.0) 72 (1.0) 30 (1.0) 5 (0.5)District of Columbia ........................... 231 (0.9) 235 (0.9) 233 (1.3) 235 (1.1) 243 (0.8) 245 (0.9) 69 (1.3) 31 (1.3) 7 (0.6) 2 (0.3)Florida................................................ 255 (1.2) 260 (1.5) 264 (1.8) — (†) 271 (1.5) 274 (1.1) 35 (1.3) 65 (1.3) 26 (1.2) 5 (0.7)
Georgia.............................................. 259 (1.3) 259 (1.2) 262 (1.6) 265 (1.2) 270 (1.2) 272 (1.1) 38 (1.3) 62 (1.3) 23 (1.2) 4 (0.5)Hawaii ................................................ 251 (0.8) 257 (0.9) 262 (1.0) 262 (1.4) 266 (0.8) 266 (0.7) 44 (1.0) 56 (1.0) 18 (0.8) 3 (0.4)Idaho6 ................................................ 271 (0.8) 275 (0.7) — (†) 277 (1.0) 280 (0.9) 281 (0.9) 27 (1.1) 73 (1.1) 30 (1.2) 5 (0.6)Illinois6 ............................................... 261 (1.7) — (†) — (†) 275 (1.7) 277 (1.2) 278 (1.1) 32 (1.2) 68 (1.2) 29 (1.3) 5 (0.6)Indiana6 ............................................. 267 (1.2) 270 (1.1) 276 (1.4) 281 (1.4) 281 (1.1) 282 (1.0) 26 (1.2) 74 (1.2) 30 (1.3) 5 (0.6)
Iowa ................................................... 278 (1.1) 283 (1.0) 284 (1.3) — (†) 284 (0.8) 284 (0.9) 25 (1.1) 76 (1.1) 34 (1.2) 6 (0.6)Kansas6 ............................................. — (†) — (†) — (†) 283 (1.7) 284 (1.3) 284 (1.0) 23 (1.3) 77 (1.3) 34 (1.4) 5 (0.6)Kentucky ............................................ 257 (1.2) 262 (1.1) 267 (1.1) 270 (1.3) 274 (1.2) 274 (1.2) 36 (1.6) 64 (1.6) 23 (1.4) 3 (0.6)Louisiana ........................................... 246 (1.2) 250 (1.7) 252 (1.6) 259 (1.5) 266 (1.5) 268 (1.4) 41 (2.1) 59 (2.1) 16 (1.4) 2 (0.4)Maine6 ............................................... — (†) 279 (1.0) 284 (1.3) 281 (1.1) 282 (0.9) 281 (0.8) 26 (1.0) 74 (1.0) 30 (1.1) 5 (0.5)
Maryland............................................ 261 (1.4) 265 (1.3) 270 (2.1) 272 (1.7) 278 (1.0) 278 (1.1) 34 (1.5) 66 (1.5) 30 (1.3) 7 (0.7)Massachusetts................................... — (†) 273 (1.0) 278 (1.7) 279 (1.5) 287 (0.9) 292 (0.9) 20 (1.1) 80 (1.1) 43 (1.4) 11 (0.8)Michigan6........................................... 264 (1.2) 267 (1.4) 277 (1.8) 277 (1.9) 276 (2.0) 277 (1.5) 32 (1.6) 68 (1.6) 29 (1.8) 6 (0.8)Minnesota .......................................... 275 (0.9) 282 (1.0) 284 (1.3) 287 (1.4) 291 (1.1) 290 (1.2) 21 (1.3) 79 (1.3) 43 (1.6) 11 (0.9)Mississippi ......................................... — (†) 246 (1.2) 250 (1.2) 254 (1.1) 261 (1.1) 263 (1.2) 48 (1.7) 52 (1.7) 14 (0.9) 1 (0.3)
Missouri ............................................. — (†) 271 (1.2) 273 (1.4) 271 (1.5) 279 (1.1) 276 (1.3) 32 (1.8) 68 (1.8) 26 (1.4) 4 (0.6)Montana6 ........................................... 280 (0.9) — (†) 283 (1.3) 285 (1.4) 286 (0.8) 286 (0.7) 21 (1.0) 80 (1.0) 36 (1.1) 6 (0.6)Nebraska ........................................... 276 (1.0) 278 (1.1) 283 (1.0) 280 (1.2) 282 (0.9) 284 (1.0) 25 (1.2) 75 (1.2) 35 (1.6) 6 (0.6)Nevada .............................................. — (†) — (†) — (†) 265 (0.8) 268 (0.8) 270 (0.8) 40 (1.1) 60 (1.1) 21 (0.9) 3 (0.5)New Hampshire ................................. 273 (0.9) 278 (1.0) — (†) — (†) 286 (0.8) 285 (0.8) 23 (0.9) 77 (0.9) 35 (1.6) 7 (0.7)
New Jersey ........................................ 270 (1.1) 272 (1.6) — (†) — (†) 281 (1.1) 284 (1.4) 26 (1.4) 74 (1.4) 36 (1.5) 9 (1.0)New Mexico ....................................... 256 (0.7) 260 (0.9) 262 (1.2) 259 (1.3) 263 (1.0) 263 (0.9) 47 (1.5) 53 (1.5) 14 (1.1) 1 (0.3)New York6 .......................................... 261 (1.4) 266 (2.1) 270 (1.7) 271 (2.2) 280 (1.1) 280 (0.9) 30 (1.1) 70 (1.1) 31 (1.3) 6 (0.5)North Carolina ................................... 250 (1.1) 258 (1.2) 268 (1.4) 276 (1.3) 281 (1.0) 282 (0.9) 28 (1.2) 72 (1.2) 32 (1.1) 7 (0.8)North Dakota ..................................... 281 (1.2) 283 (1.1) 284 (0.9) 282 (1.1) 287 (0.8) 287 (0.6) 19 (1.1) 81 (1.1) 35 (1.2) 5 (0.5)
See notes at end of table.
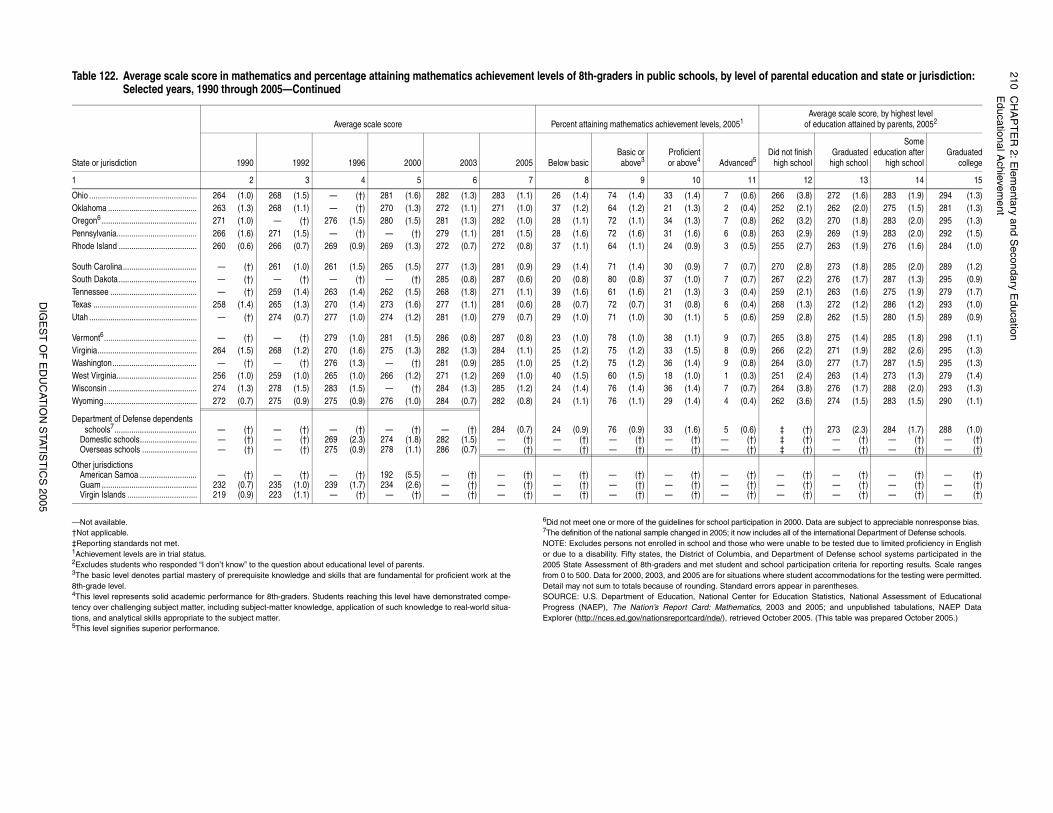
210C
HA
PT
ER
2: Elem
entary and Secondary E
ducationE
ducational Achievem
ent
DIG
ES
T O
F E
DU
CAT
ION
STAT
IST
ICS
2005
ation in 2000. Data are subject to appreciable nonresponse bias.ncludes all of the international Department of Defense schools.ho were unable to be tested due to limited proficiency in Englishand Department of Defense school systems participated in the school participation criteria for reporting results. Scale rangess where student accommodations for the testing were permitted.errors appear in parentheses. for Education Statistics, National Assessment of Educationals, 2003 and 2005; and unpublished tabulations, NAEP Datad October 2005. (This table was prepared October 2005.)
266 (3.8) 272 (1.6) 283 (1.9) 294 (1.3)252 (2.1) 262 (2.0) 275 (1.5) 281 (1.3)262 (3.2) 270 (1.8) 283 (2.0) 295 (1.3)263 (2.9) 269 (1.9) 283 (2.0) 292 (1.5)255 (2.7) 263 (1.9) 276 (1.6) 284 (1.0)
270 (2.8) 273 (1.8) 285 (2.0) 289 (1.2)267 (2.2) 276 (1.7) 287 (1.3) 295 (0.9)259 (2.1) 263 (1.6) 275 (1.9) 279 (1.7)268 (1.3) 272 (1.2) 286 (1.2) 293 (1.0)259 (2.8) 262 (1.5) 280 (1.5) 289 (0.9)
265 (3.8) 275 (1.4) 285 (1.8) 298 (1.1)266 (2.2) 271 (1.9) 282 (2.6) 295 (1.3)264 (3.0) 277 (1.7) 287 (1.5) 295 (1.3)251 (2.4) 263 (1.4) 273 (1.3) 279 (1.4)264 (3.8) 276 (1.7) 288 (2.0) 293 (1.3)262 (3.6) 274 (1.5) 283 (1.5) 290 (1.1)
‡ (†) 273 (2.3) 284 (1.7) 288 (1.0)‡ (†) — (†) — (†) — (†)‡ (†) — (†) — (†) — (†)
— (†) — (†) — (†) — (†)— (†) — (†) — (†) — (†)— (†) — (†) — (†) — (†)
of parental education and state or jurisdiction:
Average scale score, by highest level of education attained by parents, 20052
Did not finishhigh school
Graduatedhigh school
Someeducation after
high schoolGraduated
college
12 13 14 15
—Not available. †Not applicable.‡Reporting standards not met.1Achievement levels are in trial status.2Excludes students who responded “I don’t know” to the question about educational level of parents.3The basic level denotes partial mastery of prerequisite knowledge and skills that are fundamental for proficient work at the8th-grade level.4This level represents solid academic performance for 8th-graders. Students reaching this level have demonstrated compe-tency over challenging subject matter, including subject-matter knowledge, application of such knowledge to real-world situa-tions, and analytical skills appropriate to the subject matter.5This level signifies superior performance.
6Did not meet one or more of the guidelines for school particip7The definition of the national sample changed in 2005; it now iNOTE: Excludes persons not enrolled in school and those wor due to a disability. Fifty states, the District of Columbia, 2005 State Assessment of 8th-graders and met student andfrom 0 to 500. Data for 2000, 2003, and 2005 are for situationDetail may not sum to totals because of rounding. Standard SOURCE: U.S. Department of Education, National CenterProgress (NAEP), The Nation’s Report Card: MathematicExplorer (http://nces.ed.gov/nationsreportcard/nde/), retrieve
Ohio ................................................... 264 (1.0) 268 (1.5) — (†) 281 (1.6) 282 (1.3) 283 (1.1) 26 (1.4) 74 (1.4) 33 (1.4) 7 (0.6)Oklahoma .......................................... 263 (1.3) 268 (1.1) — (†) 270 (1.3) 272 (1.1) 271 (1.0) 37 (1.2) 64 (1.2) 21 (1.3) 2 (0.4)Oregon6 ............................................. 271 (1.0) — (†) 276 (1.5) 280 (1.5) 281 (1.3) 282 (1.0) 28 (1.1) 72 (1.1) 34 (1.3) 7 (0.8)Pennsylvania...................................... 266 (1.6) 271 (1.5) — (†) — (†) 279 (1.1) 281 (1.5) 28 (1.6) 72 (1.6) 31 (1.6) 6 (0.8)Rhode Island ..................................... 260 (0.6) 266 (0.7) 269 (0.9) 269 (1.3) 272 (0.7) 272 (0.8) 37 (1.1) 64 (1.1) 24 (0.9) 3 (0.5)
South Carolina................................... — (†) 261 (1.0) 261 (1.5) 265 (1.5) 277 (1.3) 281 (0.9) 29 (1.4) 71 (1.4) 30 (0.9) 7 (0.7)South Dakota ..................................... — (†) — (†) — (†) — (†) 285 (0.8) 287 (0.6) 20 (0.8) 80 (0.8) 37 (1.0) 7 (0.7)Tennessee ......................................... — (†) 259 (1.4) 263 (1.4) 262 (1.5) 268 (1.8) 271 (1.1) 39 (1.6) 61 (1.6) 21 (1.3) 3 (0.4)Texas ................................................. 258 (1.4) 265 (1.3) 270 (1.4) 273 (1.6) 277 (1.1) 281 (0.6) 28 (0.7) 72 (0.7) 31 (0.8) 6 (0.4)Utah ................................................... — (†) 274 (0.7) 277 (1.0) 274 (1.2) 281 (1.0) 279 (0.7) 29 (1.0) 71 (1.0) 30 (1.1) 5 (0.6)
Vermont6............................................ — (†) — (†) 279 (1.0) 281 (1.5) 286 (0.8) 287 (0.8) 23 (1.0) 78 (1.0) 38 (1.1) 9 (0.7)Virginia............................................... 264 (1.5) 268 (1.2) 270 (1.6) 275 (1.3) 282 (1.3) 284 (1.1) 25 (1.2) 75 (1.2) 33 (1.5) 8 (0.9)Washington........................................ — (†) — (†) 276 (1.3) — (†) 281 (0.9) 285 (1.0) 25 (1.2) 75 (1.2) 36 (1.4) 9 (0.8)West Virginia...................................... 256 (1.0) 259 (1.0) 265 (1.0) 266 (1.2) 271 (1.2) 269 (1.0) 40 (1.5) 60 (1.5) 18 (1.0) 1 (0.3)Wisconsin .......................................... 274 (1.3) 278 (1.5) 283 (1.5) — (†) 284 (1.3) 285 (1.2) 24 (1.4) 76 (1.4) 36 (1.4) 7 (0.7)Wyoming............................................ 272 (0.7) 275 (0.9) 275 (0.9) 276 (1.0) 284 (0.7) 282 (0.8) 24 (1.1) 76 (1.1) 29 (1.4) 4 (0.4)
Department of Defense dependents schools7....................................... — (†) — (†) — (†) — (†) — (†) 284 (0.7) 24 (0.9) 76 (0.9) 33 (1.6) 5 (0.6)
Domestic schools........................... — (†) — (†) 269 (2.3) 274 (1.8) 282 (1.5) — (†) — (†) — (†) — (†) — (†)Overseas schools .......................... — (†) — (†) 275 (0.9) 278 (1.1) 286 (0.7) — (†) — (†) — (†) — (†) — (†)
Other jurisdictionsAmerican Samoa ........................... — (†) — (†) — (†) 192 (5.5) — (†) — (†) — (†) — (†) — (†) — (†)Guam ............................................. 232 (0.7) 235 (1.0) 239 (1.7) 234 (2.6) — (†) — (†) — (†) — (†) — (†) — (†)Virgin Islands ................................. 219 (0.9) 223 (1.1) — (†) — (†) — (†) — (†) — (†) — (†) — (†) — (†)
Table 122. Average scale score in mathematics and percentage attaining mathematics achievement levels of 8th-graders in public schools, by levelSelected years, 1990 through 2005—Continued
State or jurisdiction
Average scale score Percent attaining mathematics achievement levels, 20051
1990 1992 1996 2000 2003 2005 Below basicBasic orabove3
Proficientor above4 Advanced5
1 2 3 4 5 6 7 8 9 10 11
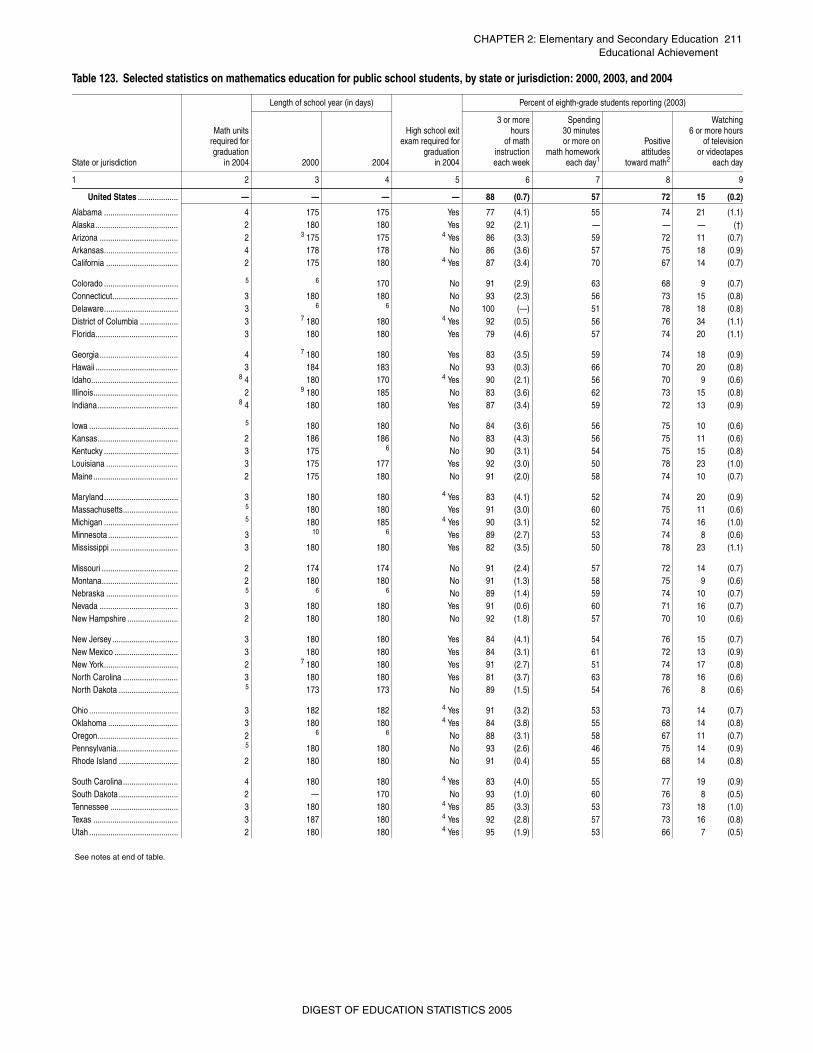
CHAPTER 2: Elementary and Secondary Education 211Educational Achievement
Table 123. Selected statistics on mathematics education for public school students, by state or jurisdiction: 2000, 2003, and 2004
State or jurisdiction
Math unitsrequired forgraduation
in 2004
Length of school year (in days)
High school exitexam required for
graduationin 2004
Percent of eighth-grade students reporting (2003)
2000 2004
3 or morehours
of mathinstructioneach week
Spending30 minutesor more on
math homeworkeach day1
Positiveattitudes
toward math2
Watching6 or more hours
of televisionor videotapes
each day
1 2 3 4 5 6 7 8 9
United States ................... — — — — 88 (0.7) 57 72 15 (0.2)
Alabama ................................... 4 175 175 Yes 77 (4.1) 55 74 21 (1.1)Alaska....................................... 2 180 180 Yes 92 (2.1) — — — (†)Arizona ..................................... 2 3 175 175 4 Yes 86 (3.3) 59 72 11 (0.7)Arkansas................................... 4 178 178 No 86 (3.6) 57 75 18 (0.9)California .................................. 2 175 180 4 Yes 87 (3.4) 70 67 14 (0.7)
Colorado ................................... 5 6 170 No 91 (2.9) 63 68 9 (0.7)Connecticut............................... 3 180 180 No 93 (2.3) 56 73 15 (0.8)Delaware................................... 3 6 6 No 100 (—) 51 78 18 (0.8)District of Columbia .................. 3 7 180 180 4 Yes 92 (0.5) 56 76 34 (1.1)Florida....................................... 3 180 180 Yes 79 (4.6) 57 74 20 (1.1)
Georgia..................................... 4 7 180 180 Yes 83 (3.5) 59 74 18 (0.9)Hawaii ....................................... 3 184 183 No 93 (0.3) 66 70 20 (0.8)Idaho......................................... 8 4 180 170 4 Yes 90 (2.1) 56 70 9 (0.6)Illinois........................................ 2 9 180 185 No 83 (3.6) 62 73 15 (0.8)Indiana...................................... 8 4 180 180 Yes 87 (3.4) 59 72 13 (0.9)
Iowa .......................................... 5 180 180 No 84 (3.6) 56 75 10 (0.6)Kansas...................................... 2 186 186 No 83 (4.3) 56 75 11 (0.6)Kentucky ................................... 3 175 6 No 90 (3.1) 54 75 15 (0.8)Louisiana .................................. 3 175 177 Yes 92 (3.0) 50 78 23 (1.0)Maine........................................ 2 175 180 No 91 (2.0) 58 74 10 (0.7)
Maryland................................... 3 180 180 4 Yes 83 (4.1) 52 74 20 (0.9)Massachusetts.......................... 5 180 180 Yes 91 (3.0) 60 75 11 (0.6)Michigan ................................... 5 180 185 4 Yes 90 (3.1) 52 74 16 (1.0)Minnesota ................................. 3 10 6 Yes 89 (2.7) 53 74 8 (0.6)Mississippi ................................ 3 180 180 Yes 82 (3.5) 50 78 23 (1.1)
Missouri .................................... 2 174 174 No 91 (2.4) 57 72 14 (0.7)Montana.................................... 2 180 180 No 91 (1.3) 58 75 9 (0.6)Nebraska .................................. 5 6 6 No 89 (1.4) 59 74 10 (0.7)Nevada ..................................... 3 180 180 Yes 91 (0.6) 60 71 16 (0.7)New Hampshire ........................ 2 180 180 No 92 (1.8) 57 70 10 (0.6)
New Jersey ............................... 3 180 180 Yes 84 (4.1) 54 76 15 (0.7)New Mexico .............................. 3 180 180 Yes 84 (3.1) 61 72 13 (0.9)New York................................... 2 7 180 180 Yes 91 (2.7) 51 74 17 (0.8)North Carolina .......................... 3 180 180 Yes 81 (3.7) 63 78 16 (0.6)North Dakota ............................ 5 173 173 No 89 (1.5) 54 76 8 (0.6)
Ohio .......................................... 3 182 182 4 Yes 91 (3.2) 53 73 14 (0.7)Oklahoma ................................. 3 180 180 4 Yes 84 (3.8) 55 68 14 (0.8)Oregon...................................... 2 6 6 No 88 (3.1) 58 67 11 (0.7)Pennsylvania............................. 5 180 180 No 93 (2.6) 46 75 14 (0.9)Rhode Island ............................ 2 180 180 No 91 (0.4) 55 68 14 (0.8)
South Carolina.......................... 4 180 180 4 Yes 83 (4.0) 55 77 19 (0.9)South Dakota ............................ 2 — 170 No 93 (1.0) 60 76 8 (0.5)Tennessee ................................ 3 180 180 4 Yes 85 (3.3) 53 73 18 (1.0)Texas ........................................ 3 187 180 4 Yes 92 (2.8) 57 73 16 (0.8)Utah .......................................... 2 180 180 4 Yes 95 (1.9) 53 66 7 (0.5)
See notes at end of table.
DIGEST OF EDUCATION STATISTICS 2005
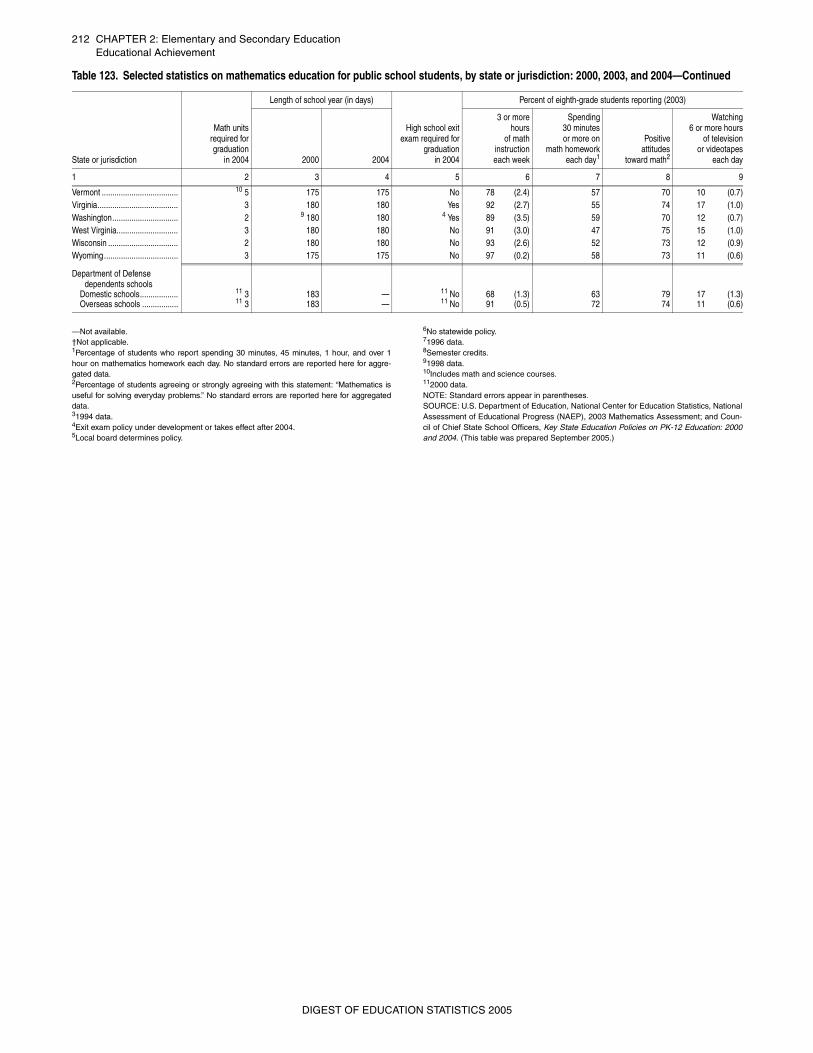
212 CHAPTER 2: Elementary and Secondary EducationEducational Achievement
—Not available. †Not applicable. 1Percentage of students who report spending 30 minutes, 45 minutes, 1 hour, and over 1hour on mathematics homework each day. No standard errors are reported here for aggre-gated data.2Percentage of students agreeing or strongly agreeing with this statement: “Mathematics isuseful for solving everyday problems.” No standard errors are reported here for aggregateddata.31994 data. 4Exit exam policy under development or takes effect after 2004.5Local board determines policy.
6No statewide policy. 71996 data. 8Semester credits. 91998 data. 10Includes math and science courses. 112000 data.NOTE: Standard errors appear in parentheses. SOURCE: U.S. Department of Education, National Center for Education Statistics, NationalAssessment of Educational Progress (NAEP), 2003 Mathematics Assessment; and Coun-cil of Chief State School Officers, Key State Education Policies on PK-12 Education: 2000and 2004. (This table was prepared September 2005.)
Vermont .................................... 10 5 175 175 No 78 (2.4) 57 70 10 (0.7)Virginia...................................... 3 180 180 Yes 92 (2.7) 55 74 17 (1.0)Washington............................... 2 9 180 180 4 Yes 89 (3.5) 59 70 12 (0.7)West Virginia............................. 3 180 180 No 91 (3.0) 47 75 15 (1.0)Wisconsin ................................. 2 180 180 No 93 (2.6) 52 73 12 (0.9)Wyoming................................... 3 175 175 No 97 (0.2) 58 73 11 (0.6)
Department of Defense dependents schools
Domestic schools.................. 11 3 183 — 11 No 68 (1.3) 63 79 17 (1.3)Overseas schools ................. 11 3 183 — 11 No 91 (0.5) 72 74 11 (0.6)
Table 123. Selected statistics on mathematics education for public school students, by state or jurisdiction: 2000, 2003, and 2004—Continued
State or jurisdiction
Math unitsrequired forgraduation
in 2004
Length of school year (in days)
High school exitexam required for
graduationin 2004
Percent of eighth-grade students reporting (2003)
2000 2004
3 or morehours
of mathinstructioneach week
Spending30 minutesor more on
math homeworkeach day1
Positiveattitudes
toward math2
Watching6 or more hours
of televisionor videotapes
each day
1 2 3 4 5 6 7 8 9
DIGEST OF EDUCATION STATISTICS 2005
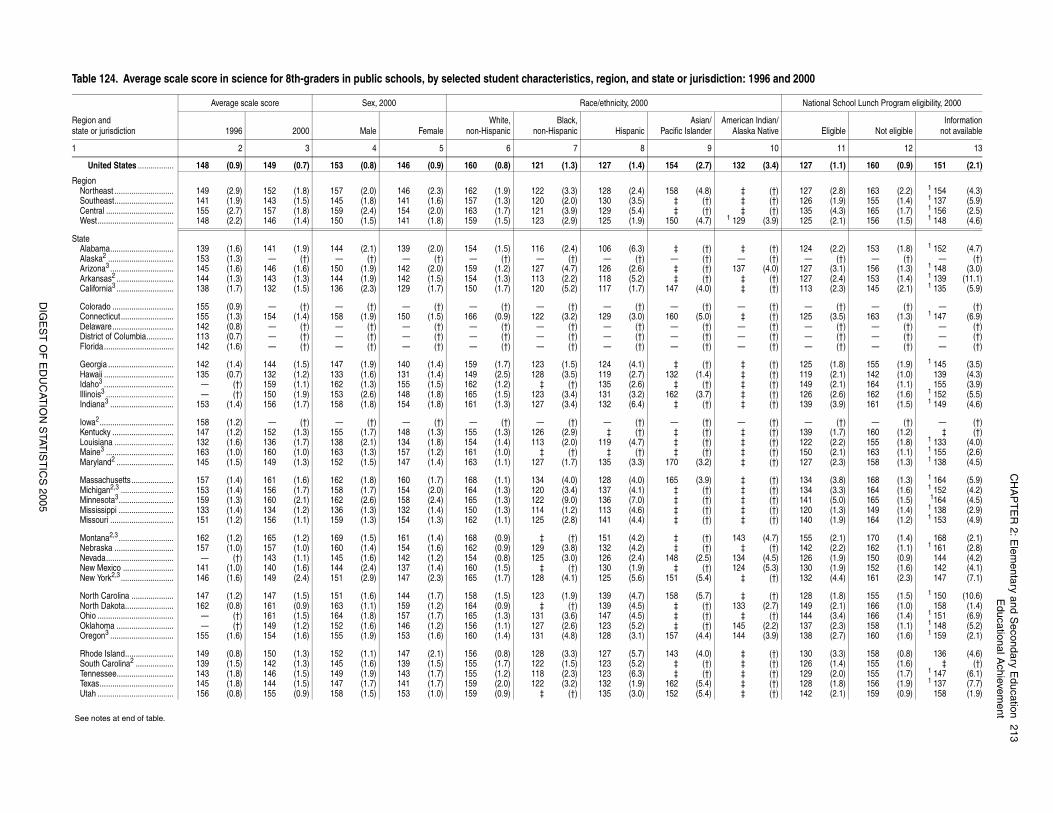
CH
AP
TE
R 2: E
lementary and S
econdary Education
213E
ducational Achievem
ent
DIG
ES
T O
F E
DU
CAT
ION
STAT
IST
ICS
2005
96 and 2000
National School Lunch Program eligibility, 2000
Indian/ Native Eligible Not eligible
Informationnot available
10 11 12 13
(3.4) 127 (1.1) 160 (0.9) 151 (2.1)
(†) 127 (2.8) 163 (2.2) 1 154 (4.3)(†) 126 (1.9) 155 (1.4) 1 137 (5.9)(†) 135 (4.3) 165 (1.7) 1 156 (2.5)
(3.9) 125 (2.1) 156 (1.5) 1 148 (4.6)
(†) 124 (2.2) 153 (1.8) 1 152 (4.7)(†) — (†) — (†) — (†)
(4.0) 127 (3.1) 156 (1.3) 1 148 (3.0)(†) 127 (2.4) 153 (1.4) 1 139 (11.1)(†) 113 (2.3) 145 (2.1) 1 135 (5.9)
(†) — (†) — (†) — (†)(†) 125 (3.5) 163 (1.3) 1 147 (6.9)(†) — (†) — (†) — (†)(†) — (†) — (†) — (†)(†) — (†) — (†) — (†)
(†) 125 (1.8) 155 (1.9) 1 145 (3.5)(†) 119 (2.1) 142 (1.0) 139 (4.3)(†) 149 (2.1) 164 (1.1) 155 (3.9)(†) 126 (2.6) 162 (1.6) 1 152 (5.5)(†) 139 (3.9) 161 (1.5) 1 149 (4.6)
(†) — (†) — (†) — (†)(†) 139 (1.7) 160 (1.2) ‡ (†)(†) 122 (2.2) 155 (1.8) 1 133 (4.0)(†) 150 (2.1) 163 (1.1) 1 155 (2.6)(†) 127 (2.3) 158 (1.3) 1 138 (4.5)
(†) 134 (3.8) 168 (1.3) 1 164 (5.9)(†) 134 (3.3) 164 (1.6) 1 152 (4.2)(†) 141 (5.0) 165 (1.5) 1164 (4.5)(†) 120 (1.3) 149 (1.4) 1 138 (2.9)(†) 140 (1.9) 164 (1.2) 1 153 (4.9)
(4.7) 155 (2.1) 170 (1.4) 168 (2.1)(†) 142 (2.2) 162 (1.1) 1 161 (2.8)
(4.5) 126 (1.9) 150 (0.9) 144 (4.2)(5.3) 130 (1.9) 152 (1.6) 142 (4.1)
(†) 132 (4.4) 161 (2.3) 147 (7.1)
(†) 128 (1.8) 155 (1.5) 1 150 (10.6)(2.7) 149 (2.1) 166 (1.0) 158 (1.4)
(†) 144 (3.4) 166 (1.4) 1 151 (6.9)(2.2) 137 (2.3) 158 (1.1) 1 148 (5.2)(3.9) 138 (2.7) 160 (1.6) 1 159 (2.1)
(†) 130 (3.3) 158 (0.8) 136 (4.6)(†) 126 (1.4) 155 (1.6) ‡ (†)(†) 129 (2.0) 155 (1.7) 1 147 (6.1)(†) 128 (1.8) 156 (1.9) 1 137 (7.7)(†) 142 (2.1) 159 (0.9) 158 (1.9)
Table 124. Average scale score in science for 8th-graders in public schools, by selected student characteristics, region, and state or jurisdiction: 19
Region and state or jurisdiction
Average scale score Sex, 2000 Race/ethnicity, 2000
1996 2000 Male FemaleWhite,
non-HispanicBlack,
non-Hispanic HispanicAsian/
Pacific IslanderAmerican
Alaska
1 2 3 4 5 6 7 8 9
United States ................. 148 (0.9) 149 (0.7) 153 (0.8) 146 (0.9) 160 (0.8) 121 (1.3) 127 (1.4) 154 (2.7) 132
RegionNortheast ............................ 149 (2.9) 152 (1.8) 157 (2.0) 146 (2.3) 162 (1.9) 122 (3.3) 128 (2.4) 158 (4.8) ‡Southeast............................ 141 (1.9) 143 (1.5) 145 (1.8) 141 (1.6) 157 (1.3) 120 (2.0) 130 (3.5) ‡ (†) ‡Central ................................ 155 (2.7) 157 (1.8) 159 (2.4) 154 (2.0) 163 (1.7) 121 (3.9) 129 (5.4) ‡ (†) ‡West.................................... 148 (2.2) 146 (1.4) 150 (1.5) 141 (1.8) 159 (1.5) 123 (2.9) 125 (1.9) 150 (4.7) 1 129
StateAlabama.............................. 139 (1.6) 141 (1.9) 144 (2.1) 139 (2.0) 154 (1.5) 116 (2.4) 106 (6.3) ‡ (†) ‡Alaska2 ............................... 153 (1.3) — (†) — (†) — (†) — (†) — (†) — (†) — (†) —Arizona3 .............................. 145 (1.6) 146 (1.6) 150 (1.9) 142 (2.0) 159 (1.2) 127 (4.7) 126 (2.6) ‡ (†) 137Arkansas2 ........................... 144 (1.3) 143 (1.3) 144 (1.9) 142 (1.5) 154 (1.3) 113 (2.2) 118 (5.2) ‡ (†) ‡California3 ........................... 138 (1.7) 132 (1.5) 136 (2.3) 129 (1.7) 150 (1.7) 120 (5.2) 117 (1.7) 147 (4.0) ‡
Colorado ............................. 155 (0.9) — (†) — (†) — (†) — (†) — (†) — (†) — (†) —Connecticut ......................... 155 (1.3) 154 (1.4) 158 (1.9) 150 (1.5) 166 (0.9) 122 (3.2) 129 (3.0) 160 (5.0) ‡Delaware............................. 142 (0.8) — (†) — (†) — (†) — (†) — (†) — (†) — (†) —District of Columbia............. 113 (0.7) — (†) — (†) — (†) — (†) — (†) — (†) — (†) —Florida................................. 142 (1.6) — (†) — (†) — (†) — (†) — (†) — (†) — (†) —
Georgia ............................... 142 (1.4) 144 (1.5) 147 (1.9) 140 (1.4) 159 (1.7) 123 (1.5) 124 (4.1) ‡ (†) ‡Hawaii ................................. 135 (0.7) 132 (1.2) 133 (1.6) 131 (1.4) 149 (2.5) 128 (3.5) 119 (2.7) 132 (1.4) ‡Idaho3 ................................. — (†) 159 (1.1) 162 (1.3) 155 (1.5) 162 (1.2) ‡ (†) 135 (2.6) ‡ (†) ‡Illinois3 ................................ — (†) 150 (1.9) 153 (2.6) 148 (1.8) 165 (1.5) 123 (3.4) 131 (3.2) 162 (3.7) ‡Indiana3 .............................. 153 (1.4) 156 (1.7) 158 (1.8) 154 (1.8) 161 (1.3) 127 (3.4) 132 (6.4) ‡ (†) ‡
Iowa2................................... 158 (1.2) — (†) — (†) — (†) — (†) — (†) — (†) — (†) —Kentucky ............................. 147 (1.2) 152 (1.3) 155 (1.7) 148 (1.3) 155 (1.3) 126 (2.9) ‡ (†) ‡ (†) ‡Louisiana ............................ 132 (1.6) 136 (1.7) 138 (2.1) 134 (1.8) 154 (1.4) 113 (2.0) 119 (4.7) ‡ (†) ‡Maine3 ................................ 163 (1.0) 160 (1.0) 163 (1.3) 157 (1.2) 161 (1.0) ‡ (†) ‡ (†) ‡ (†) ‡Maryland2 ........................... 145 (1.5) 149 (1.3) 152 (1.5) 147 (1.4) 163 (1.1) 127 (1.7) 135 (3.3) 170 (3.2) ‡
Massachusetts .................... 157 (1.4) 161 (1.6) 162 (1.8) 160 (1.7) 168 (1.1) 134 (4.0) 128 (4.0) 165 (3.9) ‡Michigan2,3 ......................... 153 (1.4) 156 (1.7) 158 (1.7) 154 (2.0) 164 (1.3) 120 (3.4) 137 (4.1) ‡ (†) ‡Minnesota3.......................... 159 (1.3) 160 (2.1) 162 (2.6) 158 (2.4) 165 (1.3) 122 (9.0) 136 (7.0) ‡ (†) ‡Mississippi .......................... 133 (1.4) 134 (1.2) 136 (1.3) 132 (1.4) 150 (1.3) 114 (1.2) 113 (4.6) ‡ (†) ‡Missouri .............................. 151 (1.2) 156 (1.1) 159 (1.3) 154 (1.3) 162 (1.1) 125 (2.8) 141 (4.4) ‡ (†) ‡
Montana2,3 .......................... 162 (1.2) 165 (1.2) 169 (1.5) 161 (1.4) 168 (0.9) ‡ (†) 151 (4.2) ‡ (†) 143Nebraska ............................ 157 (1.0) 157 (1.0) 160 (1.4) 154 (1.6) 162 (0.9) 129 (3.8) 132 (4.2) ‡ (†) ‡Nevada................................ — (†) 143 (1.1) 145 (1.6) 142 (1.2) 154 (0.8) 125 (3.0) 126 (2.4) 148 (2.5) 134New Mexico ........................ 141 (1.0) 140 (1.6) 144 (2.4) 137 (1.4) 160 (1.5) ‡ (†) 130 (1.9) ‡ (†) 124New York2,3 ......................... 146 (1.6) 149 (2.4) 151 (2.9) 147 (2.3) 165 (1.7) 128 (4.1) 125 (5.6) 151 (5.4) ‡
North Carolina .................... 147 (1.2) 147 (1.5) 151 (1.6) 144 (1.7) 158 (1.5) 123 (1.9) 139 (4.7) 158 (5.7) ‡North Dakota....................... 162 (0.8) 161 (0.9) 163 (1.1) 159 (1.2) 164 (0.9) ‡ (†) 139 (4.5) ‡ (†) 133Ohio .................................... — (†) 161 (1.5) 164 (1.8) 157 (1.7) 165 (1.3) 131 (3.6) 147 (4.5) ‡ (†) ‡Oklahoma ........................... — (†) 149 (1.2) 152 (1.6) 146 (1.2) 156 (1.1) 127 (2.6) 123 (5.2) ‡ (†) 145Oregon3 .............................. 155 (1.6) 154 (1.6) 155 (1.9) 153 (1.6) 160 (1.4) 131 (4.8) 128 (3.1) 157 (4.4) 144
Rhode Island....................... 149 (0.8) 150 (1.3) 152 (1.1) 147 (2.1) 156 (0.8) 128 (3.3) 127 (5.7) 143 (4.0) ‡South Carolina2 .................. 139 (1.5) 142 (1.3) 145 (1.6) 139 (1.5) 155 (1.7) 122 (1.5) 123 (5.2) ‡ (†) ‡Tennessee........................... 143 (1.8) 146 (1.5) 149 (1.9) 143 (1.7) 155 (1.2) 118 (2.3) 123 (6.3) ‡ (†) ‡Texas................................... 145 (1.8) 144 (1.5) 147 (1.7) 141 (1.7) 159 (2.0) 122 (3.2) 132 (1.9) 162 (5.4) ‡Utah .................................... 156 (0.8) 155 (0.9) 158 (1.5) 153 (1.0) 159 (0.9) ‡ (†) 135 (3.0) 152 (5.4) ‡
See notes at end of table.
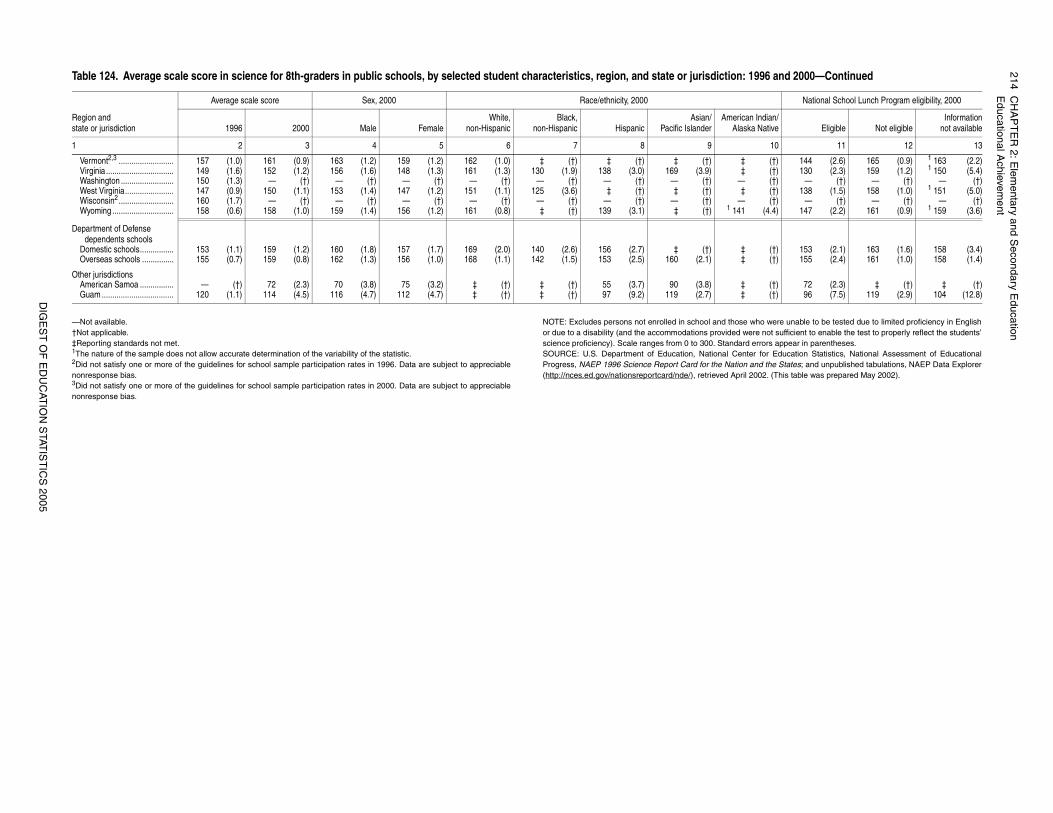
214C
HA
PT
ER
2: Elem
entary and Secondary E
ducationE
ducational Achievem
ent
DIG
ES
T O
F E
DU
CAT
ION
STAT
IST
ICS
2005
ho were unable to be tested due to limited proficiency in Englishe not sufficient to enable the test to properly reflect the students’rrors appear in parentheses. for Education Statistics, National Assessment of Educationald the States; and unpublished tabulations, NAEP Data Explorer02. (This table was prepared May 2002).
(†) 144 (2.6) 165 (0.9) 1 163 (2.2)(†) 130 (2.3) 159 (1.2) 1 150 (5.4)(†) — (†) — (†) — (†)(†) 138 (1.5) 158 (1.0) 1 151 (5.0)(†) — (†) — (†) — (†)
(4.4) 147 (2.2) 161 (0.9) 1 159 (3.6)
(†) 153 (2.1) 163 (1.6) 158 (3.4)(†) 155 (2.4) 161 (1.0) 158 (1.4)
(†) 72 (2.3) ‡ (†) ‡ (†)(†) 96 (7.5) 119 (2.9) 104 (12.8)
96 and 2000—Continued
National School Lunch Program eligibility, 2000
Indian/ Native Eligible Not eligible
Informationnot available
10 11 12 13
—Not available.†Not applicable.‡Reporting standards not met.1The nature of the sample does not allow accurate determination of the variability of the statistic.2Did not satisfy one or more of the guidelines for school sample participation rates in 1996. Data are subject to appreciablenonresponse bias.3Did not satisfy one or more of the guidelines for school sample participation rates in 2000. Data are subject to appreciablenonresponse bias.
NOTE: Excludes persons not enrolled in school and those wor due to a disability (and the accommodations provided werscience proficiency). Scale ranges from 0 to 300. Standard eSOURCE: U.S. Department of Education, National CenterProgress, NAEP 1996 Science Report Card for the Nation an(http://nces.ed.gov/nationsreportcard/nde/), retrieved April 20
Vermont2,3 .......................... 157 (1.0) 161 (0.9) 163 (1.2) 159 (1.2) 162 (1.0) ‡ (†) ‡ (†) ‡ (†) ‡Virginia ................................ 149 (1.6) 152 (1.2) 156 (1.6) 148 (1.3) 161 (1.3) 130 (1.9) 138 (3.0) 169 (3.9) ‡Washington ......................... 150 (1.3) — (†) — (†) — (†) — (†) — (†) — (†) — (†) —West Virginia....................... 147 (0.9) 150 (1.1) 153 (1.4) 147 (1.2) 151 (1.1) 125 (3.6) ‡ (†) ‡ (†) ‡Wisconsin2.......................... 160 (1.7) — (†) — (†) — (†) — (†) — (†) — (†) — (†) —Wyoming ............................. 158 (0.6) 158 (1.0) 159 (1.4) 156 (1.2) 161 (0.8) ‡ (†) 139 (3.1) ‡ (†) 1 141
Department of Defense dependents schools
Domestic schools................ 153 (1.1) 159 (1.2) 160 (1.8) 157 (1.7) 169 (2.0) 140 (2.6) 156 (2.7) ‡ (†) ‡Overseas schools ............... 155 (0.7) 159 (0.8) 162 (1.3) 156 (1.0) 168 (1.1) 142 (1.5) 153 (2.5) 160 (2.1) ‡
Other jurisdictionsAmerican Samoa ................ — (†) 72 (2.3) 70 (3.8) 75 (3.2) ‡ (†) ‡ (†) 55 (3.7) 90 (3.8) ‡Guam .................................. 120 (1.1) 114 (4.5) 116 (4.7) 112 (4.7) ‡ (†) ‡ (†) 97 (9.2) 119 (2.7) ‡
Table 124. Average scale score in science for 8th-graders in public schools, by selected student characteristics, region, and state or jurisdiction: 19
Region and state or jurisdiction
Average scale score Sex, 2000 Race/ethnicity, 2000
1996 2000 Male FemaleWhite,
non-HispanicBlack,
non-Hispanic HispanicAsian/
Pacific IslanderAmerican
Alaska
1 2 3 4 5 6 7 8 9
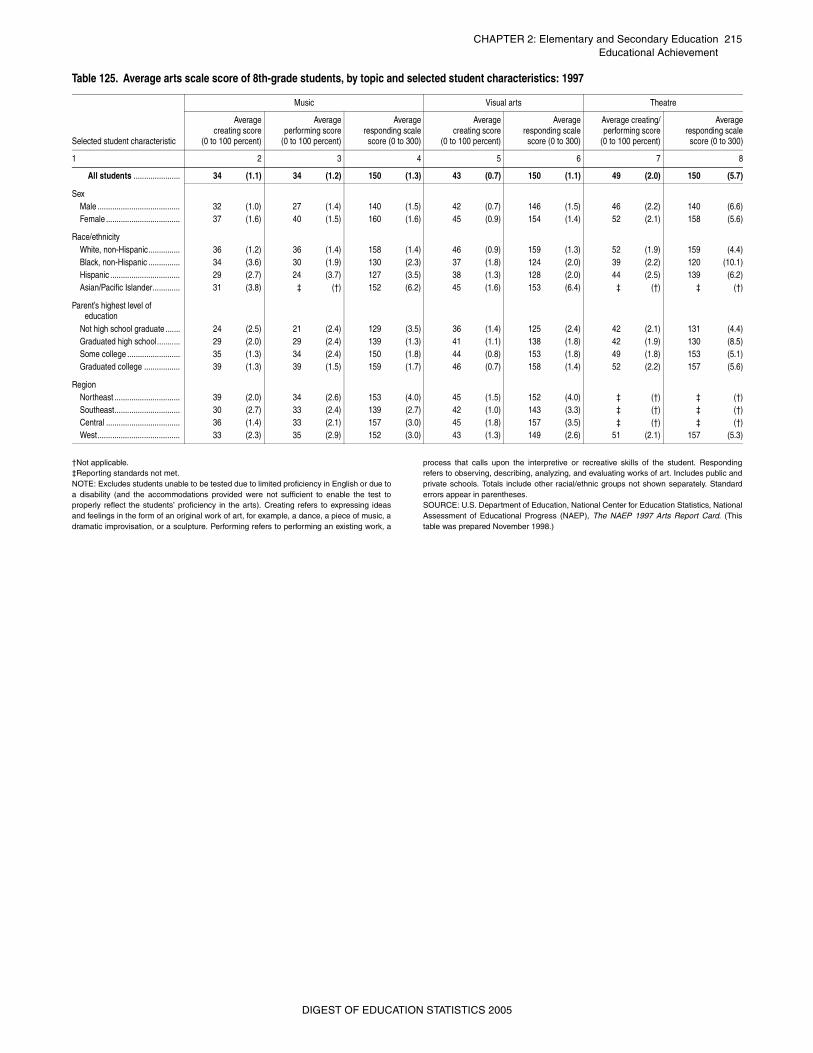
CHAPTER 2: Elementary and Secondary Education 215Educational Achievement
†Not applicable.‡Reporting standards not met.NOTE: Excludes students unable to be tested due to limited proficiency in English or due toa disability (and the accommodations provided were not sufficient to enable the test toproperly reflect the students’ proficiency in the arts). Creating refers to expressing ideasand feelings in the form of an original work of art, for example, a dance, a piece of music, adramatic improvisation, or a sculpture. Performing refers to performing an existing work, a
process that calls upon the interpretive or recreative skills of the student. Respondingrefers to observing, describing, analyzing, and evaluating works of art. Includes public andprivate schools. Totals include other racial/ethnic groups not shown separately. Standarderrors appear in parentheses.SOURCE: U.S. Department of Education, National Center for Education Statistics, NationalAssessment of Educational Progress (NAEP), The NAEP 1997 Arts Report Card. (Thistable was prepared November 1998.)
Table 125. Average arts scale score of 8th-grade students, by topic and selected student characteristics: 1997
Selected student characteristic
Music Visual arts Theatre
Averagecreating score
(0 to 100 percent)
Averageperforming score
(0 to 100 percent)
Averageresponding scale
score (0 to 300)
Averagecreating score
(0 to 100 percent)
Averageresponding scale
score (0 to 300)
Average creating/performing score
(0 to 100 percent)
Averageresponding scale
score (0 to 300)
1 2 3 4 5 6 7 8
All students ...................... 34 (1.1) 34 (1.2) 150 (1.3) 43 (0.7) 150 (1.1) 49 (2.0) 150 (5.7)
SexMale ....................................... 32 (1.0) 27 (1.4) 140 (1.5) 42 (0.7) 146 (1.5) 46 (2.2) 140 (6.6)Female ................................... 37 (1.6) 40 (1.5) 160 (1.6) 45 (0.9) 154 (1.4) 52 (2.1) 158 (5.6)
Race/ethnicityWhite, non-Hispanic............... 36 (1.2) 36 (1.4) 158 (1.4) 46 (0.9) 159 (1.3) 52 (1.9) 159 (4.4)Black, non-Hispanic ............... 34 (3.6) 30 (1.9) 130 (2.3) 37 (1.8) 124 (2.0) 39 (2.2) 120 (10.1)Hispanic ................................. 29 (2.7) 24 (3.7) 127 (3.5) 38 (1.3) 128 (2.0) 44 (2.5) 139 (6.2)Asian/Pacific Islander............. 31 (3.8) ‡ (†) 152 (6.2) 45 (1.6) 153 (6.4) ‡ (†) ‡ (†)
Parent’s highest level of education
Not high school graduate ....... 24 (2.5) 21 (2.4) 129 (3.5) 36 (1.4) 125 (2.4) 42 (2.1) 131 (4.4)Graduated high school........... 29 (2.0) 29 (2.4) 139 (1.3) 41 (1.1) 138 (1.8) 42 (1.9) 130 (8.5)Some college ......................... 35 (1.3) 34 (2.4) 150 (1.8) 44 (0.8) 153 (1.8) 49 (1.8) 153 (5.1)Graduated college ................. 39 (1.3) 39 (1.5) 159 (1.7) 46 (0.7) 158 (1.4) 52 (2.2) 157 (5.6)
RegionNortheast ............................... 39 (2.0) 34 (2.6) 153 (4.0) 45 (1.5) 152 (4.0) ‡ (†) ‡ (†)Southeast............................... 30 (2.7) 33 (2.4) 139 (2.7) 42 (1.0) 143 (3.3) ‡ (†) ‡ (†)Central ................................... 36 (1.4) 33 (2.1) 157 (3.0) 45 (1.8) 157 (3.5) ‡ (†) ‡ (†)West....................................... 33 (2.3) 35 (2.9) 152 (3.0) 43 (1.3) 149 (2.6) 51 (2.1) 157 (5.3)
DIGEST OF EDUCATION STATISTICS 2005
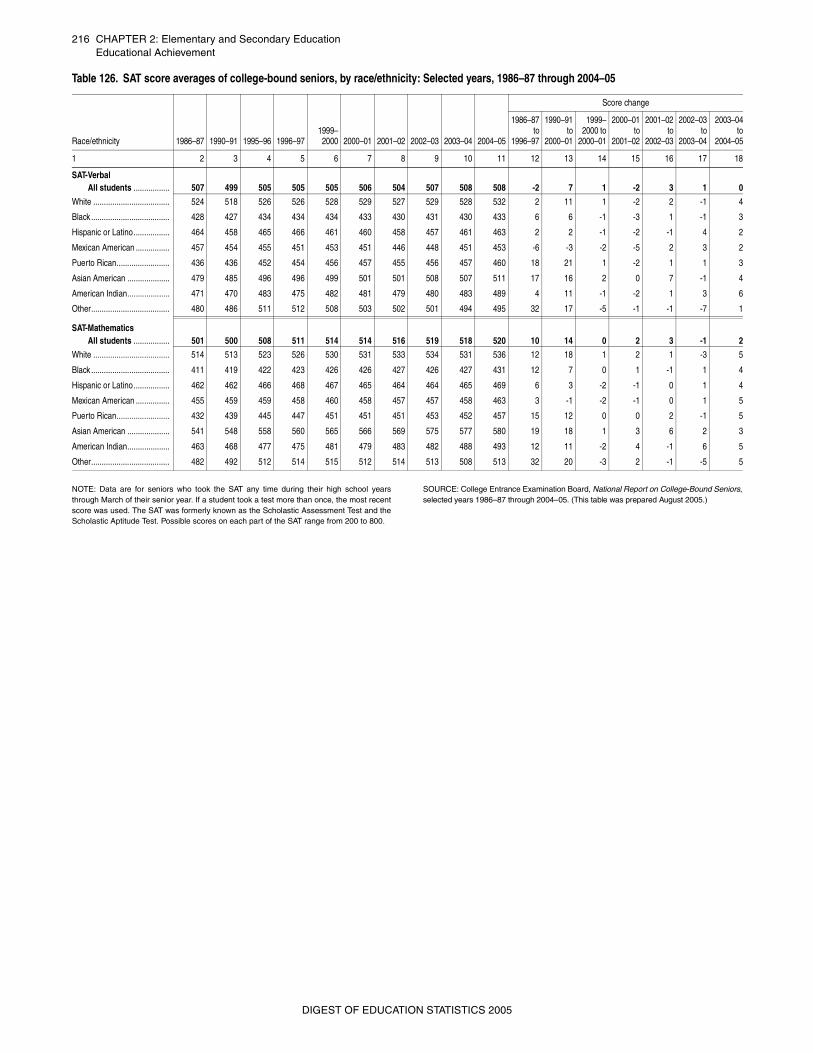
216 CHAPTER 2: Elementary and Secondary EducationEducational Achievement
_
NOTE: Data are for seniors who took the SAT any time during their high school yearsthrough March of their senior year. If a student took a test more than once, the most recentscore was used. The SAT was formerly known as the Scholastic Assessment Test and theScholastic Aptitude Test. Possible scores on each part of the SAT range from 200 to 800.
SOURCE: College Entrance Examination Board, National Report on College-Bound Seniors,selected years 1986–87 through 2004–05. (This table was prepared August 2005.)
Table 126. SAT score averages of college-bound seniors, by race/ethnicity: Selected years, 1986–87 through 2004–05
Race/ethnicity 1986–87 1990–91 1995–96 1996–971999–2000 2000–01 2001–02 2002–03 2003–04 2004–05
Score change
1986–87to
1996–97
1990–91to
2000–01
1999–2000 to
2000–01
2000–01to
2001–02
2001–02to
2002–03
2002–03to
2003–04
2003–04to
2004–05
1 2 3 4 5 6 7 8 9 10 11 12 13 14 15 16 17 18
SAT-VerbalAll students ................. 507 499 505 505 505 506 504 507 508 508 -2 7 1 -2 3 1 0
White .................................... 524 518 526 526 528 529 527 529 528 532 2 11 1 -2 2 -1 4
Black ..................................... 428 427 434 434 434 433 430 431 430 433 6 6 -1 -3 1 -1 3
Hispanic or Latino................. 464 458 465 466 461 460 458 457 461 463 2 2 -1 -2 -1 4 2
Mexican American ................ 457 454 455 451 453 451 446 448 451 453 -6 -3 -2 -5 2 3 2
Puerto Rican......................... 436 436 452 454 456 457 455 456 457 460 18 21 1 -2 1 1 3
Asian American .................... 479 485 496 496 499 501 501 508 507 511 17 16 2 0 7 -1 4
American Indian.................... 471 470 483 475 482 481 479 480 483 489 4 11 -1 -2 1 3 6
Other..................................... 480 486 511 512 508 503 502 501 494 495 32 17 -5 -1 -1 -7 1
SAT-MathematicsAll students ................. 501 500 508 511 514 514 516 519 518 520 10 14 0 2 3 -1 2
White .................................... 514 513 523 526 530 531 533 534 531 536 12 18 1 2 1 -3 5
Black ..................................... 411 419 422 423 426 426 427 426 427 431 12 7 0 1 -1 1 4
Hispanic or Latino................. 462 462 466 468 467 465 464 464 465 469 6 3 -2 -1 0 1 4
Mexican American ................ 455 459 459 458 460 458 457 457 458 463 3 -1 -2 -1 0 1 5
Puerto Rican......................... 432 439 445 447 451 451 451 453 452 457 15 12 0 0 2 -1 5
Asian American .................... 541 548 558 560 565 566 569 575 577 580 19 18 1 3 6 2 3
American Indian.................... 463 468 477 475 481 479 483 482 488 493 12 11 -2 4 -1 6 5
Other..................................... 482 492 512 514 515 512 514 513 508 513 32 20 -3 2 -1 -5 5
DIGEST OF EDUCATION STATISTICS 2005
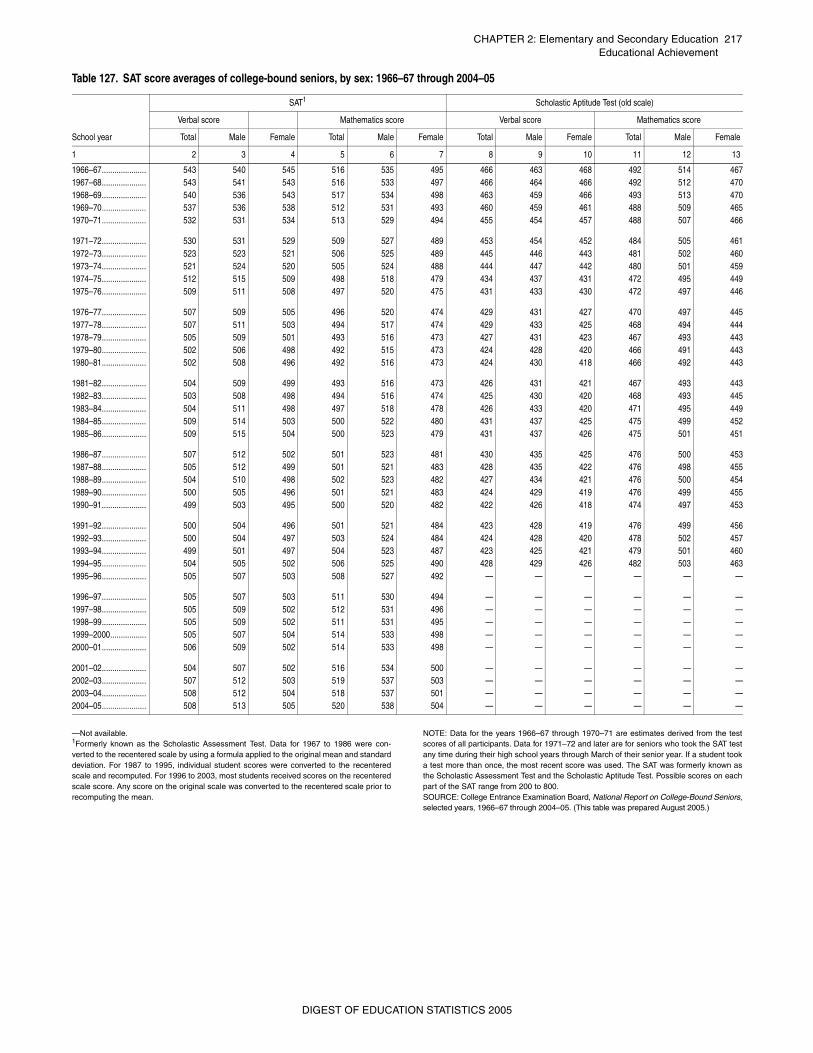
CHAPTER 2: Elementary and Secondary Education 217Educational Achievement
—Not available. 1Formerly known as the Scholastic Assessment Test. Data for 1967 to 1986 were con-verted to the recentered scale by using a formula applied to the original mean and standarddeviation. For 1987 to 1995, individual student scores were converted to the recenteredscale and recomputed. For 1996 to 2003, most students received scores on the recenteredscale score. Any score on the original scale was converted to the recentered scale prior torecomputing the mean.
NOTE: Data for the years 1966–67 through 1970–71 are estimates derived from the testscores of all participants. Data for 1971–72 and later are for seniors who took the SAT testany time during their high school years through March of their senior year. If a student tooka test more than once, the most recent score was used. The SAT was formerly known asthe Scholastic Assessment Test and the Scholastic Aptitude Test. Possible scores on eachpart of the SAT range from 200 to 800. SOURCE: College Entrance Examination Board, National Report on College-Bound Seniors,selected years, 1966–67 through 2004–05. (This table was prepared August 2005.)
Table 127. SAT score averages of college-bound seniors, by sex: 1966–67 through 2004–05
School year
SAT1 Scholastic Aptitude Test (old scale)
Verbal score Mathematics score Verbal score Mathematics score
Total Male Female Total Male Female Total Male Female Total Male Female
1 2 3 4 5 6 7 8 9 10 11 12 13
1966–67..................... 543 540 545 516 535 495 466 463 468 492 514 4671967–68..................... 543 541 543 516 533 497 466 464 466 492 512 4701968–69..................... 540 536 543 517 534 498 463 459 466 493 513 4701969–70..................... 537 536 538 512 531 493 460 459 461 488 509 4651970–71..................... 532 531 534 513 529 494 455 454 457 488 507 466
1971–72..................... 530 531 529 509 527 489 453 454 452 484 505 4611972–73..................... 523 523 521 506 525 489 445 446 443 481 502 4601973–74..................... 521 524 520 505 524 488 444 447 442 480 501 4591974–75..................... 512 515 509 498 518 479 434 437 431 472 495 4491975–76..................... 509 511 508 497 520 475 431 433 430 472 497 446
1976–77..................... 507 509 505 496 520 474 429 431 427 470 497 4451977–78..................... 507 511 503 494 517 474 429 433 425 468 494 4441978–79..................... 505 509 501 493 516 473 427 431 423 467 493 4431979–80..................... 502 506 498 492 515 473 424 428 420 466 491 4431980–81..................... 502 508 496 492 516 473 424 430 418 466 492 443
1981–82..................... 504 509 499 493 516 473 426 431 421 467 493 4431982–83..................... 503 508 498 494 516 474 425 430 420 468 493 4451983–84..................... 504 511 498 497 518 478 426 433 420 471 495 4491984–85..................... 509 514 503 500 522 480 431 437 425 475 499 4521985–86..................... 509 515 504 500 523 479 431 437 426 475 501 451
1986–87..................... 507 512 502 501 523 481 430 435 425 476 500 4531987–88..................... 505 512 499 501 521 483 428 435 422 476 498 4551988–89..................... 504 510 498 502 523 482 427 434 421 476 500 4541989–90..................... 500 505 496 501 521 483 424 429 419 476 499 4551990–91..................... 499 503 495 500 520 482 422 426 418 474 497 453
1991–92..................... 500 504 496 501 521 484 423 428 419 476 499 4561992–93..................... 500 504 497 503 524 484 424 428 420 478 502 4571993–94..................... 499 501 497 504 523 487 423 425 421 479 501 4601994–95..................... 504 505 502 506 525 490 428 429 426 482 503 4631995–96..................... 505 507 503 508 527 492 — — — — — —
1996–97..................... 505 507 503 511 530 494 — — — — — —1997–98..................... 505 509 502 512 531 496 — — — — — —1998–99..................... 505 509 502 511 531 495 — — — — — —1999–2000................. 505 507 504 514 533 498 — — — — — —2000–01..................... 506 509 502 514 533 498 — — — — — —
2001–02..................... 504 507 502 516 534 500 — — — — — —2002–03..................... 507 512 503 519 537 503 — — — — — —2003–04..................... 508 512 504 518 537 501 — — — — — —2004–05..................... 508 513 505 520 538 504 — — — — — —
DIGEST OF EDUCATION STATISTICS 2005
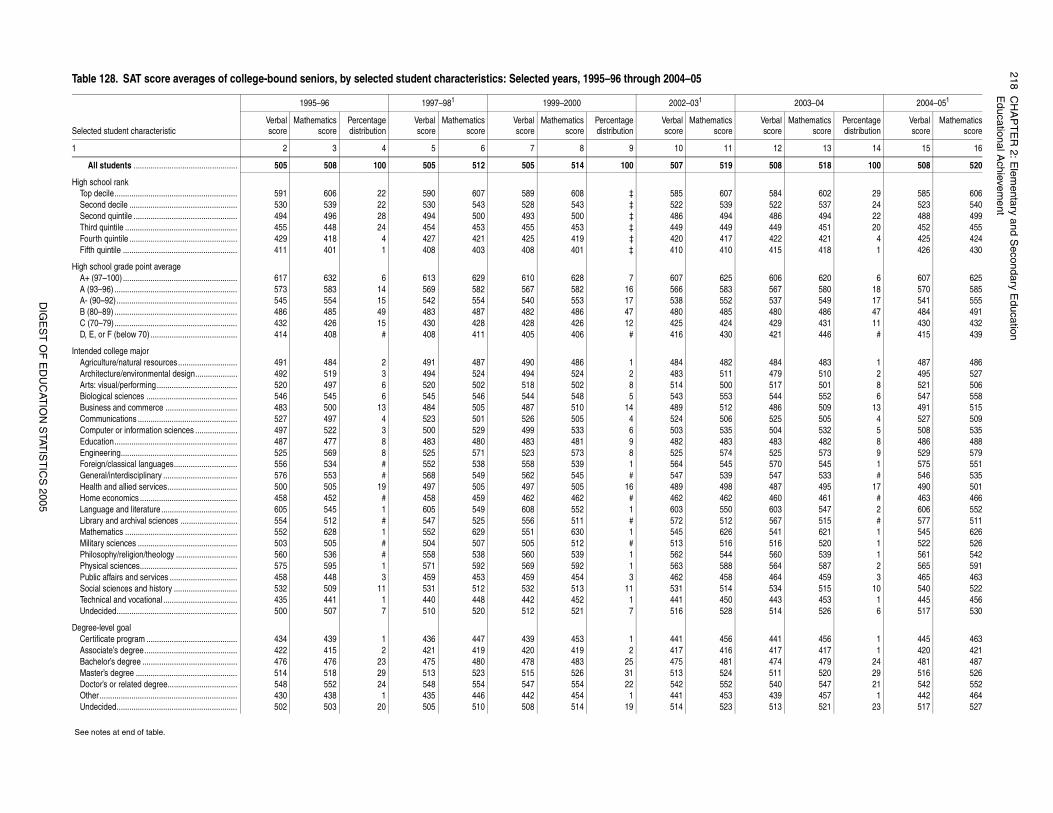
218C
HA
PT
ER
2: Elem
entary and Secondary E
ducationE
ducational Achievem
ent
DIG
ES
T O
F E
DU
CAT
ION
STAT
IST
ICS
2005
2003–04 2004–051
Verbalscore
Mathematicsscore
Percentagedistribution
Verbalscore
Mathematicsscore
12 13 14 15 16
508 518 100 508 520
584 602 29 585 606522 537 24 523 540486 494 22 488 499449 451 20 452 455422 421 4 425 424415 418 1 426 430
606 620 6 607 625567 580 18 570 585537 549 17 541 555480 486 47 484 491429 431 11 430 432421 446 # 415 439
484 483 1 487 486479 510 2 495 527517 501 8 521 506544 552 6 547 558486 509 13 491 515525 505 4 527 509504 532 5 508 535483 482 8 486 488525 573 9 529 579570 545 1 575 551547 533 # 546 535487 495 17 490 501460 461 # 463 466603 547 2 606 552567 515 # 577 511541 621 1 545 626516 520 1 522 526560 539 1 561 542564 587 2 565 591464 459 3 465 463534 515 10 540 522443 453 1 445 456514 526 6 517 530
441 456 1 445 463417 417 1 420 421474 479 24 481 487511 520 29 516 526540 547 21 542 552439 457 1 442 464513 521 23 517 527
Table 128. SAT score averages of college-bound seniors, by selected student characteristics: Selected years, 1995–96 through 2004–05
Selected student characteristic
1995–96 1997–981 1999–2000 2002–031
Verbalscore
Mathematicsscore
Percentagedistribution
Verbalscore
Mathematicsscore
Verbalscore
Mathematicsscore
Percentagedistribution
Verbalscore
Mathematicsscore
1 2 3 4 5 6 7 8 9 10 11
All students ................................................. 505 508 100 505 512 505 514 100 507 519
High school rankTop decile.......................................................... 591 606 22 590 607 589 608 ‡ 585 607Second decile ................................................... 530 539 22 530 543 528 543 ‡ 522 539Second quintile ................................................. 494 496 28 494 500 493 500 ‡ 486 494Third quintile ..................................................... 455 448 24 454 453 455 453 ‡ 449 449Fourth quintile ................................................... 429 418 4 427 421 425 419 ‡ 420 417Fifth quintile ...................................................... 411 401 1 408 403 408 401 ‡ 410 410
High school grade point averageA+ (97–100) ...................................................... 617 632 6 613 629 610 628 7 607 625A (93–96) .......................................................... 573 583 14 569 582 567 582 16 566 583A- (90–92) ......................................................... 545 554 15 542 554 540 553 17 538 552B (80–89) .......................................................... 486 485 49 483 487 482 486 47 480 485C (70–79) .......................................................... 432 426 15 430 428 428 426 12 425 424D, E, or F (below 70) ......................................... 414 408 # 408 411 405 406 # 416 430
Intended college majorAgriculture/natural resources............................ 491 484 2 491 487 490 486 1 484 482Architecture/environmental design.................... 492 519 3 494 524 494 524 2 483 511Arts: visual/performing...................................... 520 497 6 520 502 518 502 8 514 500Biological sciences ........................................... 546 545 6 545 546 544 548 5 543 553Business and commerce .................................. 483 500 13 484 505 487 510 14 489 512Communications ............................................... 527 497 4 523 501 526 505 4 524 506Computer or information sciences .................... 497 522 3 500 529 499 533 6 503 535Education.......................................................... 487 477 8 483 480 483 481 9 482 483Engineering....................................................... 525 569 8 525 571 523 573 8 525 574Foreign/classical languages.............................. 556 534 # 552 538 558 539 1 564 545General/interdisciplinary ................................... 576 553 # 568 549 562 545 # 547 539Health and allied services................................. 500 505 19 497 505 497 505 16 489 498Home economics .............................................. 458 452 # 458 459 462 462 # 462 462Language and literature .................................... 605 545 1 605 549 608 552 1 603 550Library and archival sciences ........................... 554 512 # 547 525 556 511 # 572 512Mathematics ..................................................... 552 628 1 552 629 551 630 1 545 626Military sciences ............................................... 503 505 # 504 507 505 512 # 513 516Philosophy/religion/theology ............................. 560 536 # 558 538 560 539 1 562 544Physical sciences.............................................. 575 595 1 571 592 569 592 1 563 588Public affairs and services ................................ 458 448 3 459 453 459 454 3 462 458Social sciences and history .............................. 532 509 11 531 512 532 513 11 531 514Technical and vocational ................................... 435 441 1 440 448 442 452 1 441 450Undecided......................................................... 500 507 7 510 520 512 521 7 516 528
Degree-level goalCertificate program ........................................... 434 439 1 436 447 439 453 1 441 456Associate’s degree............................................ 422 415 2 421 419 420 419 2 417 416Bachelor’s degree ............................................. 476 476 23 475 480 478 483 25 475 481Master’s degree ................................................ 514 518 29 513 523 515 526 31 513 524Doctor’s or related degree................................. 548 552 24 548 554 547 554 22 542 552Other ................................................................. 430 438 1 435 446 442 454 1 441 453Undecided......................................................... 502 503 20 505 510 508 514 19 514 523
See notes at end of table.
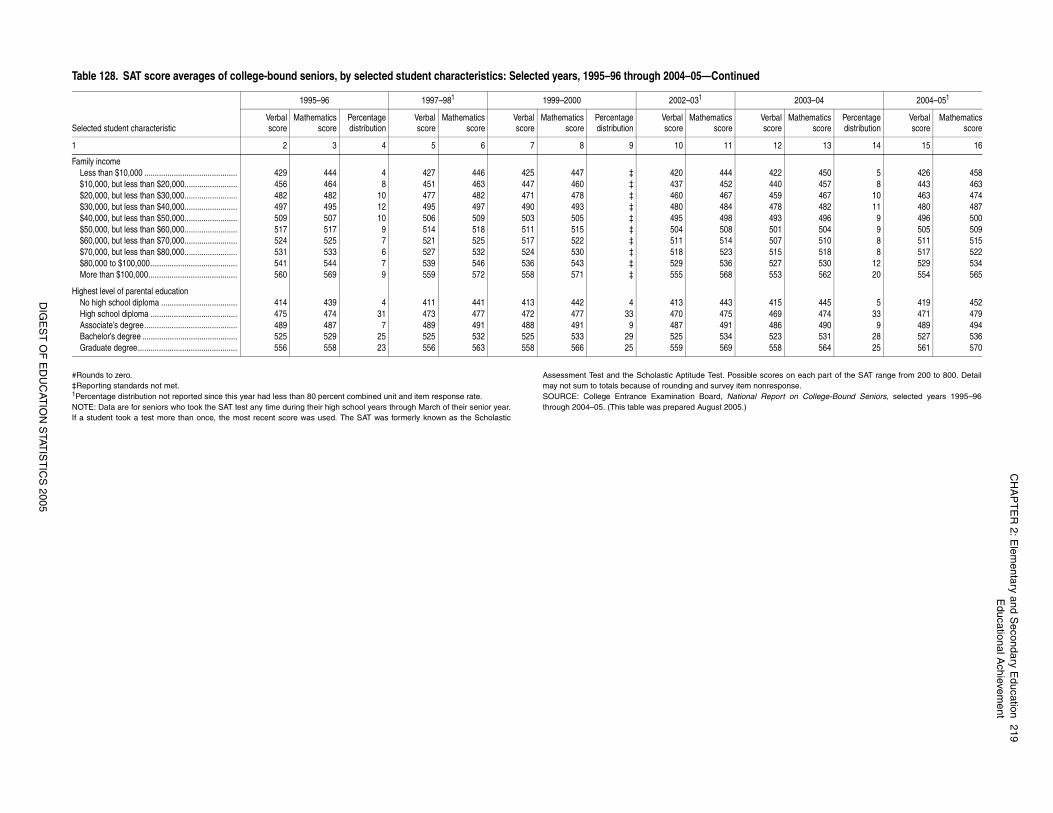
CH
AP
TE
R 2: E
lementary and S
econdary Education
219E
ducational Achievem
ent
DIG
ES
T O
F E
DU
CAT
ION
STAT
IST
ICS
2005
scores on each part of the SAT range from 200 to 800. Detailonresponse.
l Report on College-Bound Seniors, selected years 1995–96
422 450 5 426 458440 457 8 443 463459 467 10 463 474478 482 11 480 487493 496 9 496 500501 504 9 505 509507 510 8 511 515515 518 8 517 522527 530 12 529 534553 562 20 554 565
415 445 5 419 452469 474 33 471 479486 490 9 489 494523 531 28 527 536558 564 25 561 570
2003–04 2004–051
Verbalscore
Mathematicsscore
Percentagedistribution
Verbalscore
Mathematicsscore
12 13 14 15 16
#Rounds to zero.‡Reporting standards not met.1Percentage distribution not reported since this year had less than 80 percent combined unit and item response rate.NOTE: Data are for seniors who took the SAT test any time during their high school years through March of their senior year.If a student took a test more than once, the most recent score was used. The SAT was formerly known as the Scholastic
Assessment Test and the Scholastic Aptitude Test. Possiblemay not sum to totals because of rounding and survey item nSOURCE: College Entrance Examination Board, Nationathrough 2004–05. (This table was prepared August 2005.)
Family incomeLess than $10,000 ............................................ 429 444 4 427 446 425 447 ‡ 420 444$10,000, but less than $20,000......................... 456 464 8 451 463 447 460 ‡ 437 452$20,000, but less than $30,000......................... 482 482 10 477 482 471 478 ‡ 460 467$30,000, but less than $40,000......................... 497 495 12 495 497 490 493 ‡ 480 484$40,000, but less than $50,000......................... 509 507 10 506 509 503 505 ‡ 495 498$50,000, but less than $60,000......................... 517 517 9 514 518 511 515 ‡ 504 508$60,000, but less than $70,000......................... 524 525 7 521 525 517 522 ‡ 511 514$70,000, but less than $80,000......................... 531 533 6 527 532 524 530 ‡ 518 523$80,000 to $100,000......................................... 541 544 7 539 546 536 543 ‡ 529 536More than $100,000.......................................... 560 569 9 559 572 558 571 ‡ 555 568
Highest level of parental educationNo high school diploma .................................... 414 439 4 411 441 413 442 4 413 443High school diploma ......................................... 475 474 31 473 477 472 477 33 470 475Associate’s degree............................................ 489 487 7 489 491 488 491 9 487 491Bachelor’s degree ............................................. 525 529 25 525 532 525 533 29 525 534Graduate degree............................................... 556 558 23 556 563 558 566 25 559 569
Table 128. SAT score averages of college-bound seniors, by selected student characteristics: Selected years, 1995–96 through 2004–05—Continued
Selected student characteristic
1995–96 1997–981 1999–2000 2002–031
Verbalscore
Mathematicsscore
Percentagedistribution
Verbalscore
Mathematicsscore
Verbalscore
Mathematicsscore
Percentagedistribution
Verbalscore
Mathematicsscore
1 2 3 4 5 6 7 8 9 10 11
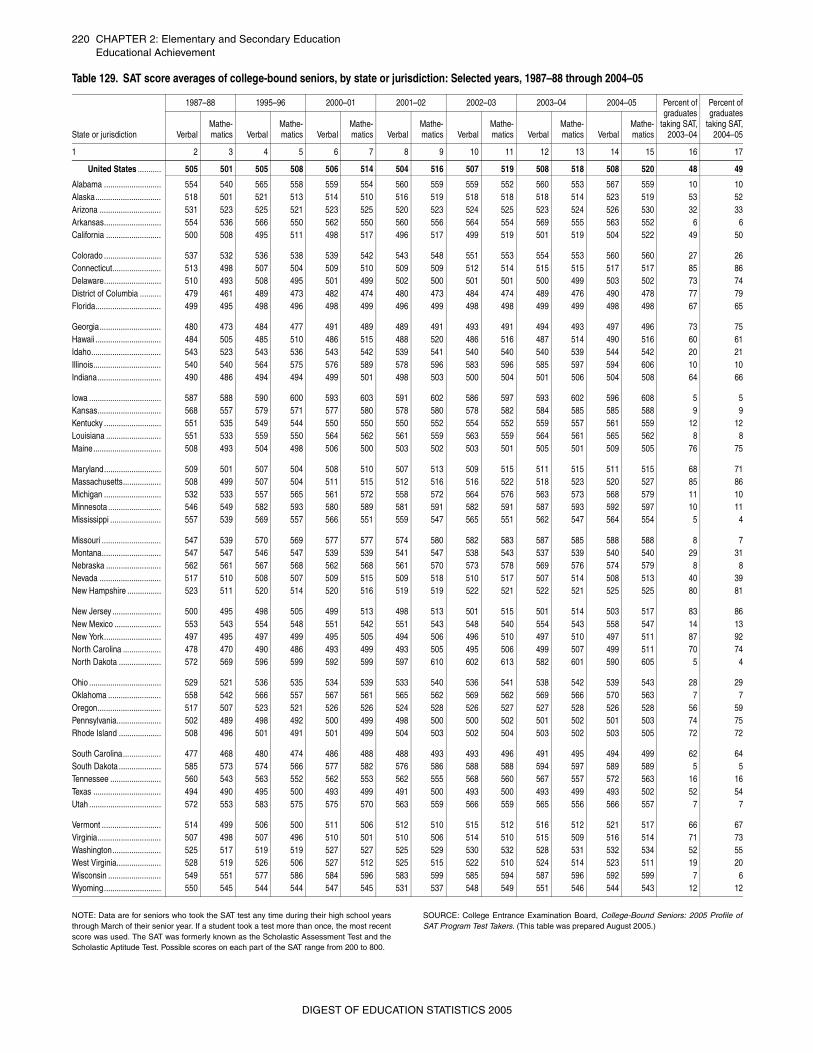
220 CHAPTER 2: Elementary and Secondary EducationEducational Achievement
NOTE: Data are for seniors who took the SAT test any time during their high school yearsthrough March of their senior year. If a student took a test more than once, the most recentscore was used. The SAT was formerly known as the Scholastic Assessment Test and theScholastic Aptitude Test. Possible scores on each part of the SAT range from 200 to 800.
SOURCE: College Entrance Examination Board, College-Bound Seniors: 2005 Profile ofSAT Program Test Takers. (This table was prepared August 2005.)
Table 129. SAT score averages of college-bound seniors, by state or jurisdiction: Selected years, 1987–88 through 2004–05
State or jurisdiction
1987–88 1995–96 2000–01 2001–02 2002–03 2003–04 2004–05 Percent ofgraduates
taking SAT,2003–04
Percent ofgraduates
taking SAT,2004–05Verbal
Mathe-matics Verbal
Mathe-matics Verbal
Mathe-matics Verbal
Mathe-matics Verbal
Mathe-matics Verbal
Mathe-matics Verbal
Mathe-matics
1 2 3 4 5 6 7 8 9 10 11 12 13 14 15 16 17
United States ........... 505 501 505 508 506 514 504 516 507 519 508 518 508 520 48 49
Alabama ........................... 554 540 565 558 559 554 560 559 559 552 560 553 567 559 10 10Alaska............................... 518 501 521 513 514 510 516 519 518 518 518 514 523 519 53 52Arizona ............................. 531 523 525 521 523 525 520 523 524 525 523 524 526 530 32 33Arkansas........................... 554 536 566 550 562 550 560 556 564 554 569 555 563 552 6 6California .......................... 500 508 495 511 498 517 496 517 499 519 501 519 504 522 49 50
Colorado ........................... 537 532 536 538 539 542 543 548 551 553 554 553 560 560 27 26Connecticut....................... 513 498 507 504 509 510 509 509 512 514 515 515 517 517 85 86Delaware........................... 510 493 508 495 501 499 502 500 501 501 500 499 503 502 73 74District of Columbia .......... 479 461 489 473 482 474 480 473 484 474 489 476 490 478 77 79Florida............................... 499 495 498 496 498 499 496 499 498 498 499 499 498 498 67 65
Georgia............................. 480 473 484 477 491 489 489 491 493 491 494 493 497 496 73 75Hawaii ............................... 484 505 485 510 486 515 488 520 486 516 487 514 490 516 60 61Idaho................................. 543 523 543 536 543 542 539 541 540 540 540 539 544 542 20 21Illinois................................ 540 540 564 575 576 589 578 596 583 596 585 597 594 606 10 10Indiana.............................. 490 486 494 494 499 501 498 503 500 504 501 506 504 508 64 66
Iowa .................................. 587 588 590 600 593 603 591 602 586 597 593 602 596 608 5 5Kansas.............................. 568 557 579 571 577 580 578 580 578 582 584 585 585 588 9 9Kentucky ........................... 551 535 549 544 550 550 550 552 554 552 559 557 561 559 12 12Louisiana .......................... 551 533 559 550 564 562 561 559 563 559 564 561 565 562 8 8Maine................................ 508 493 504 498 506 500 503 502 503 501 505 501 509 505 76 75
Maryland........................... 509 501 507 504 508 510 507 513 509 515 511 515 511 515 68 71Massachusetts.................. 508 499 507 504 511 515 512 516 516 522 518 523 520 527 85 86Michigan ........................... 532 533 557 565 561 572 558 572 564 576 563 573 568 579 11 10Minnesota ......................... 546 549 582 593 580 589 581 591 582 591 587 593 592 597 10 11Mississippi ........................ 557 539 569 557 566 551 559 547 565 551 562 547 564 554 5 4
Missouri ............................ 547 539 570 569 577 577 574 580 582 583 587 585 588 588 8 7Montana............................ 547 547 546 547 539 539 541 547 538 543 537 539 540 540 29 31Nebraska .......................... 562 561 567 568 562 568 561 570 573 578 569 576 574 579 8 8Nevada ............................. 517 510 508 507 509 515 509 518 510 517 507 514 508 513 40 39New Hampshire ................ 523 511 520 514 520 516 519 519 522 521 522 521 525 525 80 81
New Jersey ....................... 500 495 498 505 499 513 498 513 501 515 501 514 503 517 83 86New Mexico ...................... 553 543 554 548 551 542 551 543 548 540 554 543 558 547 14 13New York........................... 497 495 497 499 495 505 494 506 496 510 497 510 497 511 87 92North Carolina .................. 478 470 490 486 493 499 493 505 495 506 499 507 499 511 70 74North Dakota .................... 572 569 596 599 592 599 597 610 602 613 582 601 590 605 5 4
Ohio .................................. 529 521 536 535 534 539 533 540 536 541 538 542 539 543 28 29Oklahoma ......................... 558 542 566 557 567 561 565 562 569 562 569 566 570 563 7 7Oregon.............................. 517 507 523 521 526 526 524 528 526 527 527 528 526 528 56 59Pennsylvania..................... 502 489 498 492 500 499 498 500 500 502 501 502 501 503 74 75Rhode Island .................... 508 496 501 491 501 499 504 503 502 504 503 502 503 505 72 72
South Carolina.................. 477 468 480 474 486 488 488 493 493 496 491 495 494 499 62 64South Dakota .................... 585 573 574 566 577 582 576 586 588 588 594 597 589 589 5 5Tennessee ........................ 560 543 563 552 562 553 562 555 568 560 567 557 572 563 16 16Texas ................................ 494 490 495 500 493 499 491 500 493 500 493 499 493 502 52 54Utah .................................. 572 553 583 575 575 570 563 559 566 559 565 556 566 557 7 7
Vermont ............................ 514 499 506 500 511 506 512 510 515 512 516 512 521 517 66 67Virginia.............................. 507 498 507 496 510 501 510 506 514 510 515 509 516 514 71 73Washington....................... 525 517 519 519 527 527 525 529 530 532 528 531 532 534 52 55West Virginia..................... 528 519 526 506 527 512 525 515 522 510 524 514 523 511 19 20Wisconsin ......................... 549 551 577 586 584 596 583 599 585 594 587 596 592 599 7 6Wyoming........................... 550 545 544 544 547 545 531 537 548 549 551 546 544 543 12 12
DIGEST OF EDUCATION STATISTICS 2005
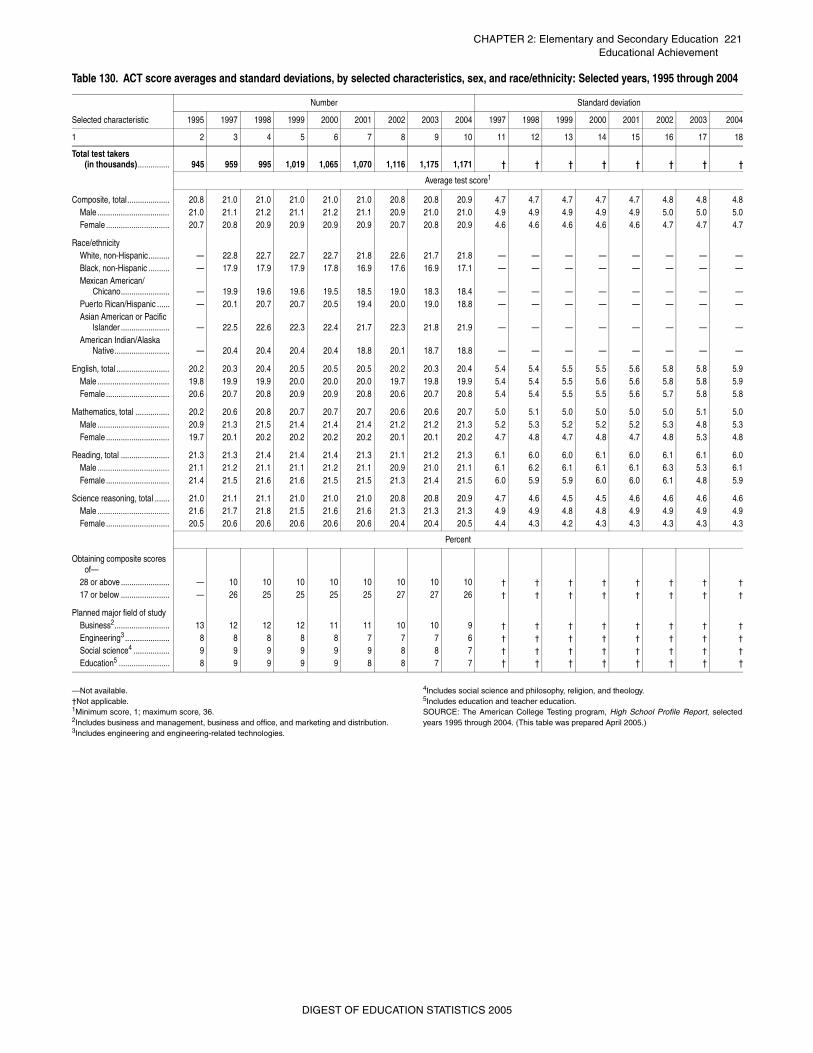
CHAPTER 2: Elementary and Secondary Education 221Educational Achievement
_
—Not available.†Not applicable.1Minimum score, 1; maximum score, 36.2Includes business and management, business and office, and marketing and distribution.3Includes engineering and engineering-related technologies.
4Includes social science and philosophy, religion, and theology.5Includes education and teacher education.SOURCE: The American College Testing program, High School Profile Report, selectedyears 1995 through 2004. (This table was prepared April 2005.)
Table 130. ACT score averages and standard deviations, by selected characteristics, sex, and race/ethnicity: Selected years, 1995 through 2004
Selected characteristic
Number Standard deviation
1995 1997 1998 1999 2000 2001 2002 2003 2004 1997 1998 1999 2000 2001 2002 2003 2004
1 2 3 4 5 6 7 8 9 10 11 12 13 14 15 16 17 18
Total test takers (in thousands) ............... 945 959 995 1,019 1,065 1,070 1,116 1,175 1,171 † † † † † † † †
Average test score1
Composite, total.................... 20.8 21.0 21.0 21.0 21.0 21.0 20.8 20.8 20.9 4.7 4.7 4.7 4.7 4.7 4.8 4.8 4.8Male .................................. 21.0 21.1 21.2 21.1 21.2 21.1 20.9 21.0 21.0 4.9 4.9 4.9 4.9 4.9 5.0 5.0 5.0Female .............................. 20.7 20.8 20.9 20.9 20.9 20.9 20.7 20.8 20.9 4.6 4.6 4.6 4.6 4.6 4.7 4.7 4.7
Race/ethnicityWhite, non-Hispanic.......... — 22.8 22.7 22.7 22.7 21.8 22.6 21.7 21.8 — — — — — — — —Black, non-Hispanic .......... — 17.9 17.9 17.9 17.8 16.9 17.6 16.9 17.1 — — — — — — — —Mexican American/
Chicano....................... — 19.9 19.6 19.6 19.5 18.5 19.0 18.3 18.4 — — — — — — — —Puerto Rican/Hispanic ...... — 20.1 20.7 20.7 20.5 19.4 20.0 19.0 18.8 — — — — — — — —Asian American or Pacific
Islander ....................... — 22.5 22.6 22.3 22.4 21.7 22.3 21.8 21.9 — — — — — — — —American Indian/Alaska
Native.......................... — 20.4 20.4 20.4 20.4 18.8 20.1 18.7 18.8 — — — — — — — —
English, total ......................... 20.2 20.3 20.4 20.5 20.5 20.5 20.2 20.3 20.4 5.4 5.4 5.5 5.5 5.6 5.8 5.8 5.9Male .................................. 19.8 19.9 19.9 20.0 20.0 20.0 19.7 19.8 19.9 5.4 5.4 5.5 5.6 5.6 5.8 5.8 5.9Female .............................. 20.6 20.7 20.8 20.9 20.9 20.8 20.6 20.7 20.8 5.4 5.4 5.5 5.5 5.6 5.7 5.8 5.8
Mathematics, total ................ 20.2 20.6 20.8 20.7 20.7 20.7 20.6 20.6 20.7 5.0 5.1 5.0 5.0 5.0 5.0 5.1 5.0Male .................................. 20.9 21.3 21.5 21.4 21.4 21.4 21.2 21.2 21.3 5.2 5.3 5.2 5.2 5.2 5.3 4.8 5.3Female .............................. 19.7 20.1 20.2 20.2 20.2 20.2 20.1 20.1 20.2 4.7 4.8 4.7 4.8 4.7 4.8 5.3 4.8
Reading, total ....................... 21.3 21.3 21.4 21.4 21.4 21.3 21.1 21.2 21.3 6.1 6.0 6.0 6.1 6.0 6.1 6.1 6.0Male .................................. 21.1 21.2 21.1 21.1 21.2 21.1 20.9 21.0 21.1 6.1 6.2 6.1 6.1 6.1 6.3 5.3 6.1Female .............................. 21.4 21.5 21.6 21.6 21.5 21.5 21.3 21.4 21.5 6.0 5.9 5.9 6.0 6.0 6.1 4.8 5.9
Science reasoning, total ....... 21.0 21.1 21.1 21.0 21.0 21.0 20.8 20.8 20.9 4.7 4.6 4.5 4.5 4.6 4.6 4.6 4.6Male .................................. 21.6 21.7 21.8 21.5 21.6 21.6 21.3 21.3 21.3 4.9 4.9 4.8 4.8 4.9 4.9 4.9 4.9Female .............................. 20.5 20.6 20.6 20.6 20.6 20.6 20.4 20.4 20.5 4.4 4.3 4.2 4.3 4.3 4.3 4.3 4.3
Percent
Obtaining composite scores of—
28 or above ....................... — 10 10 10 10 10 10 10 10 † † † † † † † †
17 or below ....................... — 26 25 25 25 25 27 27 26 † † † † † † † †
Planned major field of studyBusiness2.......................... 13 12 12 12 11 11 10 10 9 † † † † † † † †
Engineering3 ..................... 8 8 8 8 8 7 7 7 6 † † † † † † † †
Social science4 ................. 9 9 9 9 9 9 8 8 7 † † † † † † † †
Education5 ........................ 8 9 9 9 9 8 8 7 7 † † † † † † † †
DIGEST OF EDUCATION STATISTICS 2005
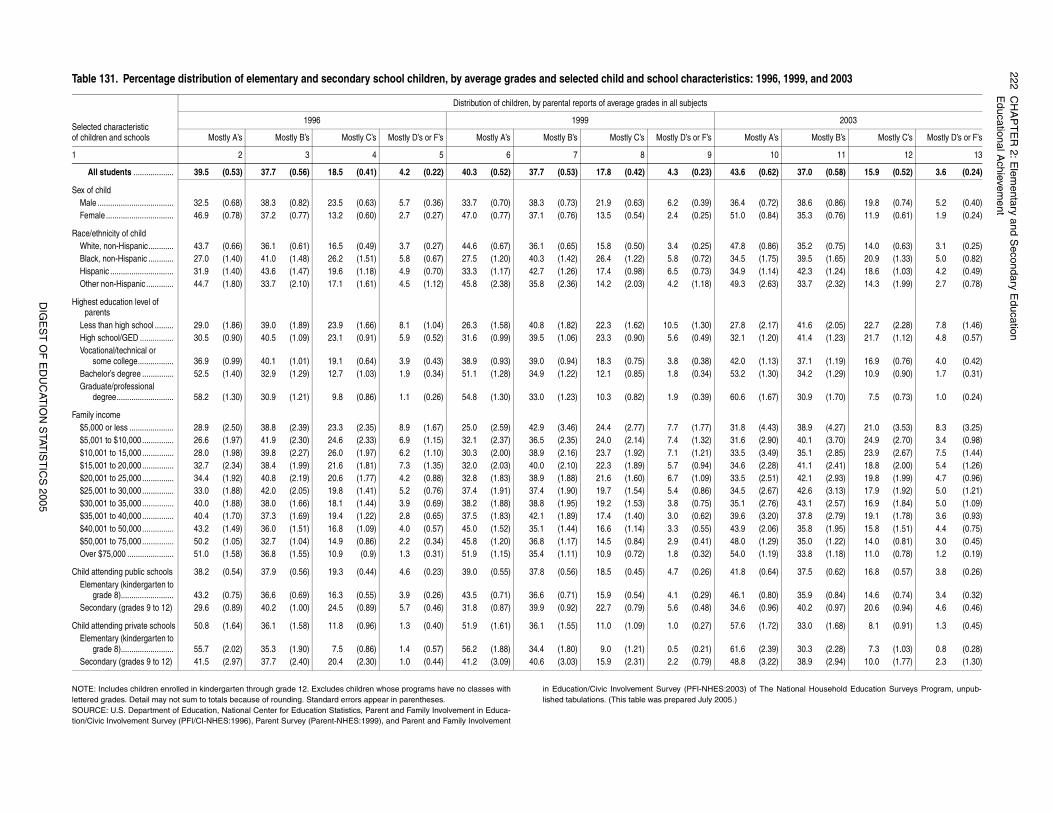
222C
HA
PT
ER
2: Elem
entary and Secondary E
ducationE
ducational Achievem
ent
DIG
ES
T O
F E
DU
CAT
ION
STAT
IST
ICS
2005
The National Household Education Surveys Program, unpub-
1996, 1999, and 2003
2003
stly A’s Mostly B’s Mostly C’s Mostly D’s or F’s
10 11 12 13
(0.62) 37.0 (0.58) 15.9 (0.52) 3.6 (0.24)
(0.72) 38.6 (0.86) 19.8 (0.74) 5.2 (0.40)(0.84) 35.3 (0.76) 11.9 (0.61) 1.9 (0.24)
(0.86) 35.2 (0.75) 14.0 (0.63) 3.1 (0.25)(1.75) 39.5 (1.65) 20.9 (1.33) 5.0 (0.82)(1.14) 42.3 (1.24) 18.6 (1.03) 4.2 (0.49)(2.63) 33.7 (2.32) 14.3 (1.99) 2.7 (0.78)
(2.17) 41.6 (2.05) 22.7 (2.28) 7.8 (1.46)(1.20) 41.4 (1.23) 21.7 (1.12) 4.8 (0.57)
(1.13) 37.1 (1.19) 16.9 (0.76) 4.0 (0.42)(1.30) 34.2 (1.29) 10.9 (0.90) 1.7 (0.31)
(1.67) 30.9 (1.70) 7.5 (0.73) 1.0 (0.24)
(4.43) 38.9 (4.27) 21.0 (3.53) 8.3 (3.25)(2.90) 40.1 (3.70) 24.9 (2.70) 3.4 (0.98)(3.49) 35.1 (2.85) 23.9 (2.67) 7.5 (1.44)(2.28) 41.1 (2.41) 18.8 (2.00) 5.4 (1.26)(2.51) 42.1 (2.93) 19.8 (1.99) 4.7 (0.96)(2.67) 42.6 (3.13) 17.9 (1.92) 5.0 (1.21)(2.76) 43.1 (2.57) 16.9 (1.84) 5.0 (1.09)(3.20) 37.8 (2.79) 19.1 (1.78) 3.6 (0.93)(2.06) 35.8 (1.95) 15.8 (1.51) 4.4 (0.75)(1.29) 35.0 (1.22) 14.0 (0.81) 3.0 (0.45)(1.19) 33.8 (1.18) 11.0 (0.78) 1.2 (0.19)
(0.64) 37.5 (0.62) 16.8 (0.57) 3.8 (0.26)
(0.80) 35.9 (0.84) 14.6 (0.74) 3.4 (0.32)(0.96) 40.2 (0.97) 20.6 (0.94) 4.6 (0.46)
(1.72) 33.0 (1.68) 8.1 (0.91) 1.3 (0.45)
(2.39) 30.3 (2.28) 7.3 (1.03) 0.8 (0.28)(3.22) 38.9 (2.94) 10.0 (1.77) 2.3 (1.30)
NOTE: Includes children enrolled in kindergarten through grade 12. Excludes children whose programs have no classes withlettered grades. Detail may not sum to totals because of rounding. Standard errors appear in parentheses. SOURCE: U.S. Department of Education, National Center for Education Statistics, Parent and Family Involvement in Educa-tion/Civic Involvement Survey (PFI/CI-NHES:1996), Parent Survey (Parent-NHES:1999), and Parent and Family Involvement
in Education/Civic Involvement Survey (PFI-NHES:2003) oflished tabulations. (This table was prepared July 2005.)
Table 131. Percentage distribution of elementary and secondary school children, by average grades and selected child and school characteristics:
Selected characteristicof children and schools
Distribution of children, by parental reports of average grades in all subjects
1996 1999
Mostly A’s Mostly B’s Mostly C’s Mostly D’s or F’s Mostly A’s Mostly B’s Mostly C’s Mostly D’s or F’s Mo
1 2 3 4 5 6 7 8 9
All students ................... 39.5 (0.53) 37.7 (0.56) 18.5 (0.41) 4.2 (0.22) 40.3 (0.52) 37.7 (0.53) 17.8 (0.42) 4.3 (0.23) 43.6
Sex of childMale .................................... 32.5 (0.68) 38.3 (0.82) 23.5 (0.63) 5.7 (0.36) 33.7 (0.70) 38.3 (0.73) 21.9 (0.63) 6.2 (0.39) 36.4Female ................................ 46.9 (0.78) 37.2 (0.77) 13.2 (0.60) 2.7 (0.27) 47.0 (0.77) 37.1 (0.76) 13.5 (0.54) 2.4 (0.25) 51.0
Race/ethnicity of childWhite, non-Hispanic............ 43.7 (0.66) 36.1 (0.61) 16.5 (0.49) 3.7 (0.27) 44.6 (0.67) 36.1 (0.65) 15.8 (0.50) 3.4 (0.25) 47.8Black, non-Hispanic ............ 27.0 (1.40) 41.0 (1.48) 26.2 (1.51) 5.8 (0.67) 27.5 (1.20) 40.3 (1.42) 26.4 (1.22) 5.8 (0.72) 34.5Hispanic .............................. 31.9 (1.40) 43.6 (1.47) 19.6 (1.18) 4.9 (0.70) 33.3 (1.17) 42.7 (1.26) 17.4 (0.98) 6.5 (0.73) 34.9Other non-Hispanic ............. 44.7 (1.80) 33.7 (2.10) 17.1 (1.61) 4.5 (1.12) 45.8 (2.38) 35.8 (2.36) 14.2 (2.03) 4.2 (1.18) 49.3
Highest education level of parents
Less than high school ......... 29.0 (1.86) 39.0 (1.89) 23.9 (1.66) 8.1 (1.04) 26.3 (1.58) 40.8 (1.82) 22.3 (1.62) 10.5 (1.30) 27.8High school/GED ................ 30.5 (0.90) 40.5 (1.09) 23.1 (0.91) 5.9 (0.52) 31.6 (0.99) 39.5 (1.06) 23.3 (0.90) 5.6 (0.49) 32.1Vocational/technical or
some college................. 36.9 (0.99) 40.1 (1.01) 19.1 (0.64) 3.9 (0.43) 38.9 (0.93) 39.0 (0.94) 18.3 (0.75) 3.8 (0.38) 42.0Bachelor’s degree ............... 52.5 (1.40) 32.9 (1.29) 12.7 (1.03) 1.9 (0.34) 51.1 (1.28) 34.9 (1.22) 12.1 (0.85) 1.8 (0.34) 53.2Graduate/professional
degree........................... 58.2 (1.30) 30.9 (1.21) 9.8 (0.86) 1.1 (0.26) 54.8 (1.30) 33.0 (1.23) 10.3 (0.82) 1.9 (0.39) 60.6
Family income$5,000 or less ..................... 28.9 (2.50) 38.8 (2.39) 23.3 (2.35) 8.9 (1.67) 25.0 (2.59) 42.9 (3.46) 24.4 (2.77) 7.7 (1.77) 31.8$5,001 to $10,000............... 26.6 (1.97) 41.9 (2.30) 24.6 (2.33) 6.9 (1.15) 32.1 (2.37) 36.5 (2.35) 24.0 (2.14) 7.4 (1.32) 31.6$10,001 to 15,000............... 28.0 (1.98) 39.8 (2.27) 26.0 (1.97) 6.2 (1.10) 30.3 (2.00) 38.9 (2.16) 23.7 (1.92) 7.1 (1.21) 33.5$15,001 to 20,000............... 32.7 (2.34) 38.4 (1.99) 21.6 (1.81) 7.3 (1.35) 32.0 (2.03) 40.0 (2.10) 22.3 (1.89) 5.7 (0.94) 34.6$20,001 to 25,000............... 34.4 (1.92) 40.8 (2.19) 20.6 (1.77) 4.2 (0.88) 32.8 (1.83) 38.9 (1.88) 21.6 (1.60) 6.7 (1.09) 33.5$25,001 to 30,000............... 33.0 (1.88) 42.0 (2.05) 19.8 (1.41) 5.2 (0.76) 37.4 (1.91) 37.4 (1.90) 19.7 (1.54) 5.4 (0.86) 34.5$30,001 to 35,000............... 40.0 (1.88) 38.0 (1.66) 18.1 (1.44) 3.9 (0.69) 38.2 (1.88) 38.8 (1.95) 19.2 (1.53) 3.8 (0.75) 35.1$35,001 to 40,000............... 40.4 (1.70) 37.3 (1.69) 19.4 (1.22) 2.8 (0.65) 37.5 (1.83) 42.1 (1.89) 17.4 (1.40) 3.0 (0.62) 39.6$40,001 to 50,000............... 43.2 (1.49) 36.0 (1.51) 16.8 (1.09) 4.0 (0.57) 45.0 (1.52) 35.1 (1.44) 16.6 (1.14) 3.3 (0.55) 43.9$50,001 to 75,000............... 50.2 (1.05) 32.7 (1.04) 14.9 (0.86) 2.2 (0.34) 45.8 (1.20) 36.8 (1.17) 14.5 (0.84) 2.9 (0.41) 48.0Over $75,000 ...................... 51.0 (1.58) 36.8 (1.55) 10.9 (0.9) 1.3 (0.31) 51.9 (1.15) 35.4 (1.11) 10.9 (0.72) 1.8 (0.32) 54.0
Child attending public schools 38.2 (0.54) 37.9 (0.56) 19.3 (0.44) 4.6 (0.23) 39.0 (0.55) 37.8 (0.56) 18.5 (0.45) 4.7 (0.26) 41.8Elementary (kindergarten to
grade 8)......................... 43.2 (0.75) 36.6 (0.69) 16.3 (0.55) 3.9 (0.26) 43.5 (0.71) 36.6 (0.71) 15.9 (0.54) 4.1 (0.29) 46.1Secondary (grades 9 to 12) 29.6 (0.89) 40.2 (1.00) 24.5 (0.89) 5.7 (0.46) 31.8 (0.87) 39.9 (0.92) 22.7 (0.79) 5.6 (0.48) 34.6
Child attending private schools 50.8 (1.64) 36.1 (1.58) 11.8 (0.96) 1.3 (0.40) 51.9 (1.61) 36.1 (1.55) 11.0 (1.09) 1.0 (0.27) 57.6Elementary (kindergarten to
grade 8)......................... 55.7 (2.02) 35.3 (1.90) 7.5 (0.86) 1.4 (0.57) 56.2 (1.88) 34.4 (1.80) 9.0 (1.21) 0.5 (0.21) 61.6Secondary (grades 9 to 12) 41.5 (2.97) 37.7 (2.40) 20.4 (2.30) 1.0 (0.44) 41.2 (3.09) 40.6 (3.03) 15.9 (2.31) 2.2 (0.79) 48.8
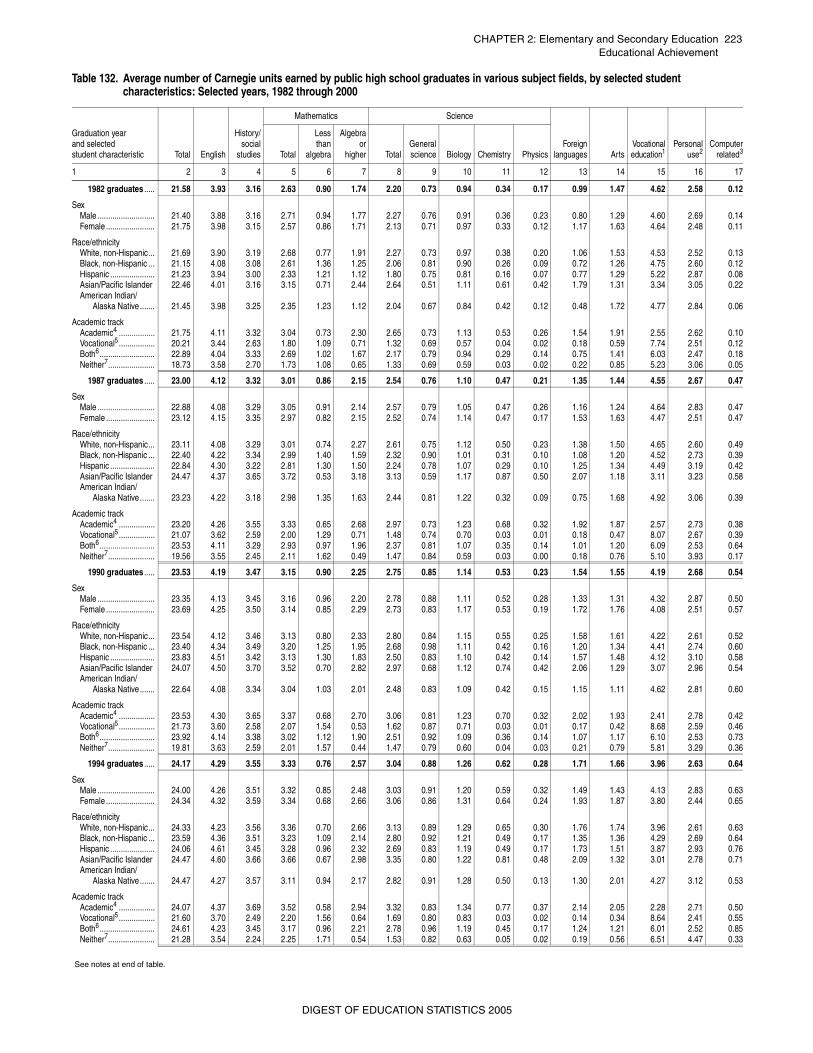
CHAPTER 2: Elementary and Secondary Education 223Educational Achievement
Table 132. Average number of Carnegie units earned by public high school graduates in various subject fields, by selected student characteristics: Selected years, 1982 through 2000
Graduation year and selected student characteristic Total English
History/social
studies
Mathematics Science
Foreignlanguages Arts
Vocationaleducation1
Personaluse2
Computerrelated3Total
Lessthan
algebra
Algebraor
higher TotalGeneralscience Biology Chemistry Physics
1 2 3 4 5 6 7 8 9 10 11 12 13 14 15 16 17
1982 graduates ..... 21.58 3.93 3.16 2.63 0.90 1.74 2.20 0.73 0.94 0.34 0.17 0.99 1.47 4.62 2.58 0.12
SexMale ........................... 21.40 3.88 3.16 2.71 0.94 1.77 2.27 0.76 0.91 0.36 0.23 0.80 1.29 4.60 2.69 0.14Female ....................... 21.75 3.98 3.15 2.57 0.86 1.71 2.13 0.71 0.97 0.33 0.12 1.17 1.63 4.64 2.48 0.11
Race/ethnicityWhite, non-Hispanic... 21.69 3.90 3.19 2.68 0.77 1.91 2.27 0.73 0.97 0.38 0.20 1.06 1.53 4.53 2.52 0.13Black, non-Hispanic ... 21.15 4.08 3.08 2.61 1.36 1.25 2.06 0.81 0.90 0.26 0.09 0.72 1.26 4.75 2.60 0.12Hispanic ..................... 21.23 3.94 3.00 2.33 1.21 1.12 1.80 0.75 0.81 0.16 0.07 0.77 1.29 5.22 2.87 0.08Asian/Pacific Islander 22.46 4.01 3.16 3.15 0.71 2.44 2.64 0.51 1.11 0.61 0.42 1.79 1.31 3.34 3.05 0.22American Indian/
Alaska Native ....... 21.45 3.98 3.25 2.35 1.23 1.12 2.04 0.67 0.84 0.42 0.12 0.48 1.72 4.77 2.84 0.06
Academic trackAcademic4 ................. 21.75 4.11 3.32 3.04 0.73 2.30 2.65 0.73 1.13 0.53 0.26 1.54 1.91 2.55 2.62 0.10Vocational5 ................. 20.21 3.44 2.63 1.80 1.09 0.71 1.32 0.69 0.57 0.04 0.02 0.18 0.59 7.74 2.51 0.12Both6.......................... 22.89 4.04 3.33 2.69 1.02 1.67 2.17 0.79 0.94 0.29 0.14 0.75 1.41 6.03 2.47 0.18Neither7...................... 18.73 3.58 2.70 1.73 1.08 0.65 1.33 0.69 0.59 0.03 0.02 0.22 0.85 5.23 3.06 0.05
1987 graduates ..... 23.00 4.12 3.32 3.01 0.86 2.15 2.54 0.76 1.10 0.47 0.21 1.35 1.44 4.55 2.67 0.47
SexMale ........................... 22.88 4.08 3.29 3.05 0.91 2.14 2.57 0.79 1.05 0.47 0.26 1.16 1.24 4.64 2.83 0.47Female ....................... 23.12 4.15 3.35 2.97 0.82 2.15 2.52 0.74 1.14 0.47 0.17 1.53 1.63 4.47 2.51 0.47
Race/ethnicityWhite, non-Hispanic... 23.11 4.08 3.29 3.01 0.74 2.27 2.61 0.75 1.12 0.50 0.23 1.38 1.50 4.65 2.60 0.49Black, non-Hispanic ... 22.40 4.22 3.34 2.99 1.40 1.59 2.32 0.90 1.01 0.31 0.10 1.08 1.20 4.52 2.73 0.39Hispanic ..................... 22.84 4.30 3.22 2.81 1.30 1.50 2.24 0.78 1.07 0.29 0.10 1.25 1.34 4.49 3.19 0.42Asian/Pacific Islander 24.47 4.37 3.65 3.72 0.53 3.18 3.13 0.59 1.17 0.87 0.50 2.07 1.18 3.11 3.23 0.58American Indian/
Alaska Native ....... 23.23 4.22 3.18 2.98 1.35 1.63 2.44 0.81 1.22 0.32 0.09 0.75 1.68 4.92 3.06 0.39
Academic trackAcademic4 ................. 23.20 4.26 3.55 3.33 0.65 2.68 2.97 0.73 1.23 0.68 0.32 1.92 1.87 2.57 2.73 0.38Vocational5 ................. 21.07 3.62 2.59 2.00 1.29 0.71 1.48 0.74 0.70 0.03 0.01 0.18 0.47 8.07 2.67 0.39Both6.......................... 23.53 4.11 3.29 2.93 0.97 1.96 2.37 0.81 1.07 0.35 0.14 1.01 1.20 6.09 2.53 0.64Neither7...................... 19.56 3.55 2.45 2.11 1.62 0.49 1.47 0.84 0.59 0.03 0.00 0.18 0.76 5.10 3.93 0.17
1990 graduates ..... 23.53 4.19 3.47 3.15 0.90 2.25 2.75 0.85 1.14 0.53 0.23 1.54 1.55 4.19 2.68 0.54
SexMale ........................... 23.35 4.13 3.45 3.16 0.96 2.20 2.78 0.88 1.11 0.52 0.28 1.33 1.31 4.32 2.87 0.50Female ....................... 23.69 4.25 3.50 3.14 0.85 2.29 2.73 0.83 1.17 0.53 0.19 1.72 1.76 4.08 2.51 0.57
Race/ethnicityWhite, non-Hispanic... 23.54 4.12 3.46 3.13 0.80 2.33 2.80 0.84 1.15 0.55 0.25 1.58 1.61 4.22 2.61 0.52Black, non-Hispanic ... 23.40 4.34 3.49 3.20 1.25 1.95 2.68 0.98 1.11 0.42 0.16 1.20 1.34 4.41 2.74 0.60Hispanic ..................... 23.83 4.51 3.42 3.13 1.30 1.83 2.50 0.83 1.10 0.42 0.14 1.57 1.48 4.12 3.10 0.58Asian/Pacific Islander 24.07 4.50 3.70 3.52 0.70 2.82 2.97 0.68 1.12 0.74 0.42 2.06 1.29 3.07 2.96 0.54American Indian/
Alaska Native ....... 22.64 4.08 3.34 3.04 1.03 2.01 2.48 0.83 1.09 0.42 0.15 1.15 1.11 4.62 2.81 0.60
Academic trackAcademic4 ................. 23.53 4.30 3.65 3.37 0.68 2.70 3.06 0.81 1.23 0.70 0.32 2.02 1.93 2.41 2.78 0.42Vocational5 ................. 21.73 3.60 2.58 2.07 1.54 0.53 1.62 0.87 0.71 0.03 0.01 0.17 0.42 8.68 2.59 0.46Both6.......................... 23.92 4.14 3.38 3.02 1.12 1.90 2.51 0.92 1.09 0.36 0.14 1.07 1.17 6.10 2.53 0.73Neither7...................... 19.81 3.63 2.59 2.01 1.57 0.44 1.47 0.79 0.60 0.04 0.03 0.21 0.79 5.81 3.29 0.36
1994 graduates ..... 24.17 4.29 3.55 3.33 0.76 2.57 3.04 0.88 1.26 0.62 0.28 1.71 1.66 3.96 2.63 0.64
SexMale ........................... 24.00 4.26 3.51 3.32 0.85 2.48 3.03 0.91 1.20 0.59 0.32 1.49 1.43 4.13 2.83 0.63Female ....................... 24.34 4.32 3.59 3.34 0.68 2.66 3.06 0.86 1.31 0.64 0.24 1.93 1.87 3.80 2.44 0.65
Race/ethnicityWhite, non-Hispanic... 24.33 4.23 3.56 3.36 0.70 2.66 3.13 0.89 1.29 0.65 0.30 1.76 1.74 3.96 2.61 0.63Black, non-Hispanic ... 23.59 4.36 3.51 3.23 1.09 2.14 2.80 0.92 1.21 0.49 0.17 1.35 1.36 4.29 2.69 0.64Hispanic ..................... 24.06 4.61 3.45 3.28 0.96 2.32 2.69 0.83 1.19 0.49 0.17 1.73 1.51 3.87 2.93 0.76Asian/Pacific Islander 24.47 4.60 3.66 3.66 0.67 2.98 3.35 0.80 1.22 0.81 0.48 2.09 1.32 3.01 2.78 0.71American Indian/
Alaska Native ....... 24.47 4.27 3.57 3.11 0.94 2.17 2.82 0.91 1.28 0.50 0.13 1.30 2.01 4.27 3.12 0.53
Academic trackAcademic4 ................. 24.07 4.37 3.69 3.52 0.58 2.94 3.32 0.83 1.34 0.77 0.37 2.14 2.05 2.28 2.71 0.50Vocational5 ................. 21.60 3.70 2.49 2.20 1.56 0.64 1.69 0.80 0.83 0.03 0.02 0.14 0.34 8.64 2.41 0.55Both6.......................... 24.61 4.23 3.45 3.17 0.96 2.21 2.78 0.96 1.19 0.45 0.17 1.24 1.21 6.01 2.52 0.85Neither7...................... 21.28 3.54 2.24 2.25 1.71 0.54 1.53 0.82 0.63 0.05 0.02 0.19 0.56 6.51 4.47 0.33
See notes at end of table.
DIGEST OF EDUCATION STATISTICS 2005
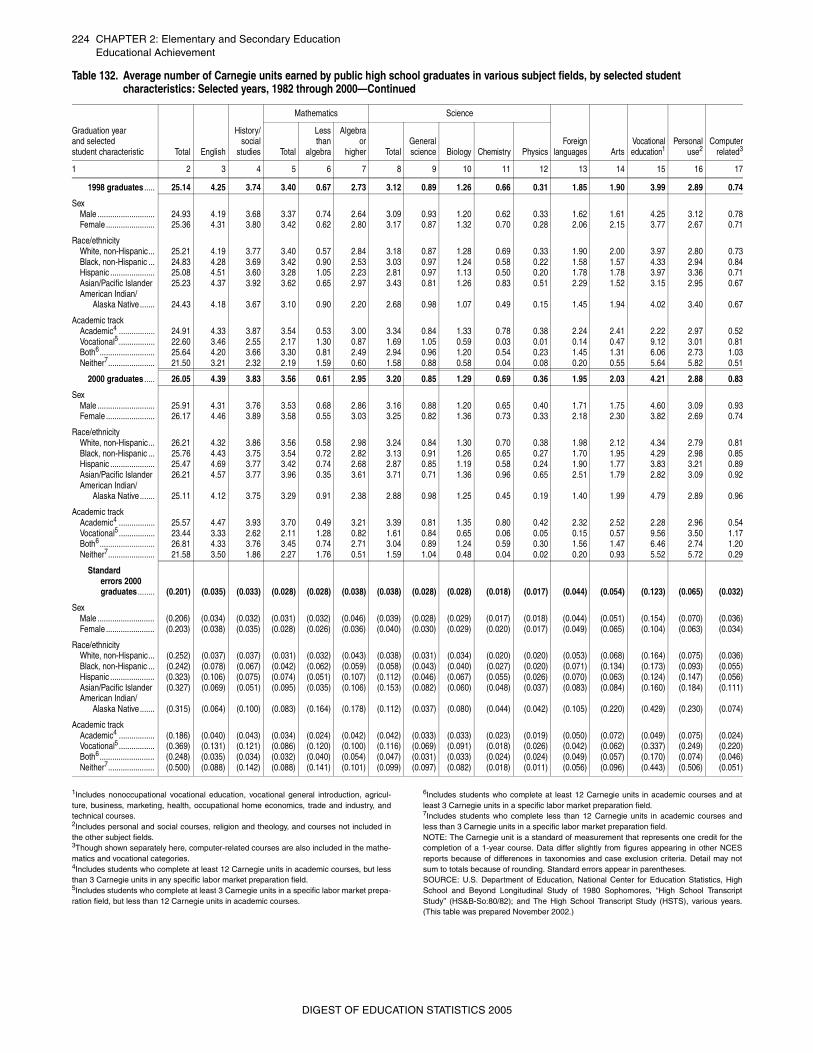
224 CHAPTER 2: Elementary and Secondary EducationEducational Achievement
1Includes nonoccupational vocational education, vocational general introduction, agricul-ture, business, marketing, health, occupational home economics, trade and industry, andtechnical courses.2Includes personal and social courses, religion and theology, and courses not included inthe other subject fields.3Though shown separately here, computer-related courses are also included in the mathe-matics and vocational categories.4Includes students who complete at least 12 Carnegie units in academic courses, but lessthan 3 Carnegie units in any specific labor market preparation field.5Includes students who complete at least 3 Carnegie units in a specific labor market prepa-ration field, but less than 12 Carnegie units in academic courses.
6Includes students who complete at least 12 Carnegie units in academic courses and atleast 3 Carnegie units in a specific labor market preparation field. 7Includes students who complete less than 12 Carnegie units in academic courses andless than 3 Carnegie units in a specific labor market preparation field. NOTE: The Carnegie unit is a standard of measurement that represents one credit for thecompletion of a 1-year course. Data differ slightly from figures appearing in other NCESreports because of differences in taxonomies and case exclusion criteria. Detail may notsum to totals because of rounding. Standard errors appear in parentheses. SOURCE: U.S. Department of Education, National Center for Education Statistics, HighSchool and Beyond Longitudinal Study of 1980 Sophomores, “High School TranscriptStudy” (HS&B-So:80/82); and The High School Transcript Study (HSTS), various years.(This table was prepared November 2002.)
1998 graduates ..... 25.14 4.25 3.74 3.40 0.67 2.73 3.12 0.89 1.26 0.66 0.31 1.85 1.90 3.99 2.89 0.74
SexMale ........................... 24.93 4.19 3.68 3.37 0.74 2.64 3.09 0.93 1.20 0.62 0.33 1.62 1.61 4.25 3.12 0.78Female ....................... 25.36 4.31 3.80 3.42 0.62 2.80 3.17 0.87 1.32 0.70 0.28 2.06 2.15 3.77 2.67 0.71
Race/ethnicityWhite, non-Hispanic... 25.21 4.19 3.77 3.40 0.57 2.84 3.18 0.87 1.28 0.69 0.33 1.90 2.00 3.97 2.80 0.73Black, non-Hispanic ... 24.83 4.28 3.69 3.42 0.90 2.53 3.03 0.97 1.24 0.58 0.22 1.58 1.57 4.33 2.94 0.84Hispanic ..................... 25.08 4.51 3.60 3.28 1.05 2.23 2.81 0.97 1.13 0.50 0.20 1.78 1.78 3.97 3.36 0.71Asian/Pacific Islander 25.23 4.37 3.92 3.62 0.65 2.97 3.43 0.81 1.26 0.83 0.51 2.29 1.52 3.15 2.95 0.67American Indian/
Alaska Native ....... 24.43 4.18 3.67 3.10 0.90 2.20 2.68 0.98 1.07 0.49 0.15 1.45 1.94 4.02 3.40 0.67
Academic trackAcademic4 ................. 24.91 4.33 3.87 3.54 0.53 3.00 3.34 0.84 1.33 0.78 0.38 2.24 2.41 2.22 2.97 0.52Vocational5 ................. 22.60 3.46 2.55 2.17 1.30 0.87 1.69 1.05 0.59 0.03 0.01 0.14 0.47 9.12 3.01 0.81Both6.......................... 25.64 4.20 3.66 3.30 0.81 2.49 2.94 0.96 1.20 0.54 0.23 1.45 1.31 6.06 2.73 1.03Neither7...................... 21.50 3.21 2.32 2.19 1.59 0.60 1.58 0.88 0.58 0.04 0.08 0.20 0.55 5.64 5.82 0.51
2000 graduates ..... 26.05 4.39 3.83 3.56 0.61 2.95 3.20 0.85 1.29 0.69 0.36 1.95 2.03 4.21 2.88 0.83
SexMale ........................... 25.91 4.31 3.76 3.53 0.68 2.86 3.16 0.88 1.20 0.65 0.40 1.71 1.75 4.60 3.09 0.93Female ....................... 26.17 4.46 3.89 3.58 0.55 3.03 3.25 0.82 1.36 0.73 0.33 2.18 2.30 3.82 2.69 0.74
Race/ethnicityWhite, non-Hispanic... 26.21 4.32 3.86 3.56 0.58 2.98 3.24 0.84 1.30 0.70 0.38 1.98 2.12 4.34 2.79 0.81Black, non-Hispanic ... 25.76 4.43 3.75 3.54 0.72 2.82 3.13 0.91 1.26 0.65 0.27 1.70 1.95 4.29 2.98 0.85Hispanic ..................... 25.47 4.69 3.77 3.42 0.74 2.68 2.87 0.85 1.19 0.58 0.24 1.90 1.77 3.83 3.21 0.89Asian/Pacific Islander 26.21 4.57 3.77 3.96 0.35 3.61 3.71 0.71 1.36 0.96 0.65 2.51 1.79 2.82 3.09 0.92American Indian/
Alaska Native ....... 25.11 4.12 3.75 3.29 0.91 2.38 2.88 0.98 1.25 0.45 0.19 1.40 1.99 4.79 2.89 0.96
Academic trackAcademic4 ................. 25.57 4.47 3.93 3.70 0.49 3.21 3.39 0.81 1.35 0.80 0.42 2.32 2.52 2.28 2.96 0.54Vocational5 ................. 23.44 3.33 2.62 2.11 1.28 0.82 1.61 0.84 0.65 0.06 0.05 0.15 0.57 9.56 3.50 1.17Both6.......................... 26.81 4.33 3.76 3.45 0.74 2.71 3.04 0.89 1.24 0.59 0.30 1.56 1.47 6.46 2.74 1.20Neither7...................... 21.58 3.50 1.86 2.27 1.76 0.51 1.59 1.04 0.48 0.04 0.02 0.20 0.93 5.52 5.72 0.29
Standard errors 2000 graduates ........ (0.201) (0.035) (0.033) (0.028) (0.028) (0.038) (0.038) (0.028) (0.028) (0.018) (0.017) (0.044) (0.054) (0.123) (0.065) (0.032)
SexMale ........................... (0.206) (0.034) (0.032) (0.031) (0.032) (0.046) (0.039) (0.028) (0.029) (0.017) (0.018) (0.044) (0.051) (0.154) (0.070) (0.036)Female ....................... (0.203) (0.038) (0.035) (0.028) (0.026) (0.036) (0.040) (0.030) (0.029) (0.020) (0.017) (0.049) (0.065) (0.104) (0.063) (0.034)
Race/ethnicityWhite, non-Hispanic... (0.252) (0.037) (0.037) (0.031) (0.032) (0.043) (0.038) (0.031) (0.034) (0.020) (0.020) (0.053) (0.068) (0.164) (0.075) (0.036)Black, non-Hispanic ... (0.242) (0.078) (0.067) (0.042) (0.062) (0.059) (0.058) (0.043) (0.040) (0.027) (0.020) (0.071) (0.134) (0.173) (0.093) (0.055)Hispanic ..................... (0.323) (0.106) (0.075) (0.074) (0.051) (0.107) (0.112) (0.046) (0.067) (0.055) (0.026) (0.070) (0.063) (0.124) (0.147) (0.056)Asian/Pacific Islander (0.327) (0.069) (0.051) (0.095) (0.035) (0.106) (0.153) (0.082) (0.060) (0.048) (0.037) (0.083) (0.084) (0.160) (0.184) (0.111)American Indian/
Alaska Native ....... (0.315) (0.064) (0.100) (0.083) (0.164) (0.178) (0.112) (0.037) (0.080) (0.044) (0.042) (0.105) (0.220) (0.429) (0.230) (0.074)
Academic trackAcademic4 ................. (0.186) (0.040) (0.043) (0.034) (0.024) (0.042) (0.042) (0.033) (0.033) (0.023) (0.019) (0.050) (0.072) (0.049) (0.075) (0.024)Vocational5 ................. (0.369) (0.131) (0.121) (0.086) (0.120) (0.100) (0.116) (0.069) (0.091) (0.018) (0.026) (0.042) (0.062) (0.337) (0.249) (0.220)Both6.......................... (0.248) (0.035) (0.034) (0.032) (0.040) (0.054) (0.047) (0.031) (0.033) (0.024) (0.024) (0.049) (0.057) (0.170) (0.074) (0.046)Neither7...................... (0.500) (0.088) (0.142) (0.088) (0.141) (0.101) (0.099) (0.097) (0.082) (0.018) (0.011) (0.056) (0.096) (0.443) (0.506) (0.051)
Table 132. Average number of Carnegie units earned by public high school graduates in various subject fields, by selected student characteristics: Selected years, 1982 through 2000—Continued
Graduation year and selected student characteristic Total English
History/social
studies
Mathematics Science
Foreignlanguages Arts
Vocationaleducation1
Personaluse2
Computerrelated3Total
Lessthan
algebra
Algebraor
higher TotalGeneralscience Biology Chemistry Physics
1 2 3 4 5 6 7 8 9 10 11 12 13 14 15 16 17
DIGEST OF EDUCATION STATISTICS 2005
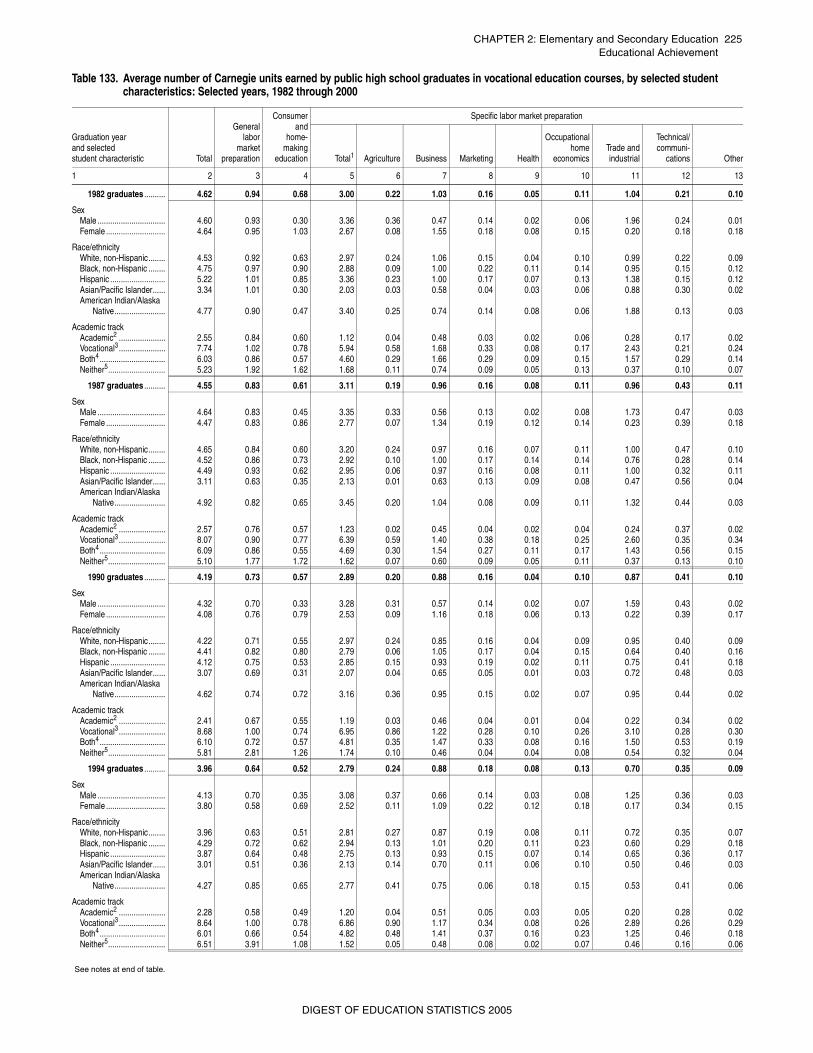
CHAPTER 2: Elementary and Secondary Education 225Educational Achievement
Table 133. Average number of Carnegie units earned by public high school graduates in vocational education courses, by selected student characteristics: Selected years, 1982 through 2000
Graduation year and selected student characteristic Total
Generallabor
marketpreparation
Consumerand
home-making
education
Specific labor market preparation
Total1 Agriculture Business Marketing Health
Occupationalhome
economicsTrade andindustrial
Technical/communi-
cations Other
1 2 3 4 5 6 7 8 9 10 11 12 13
1982 graduates .......... 4.62 0.94 0.68 3.00 0.22 1.03 0.16 0.05 0.11 1.04 0.21 0.10
SexMale ................................ 4.60 0.93 0.30 3.36 0.36 0.47 0.14 0.02 0.06 1.96 0.24 0.01Female ............................ 4.64 0.95 1.03 2.67 0.08 1.55 0.18 0.08 0.15 0.20 0.18 0.18
Race/ethnicityWhite, non-Hispanic........ 4.53 0.92 0.63 2.97 0.24 1.06 0.15 0.04 0.10 0.99 0.22 0.09Black, non-Hispanic ........ 4.75 0.97 0.90 2.88 0.09 1.00 0.22 0.11 0.14 0.95 0.15 0.12Hispanic .......................... 5.22 1.01 0.85 3.36 0.23 1.00 0.17 0.07 0.13 1.38 0.15 0.12Asian/Pacific Islander...... 3.34 1.01 0.30 2.03 0.03 0.58 0.04 0.03 0.06 0.88 0.30 0.02American Indian/Alaska
Native........................ 4.77 0.90 0.47 3.40 0.25 0.74 0.14 0.08 0.06 1.88 0.13 0.03
Academic trackAcademic2 ...................... 2.55 0.84 0.60 1.12 0.04 0.48 0.03 0.02 0.06 0.28 0.17 0.02Vocational3 ...................... 7.74 1.02 0.78 5.94 0.58 1.68 0.33 0.08 0.17 2.43 0.21 0.24Both4............................... 6.03 0.86 0.57 4.60 0.29 1.66 0.29 0.09 0.15 1.57 0.29 0.14Neither5........................... 5.23 1.92 1.62 1.68 0.11 0.74 0.09 0.05 0.13 0.37 0.10 0.07
1987 graduates .......... 4.55 0.83 0.61 3.11 0.19 0.96 0.16 0.08 0.11 0.96 0.43 0.11
SexMale ................................ 4.64 0.83 0.45 3.35 0.33 0.56 0.13 0.02 0.08 1.73 0.47 0.03Female ............................ 4.47 0.83 0.86 2.77 0.07 1.34 0.19 0.12 0.14 0.23 0.39 0.18
Race/ethnicityWhite, non-Hispanic........ 4.65 0.84 0.60 3.20 0.24 0.97 0.16 0.07 0.11 1.00 0.47 0.10Black, non-Hispanic ........ 4.52 0.86 0.73 2.92 0.10 1.00 0.17 0.14 0.14 0.76 0.28 0.14Hispanic .......................... 4.49 0.93 0.62 2.95 0.06 0.97 0.16 0.08 0.11 1.00 0.32 0.11Asian/Pacific Islander...... 3.11 0.63 0.35 2.13 0.01 0.63 0.13 0.09 0.08 0.47 0.56 0.04American Indian/Alaska
Native........................ 4.92 0.82 0.65 3.45 0.20 1.04 0.08 0.09 0.11 1.32 0.44 0.03
Academic trackAcademic2 ...................... 2.57 0.76 0.57 1.23 0.02 0.45 0.04 0.02 0.04 0.24 0.37 0.02Vocational3 ...................... 8.07 0.90 0.77 6.39 0.59 1.40 0.38 0.18 0.25 2.60 0.35 0.34Both4............................... 6.09 0.86 0.55 4.69 0.30 1.54 0.27 0.11 0.17 1.43 0.56 0.15Neither5........................... 5.10 1.77 1.72 1.62 0.07 0.60 0.09 0.05 0.11 0.37 0.13 0.10
1990 graduates .......... 4.19 0.73 0.57 2.89 0.20 0.88 0.16 0.04 0.10 0.87 0.41 0.10
SexMale ................................ 4.32 0.70 0.33 3.28 0.31 0.57 0.14 0.02 0.07 1.59 0.43 0.02Female ............................ 4.08 0.76 0.79 2.53 0.09 1.16 0.18 0.06 0.13 0.22 0.39 0.17
Race/ethnicityWhite, non-Hispanic........ 4.22 0.71 0.55 2.97 0.24 0.85 0.16 0.04 0.09 0.95 0.40 0.09Black, non-Hispanic ........ 4.41 0.82 0.80 2.79 0.06 1.05 0.17 0.04 0.15 0.64 0.40 0.16Hispanic .......................... 4.12 0.75 0.53 2.85 0.15 0.93 0.19 0.02 0.11 0.75 0.41 0.18Asian/Pacific Islander...... 3.07 0.69 0.31 2.07 0.04 0.65 0.05 0.01 0.03 0.72 0.48 0.03American Indian/Alaska
Native........................ 4.62 0.74 0.72 3.16 0.36 0.95 0.15 0.02 0.07 0.95 0.44 0.02
Academic trackAcademic2 ...................... 2.41 0.67 0.55 1.19 0.03 0.46 0.04 0.01 0.04 0.22 0.34 0.02Vocational3 ...................... 8.68 1.00 0.74 6.95 0.86 1.22 0.28 0.10 0.26 3.10 0.28 0.30Both4............................... 6.10 0.72 0.57 4.81 0.35 1.47 0.33 0.08 0.16 1.50 0.53 0.19Neither5........................... 5.81 2.81 1.26 1.74 0.10 0.46 0.04 0.04 0.08 0.54 0.32 0.04
1994 graduates .......... 3.96 0.64 0.52 2.79 0.24 0.88 0.18 0.08 0.13 0.70 0.35 0.09
SexMale ................................ 4.13 0.70 0.35 3.08 0.37 0.66 0.14 0.03 0.08 1.25 0.36 0.03Female ............................ 3.80 0.58 0.69 2.52 0.11 1.09 0.22 0.12 0.18 0.17 0.34 0.15
Race/ethnicityWhite, non-Hispanic........ 3.96 0.63 0.51 2.81 0.27 0.87 0.19 0.08 0.11 0.72 0.35 0.07Black, non-Hispanic ........ 4.29 0.72 0.62 2.94 0.13 1.01 0.20 0.11 0.23 0.60 0.29 0.18Hispanic .......................... 3.87 0.64 0.48 2.75 0.13 0.93 0.15 0.07 0.14 0.65 0.36 0.17Asian/Pacific Islander...... 3.01 0.51 0.36 2.13 0.14 0.70 0.11 0.06 0.10 0.50 0.46 0.03American Indian/Alaska
Native........................ 4.27 0.85 0.65 2.77 0.41 0.75 0.06 0.18 0.15 0.53 0.41 0.06
Academic trackAcademic2 ...................... 2.28 0.58 0.49 1.20 0.04 0.51 0.05 0.03 0.05 0.20 0.28 0.02Vocational3 ...................... 8.64 1.00 0.78 6.86 0.90 1.17 0.34 0.08 0.26 2.89 0.26 0.29Both4............................... 6.01 0.66 0.54 4.82 0.48 1.41 0.37 0.16 0.23 1.25 0.46 0.18Neither5........................... 6.51 3.91 1.08 1.52 0.05 0.48 0.08 0.02 0.07 0.46 0.16 0.06
See notes at end of table.
DIGEST OF EDUCATION STATISTICS 2005
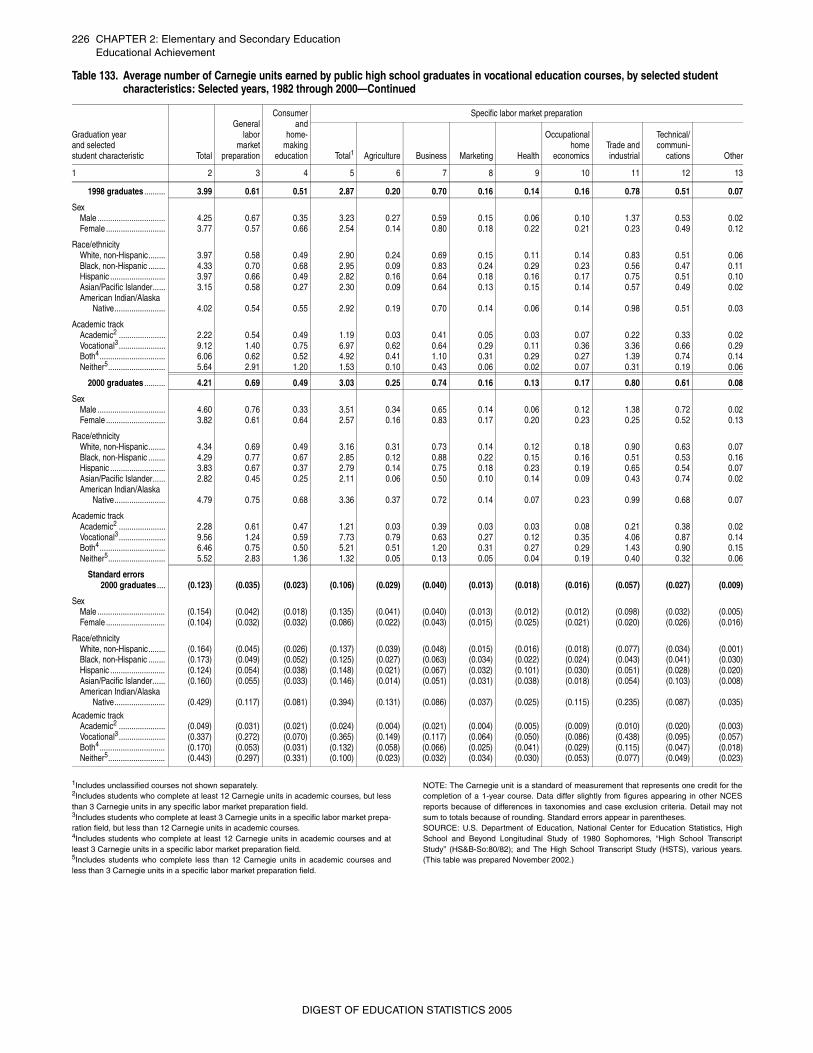
226 CHAPTER 2: Elementary and Secondary EducationEducational Achievement
1Includes unclassified courses not shown separately. 2Includes students who complete at least 12 Carnegie units in academic courses, but lessthan 3 Carnegie units in any specific labor market preparation field. 3Includes students who complete at least 3 Carnegie units in a specific labor market prepa-ration field, but less than 12 Carnegie units in academic courses. 4Includes students who complete at least 12 Carnegie units in academic courses and atleast 3 Carnegie units in a specific labor market preparation field. 5Includes students who complete less than 12 Carnegie units in academic courses andless than 3 Carnegie units in a specific labor market preparation field.
NOTE: The Carnegie unit is a standard of measurement that represents one credit for thecompletion of a 1-year course. Data differ slightly from figures appearing in other NCESreports because of differences in taxonomies and case exclusion criteria. Detail may notsum to totals because of rounding. Standard errors appear in parentheses. SOURCE: U.S. Department of Education, National Center for Education Statistics, HighSchool and Beyond Longitudinal Study of 1980 Sophomores, “High School TranscriptStudy” (HS&B-So:80/82); and The High School Transcript Study (HSTS), various years.(This table was prepared November 2002.)
1998 graduates .......... 3.99 0.61 0.51 2.87 0.20 0.70 0.16 0.14 0.16 0.78 0.51 0.07
SexMale ................................ 4.25 0.67 0.35 3.23 0.27 0.59 0.15 0.06 0.10 1.37 0.53 0.02Female ............................ 3.77 0.57 0.66 2.54 0.14 0.80 0.18 0.22 0.21 0.23 0.49 0.12
Race/ethnicityWhite, non-Hispanic........ 3.97 0.58 0.49 2.90 0.24 0.69 0.15 0.11 0.14 0.83 0.51 0.06Black, non-Hispanic ........ 4.33 0.70 0.68 2.95 0.09 0.83 0.24 0.29 0.23 0.56 0.47 0.11Hispanic .......................... 3.97 0.66 0.49 2.82 0.16 0.64 0.18 0.16 0.17 0.75 0.51 0.10Asian/Pacific Islander...... 3.15 0.58 0.27 2.30 0.09 0.64 0.13 0.15 0.14 0.57 0.49 0.02American Indian/Alaska
Native........................ 4.02 0.54 0.55 2.92 0.19 0.70 0.14 0.06 0.14 0.98 0.51 0.03
Academic trackAcademic2 ...................... 2.22 0.54 0.49 1.19 0.03 0.41 0.05 0.03 0.07 0.22 0.33 0.02Vocational3 ...................... 9.12 1.40 0.75 6.97 0.62 0.64 0.29 0.11 0.36 3.36 0.66 0.29Both4............................... 6.06 0.62 0.52 4.92 0.41 1.10 0.31 0.29 0.27 1.39 0.74 0.14Neither5........................... 5.64 2.91 1.20 1.53 0.10 0.43 0.06 0.02 0.07 0.31 0.19 0.06
2000 graduates .......... 4.21 0.69 0.49 3.03 0.25 0.74 0.16 0.13 0.17 0.80 0.61 0.08
SexMale ................................ 4.60 0.76 0.33 3.51 0.34 0.65 0.14 0.06 0.12 1.38 0.72 0.02Female ............................ 3.82 0.61 0.64 2.57 0.16 0.83 0.17 0.20 0.23 0.25 0.52 0.13
Race/ethnicityWhite, non-Hispanic........ 4.34 0.69 0.49 3.16 0.31 0.73 0.14 0.12 0.18 0.90 0.63 0.07Black, non-Hispanic ........ 4.29 0.77 0.67 2.85 0.12 0.88 0.22 0.15 0.16 0.51 0.53 0.16Hispanic .......................... 3.83 0.67 0.37 2.79 0.14 0.75 0.18 0.23 0.19 0.65 0.54 0.07Asian/Pacific Islander...... 2.82 0.45 0.25 2.11 0.06 0.50 0.10 0.14 0.09 0.43 0.74 0.02American Indian/Alaska
Native........................ 4.79 0.75 0.68 3.36 0.37 0.72 0.14 0.07 0.23 0.99 0.68 0.07
Academic trackAcademic2 ...................... 2.28 0.61 0.47 1.21 0.03 0.39 0.03 0.03 0.08 0.21 0.38 0.02Vocational3 ...................... 9.56 1.24 0.59 7.73 0.79 0.63 0.27 0.12 0.35 4.06 0.87 0.14Both4............................... 6.46 0.75 0.50 5.21 0.51 1.20 0.31 0.27 0.29 1.43 0.90 0.15Neither5........................... 5.52 2.83 1.36 1.32 0.05 0.13 0.05 0.04 0.19 0.40 0.32 0.06
Standard errors 2000 graduates .... (0.123) (0.035) (0.023) (0.106) (0.029) (0.040) (0.013) (0.018) (0.016) (0.057) (0.027) (0.009)
SexMale ................................ (0.154) (0.042) (0.018) (0.135) (0.041) (0.040) (0.013) (0.012) (0.012) (0.098) (0.032) (0.005)Female ............................ (0.104) (0.032) (0.032) (0.086) (0.022) (0.043) (0.015) (0.025) (0.021) (0.020) (0.026) (0.016)
Race/ethnicityWhite, non-Hispanic........ (0.164) (0.045) (0.026) (0.137) (0.039) (0.048) (0.015) (0.016) (0.018) (0.077) (0.034) (0.001)Black, non-Hispanic ........ (0.173) (0.049) (0.052) (0.125) (0.027) (0.063) (0.034) (0.022) (0.024) (0.043) (0.041) (0.030)Hispanic .......................... (0.124) (0.054) (0.038) (0.148) (0.021) (0.067) (0.032) (0.101) (0.030) (0.051) (0.028) (0.020)Asian/Pacific Islander...... (0.160) (0.055) (0.033) (0.146) (0.014) (0.051) (0.031) (0.038) (0.018) (0.054) (0.103) (0.008)American Indian/Alaska
Native........................ (0.429) (0.117) (0.081) (0.394) (0.131) (0.086) (0.037) (0.025) (0.115) (0.235) (0.087) (0.035)
Academic trackAcademic2 ...................... (0.049) (0.031) (0.021) (0.024) (0.004) (0.021) (0.004) (0.005) (0.009) (0.010) (0.020) (0.003)Vocational3 ...................... (0.337) (0.272) (0.070) (0.365) (0.149) (0.117) (0.064) (0.050) (0.086) (0.438) (0.095) (0.057)Both4............................... (0.170) (0.053) (0.031) (0.132) (0.058) (0.066) (0.025) (0.041) (0.029) (0.115) (0.047) (0.018)Neither5........................... (0.443) (0.297) (0.331) (0.100) (0.023) (0.032) (0.034) (0.030) (0.053) (0.077) (0.049) (0.023)
Table 133. Average number of Carnegie units earned by public high school graduates in vocational education courses, by selected student characteristics: Selected years, 1982 through 2000—Continued
Graduation year and selected student characteristic Total
Generallabor
marketpreparation
Consumerand
home-making
education
Specific labor market preparation
Total1 Agriculture Business Marketing Health
Occupationalhome
economicsTrade andindustrial
Technical/communi-
cations Other
1 2 3 4 5 6 7 8 9 10 11 12 13
DIGEST OF EDUCATION STATISTICS 2005
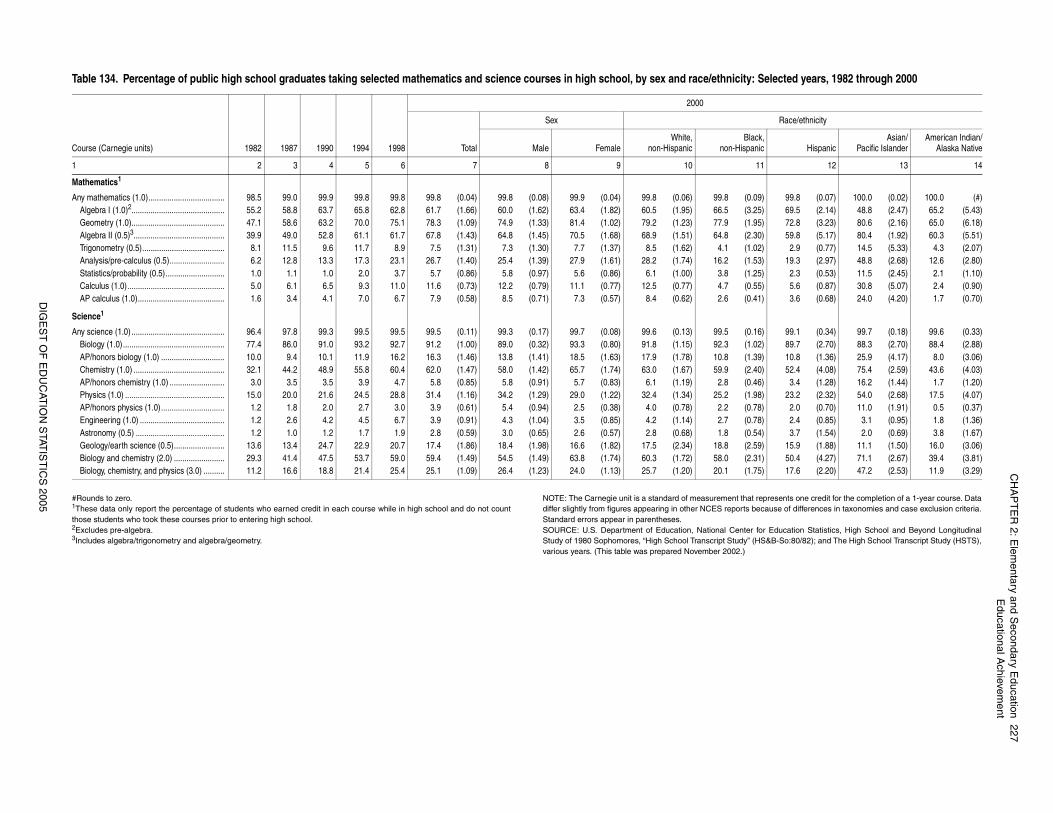
CH
AP
TE
R 2: E
lementary and S
econdary Education
227E
ducational Achievem
ent
DIG
ES
T O
F E
DU
CAT
ION
STAT
IST
ICS
2005 represents one credit for the completion of a 1-year course. Dataecause of differences in taxonomies and case exclusion criteria.
for Education Statistics, High School and Beyond LongitudinalHS&B-So:80/82); and The High School Transcript Study (HSTS),
Selected years, 1982 through 2000
Race/ethnicity
ck,nic Hispanic
Asian/Pacific Islander
American Indian/Alaska Native
11 12 13 14
9) 99.8 (0.07) 100.0 (0.02) 100.0 (#)5) 69.5 (2.14) 48.8 (2.47) 65.2 (5.43)5) 72.8 (3.23) 80.6 (2.16) 65.0 (6.18)0) 59.8 (5.17) 80.4 (1.92) 60.3 (5.51)2) 2.9 (0.77) 14.5 (5.33) 4.3 (2.07)3) 19.3 (2.97) 48.8 (2.68) 12.6 (2.80)5) 2.3 (0.53) 11.5 (2.45) 2.1 (1.10)5) 5.6 (0.87) 30.8 (5.07) 2.4 (0.90)1) 3.6 (0.68) 24.0 (4.20) 1.7 (0.70)
6) 99.1 (0.34) 99.7 (0.18) 99.6 (0.33)2) 89.7 (2.70) 88.3 (2.70) 88.4 (2.88)9) 10.8 (1.36) 25.9 (4.17) 8.0 (3.06)0) 52.4 (4.08) 75.4 (2.59) 43.6 (4.03)6) 3.4 (1.28) 16.2 (1.44) 1.7 (1.20)8) 23.2 (2.32) 54.0 (2.68) 17.5 (4.07)8) 2.0 (0.70) 11.0 (1.91) 0.5 (0.37)8) 2.4 (0.85) 3.1 (0.95) 1.8 (1.36)4) 3.7 (1.54) 2.0 (0.69) 3.8 (1.67)9) 15.9 (1.88) 11.1 (1.50) 16.0 (3.06)1) 50.4 (4.27) 71.1 (2.67) 39.4 (3.81)5) 17.6 (2.20) 47.2 (2.53) 11.9 (3.29)
_
#Rounds to zero. 1These data only report the percentage of students who earned credit in each course while in high school and do not countthose students who took these courses prior to entering high school. 2Excludes pre-algebra. 3Includes algebra/trigonometry and algebra/geometry.
NOTE: The Carnegie unit is a standard of measurement that differ slightly from figures appearing in other NCES reports bStandard errors appear in parentheses. SOURCE: U.S. Department of Education, National Center Study of 1980 Sophomores, “High School Transcript Study” (various years. (This table was prepared November 2002.)
Table 134. Percentage of public high school graduates taking selected mathematics and science courses in high school, by sex and race/ethnicity:
Course (Carnegie units) 1982 1987 1990 1994 1998
2000
Total
Sex
Male FemaleWhite,
non-HispanicBla
non-Hispa
1 2 3 4 5 6 7 8 9 10
Mathematics1
Any mathematics (1.0).................................... 98.5 99.0 99.9 99.8 99.8 99.8 (0.04) 99.8 (0.08) 99.9 (0.04) 99.8 (0.06) 99.8 (0.0Algebra I (1.0)2............................................ 55.2 58.8 63.7 65.8 62.8 61.7 (1.66) 60.0 (1.62) 63.4 (1.82) 60.5 (1.95) 66.5 (3.2Geometry (1.0)............................................ 47.1 58.6 63.2 70.0 75.1 78.3 (1.09) 74.9 (1.33) 81.4 (1.02) 79.2 (1.23) 77.9 (1.9Algebra II (0.5)3........................................... 39.9 49.0 52.8 61.1 61.7 67.8 (1.43) 64.8 (1.45) 70.5 (1.68) 68.9 (1.51) 64.8 (2.3Trigonometry (0.5)....................................... 8.1 11.5 9.6 11.7 8.9 7.5 (1.31) 7.3 (1.30) 7.7 (1.37) 8.5 (1.62) 4.1 (1.0Analysis/pre-calculus (0.5).......................... 6.2 12.8 13.3 17.3 23.1 26.7 (1.40) 25.4 (1.39) 27.9 (1.61) 28.2 (1.74) 16.2 (1.5Statistics/probability (0.5)............................ 1.0 1.1 1.0 2.0 3.7 5.7 (0.86) 5.8 (0.97) 5.6 (0.86) 6.1 (1.00) 3.8 (1.2Calculus (1.0).............................................. 5.0 6.1 6.5 9.3 11.0 11.6 (0.73) 12.2 (0.79) 11.1 (0.77) 12.5 (0.77) 4.7 (0.5AP calculus (1.0)......................................... 1.6 3.4 4.1 7.0 6.7 7.9 (0.58) 8.5 (0.71) 7.3 (0.57) 8.4 (0.62) 2.6 (0.4
Science1
Any science (1.0) ............................................ 96.4 97.8 99.3 99.5 99.5 99.5 (0.11) 99.3 (0.17) 99.7 (0.08) 99.6 (0.13) 99.5 (0.1Biology (1.0)................................................ 77.4 86.0 91.0 93.2 92.7 91.2 (1.00) 89.0 (0.32) 93.3 (0.80) 91.8 (1.15) 92.3 (1.0AP/honors biology (1.0) .............................. 10.0 9.4 10.1 11.9 16.2 16.3 (1.46) 13.8 (1.41) 18.5 (1.63) 17.9 (1.78) 10.8 (1.3Chemistry (1.0) ........................................... 32.1 44.2 48.9 55.8 60.4 62.0 (1.47) 58.0 (1.42) 65.7 (1.74) 63.0 (1.67) 59.9 (2.4AP/honors chemistry (1.0) .......................... 3.0 3.5 3.5 3.9 4.7 5.8 (0.85) 5.8 (0.91) 5.7 (0.83) 6.1 (1.19) 2.8 (0.4Physics (1.0) ............................................... 15.0 20.0 21.6 24.5 28.8 31.4 (1.16) 34.2 (1.29) 29.0 (1.22) 32.4 (1.34) 25.2 (1.9AP/honors physics (1.0).............................. 1.2 1.8 2.0 2.7 3.0 3.9 (0.61) 5.4 (0.94) 2.5 (0.38) 4.0 (0.78) 2.2 (0.7Engineering (1.0) ........................................ 1.2 2.6 4.2 4.5 6.7 3.9 (0.91) 4.3 (1.04) 3.5 (0.85) 4.2 (1.14) 2.7 (0.7Astronomy (0.5) .......................................... 1.2 1.0 1.2 1.7 1.9 2.8 (0.59) 3.0 (0.65) 2.6 (0.57) 2.8 (0.68) 1.8 (0.5Geology/earth science (0.5)........................ 13.6 13.4 24.7 22.9 20.7 17.4 (1.86) 18.4 (1.98) 16.6 (1.82) 17.5 (2.34) 18.8 (2.5Biology and chemistry (2.0) ........................ 29.3 41.4 47.5 53.7 59.0 59.4 (1.49) 54.5 (1.49) 63.8 (1.74) 60.3 (1.72) 58.0 (2.3Biology, chemistry, and physics (3.0) .......... 11.2 16.6 18.8 21.4 25.4 25.1 (1.09) 26.4 (1.23) 24.0 (1.13) 25.7 (1.20) 20.1 (1.7
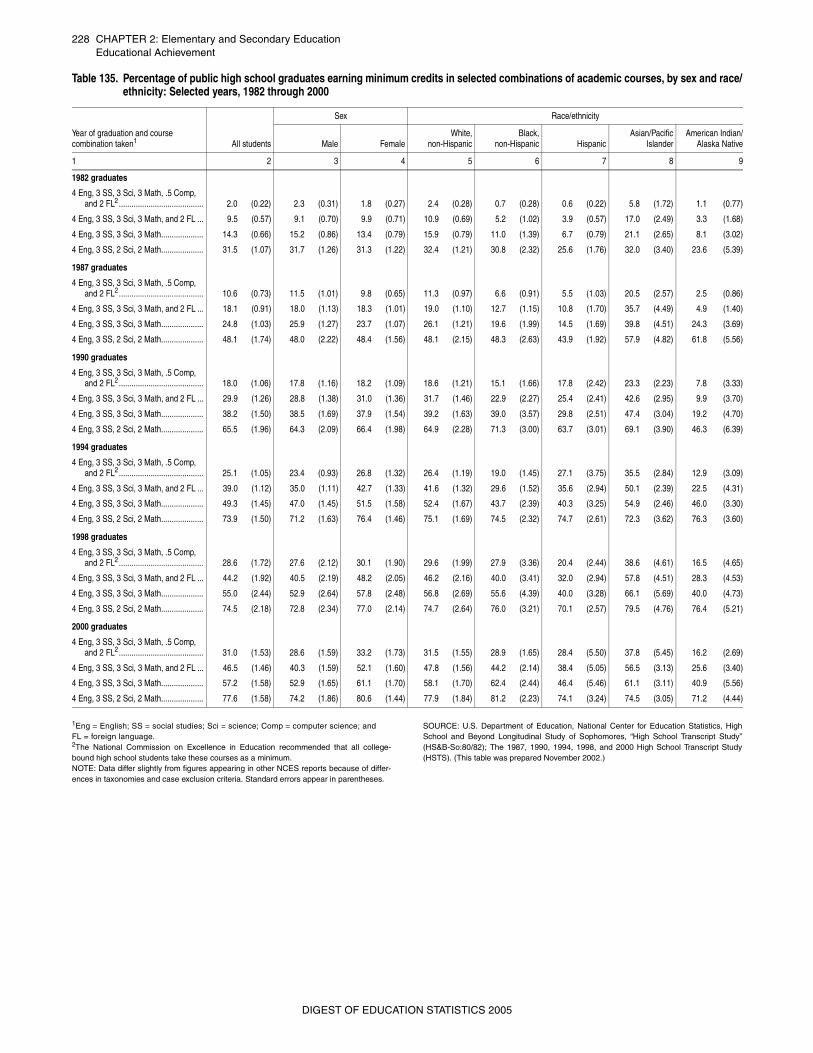
228 CHAPTER 2: Elementary and Secondary EducationEducational Achievement
_
1Eng = English; SS = social studies; Sci = science; Comp = computer science; and FL = foreign language. 2The National Commission on Excellence in Education recommended that all college-bound high school students take these courses as a minimum. NOTE: Data differ slightly from figures appearing in other NCES reports because of differ-ences in taxonomies and case exclusion criteria. Standard errors appear in parentheses.
SOURCE: U.S. Department of Education, National Center for Education Statistics, HighSchool and Beyond Longitudinal Study of Sophomores, “High School Transcript Study”(HS&B-So:80/82); The 1987, 1990, 1994, 1998, and 2000 High School Transcript Study(HSTS). (This table was prepared November 2002.)
Table 135. Percentage of public high school graduates earning minimum credits in selected combinations of academic courses, by sex and race/ethnicity: Selected years, 1982 through 2000
Year of graduation and course combination taken1 All students
Sex Race/ethnicity
Male FemaleWhite,
non-HispanicBlack,
non-Hispanic HispanicAsian/Pacific
IslanderAmerican Indian/
Alaska Native
1 2 3 4 5 6 7 8 9
1982 graduates
4 Eng, 3 SS, 3 Sci, 3 Math, .5 Comp, and 2 FL2........................................ 2.0 (0.22) 2.3 (0.31) 1.8 (0.27) 2.4 (0.28) 0.7 (0.28) 0.6 (0.22) 5.8 (1.72) 1.1 (0.77)
4 Eng, 3 SS, 3 Sci, 3 Math, and 2 FL ... 9.5 (0.57) 9.1 (0.70) 9.9 (0.71) 10.9 (0.69) 5.2 (1.02) 3.9 (0.57) 17.0 (2.49) 3.3 (1.68)
4 Eng, 3 SS, 3 Sci, 3 Math.................... 14.3 (0.66) 15.2 (0.86) 13.4 (0.79) 15.9 (0.79) 11.0 (1.39) 6.7 (0.79) 21.1 (2.65) 8.1 (3.02)
4 Eng, 3 SS, 2 Sci, 2 Math.................... 31.5 (1.07) 31.7 (1.26) 31.3 (1.22) 32.4 (1.21) 30.8 (2.32) 25.6 (1.76) 32.0 (3.40) 23.6 (5.39)
1987 graduates
4 Eng, 3 SS, 3 Sci, 3 Math, .5 Comp, and 2 FL2........................................ 10.6 (0.73) 11.5 (1.01) 9.8 (0.65) 11.3 (0.97) 6.6 (0.91) 5.5 (1.03) 20.5 (2.57) 2.5 (0.86)
4 Eng, 3 SS, 3 Sci, 3 Math, and 2 FL ... 18.1 (0.91) 18.0 (1.13) 18.3 (1.01) 19.0 (1.10) 12.7 (1.15) 10.8 (1.70) 35.7 (4.49) 4.9 (1.40)
4 Eng, 3 SS, 3 Sci, 3 Math.................... 24.8 (1.03) 25.9 (1.27) 23.7 (1.07) 26.1 (1.21) 19.6 (1.99) 14.5 (1.69) 39.8 (4.51) 24.3 (3.69)
4 Eng, 3 SS, 2 Sci, 2 Math.................... 48.1 (1.74) 48.0 (2.22) 48.4 (1.56) 48.1 (2.15) 48.3 (2.63) 43.9 (1.92) 57.9 (4.82) 61.8 (5.56)
1990 graduates
4 Eng, 3 SS, 3 Sci, 3 Math, .5 Comp, and 2 FL2........................................ 18.0 (1.06) 17.8 (1.16) 18.2 (1.09) 18.6 (1.21) 15.1 (1.66) 17.8 (2.42) 23.3 (2.23) 7.8 (3.33)
4 Eng, 3 SS, 3 Sci, 3 Math, and 2 FL ... 29.9 (1.26) 28.8 (1.38) 31.0 (1.36) 31.7 (1.46) 22.9 (2.27) 25.4 (2.41) 42.6 (2.95) 9.9 (3.70)
4 Eng, 3 SS, 3 Sci, 3 Math.................... 38.2 (1.50) 38.5 (1.69) 37.9 (1.54) 39.2 (1.63) 39.0 (3.57) 29.8 (2.51) 47.4 (3.04) 19.2 (4.70)
4 Eng, 3 SS, 2 Sci, 2 Math.................... 65.5 (1.96) 64.3 (2.09) 66.4 (1.98) 64.9 (2.28) 71.3 (3.00) 63.7 (3.01) 69.1 (3.90) 46.3 (6.39)
1994 graduates
4 Eng, 3 SS, 3 Sci, 3 Math, .5 Comp, and 2 FL2........................................ 25.1 (1.05) 23.4 (0.93) 26.8 (1.32) 26.4 (1.19) 19.0 (1.45) 27.1 (3.75) 35.5 (2.84) 12.9 (3.09)
4 Eng, 3 SS, 3 Sci, 3 Math, and 2 FL ... 39.0 (1.12) 35.0 (1.11) 42.7 (1.33) 41.6 (1.32) 29.6 (1.52) 35.6 (2.94) 50.1 (2.39) 22.5 (4.31)
4 Eng, 3 SS, 3 Sci, 3 Math.................... 49.3 (1.45) 47.0 (1.45) 51.5 (1.58) 52.4 (1.67) 43.7 (2.39) 40.3 (3.25) 54.9 (2.46) 46.0 (3.30)
4 Eng, 3 SS, 2 Sci, 2 Math.................... 73.9 (1.50) 71.2 (1.63) 76.4 (1.46) 75.1 (1.69) 74.5 (2.32) 74.7 (2.61) 72.3 (3.62) 76.3 (3.60)
1998 graduates
4 Eng, 3 SS, 3 Sci, 3 Math, .5 Comp, and 2 FL2........................................ 28.6 (1.72) 27.6 (2.12) 30.1 (1.90) 29.6 (1.99) 27.9 (3.36) 20.4 (2.44) 38.6 (4.61) 16.5 (4.65)
4 Eng, 3 SS, 3 Sci, 3 Math, and 2 FL ... 44.2 (1.92) 40.5 (2.19) 48.2 (2.05) 46.2 (2.16) 40.0 (3.41) 32.0 (2.94) 57.8 (4.51) 28.3 (4.53)
4 Eng, 3 SS, 3 Sci, 3 Math.................... 55.0 (2.44) 52.9 (2.64) 57.8 (2.48) 56.8 (2.69) 55.6 (4.39) 40.0 (3.28) 66.1 (5.69) 40.0 (4.73)
4 Eng, 3 SS, 2 Sci, 2 Math.................... 74.5 (2.18) 72.8 (2.34) 77.0 (2.14) 74.7 (2.64) 76.0 (3.21) 70.1 (2.57) 79.5 (4.76) 76.4 (5.21)
2000 graduates
4 Eng, 3 SS, 3 Sci, 3 Math, .5 Comp, and 2 FL2........................................ 31.0 (1.53) 28.6 (1.59) 33.2 (1.73) 31.5 (1.55) 28.9 (1.65) 28.4 (5.50) 37.8 (5.45) 16.2 (2.69)
4 Eng, 3 SS, 3 Sci, 3 Math, and 2 FL ... 46.5 (1.46) 40.3 (1.59) 52.1 (1.60) 47.8 (1.56) 44.2 (2.14) 38.4 (5.05) 56.5 (3.13) 25.6 (3.40)
4 Eng, 3 SS, 3 Sci, 3 Math.................... 57.2 (1.58) 52.9 (1.65) 61.1 (1.70) 58.1 (1.70) 62.4 (2.44) 46.4 (5.46) 61.1 (3.11) 40.9 (5.56)
4 Eng, 3 SS, 2 Sci, 2 Math.................... 77.6 (1.58) 74.2 (1.86) 80.6 (1.44) 77.9 (1.84) 81.2 (2.23) 74.1 (3.24) 74.5 (3.05) 71.2 (4.44)
DIGEST OF EDUCATION STATISTICS 2005
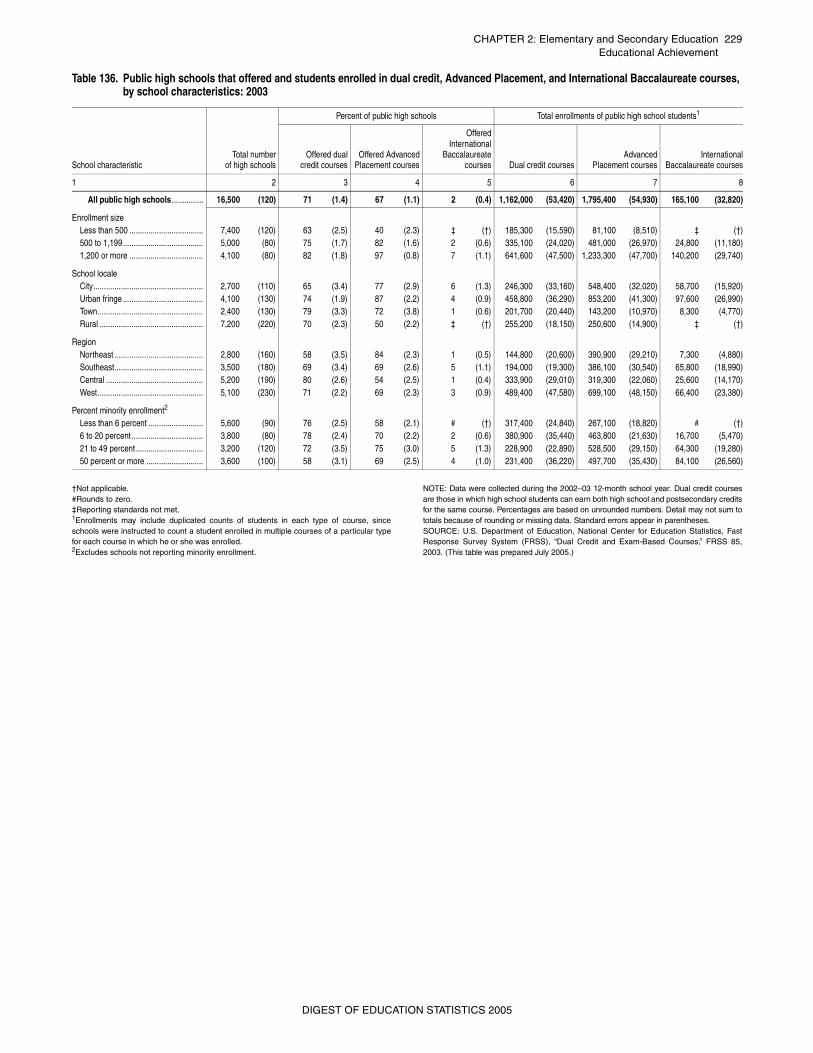
CHAPTER 2: Elementary and Secondary Education 229Educational Achievement
†Not applicable.#Rounds to zero.‡Reporting standards not met.1Enrollments may include duplicated counts of students in each type of course, sinceschools were instructed to count a student enrolled in multiple courses of a particular typefor each course in which he or she was enrolled.2Excludes schools not reporting minority enrollment.
NOTE: Data were collected during the 2002–03 12-month school year. Dual credit coursesare those in which high school students can earn both high school and postsecondary creditsfor the same course. Percentages are based on unrounded numbers. Detail may not sum tototals because of rounding or missing data. Standard errors appear in parentheses.SOURCE: U.S. Department of Education, National Center for Education Statistics, FastResponse Survey System (FRSS), “Dual Credit and Exam-Based Courses,” FRSS 85,2003. (This table was prepared July 2005.)
Table 136. Public high schools that offered and students enrolled in dual credit, Advanced Placement, and International Baccalaureate courses, by school characteristics: 2003
School characteristicTotal number
of high schools
Percent of public high schools Total enrollments of public high school students1
Offered dualcredit courses
Offered AdvancedPlacement courses
OfferedInternational
Baccalaureatecourses Dual credit courses
AdvancedPlacement courses
InternationalBaccalaureate courses
1 2 3 4 5 6 7 8
All public high schools............... 16,500 (120) 71 (1.4) 67 (1.1) 2 (0.4) 1,162,000 (53,420) 1,795,400 (54,930) 165,100 (32,820)
Enrollment sizeLess than 500 ................................... 7,400 (120) 63 (2.5) 40 (2.3) ‡ (†) 185,300 (15,590) 81,100 (8,510) ‡ (†)500 to 1,199...................................... 5,000 (80) 75 (1.7) 82 (1.6) 2 (0.6) 335,100 (24,020) 481,000 (26,970) 24,800 (11,180)1,200 or more ................................... 4,100 (80) 82 (1.8) 97 (0.8) 7 (1.1) 641,600 (47,500) 1,233,300 (47,700) 140,200 (29,740)
School localeCity.................................................... 2,700 (110) 65 (3.4) 77 (2.9) 6 (1.3) 246,300 (33,160) 548,400 (32,020) 58,700 (15,920)Urban fringe ...................................... 4,100 (130) 74 (1.9) 87 (2.2) 4 (0.9) 458,800 (36,290) 853,200 (41,300) 97,600 (26,990)Town.................................................. 2,400 (130) 79 (3.3) 72 (3.8) 1 (0.6) 201,700 (20,440) 143,200 (10,970) 8,300 (4,770)Rural ................................................. 7,200 (220) 70 (2.3) 50 (2.2) ‡ (†) 255,200 (18,150) 250,600 (14,900) ‡ (†)
RegionNortheast .......................................... 2,800 (160) 58 (3.5) 84 (2.3) 1 (0.5) 144,800 (20,600) 390,900 (29,210) 7,300 (4,880)Southeast.......................................... 3,500 (180) 69 (3.4) 69 (2.6) 5 (1.1) 194,000 (19,300) 386,100 (30,540) 65,800 (18,990)Central .............................................. 5,200 (190) 80 (2.6) 54 (2.5) 1 (0.4) 333,900 (29,010) 319,300 (22,060) 25,600 (14,170)West.................................................. 5,100 (230) 71 (2.2) 69 (2.3) 3 (0.9) 489,400 (47,580) 699,100 (48,150) 66,400 (23,380)
Percent minority enrollment2
Less than 6 percent .......................... 5,600 (90) 76 (2.5) 58 (2.1) # (†) 317,400 (24,840) 267,100 (18,820) # (†)6 to 20 percent.................................. 3,800 (80) 78 (2.4) 70 (2.2) 2 (0.6) 380,900 (35,440) 463,800 (21,630) 16,700 (5,470)21 to 49 percent................................ 3,200 (120) 72 (3.5) 75 (3.0) 5 (1.3) 228,900 (22,890) 528,500 (29,150) 64,300 (19,280)50 percent or more ........................... 3,600 (100) 58 (3.1) 69 (2.5) 4 (1.0) 231,400 (36,220) 497,700 (35,430) 84,100 (26,560)
DIGEST OF EDUCATION STATISTICS 2005
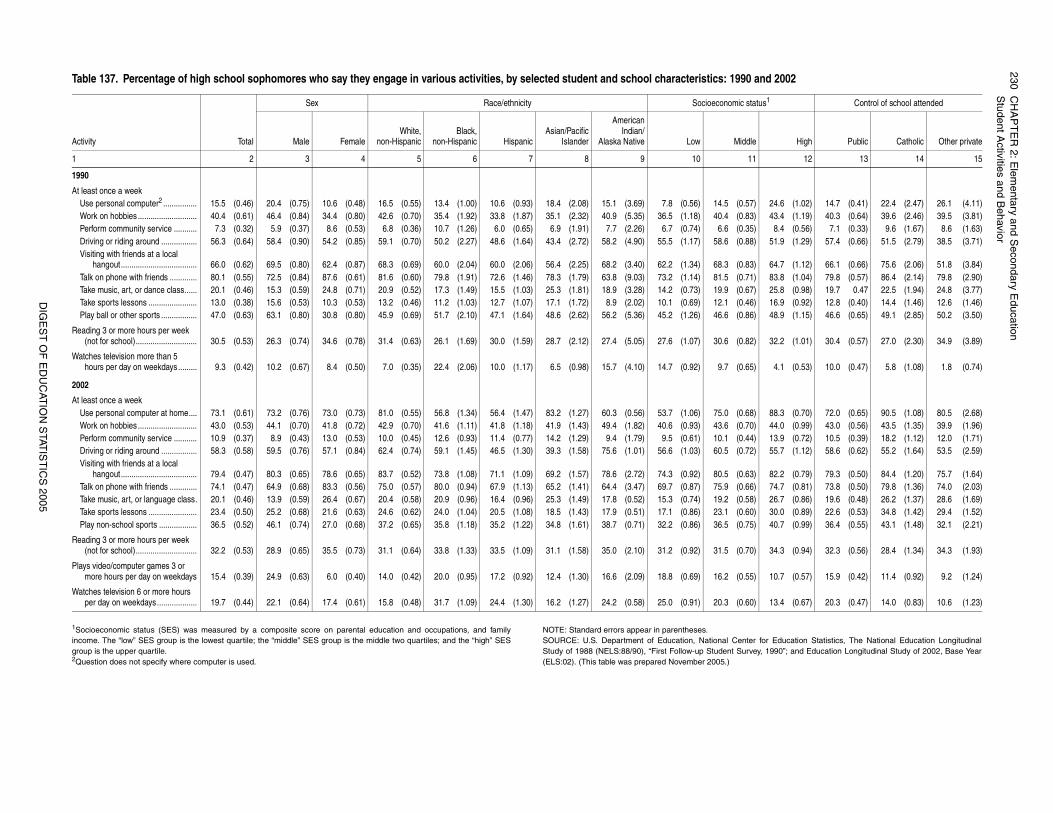
230C
HA
PT
ER
2: Elem
entary and Secondary E
ducationS
tudent Activities and B
ehavior
DIG
ES
T O
F E
DU
CAT
ION
STAT
IST
ICS
2005
for Education Statistics, The National Education Longitudinaly, 1990”; and Education Longitudinal Study of 2002, Base Year
udent and 2002
tus1 Control of school attended
High Public Catholic Other private
12 13 14 15
24.6 (1.02) 14.7 (0.41) 22.4 (2.47) 26.1 (4.11)43.4 (1.19) 40.3 (0.64) 39.6 (2.46) 39.5 (3.81)
8.4 (0.56) 7.1 (0.33) 9.6 (1.67) 8.6 (1.63)51.9 (1.29) 57.4 (0.66) 51.5 (2.79) 38.5 (3.71)
64.7 (1.12) 66.1 (0.66) 75.6 (2.06) 51.8 (3.84)83.8 (1.04) 79.8 (0.57) 86.4 (2.14) 79.8 (2.90)25.8 (0.98) 19.7 0.47 22.5 (1.94) 24.8 (3.77)16.9 (0.92) 12.8 (0.40) 14.4 (1.46) 12.6 (1.46)48.9 (1.15) 46.6 (0.65) 49.1 (2.85) 50.2 (3.50)
32.2 (1.01) 30.4 (0.57) 27.0 (2.30) 34.9 (3.89)
4.1 (0.53) 10.0 (0.47) 5.8 (1.08) 1.8 (0.74)
88.3 (0.70) 72.0 (0.65) 90.5 (1.08) 80.5 (2.68)44.0 (0.99) 43.0 (0.56) 43.5 (1.35) 39.9 (1.96)13.9 (0.72) 10.5 (0.39) 18.2 (1.12) 12.0 (1.71)55.7 (1.12) 58.6 (0.62) 55.2 (1.64) 53.5 (2.59)
82.2 (0.79) 79.3 (0.50) 84.4 (1.20) 75.7 (1.64)74.7 (0.81) 73.8 (0.50) 79.8 (1.36) 74.0 (2.03)26.7 (0.86) 19.6 (0.48) 26.2 (1.37) 28.6 (1.69)30.0 (0.89) 22.6 (0.53) 34.8 (1.42) 29.4 (1.52)40.7 (0.99) 36.4 (0.55) 43.1 (1.48) 32.1 (2.21)
34.3 (0.94) 32.3 (0.56) 28.4 (1.34) 34.3 (1.93)
10.7 (0.57) 15.9 (0.42) 11.4 (0.92) 9.2 (1.24)
13.4 (0.67) 20.3 (0.47) 14.0 (0.83) 10.6 (1.23)
_
1Socioeconomic status (SES) was measured by a composite score on parental education and occupations, and familyincome. The “low” SES group is the lowest quartile; the “middle” SES group is the middle two quartiles; and the “high” SESgroup is the upper quartile.2Question does not specify where computer is used.
NOTE: Standard errors appear in parentheses.SOURCE: U.S. Department of Education, National CenterStudy of 1988 (NELS:88/90), “First Follow-up Student Surve(ELS:02). (This table was prepared November 2005.)
St Table 137. Percentage of high school sophomores who say they engage in various activities, by selected student and school characteristics: 1990
Activity Total
Sex Race/ethnicity Socioeconomic sta
Male FemaleWhite,
non-HispanicBlack,
non-Hispanic HispanicAsian/Pacific
Islander
AmericanIndian/
Alaska Native Low Middle
1 2 3 4 5 6 7 8 9 10 11
1990
At least once a weekUse personal computer2 ................ 15.5 (0.46) 20.4 (0.75) 10.6 (0.48) 16.5 (0.55) 13.4 (1.00) 10.6 (0.93) 18.4 (2.08) 15.1 (3.69) 7.8 (0.56) 14.5 (0.57)Work on hobbies ............................ 40.4 (0.61) 46.4 (0.84) 34.4 (0.80) 42.6 (0.70) 35.4 (1.92) 33.8 (1.87) 35.1 (2.32) 40.9 (5.35) 36.5 (1.18) 40.4 (0.83)Perform community service ........... 7.3 (0.32) 5.9 (0.37) 8.6 (0.53) 6.8 (0.36) 10.7 (1.26) 6.0 (0.65) 6.9 (1.91) 7.7 (2.26) 6.7 (0.74) 6.6 (0.35)Driving or riding around ................. 56.3 (0.64) 58.4 (0.90) 54.2 (0.85) 59.1 (0.70) 50.2 (2.27) 48.6 (1.64) 43.4 (2.72) 58.2 (4.90) 55.5 (1.17) 58.6 (0.88)Visiting with friends at a local
hangout.................................... 66.0 (0.62) 69.5 (0.80) 62.4 (0.87) 68.3 (0.69) 60.0 (2.04) 60.0 (2.06) 56.4 (2.25) 68.2 (3.40) 62.2 (1.34) 68.3 (0.83)Talk on phone with friends ............. 80.1 (0.55) 72.5 (0.84) 87.6 (0.61) 81.6 (0.60) 79.8 (1.91) 72.6 (1.46) 78.3 (1.79) 63.8 (9.03) 73.2 (1.14) 81.5 (0.71)Take music, art, or dance class...... 20.1 (0.46) 15.3 (0.59) 24.8 (0.71) 20.9 (0.52) 17.3 (1.49) 15.5 (1.03) 25.3 (1.81) 18.9 (3.28) 14.2 (0.73) 19.9 (0.67)Take sports lessons ....................... 13.0 (0.38) 15.6 (0.53) 10.3 (0.53) 13.2 (0.46) 11.2 (1.03) 12.7 (1.07) 17.1 (1.72) 8.9 (2.02) 10.1 (0.69) 12.1 (0.46)Play ball or other sports ................. 47.0 (0.63) 63.1 (0.80) 30.8 (0.80) 45.9 (0.69) 51.7 (2.10) 47.1 (1.64) 48.6 (2.62) 56.2 (5.36) 45.2 (1.26) 46.6 (0.86)
Reading 3 or more hours per week (not for school)............................. 30.5 (0.53) 26.3 (0.74) 34.6 (0.78) 31.4 (0.63) 26.1 (1.69) 30.0 (1.59) 28.7 (2.12) 27.4 (5.05) 27.6 (1.07) 30.6 (0.82)
Watches television more than 5 hours per day on weekdays......... 9.3 (0.42) 10.2 (0.67) 8.4 (0.50) 7.0 (0.35) 22.4 (2.06) 10.0 (1.17) 6.5 (0.98) 15.7 (4.10) 14.7 (0.92) 9.7 (0.65)
2002
At least once a weekUse personal computer at home.... 73.1 (0.61) 73.2 (0.76) 73.0 (0.73) 81.0 (0.55) 56.8 (1.34) 56.4 (1.47) 83.2 (1.27) 60.3 (0.56) 53.7 (1.06) 75.0 (0.68)Work on hobbies ............................ 43.0 (0.53) 44.1 (0.70) 41.8 (0.72) 42.9 (0.70) 41.6 (1.11) 41.8 (1.18) 41.9 (1.43) 49.4 (1.82) 40.6 (0.93) 43.6 (0.70)Perform community service ........... 10.9 (0.37) 8.9 (0.43) 13.0 (0.53) 10.0 (0.45) 12.6 (0.93) 11.4 (0.77) 14.2 (1.29) 9.4 (1.79) 9.5 (0.61) 10.1 (0.44)Driving or riding around ................. 58.3 (0.58) 59.5 (0.76) 57.1 (0.84) 62.4 (0.74) 59.1 (1.45) 46.5 (1.30) 39.3 (1.58) 75.6 (1.01) 56.6 (1.03) 60.5 (0.72)Visiting with friends at a local
hangout.................................... 79.4 (0.47) 80.3 (0.65) 78.6 (0.65) 83.7 (0.52) 73.8 (1.08) 71.1 (1.09) 69.2 (1.57) 78.6 (2.72) 74.3 (0.92) 80.5 (0.63)Talk on phone with friends ............. 74.1 (0.47) 64.9 (0.68) 83.3 (0.56) 75.0 (0.57) 80.0 (0.94) 67.9 (1.13) 65.2 (1.41) 64.4 (3.47) 69.7 (0.87) 75.9 (0.66)Take music, art, or language class. 20.1 (0.46) 13.9 (0.59) 26.4 (0.67) 20.4 (0.58) 20.9 (0.96) 16.4 (0.96) 25.3 (1.49) 17.8 (0.52) 15.3 (0.74) 19.2 (0.58)Take sports lessons ....................... 23.4 (0.50) 25.2 (0.68) 21.6 (0.63) 24.6 (0.62) 24.0 (1.04) 20.5 (1.08) 18.5 (1.43) 17.9 (0.51) 17.1 (0.86) 23.1 (0.60)Play non-school sports .................. 36.5 (0.52) 46.1 (0.74) 27.0 (0.68) 37.2 (0.65) 35.8 (1.18) 35.2 (1.22) 34.8 (1.61) 38.7 (0.71) 32.2 (0.86) 36.5 (0.75)
Reading 3 or more hours per week (not for school)............................. 32.2 (0.53) 28.9 (0.65) 35.5 (0.73) 31.1 (0.64) 33.8 (1.33) 33.5 (1.09) 31.1 (1.58) 35.0 (2.10) 31.2 (0.92) 31.5 (0.70)
Plays video/computer games 3 or more hours per day on weekdays 15.4 (0.39) 24.9 (0.63) 6.0 (0.40) 14.0 (0.42) 20.0 (0.95) 17.2 (0.92) 12.4 (1.30) 16.6 (2.09) 18.8 (0.69) 16.2 (0.55)
Watches television 6 or more hours per day on weekdays................... 19.7 (0.44) 22.1 (0.64) 17.4 (0.61) 15.8 (0.48) 31.7 (1.09) 24.4 (1.30) 16.2 (1.27) 24.2 (0.58) 25.0 (0.91) 20.3 (0.60)
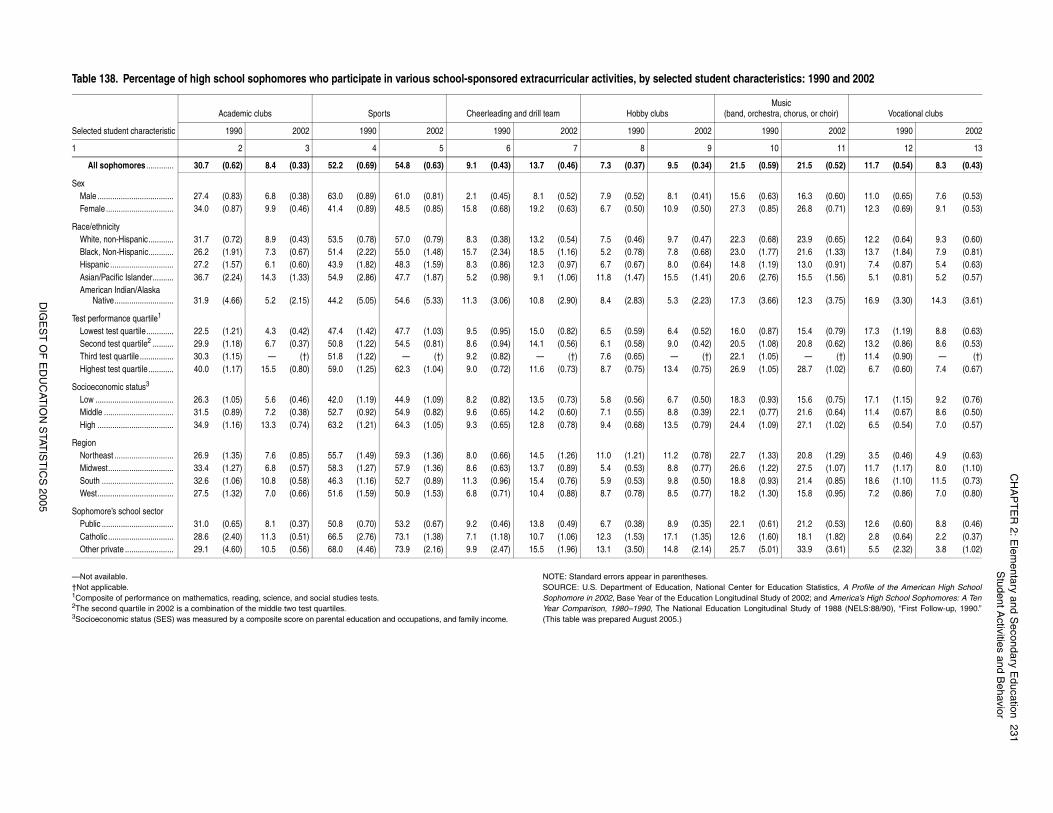
CH
AP
TE
R 2: E
lementary and S
econdary Education
231S
tudent Activities and B
ehavior
DIG
ES
T O
F E
DU
CAT
ION
STAT
IST
ICS
2005
for Education Statistics, A Profile of the American High Schooll Study of 2002; and America’s High School Sophomores: A Tengitudinal Study of 1988 (NELS:88/90), “First Follow-up, 1990.”
cteristics: 1990 and 2002
Music chestra, chorus, or choir) Vocational clubs
1990 2002 1990 2002
10 11 12 13
(0.59) 21.5 (0.52) 11.7 (0.54) 8.3 (0.43)
(0.63) 16.3 (0.60) 11.0 (0.65) 7.6 (0.53)(0.85) 26.8 (0.71) 12.3 (0.69) 9.1 (0.53)
(0.68) 23.9 (0.65) 12.2 (0.64) 9.3 (0.60)(1.77) 21.6 (1.33) 13.7 (1.84) 7.9 (0.81)(1.19) 13.0 (0.91) 7.4 (0.87) 5.4 (0.63)(2.76) 15.5 (1.56) 5.1 (0.81) 5.2 (0.57)
(3.66) 12.3 (3.75) 16.9 (3.30) 14.3 (3.61)
(0.87) 15.4 (0.79) 17.3 (1.19) 8.8 (0.63)(1.08) 20.8 (0.62) 13.2 (0.86) 8.6 (0.53)(1.05) — (†) 11.4 (0.90) — (†)(1.05) 28.7 (1.02) 6.7 (0.60) 7.4 (0.67)
(0.93) 15.6 (0.75) 17.1 (1.15) 9.2 (0.76)(0.77) 21.6 (0.64) 11.4 (0.67) 8.6 (0.50)(1.09) 27.1 (1.02) 6.5 (0.54) 7.0 (0.57)
(1.33) 20.8 (1.29) 3.5 (0.46) 4.9 (0.63)(1.22) 27.5 (1.07) 11.7 (1.17) 8.0 (1.10)(0.93) 21.4 (0.85) 18.6 (1.10) 11.5 (0.73)(1.30) 15.8 (0.95) 7.2 (0.86) 7.0 (0.80)
(0.61) 21.2 (0.53) 12.6 (0.60) 8.8 (0.46)(1.60) 18.1 (1.82) 2.8 (0.64) 2.2 (0.37)(5.01) 33.9 (3.61) 5.5 (2.32) 3.8 (1.02)
_
—Not available.†Not applicable.1Composite of performance on mathematics, reading, science, and social studies tests.2The second quartile in 2002 is a combination of the middle two test quartiles.3Socioeconomic status (SES) was measured by a composite score on parental education and occupations, and family income.
NOTE: Standard errors appear in parentheses.SOURCE: U.S. Department of Education, National Center Sophomore in 2002, Base Year of the Education LongitudinaYear Comparison, 1980–1990, The National Education Lon(This table was prepared August 2005.)
Table 138. Percentage of high school sophomores who participate in various school-sponsored extracurricular activities, by selected student chara
Selected student characteristic
Academic clubs Sports Cheerleading and drill team Hobby clubs (band, or
1990 2002 1990 2002 1990 2002 1990 2002
1 2 3 4 5 6 7 8 9
All sophomores ............. 30.7 (0.62) 8.4 (0.33) 52.2 (0.69) 54.8 (0.63) 9.1 (0.43) 13.7 (0.46) 7.3 (0.37) 9.5 (0.34) 21.5
SexMale .................................... 27.4 (0.83) 6.8 (0.38) 63.0 (0.89) 61.0 (0.81) 2.1 (0.45) 8.1 (0.52) 7.9 (0.52) 8.1 (0.41) 15.6Female ................................ 34.0 (0.87) 9.9 (0.46) 41.4 (0.89) 48.5 (0.85) 15.8 (0.68) 19.2 (0.63) 6.7 (0.50) 10.9 (0.50) 27.3
Race/ethnicityWhite, non-Hispanic............ 31.7 (0.72) 8.9 (0.43) 53.5 (0.78) 57.0 (0.79) 8.3 (0.38) 13.2 (0.54) 7.5 (0.46) 9.7 (0.47) 22.3Black, Non-Hispanic............ 26.2 (1.91) 7.3 (0.67) 51.4 (2.22) 55.0 (1.48) 15.7 (2.34) 18.5 (1.16) 5.2 (0.78) 7.8 (0.68) 23.0Hispanic .............................. 27.2 (1.57) 6.1 (0.60) 43.9 (1.82) 48.3 (1.59) 8.3 (0.86) 12.3 (0.97) 6.7 (0.67) 8.0 (0.64) 14.8Asian/Pacific Islander.......... 36.7 (2.24) 14.3 (1.33) 54.9 (2.86) 47.7 (1.87) 5.2 (0.98) 9.1 (1.06) 11.8 (1.47) 15.5 (1.41) 20.6American Indian/Alaska
Native............................ 31.9 (4.66) 5.2 (2.15) 44.2 (5.05) 54.6 (5.33) 11.3 (3.06) 10.8 (2.90) 8.4 (2.83) 5.3 (2.23) 17.3
Test performance quartile1
Lowest test quartile............. 22.5 (1.21) 4.3 (0.42) 47.4 (1.42) 47.7 (1.03) 9.5 (0.95) 15.0 (0.82) 6.5 (0.59) 6.4 (0.52) 16.0Second test quartile2 .......... 29.9 (1.18) 6.7 (0.37) 50.8 (1.22) 54.5 (0.81) 8.6 (0.94) 14.1 (0.56) 6.1 (0.58) 9.0 (0.42) 20.5Third test quartile ................ 30.3 (1.15) — (†) 51.8 (1.22) — (†) 9.2 (0.82) — (†) 7.6 (0.65) — (†) 22.1Highest test quartile............ 40.0 (1.17) 15.5 (0.80) 59.0 (1.25) 62.3 (1.04) 9.0 (0.72) 11.6 (0.73) 8.7 (0.75) 13.4 (0.75) 26.9
Socioeconomic status3
Low ..................................... 26.3 (1.05) 5.6 (0.46) 42.0 (1.19) 44.9 (1.09) 8.2 (0.82) 13.5 (0.73) 5.8 (0.56) 6.7 (0.50) 18.3Middle ................................. 31.5 (0.89) 7.2 (0.38) 52.7 (0.92) 54.9 (0.82) 9.6 (0.65) 14.2 (0.60) 7.1 (0.55) 8.8 (0.39) 22.1High .................................... 34.9 (1.16) 13.3 (0.74) 63.2 (1.21) 64.3 (1.05) 9.3 (0.65) 12.8 (0.78) 9.4 (0.68) 13.5 (0.79) 24.4
RegionNortheast ............................ 26.9 (1.35) 7.6 (0.85) 55.7 (1.49) 59.3 (1.36) 8.0 (0.66) 14.5 (1.26) 11.0 (1.21) 11.2 (0.78) 22.7Midwest............................... 33.4 (1.27) 6.8 (0.57) 58.3 (1.27) 57.9 (1.36) 8.6 (0.63) 13.7 (0.89) 5.4 (0.53) 8.8 (0.77) 26.6South .................................. 32.6 (1.06) 10.8 (0.58) 46.3 (1.16) 52.7 (0.89) 11.3 (0.96) 15.4 (0.76) 5.9 (0.53) 9.8 (0.50) 18.8West.................................... 27.5 (1.32) 7.0 (0.66) 51.6 (1.59) 50.9 (1.53) 6.8 (0.71) 10.4 (0.88) 8.7 (0.78) 8.5 (0.77) 18.2
Sophomore’s school sectorPublic .................................. 31.0 (0.65) 8.1 (0.37) 50.8 (0.70) 53.2 (0.67) 9.2 (0.46) 13.8 (0.49) 6.7 (0.38) 8.9 (0.35) 22.1Catholic ............................... 28.6 (2.40) 11.3 (0.51) 66.5 (2.76) 73.1 (1.38) 7.1 (1.18) 10.7 (1.06) 12.3 (1.53) 17.1 (1.35) 12.6Other private ....................... 29.1 (4.60) 10.5 (0.56) 68.0 (4.46) 73.9 (2.16) 9.9 (2.47) 15.5 (1.96) 13.1 (3.50) 14.8 (2.14) 25.7
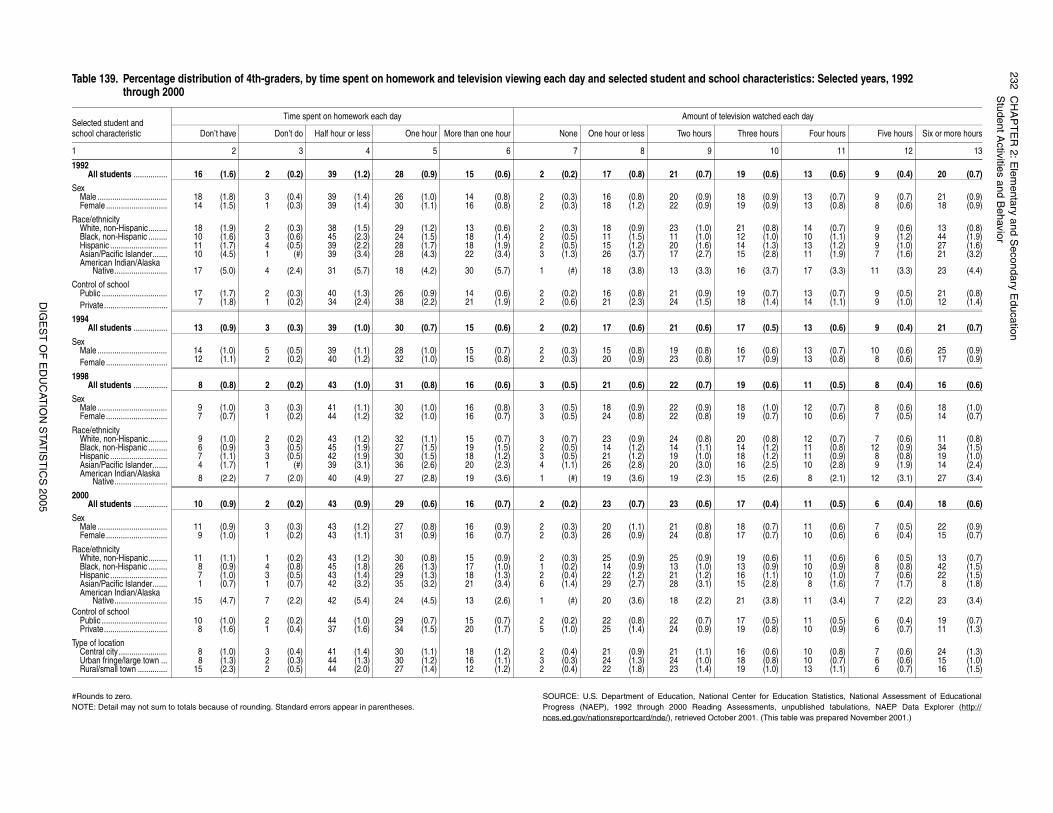
232C
HA
PT
ER
2: Elem
entary and Secondary E
ducationS
tudent Activities and B
ehavior
DIG
ES
T O
F E
DU
CAT
ION
STAT
IST
ICS
2005
for Education Statistics, National Assessment of Educationalents, unpublished tabulations, NAEP Data Explorer (http://
. (This table was prepared November 2001.)
racteristics: Selected years, 1992
atched each day
hours Four hours Five hours Six or more hours
10 11 12 13
(0.6) 13 (0.6) 9 (0.4) 20 (0.7)
(0.9) 13 (0.7) 9 (0.7) 21 (0.9)(0.9) 13 (0.8) 8 (0.6) 18 (0.9)
(0.8) 14 (0.7) 9 (0.6) 13 (0.8)(1.0) 10 (1.1) 9 (1.2) 44 (1.9)(1.3) 13 (1.2) 9 (1.0) 27 (1.6)(2.8) 11 (1.9) 7 (1.6) 21 (3.2)
(3.7) 17 (3.3) 11 (3.3) 23 (4.4)
(0.7) 13 (0.7) 9 (0.5) 21 (0.8)(1.4) 14 (1.1) 9 (1.0) 12 (1.4)
(0.5) 13 (0.6) 9 (0.4) 21 (0.7)
(0.6) 13 (0.7) 10 (0.6) 25 (0.9)(0.9) 13 (0.8) 8 (0.6) 17 (0.9)
(0.6) 11 (0.5) 8 (0.4) 16 (0.6)
(1.0) 12 (0.7) 8 (0.6) 18 (1.0)(0.7) 10 (0.6) 7 (0.5) 14 (0.7)
(0.8) 12 (0.7) 7 (0.6) 11 (0.8)(1.2) 11 (0.8) 12 (0.9) 34 (1.5)(1.2) 11 (0.9) 8 (0.8) 19 (1.0)(2.5) 10 (2.8) 9 (1.9) 14 (2.4)(2.6) 8 (2.1) 12 (3.1) 27 (3.4)
(0.4) 11 (0.5) 6 (0.4) 18 (0.6)
(0.7) 11 (0.6) 7 (0.5) 22 (0.9)(0.7) 10 (0.6) 6 (0.4) 15 (0.7)
(0.6) 11 (0.6) 6 (0.5) 13 (0.7)(0.9) 10 (0.9) 8 (0.8) 42 (1.5)(1.1) 10 (1.0) 7 (0.6) 22 (1.5)(2.8) 8 (1.6) 7 (1.7) 8 (1.8)
(3.8) 11 (3.4) 7 (2.2) 23 (3.4)
(0.5) 11 (0.5) 6 (0.4) 19 (0.7)(0.8) 10 (0.9) 6 (0.7) 11 (1.3)
(0.6) 10 (0.8) 7 (0.6) 24 (1.3)(0.8) 10 (0.7) 6 (0.6) 15 (1.0)(1.0) 13 (1.1) 6 (0.7) 16 (1.5)
#Rounds to zero.NOTE: Detail may not sum to totals because of rounding. Standard errors appear in parentheses.
SOURCE: U.S. Department of Education, National CenterProgress (NAEP), 1992 through 2000 Reading Assessmnces.ed.gov/nationsreportcard/nde/), retrieved October 2001
Table 139. Percentage distribution of 4th-graders, by time spent on homework and television viewing each day and selected student and school chathrough 2000
Selected student and school characteristic
Time spent on homework each day Amount of television w
Don’t have Don’t do Half hour or less One hour More than one hour None One hour or less Two hours Three
1 2 3 4 5 6 7 8 9
1992All students ................ 16 (1.6) 2 (0.2) 39 (1.2) 28 (0.9) 15 (0.6) 2 (0.2) 17 (0.8) 21 (0.7) 19
SexMale ................................. 18 (1.8) 3 (0.4) 39 (1.4) 26 (1.0) 14 (0.8) 2 (0.3) 16 (0.8) 20 (0.9) 18Female ............................. 14 (1.5) 1 (0.3) 39 (1.4) 30 (1.1) 16 (0.8) 2 (0.3) 18 (1.2) 22 (0.9) 19
Race/ethnicity White, non-Hispanic......... 18 (1.9) 2 (0.3) 38 (1.5) 29 (1.2) 13 (0.6) 2 (0.3) 18 (0.9) 23 (1.0) 21Black, non-Hispanic ......... 10 (1.6) 3 (0.6) 45 (2.3) 24 (1.5) 18 (1.4) 2 (0.5) 11 (1.5) 11 (1.0) 12Hispanic ........................... 11 (1.7) 4 (0.5) 39 (2.2) 28 (1.7) 18 (1.9) 2 (0.5) 15 (1.2) 20 (1.6) 14Asian/Pacific Islander....... 10 (4.5) 1 (#) 39 (3.4) 28 (4.3) 22 (3.4) 3 (1.3) 26 (3.7) 17 (2.7) 15American Indian/Alaska
Native......................... 17 (5.0) 4 (2.4) 31 (5.7) 18 (4.2) 30 (5.7) 1 (#) 18 (3.8) 13 (3.3) 16
Control of schoolPublic ............................... 17 (1.7) 2 (0.3) 40 (1.3) 26 (0.9) 14 (0.6) 2 (0.2) 16 (0.8) 21 (0.9) 19Private.............................. 7 (1.8) 1 (0.2) 34 (2.4) 38 (2.2) 21 (1.9) 2 (0.6) 21 (2.3) 24 (1.5) 18
1994All students ................ 13 (0.9) 3 (0.3) 39 (1.0) 30 (0.7) 15 (0.6) 2 (0.2) 17 (0.6) 21 (0.6) 17
SexMale ................................. 14 (1.0) 5 (0.5) 39 (1.1) 28 (1.0) 15 (0.7) 2 (0.3) 15 (0.8) 19 (0.8) 16Female ............................. 12 (1.1) 2 (0.2) 40 (1.2) 32 (1.0) 15 (0.8) 2 (0.3) 20 (0.9) 23 (0.8) 17
1998All students ................ 8 (0.8) 2 (0.2) 43 (1.0) 31 (0.8) 16 (0.6) 3 (0.5) 21 (0.6) 22 (0.7) 19
SexMale ................................. 9 (1.0) 3 (0.3) 41 (1.1) 30 (1.0) 16 (0.8) 3 (0.5) 18 (0.9) 22 (0.9) 18Female ............................. 7 (0.7) 1 (0.2) 44 (1.2) 32 (1.0) 16 (0.7) 3 (0.5) 24 (0.8) 22 (0.8) 19
Race/ethnicity White, non-Hispanic......... 9 (1.0) 2 (0.2) 43 (1.2) 32 (1.1) 15 (0.7) 3 (0.7) 23 (0.9) 24 (0.8) 20Black, non-Hispanic ......... 6 (0.9) 3 (0.5) 45 (1.9) 27 (1.5) 19 (1.5) 2 (0.5) 14 (1.2) 14 (1.1) 14Hispanic ........................... 7 (1.1) 3 (0.5) 42 (1.9) 30 (1.5) 18 (1.2) 3 (0.5) 21 (1.2) 19 (1.0) 18Asian/Pacific Islander....... 4 (1.7) 1 (#) 39 (3.1) 36 (2.6) 20 (2.3) 4 (1.1) 26 (2.8) 20 (3.0) 16American Indian/Alaska
Native......................... 8 (2.2) 7 (2.0) 40 (4.9) 27 (2.8) 19 (3.6) 1 (#) 19 (3.6) 19 (2.3) 15
2000All students ................ 10 (0.9) 2 (0.2) 43 (0.9) 29 (0.6) 16 (0.7) 2 (0.2) 23 (0.7) 23 (0.6) 17
SexMale ................................. 11 (0.9) 3 (0.3) 43 (1.2) 27 (0.8) 16 (0.9) 2 (0.3) 20 (1.1) 21 (0.8) 18Female ............................. 9 (1.0) 1 (0.2) 43 (1.1) 31 (0.9) 16 (0.7) 2 (0.3) 26 (0.9) 24 (0.8) 17
Race/ethnicity White, non-Hispanic......... 11 (1.1) 1 (0.2) 43 (1.2) 30 (0.8) 15 (0.9) 2 (0.3) 25 (0.9) 25 (0.9) 19Black, non-Hispanic ......... 8 (0.9) 4 (0.8) 45 (1.8) 26 (1.3) 17 (1.0) 1 (0.2) 14 (0.9) 13 (1.0) 13Hispanic ........................... 7 (1.0) 3 (0.5) 43 (1.4) 29 (1.3) 18 (1.3) 2 (0.4) 22 (1.2) 21 (1.2) 16Asian/Pacific Islander....... 1 (0.7) 1 (0.7) 42 (3.2) 35 (3.2) 21 (3.4) 6 (1.4) 29 (2.7) 28 (3.1) 15American Indian/Alaska
Native......................... 15 (4.7) 7 (2.2) 42 (5.4) 24 (4.5) 13 (2.6) 1 (#) 20 (3.6) 18 (2.2) 21Control of school
Public ............................... 10 (1.0) 2 (0.2) 44 (1.0) 29 (0.7) 15 (0.7) 2 (0.2) 22 (0.8) 22 (0.7) 17Private.............................. 8 (1.6) 1 (0.4) 37 (1.6) 34 (1.5) 20 (1.7) 5 (1.0) 25 (1.4) 24 (0.9) 19
Type of locationCentral city ....................... 8 (1.0) 3 (0.4) 41 (1.4) 30 (1.1) 18 (1.2) 2 (0.4) 21 (0.9) 21 (1.1) 16Urban fringe/large town ... 8 (1.3) 2 (0.3) 44 (1.3) 30 (1.2) 16 (1.1) 3 (0.3) 24 (1.3) 24 (1.0) 18Rural/small town .............. 15 (2.3) 2 (0.5) 44 (2.0) 27 (1.4) 12 (1.2) 2 (0.4) 22 (1.8) 23 (1.4) 19
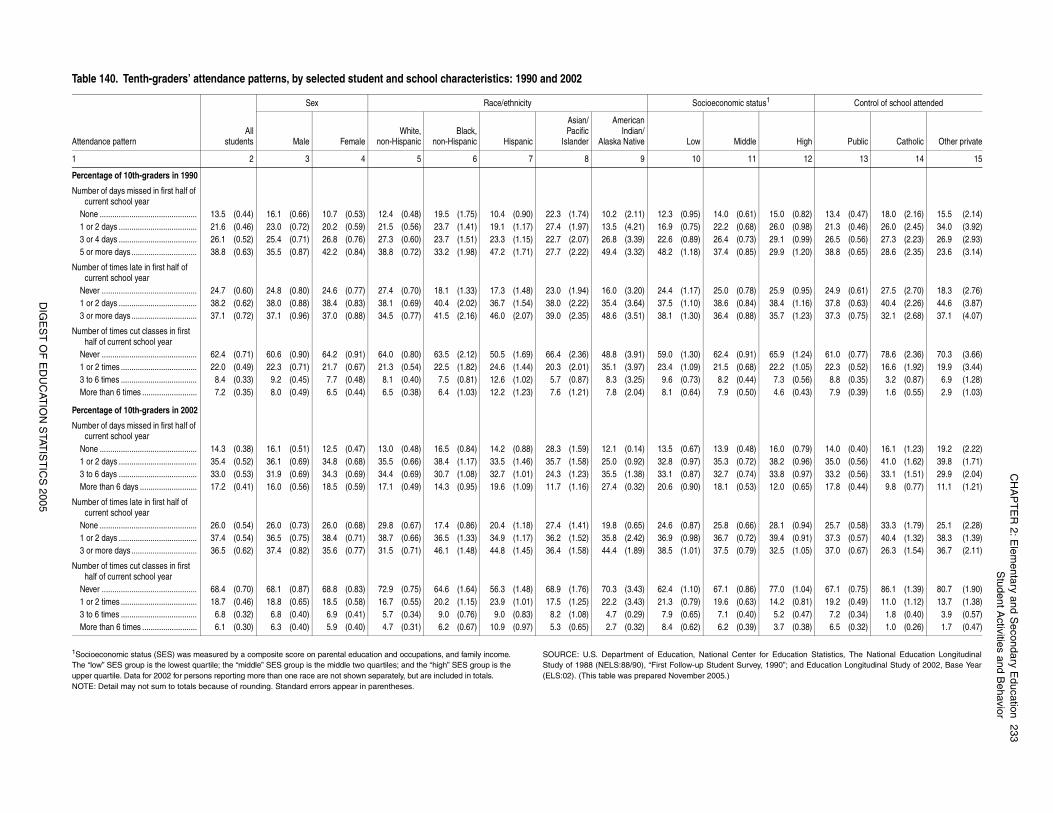
CH
AP
TE
R 2: E
lementary and S
econdary Education
233S
tudent Activities and B
ehavior
DIG
ES
T O
F E
DU
CAT
ION
STAT
IST
ICS
2005
for Education Statistics, The National Education Longitudinaly, 1990”; and Education Longitudinal Study of 2002, Base Year
tus1 Control of school attended
High Public Catholic Other private
12 13 14 15
15.0 (0.82) 13.4 (0.47) 18.0 (2.16) 15.5 (2.14)26.0 (0.98) 21.3 (0.46) 26.0 (2.45) 34.0 (3.92)29.1 (0.99) 26.5 (0.56) 27.3 (2.23) 26.9 (2.93)29.9 (1.20) 38.8 (0.65) 28.6 (2.35) 23.6 (3.14)
25.9 (0.95) 24.9 (0.61) 27.5 (2.70) 18.3 (2.76)38.4 (1.16) 37.8 (0.63) 40.4 (2.26) 44.6 (3.87)35.7 (1.23) 37.3 (0.75) 32.1 (2.68) 37.1 (4.07)
65.9 (1.24) 61.0 (0.77) 78.6 (2.36) 70.3 (3.66)22.2 (1.05) 22.3 (0.52) 16.6 (1.92) 19.9 (3.44)
7.3 (0.56) 8.8 (0.35) 3.2 (0.87) 6.9 (1.28)4.6 (0.43) 7.9 (0.39) 1.6 (0.55) 2.9 (1.03)
16.0 (0.79) 14.0 (0.40) 16.1 (1.23) 19.2 (2.22)38.2 (0.96) 35.0 (0.56) 41.0 (1.62) 39.8 (1.71)33.8 (0.97) 33.2 (0.56) 33.1 (1.51) 29.9 (2.04)12.0 (0.65) 17.8 (0.44) 9.8 (0.77) 11.1 (1.21)
28.1 (0.94) 25.7 (0.58) 33.3 (1.79) 25.1 (2.28)39.4 (0.91) 37.3 (0.57) 40.4 (1.32) 38.3 (1.39)32.5 (1.05) 37.0 (0.67) 26.3 (1.54) 36.7 (2.11)
77.0 (1.04) 67.1 (0.75) 86.1 (1.39) 80.7 (1.90)14.2 (0.81) 19.2 (0.49) 11.0 (1.12) 13.7 (1.38)
5.2 (0.47) 7.2 (0.34) 1.8 (0.40) 3.9 (0.57)3.7 (0.38) 6.5 (0.32) 1.0 (0.26) 1.7 (0.47)
1Socioeconomic status (SES) was measured by a composite score on parental education and occupations, and family income.The “low” SES group is the lowest quartile; the “middle” SES group is the middle two quartiles; and the “high” SES group is theupper quartile. Data for 2002 for persons reporting more than one race are not shown separately, but are included in totals.NOTE: Detail may not sum to totals because of rounding. Standard errors appear in parentheses.
SOURCE: U.S. Department of Education, National CenterStudy of 1988 (NELS:88/90), “First Follow-up Student Surve(ELS:02). (This table was prepared November 2005.)
Table 140. Tenth-graders’ attendance patterns, by selected student and school characteristics: 1990 and 2002
Attendance patternAll
students
Sex Race/ethnicity Socioeconomic sta
Male FemaleWhite,
non-HispanicBlack,
non-Hispanic Hispanic
Asian/Pacific
Islander
AmericanIndian/
Alaska Native Low Middle
1 2 3 4 5 6 7 8 9 10 11
Percentage of 10th-graders in 1990
Number of days missed in first half of current school year
None .............................................. 13.5 (0.44) 16.1 (0.66) 10.7 (0.53) 12.4 (0.48) 19.5 (1.75) 10.4 (0.90) 22.3 (1.74) 10.2 (2.11) 12.3 (0.95) 14.0 (0.61)1 or 2 days ..................................... 21.6 (0.46) 23.0 (0.72) 20.2 (0.59) 21.5 (0.56) 23.7 (1.41) 19.1 (1.17) 27.4 (1.97) 13.5 (4.21) 16.9 (0.75) 22.2 (0.68)3 or 4 days ..................................... 26.1 (0.52) 25.4 (0.71) 26.8 (0.76) 27.3 (0.60) 23.7 (1.51) 23.3 (1.15) 22.7 (2.07) 26.8 (3.39) 22.6 (0.89) 26.4 (0.73)5 or more days ............................... 38.8 (0.63) 35.5 (0.87) 42.2 (0.84) 38.8 (0.72) 33.2 (1.98) 47.2 (1.71) 27.7 (2.22) 49.4 (3.32) 48.2 (1.18) 37.4 (0.85)
Number of times late in first half of current school year
Never ............................................. 24.7 (0.60) 24.8 (0.80) 24.6 (0.77) 27.4 (0.70) 18.1 (1.33) 17.3 (1.48) 23.0 (1.94) 16.0 (3.20) 24.4 (1.17) 25.0 (0.78)1 or 2 days ..................................... 38.2 (0.62) 38.0 (0.88) 38.4 (0.83) 38.1 (0.69) 40.4 (2.02) 36.7 (1.54) 38.0 (2.22) 35.4 (3.64) 37.5 (1.10) 38.6 (0.84)3 or more days ............................... 37.1 (0.72) 37.1 (0.96) 37.0 (0.88) 34.5 (0.77) 41.5 (2.16) 46.0 (2.07) 39.0 (2.35) 48.6 (3.51) 38.1 (1.30) 36.4 (0.88)
Number of times cut classes in first half of current school year
Never ............................................. 62.4 (0.71) 60.6 (0.90) 64.2 (0.91) 64.0 (0.80) 63.5 (2.12) 50.5 (1.69) 66.4 (2.36) 48.8 (3.91) 59.0 (1.30) 62.4 (0.91)1 or 2 times .................................... 22.0 (0.49) 22.3 (0.71) 21.7 (0.67) 21.3 (0.54) 22.5 (1.82) 24.6 (1.44) 20.3 (2.01) 35.1 (3.97) 23.4 (1.09) 21.5 (0.68)3 to 6 times .................................... 8.4 (0.33) 9.2 (0.45) 7.7 (0.48) 8.1 (0.40) 7.5 (0.81) 12.6 (1.02) 5.7 (0.87) 8.3 (3.25) 9.6 (0.73) 8.2 (0.44)More than 6 times .......................... 7.2 (0.35) 8.0 (0.49) 6.5 (0.44) 6.5 (0.38) 6.4 (1.03) 12.2 (1.23) 7.6 (1.21) 7.8 (2.04) 8.1 (0.64) 7.9 (0.50)
Percentage of 10th-graders in 2002
Number of days missed in first half of current school year
None .............................................. 14.3 (0.38) 16.1 (0.51) 12.5 (0.47) 13.0 (0.48) 16.5 (0.84) 14.2 (0.88) 28.3 (1.59) 12.1 (0.14) 13.5 (0.67) 13.9 (0.48)1 or 2 days ..................................... 35.4 (0.52) 36.1 (0.69) 34.8 (0.68) 35.5 (0.66) 38.4 (1.17) 33.5 (1.46) 35.7 (1.58) 25.0 (0.92) 32.8 (0.97) 35.3 (0.72)3 to 6 days ..................................... 33.0 (0.53) 31.9 (0.69) 34.3 (0.69) 34.4 (0.69) 30.7 (1.08) 32.7 (1.01) 24.3 (1.23) 35.5 (1.38) 33.1 (0.87) 32.7 (0.74)More than 6 days ........................... 17.2 (0.41) 16.0 (0.56) 18.5 (0.59) 17.1 (0.49) 14.3 (0.95) 19.6 (1.09) 11.7 (1.16) 27.4 (0.32) 20.6 (0.90) 18.1 (0.53)
Number of times late in first half of current school year
None .............................................. 26.0 (0.54) 26.0 (0.73) 26.0 (0.68) 29.8 (0.67) 17.4 (0.86) 20.4 (1.18) 27.4 (1.41) 19.8 (0.65) 24.6 (0.87) 25.8 (0.66)1 or 2 days ..................................... 37.4 (0.54) 36.5 (0.75) 38.4 (0.71) 38.7 (0.66) 36.5 (1.33) 34.9 (1.17) 36.2 (1.52) 35.8 (2.42) 36.9 (0.98) 36.7 (0.72)3 or more days ............................... 36.5 (0.62) 37.4 (0.82) 35.6 (0.77) 31.5 (0.71) 46.1 (1.48) 44.8 (1.45) 36.4 (1.58) 44.4 (1.89) 38.5 (1.01) 37.5 (0.79)
Number of times cut classes in first half of current school year
Never ............................................. 68.4 (0.70) 68.1 (0.87) 68.8 (0.83) 72.9 (0.75) 64.6 (1.64) 56.3 (1.48) 68.9 (1.76) 70.3 (3.43) 62.4 (1.10) 67.1 (0.86)1 or 2 times .................................... 18.7 (0.46) 18.8 (0.65) 18.5 (0.58) 16.7 (0.55) 20.2 (1.15) 23.9 (1.01) 17.5 (1.25) 22.2 (3.43) 21.3 (0.79) 19.6 (0.63)3 to 6 times .................................... 6.8 (0.32) 6.8 (0.40) 6.9 (0.41) 5.7 (0.34) 9.0 (0.76) 9.0 (0.83) 8.2 (1.08) 4.7 (0.29) 7.9 (0.65) 7.1 (0.40)More than 6 times .......................... 6.1 (0.30) 6.3 (0.40) 5.9 (0.40) 4.7 (0.31) 6.2 (0.67) 10.9 (0.97) 5.3 (0.65) 2.7 (0.32) 8.4 (0.62) 6.2 (0.39)
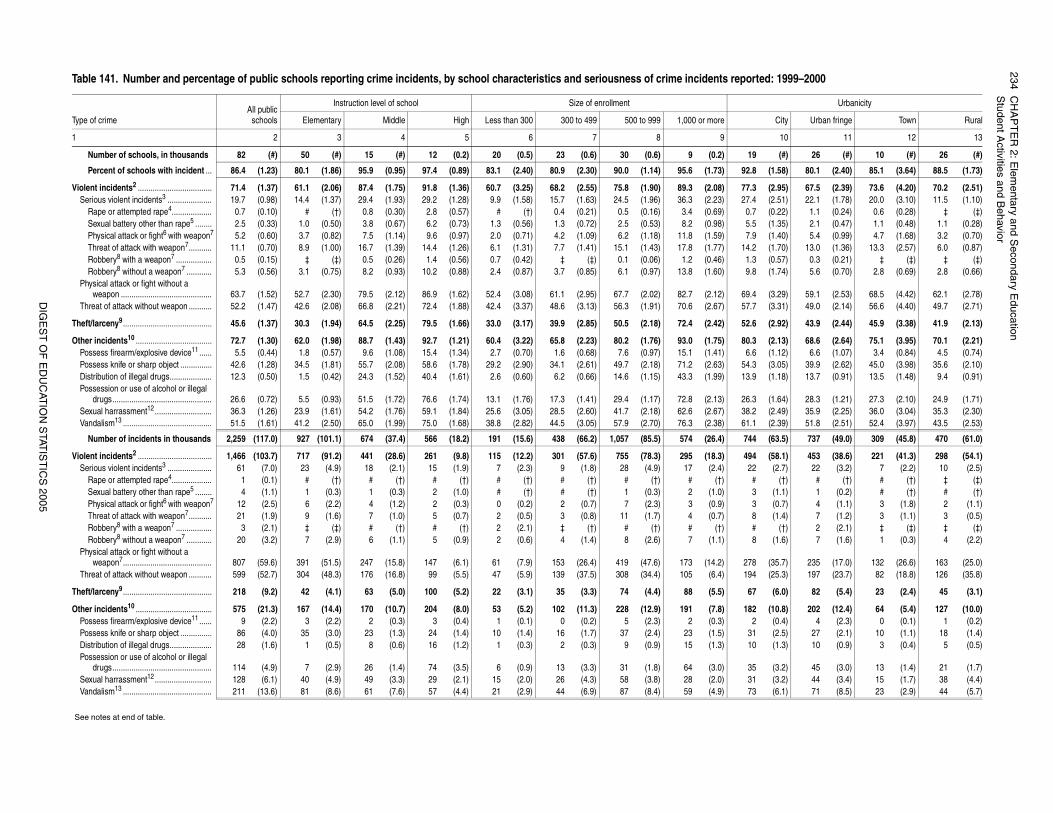
234C
HA
PT
ER
2: Elem
entary and Secondary E
ducationS
tudent Activities and B
ehavior
DIG
ES
T O
F E
DU
CAT
ION
STAT
IST
ICS
2005
ted: 1999–2000
Urbanicity
City Urban fringe Town Rural
10 11 12 13
(#) 26 (#) 10 (#) 26 (#)
(1.58) 80.1 (2.40) 85.1 (3.64) 88.5 (1.73)
(2.95) 67.5 (2.39) 73.6 (4.20) 70.2 (2.51)(2.51) 22.1 (1.78) 20.0 (3.10) 11.5 (1.10)(0.22) 1.1 (0.24) 0.6 (0.28) ‡ (‡)(1.35) 2.1 (0.47) 1.1 (0.48) 1.1 (0.28)(1.40) 5.4 (0.99) 4.7 (1.68) 3.2 (0.70)(1.70) 13.0 (1.36) 13.3 (2.57) 6.0 (0.87)(0.57) 0.3 (0.21) ‡ (‡) ‡ (‡)(1.74) 5.6 (0.70) 2.8 (0.69) 2.8 (0.66)
(3.29) 59.1 (2.53) 68.5 (4.42) 62.1 (2.78)(3.31) 49.0 (2.14) 56.6 (4.40) 49.7 (2.71)
(2.92) 43.9 (2.44) 45.9 (3.38) 41.9 (2.13)
(2.13) 68.6 (2.64) 75.1 (3.95) 70.1 (2.21)(1.12) 6.6 (1.07) 3.4 (0.84) 4.5 (0.74)(3.05) 39.9 (2.62) 45.0 (3.98) 35.6 (2.10)(1.18) 13.7 (0.91) 13.5 (1.48) 9.4 (0.91)
(1.64) 28.3 (1.21) 27.3 (2.10) 24.9 (1.71)(2.49) 35.9 (2.25) 36.0 (3.04) 35.3 (2.30)(2.39) 51.8 (2.51) 52.4 (3.97) 43.5 (2.53)
(63.5) 737 (49.0) 309 (45.8) 470 (61.0)
(58.1) 453 (38.6) 221 (41.3) 298 (54.1)(2.7) 22 (3.2) 7 (2.2) 10 (2.5)
(†) # (†) # (†) ‡ (‡)(1.1) 1 (0.2) # (†) # (†)(0.7) 4 (1.1) 3 (1.8) 2 (1.1)(1.4) 7 (1.2) 3 (1.1) 3 (0.5)
(†) 2 (2.1) ‡ (‡) ‡ (‡)(1.6) 7 (1.6) 1 (0.3) 4 (2.2)
(35.7) 235 (17.0) 132 (26.6) 163 (25.0)(25.3) 197 (23.7) 82 (18.8) 126 (35.8)
(6.0) 82 (5.4) 23 (2.4) 45 (3.1)
(10.8) 202 (12.4) 64 (5.4) 127 (10.0)(0.4) 4 (2.3) 0 (0.1) 1 (0.2)(2.5) 27 (2.1) 10 (1.1) 18 (1.4)(1.3) 10 (0.9) 3 (0.4) 5 (0.5)
(3.2) 45 (3.0) 13 (1.4) 21 (1.7)(3.2) 44 (3.4) 15 (1.7) 38 (4.4)(6.1) 71 (8.5) 23 (2.9) 44 (5.7)
_
Table 141. Number and percentage of public schools reporting crime incidents, by school characteristics and seriousness of crime incidents repor
Type of crimeAll public
schools
Instruction level of school Size of enrollment
Elementary Middle High Less than 300 300 to 499 500 to 999 1,000 or more
1 2 3 4 5 6 7 8 9
Number of schools, in thousands 82 (#) 50 (#) 15 (#) 12 (0.2) 20 (0.5) 23 (0.6) 30 (0.6) 9 (0.2) 19
Percent of schools with incident ... 86.4 (1.23) 80.1 (1.86) 95.9 (0.95) 97.4 (0.89) 83.1 (2.40) 80.9 (2.30) 90.0 (1.14) 95.6 (1.73) 92.8
Violent incidents2 ................................... 71.4 (1.37) 61.1 (2.06) 87.4 (1.75) 91.8 (1.36) 60.7 (3.25) 68.2 (2.55) 75.8 (1.90) 89.3 (2.08) 77.3Serious violent incidents3 ..................... 19.7 (0.98) 14.4 (1.37) 29.4 (1.93) 29.2 (1.28) 9.9 (1.58) 15.7 (1.63) 24.5 (1.96) 36.3 (2.23) 27.4
Rape or attempted rape4................... 0.7 (0.10) # (†) 0.8 (0.30) 2.8 (0.57) # (†) 0.4 (0.21) 0.5 (0.16) 3.4 (0.69) 0.7Sexual battery other than rape5 ........ 2.5 (0.33) 1.0 (0.50) 3.8 (0.67) 6.2 (0.73) 1.3 (0.56) 1.3 (0.72) 2.5 (0.53) 8.2 (0.98) 5.5Physical attack or fight6 with weapon7 5.2 (0.60) 3.7 (0.82) 7.5 (1.14) 9.6 (0.97) 2.0 (0.71) 4.2 (1.09) 6.2 (1.18) 11.8 (1.59) 7.9Threat of attack with weapon7........... 11.1 (0.70) 8.9 (1.00) 16.7 (1.39) 14.4 (1.26) 6.1 (1.31) 7.7 (1.41) 15.1 (1.43) 17.8 (1.77) 14.2Robbery8 with a weapon7 ................. 0.5 (0.15) ‡ (‡) 0.5 (0.26) 1.4 (0.56) 0.7 (0.42) ‡ (‡) 0.1 (0.06) 1.2 (0.46) 1.3Robbery8 without a weapon7 ............ 5.3 (0.56) 3.1 (0.75) 8.2 (0.93) 10.2 (0.88) 2.4 (0.87) 3.7 (0.85) 6.1 (0.97) 13.8 (1.60) 9.8
Physical attack or fight without a weapon ........................................... 63.7 (1.52) 52.7 (2.30) 79.5 (2.12) 86.9 (1.62) 52.4 (3.08) 61.1 (2.95) 67.7 (2.02) 82.7 (2.12) 69.4
Threat of attack without weapon ........... 52.2 (1.47) 42.6 (2.08) 66.8 (2.21) 72.4 (1.88) 42.4 (3.37) 48.6 (3.13) 56.3 (1.91) 70.6 (2.67) 57.7
Theft/larceny9 .......................................... 45.6 (1.37) 30.3 (1.94) 64.5 (2.25) 79.5 (1.66) 33.0 (3.17) 39.9 (2.85) 50.5 (2.18) 72.4 (2.42) 52.6
Other incidents10 .................................... 72.7 (1.30) 62.0 (1.98) 88.7 (1.43) 92.7 (1.21) 60.4 (3.22) 65.8 (2.23) 80.2 (1.76) 93.0 (1.75) 80.3Possess firearm/explosive device11 ...... 5.5 (0.44) 1.8 (0.57) 9.6 (1.08) 15.4 (1.34) 2.7 (0.70) 1.6 (0.68) 7.6 (0.97) 15.1 (1.41) 6.6Possess knife or sharp object ............... 42.6 (1.28) 34.5 (1.81) 55.7 (2.08) 58.6 (1.78) 29.2 (2.90) 34.1 (2.61) 49.7 (2.18) 71.2 (2.63) 54.3Distribution of illegal drugs.................... 12.3 (0.50) 1.5 (0.42) 24.3 (1.52) 40.4 (1.61) 2.6 (0.60) 6.2 (0.66) 14.6 (1.15) 43.3 (1.99) 13.9Possession or use of alcohol or illegal
drugs............................................... 26.6 (0.72) 5.5 (0.93) 51.5 (1.72) 76.6 (1.74) 13.1 (1.76) 17.3 (1.41) 29.4 (1.17) 72.8 (2.13) 26.3Sexual harrassment12........................... 36.3 (1.26) 23.9 (1.61) 54.2 (1.76) 59.1 (1.84) 25.6 (3.05) 28.5 (2.60) 41.7 (2.18) 62.6 (2.67) 38.2Vandalism13 .......................................... 51.5 (1.61) 41.2 (2.50) 65.0 (1.99) 75.0 (1.68) 38.8 (2.82) 44.5 (3.05) 57.9 (2.70) 76.3 (2.38) 61.1
Number of incidents in thousands 2,259 (117.0) 927 (101.1) 674 (37.4) 566 (18.2) 191 (15.6) 438 (66.2) 1,057 (85.5) 574 (26.4) 744
Violent incidents2 ................................... 1,466 (103.7) 717 (91.2) 441 (28.6) 261 (9.8) 115 (12.2) 301 (57.6) 755 (78.3) 295 (18.3) 494Serious violent incidents3 ..................... 61 (7.0) 23 (4.9) 18 (2.1) 15 (1.9) 7 (2.3) 9 (1.8) 28 (4.9) 17 (2.4) 22
Rape or attempted rape4................... 1 (0.1) # (†) # (†) # (†) # (†) # (†) # (†) # (†) #Sexual battery other than rape5 ........ 4 (1.1) 1 (0.3) 1 (0.3) 2 (1.0) # (†) # (†) 1 (0.3) 2 (1.0) 3Physical attack or fight6 with weapon7 12 (2.5) 6 (2.2) 4 (1.2) 2 (0.3) 0 (0.2) 2 (0.7) 7 (2.3) 3 (0.9) 3Threat of attack with weapon7........... 21 (1.9) 9 (1.6) 7 (1.0) 5 (0.7) 2 (0.5) 3 (0.8) 11 (1.7) 4 (0.7) 8Robbery8 with a weapon7 ................. 3 (2.1) ‡ (‡) # (†) # (†) 2 (2.1) ‡ (†) # (†) # (†) #Robbery8 without a weapon7 ............ 20 (3.2) 7 (2.9) 6 (1.1) 5 (0.9) 2 (0.6) 4 (1.4) 8 (2.6) 7 (1.1) 8
Physical attack or fight without a weapon7.......................................... 807 (59.6) 391 (51.5) 247 (15.8) 147 (6.1) 61 (7.9) 153 (26.4) 419 (47.6) 173 (14.2) 278
Threat of attack without weapon ........... 599 (52.7) 304 (48.3) 176 (16.8) 99 (5.5) 47 (5.9) 139 (37.5) 308 (34.4) 105 (6.4) 194
Theft/larceny9 .......................................... 218 (9.2) 42 (4.1) 63 (5.0) 100 (5.2) 22 (3.1) 35 (3.3) 74 (4.4) 88 (5.5) 67
Other incidents10 .................................... 575 (21.3) 167 (14.4) 170 (10.7) 204 (8.0) 53 (5.2) 102 (11.3) 228 (12.9) 191 (7.8) 182Possess firearm/explosive device11 ...... 9 (2.2) 3 (2.2) 2 (0.3) 3 (0.4) 1 (0.1) 0 (0.2) 5 (2.3) 2 (0.3) 2Possess knife or sharp object ............... 86 (4.0) 35 (3.0) 23 (1.3) 24 (1.4) 10 (1.4) 16 (1.7) 37 (2.4) 23 (1.5) 31Distribution of illegal drugs.................... 28 (1.6) 1 (0.5) 8 (0.6) 16 (1.2) 1 (0.3) 2 (0.3) 9 (0.9) 15 (1.3) 10Possession or use of alcohol or illegal
drugs............................................... 114 (4.9) 7 (2.9) 26 (1.4) 74 (3.5) 6 (0.9) 13 (3.3) 31 (1.8) 64 (3.0) 35Sexual harrassment12........................... 128 (6.1) 40 (4.9) 49 (3.3) 29 (2.1) 15 (2.0) 26 (4.3) 58 (3.8) 28 (2.0) 31Vandalism13 .......................................... 211 (13.6) 81 (8.6) 61 (7.6) 57 (4.4) 21 (2.9) 44 (6.9) 87 (8.4) 59 (4.9) 73
See notes at end of table.
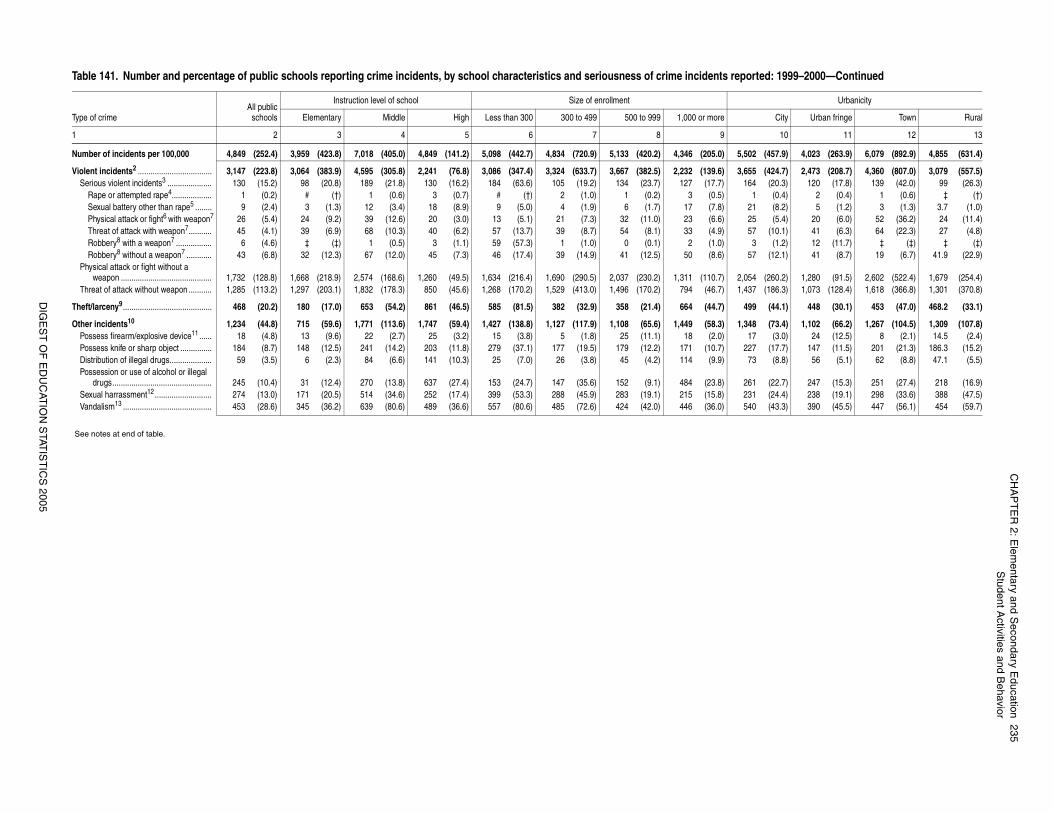
CH
AP
TE
R 2: E
lementary and S
econdary Education
235S
tudent Activities and B
ehavior
DIG
ES
T O
F E
DU
CAT
ION
STAT
IST
ICS
2005
(457.9) 4,023 (263.9) 6,079 (892.9) 4,855 (631.4)
(424.7) 2,473 (208.7) 4,360 (807.0) 3,079 (557.5)(20.3) 120 (17.8) 139 (42.0) 99 (26.3)(0.4) 2 (0.4) 1 (0.6) ‡ (†)(8.2) 5 (1.2) 3 (1.3) 3.7 (1.0)(5.4) 20 (6.0) 52 (36.2) 24 (11.4)
(10.1) 41 (6.3) 64 (22.3) 27 (4.8)(1.2) 12 (11.7) ‡ (‡) ‡ (‡)
(12.1) 41 (8.7) 19 (6.7) 41.9 (22.9)
(260.2) 1,280 (91.5) 2,602 (522.4) 1,679 (254.4)(186.3) 1,073 (128.4) 1,618 (366.8) 1,301 (370.8)
(44.1) 448 (30.1) 453 (47.0) 468.2 (33.1)
(73.4) 1,102 (66.2) 1,267 (104.5) 1,309 (107.8)(3.0) 24 (12.5) 8 (2.1) 14.5 (2.4)
(17.7) 147 (11.5) 201 (21.3) 186.3 (15.2)(8.8) 56 (5.1) 62 (8.8) 47.1 (5.5)
(22.7) 247 (15.3) 251 (27.4) 218 (16.9)(24.4) 238 (19.1) 298 (33.6) 388 (47.5)(43.3) 390 (45.5) 447 (56.1) 454 (59.7)
ted: 1999–2000—Continued
Urbanicity
City Urban fringe Town Rural
10 11 12 13
Number of incidents per 100,000 4,849 (252.4) 3,959 (423.8) 7,018 (405.0) 4,849 (141.2) 5,098 (442.7) 4,834 (720.9) 5,133 (420.2) 4,346 (205.0) 5,502
Violent incidents2 ................................... 3,147 (223.8) 3,064 (383.9) 4,595 (305.8) 2,241 (76.8) 3,086 (347.4) 3,324 (633.7) 3,667 (382.5) 2,232 (139.6) 3,655Serious violent incidents3 ..................... 130 (15.2) 98 (20.8) 189 (21.8) 130 (16.2) 184 (63.6) 105 (19.2) 134 (23.7) 127 (17.7) 164
Rape or attempted rape4................... 1 (0.2) # (†) 1 (0.6) 3 (0.7) # (†) 2 (1.0) 1 (0.2) 3 (0.5) 1Sexual battery other than rape5 ........ 9 (2.4) 3 (1.3) 12 (3.4) 18 (8.9) 9 (5.0) 4 (1.9) 6 (1.7) 17 (7.8) 21Physical attack or fight6 with weapon7 26 (5.4) 24 (9.2) 39 (12.6) 20 (3.0) 13 (5.1) 21 (7.3) 32 (11.0) 23 (6.6) 25Threat of attack with weapon7........... 45 (4.1) 39 (6.9) 68 (10.3) 40 (6.2) 57 (13.7) 39 (8.7) 54 (8.1) 33 (4.9) 57Robbery8 with a weapon7 ................. 6 (4.6) ‡ (‡) 1 (0.5) 3 (1.1) 59 (57.3) 1 (1.0) 0 (0.1) 2 (1.0) 3Robbery8 without a weapon7 ............ 43 (6.8) 32 (12.3) 67 (12.0) 45 (7.3) 46 (17.4) 39 (14.9) 41 (12.5) 50 (8.6) 57
Physical attack or fight without a weapon ........................................... 1,732 (128.8) 1,668 (218.9) 2,574 (168.6) 1,260 (49.5) 1,634 (216.4) 1,690 (290.5) 2,037 (230.2) 1,311 (110.7) 2,054
Threat of attack without weapon ........... 1,285 (113.2) 1,297 (203.1) 1,832 (178.3) 850 (45.6) 1,268 (170.2) 1,529 (413.0) 1,496 (170.2) 794 (46.7) 1,437
Theft/larceny9 .......................................... 468 (20.2) 180 (17.0) 653 (54.2) 861 (46.5) 585 (81.5) 382 (32.9) 358 (21.4) 664 (44.7) 499
Other incidents10 1,234 (44.8) 715 (59.6) 1,771 (113.6) 1,747 (59.4) 1,427 (138.8) 1,127 (117.9) 1,108 (65.6) 1,449 (58.3) 1,348Possess firearm/explosive device11 ...... 18 (4.8) 13 (9.6) 22 (2.7) 25 (3.2) 15 (3.8) 5 (1.8) 25 (11.1) 18 (2.0) 17Possess knife or sharp object ............... 184 (8.7) 148 (12.5) 241 (14.2) 203 (11.8) 279 (37.1) 177 (19.5) 179 (12.2) 171 (10.7) 227Distribution of illegal drugs.................... 59 (3.5) 6 (2.3) 84 (6.6) 141 (10.3) 25 (7.0) 26 (3.8) 45 (4.2) 114 (9.9) 73Possession or use of alcohol or illegal
drugs............................................... 245 (10.4) 31 (12.4) 270 (13.8) 637 (27.4) 153 (24.7) 147 (35.6) 152 (9.1) 484 (23.8) 261Sexual harrassment12........................... 274 (13.0) 171 (20.5) 514 (34.6) 252 (17.4) 399 (53.3) 288 (45.9) 283 (19.1) 215 (15.8) 231Vandalism13 .......................................... 453 (28.6) 345 (36.2) 639 (80.6) 489 (36.6) 557 (80.6) 485 (72.6) 424 (42.0) 446 (36.0) 540
See notes at end of table.
Table 141. Number and percentage of public schools reporting crime incidents, by school characteristics and seriousness of crime incidents repor
Type of crimeAll public
schools
Instruction level of school Size of enrollment
Elementary Middle High Less than 300 300 to 499 500 to 999 1,000 or more
1 2 3 4 5 6 7 8 9
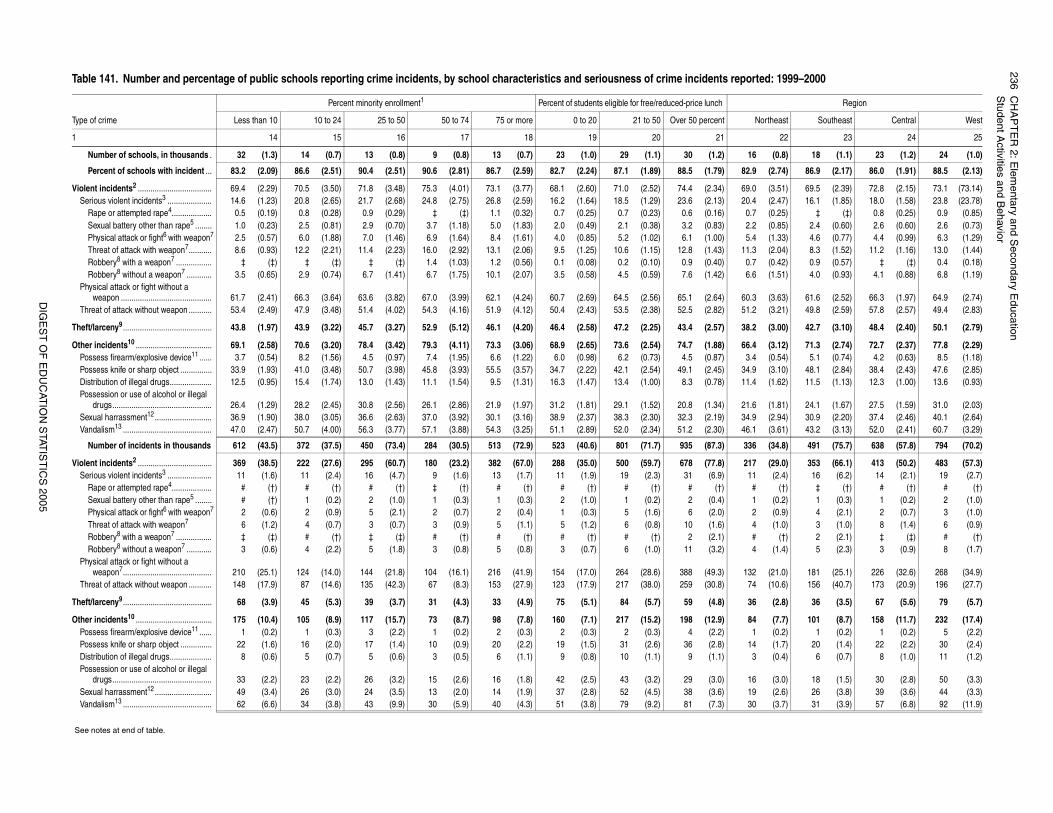
236C
HA
PT
ER
2: Elem
entary and Secondary E
ducationS
tudent Activities and B
ehavior
DIG
ES
T O
F E
DU
CAT
ION
STAT
IST
ICS
2005
ted: 1999–2000
Region
Northeast Southeast Central West
22 23 24 25
(0.8) 18 (1.1) 23 (1.2) 24 (1.0)
(2.74) 86.9 (2.17) 86.0 (1.91) 88.5 (2.13)
(3.51) 69.5 (2.39) 72.8 (2.15) 73.1 (73.14)(2.47) 16.1 (1.85) 18.0 (1.58) 23.8 (23.78)(0.25) ‡ (‡) 0.8 (0.25) 0.9 (0.85)(0.85) 2.4 (0.60) 2.6 (0.60) 2.6 (0.73)(1.33) 4.6 (0.77) 4.4 (0.99) 6.3 (1.29)(2.04) 8.3 (1.52) 11.2 (1.16) 13.0 (1.44)(0.42) 0.9 (0.57) ‡ (‡) 0.4 (0.18)(1.51) 4.0 (0.93) 4.1 (0.88) 6.8 (1.19)
(3.63) 61.6 (2.52) 66.3 (1.97) 64.9 (2.74)(3.21) 49.8 (2.59) 57.8 (2.57) 49.4 (2.83)
(3.00) 42.7 (3.10) 48.4 (2.40) 50.1 (2.79)
(3.12) 71.3 (2.74) 72.7 (2.37) 77.8 (2.29)(0.54) 5.1 (0.74) 4.2 (0.63) 8.5 (1.18)(3.10) 48.1 (2.84) 38.4 (2.43) 47.6 (2.85)(1.62) 11.5 (1.13) 12.3 (1.00) 13.6 (0.93)
(1.81) 24.1 (1.67) 27.5 (1.59) 31.0 (2.03)(2.94) 30.9 (2.20) 37.4 (2.46) 40.1 (2.64)(3.61) 43.2 (3.13) 52.0 (2.41) 60.7 (3.29)
(34.8) 491 (75.7) 638 (57.8) 794 (70.2)
(29.0) 353 (66.1) 413 (50.2) 483 (57.3)(2.4) 16 (6.2) 14 (2.1) 19 (2.7)
(†) ‡ (†) # (†) # (†)(0.2) 1 (0.3) 1 (0.2) 2 (1.0)(0.9) 4 (2.1) 2 (0.7) 3 (1.0)(1.0) 3 (1.0) 8 (1.4) 6 (0.9)
(†) 2 (2.1) ‡ (‡) # (†)(1.4) 5 (2.3) 3 (0.9) 8 (1.7)
(21.0) 181 (25.1) 226 (32.6) 268 (34.9)(10.6) 156 (40.7) 173 (20.9) 196 (27.7)
(2.8) 36 (3.5) 67 (5.6) 79 (5.7)
(7.7) 101 (8.7) 158 (11.7) 232 (17.4)(0.2) 1 (0.2) 1 (0.2) 5 (2.2)(1.7) 20 (1.4) 22 (2.2) 30 (2.4)(0.4) 6 (0.7) 8 (1.0) 11 (1.2)
(3.0) 18 (1.5) 30 (2.8) 50 (3.3)(2.6) 26 (3.8) 39 (3.6) 44 (3.3)(3.7) 31 (3.9) 57 (6.8) 92 (11.9)
_
Table 141. Number and percentage of public schools reporting crime incidents, by school characteristics and seriousness of crime incidents repor
Type of crime
Percent minority enrollment1 Percent of students eligible for free/reduced-price lunch
Less than 10 10 to 24 25 to 50 50 to 74 75 or more 0 to 20 21 to 50 Over 50 percent
1 14 15 16 17 18 19 20 21
Number of schools, in thousands . 32 (1.3) 14 (0.7) 13 (0.8) 9 (0.8) 13 (0.7) 23 (1.0) 29 (1.1) 30 (1.2) 16
Percent of schools with incident ... 83.2 (2.09) 86.6 (2.51) 90.4 (2.51) 90.6 (2.81) 86.7 (2.59) 82.7 (2.24) 87.1 (1.89) 88.5 (1.79) 82.9
Violent incidents2 ................................... 69.4 (2.29) 70.5 (3.50) 71.8 (3.48) 75.3 (4.01) 73.1 (3.77) 68.1 (2.60) 71.0 (2.52) 74.4 (2.34) 69.0Serious violent incidents3 ..................... 14.6 (1.23) 20.8 (2.65) 21.7 (2.68) 24.8 (2.75) 26.8 (2.59) 16.2 (1.64) 18.5 (1.29) 23.6 (2.13) 20.4
Rape or attempted rape4................... 0.5 (0.19) 0.8 (0.28) 0.9 (0.29) ‡ (‡) 1.1 (0.32) 0.7 (0.25) 0.7 (0.23) 0.6 (0.16) 0.7Sexual battery other than rape5 ........ 1.0 (0.23) 2.5 (0.81) 2.9 (0.70) 3.7 (1.18) 5.0 (1.83) 2.0 (0.49) 2.1 (0.38) 3.2 (0.83) 2.2Physical attack or fight6 with weapon7 2.5 (0.57) 6.0 (1.88) 7.0 (1.46) 6.9 (1.64) 8.4 (1.61) 4.0 (0.85) 5.2 (1.02) 6.1 (1.00) 5.4Threat of attack with weapon7........... 8.6 (0.93) 12.2 (2.21) 11.4 (2.23) 16.0 (2.92) 13.1 (2.06) 9.5 (1.25) 10.6 (1.15) 12.8 (1.43) 11.3Robbery8 with a weapon7 ................. ‡ (‡) ‡ (‡) ‡ (‡) 1.4 (1.03) 1.2 (0.56) 0.1 (0.08) 0.2 (0.10) 0.9 (0.40) 0.7Robbery8 without a weapon7 ............ 3.5 (0.65) 2.9 (0.74) 6.7 (1.41) 6.7 (1.75) 10.1 (2.07) 3.5 (0.58) 4.5 (0.59) 7.6 (1.42) 6.6
Physical attack or fight without a weapon ........................................... 61.7 (2.41) 66.3 (3.64) 63.6 (3.82) 67.0 (3.99) 62.1 (4.24) 60.7 (2.69) 64.5 (2.56) 65.1 (2.64) 60.3
Threat of attack without weapon ........... 53.4 (2.49) 47.9 (3.48) 51.4 (4.02) 54.3 (4.16) 51.9 (4.12) 50.4 (2.43) 53.5 (2.38) 52.5 (2.82) 51.2
Theft/larceny9 .......................................... 43.8 (1.97) 43.9 (3.22) 45.7 (3.27) 52.9 (5.12) 46.1 (4.20) 46.4 (2.58) 47.2 (2.25) 43.4 (2.57) 38.2
Other incidents10 .................................... 69.1 (2.58) 70.6 (3.20) 78.4 (3.42) 79.3 (4.11) 73.3 (3.06) 68.9 (2.65) 73.6 (2.54) 74.7 (1.88) 66.4Possess firearm/explosive device11 ...... 3.7 (0.54) 8.2 (1.56) 4.5 (0.97) 7.4 (1.95) 6.6 (1.22) 6.0 (0.98) 6.2 (0.73) 4.5 (0.87) 3.4Possess knife or sharp object ............... 33.9 (1.93) 41.0 (3.48) 50.7 (3.98) 45.8 (3.93) 55.5 (3.57) 34.7 (2.22) 42.1 (2.54) 49.1 (2.45) 34.9Distribution of illegal drugs.................... 12.5 (0.95) 15.4 (1.74) 13.0 (1.43) 11.1 (1.54) 9.5 (1.31) 16.3 (1.47) 13.4 (1.00) 8.3 (0.78) 11.4Possession or use of alcohol or illegal
drugs............................................... 26.4 (1.29) 28.2 (2.45) 30.8 (2.56) 26.1 (2.86) 21.9 (1.97) 31.2 (1.81) 29.1 (1.52) 20.8 (1.34) 21.6Sexual harrassment12........................... 36.9 (1.90) 38.0 (3.05) 36.6 (2.63) 37.0 (3.92) 30.1 (3.16) 38.9 (2.37) 38.3 (2.30) 32.3 (2.19) 34.9Vandalism13 .......................................... 47.0 (2.47) 50.7 (4.00) 56.3 (3.77) 57.1 (3.88) 54.3 (3.25) 51.1 (2.89) 52.0 (2.34) 51.2 (2.30) 46.1
Number of incidents in thousands 612 (43.5) 372 (37.5) 450 (73.4) 284 (30.5) 513 (72.9) 523 (40.6) 801 (71.7) 935 (87.3) 336
Violent incidents2 ................................... 369 (38.5) 222 (27.6) 295 (60.7) 180 (23.2) 382 (67.0) 288 (35.0) 500 (59.7) 678 (77.8) 217Serious violent incidents3 ..................... 11 (1.6) 11 (2.4) 16 (4.7) 9 (1.6) 13 (1.7) 11 (1.9) 19 (2.3) 31 (6.9) 11
Rape or attempted rape4................... # (†) # (†) # (†) ‡ (†) # (†) # (†) # (†) # (†) #Sexual battery other than rape5 ........ # (†) 1 (0.2) 2 (1.0) 1 (0.3) 1 (0.3) 2 (1.0) 1 (0.2) 2 (0.4) 1Physical attack or fight6 with weapon7 2 (0.6) 2 (0.9) 5 (2.1) 2 (0.7) 2 (0.4) 1 (0.3) 5 (1.6) 6 (2.0) 2Threat of attack with weapon7 6 (1.2) 4 (0.7) 3 (0.7) 3 (0.9) 5 (1.1) 5 (1.2) 6 (0.8) 10 (1.6) 4Robbery8 with a weapon7 ................. ‡ (‡) # (†) ‡ (‡) # (†) # (†) # (†) # (†) 2 (2.1) #Robbery8 without a weapon7 ............ 3 (0.6) 4 (2.2) 5 (1.8) 3 (0.8) 5 (0.8) 3 (0.7) 6 (1.0) 11 (3.2) 4
Physical attack or fight without a weapon7.......................................... 210 (25.1) 124 (14.0) 144 (21.8) 104 (16.1) 216 (41.9) 154 (17.0) 264 (28.6) 388 (49.3) 132
Threat of attack without weapon ........... 148 (17.9) 87 (14.6) 135 (42.3) 67 (8.3) 153 (27.9) 123 (17.9) 217 (38.0) 259 (30.8) 74
Theft/larceny9 .......................................... 68 (3.9) 45 (5.3) 39 (3.7) 31 (4.3) 33 (4.9) 75 (5.1) 84 (5.7) 59 (4.8) 36
Other incidents10 .................................... 175 (10.4) 105 (8.9) 117 (15.7) 73 (8.7) 98 (7.8) 160 (7.1) 217 (15.2) 198 (12.9) 84Possess firearm/explosive device11 ...... 1 (0.2) 1 (0.3) 3 (2.2) 1 (0.2) 2 (0.3) 2 (0.3) 2 (0.3) 4 (2.2) 1Possess knife or sharp object ............... 22 (1.6) 16 (2.0) 17 (1.4) 10 (0.9) 20 (2.2) 19 (1.5) 31 (2.6) 36 (2.8) 14Distribution of illegal drugs.................... 8 (0.6) 5 (0.7) 5 (0.6) 3 (0.5) 6 (1.1) 9 (0.8) 10 (1.1) 9 (1.1) 3Possession or use of alcohol or illegal
drugs............................................... 33 (2.2) 23 (2.2) 26 (3.2) 15 (2.6) 16 (1.8) 42 (2.5) 43 (3.2) 29 (3.0) 16Sexual harrassment12........................... 49 (3.4) 26 (3.0) 24 (3.5) 13 (2.0) 14 (1.9) 37 (2.8) 52 (4.5) 38 (3.6) 19Vandalism13 .......................................... 62 (6.6) 34 (3.8) 43 (9.9) 30 (5.9) 40 (4.3) 51 (3.8) 79 (9.2) 81 (7.3) 30
See notes at end of table.
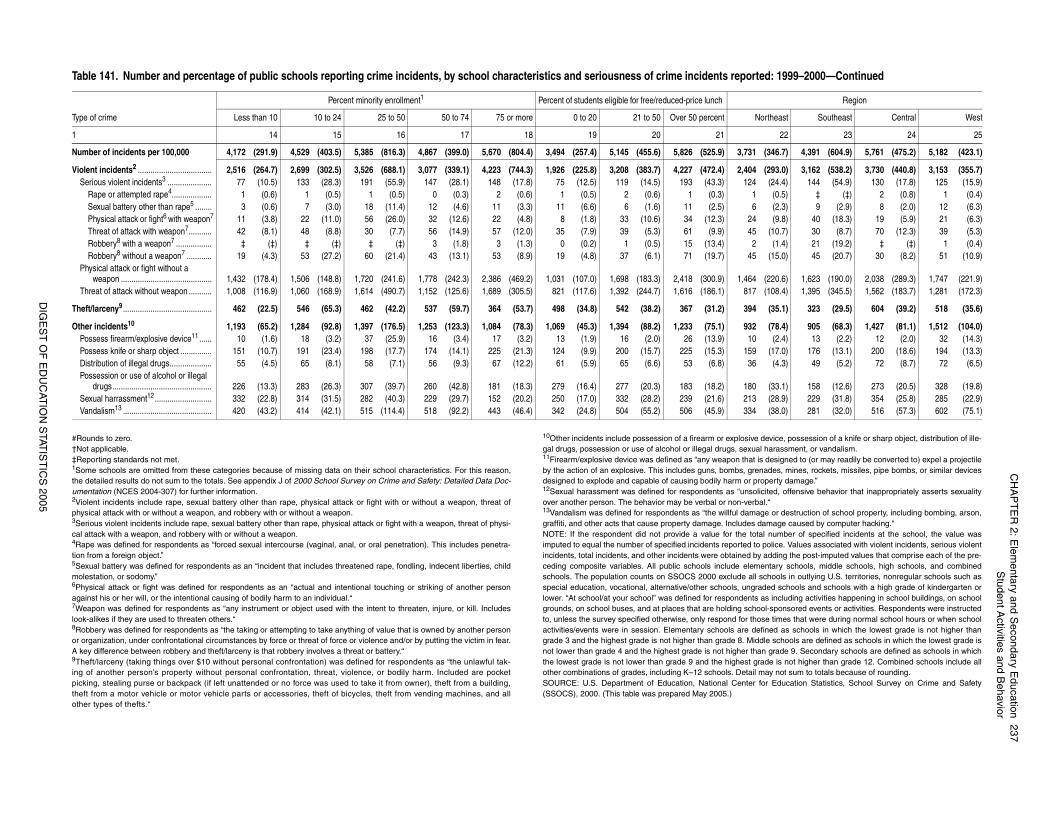
CH
AP
TE
R 2: E
lementary and S
econdary Education
237S
tudent Activities and B
ehavior
DIG
ES
T O
F E
DU
CAT
ION
STAT
IST
ICS
2005
device, possession of a knife or sharp object, distribution of ille-al harassment, or vandalism. is designed to (or may readily be converted to) expel a projectileenades, mines, rockets, missiles, pipe bombs, or similar devicesroperty damage.”licited, offensive behavior that inappropriately asserts sexuality
bal.“age or destruction of school property, including bombing, arson, damage caused by computer hacking.“tal number of specified incidents at the school, the value waso police. Values associated with violent incidents, serious violenty adding the post-imputed values that comprise each of the pre-entary schools, middle schools, high schools, and combined
l schools in outlying U.S. territories, nonregular schools such asraded schools and schools with a high grade of kindergarten ors as including activities happening in school buildings, on schoolool-sponsored events or activities. Respondents were instructedose times that were during normal school hours or when schoolefined as schools in which the lowest grade is not higher thanddle schools are defined as schools in which the lowest grade isan grade 9. Secondary schools are defined as schools in whichrade is not higher than grade 12. Combined schools include all
l may not sum to totals because of rounding. for Education Statistics, School Survey on Crime and Safety
(346.7) 4,391 (604.9) 5,761 (475.2) 5,182 (423.1)
(293.0) 3,162 (538.2) 3,730 (440.8) 3,153 (355.7)(24.4) 144 (54.9) 130 (17.8) 125 (15.9)(0.5) ‡ (‡) 2 (0.8) 1 (0.4)(2.3) 9 (2.9) 8 (2.0) 12 (6.3)(9.8) 40 (18.3) 19 (5.9) 21 (6.3)
(10.7) 30 (8.7) 70 (12.3) 39 (5.3)(1.4) 21 (19.2) ‡ (‡) 1 (0.4)
(15.0) 45 (20.7) 30 (8.2) 51 (10.9)
(220.6) 1,623 (190.0) 2,038 (289.3) 1,747 (221.9)(108.4) 1,395 (345.5) 1,562 (183.7) 1,281 (172.3)
(35.1) 323 (29.5) 604 (39.2) 518 (35.6)
(78.4) 905 (68.3) 1,427 (81.1) 1,512 (104.0)(2.4) 13 (2.2) 12 (2.0) 32 (14.3)
(17.0) 176 (13.1) 200 (18.6) 194 (13.3)(4.3) 49 (5.2) 72 (8.7) 72 (6.5)
(33.1) 158 (12.6) 273 (20.5) 328 (19.8)(28.9) 229 (31.8) 354 (25.8) 285 (22.9)(38.0) 281 (32.0) 516 (57.3) 602 (75.1)
ted: 1999–2000—Continued
Region
Northeast Southeast Central West
22 23 24 25
#Rounds to zero.†Not applicable.‡Reporting standards not met.1Some schools are omitted from these categories because of missing data on their school characteristics. For this reason,the detailed results do not sum to the totals. See appendix J of 2000 School Survey on Crime and Safety: Detailed Data Doc-umentation (NCES 2004-307) for further information.2Violent incidents include rape, sexual battery other than rape, physical attack or fight with or without a weapon, threat ofphysical attack with or without a weapon, and robbery with or without a weapon.3Serious violent incidents include rape, sexual battery other than rape, physical attack or fight with a weapon, threat of physi-cal attack with a weapon, and robbery with or without a weapon.4Rape was defined for respondents as “forced sexual intercourse (vaginal, anal, or oral penetration). This includes penetra-tion from a foreign object.”5Sexual battery was defined for respondents as an “incident that includes threatened rape, fondling, indecent liberties, childmolestation, or sodomy.”6Physical attack or fight was defined for respondents as an “actual and intentional touching or striking of another personagainst his or her will, or the intentional causing of bodily harm to an individual.“7Weapon was defined for respondents as “any instrument or object used with the intent to threaten, injure, or kill. Includeslook-alikes if they are used to threaten others.“8Robbery was defined for respondents as “the taking or attempting to take anything of value that is owned by another personor organization, under confrontational circumstances by force or threat of force or violence and/or by putting the victim in fear.A key difference between robbery and theft/larceny is that robbery involves a threat or battery.“9Theft/larceny (taking things over $10 without personal confrontation) was defined for respondents as “the unlawful tak-ing of another person’s property without personal confrontation, threat, violence, or bodily harm. Included are pocketpicking, stealing purse or backpack (if left unattended or no force was used to take it from owner), theft from a building,theft from a motor vehicle or motor vehicle parts or accessories, theft of bicycles, theft from vending machines, and allother types of thefts.“
10Other incidents include possession of a firearm or explosivegal drugs, possession or use of alcohol or illegal drugs, sexu11Firearm/explosive device was defined as “any weapon thatby the action of an explosive. This includes guns, bombs, grdesigned to explode and capable of causing bodily harm or p12Sexual harassment was defined for respondents as “unsoover another person. The behavior may be verbal or non-ver13Vandalism was defined for respondents as “the willful damgraffiti, and other acts that cause property damage. IncludesNOTE: If the respondent did not provide a value for the toimputed to equal the number of specified incidents reported tincidents, total incidents, and other incidents were obtained bceding composite variables. All public schools include elemschools. The population counts on SSOCS 2000 exclude alspecial education, vocational, alternative/other schools, unglower. “At school/at your school” was defined for respondentgrounds, on school buses, and at places that are holding schto, unless the survey specified otherwise, only respond for thactivities/events were in session. Elementary schools are dgrade 3 and the highest grade is not higher than grade 8. Minot lower than grade 4 and the highest grade is not higher ththe lowest grade is not lower than grade 9 and the highest gother combinations of grades, including K–12 schools. DetaiSOURCE: U.S. Department of Education, National Center(SSOCS), 2000. (This table was prepared May 2005.)
Number of incidents per 100,000 4,172 (291.9) 4,529 (403.5) 5,385 (816.3) 4,867 (399.0) 5,670 (804.4) 3,494 (257.4) 5,145 (455.6) 5,826 (525.9) 3,731
Violent incidents2 ................................... 2,516 (264.7) 2,699 (302.5) 3,526 (688.1) 3,077 (339.1) 4,223 (744.3) 1,926 (225.8) 3,208 (383.7) 4,227 (472.4) 2,404Serious violent incidents3 ..................... 77 (10.5) 133 (28.3) 191 (55.9) 147 (28.1) 148 (17.8) 75 (12.5) 119 (14.5) 193 (43.3) 124
Rape or attempted rape4................... 1 (0.6) 1 (0.5) 1 (0.5) 0 (0.3) 2 (0.6) 1 (0.5) 2 (0.6) 1 (0.3) 1Sexual battery other than rape5 ........ 3 (0.6) 7 (3.0) 18 (11.4) 12 (4.6) 11 (3.3) 11 (6.6) 6 (1.6) 11 (2.5) 6Physical attack or fight6 with weapon7 11 (3.8) 22 (11.0) 56 (26.0) 32 (12.6) 22 (4.8) 8 (1.8) 33 (10.6) 34 (12.3) 24Threat of attack with weapon7........... 42 (8.1) 48 (8.8) 30 (7.7) 56 (14.9) 57 (12.0) 35 (7.9) 39 (5.3) 61 (9.9) 45Robbery8 with a weapon7 ................. ‡ (‡) ‡ (‡) ‡ (‡) 3 (1.8) 3 (1.3) 0 (0.2) 1 (0.5) 15 (13.4) 2Robbery8 without a weapon7 ............ 19 (4.3) 53 (27.2) 60 (21.4) 43 (13.1) 53 (8.9) 19 (4.8) 37 (6.1) 71 (19.7) 45
Physical attack or fight without a weapon ........................................... 1,432 (178.4) 1,506 (148.8) 1,720 (241.6) 1,778 (242.3) 2,386 (469.2) 1,031 (107.0) 1,698 (183.3) 2,418 (300.9) 1,464
Threat of attack without weapon ........... 1,008 (116.9) 1,060 (168.9) 1,614 (490.7) 1,152 (125.6) 1,689 (305.5) 821 (117.6) 1,392 (244.7) 1,616 (186.1) 817
Theft/larceny9 .......................................... 462 (22.5) 546 (65.3) 462 (42.2) 537 (59.7) 364 (53.7) 498 (34.8) 542 (38.2) 367 (31.2) 394
Other incidents10 1,193 (65.2) 1,284 (92.8) 1,397 (176.5) 1,253 (123.3) 1,084 (78.3) 1,069 (45.3) 1,394 (88.2) 1,233 (75.1) 932Possess firearm/explosive device11 ...... 10 (1.6) 18 (3.2) 37 (25.9) 16 (3.4) 17 (3.2) 13 (1.9) 16 (2.0) 26 (13.9) 10Possess knife or sharp object ............... 151 (10.7) 191 (23.4) 198 (17.7) 174 (14.1) 225 (21.3) 124 (9.9) 200 (15.7) 225 (15.3) 159Distribution of illegal drugs.................... 55 (4.5) 65 (8.1) 58 (7.1) 56 (9.3) 67 (12.2) 61 (5.9) 65 (6.6) 53 (6.8) 36Possession or use of alcohol or illegal
drugs............................................... 226 (13.3) 283 (26.3) 307 (39.7) 260 (42.8) 181 (18.3) 279 (16.4) 277 (20.3) 183 (18.2) 180Sexual harrassment12........................... 332 (22.8) 314 (31.5) 282 (40.3) 229 (29.7) 152 (20.2) 250 (17.0) 332 (28.2) 239 (21.6) 213Vandalism13 .......................................... 420 (43.2) 414 (42.1) 515 (114.4) 518 (92.2) 443 (46.4) 342 (24.8) 504 (55.2) 506 (45.9) 334
Table 141. Number and percentage of public schools reporting crime incidents, by school characteristics and seriousness of crime incidents repor
Type of crime
Percent minority enrollment1 Percent of students eligible for free/reduced-price lunch
Less than 10 10 to 24 25 to 50 50 to 74 75 or more 0 to 20 21 to 50 Over 50 percent
1 14 15 16 17 18 19 20 21
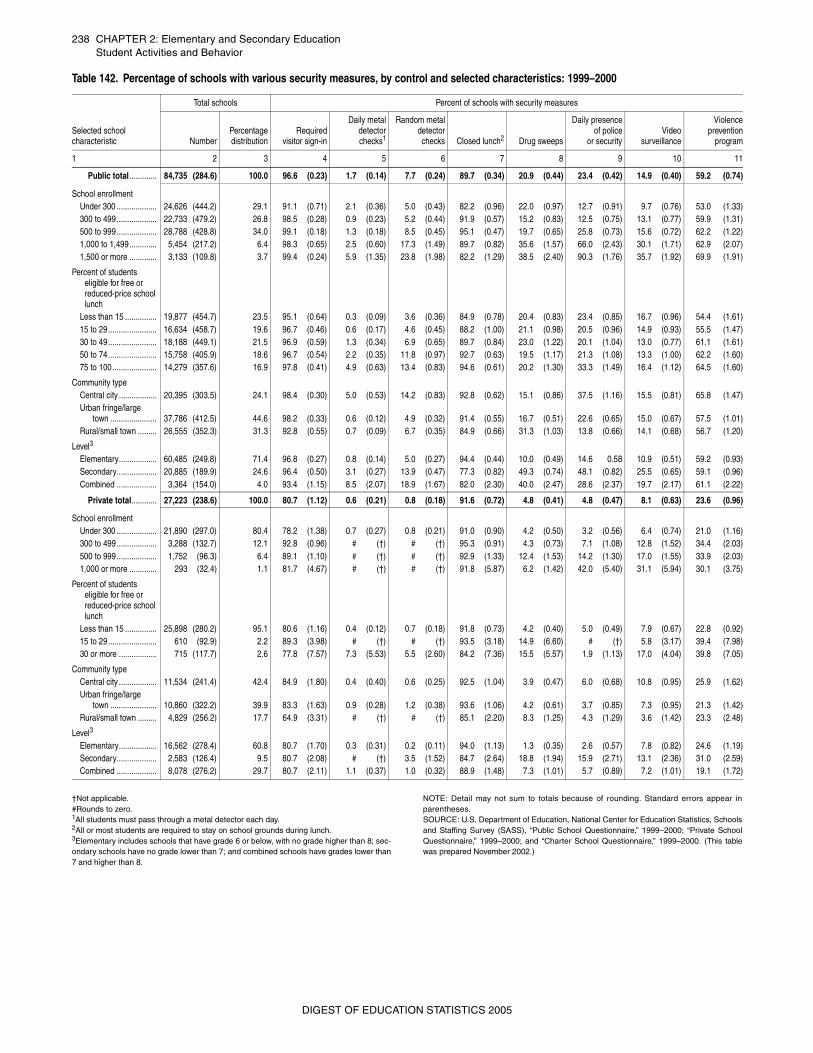
238 CHAPTER 2: Elementary and Secondary EducationStudent Activities and Behavior
_
†Not applicable.#Rounds to zero. 1All students must pass through a metal detector each day. 2All or most students are required to stay on school grounds during lunch. 3Elementary includes schools that have grade 6 or below, with no grade higher than 8; sec-ondary schools have no grade lower than 7; and combined schools have grades lower than7 and higher than 8.
NOTE: Detail may not sum to totals because of rounding. Standard errors appear inparentheses. SOURCE: U.S. Department of Education, National Center for Education Statistics, Schoolsand Staffing Survey (SASS), “Public School Questionnaire,” 1999–2000; “Private SchoolQuestionnaire,” 1999–2000; and “Charter School Questionnaire,” 1999–2000. (This tablewas prepared November 2002.)
Table 142. Percentage of schools with various security measures, by control and selected characteristics: 1999–2000
Selected school characteristic
Total schools Percent of schools with security measures
NumberPercentagedistribution
Requiredvisitor sign-in
Daily metaldetectorchecks1
Random metaldetectorchecks Closed lunch2 Drug sweeps
Daily presenceof police
or securityVideo
surveillance
Violenceprevention
program
1 2 3 4 5 6 7 8 9 10 11
Public total............. 84,735 (284.6) 100.0 96.6 (0.23) 1.7 (0.14) 7.7 (0.24) 89.7 (0.34) 20.9 (0.44) 23.4 (0.42) 14.9 (0.40) 59.2 (0.74)
School enrollmentUnder 300 ................... 24,626 (444.2) 29.1 91.1 (0.71) 2.1 (0.36) 5.0 (0.43) 82.2 (0.96) 22.0 (0.97) 12.7 (0.91) 9.7 (0.76) 53.0 (1.33)300 to 499................... 22,733 (479.2) 26.8 98.5 (0.28) 0.9 (0.23) 5.2 (0.44) 91.9 (0.57) 15.2 (0.83) 12.5 (0.75) 13.1 (0.77) 59.9 (1.31)500 to 999................... 28,788 (428.8) 34.0 99.1 (0.18) 1.3 (0.18) 8.5 (0.45) 95.1 (0.47) 19.7 (0.65) 25.8 (0.73) 15.6 (0.72) 62.2 (1.22)1,000 to 1,499............. 5,454 (217.2) 6.4 98.3 (0.65) 2.5 (0.60) 17.3 (1.49) 89.7 (0.82) 35.6 (1.57) 66.0 (2.43) 30.1 (1.71) 62.9 (2.07)1,500 or more ............. 3,133 (109.8) 3.7 99.4 (0.24) 5.9 (1.35) 23.8 (1.98) 82.2 (1.29) 38.5 (2.40) 90.3 (1.76) 35.7 (1.92) 69.9 (1.91)
Percent of students eligible for free or reduced-price school lunch
Less than 15 ............... 19,877 (454.7) 23.5 95.1 (0.64) 0.3 (0.09) 3.6 (0.36) 84.9 (0.78) 20.4 (0.83) 23.4 (0.85) 16.7 (0.96) 54.4 (1.61)15 to 29....................... 16,634 (458.7) 19.6 96.7 (0.46) 0.6 (0.17) 4.6 (0.45) 88.2 (1.00) 21.1 (0.98) 20.5 (0.96) 14.9 (0.93) 55.5 (1.47)30 to 49....................... 18,188 (449.1) 21.5 96.9 (0.59) 1.3 (0.34) 6.9 (0.65) 89.7 (0.84) 23.0 (1.22) 20.1 (1.04) 13.0 (0.77) 61.1 (1.61)50 to 74....................... 15,758 (405.9) 18.6 96.7 (0.54) 2.2 (0.35) 11.8 (0.97) 92.7 (0.63) 19.5 (1.17) 21.3 (1.08) 13.3 (1.00) 62.2 (1.60)75 to 100..................... 14,279 (357.6) 16.9 97.8 (0.41) 4.9 (0.63) 13.4 (0.83) 94.6 (0.61) 20.2 (1.30) 33.3 (1.49) 16.4 (1.12) 64.5 (1.60)
Community typeCentral city .................. 20,395 (303.5) 24.1 98.4 (0.30) 5.0 (0.53) 14.2 (0.83) 92.8 (0.62) 15.1 (0.86) 37.5 (1.16) 15.5 (0.81) 65.8 (1.47)Urban fringe/large
town ...................... 37,786 (412.5) 44.6 98.2 (0.33) 0.6 (0.12) 4.9 (0.32) 91.4 (0.55) 16.7 (0.51) 22.6 (0.65) 15.0 (0.67) 57.5 (1.01)Rural/small town ......... 26,555 (352.3) 31.3 92.8 (0.55) 0.7 (0.09) 6.7 (0.35) 84.9 (0.66) 31.3 (1.03) 13.8 (0.66) 14.1 (0.68) 56.7 (1.20)
Level3
Elementary.................. 60,485 (249.8) 71.4 96.8 (0.27) 0.8 (0.14) 5.0 (0.27) 94.4 (0.44) 10.0 (0.49) 14.6 0.58 10.9 (0.51) 59.2 (0.93)Secondary................... 20,885 (189.9) 24.6 96.4 (0.50) 3.1 (0.27) 13.9 (0.47) 77.3 (0.82) 49.3 (0.74) 48.1 (0.82) 25.5 (0.65) 59.1 (0.96)Combined ................... 3,364 (154.0) 4.0 93.4 (1.15) 8.5 (2.07) 18.9 (1.67) 82.0 (2.30) 40.0 (2.47) 28.6 (2.37) 19.7 (2.17) 61.1 (2.22)
Private total............ 27,223 (238.6) 100.0 80.7 (1.12) 0.6 (0.21) 0.8 (0.18) 91.6 (0.72) 4.8 (0.41) 4.8 (0.47) 8.1 (0.63) 23.6 (0.96)
School enrollment Under 300 ................... 21,890 (297.0) 80.4 78.2 (1.38) 0.7 (0.27) 0.8 (0.21) 91.0 (0.90) 4.2 (0.50) 3.2 (0.56) 6.4 (0.74) 21.0 (1.16)300 to 499................... 3,288 (132.7) 12.1 92.8 (0.96) # (†) # (†) 95.3 (0.91) 4.3 (0.73) 7.1 (1.08) 12.8 (1.52) 34.4 (2.03)500 to 999................... 1,752 (96.3) 6.4 89.1 (1.10) # (†) # (†) 92.9 (1.33) 12.4 (1.53) 14.2 (1.30) 17.0 (1.55) 33.9 (2.03)1,000 or more ............. 293 (32.4) 1.1 81.7 (4.67) # (†) # (†) 91.8 (5.87) 6.2 (1.42) 42.0 (5.40) 31.1 (5.94) 30.1 (3.75)
Percent of students eligible for free or reduced-price school lunch
Less than 15 ............... 25,898 (280.2) 95.1 80.6 (1.16) 0.4 (0.12) 0.7 (0.18) 91.8 (0.73) 4.2 (0.40) 5.0 (0.49) 7.9 (0.67) 22.8 (0.92)15 to 29....................... 610 (92.9) 2.2 89.3 (3.98) # (†) # (†) 93.5 (3.18) 14.9 (6.60) # (†) 5.8 (3.17) 39.4 (7.98)30 or more .................. 715 (117.7) 2.6 77.8 (7.57) 7.3 (5.53) 5.5 (2.60) 84.2 (7.36) 15.5 (5.57) 1.9 (1.13) 17.0 (4.04) 39.8 (7.05)
Community type Central city .................. 11,534 (241.4) 42.4 84.9 (1.80) 0.4 (0.40) 0.6 (0.25) 92.5 (1.04) 3.9 (0.47) 6.0 (0.68) 10.8 (0.95) 25.9 (1.62)Urban fringe/large
town ...................... 10,860 (322.2) 39.9 83.3 (1.63) 0.9 (0.28) 1.2 (0.38) 93.6 (1.06) 4.2 (0.61) 3.7 (0.85) 7.3 (0.95) 21.3 (1.42)Rural/small town ......... 4,829 (256.2) 17.7 64.9 (3.31) # (†) # (†) 85.1 (2.20) 8.3 (1.25) 4.3 (1.29) 3.6 (1.42) 23.3 (2.48)
Level3
Elementary.................. 16,562 (278.4) 60.8 80.7 (1.70) 0.3 (0.31) 0.2 (0.11) 94.0 (1.13) 1.3 (0.35) 2.6 (0.57) 7.8 (0.82) 24.6 (1.19)Secondary................... 2,583 (126.4) 9.5 80.7 (2.08) # (†) 3.5 (1.52) 84.7 (2.64) 18.8 (1.94) 15.9 (2.71) 13.1 (2.36) 31.0 (2.59)Combined ................... 8,078 (276.2) 29.7 80.7 (2.11) 1.1 (0.37) 1.0 (0.32) 88.9 (1.48) 7.3 (1.01) 5.7 (0.89) 7.2 (1.01) 19.1 (1.72)
DIGEST OF EDUCATION STATISTICS 2005
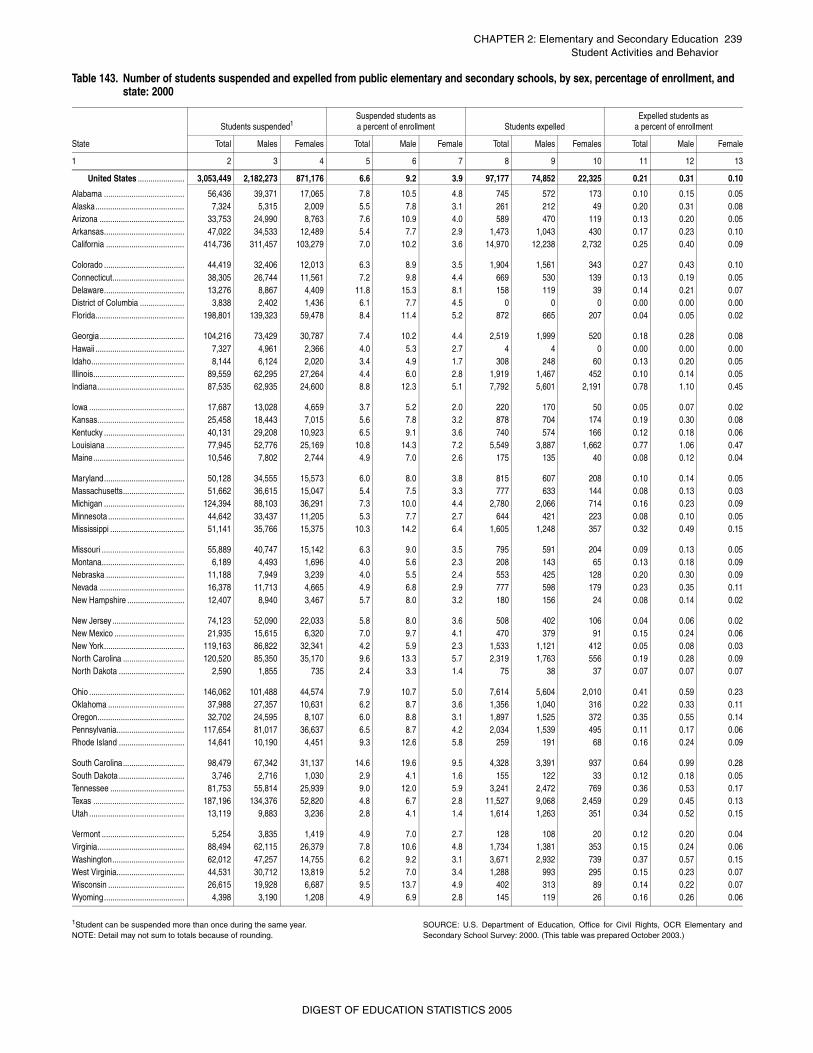
CHAPTER 2: Elementary and Secondary Education 239Student Activities and Behavior
_
1Student can be suspended more than once during the same year.NOTE: Detail may not sum to totals because of rounding.
SOURCE: U.S. Department of Education, Office for Civil Rights, OCR Elementary andSecondary School Survey: 2000. (This table was prepared October 2003.)
Table 143. Number of students suspended and expelled from public elementary and secondary schools, by sex, percentage of enrollment, and state: 2000
State
Students suspended1Suspended students as a percent of enrollment Students expelled
Expelled students as a percent of enrollment
Total Males Females Total Male Female Total Males Females Total Male Female
1 2 3 4 5 6 7 8 9 10 11 12 13
United States ...................... 3,053,449 2,182,273 871,176 6.6 9.2 3.9 97,177 74,852 22,325 0.21 0.31 0.10
Alabama ...................................... 56,436 39,371 17,065 7.8 10.5 4.8 745 572 173 0.10 0.15 0.05Alaska.......................................... 7,324 5,315 2,009 5.5 7.8 3.1 261 212 49 0.20 0.31 0.08Arizona ........................................ 33,753 24,990 8,763 7.6 10.9 4.0 589 470 119 0.13 0.20 0.05Arkansas...................................... 47,022 34,533 12,489 5.4 7.7 2.9 1,473 1,043 430 0.17 0.23 0.10California ..................................... 414,736 311,457 103,279 7.0 10.2 3.6 14,970 12,238 2,732 0.25 0.40 0.09
Colorado ...................................... 44,419 32,406 12,013 6.3 8.9 3.5 1,904 1,561 343 0.27 0.43 0.10Connecticut.................................. 38,305 26,744 11,561 7.2 9.8 4.4 669 530 139 0.13 0.19 0.05Delaware...................................... 13,276 8,867 4,409 11.8 15.3 8.1 158 119 39 0.14 0.21 0.07District of Columbia ..................... 3,838 2,402 1,436 6.1 7.7 4.5 0 0 0 0.00 0.00 0.00Florida.......................................... 198,801 139,323 59,478 8.4 11.4 5.2 872 665 207 0.04 0.05 0.02
Georgia........................................ 104,216 73,429 30,787 7.4 10.2 4.4 2,519 1,999 520 0.18 0.28 0.08Hawaii .......................................... 7,327 4,961 2,366 4.0 5.3 2.7 4 4 0 0.00 0.00 0.00Idaho............................................ 8,144 6,124 2,020 3.4 4.9 1.7 308 248 60 0.13 0.20 0.05Illinois........................................... 89,559 62,295 27,264 4.4 6.0 2.8 1,919 1,467 452 0.10 0.14 0.05Indiana......................................... 87,535 62,935 24,600 8.8 12.3 5.1 7,792 5,601 2,191 0.78 1.10 0.45
Iowa ............................................. 17,687 13,028 4,659 3.7 5.2 2.0 220 170 50 0.05 0.07 0.02Kansas......................................... 25,458 18,443 7,015 5.6 7.8 3.2 878 704 174 0.19 0.30 0.08Kentucky ...................................... 40,131 29,208 10,923 6.5 9.1 3.6 740 574 166 0.12 0.18 0.06Louisiana ..................................... 77,945 52,776 25,169 10.8 14.3 7.2 5,549 3,887 1,662 0.77 1.06 0.47Maine........................................... 10,546 7,802 2,744 4.9 7.0 2.6 175 135 40 0.08 0.12 0.04
Maryland...................................... 50,128 34,555 15,573 6.0 8.0 3.8 815 607 208 0.10 0.14 0.05Massachusetts............................. 51,662 36,615 15,047 5.4 7.5 3.3 777 633 144 0.08 0.13 0.03Michigan ...................................... 124,394 88,103 36,291 7.3 10.0 4.4 2,780 2,066 714 0.16 0.23 0.09Minnesota .................................... 44,642 33,437 11,205 5.3 7.7 2.7 644 421 223 0.08 0.10 0.05Mississippi ................................... 51,141 35,766 15,375 10.3 14.2 6.4 1,605 1,248 357 0.32 0.49 0.15
Missouri ....................................... 55,889 40,747 15,142 6.3 9.0 3.5 795 591 204 0.09 0.13 0.05Montana....................................... 6,189 4,493 1,696 4.0 5.6 2.3 208 143 65 0.13 0.18 0.09Nebraska ..................................... 11,188 7,949 3,239 4.0 5.5 2.4 553 425 128 0.20 0.30 0.09Nevada ........................................ 16,378 11,713 4,665 4.9 6.8 2.9 777 598 179 0.23 0.35 0.11New Hampshire ........................... 12,407 8,940 3,467 5.7 8.0 3.2 180 156 24 0.08 0.14 0.02
New Jersey .................................. 74,123 52,090 22,033 5.8 8.0 3.6 508 402 106 0.04 0.06 0.02New Mexico ................................. 21,935 15,615 6,320 7.0 9.7 4.1 470 379 91 0.15 0.24 0.06New York...................................... 119,163 86,822 32,341 4.2 5.9 2.3 1,533 1,121 412 0.05 0.08 0.03North Carolina ............................. 120,520 85,350 35,170 9.6 13.3 5.7 2,319 1,763 556 0.19 0.28 0.09North Dakota ............................... 2,590 1,855 735 2.4 3.3 1.4 75 38 37 0.07 0.07 0.07
Ohio ............................................. 146,062 101,488 44,574 7.9 10.7 5.0 7,614 5,604 2,010 0.41 0.59 0.23Oklahoma .................................... 37,988 27,357 10,631 6.2 8.7 3.6 1,356 1,040 316 0.22 0.33 0.11Oregon......................................... 32,702 24,595 8,107 6.0 8.8 3.1 1,897 1,525 372 0.35 0.55 0.14Pennsylvania................................ 117,654 81,017 36,637 6.5 8.7 4.2 2,034 1,539 495 0.11 0.17 0.06Rhode Island ............................... 14,641 10,190 4,451 9.3 12.6 5.8 259 191 68 0.16 0.24 0.09
South Carolina............................. 98,479 67,342 31,137 14.6 19.6 9.5 4,328 3,391 937 0.64 0.99 0.28South Dakota ............................... 3,746 2,716 1,030 2.9 4.1 1.6 155 122 33 0.12 0.18 0.05Tennessee ................................... 81,753 55,814 25,939 9.0 12.0 5.9 3,241 2,472 769 0.36 0.53 0.17Texas ........................................... 187,196 134,376 52,820 4.8 6.7 2.8 11,527 9,068 2,459 0.29 0.45 0.13Utah ............................................. 13,119 9,883 3,236 2.8 4.1 1.4 1,614 1,263 351 0.34 0.52 0.15
Vermont ....................................... 5,254 3,835 1,419 4.9 7.0 2.7 128 108 20 0.12 0.20 0.04Virginia......................................... 88,494 62,115 26,379 7.8 10.6 4.8 1,734 1,381 353 0.15 0.24 0.06Washington.................................. 62,012 47,257 14,755 6.2 9.2 3.1 3,671 2,932 739 0.37 0.57 0.15West Virginia................................ 44,531 30,712 13,819 5.2 7.0 3.4 1,288 993 295 0.15 0.23 0.07Wisconsin .................................... 26,615 19,928 6,687 9.5 13.7 4.9 402 313 89 0.14 0.22 0.07Wyoming...................................... 4,398 3,190 1,208 4.9 6.9 2.8 145 119 26 0.16 0.26 0.06
DIGEST OF EDUCATION STATISTICS 2005
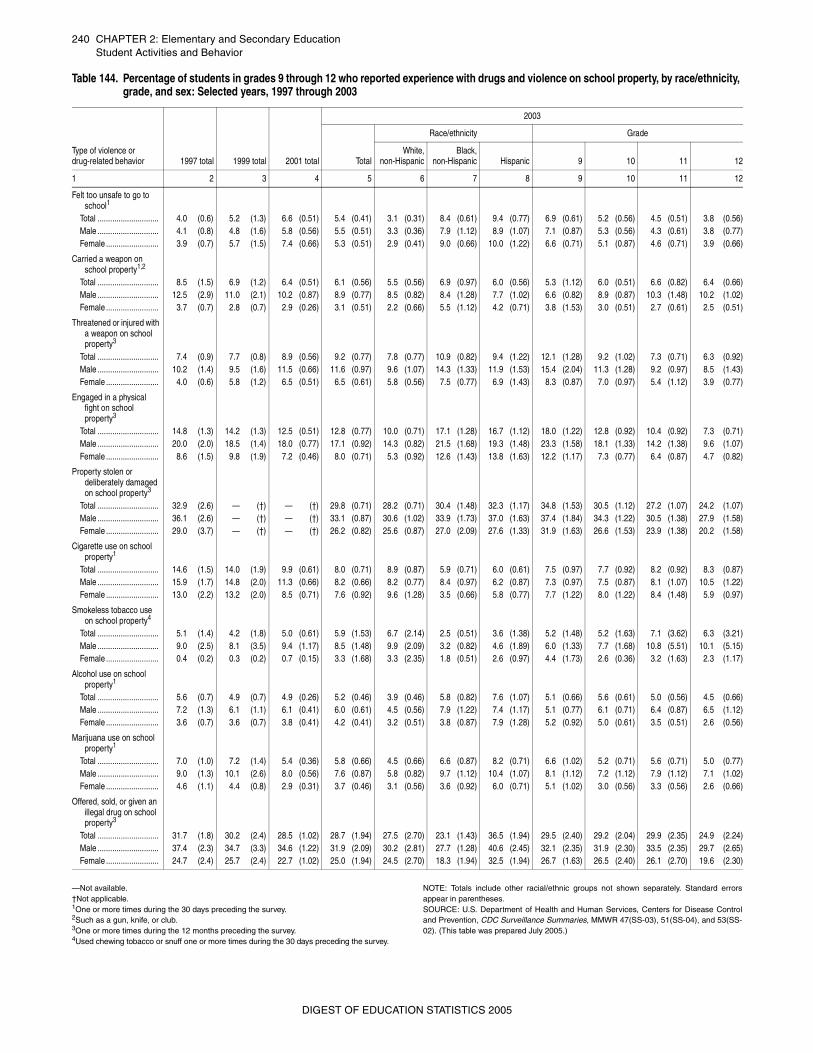
240 CHAPTER 2: Elementary and Secondary EducationStudent Activities and Behavior
—Not available. †Not applicable.1One or more times during the 30 days preceding the survey. 2Such as a gun, knife, or club.3One or more times during the 12 months preceding the survey. 4Used chewing tobacco or snuff one or more times during the 30 days preceding the survey.
NOTE: Totals include other racial/ethnic groups not shown separately. Standard errorsappear in parentheses. SOURCE: U.S. Department of Health and Human Services, Centers for Disease Controland Prevention, CDC Surveillance Summaries, MMWR 47(SS-03), 51(SS-04), and 53(SS-02). (This table was prepared July 2005.)
Table 144. Percentage of students in grades 9 through 12 who reported experience with drugs and violence on school property, by race/ethnicity, grade, and sex: Selected years, 1997 through 2003
Type of violence ordrug-related behavior 1997 total 1999 total 2001 total
2003
Total
Race/ethnicity Grade
White,non-Hispanic
Black,non-Hispanic Hispanic 9 10 11 12
1 2 3 4 5 6 7 8 9 10 11 12
Felt too unsafe to go to school1
Total ............................. 4.0 (0.6) 5.2 (1.3) 6.6 (0.51) 5.4 (0.41) 3.1 (0.31) 8.4 (0.61) 9.4 (0.77) 6.9 (0.61) 5.2 (0.56) 4.5 (0.51) 3.8 (0.56)Male ............................. 4.1 (0.8) 4.8 (1.6) 5.8 (0.56) 5.5 (0.51) 3.3 (0.36) 7.9 (1.12) 8.9 (1.07) 7.1 (0.87) 5.3 (0.56) 4.3 (0.61) 3.8 (0.77)Female ......................... 3.9 (0.7) 5.7 (1.5) 7.4 (0.66) 5.3 (0.51) 2.9 (0.41) 9.0 (0.66) 10.0 (1.22) 6.6 (0.71) 5.1 (0.87) 4.6 (0.71) 3.9 (0.66)
Carried a weapon on school property1,2
Total ............................. 8.5 (1.5) 6.9 (1.2) 6.4 (0.51) 6.1 (0.56) 5.5 (0.56) 6.9 (0.97) 6.0 (0.56) 5.3 (1.12) 6.0 (0.51) 6.6 (0.82) 6.4 (0.66)Male ............................. 12.5 (2.9) 11.0 (2.1) 10.2 (0.87) 8.9 (0.77) 8.5 (0.82) 8.4 (1.28) 7.7 (1.02) 6.6 (0.82) 8.9 (0.87) 10.3 (1.48) 10.2 (1.02)Female ......................... 3.7 (0.7) 2.8 (0.7) 2.9 (0.26) 3.1 (0.51) 2.2 (0.66) 5.5 (1.12) 4.2 (0.71) 3.8 (1.53) 3.0 (0.51) 2.7 (0.61) 2.5 (0.51)
Threatened or injured with a weapon on school property3
Total ............................. 7.4 (0.9) 7.7 (0.8) 8.9 (0.56) 9.2 (0.77) 7.8 (0.77) 10.9 (0.82) 9.4 (1.22) 12.1 (1.28) 9.2 (1.02) 7.3 (0.71) 6.3 (0.92)Male ............................. 10.2 (1.4) 9.5 (1.6) 11.5 (0.66) 11.6 (0.97) 9.6 (1.07) 14.3 (1.33) 11.9 (1.53) 15.4 (2.04) 11.3 (1.28) 9.2 (0.97) 8.5 (1.43)Female ......................... 4.0 (0.6) 5.8 (1.2) 6.5 (0.51) 6.5 (0.61) 5.8 (0.56) 7.5 (0.77) 6.9 (1.43) 8.3 (0.87) 7.0 (0.97) 5.4 (1.12) 3.9 (0.77)
Engaged in a physical fight on school property3
Total ............................. 14.8 (1.3) 14.2 (1.3) 12.5 (0.51) 12.8 (0.77) 10.0 (0.71) 17.1 (1.28) 16.7 (1.12) 18.0 (1.22) 12.8 (0.92) 10.4 (0.92) 7.3 (0.71)Male ............................. 20.0 (2.0) 18.5 (1.4) 18.0 (0.77) 17.1 (0.92) 14.3 (0.82) 21.5 (1.68) 19.3 (1.48) 23.3 (1.58) 18.1 (1.33) 14.2 (1.38) 9.6 (1.07)Female ......................... 8.6 (1.5) 9.8 (1.9) 7.2 (0.46) 8.0 (0.71) 5.3 (0.92) 12.6 (1.43) 13.8 (1.63) 12.2 (1.17) 7.3 (0.77) 6.4 (0.87) 4.7 (0.82)
Property stolen or deliberately damaged on school property3
Total ............................. 32.9 (2.6) — (†) — (†) 29.8 (0.71) 28.2 (0.71) 30.4 (1.48) 32.3 (1.17) 34.8 (1.53) 30.5 (1.12) 27.2 (1.07) 24.2 (1.07)Male ............................. 36.1 (2.6) — (†) — (†) 33.1 (0.87) 30.6 (1.02) 33.9 (1.73) 37.0 (1.63) 37.4 (1.84) 34.3 (1.22) 30.5 (1.38) 27.9 (1.58)Female ......................... 29.0 (3.7) — (†) — (†) 26.2 (0.82) 25.6 (0.87) 27.0 (2.09) 27.6 (1.33) 31.9 (1.63) 26.6 (1.53) 23.9 (1.38) 20.2 (1.58)
Cigarette use on school property1
Total ............................. 14.6 (1.5) 14.0 (1.9) 9.9 (0.61) 8.0 (0.71) 8.9 (0.87) 5.9 (0.71) 6.0 (0.61) 7.5 (0.97) 7.7 (0.92) 8.2 (0.92) 8.3 (0.87)Male ............................. 15.9 (1.7) 14.8 (2.0) 11.3 (0.66) 8.2 (0.66) 8.2 (0.77) 8.4 (0.97) 6.2 (0.87) 7.3 (0.97) 7.5 (0.87) 8.1 (1.07) 10.5 (1.22)Female ......................... 13.0 (2.2) 13.2 (2.0) 8.5 (0.71) 7.6 (0.92) 9.6 (1.28) 3.5 (0.66) 5.8 (0.77) 7.7 (1.22) 8.0 (1.22) 8.4 (1.48) 5.9 (0.97)
Smokeless tobacco use on school property4
Total ............................. 5.1 (1.4) 4.2 (1.8) 5.0 (0.61) 5.9 (1.53) 6.7 (2.14) 2.5 (0.51) 3.6 (1.38) 5.2 (1.48) 5.2 (1.63) 7.1 (3.62) 6.3 (3.21)Male ............................. 9.0 (2.5) 8.1 (3.5) 9.4 (1.17) 8.5 (1.48) 9.9 (2.09) 3.2 (0.82) 4.6 (1.89) 6.0 (1.33) 7.7 (1.68) 10.8 (5.51) 10.1 (5.15)Female ......................... 0.4 (0.2) 0.3 (0.2) 0.7 (0.15) 3.3 (1.68) 3.3 (2.35) 1.8 (0.51) 2.6 (0.97) 4.4 (1.73) 2.6 (0.36) 3.2 (1.63) 2.3 (1.17)
Alcohol use on school property1
Total ............................. 5.6 (0.7) 4.9 (0.7) 4.9 (0.26) 5.2 (0.46) 3.9 (0.46) 5.8 (0.82) 7.6 (1.07) 5.1 (0.66) 5.6 (0.61) 5.0 (0.56) 4.5 (0.66)Male ............................. 7.2 (1.3) 6.1 (1.1) 6.1 (0.41) 6.0 (0.61) 4.5 (0.56) 7.9 (1.22) 7.4 (1.17) 5.1 (0.77) 6.1 (0.71) 6.4 (0.87) 6.5 (1.12)Female ......................... 3.6 (0.7) 3.6 (0.7) 3.8 (0.41) 4.2 (0.41) 3.2 (0.51) 3.8 (0.87) 7.9 (1.28) 5.2 (0.92) 5.0 (0.61) 3.5 (0.51) 2.6 (0.56)
Marijuana use on school property1
Total ............................. 7.0 (1.0) 7.2 (1.4) 5.4 (0.36) 5.8 (0.66) 4.5 (0.66) 6.6 (0.87) 8.2 (0.71) 6.6 (1.02) 5.2 (0.71) 5.6 (0.71) 5.0 (0.77)Male ............................. 9.0 (1.3) 10.1 (2.6) 8.0 (0.56) 7.6 (0.87) 5.8 (0.82) 9.7 (1.12) 10.4 (1.07) 8.1 (1.12) 7.2 (1.12) 7.9 (1.12) 7.1 (1.02)Female ......................... 4.6 (1.1) 4.4 (0.8) 2.9 (0.31) 3.7 (0.46) 3.1 (0.56) 3.6 (0.92) 6.0 (0.71) 5.1 (1.02) 3.0 (0.56) 3.3 (0.56) 2.6 (0.66)
Offered, sold, or given an illegal drug on school property3
Total ............................. 31.7 (1.8) 30.2 (2.4) 28.5 (1.02) 28.7 (1.94) 27.5 (2.70) 23.1 (1.43) 36.5 (1.94) 29.5 (2.40) 29.2 (2.04) 29.9 (2.35) 24.9 (2.24)Male ............................. 37.4 (2.3) 34.7 (3.3) 34.6 (1.22) 31.9 (2.09) 30.2 (2.81) 27.7 (1.28) 40.6 (2.45) 32.1 (2.35) 31.9 (2.30) 33.5 (2.35) 29.7 (2.65)Female ......................... 24.7 (2.4) 25.7 (2.4) 22.7 (1.02) 25.0 (1.94) 24.5 (2.70) 18.3 (1.94) 32.5 (1.94) 26.7 (1.63) 26.5 (2.40) 26.1 (2.70) 19.6 (2.30)
DIGEST OF EDUCATION STATISTICS 2005
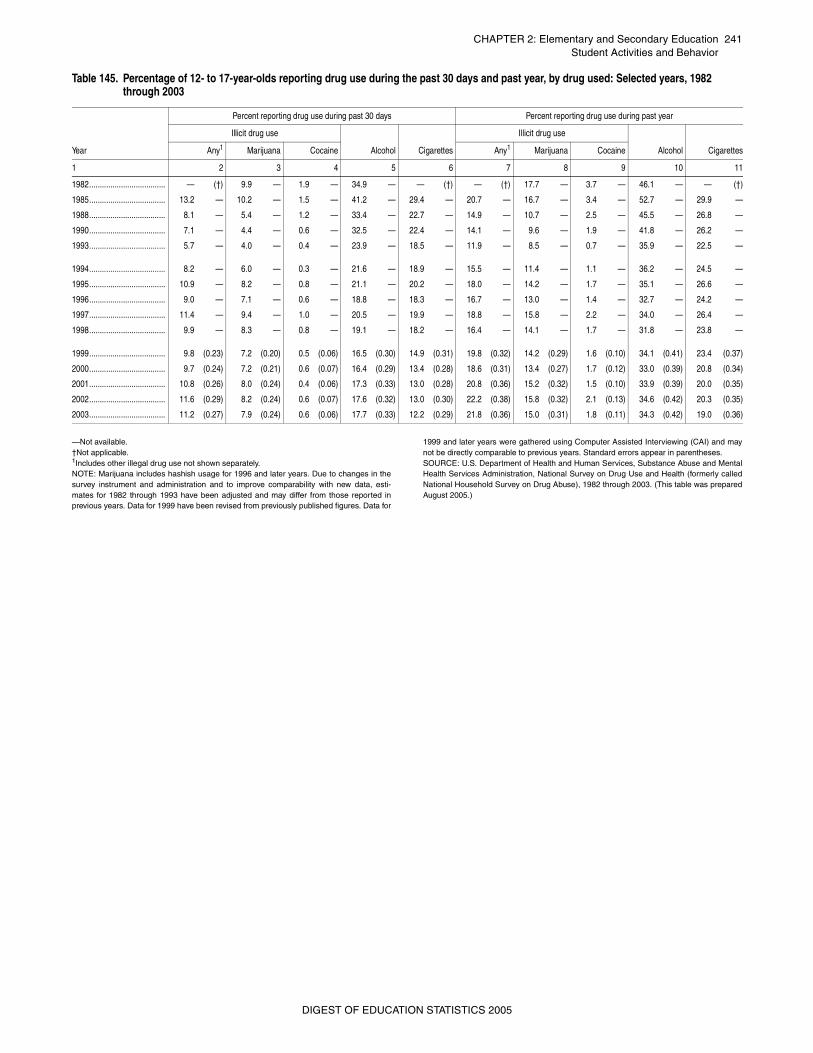
CHAPTER 2: Elementary and Secondary Education 241Student Activities and Behavior
—Not available. †Not applicable.1Includes other illegal drug use not shown separately. NOTE: Marijuana includes hashish usage for 1996 and later years. Due to changes in thesurvey instrument and administration and to improve comparability with new data, esti-mates for 1982 through 1993 have been adjusted and may differ from those reported inprevious years. Data for 1999 have been revised from previously published figures. Data for
1999 and later years were gathered using Computer Assisted Interviewing (CAI) and maynot be directly comparable to previous years. Standard errors appear in parentheses. SOURCE: U.S. Department of Health and Human Services, Substance Abuse and MentalHealth Services Administration, National Survey on Drug Use and Health (formerly calledNational Household Survey on Drug Abuse), 1982 through 2003. (This table was preparedAugust 2005.)
Table 145. Percentage of 12- to 17-year-olds reporting drug use during the past 30 days and past year, by drug used: Selected years, 1982 through 2003
Year
Percent reporting drug use during past 30 days Percent reporting drug use during past year
Illicit drug use
Alcohol Cigarettes
Illicit drug use
Alcohol CigarettesAny1 Marijuana Cocaine Any1 Marijuana Cocaine
1 2 3 4 5 6 7 8 9 10 11
1982.................................... — (†) 9.9 — 1.9 — 34.9 — — (†) — (†) 17.7 — 3.7 — 46.1 — — (†)
1985.................................... 13.2 — 10.2 — 1.5 — 41.2 — 29.4 — 20.7 — 16.7 — 3.4 — 52.7 — 29.9 —
1988.................................... 8.1 — 5.4 — 1.2 — 33.4 — 22.7 — 14.9 — 10.7 — 2.5 — 45.5 — 26.8 —
1990.................................... 7.1 — 4.4 — 0.6 — 32.5 — 22.4 — 14.1 — 9.6 — 1.9 — 41.8 — 26.2 —
1993.................................... 5.7 — 4.0 — 0.4 — 23.9 — 18.5 — 11.9 — 8.5 — 0.7 — 35.9 — 22.5 —
1994.................................... 8.2 — 6.0 — 0.3 — 21.6 — 18.9 — 15.5 — 11.4 — 1.1 — 36.2 — 24.5 —
1995.................................... 10.9 — 8.2 — 0.8 — 21.1 — 20.2 — 18.0 — 14.2 — 1.7 — 35.1 — 26.6 —
1996.................................... 9.0 — 7.1 — 0.6 — 18.8 — 18.3 — 16.7 — 13.0 — 1.4 — 32.7 — 24.2 —
1997.................................... 11.4 — 9.4 — 1.0 — 20.5 — 19.9 — 18.8 — 15.8 — 2.2 — 34.0 — 26.4 —
1998.................................... 9.9 — 8.3 — 0.8 — 19.1 — 18.2 — 16.4 — 14.1 — 1.7 — 31.8 — 23.8 —
1999.................................... 9.8 (0.23) 7.2 (0.20) 0.5 (0.06) 16.5 (0.30) 14.9 (0.31) 19.8 (0.32) 14.2 (0.29) 1.6 (0.10) 34.1 (0.41) 23.4 (0.37)
2000.................................... 9.7 (0.24) 7.2 (0.21) 0.6 (0.07) 16.4 (0.29) 13.4 (0.28) 18.6 (0.31) 13.4 (0.27) 1.7 (0.12) 33.0 (0.39) 20.8 (0.34)
2001.................................... 10.8 (0.26) 8.0 (0.24) 0.4 (0.06) 17.3 (0.33) 13.0 (0.28) 20.8 (0.36) 15.2 (0.32) 1.5 (0.10) 33.9 (0.39) 20.0 (0.35)
2002.................................... 11.6 (0.29) 8.2 (0.24) 0.6 (0.07) 17.6 (0.32) 13.0 (0.30) 22.2 (0.38) 15.8 (0.32) 2.1 (0.13) 34.6 (0.42) 20.3 (0.35)
2003.................................... 11.2 (0.27) 7.9 (0.24) 0.6 (0.06) 17.7 (0.33) 12.2 (0.29) 21.8 (0.36) 15.0 (0.31) 1.8 (0.11) 34.3 (0.42) 19.0 (0.36)
DIGEST OF EDUCATION STATISTICS 2005
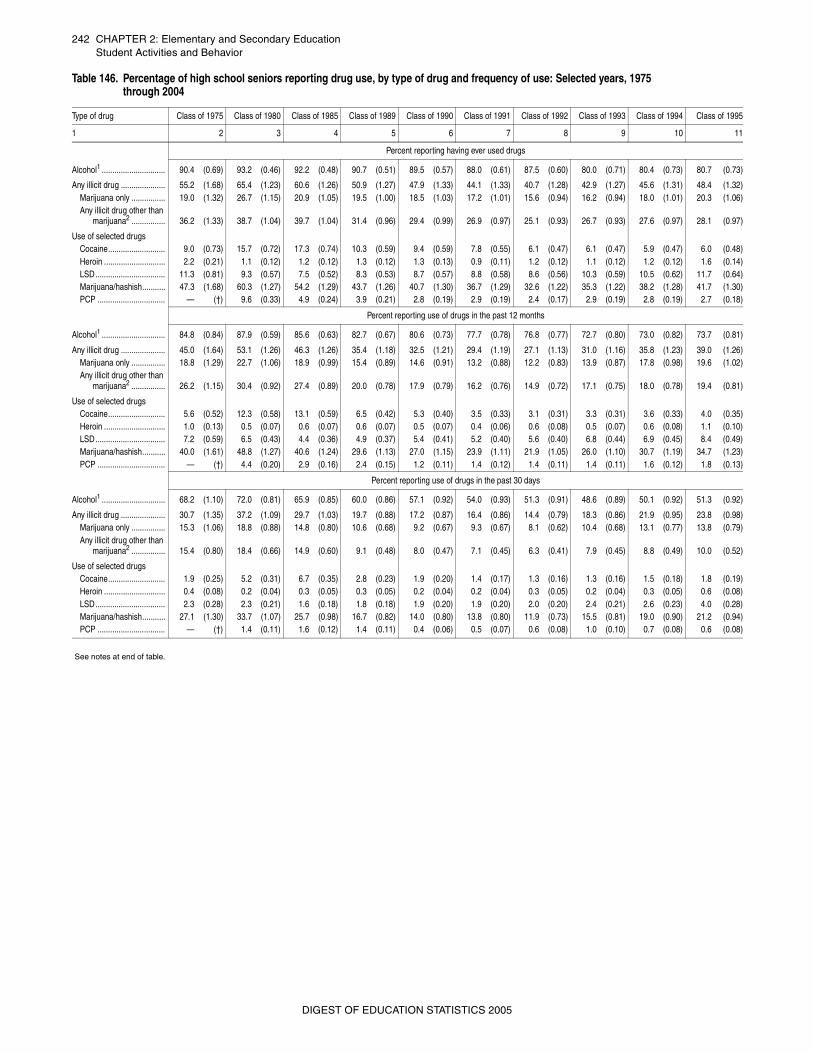
242 CHAPTER 2: Elementary and Secondary EducationStudent Activities and Behavior
_
Table 146. Percentage of high school seniors reporting drug use, by type of drug and frequency of use: Selected years, 1975 through 2004
Type of drug Class of 1975 Class of 1980 Class of 1985 Class of 1989 Class of 1990 Class of 1991 Class of 1992 Class of 1993 Class of 1994 Class of 1995
1 2 3 4 5 6 7 8 9 10 11
Percent reporting having ever used drugs
Alcohol1 .............................. 90.4 (0.69) 93.2 (0.46) 92.2 (0.48) 90.7 (0.51) 89.5 (0.57) 88.0 (0.61) 87.5 (0.60) 80.0 (0.71) 80.4 (0.73) 80.7 (0.73)
Any illicit drug ..................... 55.2 (1.68) 65.4 (1.23) 60.6 (1.26) 50.9 (1.27) 47.9 (1.33) 44.1 (1.33) 40.7 (1.28) 42.9 (1.27) 45.6 (1.31) 48.4 (1.32)Marijuana only ................ 19.0 (1.32) 26.7 (1.15) 20.9 (1.05) 19.5 (1.00) 18.5 (1.03) 17.2 (1.01) 15.6 (0.94) 16.2 (0.94) 18.0 (1.01) 20.3 (1.06)Any illicit drug other than
marijuana2 ................ 36.2 (1.33) 38.7 (1.04) 39.7 (1.04) 31.4 (0.96) 29.4 (0.99) 26.9 (0.97) 25.1 (0.93) 26.7 (0.93) 27.6 (0.97) 28.1 (0.97)
Use of selected drugsCocaine........................... 9.0 (0.73) 15.7 (0.72) 17.3 (0.74) 10.3 (0.59) 9.4 (0.59) 7.8 (0.55) 6.1 (0.47) 6.1 (0.47) 5.9 (0.47) 6.0 (0.48)Heroin ............................. 2.2 (0.21) 1.1 (0.12) 1.2 (0.12) 1.3 (0.12) 1.3 (0.13) 0.9 (0.11) 1.2 (0.12) 1.1 (0.12) 1.2 (0.12) 1.6 (0.14)LSD................................. 11.3 (0.81) 9.3 (0.57) 7.5 (0.52) 8.3 (0.53) 8.7 (0.57) 8.8 (0.58) 8.6 (0.56) 10.3 (0.59) 10.5 (0.62) 11.7 (0.64)Marijuana/hashish........... 47.3 (1.68) 60.3 (1.27) 54.2 (1.29) 43.7 (1.26) 40.7 (1.30) 36.7 (1.29) 32.6 (1.22) 35.3 (1.22) 38.2 (1.28) 41.7 (1.30)PCP ................................ — (†) 9.6 (0.33) 4.9 (0.24) 3.9 (0.21) 2.8 (0.19) 2.9 (0.19) 2.4 (0.17) 2.9 (0.19) 2.8 (0.19) 2.7 (0.18)
Percent reporting use of drugs in the past 12 months
Alcohol1 .............................. 84.8 (0.84) 87.9 (0.59) 85.6 (0.63) 82.7 (0.67) 80.6 (0.73) 77.7 (0.78) 76.8 (0.77) 72.7 (0.80) 73.0 (0.82) 73.7 (0.81)
Any illicit drug ..................... 45.0 (1.64) 53.1 (1.26) 46.3 (1.26) 35.4 (1.18) 32.5 (1.21) 29.4 (1.19) 27.1 (1.13) 31.0 (1.16) 35.8 (1.23) 39.0 (1.26)Marijuana only ................ 18.8 (1.29) 22.7 (1.06) 18.9 (0.99) 15.4 (0.89) 14.6 (0.91) 13.2 (0.88) 12.2 (0.83) 13.9 (0.87) 17.8 (0.98) 19.6 (1.02)Any illicit drug other than
marijuana2 ................ 26.2 (1.15) 30.4 (0.92) 27.4 (0.89) 20.0 (0.78) 17.9 (0.79) 16.2 (0.76) 14.9 (0.72) 17.1 (0.75) 18.0 (0.78) 19.4 (0.81)
Use of selected drugsCocaine........................... 5.6 (0.52) 12.3 (0.58) 13.1 (0.59) 6.5 (0.42) 5.3 (0.40) 3.5 (0.33) 3.1 (0.31) 3.3 (0.31) 3.6 (0.33) 4.0 (0.35)Heroin ............................. 1.0 (0.13) 0.5 (0.07) 0.6 (0.07) 0.6 (0.07) 0.5 (0.07) 0.4 (0.06) 0.6 (0.08) 0.5 (0.07) 0.6 (0.08) 1.1 (0.10)LSD................................. 7.2 (0.59) 6.5 (0.43) 4.4 (0.36) 4.9 (0.37) 5.4 (0.41) 5.2 (0.40) 5.6 (0.40) 6.8 (0.44) 6.9 (0.45) 8.4 (0.49)Marijuana/hashish........... 40.0 (1.61) 48.8 (1.27) 40.6 (1.24) 29.6 (1.13) 27.0 (1.15) 23.9 (1.11) 21.9 (1.05) 26.0 (1.10) 30.7 (1.19) 34.7 (1.23)PCP ................................ — (†) 4.4 (0.20) 2.9 (0.16) 2.4 (0.15) 1.2 (0.11) 1.4 (0.12) 1.4 (0.11) 1.4 (0.11) 1.6 (0.12) 1.8 (0.13)
Percent reporting use of drugs in the past 30 days
Alcohol1 .............................. 68.2 (1.10) 72.0 (0.81) 65.9 (0.85) 60.0 (0.86) 57.1 (0.92) 54.0 (0.93) 51.3 (0.91) 48.6 (0.89) 50.1 (0.92) 51.3 (0.92)
Any illicit drug ..................... 30.7 (1.35) 37.2 (1.09) 29.7 (1.03) 19.7 (0.88) 17.2 (0.87) 16.4 (0.86) 14.4 (0.79) 18.3 (0.86) 21.9 (0.95) 23.8 (0.98)Marijuana only ................ 15.3 (1.06) 18.8 (0.88) 14.8 (0.80) 10.6 (0.68) 9.2 (0.67) 9.3 (0.67) 8.1 (0.62) 10.4 (0.68) 13.1 (0.77) 13.8 (0.79)Any illicit drug other than
marijuana2 ................ 15.4 (0.80) 18.4 (0.66) 14.9 (0.60) 9.1 (0.48) 8.0 (0.47) 7.1 (0.45) 6.3 (0.41) 7.9 (0.45) 8.8 (0.49) 10.0 (0.52)
Use of selected drugsCocaine........................... 1.9 (0.25) 5.2 (0.31) 6.7 (0.35) 2.8 (0.23) 1.9 (0.20) 1.4 (0.17) 1.3 (0.16) 1.3 (0.16) 1.5 (0.18) 1.8 (0.19)Heroin ............................. 0.4 (0.08) 0.2 (0.04) 0.3 (0.05) 0.3 (0.05) 0.2 (0.04) 0.2 (0.04) 0.3 (0.05) 0.2 (0.04) 0.3 (0.05) 0.6 (0.08)LSD................................. 2.3 (0.28) 2.3 (0.21) 1.6 (0.18) 1.8 (0.18) 1.9 (0.20) 1.9 (0.20) 2.0 (0.20) 2.4 (0.21) 2.6 (0.23) 4.0 (0.28)Marijuana/hashish........... 27.1 (1.30) 33.7 (1.07) 25.7 (0.98) 16.7 (0.82) 14.0 (0.80) 13.8 (0.80) 11.9 (0.73) 15.5 (0.81) 19.0 (0.90) 21.2 (0.94)PCP ................................ — (†) 1.4 (0.11) 1.6 (0.12) 1.4 (0.11) 0.4 (0.06) 0.5 (0.07) 0.6 (0.08) 1.0 (0.10) 0.7 (0.08) 0.6 (0.08)
See notes at end of table.
DIGEST OF EDUCATION STATISTICS 2005
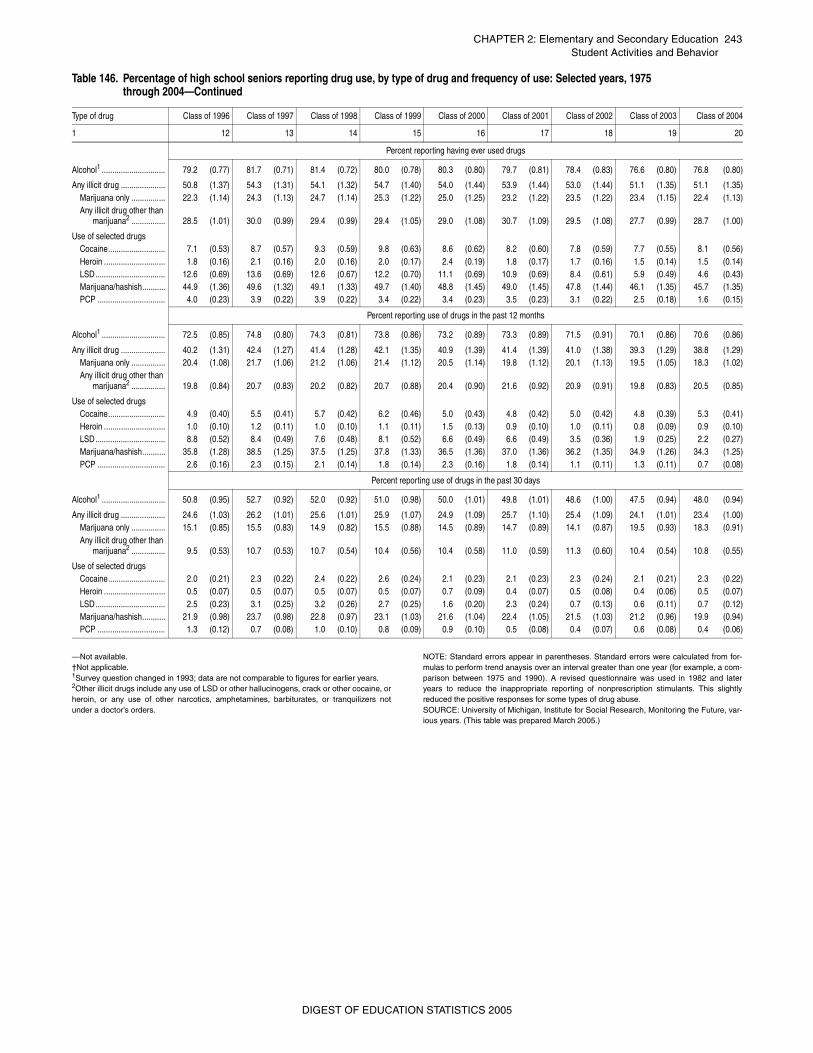
CHAPTER 2: Elementary and Secondary Education 243Student Activities and Behavior
_
—Not available.†Not applicable.1Survey question changed in 1993; data are not comparable to figures for earlier years.2Other illicit drugs include any use of LSD or other hallucinogens, crack or other cocaine, orheroin, or any use of other narcotics, amphetamines, barbiturates, or tranquilizers notunder a doctor’s orders.
NOTE: Standard errors appear in parentheses. Standard errors were calculated from for-mulas to perform trend anaysis over an interval greater than one year (for example, a com-parison between 1975 and 1990). A revised questionnaire was used in 1982 and lateryears to reduce the inappropriate reporting of nonprescription stimulants. This slightlyreduced the positive responses for some types of drug abuse. SOURCE: University of Michigan, Institute for Social Research, Monitoring the Future, var-ious years. (This table was prepared March 2005.)
Table 146. Percentage of high school seniors reporting drug use, by type of drug and frequency of use: Selected years, 1975 through 2004—Continued
Type of drug Class of 1996 Class of 1997 Class of 1998 Class of 1999 Class of 2000 Class of 2001 Class of 2002 Class of 2003 Class of 2004
1 12 13 14 15 16 17 18 19 20
Percent reporting having ever used drugs
Alcohol1 .............................. 79.2 (0.77) 81.7 (0.71) 81.4 (0.72) 80.0 (0.78) 80.3 (0.80) 79.7 (0.81) 78.4 (0.83) 76.6 (0.80) 76.8 (0.80)
Any illicit drug ..................... 50.8 (1.37) 54.3 (1.31) 54.1 (1.32) 54.7 (1.40) 54.0 (1.44) 53.9 (1.44) 53.0 (1.44) 51.1 (1.35) 51.1 (1.35)Marijuana only ................ 22.3 (1.14) 24.3 (1.13) 24.7 (1.14) 25.3 (1.22) 25.0 (1.25) 23.2 (1.22) 23.5 (1.22) 23.4 (1.15) 22.4 (1.13)Any illicit drug other than
marijuana2 ................ 28.5 (1.01) 30.0 (0.99) 29.4 (0.99) 29.4 (1.05) 29.0 (1.08) 30.7 (1.09) 29.5 (1.08) 27.7 (0.99) 28.7 (1.00)
Use of selected drugsCocaine........................... 7.1 (0.53) 8.7 (0.57) 9.3 (0.59) 9.8 (0.63) 8.6 (0.62) 8.2 (0.60) 7.8 (0.59) 7.7 (0.55) 8.1 (0.56)Heroin ............................. 1.8 (0.16) 2.1 (0.16) 2.0 (0.16) 2.0 (0.17) 2.4 (0.19) 1.8 (0.17) 1.7 (0.16) 1.5 (0.14) 1.5 (0.14)LSD................................. 12.6 (0.69) 13.6 (0.69) 12.6 (0.67) 12.2 (0.70) 11.1 (0.69) 10.9 (0.69) 8.4 (0.61) 5.9 (0.49) 4.6 (0.43)Marijuana/hashish........... 44.9 (1.36) 49.6 (1.32) 49.1 (1.33) 49.7 (1.40) 48.8 (1.45) 49.0 (1.45) 47.8 (1.44) 46.1 (1.35) 45.7 (1.35)PCP ................................ 4.0 (0.23) 3.9 (0.22) 3.9 (0.22) 3.4 (0.22) 3.4 (0.23) 3.5 (0.23) 3.1 (0.22) 2.5 (0.18) 1.6 (0.15)
Percent reporting use of drugs in the past 12 months
Alcohol1 .............................. 72.5 (0.85) 74.8 (0.80) 74.3 (0.81) 73.8 (0.86) 73.2 (0.89) 73.3 (0.89) 71.5 (0.91) 70.1 (0.86) 70.6 (0.86)
Any illicit drug ..................... 40.2 (1.31) 42.4 (1.27) 41.4 (1.28) 42.1 (1.35) 40.9 (1.39) 41.4 (1.39) 41.0 (1.38) 39.3 (1.29) 38.8 (1.29)Marijuana only ................ 20.4 (1.08) 21.7 (1.06) 21.2 (1.06) 21.4 (1.12) 20.5 (1.14) 19.8 (1.12) 20.1 (1.13) 19.5 (1.05) 18.3 (1.02)Any illicit drug other than
marijuana2 ................ 19.8 (0.84) 20.7 (0.83) 20.2 (0.82) 20.7 (0.88) 20.4 (0.90) 21.6 (0.92) 20.9 (0.91) 19.8 (0.83) 20.5 (0.85)
Use of selected drugsCocaine........................... 4.9 (0.40) 5.5 (0.41) 5.7 (0.42) 6.2 (0.46) 5.0 (0.43) 4.8 (0.42) 5.0 (0.42) 4.8 (0.39) 5.3 (0.41)Heroin ............................. 1.0 (0.10) 1.2 (0.11) 1.0 (0.10) 1.1 (0.11) 1.5 (0.13) 0.9 (0.10) 1.0 (0.11) 0.8 (0.09) 0.9 (0.10)LSD................................. 8.8 (0.52) 8.4 (0.49) 7.6 (0.48) 8.1 (0.52) 6.6 (0.49) 6.6 (0.49) 3.5 (0.36) 1.9 (0.25) 2.2 (0.27)Marijuana/hashish........... 35.8 (1.28) 38.5 (1.25) 37.5 (1.25) 37.8 (1.33) 36.5 (1.36) 37.0 (1.36) 36.2 (1.35) 34.9 (1.26) 34.3 (1.25)PCP ................................ 2.6 (0.16) 2.3 (0.15) 2.1 (0.14) 1.8 (0.14) 2.3 (0.16) 1.8 (0.14) 1.1 (0.11) 1.3 (0.11) 0.7 (0.08)
Percent reporting use of drugs in the past 30 days
Alcohol1 .............................. 50.8 (0.95) 52.7 (0.92) 52.0 (0.92) 51.0 (0.98) 50.0 (1.01) 49.8 (1.01) 48.6 (1.00) 47.5 (0.94) 48.0 (0.94)
Any illicit drug ..................... 24.6 (1.03) 26.2 (1.01) 25.6 (1.01) 25.9 (1.07) 24.9 (1.09) 25.7 (1.10) 25.4 (1.09) 24.1 (1.01) 23.4 (1.00)Marijuana only ................ 15.1 (0.85) 15.5 (0.83) 14.9 (0.82) 15.5 (0.88) 14.5 (0.89) 14.7 (0.89) 14.1 (0.87) 19.5 (0.93) 18.3 (0.91)Any illicit drug other than
marijuana2 ................ 9.5 (0.53) 10.7 (0.53) 10.7 (0.54) 10.4 (0.56) 10.4 (0.58) 11.0 (0.59) 11.3 (0.60) 10.4 (0.54) 10.8 (0.55)
Use of selected drugsCocaine........................... 2.0 (0.21) 2.3 (0.22) 2.4 (0.22) 2.6 (0.24) 2.1 (0.23) 2.1 (0.23) 2.3 (0.24) 2.1 (0.21) 2.3 (0.22)Heroin ............................. 0.5 (0.07) 0.5 (0.07) 0.5 (0.07) 0.5 (0.07) 0.7 (0.09) 0.4 (0.07) 0.5 (0.08) 0.4 (0.06) 0.5 (0.07)LSD................................. 2.5 (0.23) 3.1 (0.25) 3.2 (0.26) 2.7 (0.25) 1.6 (0.20) 2.3 (0.24) 0.7 (0.13) 0.6 (0.11) 0.7 (0.12)Marijuana/hashish........... 21.9 (0.98) 23.7 (0.98) 22.8 (0.97) 23.1 (1.03) 21.6 (1.04) 22.4 (1.05) 21.5 (1.03) 21.2 (0.96) 19.9 (0.94)PCP ................................ 1.3 (0.12) 0.7 (0.08) 1.0 (0.10) 0.8 (0.09) 0.9 (0.10) 0.5 (0.08) 0.4 (0.07) 0.6 (0.08) 0.4 (0.06)
DIGEST OF EDUCATION STATISTICS 2005
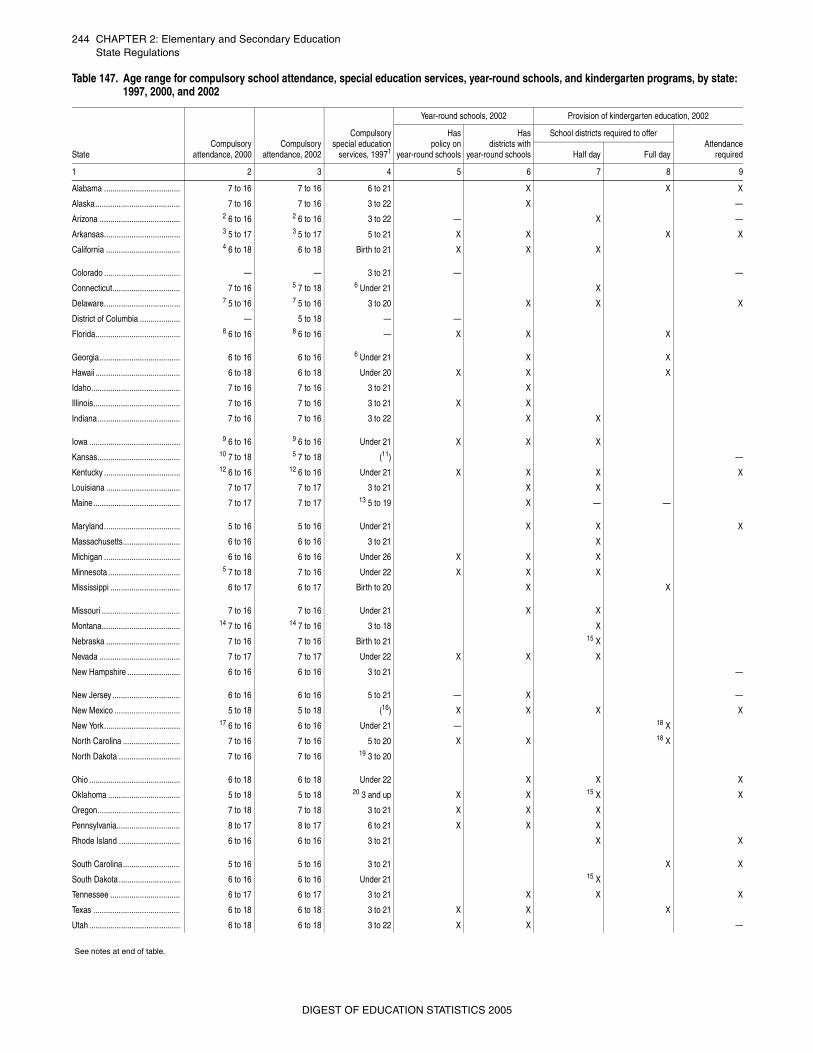
244 CHAPTER 2: Elementary and Secondary EducationState Regulations
ate Re
_St Table 147. Age range for compulsory school attendance, special education services, year-round schools, and kindergarten programs, by state: 1997, 2000, and 2002
StateCompulsory
attendance, 2000Compulsory
attendance, 2002
Compulsoryspecial education
services, 19971
Year-round schools, 2002 Provision of kindergarten education, 2002
Haspolicy on
year-round schools
Hasdistricts with
year-round schools
School districts required to offerAttendance
requiredHalf day Full day
1 2 3 4 5 6 7 8 9
Alabama .................................... 7 to 16 7 to 16 6 to 21 X X X
Alaska........................................ 7 to 16 7 to 16 3 to 22 X —
Arizona ...................................... 2 6 to 16 2 6 to 16 3 to 22 — X —
Arkansas.................................... 3 5 to 17 3 5 to 17 5 to 21 X X X X
California ................................... 4 6 to 18 6 to 18 Birth to 21 X X X
Colorado .................................... — — 3 to 21 — —
Connecticut................................ 7 to 16 5 7 to 18 6 Under 21 X
Delaware.................................... 7 5 to 16 7 5 to 16 3 to 20 X X X
District of Columbia ................... — 5 to 18 — —
Florida........................................ 8 6 to 16 8 6 to 16 — X X X
Georgia...................................... 6 to 16 6 to 16 6 Under 21 X X
Hawaii ........................................ 6 to 18 6 to 18 Under 20 X X X
Idaho.......................................... 7 to 16 7 to 16 3 to 21 X
Illinois......................................... 7 to 16 7 to 16 3 to 21 X X
Indiana....................................... 7 to 16 7 to 16 3 to 22 X X
Iowa ........................................... 9 6 to 16 9 6 to 16 Under 21 X X X
Kansas....................................... 10 7 to 18 5 7 to 18 (11) —
Kentucky .................................... 12 6 to 16 12 6 to 16 Under 21 X X X X
Louisiana ................................... 7 to 17 7 to 17 3 to 21 X X
Maine......................................... 7 to 17 7 to 17 13 5 to 19 X — —
Maryland.................................... 5 to 16 5 to 16 Under 21 X X X
Massachusetts........................... 6 to 16 6 to 16 3 to 21 X
Michigan .................................... 6 to 16 6 to 16 Under 26 X X X
Minnesota .................................. 5 7 to 18 7 to 16 Under 22 X X X
Mississippi ................................. 6 to 17 6 to 17 Birth to 20 X X
Missouri ..................................... 7 to 16 7 to 16 Under 21 X X
Montana..................................... 14 7 to 16 14 7 to 16 3 to 18 X
Nebraska ................................... 7 to 16 7 to 16 Birth to 21 15 X
Nevada ...................................... 7 to 17 7 to 17 Under 22 X X X
New Hampshire ......................... 6 to 16 6 to 16 3 to 21 —
New Jersey ................................ 6 to 16 6 to 16 5 to 21 — X —
New Mexico ............................... 5 to 18 5 to 18 (16) X X X X
New York.................................... 17 6 to 16 6 to 16 Under 21 — 18 X
North Carolina ........................... 7 to 16 7 to 16 5 to 20 X X 18 X
North Dakota ............................. 7 to 16 7 to 16 19 3 to 20
Ohio ........................................... 6 to 18 6 to 18 Under 22 X X X
Oklahoma .................................. 5 to 18 5 to 18 20 3 and up X X 15 X X
Oregon....................................... 7 to 18 7 to 18 3 to 21 X X X
Pennsylvania.............................. 8 to 17 8 to 17 6 to 21 X X X
Rhode Island ............................. 6 to 16 6 to 16 3 to 21 X X
South Carolina........................... 5 to 16 5 to 16 3 to 21 X X
South Dakota ............................. 6 to 16 6 to 16 Under 21 15 X
Tennessee ................................. 6 to 17 6 to 17 3 to 21 X X X
Texas ......................................... 6 to 18 6 to 18 3 to 21 X X X
Utah ........................................... 6 to 18 6 to 18 3 to 22 X X —
See notes at end of table.
DIGEST OF EDUCATION STATISTICS 2005
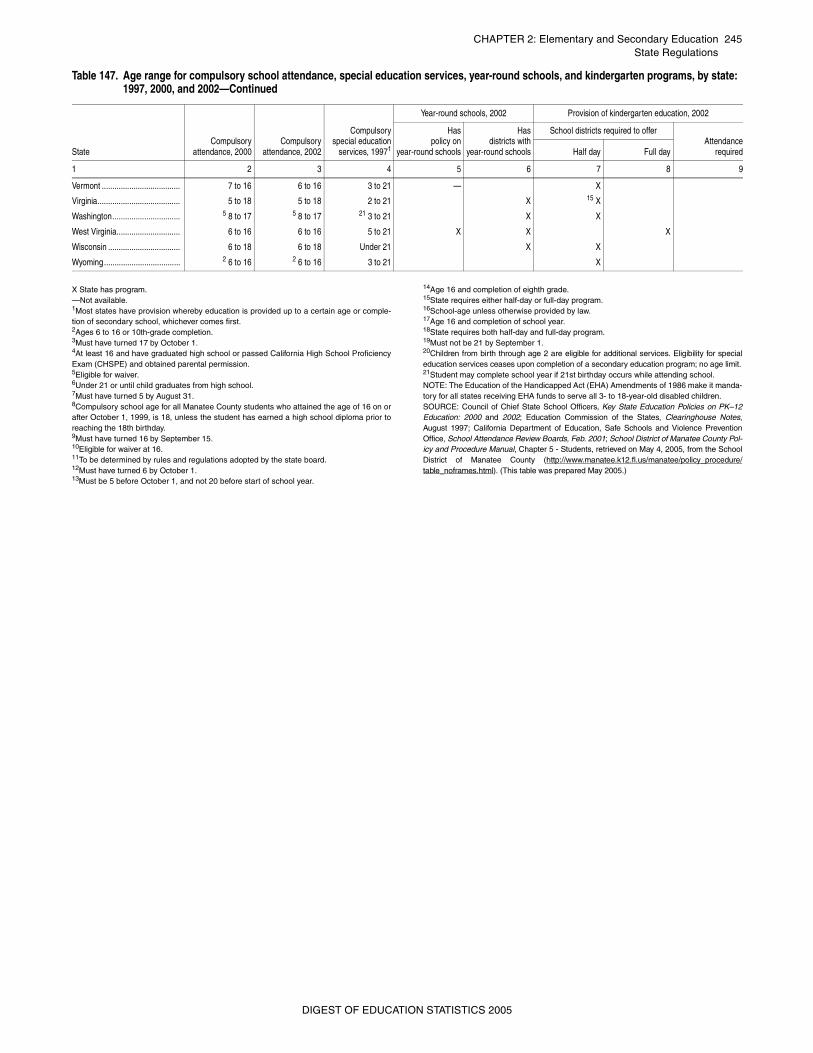
CHAPTER 2: Elementary and Secondary Education 245State Regulations
ate Re
X State has program.—Not available.1Most states have provision whereby education is provided up to a certain age or comple-tion of secondary school, whichever comes first.2Ages 6 to 16 or 10th-grade completion.3Must have turned 17 by October 1. 4At least 16 and have graduated high school or passed California High School ProficiencyExam (CHSPE) and obtained parental permission.5Eligible for waiver.6Under 21 or until child graduates from high school.7Must have turned 5 by August 31.8Compulsory school age for all Manatee County students who attained the age of 16 on orafter October 1, 1999, is 18, unless the student has earned a high school diploma prior toreaching the 18th birthday.9Must have turned 16 by September 15.10Eligible for waiver at 16.11To be determined by rules and regulations adopted by the state board.12Must have turned 6 by October 1.13Must be 5 before October 1, and not 20 before start of school year.
14Age 16 and completion of eighth grade.15State requires either half-day or full-day program. 16School-age unless otherwise provided by law.17Age 16 and completion of school year.18State requires both half-day and full-day program.19Must not be 21 by September 1.20Children from birth through age 2 are eligible for additional services. Eligibility for specialeducation services ceases upon completion of a secondary education program; no age limit.21Student may complete school year if 21st birthday occurs while attending school.NOTE: The Education of the Handicapped Act (EHA) Amendments of 1986 make it manda-tory for all states receiving EHA funds to serve all 3- to 18-year-old disabled children.SOURCE: Council of Chief State School Officers, Key State Education Policies on PK–12Education: 2000 and 2002; Education Commission of the States, Clearinghouse Notes,August 1997; California Department of Education, Safe Schools and Violence PreventionOffice, School Attendance Review Boards, Feb. 2001; School District of Manatee County Pol-icy and Procedure Manual, Chapter 5 - Students, retrieved on May 4, 2005, from the SchoolDistrict of Manatee County (http://www.manatee.k12.fl.us/manatee/policy_procedure/table_noframes.html). (This table was prepared May 2005.)
Vermont ..................................... 7 to 16 6 to 16 3 to 21 — X
Virginia....................................... 5 to 18 5 to 18 2 to 21 X 15 X
Washington................................ 5 8 to 17 5 8 to 17 21 3 to 21 X X
West Virginia.............................. 6 to 16 6 to 16 5 to 21 X X X
Wisconsin .................................. 6 to 18 6 to 18 Under 21 X X
Wyoming.................................... 2 6 to 16 2 6 to 16 3 to 21 X
St Table 147. Age range for compulsory school attendance, special education services, year-round schools, and kindergarten programs, by state: 1997, 2000, and 2002—Continued
StateCompulsory
attendance, 2000Compulsory
attendance, 2002
Compulsoryspecial education
services, 19971
Year-round schools, 2002 Provision of kindergarten education, 2002
Haspolicy on
year-round schools
Hasdistricts with
year-round schools
School districts required to offerAttendance
requiredHalf day Full day
1 2 3 4 5 6 7 8 9
DIGEST OF EDUCATION STATISTICS 2005
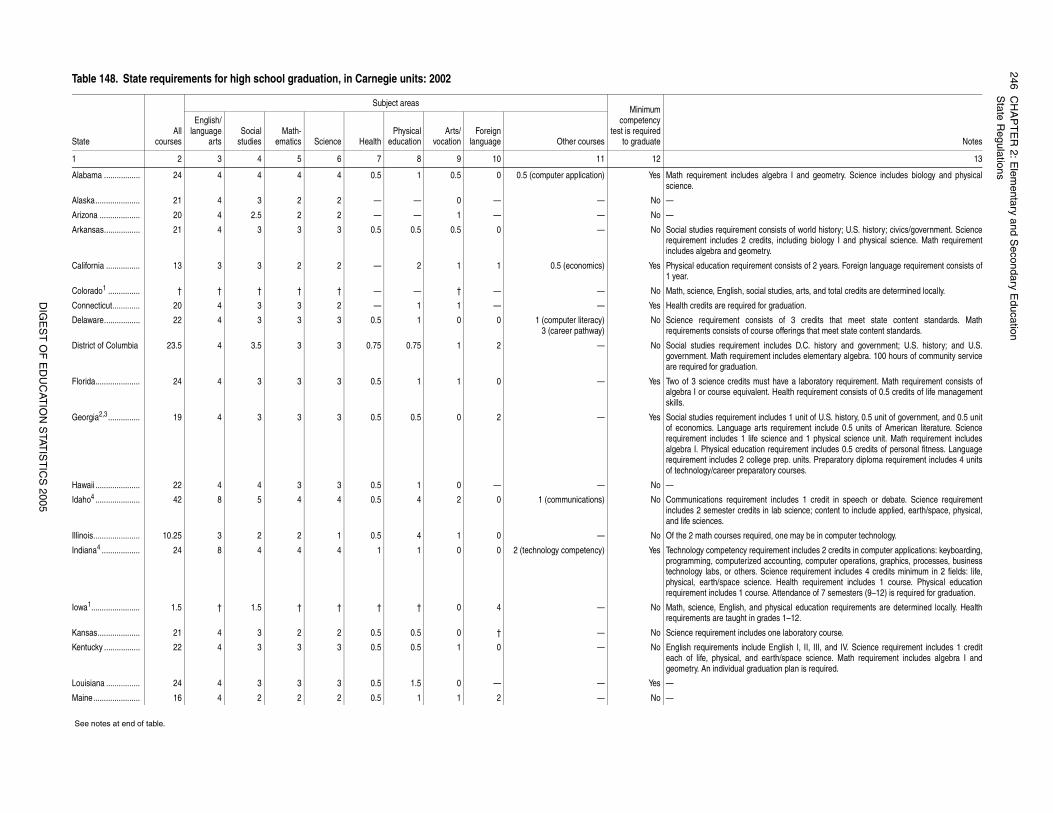
246C
HA
PT
ER
2: Elem
entary and Secondary E
ducationS
tate Regulations
DIG
ES
T O
F E
DU
CAT
ION
STAT
IST
ICS
2005
Notes
13
s algebra I and geometry. Science includes biology and physical
t consists of world history; U.S. history; civics/government. Scienceedits, including biology I and physical science. Math requirementetry.
ment consists of 2 years. Foreign language requirement consists of
cial studies, arts, and total credits are determined locally.
for graduation.
sists of 3 credits that meet state content standards. Mathourse offerings that meet state content standards.
t includes D.C. history and government; U.S. history; and U.S.ent includes elementary algebra. 100 hours of community service
.
ust have a laboratory requirement. Math requirement consists oflent. Health requirement consists of 0.5 credits of life management
includes 1 unit of U.S. history, 0.5 unit of government, and 0.5 unitarts requirement include 0.5 units of American literature. Science science and 1 physical science unit. Math requirement includes
ion requirement includes 0.5 credits of personal fitness. Languagellege prep. units. Preparatory diploma requirement includes 4 unitsratory courses.
ent includes 1 credit in speech or debate. Science requirements in lab science; content to include applied, earth/space, physical,
ired, one may be in computer technology.
quirement includes 2 credits in computer applications: keyboarding,d accounting, computer operations, graphics, processes, business. Science requirement includes 4 credits minimum in 2 fields: life,nce. Health requirement includes 1 course. Physical educationrse. Attendance of 7 semesters (9–12) is required for graduation.
d physical education requirements are determined locally. Health grades 1–12.
es one laboratory course.
de English I, II, III, and IV. Science requirement includes 1 credit earth/space science. Math requirement includes algebra I andduation plan is required.
Table 148. State requirements for high school graduation, in Carnegie units: 2002
StateAll
courses
Subject areasMinimum
competencytest is required
to graduate
English/language
artsSocial
studiesMath-
ematics Science HealthPhysical
educationArts/
vocationForeign
language Other courses
1 2 3 4 5 6 7 8 9 10 11 12
Alabama ................. 24 4 4 4 4 0.5 1 0.5 0 0.5 (computer application) Yes Math requirement includescience.
Alaska..................... 21 4 3 2 2 — — 0 — — No —
Arizona ................... 20 4 2.5 2 2 — — 1 — — No —
Arkansas................. 21 4 3 3 3 0.5 0.5 0.5 0 — No Social studies requiremenrequirement includes 2 crincludes algebra and geom
California ................ 13 3 3 2 2 — 2 1 1 0.5 (economics) Yes Physical education require1 year.
Colorado1 ............... † † † † † — — † — — No Math, science, English, so
Connecticut............. 20 4 3 3 2 — 1 1 — — Yes Health credits are required
Delaware................. 22 4 3 3 3 0.5 1 0 0 1 (computer literacy)3 (career pathway)
No Science requirement conrequirements consists of c
District of Columbia 23.5 4 3.5 3 3 0.75 0.75 1 2 — No Social studies requiremengovernment. Math requiremare required for graduation
Florida..................... 24 4 3 3 3 0.5 1 1 0 — Yes Two of 3 science credits malgebra I or course equivaskills.
Georgia2,3 ............... 19 4 3 3 3 0.5 0.5 0 2 — Yes Social studies requirementof economics. Language requirement includes 1 lifealgebra I. Physical educatrequirement includes 2 coof technology/career prepa
Hawaii ..................... 22 4 4 3 3 0.5 1 0 — — No —
Idaho4 ..................... 42 8 5 4 4 0.5 4 2 0 1 (communications) No Communications requiremincludes 2 semester creditand life sciences.
Illinois...................... 10.25 3 2 2 1 0.5 4 1 0 — No Of the 2 math courses requ
Indiana4 .................. 24 8 4 4 4 1 1 0 0 2 (technology competency) Yes Technology competency reprogramming, computerizetechnology labs, or othersphysical, earth/space scierequirement includes 1 cou
Iowa1....................... 1.5 † 1.5 † † † † 0 4 — No Math, science, English, anrequirements are taught in
Kansas.................... 21 4 3 2 2 0.5 0.5 0 † — No Science requirement includ
Kentucky ................. 22 4 3 3 3 0.5 0.5 1 0 — No English requirements inclueach of life, physical, andgeometry. An individual gra
Louisiana ................ 24 4 3 3 3 0.5 1.5 0 — — Yes —
Maine...................... 16 4 2 2 2 0.5 1 1 2 — No —
See notes at end of table.
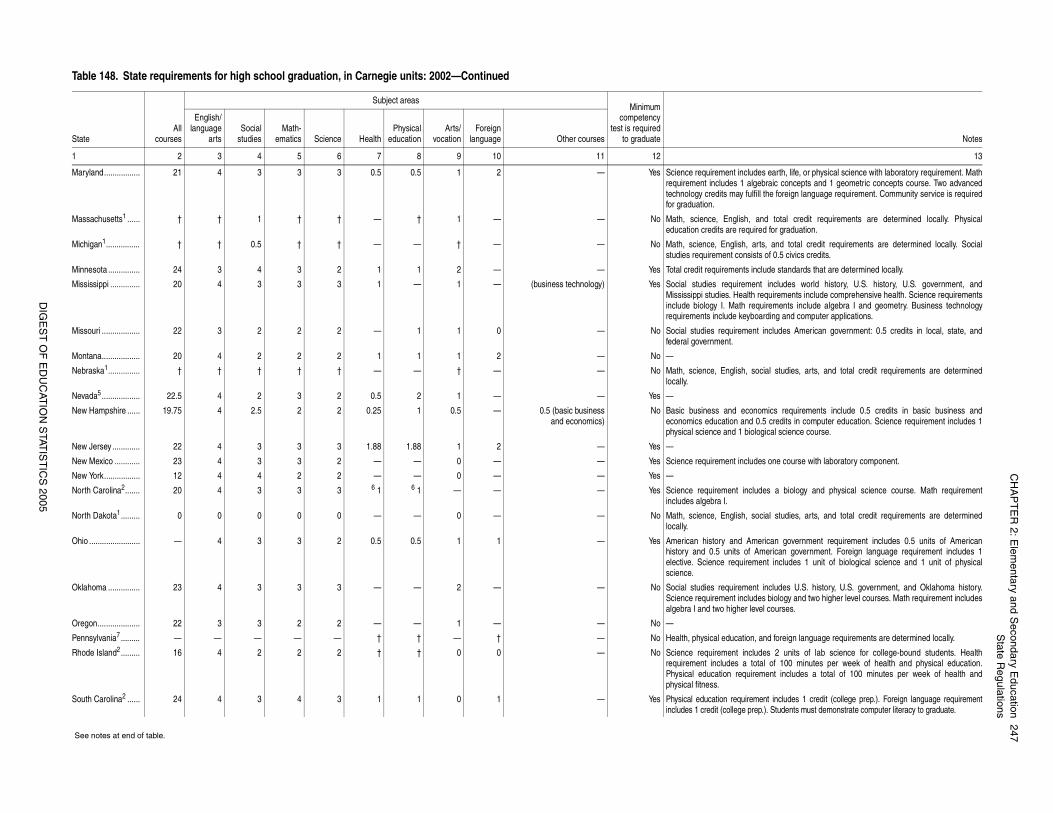
CH
AP
TE
R 2: E
lementary and S
econdary Education
247S
tate Regulations
DIG
ES
T O
F E
DU
CAT
ION
STAT
IST
ICS
2005
es earth, life, or physical science with laboratory requirement. Mathebraic concepts and 1 geometric concepts course. Two advancedill the foreign language requirement. Community service is required
and total credit requirements are determined locally. Physicalred for graduation.
rts, and total credit requirements are determined locally. Socialts of 0.5 civics credits.
clude standards that are determined locally.
nt includes world history, U.S. history, U.S. government, and requirements include comprehensive health. Science requirementsquirements include algebra I and geometry. Business technologyoarding and computer applications.
t includes American government: 0.5 credits in local, state, and
ocial studies, arts, and total credit requirements are determined
omics requirements include 0.5 credits in basic business and0.5 credits in computer education. Science requirement includes 1logical science course.
es one course with laboratory component.
des a biology and physical science course. Math requirement
ocial studies, arts, and total credit requirements are determined
erican government requirement includes 0.5 units of AmericanAmerican government. Foreign language requirement includes 1
ent includes 1 unit of biological science and 1 unit of physical
t includes U.S. history, U.S. government, and Oklahoma history.es biology and two higher level courses. Math requirement includes
vel courses.
, and foreign language requirements are determined locally.
des 2 units of lab science for college-bound students. Healthtal of 100 minutes per week of health and physical education.
ement includes a total of 100 minutes per week of health and
ent includes 1 credit (college prep.). Foreign language requirementp.). Students must demonstrate computer literacy to graduate.
Notes
13
Maryland................. 21 4 3 3 3 0.5 0.5 1 2 — Yes Science requirement includrequirement includes 1 algtechnology credits may fulffor graduation.
Massachusetts1 ...... † † 1 † † — † 1 — — No Math, science, English, education credits are requi
Michigan1................ † † 0.5 † † — — † — — No Math, science, English, astudies requirement consis
Minnesota ............... 24 3 4 3 2 1 1 2 — — Yes Total credit requirements in
Mississippi .............. 20 4 3 3 3 1 — 1 — (business technology) Yes Social studies requiremeMississippi studies. Healthinclude biology I. Math rerequirements include keyb
Missouri .................. 22 3 2 2 2 — 1 1 0 — No Social studies requiremenfederal government.
Montana.................. 20 4 2 2 2 1 1 1 2 — No —
Nebraska1............... † † † † † — — † — — No Math, science, English, slocally.
Nevada5.................. 22.5 4 2 3 2 0.5 2 1 — — Yes —
New Hampshire ...... 19.75 4 2.5 2 2 0.25 1 0.5 — 0.5 (basic businessand economics)
No Basic business and econeconomics education and physical science and 1 bio
New Jersey ............. 22 4 3 3 3 1.88 1.88 1 2 — Yes —
New Mexico ............ 23 4 3 3 2 — — 0 — — Yes Science requirement includ
New York................. 12 4 4 2 2 — — 0 — — Yes —
North Carolina2....... 20 4 3 3 3 6 1 6 1 — — — Yes Science requirement incluincludes algebra I.
North Dakota1......... 0 0 0 0 0 — — 0 — — No Math, science, English, slocally.
Ohio ........................ — 4 3 3 2 0.5 0.5 1 1 — Yes American history and Amhistory and 0.5 units of elective. Science requiremscience.
Oklahoma ............... 23 4 3 3 3 — — 2 — — No Social studies requiremenScience requirement includalgebra I and two higher le
Oregon.................... 22 3 3 2 2 — — 1 — — No —
Pennsylvania7 ......... — — — — — † † — † — No Health, physical education
Rhode Island2......... 16 4 2 2 2 † † 0 0 — No Science requirement inclurequirement includes a toPhysical education requirphysical fitness.
South Carolina2 ...... 24 4 3 4 3 1 1 0 1 — Yes Physical education requiremincludes 1 credit (college pre
See notes at end of table.
Table 148. State requirements for high school graduation, in Carnegie units: 2002—Continued
StateAll
courses
Subject areasMinimum
competencytest is required
to graduate
English/language
artsSocial
studiesMath-
ematics Science HealthPhysical
educationArts/
vocationForeign
language Other courses
1 2 3 4 5 6 7 8 9 10 11 12
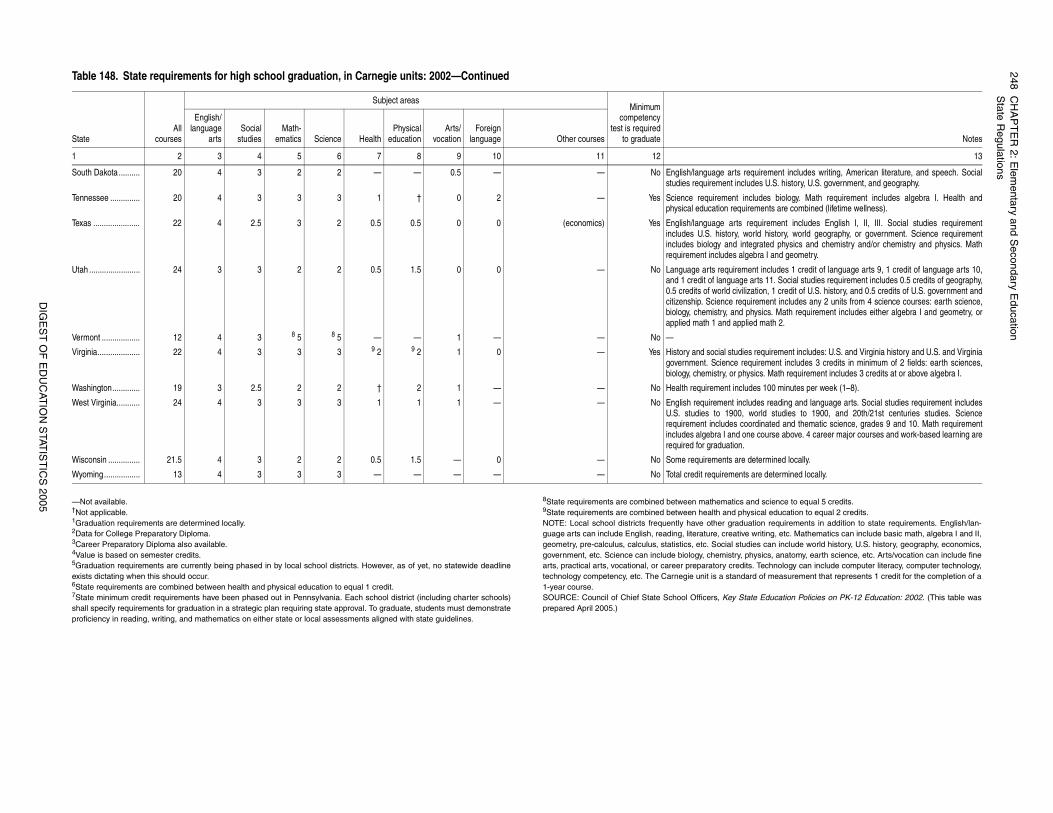
248C
HA
PT
ER
2: Elem
entary and Secondary E
ducationS
tate Regulations
DIG
ES
T O
F E
DU
CAT
ION
STAT
IST
ICS
2005 d science to equal 5 credits.ical education to equal 2 credits.ion requirements in addition to state requirements. English/lan-riting, etc. Mathematics can include basic math, algebra I and II,s can include world history, U.S. history, geography, economics,sics, anatomy, earth science, etc. Arts/vocation can include fine
Technology can include computer literacy, computer technology, of measurement that represents 1 credit for the completion of a
Education Policies on PK-12 Education: 2002. (This table was
uirement includes writing, American literature, and speech. Sociales U.S. history, U.S. government, and geography.
udes biology. Math requirement includes algebra I. Health andments are combined (lifetime wellness).
uirement includes English I, II, III. Social studies requirementld history, world geography, or government. Science requirementrated physics and chemistry and/or chemistry and physics. Mathra I and geometry.
t includes 1 credit of language arts 9, 1 credit of language arts 10,ts 11. Social studies requirement includes 0.5 credits of geography,
tion, 1 credit of U.S. history, and 0.5 credits of U.S. government andement includes any 2 units from 4 science courses: earth science,sics. Math requirement includes either algebra I and geometry, or math 2.
equirement includes: U.S. and Virginia history and U.S. and Virginiairement includes 3 credits in minimum of 2 fields: earth sciences,cs. Math requirement includes 3 credits at or above algebra I.
s 100 minutes per week (1–8).
es reading and language arts. Social studies requirement includesrld studies to 1900, and 20th/21st centuries studies. Science
dinated and thematic science, grades 9 and 10. Math requirement course above. 4 career major courses and work-based learning are
termined locally.
re determined locally.
Notes
13
—Not available.†Not applicable.1Graduation requirements are determined locally.2Data for College Preparatory Diploma.3Career Preparatory Diploma also available.4Value is based on semester credits.5Graduation requirements are currently being phased in by local school districts. However, as of yet, no statewide deadlineexists dictating when this should occur.6State requirements are combined between health and physical education to equal 1 credit.7State minimum credit requirements have been phased out in Pennsylvania. Each school district (including charter schools)shall specify requirements for graduation in a strategic plan requiring state approval. To graduate, students must demonstrateproficiency in reading, writing, and mathematics on either state or local assessments aligned with state guidelines.
8State requirements are combined between mathematics an9State requirements are combined between health and physNOTE: Local school districts frequently have other graduatguage arts can include English, reading, literature, creative wgeometry, pre-calculus, calculus, statistics, etc. Social studiegovernment, etc. Science can include biology, chemistry, phyarts, practical arts, vocational, or career preparatory credits.technology competency, etc. The Carnegie unit is a standard1-year course.SOURCE: Council of Chief State School Officers, Key Stateprepared April 2005.)
South Dakota .......... 20 4 3 2 2 — — 0.5 — — No English/language arts reqstudies requirement includ
Tennessee .............. 20 4 3 3 3 1 † 0 2 — Yes Science requirement inclphysical education require
Texas ...................... 22 4 2.5 3 2 0.5 0.5 0 0 (economics) Yes English/language arts reqincludes U.S. history, worincludes biology and integrequirement includes algeb
Utah ........................ 24 3 3 2 2 0.5 1.5 0 0 — No Language arts requiremenand 1 credit of language ar0.5 credits of world civilizacitizenship. Science requirbiology, chemistry, and phyapplied math 1 and applied
Vermont .................. 12 4 3 8 5 8 5 — — 1 — — No —
Virginia.................... 22 4 3 3 3 9 2 9 2 1 0 — Yes History and social studies rgovernment. Science requbiology, chemistry, or physi
Washington............. 19 3 2.5 2 2 † 2 1 — — No Health requirement include
West Virginia........... 24 4 3 3 3 1 1 1 — — No English requirement includU.S. studies to 1900, worequirement includes coorincludes algebra I and onerequired for graduation.
Wisconsin ............... 21.5 4 3 2 2 0.5 1.5 — 0 — No Some requirements are de
Wyoming................. 13 4 3 3 3 — — — — — No Total credit requirements a
Table 148. State requirements for high school graduation, in Carnegie units: 2002—Continued
StateAll
courses
Subject areasMinimum
competencytest is required
to graduate
English/language
artsSocial
studiesMath-
ematics Science HealthPhysical
educationArts/
vocationForeign
language Other courses
1 2 3 4 5 6 7 8 9 10 11 12
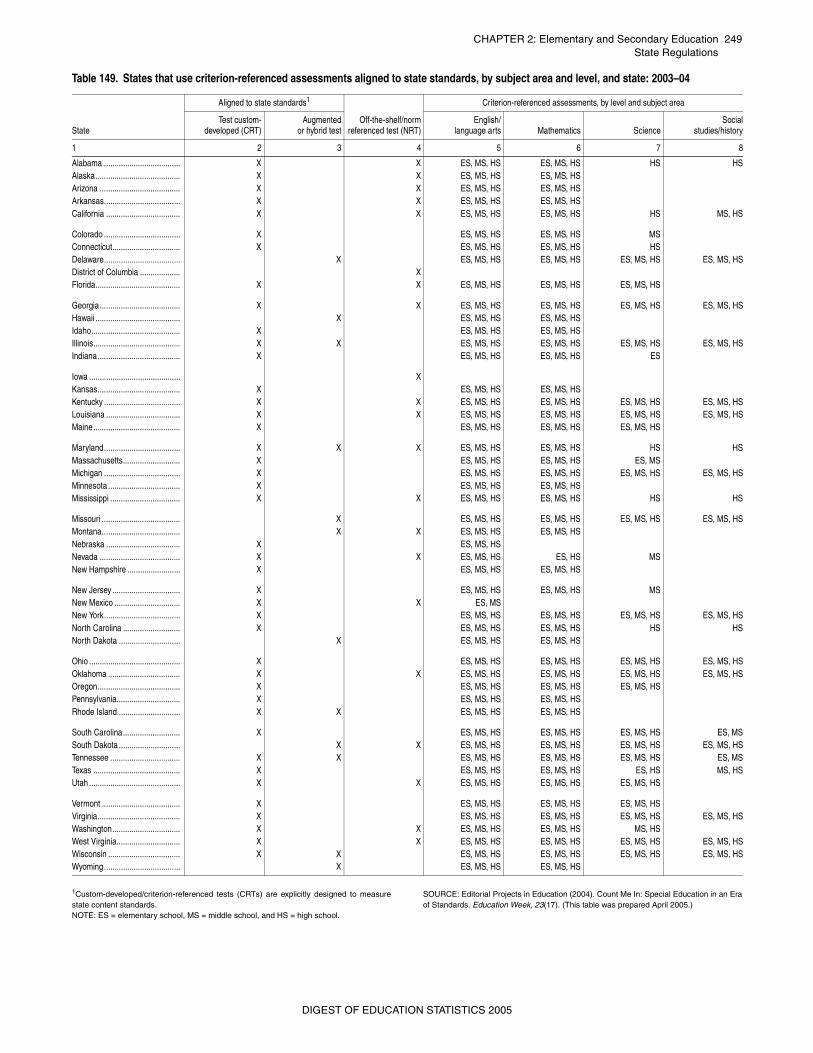
CHAPTER 2: Elementary and Secondary Education 249State Regulations
_
1Custom-developed/criterion-referenced tests (CRTs) are explicitly designed to measurestate content standards. NOTE: ES = elementary school, MS = middle school, and HS = high school.
SOURCE: Editorial Projects in Education (2004). Count Me In: Special Education in an Eraof Standards. Education Week, 23(17). (This table was prepared April 2005.)
Table 149. States that use criterion-referenced assessments aligned to state standards, by subject area and level, and state: 2003–04
State
Aligned to state standards1
Off-the-shelf/normreferenced test (NRT)
Criterion-referenced assessments, by level and subject area
Test custom-developed (CRT)
Augmentedor hybrid test
English/language arts Mathematics Science
Socialstudies/history
1 2 3 4 5 6 7 8
Alabama .................................... X X ES, MS, HS ES, MS, HS HS HSAlaska........................................ X X ES, MS, HS ES, MS, HSArizona ...................................... X X ES, MS, HS ES, MS, HSArkansas.................................... X X ES, MS, HS ES, MS, HSCalifornia ................................... X X ES, MS, HS ES, MS, HS HS MS, HS
Colorado .................................... X ES, MS, HS ES, MS, HS MSConnecticut................................ X ES, MS, HS ES, MS, HS HSDelaware.................................... X ES, MS, HS ES, MS, HS ES, MS, HS ES, MS, HSDistrict of Columbia ................... XFlorida........................................ X X ES, MS, HS ES, MS, HS ES, MS, HS
Georgia...................................... X X ES, MS, HS ES, MS, HS ES, MS, HS ES, MS, HSHawaii ........................................ X ES, MS, HS ES, MS, HSIdaho.......................................... X ES, MS, HS ES, MS, HSIllinois......................................... X X ES, MS, HS ES, MS, HS ES, MS, HS ES, MS, HSIndiana....................................... X ES, MS, HS ES, MS, HS ES
Iowa ........................................... XKansas....................................... X ES, MS, HS ES, MS, HSKentucky .................................... X X ES, MS, HS ES, MS, HS ES, MS, HS ES, MS, HSLouisiana ................................... X X ES, MS, HS ES, MS, HS ES, MS, HS ES, MS, HSMaine......................................... X ES, MS, HS ES, MS, HS ES, MS, HS
Maryland.................................... X X X ES, MS, HS ES, MS, HS HS HSMassachusetts........................... X ES, MS, HS ES, MS, HS ES, MSMichigan .................................... X ES, MS, HS ES, MS, HS ES, MS, HS ES, MS, HSMinnesota .................................. X ES, MS, HS ES, MS, HSMississippi ................................. X X ES, MS, HS ES, MS, HS HS HS
Missouri ..................................... X ES, MS, HS ES, MS, HS ES, MS, HS ES, MS, HSMontana..................................... X X ES, MS, HS ES, MS, HSNebraska ................................... X ES, MS, HSNevada ...................................... X X ES, MS, HS ES, HS MSNew Hampshire ......................... X ES, MS, HS ES, MS, HS
New Jersey ................................ X ES, MS, HS ES, MS, HS MSNew Mexico ............................... X X ES, MSNew York.................................... X ES, MS, HS ES, MS, HS ES, MS, HS ES, MS, HSNorth Carolina ........................... X ES, MS, HS ES, MS, HS HS HSNorth Dakota ............................. X ES, MS, HS ES, MS, HS
Ohio ........................................... X ES, MS, HS ES, MS, HS ES, MS, HS ES, MS, HSOklahoma .................................. X X ES, MS, HS ES, MS, HS ES, MS, HS ES, MS, HSOregon....................................... X ES, MS, HS ES, MS, HS ES, MS, HSPennsylvania.............................. X ES, MS, HS ES, MS, HSRhode Island ............................. X X ES, MS, HS ES, MS, HS
South Carolina........................... X ES, MS, HS ES, MS, HS ES, MS, HS ES, MSSouth Dakota ............................. X X ES, MS, HS ES, MS, HS ES, MS, HS ES, MS, HSTennessee ................................. X X ES, MS, HS ES, MS, HS ES, MS, HS ES, MSTexas ......................................... X ES, MS, HS ES, MS, HS ES, HS MS, HSUtah ........................................... X X ES, MS, HS ES, MS, HS ES, MS, HS
Vermont ..................................... X ES, MS, HS ES, MS, HS ES, MS, HSVirginia....................................... X ES, MS, HS ES, MS, HS ES, MS, HS ES, MS, HSWashington................................ X X ES, MS, HS ES, MS, HS MS, HSWest Virginia.............................. X X ES, MS, HS ES, MS, HS ES, MS, HS ES, MS, HSWisconsin .................................. X X ES, MS, HS ES, MS, HS ES, MS, HS ES, MS, HSWyoming.................................... X ES, MS, HS ES, MS, HS
DIGEST OF EDUCATION STATISTICS 2005
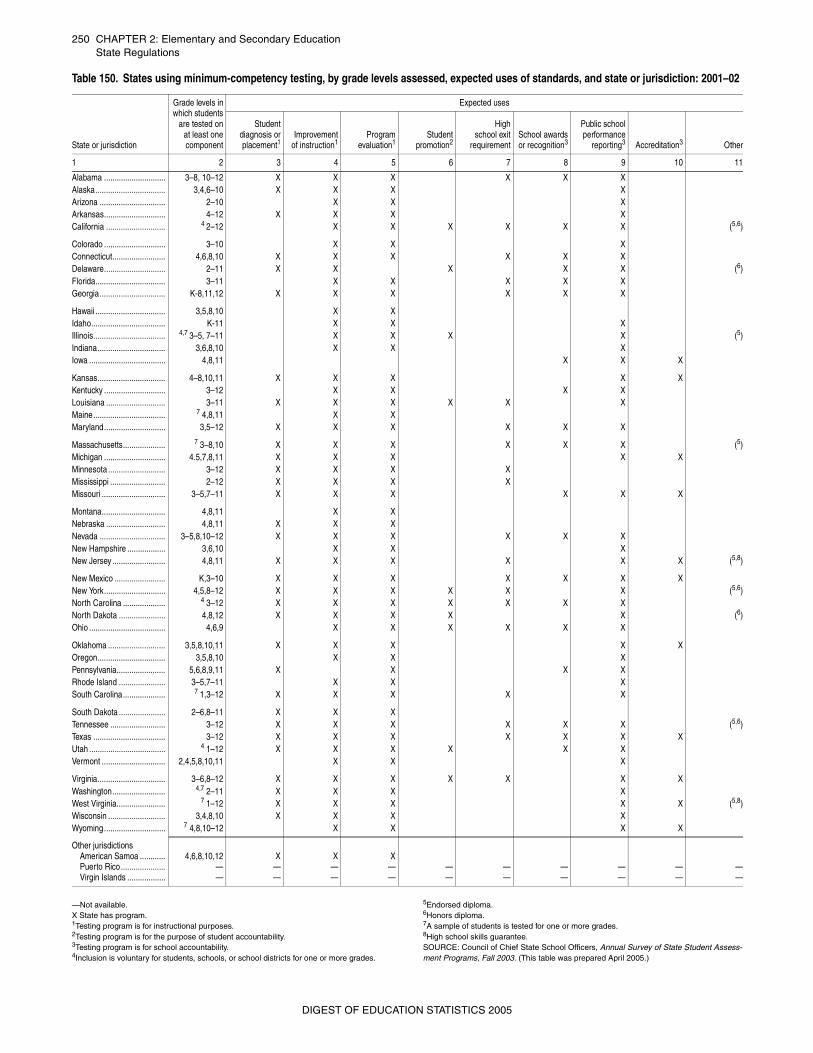
250 CHAPTER 2: Elementary and Secondary EducationState Regulations
—Not available.X State has program.1Testing program is for instructional purposes.2Testing program is for the purpose of student accountability.3Testing program is for school accountability.4Inclusion is voluntary for students, schools, or school districts for one or more grades.
5Endorsed diploma.6Honors diploma.7A sample of students is tested for one or more grades.8High school skills guarantee.SOURCE: Council of Chief State School Officers, Annual Survey of State Student Assess-ment Programs, Fall 2003. (This table was prepared April 2005.)
Table 150. States using minimum-competency testing, by grade levels assessed, expected uses of standards, and state or jurisdiction: 2001–02
State or jurisdiction
Grade levels inwhich students
are tested onat least onecomponent
Expected uses
Studentdiagnosis orplacement1
Improvementof instruction1
Programevaluation1
Studentpromotion2
Highschool exit
requirementSchool awardsor recognition3
Public schoolperformance
reporting3 Accreditation3 Other
1 2 3 4 5 6 7 8 9 10 11
Alabama ............................. 3–8, 10–12 X X X X X XAlaska................................. 3,4,6–10 X X X XArizona ............................... 2–10 X X XArkansas............................. 4–12 X X X XCalifornia ............................ 4 2–12 X X X X X X (5,6)
Colorado ............................. 3–10 X X XConnecticut......................... 4,6,8,10 X X X X X XDelaware............................. 2–11 X X X X X (6)Florida................................. 3–11 X X X X XGeorgia............................... K-8,11,12 X X X X X X
Hawaii ................................. 3,5,8,10 X XIdaho................................... K-11 X X XIllinois.................................. 4,7 3–5, 7–11 X X X X (5)Indiana................................ 3,6,8,10 X X XIowa .................................... 4,8,11 X X X
Kansas................................ 4–8,10,11 X X X X XKentucky ............................. 3–12 X X X XLouisiana ............................ 3–11 X X X X X XMaine.................................. 7 4,8,11 X XMaryland............................. 3,5–12 X X X X X X
Massachusetts.................... 7 3–8,10 X X X X X X (5)Michigan ............................. 4.5,7,8,11 X X X X XMinnesota ........................... 3–12 X X X XMississippi .......................... 2–12 X X X XMissouri .............................. 3–5,7–11 X X X X X X
Montana.............................. 4,8,11 X XNebraska ............................ 4,8,11 X X XNevada ............................... 3–5,8,10–12 X X X X X XNew Hampshire .................. 3,6,10 X X XNew Jersey ......................... 4,8,11 X X X X X X (5,8)
New Mexico ........................ K,3–10 X X X X X X XNew York............................. 4,5,8–12 X X X X X X (5,6)North Carolina .................... 4 3–12 X X X X X X XNorth Dakota ...................... 4,8,12 X X X X X (6)Ohio .................................... 4,6,9 X X X X X X
Oklahoma ........................... 3,5,8,10,11 X X X X XOregon................................ 3,5,8,10 X X XPennsylvania....................... 5,6,8,9,11 X X X XRhode Island ...................... 3–5,7–11 X X XSouth Carolina.................... 7 1,3–12 X X X X X
South Dakota ...................... 2–6,8–11 X X XTennessee .......................... 3–12 X X X X X X (5,6)Texas .................................. 3–12 X X X X X X XUtah .................................... 4 1–12 X X X X X XVermont .............................. 2,4,5,8,10,11 X X X
Virginia................................ 3–6,8–12 X X X X X X XWashington......................... 4,7 2–11 X X X XWest Virginia....................... 7 1–12 X X X X X (5,8)Wisconsin ........................... 3,4,8,10 X X X XWyoming............................. 7 4,8,10–12 X X X X
Other jurisdictionsAmerican Samoa ............ 4,6,8,10,12 X X XPuerto Rico ..................... — — — — — — — — — —Virgin Islands .................. — — — — — — — — — —
DIGEST OF EDUCATION STATISTICS 2005
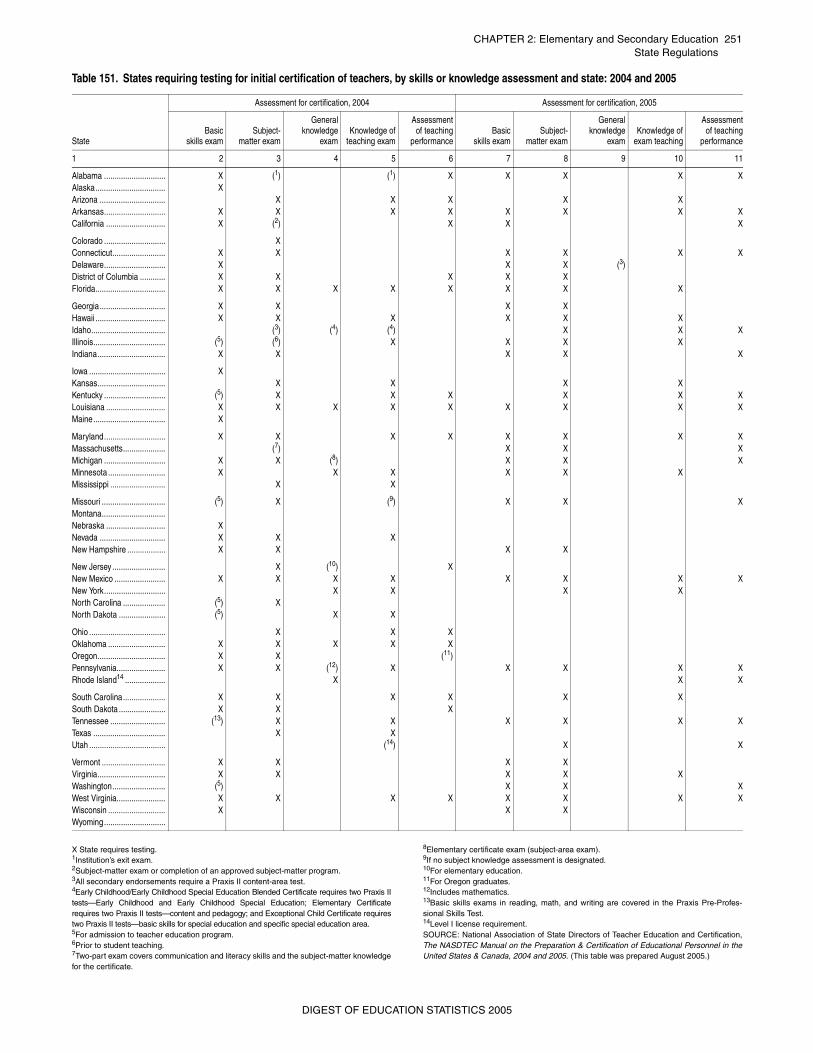
CHAPTER 2: Elementary and Secondary Education 251State Regulations
_
X State requires testing.1Institution’s exit exam.2Subject-matter exam or completion of an approved subject-matter program.3All secondary endorsements require a Praxis II content-area test.4Early Childhood/Early Childhood Special Education Blended Certificate requires two Praxis IItests—Early Childhood and Early Childhood Special Education; Elementary Certificaterequires two Praxis II tests—content and pedagogy; and Exceptional Child Certificate requirestwo Praxis II tests—basic skills for special education and specific special education area.5For admission to teacher education program.6Prior to student teaching.7Two-part exam covers communication and literacy skills and the subject-matter knowledgefor the certificate.
8Elementary certificate exam (subject-area exam).9If no subject knowledge assessment is designated.10For elementary education.11For Oregon graduates.12Includes mathematics.13Basic skills exams in reading, math, and writing are covered in the Praxis Pre-Profes-sional Skills Test.14Level I license requirement.SOURCE: National Association of State Directors of Teacher Education and Certification,The NASDTEC Manual on the Preparation & Certification of Educational Personnel in theUnited States & Canada, 2004 and 2005. (This table was prepared August 2005.)
Table 151. States requiring testing for initial certification of teachers, by skills or knowledge assessment and state: 2004 and 2005
State
Assessment for certification, 2004 Assessment for certification, 2005
Basicskills exam
Subject-matter exam
Generalknowledge
examKnowledge of
teaching exam
Assessmentof teaching
performanceBasic
skills examSubject-
matter exam
Generalknowledge
examKnowledge of
exam teaching
Assessmentof teaching
performance
1 2 3 4 5 6 7 8 9 10 11
Alabama ............................. X (1) (1) X X X X XAlaska................................. XArizona ............................... X X X X XArkansas............................. X X X X X X X XCalifornia ............................ X (2) X X X
Colorado ............................. XConnecticut......................... X X X X X XDelaware............................. X X X (3)District of Columbia ............ X X X X XFlorida................................. X X X X X X X X
Georgia............................... X X X XHawaii ................................. X X X X X XIdaho................................... (3) (4) (4) X X XIllinois.................................. (5) (6) X X X XIndiana................................ X X X X X
Iowa .................................... XKansas................................ X X X XKentucky ............................. (5) X X X X X XLouisiana ............................ X X X X X X X X XMaine.................................. X
Maryland............................. X X X X X X X XMassachusetts.................... (7) X X XMichigan ............................. X X (8) X X XMinnesota ........................... X X X X X XMississippi .......................... X X
Missouri .............................. (5) X (9) X X XMontana..............................Nebraska ............................ XNevada ............................... X X XNew Hampshire .................. X X X X
New Jersey ......................... X (10) XNew Mexico ........................ X X X X X X X XNew York............................. X X X XNorth Carolina .................... (5) XNorth Dakota ...................... (5) X X
Ohio .................................... X X XOklahoma ........................... X X X X XOregon................................ X X (11)Pennsylvania....................... X X (12) X X X X XRhode Island14 ................... X X X
South Carolina.................... X X X X X XSouth Dakota ...................... X X XTennessee .......................... (13) X X X X X XTexas .................................. X XUtah .................................... (14) X X
Vermont .............................. X X X XVirginia................................ X X X X XWashington......................... (5) X X XWest Virginia....................... X X X X X X X XWisconsin ........................... X X XWyoming.............................
DIGEST OF EDUCATION STATISTICS 2005
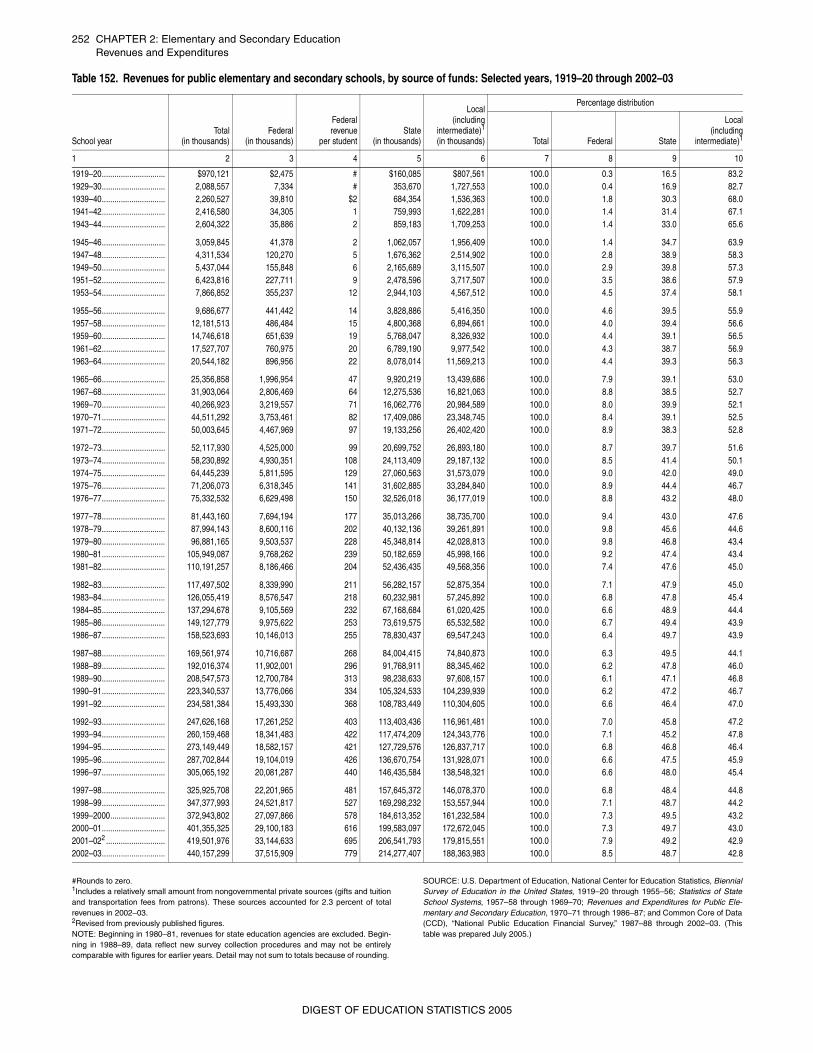
252 CHAPTER 2: Elementary and Secondary EducationRevenues and Expenditures
venues
#Rounds to zero.1Includes a relatively small amount from nongovernmental private sources (gifts and tuitionand transportation fees from patrons). These sources accounted for 2.3 percent of totalrevenues in 2002–03. 2Revised from previously published figures.NOTE: Beginning in 1980–81, revenues for state education agencies are excluded. Begin-ning in 1988–89, data reflect new survey collection procedures and may not be entirelycomparable with figures for earlier years. Detail may not sum to totals because of rounding.
SOURCE: U.S. Department of Education, National Center for Education Statistics, BiennialSurvey of Education in the United States, 1919–20 through 1955–56; Statistics of StateSchool Systems, 1957–58 through 1969–70; Revenues and Expenditures for Public Ele-mentary and Secondary Education, 1970–71 through 1986–87; and Common Core of Data(CCD), “National Public Education Financial Survey,” 1987–88 through 2002–03. (Thistable was prepared July 2005.)
ReTable 152. Revenues for public elementary and secondary schools, by source of funds: Selected years, 1919–20 through 2002–03
School yearTotal
(in thousands)Federal
(in thousands)
Federalrevenue
per studentState
(in thousands)
Local(including
intermediate)1
(in thousands)
Percentage distribution
Total Federal State
Local(including
intermediate)1
1 2 3 4 5 6 7 8 9 10
1919–20.............................. $970,121 $2,475 # $160,085 $807,561 100.0 0.3 16.5 83.21929–30.............................. 2,088,557 7,334 # 353,670 1,727,553 100.0 0.4 16.9 82.71939–40.............................. 2,260,527 39,810 $2 684,354 1,536,363 100.0 1.8 30.3 68.01941–42.............................. 2,416,580 34,305 1 759,993 1,622,281 100.0 1.4 31.4 67.11943–44.............................. 2,604,322 35,886 2 859,183 1,709,253 100.0 1.4 33.0 65.6
1945–46.............................. 3,059,845 41,378 2 1,062,057 1,956,409 100.0 1.4 34.7 63.91947–48.............................. 4,311,534 120,270 5 1,676,362 2,514,902 100.0 2.8 38.9 58.31949–50.............................. 5,437,044 155,848 6 2,165,689 3,115,507 100.0 2.9 39.8 57.31951–52.............................. 6,423,816 227,711 9 2,478,596 3,717,507 100.0 3.5 38.6 57.91953–54.............................. 7,866,852 355,237 12 2,944,103 4,567,512 100.0 4.5 37.4 58.1
1955–56.............................. 9,686,677 441,442 14 3,828,886 5,416,350 100.0 4.6 39.5 55.91957–58.............................. 12,181,513 486,484 15 4,800,368 6,894,661 100.0 4.0 39.4 56.61959–60.............................. 14,746,618 651,639 19 5,768,047 8,326,932 100.0 4.4 39.1 56.51961–62.............................. 17,527,707 760,975 20 6,789,190 9,977,542 100.0 4.3 38.7 56.91963–64.............................. 20,544,182 896,956 22 8,078,014 11,569,213 100.0 4.4 39.3 56.3
1965–66.............................. 25,356,858 1,996,954 47 9,920,219 13,439,686 100.0 7.9 39.1 53.01967–68.............................. 31,903,064 2,806,469 64 12,275,536 16,821,063 100.0 8.8 38.5 52.71969–70.............................. 40,266,923 3,219,557 71 16,062,776 20,984,589 100.0 8.0 39.9 52.11970–71.............................. 44,511,292 3,753,461 82 17,409,086 23,348,745 100.0 8.4 39.1 52.51971–72.............................. 50,003,645 4,467,969 97 19,133,256 26,402,420 100.0 8.9 38.3 52.8
1972–73.............................. 52,117,930 4,525,000 99 20,699,752 26,893,180 100.0 8.7 39.7 51.61973–74.............................. 58,230,892 4,930,351 108 24,113,409 29,187,132 100.0 8.5 41.4 50.11974–75.............................. 64,445,239 5,811,595 129 27,060,563 31,573,079 100.0 9.0 42.0 49.01975–76.............................. 71,206,073 6,318,345 141 31,602,885 33,284,840 100.0 8.9 44.4 46.71976–77.............................. 75,332,532 6,629,498 150 32,526,018 36,177,019 100.0 8.8 43.2 48.0
1977–78.............................. 81,443,160 7,694,194 177 35,013,266 38,735,700 100.0 9.4 43.0 47.61978–79.............................. 87,994,143 8,600,116 202 40,132,136 39,261,891 100.0 9.8 45.6 44.61979–80.............................. 96,881,165 9,503,537 228 45,348,814 42,028,813 100.0 9.8 46.8 43.41980–81.............................. 105,949,087 9,768,262 239 50,182,659 45,998,166 100.0 9.2 47.4 43.41981–82.............................. 110,191,257 8,186,466 204 52,436,435 49,568,356 100.0 7.4 47.6 45.0
1982–83.............................. 117,497,502 8,339,990 211 56,282,157 52,875,354 100.0 7.1 47.9 45.01983–84.............................. 126,055,419 8,576,547 218 60,232,981 57,245,892 100.0 6.8 47.8 45.41984–85.............................. 137,294,678 9,105,569 232 67,168,684 61,020,425 100.0 6.6 48.9 44.41985–86.............................. 149,127,779 9,975,622 253 73,619,575 65,532,582 100.0 6.7 49.4 43.91986–87.............................. 158,523,693 10,146,013 255 78,830,437 69,547,243 100.0 6.4 49.7 43.9
1987–88.............................. 169,561,974 10,716,687 268 84,004,415 74,840,873 100.0 6.3 49.5 44.11988–89.............................. 192,016,374 11,902,001 296 91,768,911 88,345,462 100.0 6.2 47.8 46.01989–90.............................. 208,547,573 12,700,784 313 98,238,633 97,608,157 100.0 6.1 47.1 46.81990–91.............................. 223,340,537 13,776,066 334 105,324,533 104,239,939 100.0 6.2 47.2 46.71991–92.............................. 234,581,384 15,493,330 368 108,783,449 110,304,605 100.0 6.6 46.4 47.0
1992–93.............................. 247,626,168 17,261,252 403 113,403,436 116,961,481 100.0 7.0 45.8 47.21993–94.............................. 260,159,468 18,341,483 422 117,474,209 124,343,776 100.0 7.1 45.2 47.81994–95.............................. 273,149,449 18,582,157 421 127,729,576 126,837,717 100.0 6.8 46.8 46.41995–96.............................. 287,702,844 19,104,019 426 136,670,754 131,928,071 100.0 6.6 47.5 45.91996–97.............................. 305,065,192 20,081,287 440 146,435,584 138,548,321 100.0 6.6 48.0 45.4
1997–98.............................. 325,925,708 22,201,965 481 157,645,372 146,078,370 100.0 6.8 48.4 44.81998–99.............................. 347,377,993 24,521,817 527 169,298,232 153,557,944 100.0 7.1 48.7 44.21999–2000.......................... 372,943,802 27,097,866 578 184,613,352 161,232,584 100.0 7.3 49.5 43.22000–01.............................. 401,355,325 29,100,183 616 199,583,097 172,672,045 100.0 7.3 49.7 43.02001–022 ............................ 419,501,976 33,144,633 695 206,541,793 179,815,551 100.0 7.9 49.2 42.92002–03.............................. 440,157,299 37,515,909 779 214,277,407 188,363,983 100.0 8.5 48.7 42.8
DIGEST OF EDUCATION STATISTICS 2005
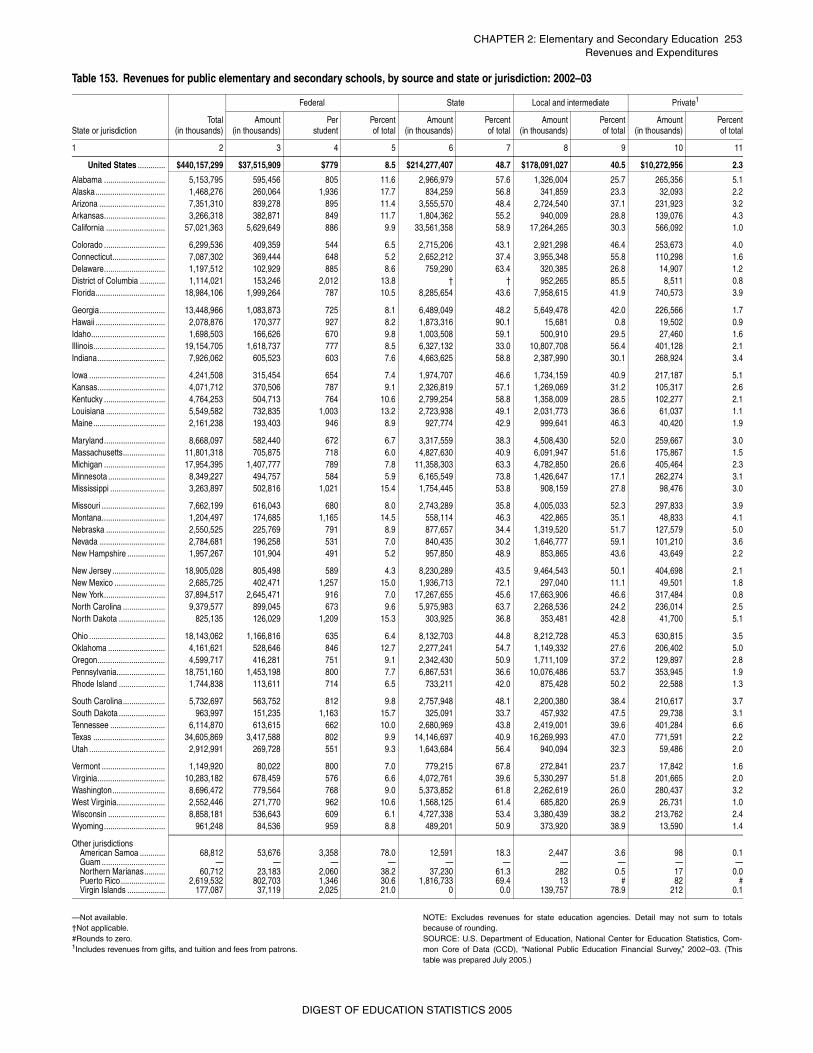
CHAPTER 2: Elementary and Secondary Education 253Revenues and Expenditures
—Not available.†Not applicable.#Rounds to zero.1Includes revenues from gifts, and tuition and fees from patrons.
NOTE: Excludes revenues for state education agencies. Detail may not sum to totalsbecause of rounding.SOURCE: U.S. Department of Education, National Center for Education Statistics, Com-mon Core of Data (CCD), “National Public Education Financial Survey,” 2002–03. (Thistable was prepared July 2005.)
Table 153. Revenues for public elementary and secondary schools, by source and state or jurisdiction: 2002–03
State or jurisdictionTotal
(in thousands)
Federal State Local and intermediate Private1
Amount(in thousands)
Perstudent
Percentof total
Amount(in thousands)
Percentof total
Amount(in thousands)
Percentof total
Amount(in thousands)
Percentof total
1 2 3 4 5 6 7 8 9 10 11
United States ............. $440,157,299 $37,515,909 $779 8.5 $214,277,407 48.7 $178,091,027 40.5 $10,272,956 2.3
Alabama ............................. 5,153,795 595,456 805 11.6 2,966,979 57.6 1,326,004 25.7 265,356 5.1Alaska................................. 1,468,276 260,064 1,936 17.7 834,259 56.8 341,859 23.3 32,093 2.2Arizona ............................... 7,351,310 839,278 895 11.4 3,555,570 48.4 2,724,540 37.1 231,923 3.2Arkansas............................. 3,266,318 382,871 849 11.7 1,804,362 55.2 940,009 28.8 139,076 4.3California ............................ 57,021,363 5,629,649 886 9.9 33,561,358 58.9 17,264,265 30.3 566,092 1.0
Colorado ............................. 6,299,536 409,359 544 6.5 2,715,206 43.1 2,921,298 46.4 253,673 4.0Connecticut......................... 7,087,302 369,444 648 5.2 2,652,212 37.4 3,955,348 55.8 110,298 1.6Delaware............................. 1,197,512 102,929 885 8.6 759,290 63.4 320,385 26.8 14,907 1.2District of Columbia ............ 1,114,021 153,246 2,012 13.8 † † 952,265 85.5 8,511 0.8Florida................................. 18,984,106 1,999,264 787 10.5 8,285,654 43.6 7,958,615 41.9 740,573 3.9
Georgia............................... 13,448,966 1,083,873 725 8.1 6,489,049 48.2 5,649,478 42.0 226,566 1.7Hawaii ................................. 2,078,876 170,377 927 8.2 1,873,316 90.1 15,681 0.8 19,502 0.9Idaho................................... 1,698,503 166,626 670 9.8 1,003,508 59.1 500,910 29.5 27,460 1.6Illinois.................................. 19,154,705 1,618,737 777 8.5 6,327,132 33.0 10,807,708 56.4 401,128 2.1Indiana................................ 7,926,062 605,523 603 7.6 4,663,625 58.8 2,387,990 30.1 268,924 3.4
Iowa .................................... 4,241,508 315,454 654 7.4 1,974,707 46.6 1,734,159 40.9 217,187 5.1Kansas................................ 4,071,712 370,506 787 9.1 2,326,819 57.1 1,269,069 31.2 105,317 2.6Kentucky ............................. 4,764,253 504,713 764 10.6 2,799,254 58.8 1,358,009 28.5 102,277 2.1Louisiana ............................ 5,549,582 732,835 1,003 13.2 2,723,938 49.1 2,031,773 36.6 61,037 1.1Maine.................................. 2,161,238 193,403 946 8.9 927,774 42.9 999,641 46.3 40,420 1.9
Maryland............................. 8,668,097 582,440 672 6.7 3,317,559 38.3 4,508,430 52.0 259,667 3.0Massachusetts.................... 11,801,318 705,875 718 6.0 4,827,630 40.9 6,091,947 51.6 175,867 1.5Michigan ............................. 17,954,395 1,407,777 789 7.8 11,358,303 63.3 4,782,850 26.6 405,464 2.3Minnesota ........................... 8,349,227 494,757 584 5.9 6,165,549 73.8 1,426,647 17.1 262,274 3.1Mississippi .......................... 3,263,897 502,816 1,021 15.4 1,754,445 53.8 908,159 27.8 98,476 3.0
Missouri .............................. 7,662,199 616,043 680 8.0 2,743,289 35.8 4,005,033 52.3 297,833 3.9Montana.............................. 1,204,497 174,685 1,165 14.5 558,114 46.3 422,865 35.1 48,833 4.1Nebraska ............................ 2,550,525 225,769 791 8.9 877,657 34.4 1,319,520 51.7 127,579 5.0Nevada ............................... 2,784,681 196,258 531 7.0 840,435 30.2 1,646,777 59.1 101,210 3.6New Hampshire .................. 1,957,267 101,904 491 5.2 957,850 48.9 853,865 43.6 43,649 2.2
New Jersey ......................... 18,905,028 805,498 589 4.3 8,230,289 43.5 9,464,543 50.1 404,698 2.1New Mexico ........................ 2,685,725 402,471 1,257 15.0 1,936,713 72.1 297,040 11.1 49,501 1.8New York............................. 37,894,517 2,645,471 916 7.0 17,267,655 45.6 17,663,906 46.6 317,484 0.8North Carolina .................... 9,379,577 899,045 673 9.6 5,975,983 63.7 2,268,536 24.2 236,014 2.5North Dakota ...................... 825,135 126,029 1,209 15.3 303,925 36.8 353,481 42.8 41,700 5.1
Ohio .................................... 18,143,062 1,166,816 635 6.4 8,132,703 44.8 8,212,728 45.3 630,815 3.5Oklahoma ........................... 4,161,621 528,646 846 12.7 2,277,241 54.7 1,149,332 27.6 206,402 5.0Oregon................................ 4,599,717 416,281 751 9.1 2,342,430 50.9 1,711,109 37.2 129,897 2.8Pennsylvania....................... 18,751,160 1,453,198 800 7.7 6,867,531 36.6 10,076,486 53.7 353,945 1.9Rhode Island ...................... 1,744,838 113,611 714 6.5 733,211 42.0 875,428 50.2 22,588 1.3
South Carolina.................... 5,732,697 563,752 812 9.8 2,757,948 48.1 2,200,380 38.4 210,617 3.7South Dakota ...................... 963,997 151,235 1,163 15.7 325,091 33.7 457,932 47.5 29,738 3.1Tennessee .......................... 6,114,870 613,615 662 10.0 2,680,969 43.8 2,419,001 39.6 401,284 6.6Texas .................................. 34,605,869 3,417,588 802 9.9 14,146,697 40.9 16,269,993 47.0 771,591 2.2Utah .................................... 2,912,991 269,728 551 9.3 1,643,684 56.4 940,094 32.3 59,486 2.0
Vermont .............................. 1,149,920 80,022 800 7.0 779,215 67.8 272,841 23.7 17,842 1.6Virginia................................ 10,283,182 678,459 576 6.6 4,072,761 39.6 5,330,297 51.8 201,665 2.0Washington......................... 8,696,472 779,564 768 9.0 5,373,852 61.8 2,262,619 26.0 280,437 3.2West Virginia....................... 2,552,446 271,770 962 10.6 1,568,125 61.4 685,820 26.9 26,731 1.0Wisconsin ........................... 8,858,181 536,643 609 6.1 4,727,338 53.4 3,380,439 38.2 213,762 2.4Wyoming............................. 961,248 84,536 959 8.8 489,201 50.9 373,920 38.9 13,590 1.4
Other jurisdictionsAmerican Samoa ............ 68,812 53,676 3,358 78.0 12,591 18.3 2,447 3.6 98 0.1Guam .............................. — — — — — — — — — —Northern Marianas.......... 60,712 23,183 2,060 38.2 37,230 61.3 282 0.5 17 0.0Puerto Rico ..................... 2,619,532 802,703 1,346 30.6 1,816,733 69.4 13 # 82 #Virgin Islands .................. 177,087 37,119 2,025 21.0 0 0.0 139,757 78.9 212 0.1
DIGEST OF EDUCATION STATISTICS 2005
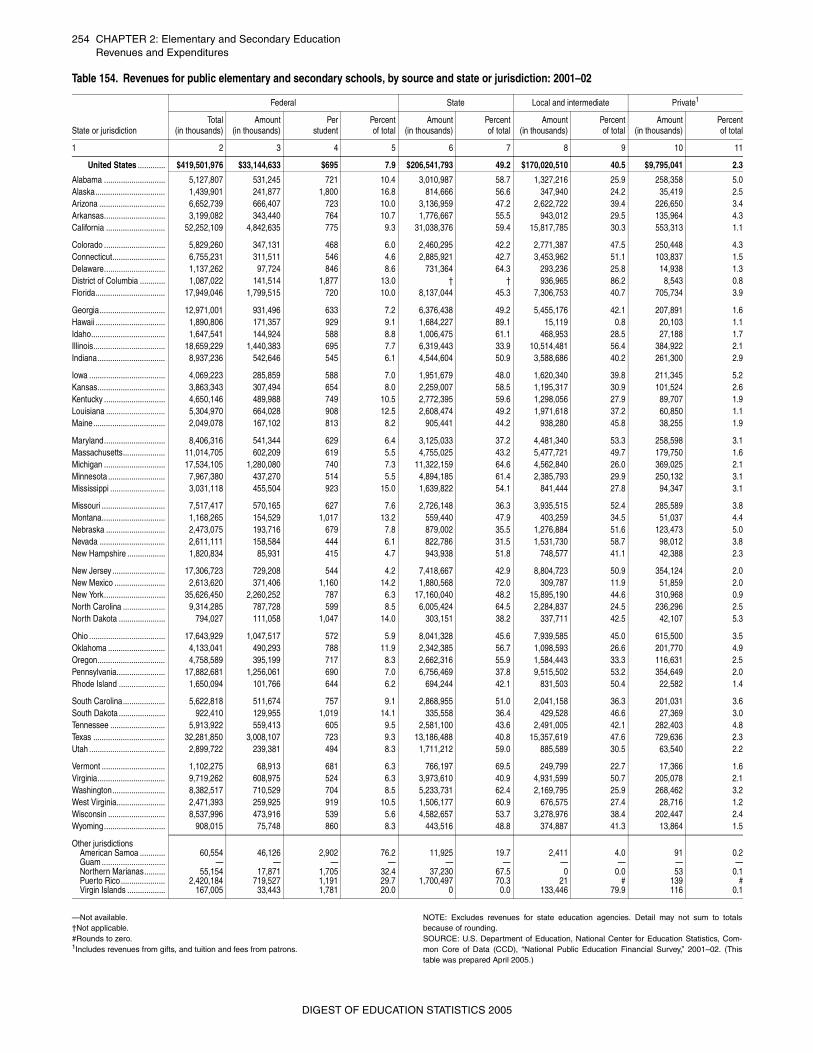
254 CHAPTER 2: Elementary and Secondary EducationRevenues and Expenditures
—Not available.†Not applicable.#Rounds to zero.1Includes revenues from gifts, and tuition and fees from patrons.
NOTE: Excludes revenues for state education agencies. Detail may not sum to totalsbecause of rounding.SOURCE: U.S. Department of Education, National Center for Education Statistics, Com-mon Core of Data (CCD), “National Public Education Financial Survey,” 2001–02. (Thistable was prepared April 2005.)
Table 154. Revenues for public elementary and secondary schools, by source and state or jurisdiction: 2001–02
State or jurisdiction
Federal State Local and intermediate Private1
Total(in thousands)
Amount(in thousands)
Perstudent
Percentof total
Amount(in thousands)
Percentof total
Amount(in thousands)
Percentof total
Amount(in thousands)
Percentof total
1 2 3 4 5 6 7 8 9 10 11
United States ............. $419,501,976 $33,144,633 $695 7.9 $206,541,793 49.2 $170,020,510 40.5 $9,795,041 2.3
Alabama ............................. 5,127,807 531,245 721 10.4 3,010,987 58.7 1,327,216 25.9 258,358 5.0Alaska................................. 1,439,901 241,877 1,800 16.8 814,666 56.6 347,940 24.2 35,419 2.5Arizona ............................... 6,652,739 666,407 723 10.0 3,136,959 47.2 2,622,722 39.4 226,650 3.4Arkansas............................. 3,199,082 343,440 764 10.7 1,776,667 55.5 943,012 29.5 135,964 4.3California ............................ 52,252,109 4,842,635 775 9.3 31,038,376 59.4 15,817,785 30.3 553,313 1.1
Colorado ............................. 5,829,260 347,131 468 6.0 2,460,295 42.2 2,771,387 47.5 250,448 4.3Connecticut......................... 6,755,231 311,511 546 4.6 2,885,921 42.7 3,453,962 51.1 103,837 1.5Delaware............................. 1,137,262 97,724 846 8.6 731,364 64.3 293,236 25.8 14,938 1.3District of Columbia ............ 1,087,022 141,514 1,877 13.0 † † 936,965 86.2 8,543 0.8Florida................................. 17,949,046 1,799,515 720 10.0 8,137,044 45.3 7,306,753 40.7 705,734 3.9
Georgia............................... 12,971,001 931,496 633 7.2 6,376,438 49.2 5,455,176 42.1 207,891 1.6Hawaii ................................. 1,890,806 171,357 929 9.1 1,684,227 89.1 15,119 0.8 20,103 1.1Idaho................................... 1,647,541 144,924 588 8.8 1,006,475 61.1 468,953 28.5 27,188 1.7Illinois.................................. 18,659,229 1,440,383 695 7.7 6,319,443 33.9 10,514,481 56.4 384,922 2.1Indiana................................ 8,937,236 542,646 545 6.1 4,544,604 50.9 3,588,686 40.2 261,300 2.9
Iowa .................................... 4,069,223 285,859 588 7.0 1,951,679 48.0 1,620,340 39.8 211,345 5.2Kansas................................ 3,863,343 307,494 654 8.0 2,259,007 58.5 1,195,317 30.9 101,524 2.6Kentucky ............................. 4,650,146 489,988 749 10.5 2,772,395 59.6 1,298,056 27.9 89,707 1.9Louisiana ............................ 5,304,970 664,028 908 12.5 2,608,474 49.2 1,971,618 37.2 60,850 1.1Maine.................................. 2,049,078 167,102 813 8.2 905,441 44.2 938,280 45.8 38,255 1.9
Maryland............................. 8,406,316 541,344 629 6.4 3,125,033 37.2 4,481,340 53.3 258,598 3.1Massachusetts.................... 11,014,705 602,209 619 5.5 4,755,025 43.2 5,477,721 49.7 179,750 1.6Michigan ............................. 17,534,105 1,280,080 740 7.3 11,322,159 64.6 4,562,840 26.0 369,025 2.1Minnesota ........................... 7,967,380 437,270 514 5.5 4,894,185 61.4 2,385,793 29.9 250,132 3.1Mississippi .......................... 3,031,118 455,504 923 15.0 1,639,822 54.1 841,444 27.8 94,347 3.1
Missouri .............................. 7,517,417 570,165 627 7.6 2,726,148 36.3 3,935,515 52.4 285,589 3.8Montana.............................. 1,168,265 154,529 1,017 13.2 559,440 47.9 403,259 34.5 51,037 4.4Nebraska ............................ 2,473,075 193,716 679 7.8 879,002 35.5 1,276,884 51.6 123,473 5.0Nevada ............................... 2,611,111 158,584 444 6.1 822,786 31.5 1,531,730 58.7 98,012 3.8New Hampshire .................. 1,820,834 85,931 415 4.7 943,938 51.8 748,577 41.1 42,388 2.3
New Jersey ......................... 17,306,723 729,208 544 4.2 7,418,667 42.9 8,804,723 50.9 354,124 2.0New Mexico ........................ 2,613,620 371,406 1,160 14.2 1,880,568 72.0 309,787 11.9 51,859 2.0New York............................. 35,626,450 2,260,252 787 6.3 17,160,040 48.2 15,895,190 44.6 310,968 0.9North Carolina .................... 9,314,285 787,728 599 8.5 6,005,424 64.5 2,284,837 24.5 236,296 2.5North Dakota ...................... 794,027 111,058 1,047 14.0 303,151 38.2 337,711 42.5 42,107 5.3
Ohio .................................... 17,643,929 1,047,517 572 5.9 8,041,328 45.6 7,939,585 45.0 615,500 3.5Oklahoma ........................... 4,133,041 490,293 788 11.9 2,342,385 56.7 1,098,593 26.6 201,770 4.9Oregon................................ 4,758,589 395,199 717 8.3 2,662,316 55.9 1,584,443 33.3 116,631 2.5Pennsylvania....................... 17,882,681 1,256,061 690 7.0 6,756,469 37.8 9,515,502 53.2 354,649 2.0Rhode Island ...................... 1,650,094 101,766 644 6.2 694,244 42.1 831,503 50.4 22,582 1.4
South Carolina.................... 5,622,818 511,674 757 9.1 2,868,955 51.0 2,041,158 36.3 201,031 3.6South Dakota ...................... 922,410 129,955 1,019 14.1 335,558 36.4 429,528 46.6 27,369 3.0Tennessee .......................... 5,913,922 559,413 605 9.5 2,581,100 43.6 2,491,005 42.1 282,403 4.8Texas .................................. 32,281,850 3,008,107 723 9.3 13,186,488 40.8 15,357,619 47.6 729,636 2.3Utah .................................... 2,899,722 239,381 494 8.3 1,711,212 59.0 885,589 30.5 63,540 2.2
Vermont .............................. 1,102,275 68,913 681 6.3 766,197 69.5 249,799 22.7 17,366 1.6Virginia................................ 9,719,262 608,975 524 6.3 3,973,610 40.9 4,931,599 50.7 205,078 2.1Washington......................... 8,382,517 710,529 704 8.5 5,233,731 62.4 2,169,795 25.9 268,462 3.2West Virginia....................... 2,471,393 259,925 919 10.5 1,506,177 60.9 676,575 27.4 28,716 1.2Wisconsin ........................... 8,537,996 473,916 539 5.6 4,582,657 53.7 3,278,976 38.4 202,447 2.4Wyoming............................. 908,015 75,748 860 8.3 443,516 48.8 374,887 41.3 13,864 1.5
Other jurisdictionsAmerican Samoa ............ 60,554 46,126 2,902 76.2 11,925 19.7 2,411 4.0 91 0.2Guam .............................. — — — — — — — — — —Northern Marianas.......... 55,154 17,871 1,705 32.4 37,230 67.5 0 0.0 53 0.1Puerto Rico ..................... 2,420,184 719,527 1,191 29.7 1,700,497 70.3 21 # 139 #Virgin Islands .................. 167,005 33,443 1,781 20.0 0 0.0 133,446 79.9 116 0.1
DIGEST OF EDUCATION STATISTICS 2005
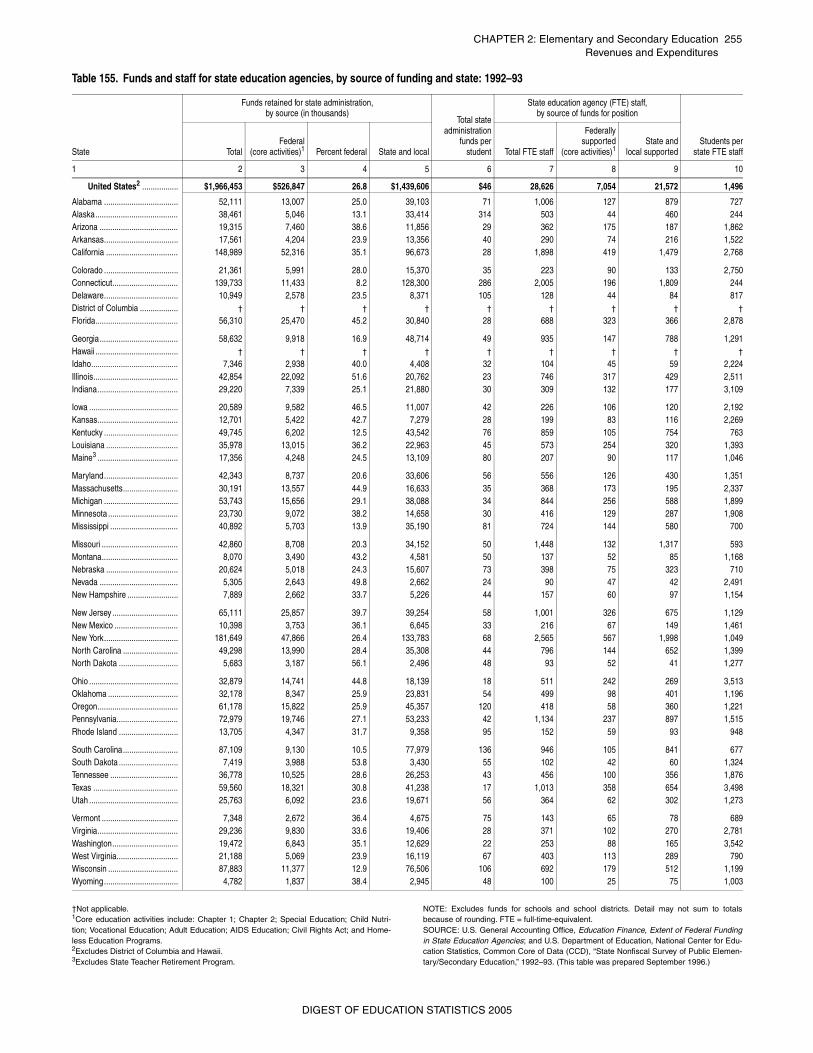
CHAPTER 2: Elementary and Secondary Education 255Revenues and Expenditures
†Not applicable.1Core education activities include: Chapter 1; Chapter 2; Special Education; Child Nutri-tion; Vocational Education; Adult Education; AIDS Education; Civil Rights Act; and Home-less Education Programs.2Excludes District of Columbia and Hawaii.3Excludes State Teacher Retirement Program.
NOTE: Excludes funds for schools and school districts. Detail may not sum to totalsbecause of rounding. FTE = full-time-equivalent.SOURCE: U.S. General Accounting Office, Education Finance, Extent of Federal Fundingin State Education Agencies; and U.S. Department of Education, National Center for Edu-cation Statistics, Common Core of Data (CCD), “State Nonfiscal Survey of Public Elemen-tary/Secondary Education,” 1992–93. (This table was prepared September 1996.)
Table 155. Funds and staff for state education agencies, by source of funding and state: 1992–93
State
Funds retained for state administration, by source (in thousands)
Total stateadministration
funds perstudent
State education agency (FTE) staff, by source of funds for position
Students perstate FTE staffTotal
Federal(core activities)1 Percent federal State and local Total FTE staff
Federallysupported
(core activities)1State and
local supported
1 2 3 4 5 6 7 8 9 10
United States2 ................. $1,966,453 $526,847 26.8 $1,439,606 $46 28,626 7,054 21,572 1,496
Alabama ................................... 52,111 13,007 25.0 39,103 71 1,006 127 879 727Alaska....................................... 38,461 5,046 13.1 33,414 314 503 44 460 244Arizona ..................................... 19,315 7,460 38.6 11,856 29 362 175 187 1,862Arkansas................................... 17,561 4,204 23.9 13,356 40 290 74 216 1,522California .................................. 148,989 52,316 35.1 96,673 28 1,898 419 1,479 2,768
Colorado ................................... 21,361 5,991 28.0 15,370 35 223 90 133 2,750Connecticut............................... 139,733 11,433 8.2 128,300 286 2,005 196 1,809 244Delaware................................... 10,949 2,578 23.5 8,371 105 128 44 84 817District of Columbia .................. † † † † † † † † †
Florida....................................... 56,310 25,470 45.2 30,840 28 688 323 366 2,878
Georgia..................................... 58,632 9,918 16.9 48,714 49 935 147 788 1,291Hawaii ....................................... † † † † † † † † †
Idaho......................................... 7,346 2,938 40.0 4,408 32 104 45 59 2,224Illinois........................................ 42,854 22,092 51.6 20,762 23 746 317 429 2,511Indiana...................................... 29,220 7,339 25.1 21,880 30 309 132 177 3,109
Iowa .......................................... 20,589 9,582 46.5 11,007 42 226 106 120 2,192Kansas...................................... 12,701 5,422 42.7 7,279 28 199 83 116 2,269Kentucky ................................... 49,745 6,202 12.5 43,542 76 859 105 754 763Louisiana .................................. 35,978 13,015 36.2 22,963 45 573 254 320 1,393Maine3 ...................................... 17,356 4,248 24.5 13,109 80 207 90 117 1,046
Maryland................................... 42,343 8,737 20.6 33,606 56 556 126 430 1,351Massachusetts.......................... 30,191 13,557 44.9 16,633 35 368 173 195 2,337Michigan ................................... 53,743 15,656 29.1 38,088 34 844 256 588 1,899Minnesota ................................. 23,730 9,072 38.2 14,658 30 416 129 287 1,908Mississippi ................................ 40,892 5,703 13.9 35,190 81 724 144 580 700
Missouri .................................... 42,860 8,708 20.3 34,152 50 1,448 132 1,317 593Montana.................................... 8,070 3,490 43.2 4,581 50 137 52 85 1,168Nebraska .................................. 20,624 5,018 24.3 15,607 73 398 75 323 710Nevada ..................................... 5,305 2,643 49.8 2,662 24 90 47 42 2,491New Hampshire ........................ 7,889 2,662 33.7 5,226 44 157 60 97 1,154
New Jersey ............................... 65,111 25,857 39.7 39,254 58 1,001 326 675 1,129New Mexico .............................. 10,398 3,753 36.1 6,645 33 216 67 149 1,461New York................................... 181,649 47,866 26.4 133,783 68 2,565 567 1,998 1,049North Carolina .......................... 49,298 13,990 28.4 35,308 44 796 144 652 1,399North Dakota ............................ 5,683 3,187 56.1 2,496 48 93 52 41 1,277
Ohio .......................................... 32,879 14,741 44.8 18,139 18 511 242 269 3,513Oklahoma ................................. 32,178 8,347 25.9 23,831 54 499 98 401 1,196Oregon...................................... 61,178 15,822 25.9 45,357 120 418 58 360 1,221Pennsylvania............................. 72,979 19,746 27.1 53,233 42 1,134 237 897 1,515Rhode Island ............................ 13,705 4,347 31.7 9,358 95 152 59 93 948
South Carolina.......................... 87,109 9,130 10.5 77,979 136 946 105 841 677South Dakota ............................ 7,419 3,988 53.8 3,430 55 102 42 60 1,324Tennessee ................................ 36,778 10,525 28.6 26,253 43 456 100 356 1,876Texas ........................................ 59,560 18,321 30.8 41,238 17 1,013 358 654 3,498Utah .......................................... 25,763 6,092 23.6 19,671 56 364 62 302 1,273
Vermont .................................... 7,348 2,672 36.4 4,675 75 143 65 78 689Virginia...................................... 29,236 9,830 33.6 19,406 28 371 102 270 2,781Washington............................... 19,472 6,843 35.1 12,629 22 253 88 165 3,542West Virginia............................. 21,188 5,069 23.9 16,119 67 403 113 289 790Wisconsin ................................. 87,883 11,377 12.9 76,506 106 692 179 512 1,199Wyoming................................... 4,782 1,837 38.4 2,945 48 100 25 75 1,003
DIGEST OF EDUCATION STATISTICS 2005
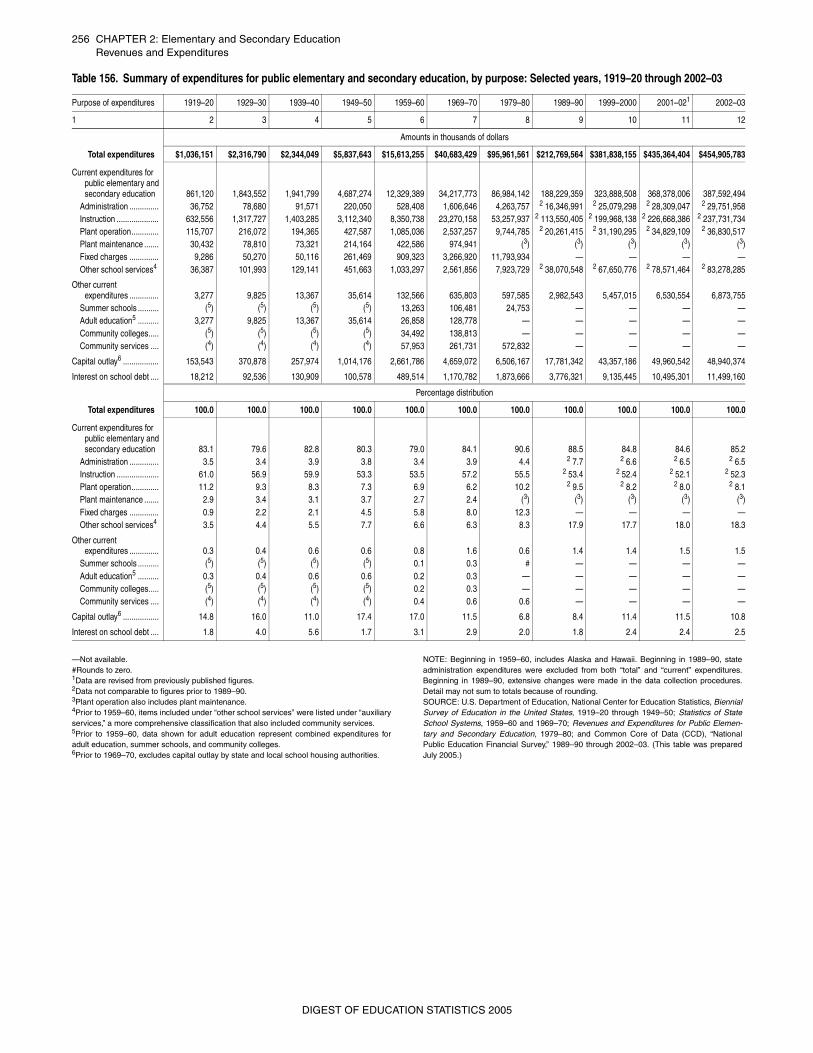
256 CHAPTER 2: Elementary and Secondary EducationRevenues and Expenditures
—Not available. #Rounds to zero. 1Data are revised from previously published figures. 2Data not comparable to figures prior to 1989–90. 3Plant operation also includes plant maintenance. 4Prior to 1959–60, items included under “other school services” were listed under “auxiliaryservices,” a more comprehensive classification that also included community services. 5Prior to 1959–60, data shown for adult education represent combined expenditures foradult education, summer schools, and community colleges. 6Prior to 1969–70, excludes capital outlay by state and local school housing authorities.
NOTE: Beginning in 1959–60, includes Alaska and Hawaii. Beginning in 1989–90, stateadministration expenditures were excluded from both “total” and “current” expenditures.Beginning in 1989–90, extensive changes were made in the data collection procedures.Detail may not sum to totals because of rounding.SOURCE: U.S. Department of Education, National Center for Education Statistics, BiennialSurvey of Education in the United States, 1919–20 through 1949–50; Statistics of StateSchool Systems, 1959–60 and 1969–70; Revenues and Expenditures for Public Elemen-tary and Secondary Education, 1979–80; and Common Core of Data (CCD), “NationalPublic Education Financial Survey,” 1989–90 through 2002–03. (This table was preparedJuly 2005.)
Table 156. Summary of expenditures for public elementary and secondary education, by purpose: Selected years, 1919–20 through 2002–03
Purpose of expenditures 1919–20 1929–30 1939–40 1949–50 1959–60 1969–70 1979–80 1989–90 1999–2000 2001–021 2002–03
1 2 3 4 5 6 7 8 9 10 11 12
Amounts in thousands of dollars
Total expenditures $1,036,151 $2,316,790 $2,344,049 $5,837,643 $15,613,255 $40,683,429 $95,961,561 $212,769,564 $381,838,155 $435,364,404 $454,905,783
Current expenditures for public elementary and secondary education 861,120 1,843,552 1,941,799 4,687,274 12,329,389 34,217,773 86,984,142 188,229,359 323,888,508 368,378,006 387,592,494
Administration .............. 36,752 78,680 91,571 220,050 528,408 1,606,646 4,263,757 2 16,346,991 2 25,079,298 2 28,309,047 2 29,751,958Instruction .................... 632,556 1,317,727 1,403,285 3,112,340 8,350,738 23,270,158 53,257,937 2 113,550,405 2 199,968,138 2 226,668,386 2 237,731,734Plant operation............. 115,707 216,072 194,365 427,587 1,085,036 2,537,257 9,744,785 2 20,261,415 2 31,190,295 2 34,829,109 2 36,830,517Plant maintenance ....... 30,432 78,810 73,321 214,164 422,586 974,941 (3) (3) (3) (3) (3)Fixed charges .............. 9,286 50,270 50,116 261,469 909,323 3,266,920 11,793,934 — — — —Other school services4 36,387 101,993 129,141 451,663 1,033,297 2,561,856 7,923,729 2 38,070,548 2 67,650,776 2 78,571,464 2 83,278,285
Other current expenditures .............. 3,277 9,825 13,367 35,614 132,566 635,803 597,585 2,982,543 5,457,015 6,530,554 6,873,755
Summer schools .......... (5) (5) (5) (5) 13,263 106,481 24,753 — — — —Adult education5 .......... 3,277 9,825 13,367 35,614 26,858 128,778 — — — — —Community colleges..... (5) (5) (5) (5) 34,492 138,813 — — — — —Community services .... (4) (4) (4) (4) 57,953 261,731 572,832 — — — —
Capital outlay6 ................. 153,543 370,878 257,974 1,014,176 2,661,786 4,659,072 6,506,167 17,781,342 43,357,186 49,960,542 48,940,374
Interest on school debt .... 18,212 92,536 130,909 100,578 489,514 1,170,782 1,873,666 3,776,321 9,135,445 10,495,301 11,499,160
Percentage distribution
Total expenditures 100.0 100.0 100.0 100.0 100.0 100.0 100.0 100.0 100.0 100.0 100.0
Current expenditures for public elementary and secondary education 83.1 79.6 82.8 80.3 79.0 84.1 90.6 88.5 84.8 84.6 85.2
Administration .............. 3.5 3.4 3.9 3.8 3.4 3.9 4.4 2 7.7 2 6.6 2 6.5 2 6.5Instruction .................... 61.0 56.9 59.9 53.3 53.5 57.2 55.5 2 53.4 2 52.4 2 52.1 2 52.3Plant operation............. 11.2 9.3 8.3 7.3 6.9 6.2 10.2 2 9.5 2 8.2 2 8.0 2 8.1Plant maintenance ....... 2.9 3.4 3.1 3.7 2.7 2.4 (3) (3) (3) (3) (3)Fixed charges .............. 0.9 2.2 2.1 4.5 5.8 8.0 12.3 — — — —Other school services4 3.5 4.4 5.5 7.7 6.6 6.3 8.3 17.9 17.7 18.0 18.3
Other current expenditures .............. 0.3 0.4 0.6 0.6 0.8 1.6 0.6 1.4 1.4 1.5 1.5
Summer schools .......... (5) (5) (5) (5) 0.1 0.3 # — — — —Adult education5 .......... 0.3 0.4 0.6 0.6 0.2 0.3 — — — — —Community colleges..... (5) (5) (5) (5) 0.2 0.3 — — — — —Community services .... (4) (4) (4) (4) 0.4 0.6 0.6 — — — —
Capital outlay6 ................. 14.8 16.0 11.0 17.4 17.0 11.5 6.8 8.4 11.4 11.5 10.8
Interest on school debt .... 1.8 4.0 5.6 1.7 3.1 2.9 2.0 1.8 2.4 2.4 2.5
DIGEST OF EDUCATION STATISTICS 2005
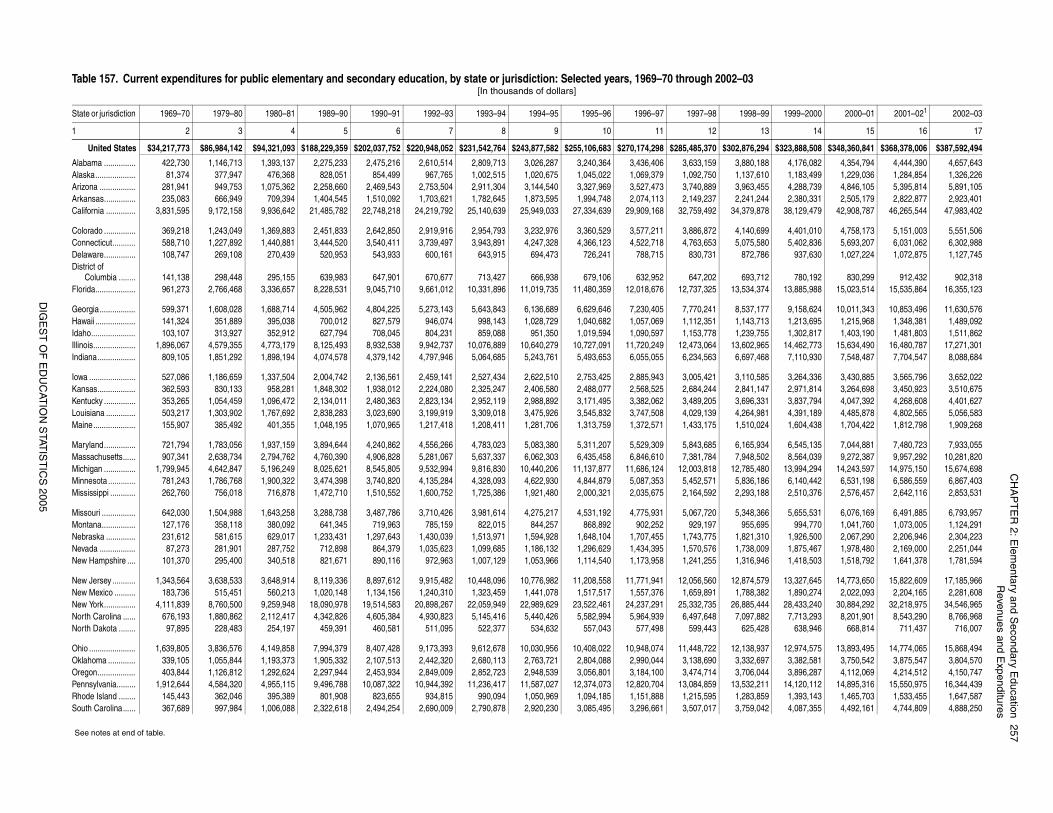
CH
AP
TE
R 2: E
lementary and S
econdary Education
257R
evenues and Expenditures
DIG
ES
T O
F E
DU
CAT
ION
STAT
IST
ICS
2005
–99 1999–2000 2000–01 2001–021 2002–03
13 14 15 16 17
,294 $323,888,508 $348,360,841 $368,378,006 $387,592,494
,188 4,176,082 4,354,794 4,444,390 4,657,643610 1,183,499 1,229,036 1,284,854 1,326,226
,455 4,288,739 4,846,105 5,395,814 5,891,105,244 2,380,331 2,505,179 2,822,877 2,923,401,878 38,129,479 42,908,787 46,265,544 47,983,402
,699 4,401,010 4,758,173 5,151,003 5,551,506,580 5,402,836 5,693,207 6,031,062 6,302,988786 937,630 1,027,224 1,072,875 1,127,745
,712 780,192 830,299 912,432 902,318,374 13,885,988 15,023,514 15,535,864 16,355,123
,177 9,158,624 10,011,343 10,853,496 11,630,576713 1,213,695 1,215,968 1,348,381 1,489,092755 1,302,817 1,403,190 1,481,803 1,511,862
,965 14,462,773 15,634,490 16,480,787 17,271,301,468 7,110,930 7,548,487 7,704,547 8,088,684
,585 3,264,336 3,430,885 3,565,796 3,652,022,147 2,971,814 3,264,698 3,450,923 3,510,675,331 3,837,794 4,047,392 4,268,608 4,401,627,981 4,391,189 4,485,878 4,802,565 5,056,583,024 1,604,438 1,704,422 1,812,798 1,909,268
,934 6,545,135 7,044,881 7,480,723 7,933,055,502 8,564,039 9,272,387 9,957,292 10,281,820,480 13,994,294 14,243,597 14,975,150 15,674,698,186 6,140,442 6,531,198 6,586,559 6,867,403,188 2,510,376 2,576,457 2,642,116 2,853,531
,366 5,655,531 6,076,169 6,491,885 6,793,957695 994,770 1,041,760 1,073,005 1,124,291
,310 1,926,500 2,067,290 2,206,946 2,304,223009 1,875,467 1,978,480 2,169,000 2,251,044
,946 1,418,503 1,518,792 1,641,378 1,781,594
,579 13,327,645 14,773,650 15,822,609 17,185,966,382 1,890,274 2,022,093 2,204,165 2,281,608,444 28,433,240 30,884,292 32,218,975 34,546,965,882 7,713,293 8,201,901 8,543,290 8,766,968,428 638,946 668,814 711,437 716,007
,937 12,974,575 13,893,495 14,774,065 15,868,494,697 3,382,581 3,750,542 3,875,547 3,804,570,044 3,896,287 4,112,069 4,214,512 4,150,747,211 14,120,112 14,895,316 15,550,975 16,344,439,859 1,393,143 1,465,703 1,533,455 1,647,587,042 4,087,355 4,492,161 4,744,809 4,888,250
Table 157. Current expenditures for public elementary and secondary education, by state or jurisdiction: Selected years, 1969–70 through 2002–03[In thousands of dollars]
State or jurisdiction 1969–70 1979–80 1980–81 1989–90 1990–91 1992–93 1993–94 1994–95 1995–96 1996–97 1997–98 1998
1 2 3 4 5 6 7 8 9 10 11 12
United States $34,217,773 $86,984,142 $94,321,093 $188,229,359 $202,037,752 $220,948,052 $231,542,764 $243,877,582 $255,106,683 $270,174,298 $285,485,370 $302,876
Alabama ............... 422,730 1,146,713 1,393,137 2,275,233 2,475,216 2,610,514 2,809,713 3,026,287 3,240,364 3,436,406 3,633,159 3,880Alaska................... 81,374 377,947 476,368 828,051 854,499 967,765 1,002,515 1,020,675 1,045,022 1,069,379 1,092,750 1,137,Arizona ................. 281,941 949,753 1,075,362 2,258,660 2,469,543 2,753,504 2,911,304 3,144,540 3,327,969 3,527,473 3,740,889 3,963Arkansas............... 235,083 666,949 709,394 1,404,545 1,510,092 1,703,621 1,782,645 1,873,595 1,994,748 2,074,113 2,149,237 2,241California .............. 3,831,595 9,172,158 9,936,642 21,485,782 22,748,218 24,219,792 25,140,639 25,949,033 27,334,639 29,909,168 32,759,492 34,379
Colorado ............... 369,218 1,243,049 1,369,883 2,451,833 2,642,850 2,919,916 2,954,793 3,232,976 3,360,529 3,577,211 3,886,872 4,140Connecticut........... 588,710 1,227,892 1,440,881 3,444,520 3,540,411 3,739,497 3,943,891 4,247,328 4,366,123 4,522,718 4,763,653 5,075Delaware............... 108,747 269,108 270,439 520,953 543,933 600,161 643,915 694,473 726,241 788,715 830,731 872,District of
Columbia ........ 141,138 298,448 295,155 639,983 647,901 670,677 713,427 666,938 679,106 632,952 647,202 693Florida................... 961,273 2,766,468 3,336,657 8,228,531 9,045,710 9,661,012 10,331,896 11,019,735 11,480,359 12,018,676 12,737,325 13,534
Georgia................. 599,371 1,608,028 1,688,714 4,505,962 4,804,225 5,273,143 5,643,843 6,136,689 6,629,646 7,230,405 7,770,241 8,537Hawaii ................... 141,324 351,889 395,038 700,012 827,579 946,074 998,143 1,028,729 1,040,682 1,057,069 1,112,351 1,143,Idaho..................... 103,107 313,927 352,912 627,794 708,045 804,231 859,088 951,350 1,019,594 1,090,597 1,153,778 1,239,Illinois.................... 1,896,067 4,579,355 4,773,179 8,125,493 8,932,538 9,942,737 10,076,889 10,640,279 10,727,091 11,720,249 12,473,064 13,602Indiana.................. 809,105 1,851,292 1,898,194 4,074,578 4,379,142 4,797,946 5,064,685 5,243,761 5,493,653 6,055,055 6,234,563 6,697
Iowa ...................... 527,086 1,186,659 1,337,504 2,004,742 2,136,561 2,459,141 2,527,434 2,622,510 2,753,425 2,885,943 3,005,421 3,110Kansas.................. 362,593 830,133 958,281 1,848,302 1,938,012 2,224,080 2,325,247 2,406,580 2,488,077 2,568,525 2,684,244 2,841Kentucky ............... 353,265 1,054,459 1,096,472 2,134,011 2,480,363 2,823,134 2,952,119 2,988,892 3,171,495 3,382,062 3,489,205 3,696Louisiana .............. 503,217 1,303,902 1,767,692 2,838,283 3,023,690 3,199,919 3,309,018 3,475,926 3,545,832 3,747,508 4,029,139 4,264Maine.................... 155,907 385,492 401,355 1,048,195 1,070,965 1,217,418 1,208,411 1,281,706 1,313,759 1,372,571 1,433,175 1,510
Maryland............... 721,794 1,783,056 1,937,159 3,894,644 4,240,862 4,556,266 4,783,023 5,083,380 5,311,207 5,529,309 5,843,685 6,165Massachusetts...... 907,341 2,638,734 2,794,762 4,760,390 4,906,828 5,281,067 5,637,337 6,062,303 6,435,458 6,846,610 7,381,784 7,948Michigan ............... 1,799,945 4,642,847 5,196,249 8,025,621 8,545,805 9,532,994 9,816,830 10,440,206 11,137,877 11,686,124 12,003,818 12,785Minnesota ............. 781,243 1,786,768 1,900,322 3,474,398 3,740,820 4,135,284 4,328,093 4,622,930 4,844,879 5,087,353 5,452,571 5,836Mississippi ............ 262,760 756,018 716,878 1,472,710 1,510,552 1,600,752 1,725,386 1,921,480 2,000,321 2,035,675 2,164,592 2,293
Missouri ................ 642,030 1,504,988 1,643,258 3,288,738 3,487,786 3,710,426 3,981,614 4,275,217 4,531,192 4,775,931 5,067,720 5,348Montana................ 127,176 358,118 380,092 641,345 719,963 785,159 822,015 844,257 868,892 902,252 929,197 955,Nebraska .............. 231,612 581,615 629,017 1,233,431 1,297,643 1,430,039 1,513,971 1,594,928 1,648,104 1,707,455 1,743,775 1,821Nevada ................. 87,273 281,901 287,752 712,898 864,379 1,035,623 1,099,685 1,186,132 1,296,629 1,434,395 1,570,576 1,738,New Hampshire .... 101,370 295,400 340,518 821,671 890,116 972,963 1,007,129 1,053,966 1,114,540 1,173,958 1,241,255 1,316
New Jersey ........... 1,343,564 3,638,533 3,648,914 8,119,336 8,897,612 9,915,482 10,448,096 10,776,982 11,208,558 11,771,941 12,056,560 12,874New Mexico .......... 183,736 515,451 560,213 1,020,148 1,134,156 1,240,310 1,323,459 1,441,078 1,517,517 1,557,376 1,659,891 1,788New York............... 4,111,839 8,760,500 9,259,948 18,090,978 19,514,583 20,898,267 22,059,949 22,989,629 23,522,461 24,237,291 25,332,735 26,885North Carolina ...... 676,193 1,880,862 2,112,417 4,342,826 4,605,384 4,930,823 5,145,416 5,440,426 5,582,994 5,964,939 6,497,648 7,097North Dakota ........ 97,895 228,483 254,197 459,391 460,581 511,095 522,377 534,632 557,043 577,498 599,443 625
Ohio ...................... 1,639,805 3,836,576 4,149,858 7,994,379 8,407,428 9,173,393 9,612,678 10,030,956 10,408,022 10,948,074 11,448,722 12,138Oklahoma ............. 339,105 1,055,844 1,193,373 1,905,332 2,107,513 2,442,320 2,680,113 2,763,721 2,804,088 2,990,044 3,138,690 3,332Oregon.................. 403,844 1,126,812 1,292,624 2,297,944 2,453,934 2,849,009 2,852,723 2,948,539 3,056,801 3,184,100 3,474,714 3,706Pennsylvania......... 1,912,644 4,584,320 4,955,115 9,496,788 10,087,322 10,944,392 11,236,417 11,587,027 12,374,073 12,820,704 13,084,859 13,532Rhode Island ........ 145,443 362,046 395,389 801,908 823,655 934,815 990,094 1,050,969 1,094,185 1,151,888 1,215,595 1,283South Carolina...... 367,689 997,984 1,006,088 2,322,618 2,494,254 2,690,009 2,790,878 2,920,230 3,085,495 3,296,661 3,507,017 3,759
See notes at end of table.
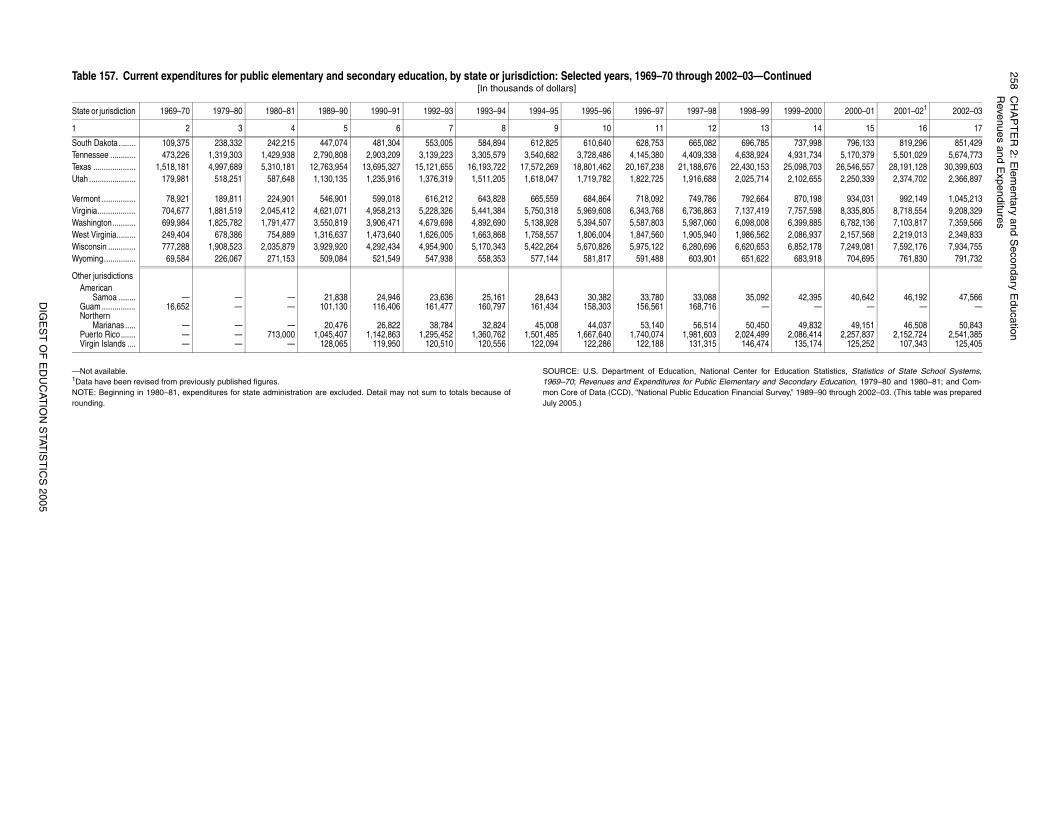
258C
HA
PT
ER
2: Elem
entary and Secondary E
ducationR
evenues and Expenditures
DIG
ES
T O
F E
DU
CAT
ION
STAT
IST
ICS
2005
r for Education Statistics, Statistics of State School Systems,y and Secondary Education, 1979–80 and 1980–81; and Com-ial Survey,” 1989–90 through 2002–03. (This table was prepared
785 737,998 796,133 819,296 851,429,924 4,931,734 5,170,379 5,501,029 5,674,773,153 25,098,703 26,546,557 28,191,128 30,399,603,714 2,102,655 2,250,339 2,374,702 2,366,897
664 870,198 934,031 992,149 1,045,213,419 7,757,598 8,335,805 8,718,554 9,208,329,008 6,399,885 6,782,136 7,103,817 7,359,566,562 2,086,937 2,157,568 2,219,013 2,349,833,653 6,852,178 7,249,081 7,592,176 7,934,755622 683,918 704,695 761,830 791,732
,092 42,395 40,642 46,192 47,566— — — — —
,450 49,832 49,151 46,508 50,843,499 2,086,414 2,257,837 2,152,724 2,541,385,474 135,174 125,252 107,343 125,405
Continued
–99 1999–2000 2000–01 2001–021 2002–03
13 14 15 16 17
—Not available.1Data have been revised from previously published figures.NOTE: Beginning in 1980–81, expenditures for state administration are excluded. Detail may not sum to totals because ofrounding.
SOURCE: U.S. Department of Education, National Cente1969–70; Revenues and Expenditures for Public Elementarmon Core of Data (CCD), “National Public Education FinancJuly 2005.)
South Dakota ........ 109,375 238,332 242,215 447,074 481,304 553,005 584,894 612,825 610,640 628,753 665,082 696,Tennessee ............ 473,226 1,319,303 1,429,938 2,790,808 2,903,209 3,139,223 3,305,579 3,540,682 3,728,486 4,145,380 4,409,338 4,638Texas .................... 1,518,181 4,997,689 5,310,181 12,763,954 13,695,327 15,121,655 16,193,722 17,572,269 18,801,462 20,167,238 21,188,676 22,430Utah ...................... 179,981 518,251 587,648 1,130,135 1,235,916 1,376,319 1,511,205 1,618,047 1,719,782 1,822,725 1,916,688 2,025
Vermont ................ 78,921 189,811 224,901 546,901 599,018 616,212 643,828 665,559 684,864 718,092 749,786 792,Virginia.................. 704,677 1,881,519 2,045,412 4,621,071 4,958,213 5,228,326 5,441,384 5,750,318 5,969,608 6,343,768 6,736,863 7,137Washington........... 699,984 1,825,782 1,791,477 3,550,819 3,906,471 4,679,698 4,892,690 5,138,928 5,394,507 5,587,803 5,987,060 6,098West Virginia......... 249,404 678,386 754,889 1,316,637 1,473,640 1,626,005 1,663,868 1,758,557 1,806,004 1,847,560 1,905,940 1,986Wisconsin ............. 777,288 1,908,523 2,035,879 3,929,920 4,292,434 4,954,900 5,170,343 5,422,264 5,670,826 5,975,122 6,280,696 6,620Wyoming............... 69,584 226,067 271,153 509,084 521,549 547,938 558,353 577,144 581,817 591,488 603,901 651,
Other jurisdictionsAmerican
Samoa ........ — — — 21,838 24,946 23,636 25,161 28,643 30,382 33,780 33,088 35Guam ................ 16,652 — — 101,130 116,406 161,477 160,797 161,434 158,303 156,561 168,716Northern
Marianas ..... — — — 20,476 26,822 38,784 32,824 45,008 44,037 53,140 56,514 50Puerto Rico ....... — — 713,000 1,045,407 1,142,863 1,295,452 1,360,762 1,501,485 1,667,640 1,740,074 1,981,603 2,024Virgin Islands .... — — — 128,065 119,950 120,510 120,556 122,094 122,286 122,188 131,315 146
Table 157. Current expenditures for public elementary and secondary education, by state or jurisdiction: Selected years, 1969–70 through 2002–03—[In thousands of dollars]
State or jurisdiction 1969–70 1979–80 1980–81 1989–90 1990–91 1992–93 1993–94 1994–95 1995–96 1996–97 1997–98 1998
1 2 3 4 5 6 7 8 9 10 11 12
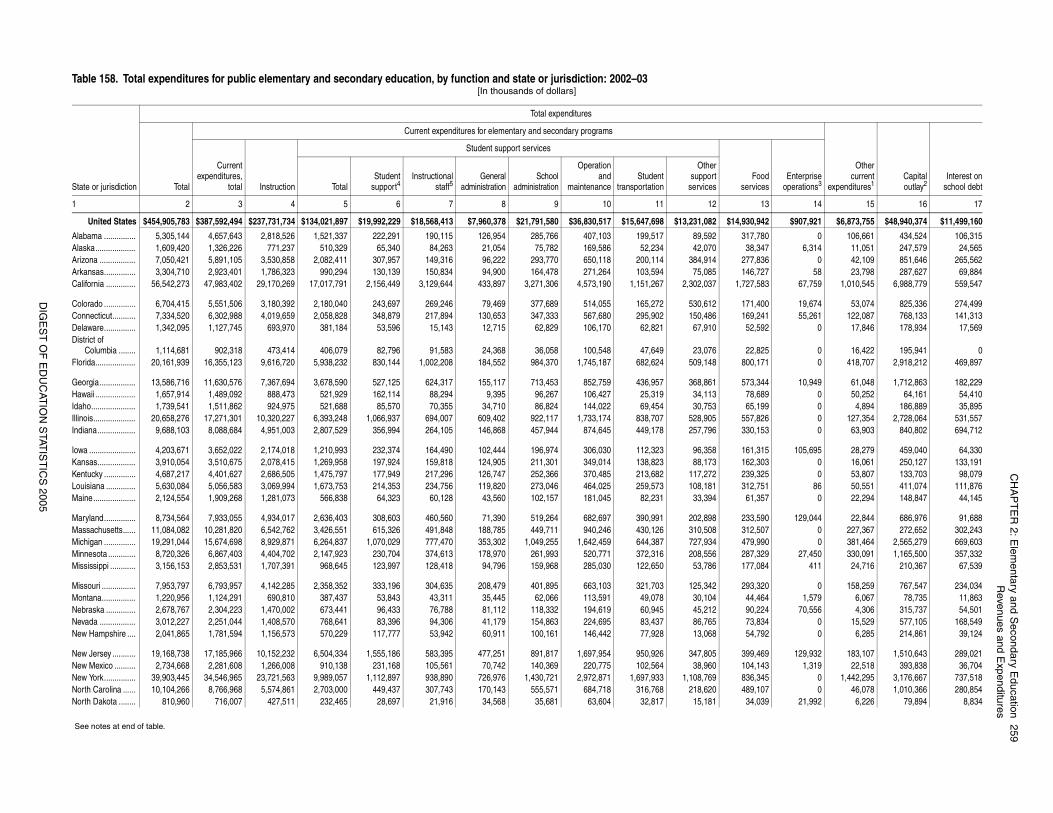
CH
AP
TE
R 2: E
lementary and S
econdary Education
259R
evenues and Expenditures
DIG
ES
T O
F E
DU
CAT
ION
STAT
IST
ICS
2005
Othercurrent
expenditures1Capitaloutlay2
Interest onschool debt
oodices
Enterpriseoperations3
13 14 15 16 17
,942 $907,921 $6,873,755 $48,940,374 $11,499,160
780 0 106,661 434,524 106,315347 6,314 11,051 247,579 24,565
,836 0 42,109 851,646 265,562727 58 23,798 287,627 69,884
,583 67,759 1,010,545 6,988,779 559,547
400 19,674 53,074 825,336 274,499,241 55,261 122,087 768,133 141,313592 0 17,846 178,934 17,569
,825 0 16,422 195,941 0,171 0 418,707 2,918,212 469,897
,344 10,949 61,048 1,712,863 182,229,689 0 50,252 64,161 54,410199 0 4,894 186,889 35,895826 0 127,354 2,728,064 531,557153 0 63,903 840,802 694,712
,315 105,695 28,279 459,040 64,330303 0 16,061 250,127 133,191
,325 0 53,807 133,703 98,079751 86 50,551 411,074 111,876
,357 0 22,294 148,847 44,145
,590 129,044 22,844 686,976 91,688,507 0 227,367 272,652 302,243,990 0 381,464 2,565,279 669,603,329 27,450 330,091 1,165,500 357,332084 411 24,716 210,367 67,539
,320 0 158,259 767,547 234,034464 1,579 6,067 78,735 11,863
,224 70,556 4,306 315,737 54,501,834 0 15,529 577,105 168,549,792 0 6,285 214,861 39,124
,469 129,932 183,107 1,510,643 289,021,143 1,319 22,518 393,838 36,704,345 0 1,442,295 3,176,667 737,518,107 0 46,078 1,010,366 280,854,039 21,992 6,226 79,894 8,834
Table 158. Total expenditures for public elementary and secondary education, by function and state or jurisdiction: 2002–03[In thousands of dollars]
State or jurisdiction
Total expenditures
Total
Current expenditures for elementary and secondary programs
Currentexpenditures,
total Instruction
Student support services
FservTotal
Studentsupport4
Instructionalstaff5
Generaladministration
Schooladministration
Operationand
maintenanceStudent
transportation
Othersupport
services
1 2 3 4 5 6 7 8 9 10 11 12
United States $454,905,783 $387,592,494 $237,731,734 $134,021,897 $19,992,229 $18,568,413 $7,960,378 $21,791,580 $36,830,517 $15,647,698 $13,231,082 $14,930
Alabama ............... 5,305,144 4,657,643 2,818,526 1,521,337 222,291 190,115 126,954 285,766 407,103 199,517 89,592 317,Alaska................... 1,609,420 1,326,226 771,237 510,329 65,340 84,263 21,054 75,782 169,586 52,234 42,070 38,Arizona ................. 7,050,421 5,891,105 3,530,858 2,082,411 307,957 149,316 96,222 293,770 650,118 200,114 384,914 277Arkansas............... 3,304,710 2,923,401 1,786,323 990,294 130,139 150,834 94,900 164,478 271,264 103,594 75,085 146,California .............. 56,542,273 47,983,402 29,170,269 17,017,791 2,156,449 3,129,644 433,897 3,271,306 4,573,190 1,151,267 2,302,037 1,727
Colorado ............... 6,704,415 5,551,506 3,180,392 2,180,040 243,697 269,246 79,469 377,689 514,055 165,272 530,612 171,Connecticut........... 7,334,520 6,302,988 4,019,659 2,058,828 348,879 217,894 130,653 347,333 567,680 295,902 150,486 169Delaware............... 1,342,095 1,127,745 693,970 381,184 53,596 15,143 12,715 62,829 106,170 62,821 67,910 52,District of
Columbia ........ 1,114,681 902,318 473,414 406,079 82,796 91,583 24,368 36,058 100,548 47,649 23,076 22Florida................... 20,161,939 16,355,123 9,616,720 5,938,232 830,144 1,002,208 184,552 984,370 1,745,187 682,624 509,148 800
Georgia................. 13,586,716 11,630,576 7,367,694 3,678,590 527,125 624,317 155,117 713,453 852,759 436,957 368,861 573Hawaii ................... 1,657,914 1,489,092 888,473 521,929 162,114 88,294 9,395 96,267 106,427 25,319 34,113 78Idaho..................... 1,739,541 1,511,862 924,975 521,688 85,570 70,355 34,710 86,824 144,022 69,454 30,753 65,Illinois.................... 20,658,276 17,271,301 10,320,227 6,393,248 1,066,937 694,007 609,402 922,117 1,733,174 838,707 528,905 557,Indiana.................. 9,688,103 8,088,684 4,951,003 2,807,529 356,994 264,105 146,868 457,944 874,645 449,178 257,796 330,
Iowa ...................... 4,203,671 3,652,022 2,174,018 1,210,993 232,374 164,490 102,444 196,974 306,030 112,323 96,358 161Kansas.................. 3,910,054 3,510,675 2,078,415 1,269,958 197,924 159,818 124,905 211,301 349,014 138,823 88,173 162,Kentucky ............... 4,687,217 4,401,627 2,686,505 1,475,797 177,949 217,296 126,747 252,366 370,485 213,682 117,272 239Louisiana .............. 5,630,084 5,056,583 3,069,994 1,673,753 214,353 234,756 119,820 273,046 464,025 259,573 108,181 312,Maine.................... 2,124,554 1,909,268 1,281,073 566,838 64,323 60,128 43,560 102,157 181,045 82,231 33,394 61
Maryland............... 8,734,564 7,933,055 4,934,017 2,636,403 308,603 460,560 71,390 519,264 682,697 390,991 202,898 233Massachusetts...... 11,084,082 10,281,820 6,542,762 3,426,551 615,326 491,848 188,785 449,711 940,246 430,126 310,508 312Michigan ............... 19,291,044 15,674,698 8,929,871 6,264,837 1,070,029 777,470 353,302 1,049,255 1,642,459 644,387 727,934 479Minnesota ............. 8,720,326 6,867,403 4,404,702 2,147,923 230,704 374,613 178,970 261,993 520,771 372,316 208,556 287Mississippi ............ 3,156,153 2,853,531 1,707,391 968,645 123,997 128,418 94,796 159,968 285,030 122,650 53,786 177,
Missouri ................ 7,953,797 6,793,957 4,142,285 2,358,352 333,196 304,635 208,479 401,895 663,103 321,703 125,342 293Montana................ 1,220,956 1,124,291 690,810 387,437 53,843 43,311 35,445 62,066 113,591 49,078 30,104 44,Nebraska .............. 2,678,767 2,304,223 1,470,002 673,441 96,433 76,788 81,112 118,332 194,619 60,945 45,212 90Nevada ................. 3,012,227 2,251,044 1,408,570 768,641 83,396 94,306 41,179 154,863 224,695 83,437 86,765 73New Hampshire .... 2,041,865 1,781,594 1,156,573 570,229 117,777 53,942 60,911 100,161 146,442 77,928 13,068 54
New Jersey ........... 19,168,738 17,185,966 10,152,232 6,504,334 1,555,186 583,395 477,251 891,817 1,697,954 950,926 347,805 399New Mexico .......... 2,734,668 2,281,608 1,266,008 910,138 231,168 105,561 70,742 140,369 220,775 102,564 38,960 104New York............... 39,903,445 34,546,965 23,721,563 9,989,057 1,112,897 938,890 726,976 1,430,721 2,972,871 1,697,933 1,108,769 836North Carolina ...... 10,104,266 8,766,968 5,574,861 2,703,000 449,437 307,743 170,143 555,571 684,718 316,768 218,620 489North Dakota ........ 810,960 716,007 427,511 232,465 28,697 21,916 34,568 35,681 63,604 32,817 15,181 34
See notes at end of table.
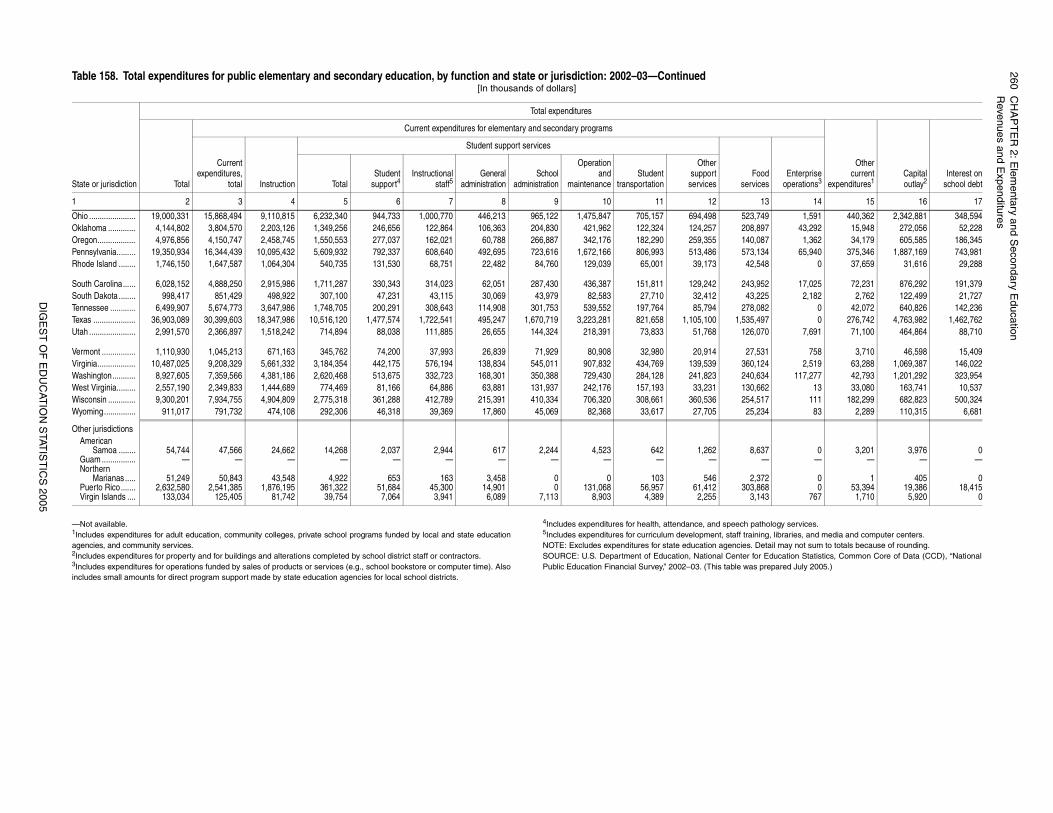
260C
HA
PT
ER
2: Elem
entary and Secondary E
ducationR
evenues and Expenditures
DIG
ES
T O
F E
DU
CAT
ION
STAT
IST
ICS
2005
athology services.ning, libraries, and media and computer centers.Detail may not sum to totals because of rounding. r Education Statistics, Common Core of Data (CCD), “National prepared July 2005.)
749 1,591 440,362 2,342,881 348,594,897 43,292 15,948 272,056 52,228,087 1,362 34,179 605,585 186,345,134 65,940 375,346 1,887,169 743,981,548 0 37,659 31,616 29,288
,952 17,025 72,231 876,292 191,379,225 2,182 2,762 122,499 21,727082 0 42,072 640,826 142,236
,497 0 276,742 4,763,982 1,462,762070 7,691 71,100 464,864 88,710
,531 758 3,710 46,598 15,409124 2,519 63,288 1,069,387 146,022634 117,277 42,793 1,201,292 323,954
,662 13 33,080 163,741 10,537,517 111 182,299 682,823 500,324,234 83 2,289 110,315 6,681
637 0 3,201 3,976 0— — — — —
,372 0 1 405 0,868 0 53,394 19,386 18,415,143 767 1,710 5,920 0
Othercurrent
expenditures1Capitaloutlay2
Interest onschool debt
oodices
Enterpriseoperations3
13 14 15 16 17
—Not available. 1Includes expenditures for adult education, community colleges, private school programs funded by local and state educationagencies, and community services.2Includes expenditures for property and for buildings and alterations completed by school district staff or contractors.3Includes expenditures for operations funded by sales of products or services (e.g., school bookstore or computer time). Alsoincludes small amounts for direct program support made by state education agencies for local school districts.
4Includes expenditures for health, attendance, and speech p5Includes expenditures for curriculum development, staff traiNOTE: Excludes expenditures for state education agencies. SOURCE: U.S. Department of Education, National Center foPublic Education Financial Survey,” 2002–03. (This table was
Ohio ...................... 19,000,331 15,868,494 9,110,815 6,232,340 944,733 1,000,770 446,213 965,122 1,475,847 705,157 694,498 523,Oklahoma ............. 4,144,802 3,804,570 2,203,126 1,349,256 246,656 122,864 106,363 204,830 421,962 122,324 124,257 208Oregon.................. 4,976,856 4,150,747 2,458,745 1,550,553 277,037 162,021 60,788 266,887 342,176 182,290 259,355 140Pennsylvania......... 19,350,934 16,344,439 10,095,432 5,609,932 792,337 608,640 492,695 723,616 1,672,166 806,993 513,486 573Rhode Island ........ 1,746,150 1,647,587 1,064,304 540,735 131,530 68,751 22,482 84,760 129,039 65,001 39,173 42
South Carolina...... 6,028,152 4,888,250 2,915,986 1,711,287 330,343 314,023 62,051 287,430 436,387 151,811 129,242 243South Dakota ........ 998,417 851,429 498,922 307,100 47,231 43,115 30,069 43,979 82,583 27,710 32,412 43Tennessee ............ 6,499,907 5,674,773 3,647,986 1,748,705 200,291 308,643 114,908 301,753 539,552 197,764 85,794 278,Texas .................... 36,903,089 30,399,603 18,347,986 10,516,120 1,477,574 1,722,541 495,247 1,670,719 3,223,281 821,658 1,105,100 1,535Utah ...................... 2,991,570 2,366,897 1,518,242 714,894 88,038 111,885 26,655 144,324 218,391 73,833 51,768 126,
Vermont ................ 1,110,930 1,045,213 671,163 345,762 74,200 37,993 26,839 71,929 80,908 32,980 20,914 27Virginia.................. 10,487,025 9,208,329 5,661,332 3,184,354 442,175 576,194 138,834 545,011 907,832 434,769 139,539 360,Washington........... 8,927,605 7,359,566 4,381,186 2,620,468 513,675 332,723 168,301 350,388 729,430 284,128 241,823 240,West Virginia......... 2,557,190 2,349,833 1,444,689 774,469 81,166 64,886 63,881 131,937 242,176 157,193 33,231 130Wisconsin ............. 9,300,201 7,934,755 4,904,809 2,775,318 361,288 412,789 215,391 410,334 706,320 308,661 360,536 254Wyoming............... 911,017 791,732 474,108 292,306 46,318 39,369 17,860 45,069 82,368 33,617 27,705 25
Other jurisdictionsAmerican
Samoa ........ 54,744 47,566 24,662 14,268 2,037 2,944 617 2,244 4,523 642 1,262 8,Guam ................ — — — — — — — — — — —Northern
Marianas ..... 51,249 50,843 43,548 4,922 653 163 3,458 0 0 103 546 2Puerto Rico ....... 2,632,580 2,541,385 1,876,195 361,322 51,684 45,300 14,901 0 131,068 56,957 61,412 303Virgin Islands .... 133,034 125,405 81,742 39,754 7,064 3,941 6,089 7,113 8,903 4,389 2,255 3
Table 158. Total expenditures for public elementary and secondary education, by function and state or jurisdiction: 2002–03—Continued[In thousands of dollars]
State or jurisdiction
Total expenditures
Total
Current expenditures for elementary and secondary programs
Currentexpenditures,
total Instruction
Student support services
FservTotal
Studentsupport4
Instructionalstaff5
Generaladministration
Schooladministration
Operationand
maintenanceStudent
transportation
Othersupport
services
1 2 3 4 5 6 7 8 9 10 11 12
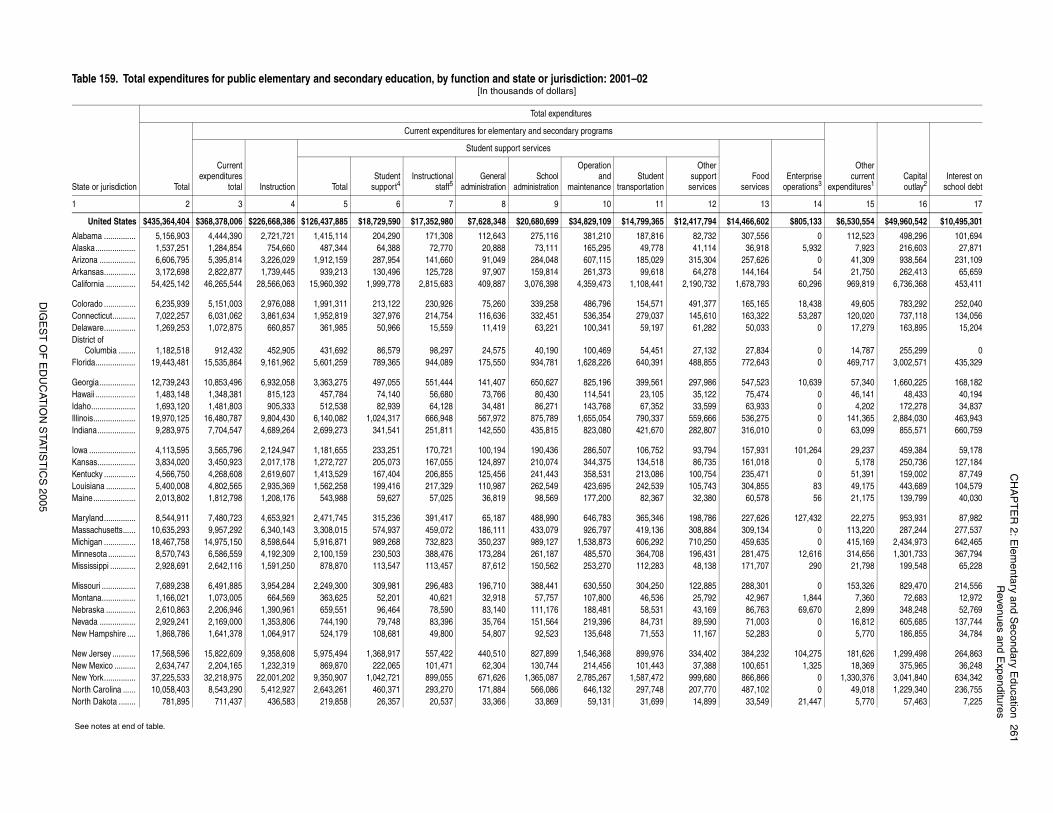
CH
AP
TE
R 2: E
lementary and S
econdary Education
261R
evenues and Expenditures
DIG
ES
T O
F E
DU
CAT
ION
STAT
IST
ICS
2005
Othercurrent
expenditures1Capitaloutlay2
Interest onschool debt
oodices
Enterpriseoperations3
13 14 15 16 17
,602 $805,133 $6,530,554 $49,960,542 $10,495,301
556 0 112,523 498,296 101,694918 5,932 7,923 216,603 27,871
,626 0 41,309 938,564 231,109164 54 21,750 262,413 65,659
,793 60,296 969,819 6,736,368 453,411
165 18,438 49,605 783,292 252,040,322 53,287 120,020 737,118 134,056033 0 17,279 163,895 15,204
,834 0 14,787 255,299 0,643 0 469,717 3,002,571 435,329
,523 10,639 57,340 1,660,225 168,182,474 0 46,141 48,433 40,194933 0 4,202 172,278 34,837
,275 0 141,365 2,884,030 463,943010 0 63,099 855,571 660,759
,931 101,264 29,237 459,384 59,178018 0 5,178 250,736 127,184
,471 0 51,391 159,002 87,749855 83 49,175 443,689 104,579
,578 56 21,175 139,799 40,030
,626 127,432 22,275 953,931 87,982,134 0 113,220 287,244 277,537,635 0 415,169 2,434,973 642,465,475 12,616 314,656 1,301,733 367,794707 290 21,798 199,548 65,228
,301 0 153,326 829,470 214,556967 1,844 7,360 72,683 12,972
,763 69,670 2,899 348,248 52,769,003 0 16,812 605,685 137,744,283 0 5,770 186,855 34,784
,232 104,275 181,626 1,299,498 264,863,651 1,325 18,369 375,965 36,248,866 0 1,330,376 3,041,840 634,342,102 0 49,018 1,229,340 236,755,549 21,447 5,770 57,463 7,225
Table 159. Total expenditures for public elementary and secondary education, by function and state or jurisdiction: 2001–02[In thousands of dollars]
State or jurisdiction
Total expenditures
Total
Current expenditures for elementary and secondary programs
Currentexpenditures
total Instruction
Student support services
FservTotal
Studentsupport4
Instructionalstaff5
Generaladministration
Schooladministration
Operationand
maintenanceStudent
transportation
Othersupport
services
1 2 3 4 5 6 7 8 9 10 11 12
United States $435,364,404 $368,378,006 $226,668,386 $126,437,885 $18,729,590 $17,352,980 $7,628,348 $20,680,699 $34,829,109 $14,799,365 $12,417,794 $14,466
Alabama ............... 5,156,903 4,444,390 2,721,721 1,415,114 204,290 171,308 112,643 275,116 381,210 187,816 82,732 307,Alaska................... 1,537,251 1,284,854 754,660 487,344 64,388 72,770 20,888 73,111 165,295 49,778 41,114 36,Arizona ................. 6,606,795 5,395,814 3,226,029 1,912,159 287,954 141,660 91,049 284,048 607,115 185,029 315,304 257Arkansas............... 3,172,698 2,822,877 1,739,445 939,213 130,496 125,728 97,907 159,814 261,373 99,618 64,278 144,California .............. 54,425,142 46,265,544 28,566,063 15,960,392 1,999,778 2,815,683 409,887 3,076,398 4,359,473 1,108,441 2,190,732 1,678
Colorado ............... 6,235,939 5,151,003 2,976,088 1,991,311 213,122 230,926 75,260 339,258 486,796 154,571 491,377 165,Connecticut........... 7,022,257 6,031,062 3,861,634 1,952,819 327,976 214,754 116,636 332,451 536,354 279,037 145,610 163Delaware............... 1,269,253 1,072,875 660,857 361,985 50,966 15,559 11,419 63,221 100,341 59,197 61,282 50,District of
Columbia ........ 1,182,518 912,432 452,905 431,692 86,579 98,297 24,575 40,190 100,469 54,451 27,132 27Florida................... 19,443,481 15,535,864 9,161,962 5,601,259 789,365 944,089 175,550 934,781 1,628,226 640,391 488,855 772
Georgia................. 12,739,243 10,853,496 6,932,058 3,363,275 497,055 551,444 141,407 650,627 825,196 399,561 297,986 547Hawaii ................... 1,483,148 1,348,381 815,123 457,784 74,140 56,680 73,766 80,430 114,541 23,105 35,122 75Idaho..................... 1,693,120 1,481,803 905,333 512,538 82,939 64,128 34,481 86,271 143,768 67,352 33,599 63,Illinois.................... 19,970,125 16,480,787 9,804,430 6,140,082 1,024,317 666,948 567,972 875,789 1,655,054 790,337 559,666 536Indiana.................. 9,283,975 7,704,547 4,689,264 2,699,273 341,541 251,811 142,550 435,815 823,080 421,670 282,807 316,
Iowa ...................... 4,113,595 3,565,796 2,124,947 1,181,655 233,251 170,721 100,194 190,436 286,507 106,752 93,794 157Kansas.................. 3,834,020 3,450,923 2,017,178 1,272,727 205,073 167,055 124,897 210,074 344,375 134,518 86,735 161,Kentucky ............... 4,566,750 4,268,608 2,619,607 1,413,529 167,404 206,855 125,456 241,443 358,531 213,086 100,754 235Louisiana .............. 5,400,008 4,802,565 2,935,369 1,562,258 199,416 217,329 110,987 262,549 423,695 242,539 105,743 304,Maine.................... 2,013,802 1,812,798 1,208,176 543,988 59,627 57,025 36,819 98,569 177,200 82,367 32,380 60
Maryland............... 8,544,911 7,480,723 4,653,921 2,471,745 315,236 391,417 65,187 488,990 646,783 365,346 198,786 227Massachusetts...... 10,635,293 9,957,292 6,340,143 3,308,015 574,937 459,072 186,111 433,079 926,797 419,136 308,884 309Michigan ............... 18,467,758 14,975,150 8,598,644 5,916,871 989,268 732,823 350,237 989,127 1,538,873 606,292 710,250 459Minnesota ............. 8,570,743 6,586,559 4,192,309 2,100,159 230,503 388,476 173,284 261,187 485,570 364,708 196,431 281Mississippi ............ 2,928,691 2,642,116 1,591,250 878,870 113,547 113,457 87,612 150,562 253,270 112,283 48,138 171,
Missouri ................ 7,689,238 6,491,885 3,954,284 2,249,300 309,981 296,483 196,710 388,441 630,550 304,250 122,885 288Montana................ 1,166,021 1,073,005 664,569 363,625 52,201 40,621 32,918 57,757 107,800 46,536 25,792 42,Nebraska .............. 2,610,863 2,206,946 1,390,961 659,551 96,464 78,590 83,140 111,176 188,481 58,531 43,169 86Nevada ................. 2,929,241 2,169,000 1,353,806 744,190 79,748 83,396 35,764 151,564 219,396 84,731 89,590 71New Hampshire .... 1,868,786 1,641,378 1,064,917 524,179 108,681 49,800 54,807 92,523 135,648 71,553 11,167 52
New Jersey ........... 17,568,596 15,822,609 9,358,608 5,975,494 1,368,917 557,422 440,510 827,899 1,546,368 899,976 334,402 384New Mexico .......... 2,634,747 2,204,165 1,232,319 869,870 222,065 101,471 62,304 130,744 214,456 101,443 37,388 100New York............... 37,225,533 32,218,975 22,001,202 9,350,907 1,042,721 899,055 671,626 1,365,087 2,785,267 1,587,472 999,680 866North Carolina ...... 10,058,403 8,543,290 5,412,927 2,643,261 460,371 293,270 171,884 566,086 646,132 297,748 207,770 487North Dakota ........ 781,895 711,437 436,583 219,858 26,357 20,537 33,366 33,869 59,131 31,699 14,899 33
See notes at end of table.
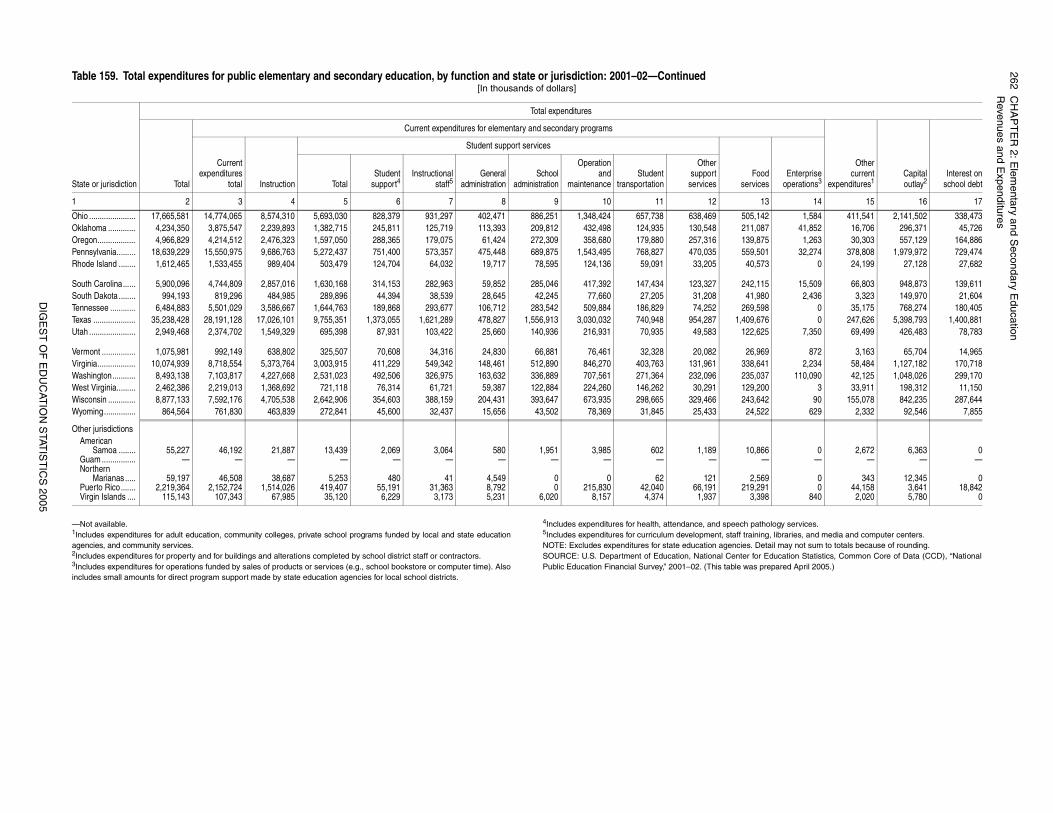
262C
HA
PT
ER
2: Elem
entary and Secondary E
ducationR
evenues and Expenditures
DIG
ES
T O
F E
DU
CAT
ION
STAT
IST
ICS
2005
athology services. ning, libraries, and media and computer centers.Detail may not sum to totals because of rounding. r Education Statistics, Common Core of Data (CCD), “National prepared April 2005.)
142 1,584 411,541 2,141,502 338,473,087 41,852 16,706 296,371 45,726,875 1,263 30,303 557,129 164,886,501 32,274 378,808 1,979,972 729,474,573 0 24,199 27,128 27,682
,115 15,509 66,803 948,873 139,611,980 2,436 3,323 149,970 21,604598 0 35,175 768,274 180,405
,676 0 247,626 5,398,793 1,400,881625 7,350 69,499 426,483 78,783
,969 872 3,163 65,704 14,965641 2,234 58,484 1,127,182 170,718037 110,090 42,125 1,048,026 299,170
,200 3 33,911 198,312 11,150642 90 155,078 842,235 287,644
,522 629 2,332 92,546 7,855
866 0 2,672 6,363 0— — — — —
,569 0 343 12,345 0,291 0 44,158 3,641 18,842,398 840 2,020 5,780 0
Othercurrent
expenditures1Capitaloutlay2
Interest onschool debt
oodices
Enterpriseoperations3
13 14 15 16 17
—Not available. 1Includes expenditures for adult education, community colleges, private school programs funded by local and state educationagencies, and community services.2Includes expenditures for property and for buildings and alterations completed by school district staff or contractors.3Includes expenditures for operations funded by sales of products or services (e.g., school bookstore or computer time). Alsoincludes small amounts for direct program support made by state education agencies for local school districts.
4Includes expenditures for health, attendance, and speech p5Includes expenditures for curriculum development, staff traiNOTE: Excludes expenditures for state education agencies. SOURCE: U.S. Department of Education, National Center foPublic Education Financial Survey,” 2001–02. (This table was
Ohio ...................... 17,665,581 14,774,065 8,574,310 5,693,030 828,379 931,297 402,471 886,251 1,348,424 657,738 638,469 505,Oklahoma ............. 4,234,350 3,875,547 2,239,893 1,382,715 245,811 125,719 113,393 209,812 432,498 124,935 130,548 211Oregon.................. 4,966,829 4,214,512 2,476,323 1,597,050 288,365 179,075 61,424 272,309 358,680 179,880 257,316 139Pennsylvania......... 18,639,229 15,550,975 9,686,763 5,272,437 751,400 573,357 475,448 689,875 1,543,495 768,827 470,035 559Rhode Island ........ 1,612,465 1,533,455 989,404 503,479 124,704 64,032 19,717 78,595 124,136 59,091 33,205 40
South Carolina...... 5,900,096 4,744,809 2,857,016 1,630,168 314,153 282,963 59,852 285,046 417,392 147,434 123,327 242South Dakota ........ 994,193 819,296 484,985 289,896 44,394 38,539 28,645 42,245 77,660 27,205 31,208 41Tennessee ............ 6,484,883 5,501,029 3,586,667 1,644,763 189,868 293,677 106,712 283,542 509,884 186,829 74,252 269,Texas .................... 35,238,428 28,191,128 17,026,101 9,755,351 1,373,055 1,621,289 478,827 1,556,913 3,030,032 740,948 954,287 1,409Utah ...................... 2,949,468 2,374,702 1,549,329 695,398 87,931 103,422 25,660 140,936 216,931 70,935 49,583 122,
Vermont ................ 1,075,981 992,149 638,802 325,507 70,608 34,316 24,830 66,881 76,461 32,328 20,082 26Virginia.................. 10,074,939 8,718,554 5,373,764 3,003,915 411,229 549,342 148,461 512,890 846,270 403,763 131,961 338,Washington........... 8,493,138 7,103,817 4,227,668 2,531,023 492,506 326,975 163,632 336,889 707,561 271,364 232,096 235,West Virginia......... 2,462,386 2,219,013 1,368,692 721,118 76,314 61,721 59,387 122,884 224,260 146,262 30,291 129Wisconsin ............. 8,877,133 7,592,176 4,705,538 2,642,906 354,603 388,159 204,431 393,647 673,935 298,665 329,466 243,Wyoming............... 864,564 761,830 463,839 272,841 45,600 32,437 15,656 43,502 78,369 31,845 25,433 24
Other jurisdictionsAmerican
Samoa ........ 55,227 46,192 21,887 13,439 2,069 3,064 580 1,951 3,985 602 1,189 10,Guam ................ — — — — — — — — — — —Northern
Marianas ..... 59,197 46,508 38,687 5,253 480 41 4,549 0 0 62 121 2Puerto Rico ....... 2,219,364 2,152,724 1,514,026 419,407 55,191 31,363 8,792 0 215,830 42,040 66,191 219Virgin Islands .... 115,143 107,343 67,985 35,120 6,229 3,173 5,231 6,020 8,157 4,374 1,937 3
Table 159. Total expenditures for public elementary and secondary education, by function and state or jurisdiction: 2001–02—Continued[In thousands of dollars]
State or jurisdiction
Total expenditures
Total
Current expenditures for elementary and secondary programs
Currentexpenditures
total Instruction
Student support services
FservTotal
Studentsupport4
Instructionalstaff5
Generaladministration
Schooladministration
Operationand
maintenanceStudent
transportation
Othersupport
services
1 2 3 4 5 6 7 8 9 10 11 12
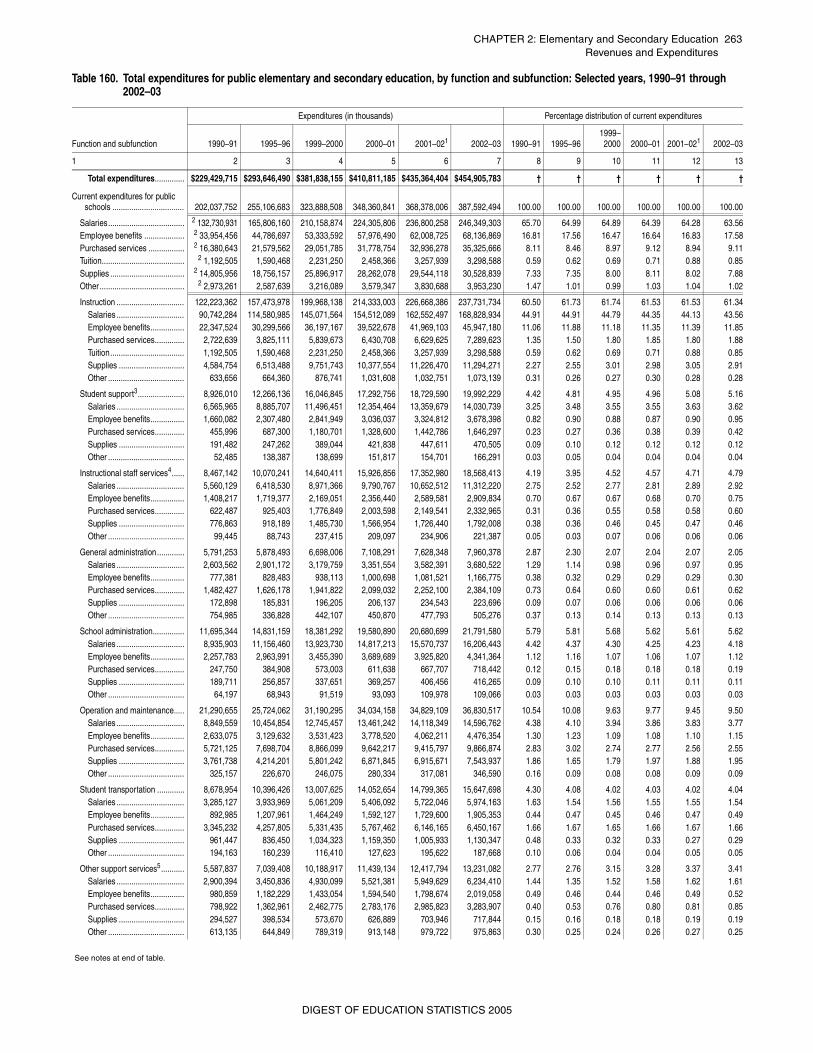
CHAPTER 2: Elementary and Secondary Education 263Revenues and Expenditures
Table 160. Total expenditures for public elementary and secondary education, by function and subfunction: Selected years, 1990–91 through 2002–03
Function and subfunction
Expenditures (in thousands) Percentage distribution of current expenditures
1990–91 1995–96 1999–2000 2000–01 2001–021 2002–03 1990–91 1995–961999–2000 2000–01 2001–021 2002–03
1 2 3 4 5 6 7 8 9 10 11 12 13
Total expenditures.............. $229,429,715 $293,646,490 $381,838,155 $410,811,185 $435,364,404 $454,905,783 † † † † † †
Current expenditures for public schools .................................. 202,037,752 255,106,683 323,888,508 348,360,841 368,378,006 387,592,494 100.00 100.00 100.00 100.00 100.00 100.00
Salaries.................................... 2 132,730,931 165,806,160 210,158,874 224,305,806 236,800,258 246,349,303 65.70 64.99 64.89 64.39 64.28 63.56Employee benefits ................... 2 33,954,456 44,786,697 53,333,592 57,976,490 62,008,725 68,136,869 16.81 17.56 16.47 16.64 16.83 17.58Purchased services ................. 2 16,380,643 21,579,562 29,051,785 31,778,754 32,936,278 35,325,666 8.11 8.46 8.97 9.12 8.94 9.11Tuition....................................... 2 1,192,505 1,590,468 2,231,250 2,458,366 3,257,939 3,298,588 0.59 0.62 0.69 0.71 0.88 0.85Supplies ................................... 2 14,805,956 18,756,157 25,896,917 28,262,078 29,544,118 30,528,839 7.33 7.35 8.00 8.11 8.02 7.88Other ........................................ 2 2,973,261 2,587,639 3,216,089 3,579,347 3,830,688 3,953,230 1.47 1.01 0.99 1.03 1.04 1.02
Instruction ................................ 122,223,362 157,473,978 199,968,138 214,333,003 226,668,386 237,731,734 60.50 61.73 61.74 61.53 61.53 61.34Salaries ................................ 90,742,284 114,580,985 145,071,564 154,512,089 162,552,497 168,828,934 44.91 44.91 44.79 44.35 44.13 43.56Employee benefits................ 22,347,524 30,299,566 36,197,167 39,522,678 41,969,103 45,947,180 11.06 11.88 11.18 11.35 11.39 11.85Purchased services.............. 2,722,639 3,825,111 5,839,673 6,430,708 6,629,625 7,289,623 1.35 1.50 1.80 1.85 1.80 1.88Tuition................................... 1,192,505 1,590,468 2,231,250 2,458,366 3,257,939 3,298,588 0.59 0.62 0.69 0.71 0.88 0.85Supplies ............................... 4,584,754 6,513,488 9,751,743 10,377,554 11,226,470 11,294,271 2.27 2.55 3.01 2.98 3.05 2.91Other .................................... 633,656 664,360 876,741 1,031,608 1,032,751 1,073,139 0.31 0.26 0.27 0.30 0.28 0.28
Student support3...................... 8,926,010 12,266,136 16,046,845 17,292,756 18,729,590 19,992,229 4.42 4.81 4.95 4.96 5.08 5.16Salaries ................................ 6,565,965 8,885,707 11,496,451 12,354,464 13,359,679 14,030,739 3.25 3.48 3.55 3.55 3.63 3.62Employee benefits................ 1,660,082 2,307,480 2,841,949 3,036,037 3,324,812 3,678,398 0.82 0.90 0.88 0.87 0.90 0.95Purchased services.............. 455,996 687,300 1,180,701 1,328,600 1,442,786 1,646,297 0.23 0.27 0.36 0.38 0.39 0.42Supplies ............................... 191,482 247,262 389,044 421,838 447,611 470,505 0.09 0.10 0.12 0.12 0.12 0.12Other .................................... 52,485 138,387 138,699 151,817 154,701 166,291 0.03 0.05 0.04 0.04 0.04 0.04
Instructional staff services4...... 8,467,142 10,070,241 14,640,411 15,926,856 17,352,980 18,568,413 4.19 3.95 4.52 4.57 4.71 4.79Salaries ................................ 5,560,129 6,418,530 8,971,366 9,790,767 10,652,512 11,312,220 2.75 2.52 2.77 2.81 2.89 2.92Employee benefits................ 1,408,217 1,719,377 2,169,051 2,356,440 2,589,581 2,909,834 0.70 0.67 0.67 0.68 0.70 0.75Purchased services.............. 622,487 925,403 1,776,849 2,003,598 2,149,541 2,332,965 0.31 0.36 0.55 0.58 0.58 0.60Supplies ............................... 776,863 918,189 1,485,730 1,566,954 1,726,440 1,792,008 0.38 0.36 0.46 0.45 0.47 0.46Other .................................... 99,445 88,743 237,415 209,097 234,906 221,387 0.05 0.03 0.07 0.06 0.06 0.06
General administration............. 5,791,253 5,878,493 6,698,006 7,108,291 7,628,348 7,960,378 2.87 2.30 2.07 2.04 2.07 2.05Salaries ................................ 2,603,562 2,901,172 3,179,759 3,351,554 3,582,391 3,680,522 1.29 1.14 0.98 0.96 0.97 0.95Employee benefits................ 777,381 828,483 938,113 1,000,698 1,081,521 1,166,775 0.38 0.32 0.29 0.29 0.29 0.30Purchased services.............. 1,482,427 1,626,178 1,941,822 2,099,032 2,252,100 2,384,109 0.73 0.64 0.60 0.60 0.61 0.62Supplies ............................... 172,898 185,831 196,205 206,137 234,543 223,696 0.09 0.07 0.06 0.06 0.06 0.06Other .................................... 754,985 336,828 442,107 450,870 477,793 505,276 0.37 0.13 0.14 0.13 0.13 0.13
School administration............... 11,695,344 14,831,159 18,381,292 19,580,890 20,680,699 21,791,580 5.79 5.81 5.68 5.62 5.61 5.62Salaries ................................ 8,935,903 11,156,460 13,923,730 14,817,213 15,570,737 16,206,443 4.42 4.37 4.30 4.25 4.23 4.18Employee benefits................ 2,257,783 2,963,991 3,455,390 3,689,689 3,925,820 4,341,364 1.12 1.16 1.07 1.06 1.07 1.12Purchased services.............. 247,750 384,908 573,003 611,638 667,707 718,442 0.12 0.15 0.18 0.18 0.18 0.19Supplies ............................... 189,711 256,857 337,651 369,257 406,456 416,265 0.09 0.10 0.10 0.11 0.11 0.11Other .................................... 64,197 68,943 91,519 93,093 109,978 109,066 0.03 0.03 0.03 0.03 0.03 0.03
Operation and maintenance..... 21,290,655 25,724,062 31,190,295 34,034,158 34,829,109 36,830,517 10.54 10.08 9.63 9.77 9.45 9.50Salaries ................................ 8,849,559 10,454,854 12,745,457 13,461,242 14,118,349 14,596,762 4.38 4.10 3.94 3.86 3.83 3.77Employee benefits................ 2,633,075 3,129,632 3,531,423 3,778,520 4,062,211 4,476,354 1.30 1.23 1.09 1.08 1.10 1.15Purchased services.............. 5,721,125 7,698,704 8,866,099 9,642,217 9,415,797 9,866,874 2.83 3.02 2.74 2.77 2.56 2.55Supplies ............................... 3,761,738 4,214,201 5,801,242 6,871,845 6,915,671 7,543,937 1.86 1.65 1.79 1.97 1.88 1.95Other .................................... 325,157 226,670 246,075 280,334 317,081 346,590 0.16 0.09 0.08 0.08 0.09 0.09
Student transportation ............. 8,678,954 10,396,426 13,007,625 14,052,654 14,799,365 15,647,698 4.30 4.08 4.02 4.03 4.02 4.04Salaries ................................ 3,285,127 3,933,969 5,061,209 5,406,092 5,722,046 5,974,163 1.63 1.54 1.56 1.55 1.55 1.54Employee benefits................ 892,985 1,207,961 1,464,249 1,592,127 1,729,600 1,905,353 0.44 0.47 0.45 0.46 0.47 0.49Purchased services.............. 3,345,232 4,257,805 5,331,435 5,767,462 6,146,165 6,450,167 1.66 1.67 1.65 1.66 1.67 1.66Supplies ............................... 961,447 836,450 1,034,323 1,159,350 1,005,933 1,130,347 0.48 0.33 0.32 0.33 0.27 0.29Other .................................... 194,163 160,239 116,410 127,623 195,622 187,668 0.10 0.06 0.04 0.04 0.05 0.05
Other support services5........... 5,587,837 7,039,408 10,188,917 11,439,134 12,417,794 13,231,082 2.77 2.76 3.15 3.28 3.37 3.41Salaries ................................ 2,900,394 3,450,836 4,930,099 5,521,381 5,949,629 6,234,410 1.44 1.35 1.52 1.58 1.62 1.61Employee benefits................ 980,859 1,182,229 1,433,054 1,594,540 1,798,674 2,019,058 0.49 0.46 0.44 0.46 0.49 0.52Purchased services.............. 798,922 1,362,961 2,462,775 2,783,176 2,985,823 3,283,907 0.40 0.53 0.76 0.80 0.81 0.85Supplies ............................... 294,527 398,534 573,670 626,889 703,946 717,844 0.15 0.16 0.18 0.18 0.19 0.19Other .................................... 613,135 644,849 789,319 913,148 979,722 975,863 0.30 0.25 0.24 0.26 0.27 0.25
See notes at end of table.
DIGEST OF EDUCATION STATISTICS 2005
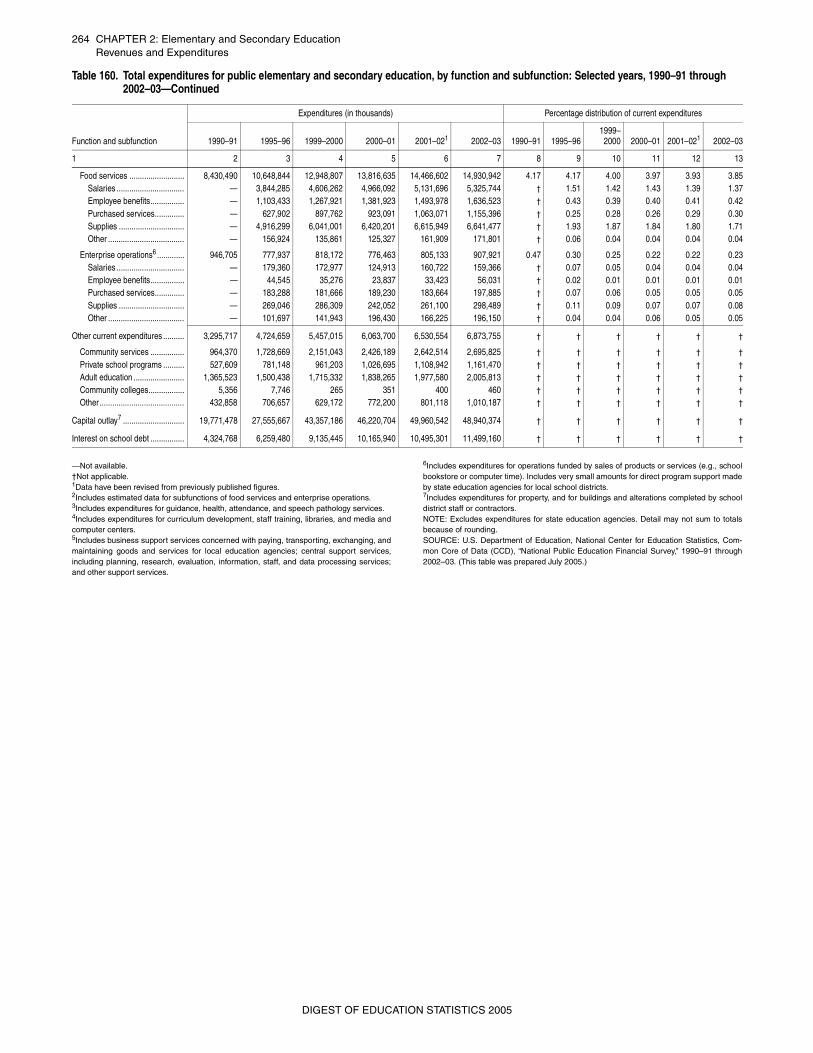
264 CHAPTER 2: Elementary and Secondary EducationRevenues and Expenditures
—Not available.†Not applicable.1Data have been revised from previously published figures.2Includes estimated data for subfunctions of food services and enterprise operations.3Includes expenditures for guidance, health, attendance, and speech pathology services.4Includes expenditures for curriculum development, staff training, libraries, and media andcomputer centers.5Includes business support services concerned with paying, transporting, exchanging, andmaintaining goods and services for local education agencies; central support services,including planning, research, evaluation, information, staff, and data processing services;and other support services.
6Includes expenditures for operations funded by sales of products or services (e.g., schoolbookstore or computer time). Includes very small amounts for direct program support madeby state education agencies for local school districts.7Includes expenditures for property, and for buildings and alterations completed by schooldistrict staff or contractors.NOTE: Excludes expenditures for state education agencies. Detail may not sum to totalsbecause of rounding.SOURCE: U.S. Department of Education, National Center for Education Statistics, Com-mon Core of Data (CCD), “National Public Education Financial Survey,” 1990–91 through2002–03. (This table was prepared July 2005.)
Food services .......................... 8,430,490 10,648,844 12,948,807 13,816,635 14,466,602 14,930,942 4.17 4.17 4.00 3.97 3.93 3.85Salaries ................................ — 3,844,285 4,606,262 4,966,092 5,131,696 5,325,744 † 1.51 1.42 1.43 1.39 1.37Employee benefits................ — 1,103,433 1,267,921 1,381,923 1,493,978 1,636,523 † 0.43 0.39 0.40 0.41 0.42Purchased services.............. — 627,902 897,762 923,091 1,063,071 1,155,396 † 0.25 0.28 0.26 0.29 0.30Supplies ............................... — 4,916,299 6,041,001 6,420,201 6,615,949 6,641,477 † 1.93 1.87 1.84 1.80 1.71Other .................................... — 156,924 135,861 125,327 161,909 171,801 † 0.06 0.04 0.04 0.04 0.04
Enterprise operations6 ............. 946,705 777,937 818,172 776,463 805,133 907,921 0.47 0.30 0.25 0.22 0.22 0.23Salaries ................................ — 179,360 172,977 124,913 160,722 159,366 † 0.07 0.05 0.04 0.04 0.04Employee benefits................ — 44,545 35,276 23,837 33,423 56,031 † 0.02 0.01 0.01 0.01 0.01Purchased services.............. — 183,288 181,666 189,230 183,664 197,885 † 0.07 0.06 0.05 0.05 0.05Supplies ............................... — 269,046 286,309 242,052 261,100 298,489 † 0.11 0.09 0.07 0.07 0.08Other .................................... — 101,697 141,943 196,430 166,225 196,150 † 0.04 0.04 0.06 0.05 0.05
Other current expenditures .......... 3,295,717 4,724,659 5,457,015 6,063,700 6,530,554 6,873,755 † † † † † †
Community services ................ 964,370 1,728,669 2,151,043 2,426,189 2,642,514 2,695,825 † † † † † †
Private school programs .......... 527,609 781,148 961,203 1,026,695 1,108,942 1,161,470 † † † † † †
Adult education ........................ 1,365,523 1,500,438 1,715,332 1,838,265 1,977,580 2,005,813 † † † † † †
Community colleges................. 5,356 7,746 265 351 400 460 † † † † † †
Other ........................................ 432,858 706,657 629,172 772,200 801,118 1,010,187 † † † † † †
Capital outlay7 ............................. 19,771,478 27,555,667 43,357,186 46,220,704 49,960,542 48,940,374 † † † † † †
Interest on school debt ................ 4,324,768 6,259,480 9,135,445 10,165,940 10,495,301 11,499,160 † † † † † †
Table 160. Total expenditures for public elementary and secondary education, by function and subfunction: Selected years, 1990–91 through 2002–03—Continued
Function and subfunction
Expenditures (in thousands) Percentage distribution of current expenditures
1990–91 1995–96 1999–2000 2000–01 2001–021 2002–03 1990–91 1995–961999–2000 2000–01 2001–021 2002–03
1 2 3 4 5 6 7 8 9 10 11 12 13
DIGEST OF EDUCATION STATISTICS 2005
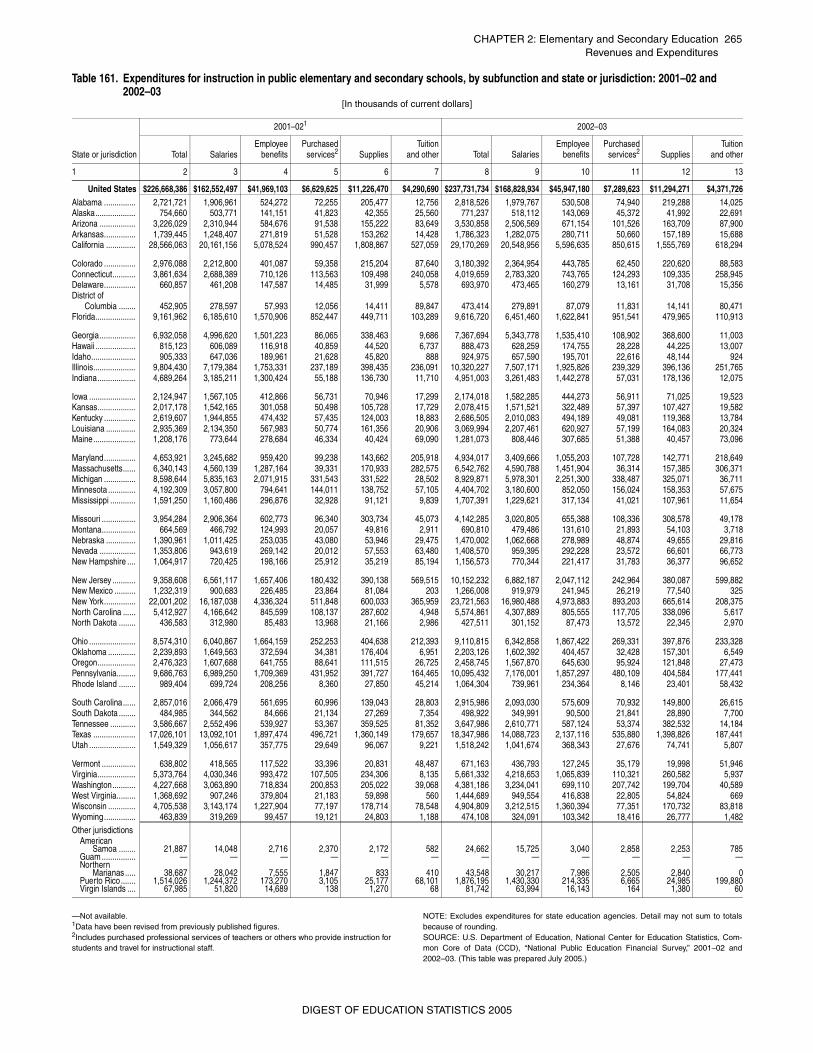
CHAPTER 2: Elementary and Secondary Education 265Revenues and Expenditures
—Not available.1Data have been revised from previously published figures.2Includes purchased professional services of teachers or others who provide instruction forstudents and travel for instructional staff.
NOTE: Excludes expenditures for state education agencies. Detail may not sum to totalsbecause of rounding.SOURCE: U.S. Department of Education, National Center for Education Statistics, Com-mon Core of Data (CCD), “National Public Education Financial Survey,” 2001–02 and2002–03. (This table was prepared July 2005.)
Table 161. Expenditures for instruction in public elementary and secondary schools, by subfunction and state or jurisdiction: 2001–02 and 2002–03
[In thousands of current dollars]
State or jurisdiction
2001–021 2002–03
Total SalariesEmployee
benefitsPurchased
services2 SuppliesTuition
and other Total SalariesEmployee
benefitsPurchased
services2 SuppliesTuition
and other
1 2 3 4 5 6 7 8 9 10 11 12 13
United States $226,668,386 $162,552,497 $41,969,103 $6,629,625 $11,226,470 $4,290,690 $237,731,734 $168,828,934 $45,947,180 $7,289,623 $11,294,271 $4,371,726Alabama ............... 2,721,721 1,906,961 524,272 72,255 205,477 12,756 2,818,526 1,979,767 530,508 74,940 219,288 14,025Alaska................... 754,660 503,771 141,151 41,823 42,355 25,560 771,237 518,112 143,069 45,372 41,992 22,691Arizona ................. 3,226,029 2,310,944 584,676 91,538 155,222 83,649 3,530,858 2,506,569 671,154 101,526 163,709 87,900Arkansas............... 1,739,445 1,248,407 271,819 51,528 153,262 14,428 1,786,323 1,282,075 280,711 50,660 157,189 15,688California .............. 28,566,063 20,161,156 5,078,524 990,457 1,808,867 527,059 29,170,269 20,548,956 5,596,635 850,615 1,555,769 618,294
Colorado ............... 2,976,088 2,212,800 401,087 59,358 215,204 87,640 3,180,392 2,364,954 443,785 62,450 220,620 88,583Connecticut........... 3,861,634 2,688,389 710,126 113,563 109,498 240,058 4,019,659 2,783,320 743,765 124,293 109,335 258,945Delaware............... 660,857 461,208 147,587 14,485 31,999 5,578 693,970 473,465 160,279 13,161 31,708 15,356District of
Columbia ........ 452,905 278,597 57,993 12,056 14,411 89,847 473,414 279,891 87,079 11,831 14,141 80,471Florida................... 9,161,962 6,185,610 1,570,906 852,447 449,711 103,289 9,616,720 6,451,460 1,622,841 951,541 479,965 110,913
Georgia................. 6,932,058 4,996,620 1,501,223 86,065 338,463 9,686 7,367,694 5,343,778 1,535,410 108,902 368,600 11,003Hawaii ................... 815,123 606,089 116,918 40,859 44,520 6,737 888,473 628,259 174,755 28,228 44,225 13,007Idaho..................... 905,333 647,036 189,961 21,628 45,820 888 924,975 657,590 195,701 22,616 48,144 924Illinois.................... 9,804,430 7,179,384 1,753,331 237,189 398,435 236,091 10,320,227 7,507,171 1,925,826 239,329 396,136 251,765Indiana.................. 4,689,264 3,185,211 1,300,424 55,188 136,730 11,710 4,951,003 3,261,483 1,442,278 57,031 178,136 12,075
Iowa ...................... 2,124,947 1,567,105 412,866 56,731 70,946 17,299 2,174,018 1,582,285 444,273 56,911 71,025 19,523Kansas.................. 2,017,178 1,542,165 301,058 50,498 105,728 17,729 2,078,415 1,571,521 322,489 57,397 107,427 19,582Kentucky ............... 2,619,607 1,944,855 474,432 57,435 124,003 18,883 2,686,505 2,010,083 494,189 49,081 119,368 13,784Louisiana .............. 2,935,369 2,134,350 567,983 50,774 161,356 20,906 3,069,994 2,207,461 620,927 57,199 164,083 20,324Maine.................... 1,208,176 773,644 278,684 46,334 40,424 69,090 1,281,073 808,446 307,685 51,388 40,457 73,096
Maryland............... 4,653,921 3,245,682 959,420 99,238 143,662 205,918 4,934,017 3,409,666 1,055,203 107,728 142,771 218,649Massachusetts...... 6,340,143 4,560,139 1,287,164 39,331 170,933 282,575 6,542,762 4,590,788 1,451,904 36,314 157,385 306,371Michigan ............... 8,598,644 5,835,163 2,071,915 331,543 331,522 28,502 8,929,871 5,978,301 2,251,300 338,487 325,071 36,711Minnesota ............. 4,192,309 3,057,800 794,641 144,011 138,752 57,105 4,404,702 3,180,600 852,050 156,024 158,353 57,675Mississippi ............ 1,591,250 1,160,486 296,876 32,928 91,121 9,839 1,707,391 1,229,621 317,134 41,021 107,961 11,654
Missouri ................ 3,954,284 2,906,364 602,773 96,340 303,734 45,073 4,142,285 3,020,805 655,388 108,336 308,578 49,178Montana................ 664,569 466,792 124,993 20,057 49,816 2,911 690,810 479,486 131,610 21,893 54,103 3,718Nebraska .............. 1,390,961 1,011,425 253,035 43,080 53,946 29,475 1,470,002 1,062,668 278,989 48,874 49,655 29,816Nevada ................. 1,353,806 943,619 269,142 20,012 57,553 63,480 1,408,570 959,395 292,228 23,572 66,601 66,773New Hampshire .... 1,064,917 720,425 198,166 25,912 35,219 85,194 1,156,573 770,344 221,417 31,783 36,377 96,652
New Jersey ........... 9,358,608 6,561,117 1,657,406 180,432 390,138 569,515 10,152,232 6,882,187 2,047,112 242,964 380,087 599,882New Mexico .......... 1,232,319 900,683 226,485 23,864 81,084 203 1,266,008 919,979 241,945 26,219 77,540 325New York............... 22,001,202 16,187,038 4,336,324 511,848 600,033 365,959 23,721,563 16,980,488 4,973,883 893,203 665,614 208,375North Carolina ...... 5,412,927 4,166,642 845,599 108,137 287,602 4,948 5,574,861 4,307,889 805,555 117,705 338,096 5,617North Dakota ........ 436,583 312,980 85,483 13,968 21,166 2,986 427,511 301,152 87,473 13,572 22,345 2,970
Ohio ...................... 8,574,310 6,040,867 1,664,159 252,253 404,638 212,393 9,110,815 6,342,858 1,867,422 269,331 397,876 233,328Oklahoma ............. 2,239,893 1,649,563 372,594 34,381 176,404 6,951 2,203,126 1,602,392 404,457 32,428 157,301 6,549Oregon.................. 2,476,323 1,607,688 641,755 88,641 111,515 26,725 2,458,745 1,567,870 645,630 95,924 121,848 27,473Pennsylvania......... 9,686,763 6,989,250 1,709,369 431,952 391,727 164,465 10,095,432 7,176,001 1,857,297 480,109 404,584 177,441Rhode Island ........ 989,404 699,724 208,256 8,360 27,850 45,214 1,064,304 739,961 234,364 8,146 23,401 58,432
South Carolina...... 2,857,016 2,066,479 561,695 60,996 139,043 28,803 2,915,986 2,093,030 575,609 70,932 149,800 26,615South Dakota ........ 484,985 344,562 84,666 21,134 27,269 7,354 498,922 349,991 90,500 21,841 28,890 7,700Tennessee ............ 3,586,667 2,552,496 539,927 53,367 359,525 81,352 3,647,986 2,610,771 587,124 53,374 382,532 14,184Texas .................... 17,026,101 13,092,101 1,897,474 496,721 1,360,149 179,657 18,347,986 14,088,723 2,137,116 535,880 1,398,826 187,441Utah ...................... 1,549,329 1,056,617 357,775 29,649 96,067 9,221 1,518,242 1,041,674 368,343 27,676 74,741 5,807
Vermont ................ 638,802 418,565 117,522 33,396 20,831 48,487 671,163 436,793 127,245 35,179 19,998 51,946Virginia.................. 5,373,764 4,030,346 993,472 107,505 234,306 8,135 5,661,332 4,218,653 1,065,839 110,321 260,582 5,937Washington........... 4,227,668 3,063,890 718,834 200,853 205,022 39,068 4,381,186 3,234,041 699,110 207,742 199,704 40,589West Virginia......... 1,368,692 907,246 379,804 21,183 59,898 560 1,444,689 949,554 416,838 22,805 54,824 669Wisconsin ............. 4,705,538 3,143,174 1,227,904 77,197 178,714 78,548 4,904,809 3,212,515 1,360,394 77,351 170,732 83,818Wyoming............... 463,839 319,269 99,457 19,121 24,803 1,188 474,108 324,091 103,342 18,416 26,777 1,482Other jurisdictions
American Samoa ........ 21,887 14,048 2,716 2,370 2,172 582 24,662 15,725 3,040 2,858 2,253 785
Guam ................ — — — — — — — — — — — —Northern
Marianas ..... 38,687 28,042 7,555 1,847 833 410 43,548 30,217 7,986 2,505 2,840 0Puerto Rico ....... 1,514,026 1,244,372 173,270 3,105 25,177 68,101 1,876,195 1,430,330 214,335 6,665 24,985 199,880Virgin Islands .... 67,985 51,820 14,689 138 1,270 68 81,742 63,994 16,143 164 1,380 60
DIGEST OF EDUCATION STATISTICS 2005
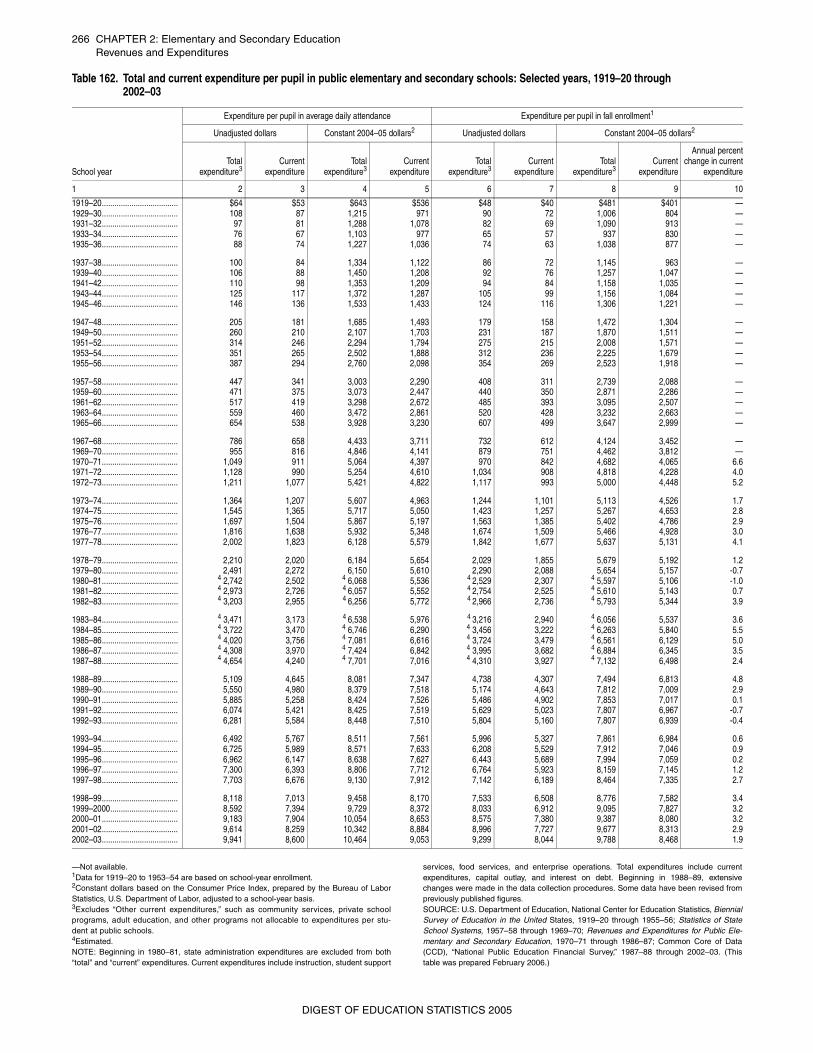
266 CHAPTER 2: Elementary and Secondary EducationRevenues and Expenditures
—Not available.1Data for 1919–20 to 1953–54 are based on school-year enrollment. 2Constant dollars based on the Consumer Price Index, prepared by the Bureau of LaborStatistics, U.S. Department of Labor, adjusted to a school-year basis. 3Excludes “Other current expenditures,” such as community services, private schoolprograms, adult education, and other programs not allocable to expenditures per stu-dent at public schools.4Estimated.NOTE: Beginning in 1980–81, state administration expenditures are excluded from both“total” and “current” expenditures. Current expenditures include instruction, student support
services, food services, and enterprise operations. Total expenditures include currentexpenditures, capital outlay, and interest on debt. Beginning in 1988–89, extensivechanges were made in the data collection procedures. Some data have been revised frompreviously published figures.SOURCE: U.S. Department of Education, National Center for Education Statistics, BiennialSurvey of Education in the United States, 1919–20 through 1955–56; Statistics of StateSchool Systems, 1957–58 through 1969–70; Revenues and Expenditures for Public Ele-mentary and Secondary Education, 1970–71 through 1986–87; Common Core of Data(CCD), “National Public Education Financial Survey,” 1987–88 through 2002–03. (Thistable was prepared February 2006.)
Table 162. Total and current expenditure per pupil in public elementary and secondary schools: Selected years, 1919–20 through 2002–03
School year
Expenditure per pupil in average daily attendance Expenditure per pupil in fall enrollment1
Unadjusted dollars Constant 2004–05 dollars2 Unadjusted dollars Constant 2004–05 dollars2
Totalexpenditure3
Currentexpenditure
Totalexpenditure3
Currentexpenditure
Totalexpenditure3
Currentexpenditure
Totalexpenditure3
Currentexpenditure
Annual percentchange in current
expenditure
1 2 3 4 5 6 7 8 9 10
1919–20.................................... $64 $53 $643 $536 $48 $40 $481 $401 —1929–30.................................... 108 87 1,215 971 90 72 1,006 804 —1931–32.................................... 97 81 1,288 1,078 82 69 1,090 913 —1933–34.................................... 76 67 1,103 977 65 57 937 830 —1935–36.................................... 88 74 1,227 1,036 74 63 1,038 877 —
1937–38.................................... 100 84 1,334 1,122 86 72 1,145 963 —1939–40.................................... 106 88 1,450 1,208 92 76 1,257 1,047 —1941–42.................................... 110 98 1,353 1,209 94 84 1,158 1,035 —1943–44.................................... 125 117 1,372 1,287 105 99 1,156 1,084 —1945–46.................................... 146 136 1,533 1,433 124 116 1,306 1,221 —
1947–48.................................... 205 181 1,685 1,493 179 158 1,472 1,304 —1949–50.................................... 260 210 2,107 1,703 231 187 1,870 1,511 —1951–52.................................... 314 246 2,294 1,794 275 215 2,008 1,571 —1953–54.................................... 351 265 2,502 1,888 312 236 2,225 1,679 —1955–56.................................... 387 294 2,760 2,098 354 269 2,523 1,918 —
1957–58.................................... 447 341 3,003 2,290 408 311 2,739 2,088 —1959–60.................................... 471 375 3,073 2,447 440 350 2,871 2,286 —1961–62.................................... 517 419 3,298 2,672 485 393 3,095 2,507 —1963–64.................................... 559 460 3,472 2,861 520 428 3,232 2,663 —1965–66.................................... 654 538 3,928 3,230 607 499 3,647 2,999 —
1967–68.................................... 786 658 4,433 3,711 732 612 4,124 3,452 —1969–70.................................... 955 816 4,846 4,141 879 751 4,462 3,812 —1970–71.................................... 1,049 911 5,064 4,397 970 842 4,682 4,065 6.61971–72.................................... 1,128 990 5,254 4,610 1,034 908 4,818 4,228 4.01972–73.................................... 1,211 1,077 5,421 4,822 1,117 993 5,000 4,448 5.2
1973–74.................................... 1,364 1,207 5,607 4,963 1,244 1,101 5,113 4,526 1.71974–75.................................... 1,545 1,365 5,717 5,050 1,423 1,257 5,267 4,653 2.81975–76.................................... 1,697 1,504 5,867 5,197 1,563 1,385 5,402 4,786 2.91976–77.................................... 1,816 1,638 5,932 5,348 1,674 1,509 5,466 4,928 3.01977–78.................................... 2,002 1,823 6,128 5,579 1,842 1,677 5,637 5,131 4.1
1978–79.................................... 2,210 2,020 6,184 5,654 2,029 1,855 5,679 5,192 1.21979–80.................................... 2,491 2,272 6,150 5,610 2,290 2,088 5,654 5,157 -0.71980–81.................................... 4 2,742 2,502 4 6,068 5,536 4 2,529 2,307 4 5,597 5,106 -1.01981–82.................................... 4 2,973 2,726 4 6,057 5,552 4 2,754 2,525 4 5,610 5,143 0.71982–83.................................... 4 3,203 2,955 4 6,256 5,772 4 2,966 2,736 4 5,793 5,344 3.9
1983–84.................................... 4 3,471 3,173 4 6,538 5,976 4 3,216 2,940 4 6,056 5,537 3.61984–85.................................... 4 3,722 3,470 4 6,746 6,290 4 3,456 3,222 4 6,263 5,840 5.51985–86.................................... 4 4,020 3,756 4 7,081 6,616 4 3,724 3,479 4 6,561 6,129 5.01986–87.................................... 4 4,308 3,970 4 7,424 6,842 4 3,995 3,682 4 6,884 6,345 3.51987–88.................................... 4 4,654 4,240 4 7,701 7,016 4 4,310 3,927 4 7,132 6,498 2.4
1988–89.................................... 5,109 4,645 8,081 7,347 4,738 4,307 7,494 6,813 4.81989–90.................................... 5,550 4,980 8,379 7,518 5,174 4,643 7,812 7,009 2.91990–91.................................... 5,885 5,258 8,424 7,526 5,486 4,902 7,853 7,017 0.11991–92.................................... 6,074 5,421 8,425 7,519 5,629 5,023 7,807 6,967 -0.71992–93.................................... 6,281 5,584 8,448 7,510 5,804 5,160 7,807 6,939 -0.4
1993–94.................................... 6,492 5,767 8,511 7,561 5,996 5,327 7,861 6,984 0.61994–95.................................... 6,725 5,989 8,571 7,633 6,208 5,529 7,912 7,046 0.91995–96.................................... 6,962 6,147 8,638 7,627 6,443 5,689 7,994 7,059 0.21996–97.................................... 7,300 6,393 8,806 7,712 6,764 5,923 8,159 7,145 1.21997–98.................................... 7,703 6,676 9,130 7,912 7,142 6,189 8,464 7,335 2.7
1998–99.................................... 8,118 7,013 9,458 8,170 7,533 6,508 8,776 7,582 3.41999–2000................................ 8,592 7,394 9,729 8,372 8,033 6,912 9,095 7,827 3.22000–01.................................... 9,183 7,904 10,054 8,653 8,575 7,380 9,387 8,080 3.22001–02.................................... 9,614 8,259 10,342 8,884 8,996 7,727 9,677 8,313 2.92002–03.................................... 9,941 8,600 10,464 9,053 9,299 8,044 9,788 8,468 1.9
DIGEST OF EDUCATION STATISTICS 2005
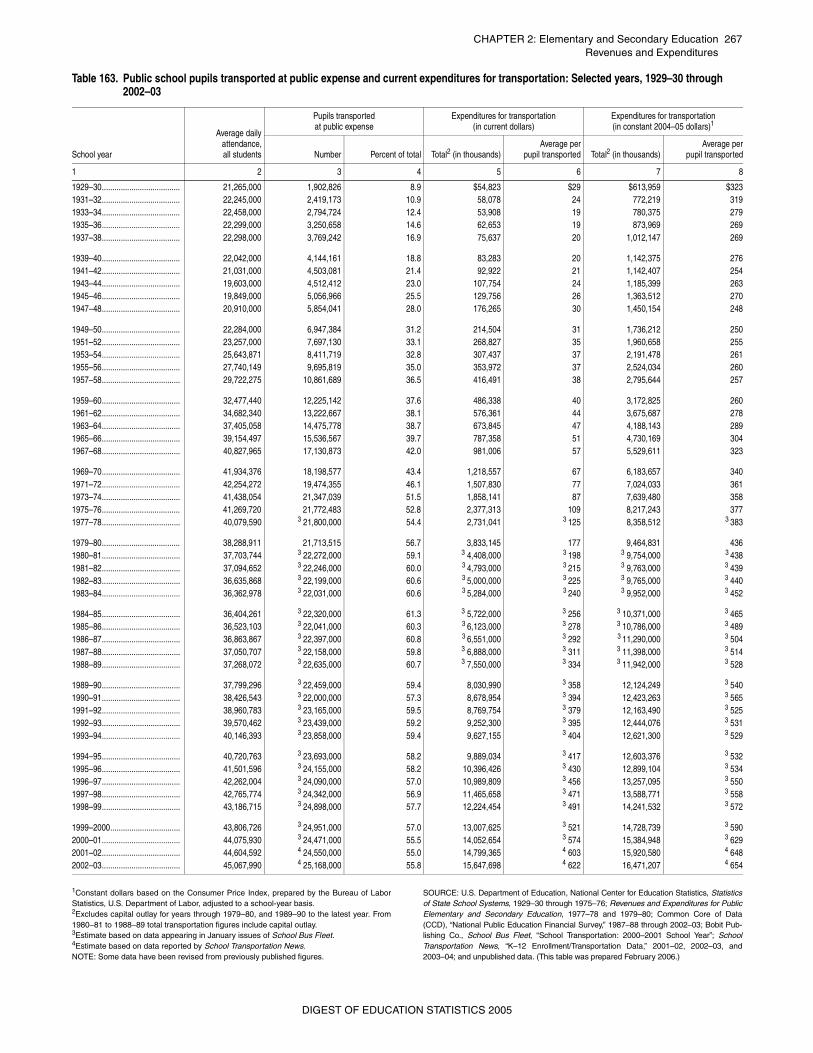
CHAPTER 2: Elementary and Secondary Education 267Revenues and Expenditures
1Constant dollars based on the Consumer Price Index, prepared by the Bureau of LaborStatistics, U.S. Department of Labor, adjusted to a school-year basis. 2Excludes capital outlay for years through 1979–80, and 1989–90 to the latest year. From1980–81 to 1988–89 total transportation figures include capital outlay.3Estimate based on data appearing in January issues of School Bus Fleet. 4Estimate based on data reported by School Transportation News.NOTE: Some data have been revised from previously published figures.
SOURCE: U.S. Department of Education, National Center for Education Statistics, Statisticsof State School Systems, 1929–30 through 1975–76; Revenues and Expenditures for PublicElementary and Secondary Education, 1977–78 and 1979–80; Common Core of Data(CCD), “National Public Education Financial Survey,” 1987–88 through 2002–03; Bobit Pub-lishing Co., School Bus Fleet, “School Transportation: 2000–2001 School Year”; SchoolTransportation News, “K–12 Enrollment/Transportation Data,” 2001–02, 2002–03, and2003–04; and unpublished data. (This table was prepared February 2006.)
Table 163. Public school pupils transported at public expense and current expenditures for transportation: Selected years, 1929–30 through 2002–03
School year
Average dailyattendance,all students
Pupils transported at public expense
Expenditures for transportation (in current dollars)
Expenditures for transportation(in constant 2004–05 dollars)1
Number Percent of total Total2 (in thousands)Average per
pupil transported Total2 (in thousands)Average per
pupil transported
1 2 3 4 5 6 7 8
1929–30..................................... 21,265,000 1,902,826 8.9 $54,823 $29 $613,959 $3231931–32..................................... 22,245,000 2,419,173 10.9 58,078 24 772,219 3191933–34..................................... 22,458,000 2,794,724 12.4 53,908 19 780,375 2791935–36..................................... 22,299,000 3,250,658 14.6 62,653 19 873,969 2691937–38..................................... 22,298,000 3,769,242 16.9 75,637 20 1,012,147 269
1939–40..................................... 22,042,000 4,144,161 18.8 83,283 20 1,142,375 2761941–42..................................... 21,031,000 4,503,081 21.4 92,922 21 1,142,407 2541943–44..................................... 19,603,000 4,512,412 23.0 107,754 24 1,185,399 2631945–46..................................... 19,849,000 5,056,966 25.5 129,756 26 1,363,512 2701947–48..................................... 20,910,000 5,854,041 28.0 176,265 30 1,450,154 248
1949–50..................................... 22,284,000 6,947,384 31.2 214,504 31 1,736,212 2501951–52..................................... 23,257,000 7,697,130 33.1 268,827 35 1,960,658 2551953–54..................................... 25,643,871 8,411,719 32.8 307,437 37 2,191,478 2611955–56..................................... 27,740,149 9,695,819 35.0 353,972 37 2,524,034 2601957–58..................................... 29,722,275 10,861,689 36.5 416,491 38 2,795,644 257
1959–60..................................... 32,477,440 12,225,142 37.6 486,338 40 3,172,825 2601961–62..................................... 34,682,340 13,222,667 38.1 576,361 44 3,675,687 2781963–64..................................... 37,405,058 14,475,778 38.7 673,845 47 4,188,143 2891965–66..................................... 39,154,497 15,536,567 39.7 787,358 51 4,730,169 3041967–68..................................... 40,827,965 17,130,873 42.0 981,006 57 5,529,611 323
1969–70..................................... 41,934,376 18,198,577 43.4 1,218,557 67 6,183,657 3401971–72..................................... 42,254,272 19,474,355 46.1 1,507,830 77 7,024,033 3611973–74..................................... 41,438,054 21,347,039 51.5 1,858,141 87 7,639,480 3581975–76..................................... 41,269,720 21,772,483 52.8 2,377,313 109 8,217,243 3771977–78..................................... 40,079,590 3 21,800,000 54.4 2,731,041 3 125 8,358,512 3 383
1979–80..................................... 38,288,911 21,713,515 56.7 3,833,145 177 9,464,831 4361980–81..................................... 37,703,744 3 22,272,000 59.1 3 4,408,000 3 198 3 9,754,000 3 4381981–82..................................... 37,094,652 3 22,246,000 60.0 3 4,793,000 3 215 3 9,763,000 3 4391982–83..................................... 36,635,868 3 22,199,000 60.6 3 5,000,000 3 225 3 9,765,000 3 4401983–84..................................... 36,362,978 3 22,031,000 60.6 3 5,284,000 3 240 3 9,952,000 3 452
1984–85..................................... 36,404,261 3 22,320,000 61.3 3 5,722,000 3 256 3 10,371,000 3 4651985–86..................................... 36,523,103 3 22,041,000 60.3 3 6,123,000 3 278 3 10,786,000 3 4891986–87..................................... 36,863,867 3 22,397,000 60.8 3 6,551,000 3 292 3 11,290,000 3 5041987–88..................................... 37,050,707 3 22,158,000 59.8 3 6,888,000 3 311 3 11,398,000 3 5141988–89..................................... 37,268,072 3 22,635,000 60.7 3 7,550,000 3 334 3 11,942,000 3 528
1989–90..................................... 37,799,296 3 22,459,000 59.4 8,030,990 3 358 12,124,249 3 5401990–91..................................... 38,426,543 3 22,000,000 57.3 8,678,954 3 394 12,423,263 3 5651991–92..................................... 38,960,783 3 23,165,000 59.5 8,769,754 3 379 12,163,490 3 5251992–93..................................... 39,570,462 3 23,439,000 59.2 9,252,300 3 395 12,444,076 3 5311993–94..................................... 40,146,393 3 23,858,000 59.4 9,627,155 3 404 12,621,300 3 529
1994–95..................................... 40,720,763 3 23,693,000 58.2 9,889,034 3 417 12,603,376 3 5321995–96..................................... 41,501,596 3 24,155,000 58.2 10,396,426 3 430 12,899,104 3 5341996–97..................................... 42,262,004 3 24,090,000 57.0 10,989,809 3 456 13,257,095 3 5501997–98..................................... 42,765,774 3 24,342,000 56.9 11,465,658 3 471 13,588,771 3 5581998–99..................................... 43,186,715 3 24,898,000 57.7 12,224,454 3 491 14,241,532 3 572
1999–2000................................. 43,806,726 3 24,951,000 57.0 13,007,625 3 521 14,728,739 3 5902000–01..................................... 44,075,930 3 24,471,000 55.5 14,052,654 3 574 15,384,948 3 6292001–02..................................... 44,604,592 4 24,550,000 55.0 14,799,365 4 603 15,920,580 4 6482002–03..................................... 45,067,990 4 25,168,000 55.8 15,647,698 4 622 16,471,207 4 654
DIGEST OF EDUCATION STATISTICS 2005
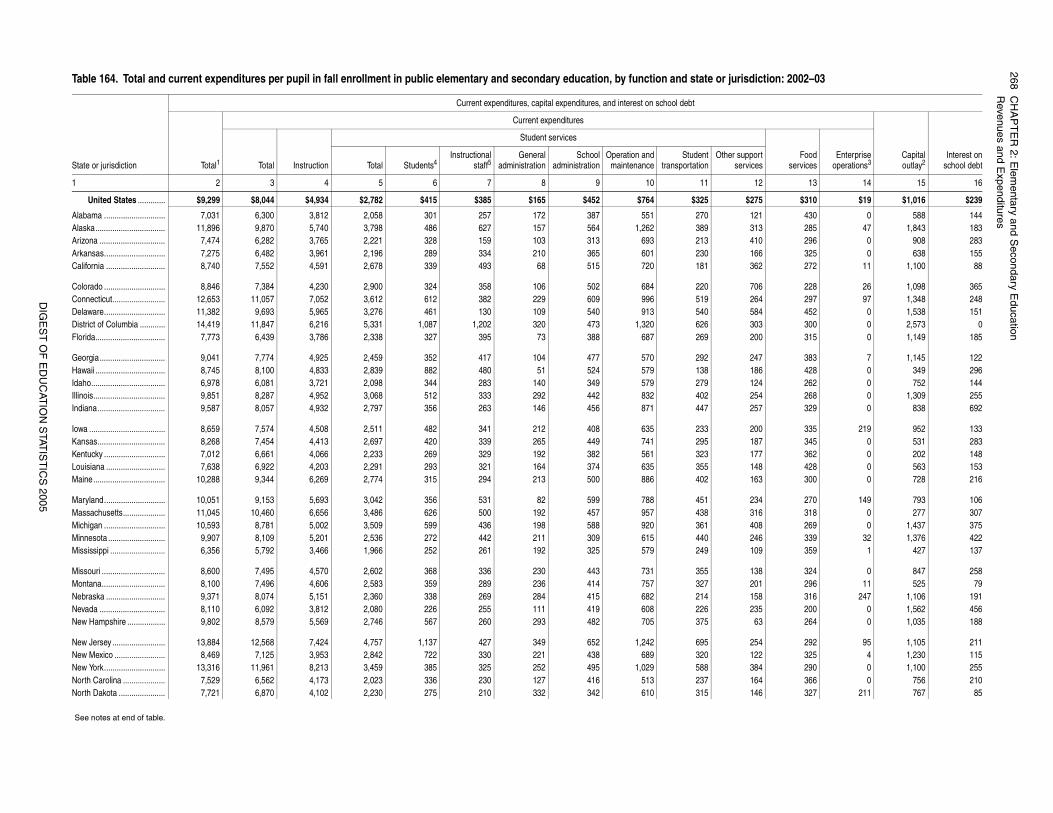
268C
HA
PT
ER
2: Elem
entary and Secondary E
ducationR
evenues and Expenditures
DIG
ES
T O
F E
DU
CAT
ION
STAT
IST
ICS
2005
iction: 2002–03
Capitaloutlay2
Interest onschool debt
Foodservices
Enterpriseoperations3
rtes
12 13 14 15 16
75 $310 $19 $1,016 $239
1 430 0 588 14413 285 47 1,843 183
0 296 0 908 28366 325 0 638 155
2 272 11 1,100 88
06 228 26 1,098 36564 297 97 1,348 24884 452 0 1,538 15103 300 0 2,573 000 315 0 1,149 185
7 383 7 1,145 12286 428 0 349 2964 262 0 752 144
54 268 0 1,309 2557 329 0 838 692
0 335 219 952 13387 345 0 531 283
7 362 0 202 14848 428 0 563 153
3 300 0 728 216
34 270 149 793 1066 318 0 277 3078 269 0 1,437 375
46 339 32 1,376 42209 359 1 427 137
8 324 0 847 25801 296 11 525 79
8 316 247 1,106 1915 200 0 1,562 456
63 264 0 1,035 188
54 292 95 1,105 2112 325 4 1,230 1154 290 0 1,100 2554 366 0 756 210
46 327 211 767 85
Table 164. Total and current expenditures per pupil in fall enrollment in public elementary and secondary education, by function and state or jurisd
State or jurisdiction
Current expenditures, capital expenditures, and interest on school debt
Total1
Current expenditures
Total Instruction
Student services
Total Students4Instructional
staff5General
administrationSchool
administrationOperation and
maintenanceStudent
transportationOther suppo
servic
1 2 3 4 5 6 7 8 9 10 11
United States ............. $9,299 $8,044 $4,934 $2,782 $415 $385 $165 $452 $764 $325 $2
Alabama ............................. 7,031 6,300 3,812 2,058 301 257 172 387 551 270 12Alaska................................. 11,896 9,870 5,740 3,798 486 627 157 564 1,262 389 3Arizona ............................... 7,474 6,282 3,765 2,221 328 159 103 313 693 213 41Arkansas............................. 7,275 6,482 3,961 2,196 289 334 210 365 601 230 1California ............................ 8,740 7,552 4,591 2,678 339 493 68 515 720 181 36
Colorado ............................. 8,846 7,384 4,230 2,900 324 358 106 502 684 220 7Connecticut......................... 12,653 11,057 7,052 3,612 612 382 229 609 996 519 2Delaware............................. 11,382 9,693 5,965 3,276 461 130 109 540 913 540 5District of Columbia ............ 14,419 11,847 6,216 5,331 1,087 1,202 320 473 1,320 626 3Florida................................. 7,773 6,439 3,786 2,338 327 395 73 388 687 269 2
Georgia............................... 9,041 7,774 4,925 2,459 352 417 104 477 570 292 24Hawaii ................................. 8,745 8,100 4,833 2,839 882 480 51 524 579 138 1Idaho................................... 6,978 6,081 3,721 2,098 344 283 140 349 579 279 12Illinois.................................. 9,851 8,287 4,952 3,068 512 333 292 442 832 402 2Indiana................................ 9,587 8,057 4,932 2,797 356 263 146 456 871 447 25
Iowa .................................... 8,659 7,574 4,508 2,511 482 341 212 408 635 233 20Kansas................................ 8,268 7,454 4,413 2,697 420 339 265 449 741 295 1Kentucky ............................. 7,012 6,661 4,066 2,233 269 329 192 382 561 323 17Louisiana ............................ 7,638 6,922 4,203 2,291 293 321 164 374 635 355 1Maine.................................. 10,288 9,344 6,269 2,774 315 294 213 500 886 402 16
Maryland............................. 10,051 9,153 5,693 3,042 356 531 82 599 788 451 2Massachusetts.................... 11,045 10,460 6,656 3,486 626 500 192 457 957 438 31Michigan ............................. 10,593 8,781 5,002 3,509 599 436 198 588 920 361 40Minnesota ........................... 9,907 8,109 5,201 2,536 272 442 211 309 615 440 2Mississippi .......................... 6,356 5,792 3,466 1,966 252 261 192 325 579 249 1
Missouri .............................. 8,600 7,495 4,570 2,602 368 336 230 443 731 355 13Montana.............................. 8,100 7,496 4,606 2,583 359 289 236 414 757 327 2Nebraska ............................ 9,371 8,074 5,151 2,360 338 269 284 415 682 214 15Nevada ............................... 8,110 6,092 3,812 2,080 226 255 111 419 608 226 23New Hampshire .................. 9,802 8,579 5,569 2,746 567 260 293 482 705 375
New Jersey ......................... 13,884 12,568 7,424 4,757 1,137 427 349 652 1,242 695 2New Mexico ........................ 8,469 7,125 3,953 2,842 722 330 221 438 689 320 12New York............................. 13,316 11,961 8,213 3,459 385 325 252 495 1,029 588 38North Carolina .................... 7,529 6,562 4,173 2,023 336 230 127 416 513 237 16North Dakota ...................... 7,721 6,870 4,102 2,230 275 210 332 342 610 315 1
See notes at end of table.

CH
AP
TE
R 2: E
lementary and S
econdary Education
269R
evenues and Expenditures
DIG
ES
T O
F E
DU
CAT
ION
STAT
IST
ICS
2005
ning, libraries, and media and computer centers.. “0” indicates none or less than $0.50. Some data have been to totals because of rounding.r Education Statistics, Common Core of Data (CCD), “National prepared July 2005.)
8 285 1 1,274 19099 334 69 436 84
8 253 2 1,093 33683 315 36 1,039 4106 267 0 199 184
6 351 25 1,262 27649 332 17 942 16792 300 0 691 1539 360 0 1,118 3436 258 16 950 181
9 275 8 466 1549 306 2 908 1248 237 116 1,184 319
18 463 0 580 379 289 0 775 5684 286 1 1,252 76
79 540 0 249 0— — — — —48 211 0 36 03 509 0 32 31
23 171 42 323 0
iction: 2002–03—Continued
Capitaloutlay2
Interest onschool debt
Foodservices
Enterpriseoperations3
rtes
12 13 14 15 16
—Not available. 1Excludes “Other current expenditures,” such as community services, private school programs, adult education, and otherprograms not allocable to expenditures per pupil in public schools.2Includes expenditures for property and for buildings and alterations completed by school district staff or contractors. 3Includes expenditures for operations funded by sales of products or services (e.g., school bookstore or computer time).4Includes expenditures for health, attendance, and speech pathology services.
5Includes expenditures for curriculum development, staff traiNOTE: Excludes expenditures for state education agenciesrevised from previously published figures. Detail may not sumSOURCE: U.S. Department of Education, National Center foPublic Education Financial Survey,” 2002–03. (This table was
Ohio .................................... 10,096 8,632 4,956 3,390 514 544 243 525 803 384 37Oklahoma ........................... 6,611 6,092 3,528 2,160 395 197 170 328 676 196 1Oregon................................ 8,921 7,491 4,438 2,798 500 292 110 482 618 329 46Pennsylvania....................... 10,445 8,997 5,557 3,088 436 335 271 398 920 444 2Rhode Island ...................... 10,731 10,349 6,685 3,396 826 432 141 532 811 408 24
South Carolina.................... 8,577 7,040 4,199 2,464 476 452 89 414 628 219 18South Dakota ...................... 7,656 6,547 3,836 2,361 363 332 231 338 635 213 2Tennessee .......................... 6,962 6,118 3,933 1,885 216 333 124 325 582 213Texas .................................. 8,598 7,136 4,307 2,469 347 404 116 392 757 193 25Utah .................................... 5,969 4,838 3,103 1,461 180 229 54 295 446 151 10
Vermont .............................. 11,075 10,454 6,713 3,458 742 380 268 719 809 330 20Virginia................................ 8,854 7,822 4,809 2,705 376 489 118 463 771 369 11Washington......................... 8,755 7,252 4,317 2,582 506 328 166 345 719 280 23West Virginia....................... 8,936 8,319 5,115 2,742 287 230 226 467 857 557 1Wisconsin ........................... 10,347 9,004 5,566 3,149 410 468 244 466 802 350 40Wyoming............................. 10,313 8,985 5,381 3,317 526 447 203 511 935 382 31
Other jurisdictionsAmerican Samoa ........... 3,225 2,976 1,543 893 127 184 39 140 283 40Guam ............................. — — — — — — — — — —Northern Marianas......... 4,555 4,519 3,871 437 58 14 307 0 0 9Puerto Rico .................... 4,324 4,260 3,145 606 87 76 25 0 220 95 10Virgin Islands ................. 7,163 6,840 4,459 2,168 385 215 332 388 486 239 1
Table 164. Total and current expenditures per pupil in fall enrollment in public elementary and secondary education, by function and state or jurisd
State or jurisdiction
Current expenditures, capital expenditures, and interest on school debt
Total1
Current expenditures
Total Instruction
Student services
Total Students4Instructional
staff5General
administrationSchool
administrationOperation and
maintenanceStudent
transportationOther suppo
servic
1 2 3 4 5 6 7 8 9 10 11
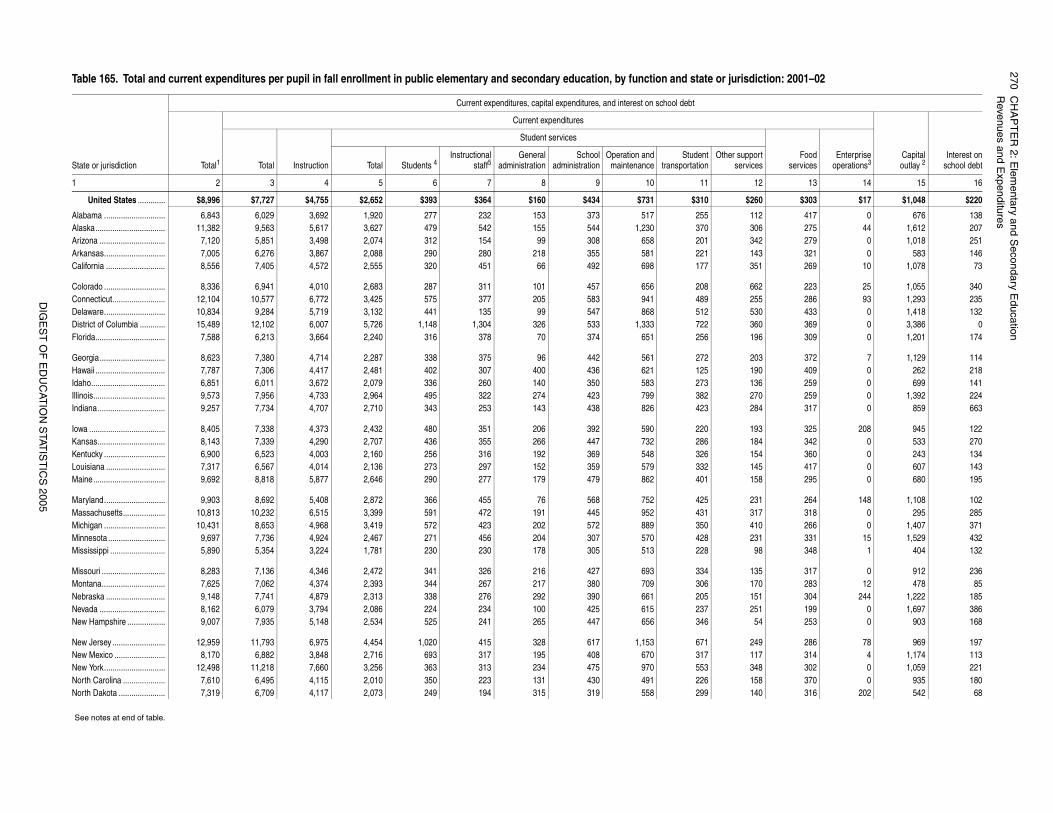
270C
HA
PT
ER
2: Elem
entary and Secondary E
ducationR
evenues and Expenditures
DIG
ES
T O
F E
DU
CAT
ION
STAT
IST
ICS
2005
iction: 2001–02
Capitaloutlay 2
Interest onschool debt
Foodservices
Enterpriseoperations3
rtes
12 13 14 15 16
60 $303 $17 $1,048 $220
2 417 0 676 13806 275 44 1,612 20742 279 0 1,018 251
3 321 0 583 1461 269 10 1,078 73
2 223 25 1,055 3405 286 93 1,293 235
30 433 0 1,418 13260 369 0 3,386 096 309 0 1,201 174
03 372 7 1,129 1140 409 0 262 2186 259 0 699 1410 259 0 1,392 224
84 317 0 859 663
3 325 208 945 1224 342 0 533 2704 360 0 243 134
45 417 0 607 1438 295 0 680 195
31 264 148 1,108 1027 318 0 295 2850 266 0 1,407 371
31 331 15 1,529 43298 348 1 404 132
5 317 0 912 23670 283 12 478 85
1 304 244 1,222 1851 199 0 1,697 386
54 253 0 903 168
49 286 78 969 1977 314 4 1,174 1138 302 0 1,059 2218 370 0 935 180
40 316 202 542 68
Table 165. Total and current expenditures per pupil in fall enrollment in public elementary and secondary education, by function and state or jurisd
State or jurisdiction
Current expenditures, capital expenditures, and interest on school debt
Total1
Current expenditures
Total Instruction
Student services
Total Students 4Instructional
staff5General
administrationSchool
administrationOperation and
maintenanceStudent
transportationOther suppo
servic
1 2 3 4 5 6 7 8 9 10 11
United States ............. $8,996 $7,727 $4,755 $2,652 $393 $364 $160 $434 $731 $310 $2
Alabama ............................. 6,843 6,029 3,692 1,920 277 232 153 373 517 255 11Alaska................................. 11,382 9,563 5,617 3,627 479 542 155 544 1,230 370 3Arizona ............................... 7,120 5,851 3,498 2,074 312 154 99 308 658 201 3Arkansas............................. 7,005 6,276 3,867 2,088 290 280 218 355 581 221 14California ............................ 8,556 7,405 4,572 2,555 320 451 66 492 698 177 35
Colorado ............................. 8,336 6,941 4,010 2,683 287 311 101 457 656 208 66Connecticut......................... 12,104 10,577 6,772 3,425 575 377 205 583 941 489 25Delaware............................. 10,834 9,284 5,719 3,132 441 135 99 547 868 512 5District of Columbia ............ 15,489 12,102 6,007 5,726 1,148 1,304 326 533 1,333 722 3Florida................................. 7,588 6,213 3,664 2,240 316 378 70 374 651 256 1
Georgia............................... 8,623 7,380 4,714 2,287 338 375 96 442 561 272 2Hawaii ................................. 7,787 7,306 4,417 2,481 402 307 400 436 621 125 19Idaho................................... 6,851 6,011 3,672 2,079 336 260 140 350 583 273 13Illinois.................................. 9,573 7,956 4,733 2,964 495 322 274 423 799 382 27Indiana................................ 9,257 7,734 4,707 2,710 343 253 143 438 826 423 2
Iowa .................................... 8,405 7,338 4,373 2,432 480 351 206 392 590 220 19Kansas................................ 8,143 7,339 4,290 2,707 436 355 266 447 732 286 18Kentucky ............................. 6,900 6,523 4,003 2,160 256 316 192 369 548 326 15Louisiana ............................ 7,317 6,567 4,014 2,136 273 297 152 359 579 332 1Maine.................................. 9,692 8,818 5,877 2,646 290 277 179 479 862 401 15
Maryland............................. 9,903 8,692 5,408 2,872 366 455 76 568 752 425 2Massachusetts.................... 10,813 10,232 6,515 3,399 591 472 191 445 952 431 31Michigan ............................. 10,431 8,653 4,968 3,419 572 423 202 572 889 350 41Minnesota ........................... 9,697 7,736 4,924 2,467 271 456 204 307 570 428 2Mississippi .......................... 5,890 5,354 3,224 1,781 230 230 178 305 513 228
Missouri .............................. 8,283 7,136 4,346 2,472 341 326 216 427 693 334 13Montana.............................. 7,625 7,062 4,374 2,393 344 267 217 380 709 306 1Nebraska ............................ 9,148 7,741 4,879 2,313 338 276 292 390 661 205 15Nevada ............................... 8,162 6,079 3,794 2,086 224 234 100 425 615 237 25New Hampshire .................. 9,007 7,935 5,148 2,534 525 241 265 447 656 346
New Jersey ......................... 12,959 11,793 6,975 4,454 1,020 415 328 617 1,153 671 2New Mexico ........................ 8,170 6,882 3,848 2,716 693 317 195 408 670 317 11New York............................. 12,498 11,218 7,660 3,256 363 313 234 475 970 553 34North Carolina .................... 7,610 6,495 4,115 2,010 350 223 131 430 491 226 15North Dakota ...................... 7,319 6,709 4,117 2,073 249 194 315 319 558 299 1
See notes at end of table.
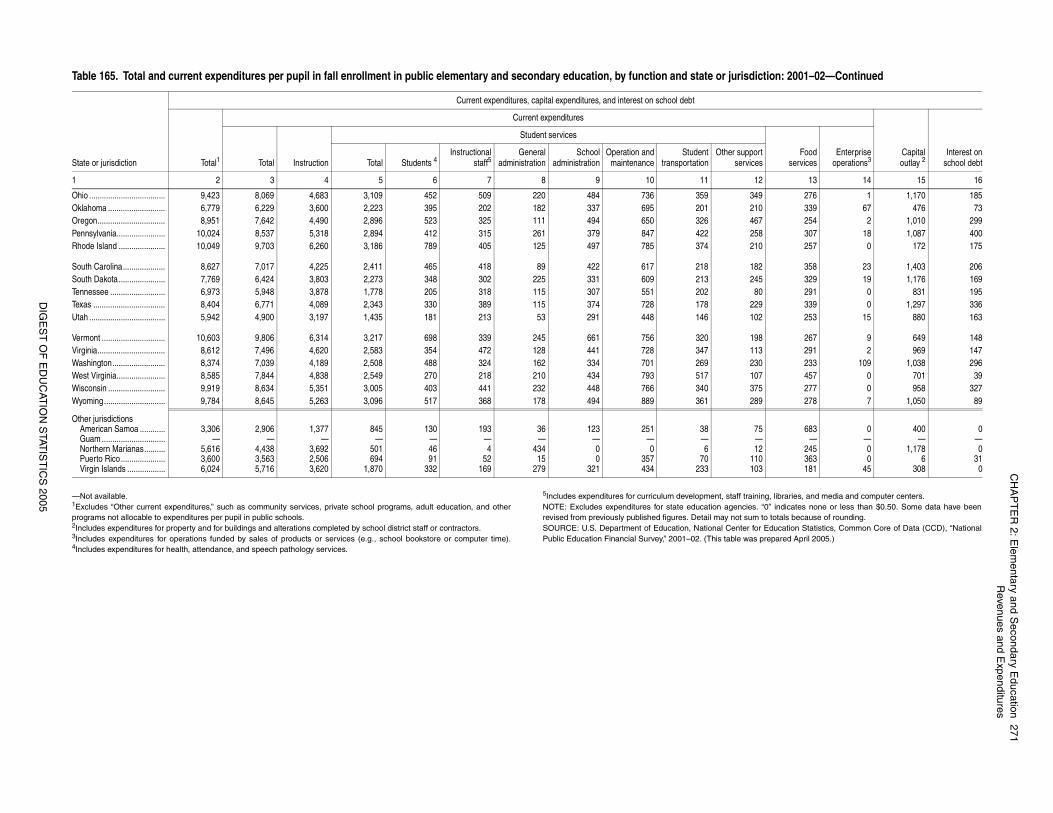
CH
AP
TE
R 2: E
lementary and S
econdary Education
271R
evenues and Expenditures
DIG
ES
T O
F E
DU
CAT
ION
STAT
IST
ICS
2005
ning, libraries, and media and computer centers.. “0” indicates none or less than $0.50. Some data have been to totals because of rounding.r Education Statistics, Common Core of Data (CCD), “National prepared April 2005.)
9 276 1 1,170 18510 339 67 476 73
7 254 2 1,010 29958 307 18 1,087 4000 257 0 172 175
2 358 23 1,403 20645 329 19 1,176 16980 291 0 831 1959 339 0 1,297 3362 253 15 880 163
98 267 9 649 1483 291 2 969 1470 233 109 1,038 296
07 457 0 701 395 277 0 958 3279 278 7 1,050 89
75 683 0 400 0— — — — —2 245 0 1,178 0
10 363 0 6 3103 181 45 308 0
iction: 2001–02—Continued
Capitaloutlay 2
Interest onschool debt
Foodservices
Enterpriseoperations3
rtes
12 13 14 15 16
—Not available. 1Excludes “Other current expenditures,” such as community services, private school programs, adult education, and otherprograms not allocable to expenditures per pupil in public schools.2Includes expenditures for property and for buildings and alterations completed by school district staff or contractors. 3Includes expenditures for operations funded by sales of products or services (e.g., school bookstore or computer time).4Includes expenditures for health, attendance, and speech pathology services.
5Includes expenditures for curriculum development, staff traiNOTE: Excludes expenditures for state education agenciesrevised from previously published figures. Detail may not sumSOURCE: U.S. Department of Education, National Center foPublic Education Financial Survey,” 2001–02. (This table was
Ohio .................................... 9,423 8,069 4,683 3,109 452 509 220 484 736 359 34Oklahoma ........................... 6,779 6,229 3,600 2,223 395 202 182 337 695 201 2Oregon................................ 8,951 7,642 4,490 2,896 523 325 111 494 650 326 46Pennsylvania....................... 10,024 8,537 5,318 2,894 412 315 261 379 847 422 2Rhode Island ...................... 10,049 9,703 6,260 3,186 789 405 125 497 785 374 21
South Carolina.................... 8,627 7,017 4,225 2,411 465 418 89 422 617 218 18South Dakota ...................... 7,769 6,424 3,803 2,273 348 302 225 331 609 213 2Tennessee .......................... 6,973 5,948 3,878 1,778 205 318 115 307 551 202Texas .................................. 8,404 6,771 4,089 2,343 330 389 115 374 728 178 22Utah .................................... 5,942 4,900 3,197 1,435 181 213 53 291 448 146 10
Vermont .............................. 10,603 9,806 6,314 3,217 698 339 245 661 756 320 1Virginia................................ 8,612 7,496 4,620 2,583 354 472 128 441 728 347 11Washington......................... 8,374 7,039 4,189 2,508 488 324 162 334 701 269 23West Virginia....................... 8,585 7,844 4,838 2,549 270 218 210 434 793 517 1Wisconsin ........................... 9,919 8,634 5,351 3,005 403 441 232 448 766 340 37Wyoming............................. 9,784 8,645 5,263 3,096 517 368 178 494 889 361 28
Other jurisdictionsAmerican Samoa ............ 3,306 2,906 1,377 845 130 193 36 123 251 38Guam .............................. — — — — — — — — — —Northern Marianas.......... 5,616 4,438 3,692 501 46 4 434 0 0 6 1Puerto Rico ..................... 3,600 3,563 2,506 694 91 52 15 0 357 70 1Virgin Islands .................. 6,024 5,716 3,620 1,870 332 169 279 321 434 233 1
Table 165. Total and current expenditures per pupil in fall enrollment in public elementary and secondary education, by function and state or jurisd
State or jurisdiction
Current expenditures, capital expenditures, and interest on school debt
Total1
Current expenditures
Total Instruction
Student services
Total Students 4Instructional
staff5General
administrationSchool
administrationOperation and
maintenanceStudent
transportationOther suppo
servic
1 2 3 4 5 6 7 8 9 10 11
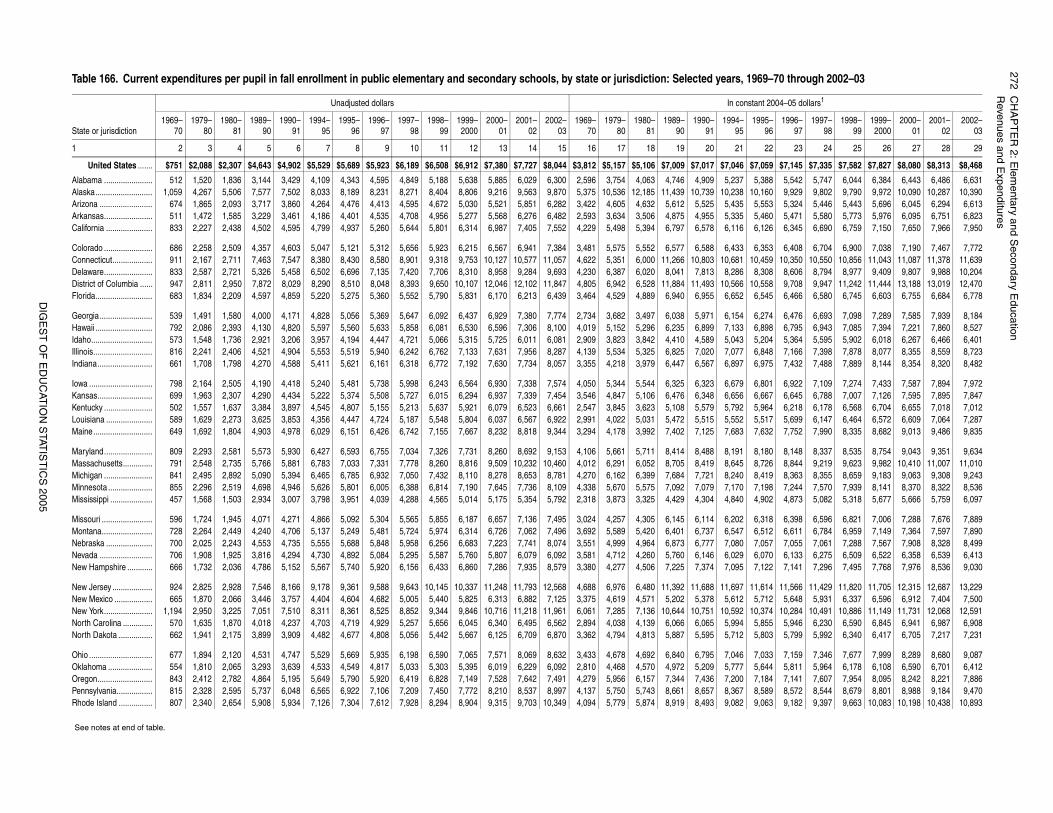
272C
HA
PT
ER
2: Elem
entary and Secondary E
ducationR
evenues and Expenditures
DIG
ES
T O
F E
DU
CAT
ION
STAT
IST
ICS
2005
69–70 through 2002–03
nt 2004–05 dollars1
995–96
1996–97
1997–98
1998–99
1999–2000
2000–01
2001–02
2002–03
22 23 24 25 26 27 28 29
7,059 $7,145 $7,335 $7,582 $7,827 $8,080 $8,313 $8,468
,388 5,542 5,747 6,044 6,384 6,443 6,486 6,631,160 9,929 9,802 9,790 9,972 10,090 10,287 10,390,553 5,324 5,446 5,443 5,696 6,045 6,294 6,613,460 5,471 5,580 5,773 5,976 6,095 6,751 6,823,126 6,345 6,690 6,759 7,150 7,650 7,966 7,950
,353 6,408 6,704 6,900 7,038 7,190 7,467 7,772,459 10,350 10,550 10,856 11,043 11,087 11,378 11,639,308 8,606 8,794 8,977 9,409 9,807 9,988 10,204,558 9,708 9,947 11,242 11,444 13,188 13,019 12,470,545 6,466 6,580 6,745 6,603 6,755 6,684 6,778
,274 6,476 6,693 7,098 7,289 7,585 7,939 8,184,898 6,795 6,943 7,085 7,394 7,221 7,860 8,527,204 5,364 5,595 5,902 6,018 6,267 6,466 6,401,848 7,166 7,398 7,878 8,077 8,355 8,559 8,723,975 7,432 7,488 7,889 8,144 8,354 8,320 8,482
,801 6,922 7,109 7,274 7,433 7,587 7,894 7,972,667 6,645 6,788 7,007 7,126 7,595 7,895 7,847,964 6,218 6,178 6,568 6,704 6,655 7,018 7,012,517 5,699 6,147 6,464 6,572 6,609 7,064 7,287,632 7,752 7,990 8,335 8,682 9,013 9,486 9,835
,180 8,148 8,337 8,535 8,754 9,043 9,351 9,634,726 8,844 9,219 9,623 9,982 10,410 11,007 11,010,419 8,363 8,355 8,659 9,183 9,063 9,308 9,243,198 7,244 7,570 7,939 8,141 8,370 8,322 8,536,902 4,873 5,082 5,318 5,677 5,666 5,759 6,097
,318 6,398 6,596 6,821 7,006 7,288 7,676 7,889,512 6,611 6,784 6,959 7,149 7,364 7,597 7,890,057 7,055 7,061 7,288 7,567 7,908 8,328 8,499,070 6,133 6,275 6,509 6,522 6,358 6,539 6,413,122 7,141 7,296 7,495 7,768 7,976 8,536 9,030
,614 11,566 11,429 11,820 11,705 12,315 12,687 13,229,712 5,648 5,931 6,337 6,596 6,912 7,404 7,500,374 10,284 10,491 10,886 11,149 11,731 12,068 12,591,855 5,946 6,230 6,590 6,845 6,941 6,987 6,908,803 5,799 5,992 6,340 6,417 6,705 7,217 7,231
,033 7,159 7,346 7,677 7,999 8,289 8,680 9,087,644 5,811 5,964 6,178 6,108 6,590 6,701 6,412,184 7,141 7,607 7,954 8,095 8,242 8,221 7,886,589 8,572 8,544 8,679 8,801 8,988 9,184 9,470,063 9,182 9,397 9,663 10,083 10,198 10,438 10,893
Table 166. Current expenditures per pupil in fall enrollment in public elementary and secondary schools, by state or jurisdiction: Selected years, 19
State or jurisdiction
Unadjusted dollars In consta
1969–70
1979–80
1980–81
1989–90
1990–91
1994–95
1995–96
1996–97
1997–98
1998–99
1999–2000
2000–01
2001–02
2002–03
1969–70
1979–80
1980–81
1989–90
1990–91
1994–95
1
1 2 3 4 5 6 7 8 9 10 11 12 13 14 15 16 17 18 19 20 21
United States ....... $751 $2,088 $2,307 $4,643 $4,902 $5,529 $5,689 $5,923 $6,189 $6,508 $6,912 $7,380 $7,727 $8,044 $3,812 $5,157 $5,106 $7,009 $7,017 $7,046 $
Alabama ....................... 512 1,520 1,836 3,144 3,429 4,109 4,343 4,595 4,849 5,188 5,638 5,885 6,029 6,300 2,596 3,754 4,063 4,746 4,909 5,237 5Alaska........................... 1,059 4,267 5,506 7,577 7,502 8,033 8,189 8,231 8,271 8,404 8,806 9,216 9,563 9,870 5,375 10,536 12,185 11,439 10,739 10,238 10Arizona ......................... 674 1,865 2,093 3,717 3,860 4,264 4,476 4,413 4,595 4,672 5,030 5,521 5,851 6,282 3,422 4,605 4,632 5,612 5,525 5,435 5Arkansas....................... 511 1,472 1,585 3,229 3,461 4,186 4,401 4,535 4,708 4,956 5,277 5,568 6,276 6,482 2,593 3,634 3,506 4,875 4,955 5,335 5California ...................... 833 2,227 2,438 4,502 4,595 4,799 4,937 5,260 5,644 5,801 6,314 6,987 7,405 7,552 4,229 5,498 5,394 6,797 6,578 6,116 6
Colorado ....................... 686 2,258 2,509 4,357 4,603 5,047 5,121 5,312 5,656 5,923 6,215 6,567 6,941 7,384 3,481 5,575 5,552 6,577 6,588 6,433 6Connecticut................... 911 2,167 2,711 7,463 7,547 8,380 8,430 8,580 8,901 9,318 9,753 10,127 10,577 11,057 4,622 5,351 6,000 11,266 10,803 10,681 10Delaware....................... 833 2,587 2,721 5,326 5,458 6,502 6,696 7,135 7,420 7,706 8,310 8,958 9,284 9,693 4,230 6,387 6,020 8,041 7,813 8,286 8District of Columbia ...... 947 2,811 2,950 7,872 8,029 8,290 8,510 8,048 8,393 9,650 10,107 12,046 12,102 11,847 4,805 6,942 6,528 11,884 11,493 10,566 10Florida........................... 683 1,834 2,209 4,597 4,859 5,220 5,275 5,360 5,552 5,790 5,831 6,170 6,213 6,439 3,464 4,529 4,889 6,940 6,955 6,652 6
Georgia......................... 539 1,491 1,580 4,000 4,171 4,828 5,056 5,369 5,647 6,092 6,437 6,929 7,380 7,774 2,734 3,682 3,497 6,038 5,971 6,154 6Hawaii ........................... 792 2,086 2,393 4,130 4,820 5,597 5,560 5,633 5,858 6,081 6,530 6,596 7,306 8,100 4,019 5,152 5,296 6,235 6,899 7,133 6Idaho............................. 573 1,548 1,736 2,921 3,206 3,957 4,194 4,447 4,721 5,066 5,315 5,725 6,011 6,081 2,909 3,823 3,842 4,410 4,589 5,043 5Illinois............................ 816 2,241 2,406 4,521 4,904 5,553 5,519 5,940 6,242 6,762 7,133 7,631 7,956 8,287 4,139 5,534 5,325 6,825 7,020 7,077 6Indiana.......................... 661 1,708 1,798 4,270 4,588 5,411 5,621 6,161 6,318 6,772 7,192 7,630 7,734 8,057 3,355 4,218 3,979 6,447 6,567 6,897 6
Iowa .............................. 798 2,164 2,505 4,190 4,418 5,240 5,481 5,738 5,998 6,243 6,564 6,930 7,338 7,574 4,050 5,344 5,544 6,325 6,323 6,679 6Kansas.......................... 699 1,963 2,307 4,290 4,434 5,222 5,374 5,508 5,727 6,015 6,294 6,937 7,339 7,454 3,546 4,847 5,106 6,476 6,348 6,656 6Kentucky ....................... 502 1,557 1,637 3,384 3,897 4,545 4,807 5,155 5,213 5,637 5,921 6,079 6,523 6,661 2,547 3,845 3,623 5,108 5,579 5,792 5Louisiana ...................... 589 1,629 2,273 3,625 3,853 4,356 4,447 4,724 5,187 5,548 5,804 6,037 6,567 6,922 2,991 4,022 5,031 5,472 5,515 5,552 5Maine............................ 649 1,692 1,804 4,903 4,978 6,029 6,151 6,426 6,742 7,155 7,667 8,232 8,818 9,344 3,294 4,178 3,992 7,402 7,125 7,683 7
Maryland....................... 809 2,293 2,581 5,573 5,930 6,427 6,593 6,755 7,034 7,326 7,731 8,260 8,692 9,153 4,106 5,661 5,711 8,414 8,488 8,191 8Massachusetts.............. 791 2,548 2,735 5,766 5,881 6,783 7,033 7,331 7,778 8,260 8,816 9,509 10,232 10,460 4,012 6,291 6,052 8,705 8,419 8,645 8Michigan ....................... 841 2,495 2,892 5,090 5,394 6,465 6,785 6,932 7,050 7,432 8,110 8,278 8,653 8,781 4,270 6,162 6,399 7,684 7,721 8,240 8Minnesota ..................... 855 2,296 2,519 4,698 4,946 5,626 5,801 6,005 6,388 6,814 7,190 7,645 7,736 8,109 4,338 5,670 5,575 7,092 7,079 7,170 7Mississippi .................... 457 1,568 1,503 2,934 3,007 3,798 3,951 4,039 4,288 4,565 5,014 5,175 5,354 5,792 2,318 3,873 3,325 4,429 4,304 4,840 4
Missouri ........................ 596 1,724 1,945 4,071 4,271 4,866 5,092 5,304 5,565 5,855 6,187 6,657 7,136 7,495 3,024 4,257 4,305 6,145 6,114 6,202 6Montana........................ 728 2,264 2,449 4,240 4,706 5,137 5,249 5,481 5,724 5,974 6,314 6,726 7,062 7,496 3,692 5,589 5,420 6,401 6,737 6,547 6Nebraska ...................... 700 2,025 2,243 4,553 4,735 5,555 5,688 5,848 5,958 6,256 6,683 7,223 7,741 8,074 3,551 4,999 4,964 6,873 6,777 7,080 7Nevada ......................... 706 1,908 1,925 3,816 4,294 4,730 4,892 5,084 5,295 5,587 5,760 5,807 6,079 6,092 3,581 4,712 4,260 5,760 6,146 6,029 6New Hampshire ............ 666 1,732 2,036 4,786 5,152 5,567 5,740 5,920 6,156 6,433 6,860 7,286 7,935 8,579 3,380 4,277 4,506 7,225 7,374 7,095 7
New Jersey ................... 924 2,825 2,928 7,546 8,166 9,178 9,361 9,588 9,643 10,145 10,337 11,248 11,793 12,568 4,688 6,976 6,480 11,392 11,688 11,697 11New Mexico .................. 665 1,870 2,066 3,446 3,757 4,404 4,604 4,682 5,005 5,440 5,825 6,313 6,882 7,125 3,375 4,619 4,571 5,202 5,378 5,612 5New York....................... 1,194 2,950 3,225 7,051 7,510 8,311 8,361 8,525 8,852 9,344 9,846 10,716 11,218 11,961 6,061 7,285 7,136 10,644 10,751 10,592 10North Carolina .............. 570 1,635 1,870 4,018 4,237 4,703 4,719 4,929 5,257 5,656 6,045 6,340 6,495 6,562 2,894 4,038 4,139 6,066 6,065 5,994 5North Dakota ................ 662 1,941 2,175 3,899 3,909 4,482 4,677 4,808 5,056 5,442 5,667 6,125 6,709 6,870 3,362 4,794 4,813 5,887 5,595 5,712 5
Ohio .............................. 677 1,894 2,120 4,531 4,747 5,529 5,669 5,935 6,198 6,590 7,065 7,571 8,069 8,632 3,433 4,678 4,692 6,840 6,795 7,046 7Oklahoma ..................... 554 1,810 2,065 3,293 3,639 4,533 4,549 4,817 5,033 5,303 5,395 6,019 6,229 6,092 2,810 4,468 4,570 4,972 5,209 5,777 5Oregon.......................... 843 2,412 2,782 4,864 5,195 5,649 5,790 5,920 6,419 6,828 7,149 7,528 7,642 7,491 4,279 5,956 6,157 7,344 7,436 7,200 7Pennsylvania................. 815 2,328 2,595 5,737 6,048 6,565 6,922 7,106 7,209 7,450 7,772 8,210 8,537 8,997 4,137 5,750 5,743 8,661 8,657 8,367 8Rhode Island ................ 807 2,340 2,654 5,908 5,934 7,126 7,304 7,612 7,928 8,294 8,904 9,315 9,703 10,349 4,094 5,779 5,874 8,919 8,493 9,082 9
See notes at end of table.
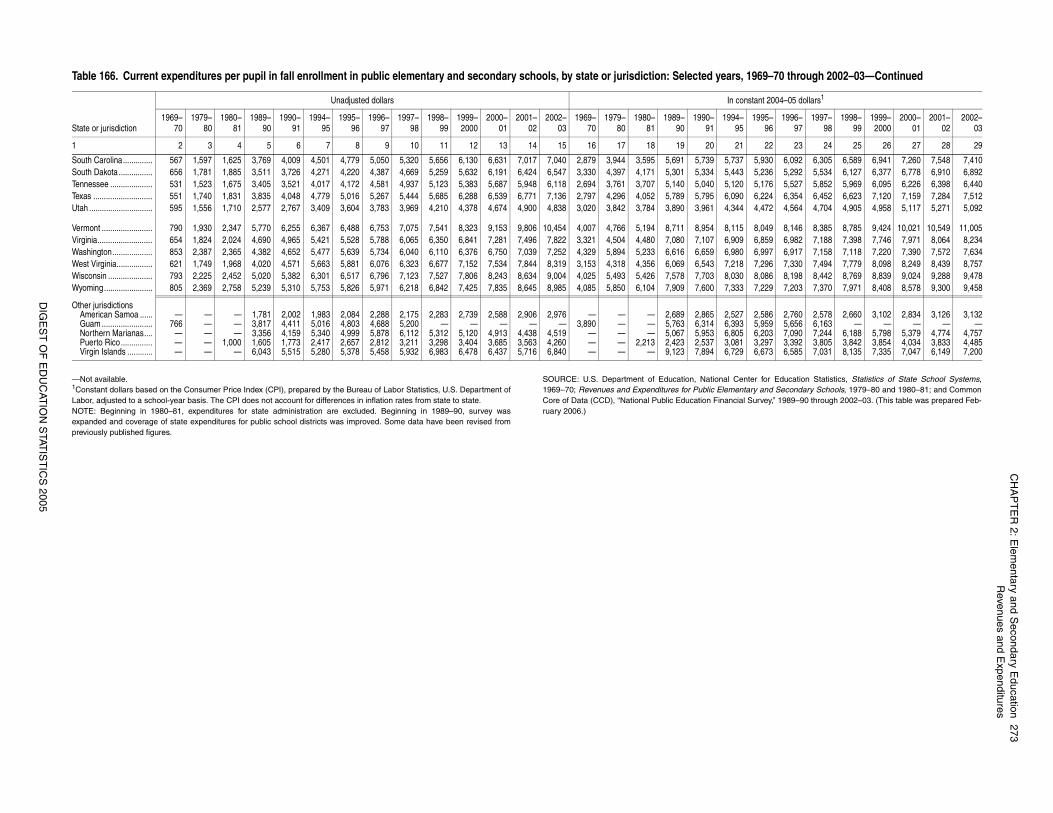
CH
AP
TE
R 2: E
lementary and S
econdary Education
273R
evenues and Expenditures
DIG
ES
T O
F E
DU
CAT
ION
STAT
IST
ICS
2005
r for Education Statistics, Statistics of State School Systems, and Secondary Schools, 1979–80 and 1980–81; and Commonrvey,” 1989–90 through 2002–03. (This table was prepared Feb-
,930 6,092 6,305 6,589 6,941 7,260 7,548 7,410,236 5,292 5,534 6,127 6,377 6,778 6,910 6,892,176 5,527 5,852 5,969 6,095 6,226 6,398 6,440,224 6,354 6,452 6,623 7,120 7,159 7,284 7,512,472 4,564 4,704 4,905 4,958 5,117 5,271 5,092
,049 8,146 8,385 8,785 9,424 10,021 10,549 11,005,859 6,982 7,188 7,398 7,746 7,971 8,064 8,234,997 6,917 7,158 7,118 7,220 7,390 7,572 7,634,296 7,330 7,494 7,779 8,098 8,249 8,439 8,757,086 8,198 8,442 8,769 8,839 9,024 9,288 9,478,229 7,203 7,370 7,971 8,408 8,578 9,300 9,458
,586 2,760 2,578 2,660 3,102 2,834 3,126 3,132,959 5,656 6,163 — — — — —,203 7,090 7,244 6,188 5,798 5,379 4,774 4,757,297 3,392 3,805 3,842 3,854 4,034 3,833 4,485,673 6,585 7,031 8,135 7,335 7,047 6,149 7,200
69–70 through 2002–03—Continued
nt 2004–05 dollars1
995–96
1996–97
1997–98
1998–99
1999–2000
2000–01
2001–02
2002–03
22 23 24 25 26 27 28 29
—Not available. 1Constant dollars based on the Consumer Price Index (CPI), prepared by the Bureau of Labor Statistics, U.S. Department ofLabor, adjusted to a school-year basis. The CPI does not account for differences in inflation rates from state to state. NOTE: Beginning in 1980–81, expenditures for state administration are excluded. Beginning in 1989–90, survey wasexpanded and coverage of state expenditures for public school districts was improved. Some data have been revised frompreviously published figures.
SOURCE: U.S. Department of Education, National Cente1969–70; Revenues and Expenditures for Public ElementaryCore of Data (CCD), “National Public Education Financial Suruary 2006.)
South Carolina.............. 567 1,597 1,625 3,769 4,009 4,501 4,779 5,050 5,320 5,656 6,130 6,631 7,017 7,040 2,879 3,944 3,595 5,691 5,739 5,737 5South Dakota ................ 656 1,781 1,885 3,511 3,726 4,271 4,220 4,387 4,669 5,259 5,632 6,191 6,424 6,547 3,330 4,397 4,171 5,301 5,334 5,443 5Tennessee .................... 531 1,523 1,675 3,405 3,521 4,017 4,172 4,581 4,937 5,123 5,383 5,687 5,948 6,118 2,694 3,761 3,707 5,140 5,040 5,120 5Texas ............................ 551 1,740 1,831 3,835 4,048 4,779 5,016 5,267 5,444 5,685 6,288 6,539 6,771 7,136 2,797 4,296 4,052 5,789 5,795 6,090 6Utah .............................. 595 1,556 1,710 2,577 2,767 3,409 3,604 3,783 3,969 4,210 4,378 4,674 4,900 4,838 3,020 3,842 3,784 3,890 3,961 4,344 4
Vermont ........................ 790 1,930 2,347 5,770 6,255 6,367 6,488 6,753 7,075 7,541 8,323 9,153 9,806 10,454 4,007 4,766 5,194 8,711 8,954 8,115 8Virginia.......................... 654 1,824 2,024 4,690 4,965 5,421 5,528 5,788 6,065 6,350 6,841 7,281 7,496 7,822 3,321 4,504 4,480 7,080 7,107 6,909 6Washington................... 853 2,387 2,365 4,382 4,652 5,477 5,639 5,734 6,040 6,110 6,376 6,750 7,039 7,252 4,329 5,894 5,233 6,616 6,659 6,980 6West Virginia................. 621 1,749 1,968 4,020 4,571 5,663 5,881 6,076 6,323 6,677 7,152 7,534 7,844 8,319 3,153 4,318 4,356 6,069 6,543 7,218 7Wisconsin ..................... 793 2,225 2,452 5,020 5,382 6,301 6,517 6,796 7,123 7,527 7,806 8,243 8,634 9,004 4,025 5,493 5,426 7,578 7,703 8,030 8Wyoming....................... 805 2,369 2,758 5,239 5,310 5,753 5,826 5,971 6,218 6,842 7,425 7,835 8,645 8,985 4,085 5,850 6,104 7,909 7,600 7,333 7
Other jurisdictionsAmerican Samoa ...... — — — 1,781 2,002 1,983 2,084 2,288 2,175 2,283 2,739 2,588 2,906 2,976 — — — 2,689 2,865 2,527 2Guam ........................ 766 — — 3,817 4,411 5,016 4,803 4,688 5,200 — — — — — 3,890 — — 5,763 6,314 6,393 5Northern Marianas.... — — — 3,356 4,159 5,340 4,999 5,878 6,112 5,312 5,120 4,913 4,438 4,519 — — — 5,067 5,953 6,805 6Puerto Rico ............... — — 1,000 1,605 1,773 2,417 2,657 2,812 3,211 3,298 3,404 3,685 3,563 4,260 — — 2,213 2,423 2,537 3,081 3Virgin Islands ............ — — — 6,043 5,515 5,280 5,378 5,458 5,932 6,983 6,478 6,437 5,716 6,840 — — — 9,123 7,894 6,729 6
Table 166. Current expenditures per pupil in fall enrollment in public elementary and secondary schools, by state or jurisdiction: Selected years, 19
State or jurisdiction
Unadjusted dollars In consta
1969–70
1979–80
1980–81
1989–90
1990–91
1994–95
1995–96
1996–97
1997–98
1998–99
1999–2000
2000–01
2001–02
2002–03
1969–70
1979–80
1980–81
1989–90
1990–91
1994–95
1
1 2 3 4 5 6 7 8 9 10 11 12 13 14 15 16 17 18 19 20 21
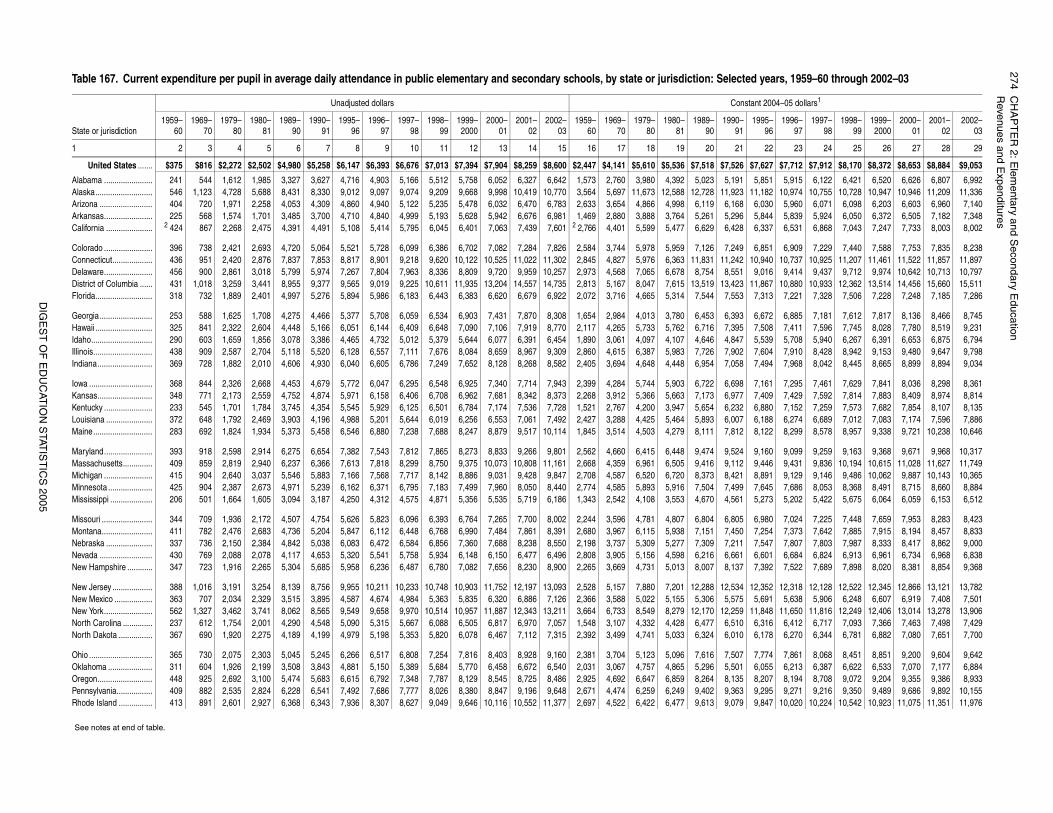
274C
HA
PT
ER
2: Elem
entary and Secondary E
ducationR
evenues and Expenditures
DIG
ES
T O
F E
DU
CAT
ION
STAT
IST
ICS
2005
years, 1959–60 through 2002–03
nt 2004–05 dollars1
995–96
1996–97
1997–98
1998–99
1999–2000
2000–01
2001–02
2002–03
22 23 24 25 26 27 28 29
7,627 $7,712 $7,912 $8,170 $8,372 $8,653 $8,884 $9,053
,851 5,915 6,122 6,421 6,520 6,626 6,807 6,992,182 10,974 10,755 10,728 10,947 10,946 11,209 11,336,030 5,960 6,071 6,098 6,203 6,603 6,960 7,140,844 5,839 5,924 6,050 6,372 6,505 7,182 7,348,337 6,531 6,868 7,043 7,247 7,733 8,003 8,002
,851 6,909 7,229 7,440 7,588 7,753 7,835 8,238,940 10,737 10,925 11,207 11,461 11,522 11,857 11,897,016 9,414 9,437 9,712 9,974 10,642 10,713 10,797,867 10,880 10,933 12,362 13,514 14,456 15,660 15,511,313 7,221 7,328 7,506 7,228 7,248 7,185 7,286
,672 6,885 7,181 7,612 7,817 8,136 8,466 8,745,508 7,411 7,596 7,745 8,028 7,780 8,519 9,231,539 5,708 5,940 6,267 6,391 6,653 6,875 6,794,604 7,910 8,428 8,942 9,153 9,480 9,647 9,798,494 7,968 8,042 8,445 8,665 8,899 8,894 9,034
,161 7,295 7,461 7,629 7,841 8,036 8,298 8,361,409 7,429 7,592 7,814 7,883 8,409 8,974 8,814,880 7,152 7,259 7,573 7,682 7,854 8,107 8,135,188 6,274 6,689 7,012 7,083 7,174 7,596 7,886,122 8,299 8,578 8,957 9,338 9,721 10,238 10,646
,160 9,099 9,259 9,163 9,368 9,671 9,968 10,317,446 9,431 9,836 10,194 10,615 11,028 11,627 11,749,891 9,129 9,146 9,486 10,062 9,887 10,143 10,365,645 7,686 8,053 8,368 8,491 8,715 8,660 8,884,273 5,202 5,422 5,675 6,064 6,059 6,153 6,512
,980 7,024 7,225 7,448 7,659 7,953 8,283 8,423,254 7,373 7,642 7,885 7,915 8,194 8,457 8,833,547 7,807 7,803 7,987 8,333 8,417 8,862 9,000,601 6,684 6,824 6,913 6,961 6,734 6,968 6,838,392 7,522 7,689 7,898 8,020 8,381 8,854 9,368
,352 12,318 12,128 12,522 12,345 12,866 13,121 13,782,691 5,638 5,906 6,248 6,607 6,919 7,408 7,501,848 11,650 11,816 12,249 12,406 13,014 13,278 13,906,316 6,412 6,717 7,093 7,366 7,463 7,498 7,429,178 6,270 6,344 6,781 6,882 7,080 7,651 7,700
,774 7,861 8,068 8,451 8,851 9,200 9,604 9,642,055 6,213 6,387 6,622 6,533 7,070 7,177 6,884,207 8,194 8,708 9,072 9,204 9,355 9,386 8,933,295 9,271 9,216 9,350 9,489 9,686 9,892 10,155,847 10,020 10,224 10,542 10,923 11,075 11,351 11,976
t
Table 167. Current expenditure per pupil in average daily attendance in public elementary and secondary schools, by state or jurisdiction: Selected
State or jurisdiction
Unadjusted dollars Consta
1959–60
1969–70
1979–80
1980–81
1989–90
1990–91
1995–96
1996–97
1997–98
1998–99
1999–2000
2000–01
2001–02
2002–03
1959–60
1969–70
1979–80
1980–81
1989–90
1990–91
1
1 2 3 4 5 6 7 8 9 10 11 12 13 14 15 16 17 18 19 20 21
United States ....... $375 $816 $2,272 $2,502 $4,980 $5,258 $6,147 $6,393 $6,676 $7,013 $7,394 $7,904 $8,259 $8,600 $2,447 $4,141 $5,610 $5,536 $7,518 $7,526 $
Alabama ....................... 241 544 1,612 1,985 3,327 3,627 4,716 4,903 5,166 5,512 5,758 6,052 6,327 6,642 1,573 2,760 3,980 4,392 5,023 5,191 5Alaska........................... 546 1,123 4,728 5,688 8,431 8,330 9,012 9,097 9,074 9,209 9,668 9,998 10,419 10,770 3,564 5,697 11,673 12,588 12,728 11,923 11Arizona ......................... 404 720 1,971 2,258 4,053 4,309 4,860 4,940 5,122 5,235 5,478 6,032 6,470 6,783 2,633 3,654 4,866 4,998 6,119 6,168 6Arkansas....................... 225 568 1,574 1,701 3,485 3,700 4,710 4,840 4,999 5,193 5,628 5,942 6,676 6,981 1,469 2,880 3,888 3,764 5,261 5,296 5California ...................... 2 424 867 2,268 2,475 4,391 4,491 5,108 5,414 5,795 6,045 6,401 7,063 7,439 7,601 2 2,766 4,401 5,599 5,477 6,629 6,428 6
Colorado ....................... 396 738 2,421 2,693 4,720 5,064 5,521 5,728 6,099 6,386 6,702 7,082 7,284 7,826 2,584 3,744 5,978 5,959 7,126 7,249 6Connecticut................... 436 951 2,420 2,876 7,837 7,853 8,817 8,901 9,218 9,620 10,122 10,525 11,022 11,302 2,845 4,827 5,976 6,363 11,831 11,242 10Delaware....................... 456 900 2,861 3,018 5,799 5,974 7,267 7,804 7,963 8,336 8,809 9,720 9,959 10,257 2,973 4,568 7,065 6,678 8,754 8,551 9District of Columbia ...... 431 1,018 3,259 3,441 8,955 9,377 9,565 9,019 9,225 10,611 11,935 13,204 14,557 14,735 2,813 5,167 8,047 7,615 13,519 13,423 11Florida........................... 318 732 1,889 2,401 4,997 5,276 5,894 5,986 6,183 6,443 6,383 6,620 6,679 6,922 2,072 3,716 4,665 5,314 7,544 7,553 7
Georgia......................... 253 588 1,625 1,708 4,275 4,466 5,377 5,708 6,059 6,534 6,903 7,431 7,870 8,308 1,654 2,984 4,013 3,780 6,453 6,393 6Hawaii ........................... 325 841 2,322 2,604 4,448 5,166 6,051 6,144 6,409 6,648 7,090 7,106 7,919 8,770 2,117 4,265 5,733 5,762 6,716 7,395 7Idaho............................. 290 603 1,659 1,856 3,078 3,386 4,465 4,732 5,012 5,379 5,644 6,077 6,391 6,454 1,890 3,061 4,097 4,107 4,646 4,847 5Illinois............................ 438 909 2,587 2,704 5,118 5,520 6,128 6,557 7,111 7,676 8,084 8,659 8,967 9,309 2,860 4,615 6,387 5,983 7,726 7,902 7Indiana.......................... 369 728 1,882 2,010 4,606 4,930 6,040 6,605 6,786 7,249 7,652 8,128 8,268 8,582 2,405 3,694 4,648 4,448 6,954 7,058 7
Iowa .............................. 368 844 2,326 2,668 4,453 4,679 5,772 6,047 6,295 6,548 6,925 7,340 7,714 7,943 2,399 4,284 5,744 5,903 6,722 6,698 7Kansas.......................... 348 771 2,173 2,559 4,752 4,874 5,971 6,158 6,406 6,708 6,962 7,681 8,342 8,373 2,268 3,912 5,366 5,663 7,173 6,977 7Kentucky ....................... 233 545 1,701 1,784 3,745 4,354 5,545 5,929 6,125 6,501 6,784 7,174 7,536 7,728 1,521 2,767 4,200 3,947 5,654 6,232 6Louisiana ...................... 372 648 1,792 2,469 3,903 4,196 4,988 5,201 5,644 6,019 6,256 6,553 7,061 7,492 2,427 3,288 4,425 5,464 5,893 6,007 6Maine............................ 283 692 1,824 1,934 5,373 5,458 6,546 6,880 7,238 7,688 8,247 8,879 9,517 10,114 1,845 3,514 4,503 4,279 8,111 7,812 8
Maryland....................... 393 918 2,598 2,914 6,275 6,654 7,382 7,543 7,812 7,865 8,273 8,833 9,266 9,801 2,562 4,660 6,415 6,448 9,474 9,524 9Massachusetts.............. 409 859 2,819 2,940 6,237 6,366 7,613 7,818 8,299 8,750 9,375 10,073 10,808 11,161 2,668 4,359 6,961 6,505 9,416 9,112 9Michigan ....................... 415 904 2,640 3,037 5,546 5,883 7,166 7,568 7,717 8,142 8,886 9,031 9,428 9,847 2,708 4,587 6,520 6,720 8,373 8,421 8Minnesota ..................... 425 904 2,387 2,673 4,971 5,239 6,162 6,371 6,795 7,183 7,499 7,960 8,050 8,440 2,774 4,585 5,893 5,916 7,504 7,499 7Mississippi .................... 206 501 1,664 1,605 3,094 3,187 4,250 4,312 4,575 4,871 5,356 5,535 5,719 6,186 1,343 2,542 4,108 3,553 4,670 4,561 5
Missouri ........................ 344 709 1,936 2,172 4,507 4,754 5,626 5,823 6,096 6,393 6,764 7,265 7,700 8,002 2,244 3,596 4,781 4,807 6,804 6,805 6Montana........................ 411 782 2,476 2,683 4,736 5,204 5,847 6,112 6,448 6,768 6,990 7,484 7,861 8,391 2,680 3,967 6,115 5,938 7,151 7,450 7Nebraska ...................... 337 736 2,150 2,384 4,842 5,038 6,083 6,472 6,584 6,856 7,360 7,688 8,238 8,550 2,198 3,737 5,309 5,277 7,309 7,211 7Nevada ......................... 430 769 2,088 2,078 4,117 4,653 5,320 5,541 5,758 5,934 6,148 6,150 6,477 6,496 2,808 3,905 5,156 4,598 6,216 6,661 6New Hampshire ............ 347 723 1,916 2,265 5,304 5,685 5,958 6,236 6,487 6,780 7,082 7,656 8,230 8,900 2,265 3,669 4,731 5,013 8,007 8,137 7
New Jersey ................... 388 1,016 3,191 3,254 8,139 8,756 9,955 10,211 10,233 10,748 10,903 11,752 12,197 13,093 2,528 5,157 7,880 7,201 12,288 12,534 12New Mexico .................. 363 707 2,034 2,329 3,515 3,895 4,587 4,674 4,984 5,363 5,835 6,320 6,886 7,126 2,366 3,588 5,022 5,155 5,306 5,575 5New York....................... 562 1,327 3,462 3,741 8,062 8,565 9,549 9,658 9,970 10,514 10,957 11,887 12,343 13,211 3,664 6,733 8,549 8,279 12,170 12,259 11North Carolina .............. 237 612 1,754 2,001 4,290 4,548 5,090 5,315 5,667 6,088 6,505 6,817 6,970 7,057 1,548 3,107 4,332 4,428 6,477 6,510 6North Dakota ................ 367 690 1,920 2,275 4,189 4,199 4,979 5,198 5,353 5,820 6,078 6,467 7,112 7,315 2,392 3,499 4,741 5,033 6,324 6,010 6
Ohio .............................. 365 730 2,075 2,303 5,045 5,245 6,266 6,517 6,808 7,254 7,816 8,403 8,928 9,160 2,381 3,704 5,123 5,096 7,616 7,507 7Oklahoma ..................... 311 604 1,926 2,199 3,508 3,843 4,881 5,150 5,389 5,684 5,770 6,458 6,672 6,540 2,031 3,067 4,757 4,865 5,296 5,501 6Oregon.......................... 448 925 2,692 3,100 5,474 5,683 6,615 6,792 7,348 7,787 8,129 8,545 8,725 8,486 2,925 4,692 6,647 6,859 8,264 8,135 8Pennsylvania................. 409 882 2,535 2,824 6,228 6,541 7,492 7,686 7,777 8,026 8,380 8,847 9,196 9,648 2,671 4,474 6,259 6,249 9,402 9,363 9Rhode Island ................ 413 891 2,601 2,927 6,368 6,343 7,936 8,307 8,627 9,049 9,646 10,116 10,552 11,377 2,697 4,522 6,422 6,477 9,613 9,079 9
See notes at end of table.
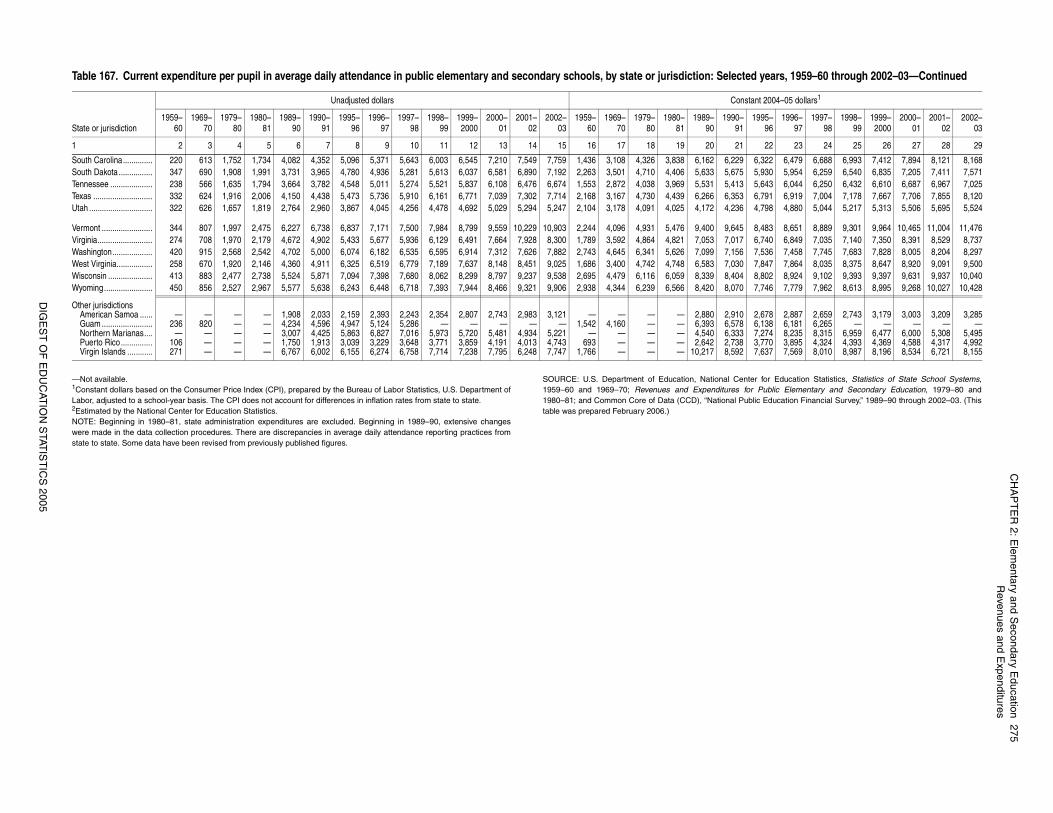
CH
AP
TE
R 2: E
lementary and S
econdary Education
275R
evenues and Expenditures
DIG
ES
T O
F E
DU
CAT
ION
STAT
IST
ICS
2005
r for Education Statistics, Statistics of State School Systems,Public Elementary and Secondary Education, 1979–80 and
ic Education Financial Survey,” 1989–90 through 2002–03. (This
,322 6,479 6,688 6,993 7,412 7,894 8,121 8,168,930 5,954 6,259 6,540 6,835 7,205 7,411 7,571,643 6,044 6,250 6,432 6,610 6,687 6,967 7,025,791 6,919 7,004 7,178 7,667 7,706 7,855 8,120,798 4,880 5,044 5,217 5,313 5,506 5,695 5,524
,483 8,651 8,889 9,301 9,964 10,465 11,004 11,476,740 6,849 7,035 7,140 7,350 8,391 8,529 8,737,536 7,458 7,745 7,683 7,828 8,005 8,204 8,297,847 7,864 8,035 8,375 8,647 8,920 9,091 9,500,802 8,924 9,102 9,393 9,397 9,631 9,937 10,040,746 7,779 7,962 8,613 8,995 9,268 10,027 10,428
,678 2,887 2,659 2,743 3,179 3,003 3,209 3,285,138 6,181 6,265 — — — — —,274 8,235 8,315 6,959 6,477 6,000 5,308 5,495,770 3,895 4,324 4,393 4,369 4,588 4,317 4,992,637 7,569 8,010 8,987 8,196 8,534 6,721 8,155
years, 1959–60 through 2002–03—Continued
nt 2004–05 dollars1
995–96
1996–97
1997–98
1998–99
1999–2000
2000–01
2001–02
2002–03
22 23 24 25 26 27 28 29
—Not available. 1Constant dollars based on the Consumer Price Index (CPI), prepared by the Bureau of Labor Statistics, U.S. Department ofLabor, adjusted to a school-year basis. The CPI does not account for differences in inflation rates from state to state. 2Estimated by the National Center for Education Statistics. NOTE: Beginning in 1980–81, state administration expenditures are excluded. Beginning in 1989–90, extensive changeswere made in the data collection procedures. There are discrepancies in average daily attendance reporting practices fromstate to state. Some data have been revised from previously published figures.
SOURCE: U.S. Department of Education, National Cente1959–60 and 1969–70; Revenues and Expenditures for 1980–81; and Common Core of Data (CCD), “National Publtable was prepared February 2006.)
South Carolina.............. 220 613 1,752 1,734 4,082 4,352 5,096 5,371 5,643 6,003 6,545 7,210 7,549 7,759 1,436 3,108 4,326 3,838 6,162 6,229 6South Dakota ................ 347 690 1,908 1,991 3,731 3,965 4,780 4,936 5,281 5,613 6,037 6,581 6,890 7,192 2,263 3,501 4,710 4,406 5,633 5,675 5Tennessee .................... 238 566 1,635 1,794 3,664 3,782 4,548 5,011 5,274 5,521 5,837 6,108 6,476 6,674 1,553 2,872 4,038 3,969 5,531 5,413 5Texas ............................ 332 624 1,916 2,006 4,150 4,438 5,473 5,736 5,910 6,161 6,771 7,039 7,302 7,714 2,168 3,167 4,730 4,439 6,266 6,353 6Utah .............................. 322 626 1,657 1,819 2,764 2,960 3,867 4,045 4,256 4,478 4,692 5,029 5,294 5,247 2,104 3,178 4,091 4,025 4,172 4,236 4
Vermont ........................ 344 807 1,997 2,475 6,227 6,738 6,837 7,171 7,500 7,984 8,799 9,559 10,229 10,903 2,244 4,096 4,931 5,476 9,400 9,645 8Virginia.......................... 274 708 1,970 2,179 4,672 4,902 5,433 5,677 5,936 6,129 6,491 7,664 7,928 8,300 1,789 3,592 4,864 4,821 7,053 7,017 6Washington................... 420 915 2,568 2,542 4,702 5,000 6,074 6,182 6,535 6,595 6,914 7,312 7,626 7,882 2,743 4,645 6,341 5,626 7,099 7,156 7West Virginia................. 258 670 1,920 2,146 4,360 4,911 6,325 6,519 6,779 7,189 7,637 8,148 8,451 9,025 1,686 3,400 4,742 4,748 6,583 7,030 7Wisconsin ..................... 413 883 2,477 2,738 5,524 5,871 7,094 7,398 7,680 8,062 8,299 8,797 9,237 9,538 2,695 4,479 6,116 6,059 8,339 8,404 8Wyoming....................... 450 856 2,527 2,967 5,577 5,638 6,243 6,448 6,718 7,393 7,944 8,466 9,321 9,906 2,938 4,344 6,239 6,566 8,420 8,070 7
Other jurisdictionsAmerican Samoa ...... — — — — 1,908 2,033 2,159 2,393 2,243 2,354 2,807 2,743 2,983 3,121 — — — — 2,880 2,910 2Guam ........................ 236 820 — — 4,234 4,596 4,947 5,124 5,286 — — — — — 1,542 4,160 — — 6,393 6,578 6Northern Marianas.... — — — — 3,007 4,425 5,863 6,827 7,016 5,973 5,720 5,481 4,934 5,221 — — — — 4,540 6,333 7Puerto Rico ............... 106 — — — 1,750 1,913 3,039 3,229 3,648 3,771 3,859 4,191 4,013 4,743 693 — — — 2,642 2,738 3Virgin Islands ............ 271 — — — 6,767 6,002 6,155 6,274 6,758 7,714 7,238 7,795 6,248 7,747 1,766 — — — 10,217 8,592 7
Table 167. Current expenditure per pupil in average daily attendance in public elementary and secondary schools, by state or jurisdiction: Selected
State or jurisdiction
Unadjusted dollars Consta
1959–60
1969–70
1979–80
1980–81
1989–90
1990–91
1995–96
1996–97
1997–98
1998–99
1999–2000
2000–01
2001–02
2002–03
1959–60
1969–70
1979–80
1980–81
1989–90
1990–91
1
1 2 3 4 5 6 7 8 9 10 11 12 13 14 15 16 17 18 19 20 21


![CSR Report 2015 [Digest]](https://img.pdfslide.net/doc/110x75/63257519cedd78c2b50c99c4/csr-report-2015-digest.jpg)