Embed Size (px)
Citation preview
Durability of Geosyntheticsfor Highway ApplicationsInterim Report
Publication No. FHWA-RD-95016
U.S. Department of TransportationFederal Highway Administration
January 1996
Research and DevelopmentTurner-Fairbank Highway Research Center6300 Georgetown PikeMcLean, Virginia 22101-2296
lllllllllll~~il~lllllllll101664
Geosynthetics as a soil reinforcement material have been used in retaining wall applications sincethe early 1970’s, and more recently in reinforced slope and embankment applications. Because oftheir cost effectiveness, there is a strong desire to increase the use of geosynthetics in theseapplications. However, they have not found widespread use in permanent reinforcementapplications because of the lack of information and defined test protocols regarding their long-term durability. In 1991, a pooled fund study was initiated through the FHWA to studygeosynthetic durability and to develop test protocols to address the long-term durability issue.The scope of the study included both field exhumations of existing installations as well as anintensive laboratory program. This report is interim in nature and provides a background to thestudy as well as a summary of some of the early test results. This report should be of interest togeotechnical and bridge engineers who are concerned with the durability of geosyntheticreinforced soil structures.
Charles J. Nemmers, P.E.Director, Office of Engineering
Research and Development
NOTICE
This document is disseminated under the sponsorship of the Department of Transportation in theinterest of information exchange. The United States Government assumes no liability for itscontents or use thereof. The contents of this report reflect the views of the authors, who areresponsible for the accuracy of the data presented herein. The contents do not necessarily reflectthe official policy of the Department of Transportation. This report does not constitute astandard, specification, or regulation.
The United States Government does not endorse products or manufacturers. Trade ormanufacturers’ names appear herein only because they are considered essential to the object ofthis document.
Technical Report Documentation Page1. Report No.
FHWA-RD-95-0164. Title and Subtitle
DURABILITY OF GEOSYNTHETICS FOR HIGHWAY APPLICATIONSINTERIM REPORT
7. Author(s)Tony M. Allen and Victor Elias
9. Performing Organization Name and Address
!3401 Collins Park DriveEarth Engineering and Sciences
iBaltimore, MD 21215
12. Sponsoring Agency Name and Address
15. Supplementary Notes
IFHWA Contracting Officer’s Technical Representative: Albert F. DiMillio, HNR-10
State DOT Sponsors: AZ, CA, GA, HI, ID, IL, KS, MN, MO, MT, NY, OH, OK, OR, PA, SD, VA, WA
16. Abstract
3. Recipient’s Catalog No.
5. Report Date
January 19966. Performing Organization Code
8. Performing Organization Report No.
10. Work Unit No. (TRAIS)3E3B0772
11. Contract or Grant No.DTFH61-91-00054
13. Type of Report and Period Covered
14. Sponsoring Agency Code
This report provides background and summary of the scope of work for the pooled fund study, “Durability of
Geosynthetics for Highway Applications.” Status and a summary of initial test results for each of the tasks in this
study, as well as a summary of the significant accomplishments to date are provided. Finally, discussion of
geosynthetic life prediction issues and additional research needs are provided.
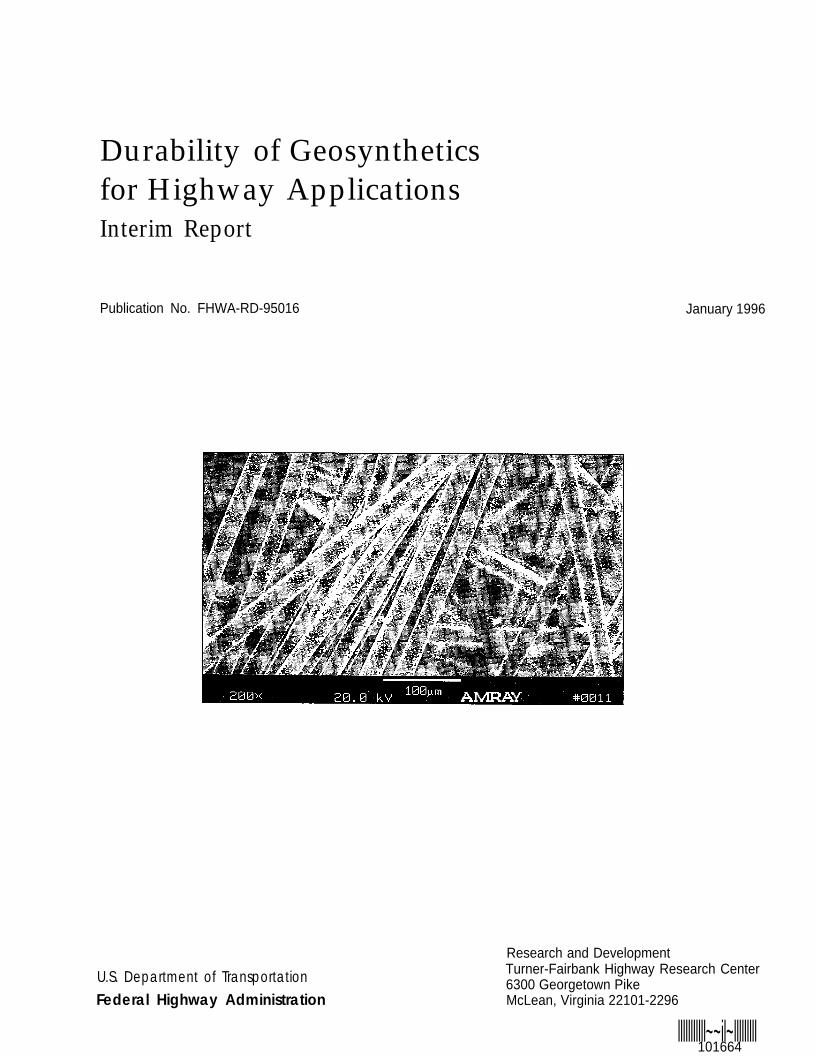
COVER PHOTO: Nonwoven polyester geosynthetic
17. Key WordsGeosynthetics, reinforcement, durability, chemical
degradation, polypropylene, high density polyethylene,
polyester, hydrolysis, oxidation
18. Distribution Statement
No Restrictions. This document is available to the public
through the National Technical Information Service,
Springfield, VA 22161
19. Security Classif. (of this report) 20. Security Classif. (of this page) 21. No. of Pages 22. Price
UNCLASSIFIEDForm DOT F 1700.7 (8-72)PFv2.1, 12/13/93
21. No. of Pages 22. P ri cee 20. Security Classif. (of this page)
UNCLASSIFIED
Reproduction of completed page authorized
I 59 I
1. BACKGROUND FOR THE GEOSYNTHETIC DURABILITY RESEARCH PROGRAM
Current codes and guidelines for design of geosynthetic reinforcement [e.g., AmericanAssociation State Highway Transportation Officials (AASHTO), 1994] require that the long-termallowable strength of the geosynthetic be greater than the load applied to the geosyntheticmultiplied by an overall factor of safety. That is, the designer must be reasonably certain that thegeosynthetic will have adequate strength to resist the loads applied throughout the life of thestructure.
The load applied to the geosynthetic is fairly straight forward to estimate for geosynthetic walland slope applications as well as for embankment and roadway subgrade reinforcementapplications, though typical practice tends to result in conservative estimates. The ability toestimate long-term allowable geosynthetic strength (i.e., its durability) is of direct benefit to thedesign of these applications, as both sides of the equation would then be known. Currently, thetensile load applied to the geosynthetic cannot be estimated directly for separation, drainage, anderosion control applications. Therefore, the ability to estimate long-term geosynthetic strengthwould only be indirectly beneficial to the design of these latter applications (i.e., the ability topredict when severe or complete degradation occurs within the desired design lifetime would stillbe desirable).
All materials degrade with time, including materials used routinely in the construction of retainingwalls and other structures such as concrete and steel. For example, steel corrodes, and failureshave occurred as the result of the corrosion phenomenon (Weatherby, 1982; Darbin, et. al.,1988). However, much has been learned from these failures as well as the general long-termperformance of steel and concrete structures. Due to the available long-term history for concreteand steel structures, designers have the tools and the confidence to use these materials routinely insuch structures.
Geosynthetics have been used in reinforcement applications for the past 20 years. Researchconducted to date on the durability of geosynthetics includes evaluation of exhumed materialsfrom actual geosynthetic structures as well as evaluation of materials exposed in laboratoryenvironments which are more severe than environments typically encountered in soil. In the caseof the field studies, observed long-term strength losses have generally been less than 10 to 15percent, except in certain extreme soil environments (Allen, 1991). However, the observationperiod in these studies has typically been 5 to 10 years or less, and extrapolation to typical designlives of 75 years or more, especially considering the many uncontrolled variables, has significantuncertainty. In the case of the laboratory studies in which the variables can be more carefullycontrolled, severe degradation has been observed in relatively short periods of time. However,the models to relate the severe (i.e., accelerated) laboratory exposure conditions to typicalambient field conditions are not well enough developed to permit accurate extrapolation of thelaboratory data. In both cases, extrapolation of degradation data is the key issue.
Perceptions by users concerning geosynthetic durability have caused a significant number ofdesigners and agencies to be reluctant to use geosynthetics for long-term reinforcementapplications, to limit reinforcement use to a small number of geosynthetic products which areperceived to be more durable or for which more data is available, or to limit reinforcement use to
1
noncritical applications (Allen and Diekman, 1994). Furthermore, the lack of geosyntheticdurability testing and product evaluation standards does not allow geosynthetic products to beequitably compared regarding long-term durability.
This does not mean that geosynthetics are anticipated to degrade more than materials such as steeland concrete which are at present in routine use. In fact, in some environments, mostgeosynthetics will likely be significantly more durable than these other materials. The issue is thatcurrently, the available design tools and standards are inadequate to assure the desired long-termdesign life (typically 75 years or more).
The long-term allowable strength of the geosynthetic is generally determined as follows:
TultTallow= ----
RFwhere,
Tult = the ultimate short -term strength of the geosyntheticRF = a reduction factor which is a function of strength loss due to installation
damage, creep, chemical degradation, biological degradation, andjoint / connection details.
Installation damage and creep are potentially the largest sources of strength loss; however, currentknowledge is adequate to safely design a geosynthetic structure for these two factors. Biologicaldegradation is for the most part a nonissue for the materials used to resist tensile load within thegeosynthetic (i.e., Polypropylene "PP,"” high density polyethylene “HDPE,” and polyester “PET”).Current knowledge regarding chemical degradation, and the soil environments which causechemical degradation, is inadequate for reasonably accurate life prediction and is the mainhindrance to routine use of geosynthetic reinforcement. The combined effect of installationdamage, creep, and chemical/biological degradation (i.e., the synergism of these factors) on thelong-term allowable strength is also not well known, though the current practice of multiplyingthese factors together (Task Force 27, 1989; AASHTO, 1994) is considered to be conservative.
Routine use of geosynthetics in long-term reinforcement applications such as retaining walls is adesirable objective due to the opportunity for exceptional cost savings relative to the otheralternative wall systems currently available. Current experience with geosynthetic walls indicatesthat on the order of 30 percent or more savings relative to other available wall systems can berealized. Nationwide on Federal and State transportation projects, it has been estimated thatsavings on the order of $70 million or more per year could be obtained through routine use ofgeosynthetic wall systems (Fettig, 1991). Use of geosynthetic reinforced slopes could result ineven greater savings. Hence the potential return on investment for the research needed to addresslong-term geosynthetic strength issues is exceptionally high.
Considering this, a research program to address the issues hindering routine long-term use ofgeosynthetics in reinforcement applications was developed. The objectives of this researchprogram are three fold:
1. Gain enough understanding of the mechanisms and environments which affect the strengthdegradation rate of geosynthetic reinforcement in typical in-soil environments to develop anacceptably accurate life prediction model.
2. Develop a practical methodology (i.e., geosynthetic durability testing and evaluationprotocols) which can be used to equitably compare geosynthetic products regarding theirlong-term durability.
3. Develop the detailed research program in a way that considers the expertise nationally ofgeosynthetics specialists in the geosynthetic industry, academia, transportation agencies,consulting firms, and in related disciplines such as polymer chemistry, materials science, andsoil science to ensure nationwide acceptance of the research results.
Due to the size of the research program required and funding limitations, only part of the totalresearch program could be included in the first research contract. However, enough of the totalresearch program was included in the first contract such that the research results obtained wouldbe useable to encourage increased use of geosynthetic reinforced structures. Subsequent researchcontracts are planned to complete the geosynthetic durability research program.
BACKGROUND FOR FIRST RESEARCH CONTRACT
The first research contract was funded as a Federal Highway Administration (FHWA) HP&RNational Pooled fund study. Contributors to the study include the FHWA, 16 Statetransportation departments, the Forest Service, the National Park Service, the Corps ofEngineers, and the geosynthetic industry. At this point, the geosynthetic industry is providing in-kind testing services rather than monetary support. Two of the subcontractors which are part ofthe selected research team have also contributed in terms of cost sharing. The FHWA isadministering the research contract, while the Washington State Department of Transportation istaking the lead among the State transportation departments to provide technical oversight andreview for the research.
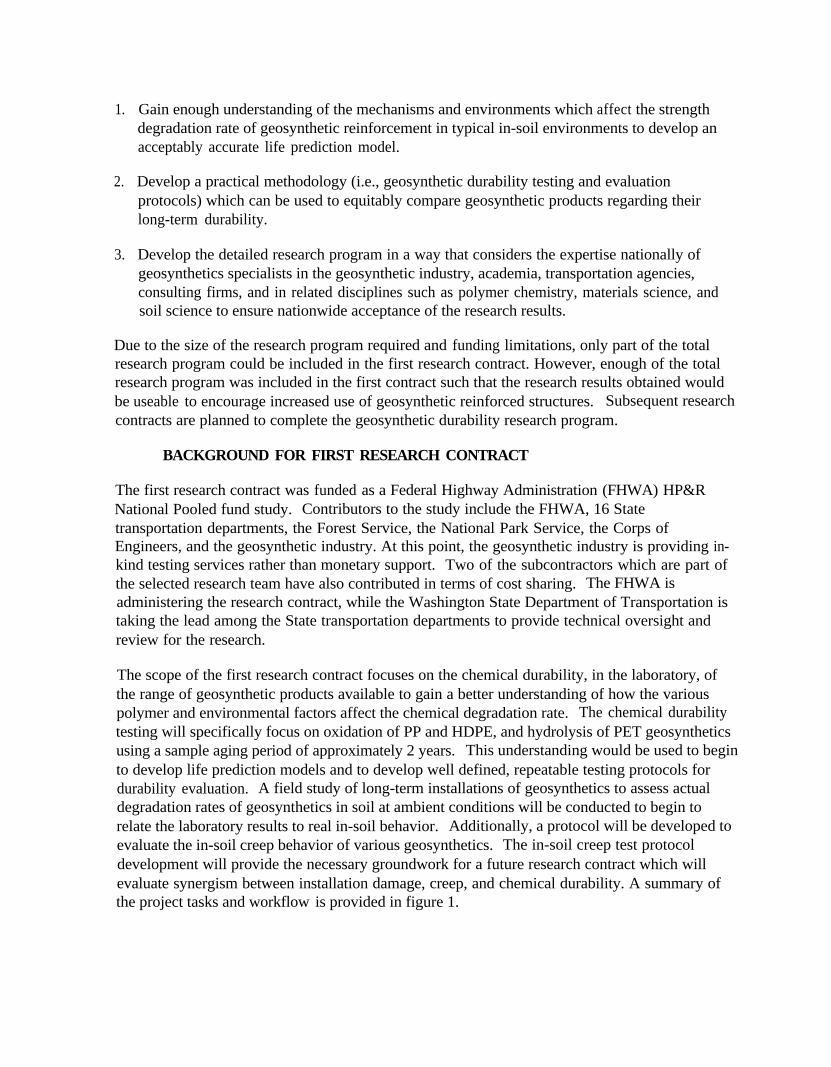
The scope of the first research contract focuses on the chemical durability, in the laboratory, ofthe range of geosynthetic products available to gain a better understanding of how the variouspolymer and environmental factors affect the chemical degradation rate. The chemical durabilitytesting will specifically focus on oxidation of PP and HDPE, and hydrolysis of PET geosyntheticsusing a sample aging period of approximately 2 years. This understanding would be used to beginto develop life prediction models and to develop well defined, repeatable testing protocols fordurability evaluation. A field study of long-term installations of geosynthetics to assess actualdegradation rates of geosynthetics in soil at ambient conditions will be conducted to begin torelate the laboratory results to real in-soil behavior. Additionally, a protocol will be developed toevaluate the in-soil creep behavior of various geosynthetics. The in-soil creep test protocoldevelopment will provide the necessary groundwork for a future research contract which willevaluate synergism between installation damage, creep, and chemical durability. A summary ofthe project tasks and workflow is provided in figure 1.
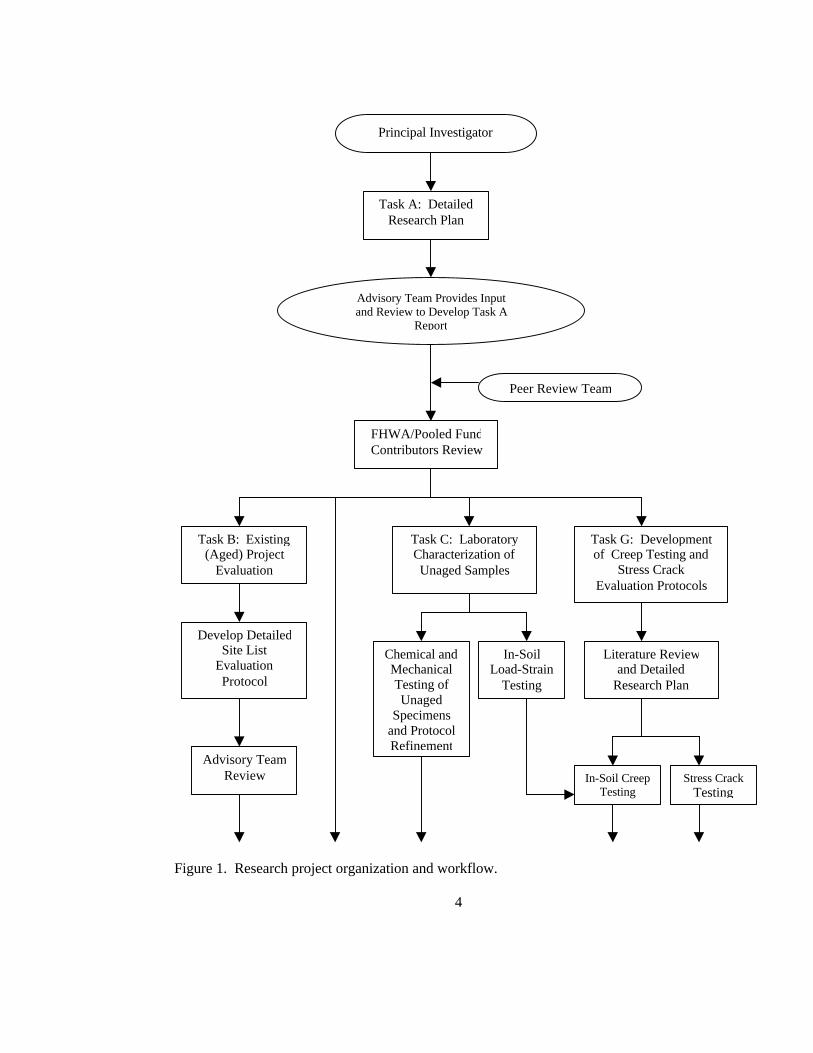
Figure 1. Research project organization and workflow.
4
Principal Investigator
Task A: DetailedResearch Plan
Advisory Team Provides Inputand Review to Develop Task A
Report
Peer Review Team
FHWA/Pooled FundContributors Review
Task B: Existing(Aged) Project
Evaluation
Develop DetailedSite List
EvaluationProtocol
Advisory TeamReview
Task C: LaboratoryCharacterization ofUnaged Samples
Chemical andMechanicalTesting ofUnaged
Specimensand ProtocolRefinement
In-SoilLoad-Strain
Testing
Task G: Developmentof Creep Testing and
Stress CrackEvaluation Protocols
Literature Reviewand Detailed
Research Plan
In-Soil CreepTesting
Stress CrackTesting
Figure 1. Research project organization and workflow (continued).
5
FHWA/PooledFund
ContributorsReview
SampleRecovery, Site
Characterizationand Soil Tests
GeosyntheticSample
Chemical andMechanical
Testing AfterTask C Protocol
Refinement
Develop BaselineData Bank ofProduct TestResults for
Unaged Materials(including test resultsfor products selected
for Task D and Etesting)
Develop TestProtocol for In-
Soil Creep
Develop TestProtocol for In-
Soil Creep
Task D:Oxidative
DegradationAnalysis
Task E:Hydrolytic
DegradationAnalysis
Phases 1 and 2 Specimen Characterization, andProtocol and Long-term Testing Program
Phase 3 Long-Term Testing Program
Task F: Behavioral Patterns of Geosynthetic Aging
Task H: Final Report
FHWA/Pooled Fund Contributors Review
PeerReviewTeam
The first contract was awarded to the research team on September 23, 1991. The budget for thefirst research contract was set at $878,876.00, not including an estimated $354,514.00 in costsharing and in-kind testing services provided by some members of the research team. The firstcontract consists of eight main tasks (Tasks A through H), in which the first task consisted of thedevelopment of a more detailed research plan. Once the detailed research plan was developed, anamendment to the initial contract was necessary to implement the detailed research plan. Themain changes to the contract resulting from this amendment consisted of increasing the long-termincubation period for oxidation and hydrolysis testing from 2 years to 2.5 years, aging specimensat lower temperatures to accommodate the increased incubation period and to provide anopportunity to extend some specimens to even longer incubation periods, adding two preliminaryphases to the oxidation and hydrolysis testing to develop testing protocols and fine tune the long-term testing program, and expanding the in-soil creep testing task to include the development of astress cracking protocol. This amendment, approved in October 1993, increased the totalcontract budget to $1,287,801.00, not including an estimated $358,517.00 in cost sharing and in-kind testing services from the geosynthetic industry as well as some of the research teammembers. It is anticipated that as the research project progresses, additional modifications to thecontract may be needed. Considering the potential yearly savings nationwide mentionedpreviously ($70 million/year), once implemented, the research will pay for itself rapidly. In fact,much of the cost of the research could be recovered from savings produced on one or two largeprojects.
PROPOSED FUTURE RERESEARCH CONTRACTS
The first research contract does not address all of the objectives envisioned for this researchprogram. The first research contract will provide a geosynthetic life prediction model for thelaboratory environment with only an order of magnitude assessment of the relationship betweenthe predicted life in the laboratory environment and the life in typical in-soil environments. Thisrelationship will likely have a great deal of uncertainty, which could result in the estimatedgeosynthetic life being quite conservative (this will be discussed more fully in a later chapter).This could result in the geosynthetic durability testing and evaluation protocol developed from thefirst contract being conservative as well. The first research contract will not address thesynergism between all of the strength loss mechanisms such as creep installation damage, andchemical durability.
Therefore, the scope of work for future research contracts would need to more fully address theextension of the life prediction model to geosynthetic degradation when buried in soil throughlaboratory as well as field studies, modifying the durability testing and evaluation protocol asneeded. Additionally, these future contracts would need to evaluate chemical degradation rates ofgeosynthetics under load, both in a virgin state and a roughened state as would result frominstallation in soil. Finally, depending on the results obtained from the first contract, additionallaboratory environments and/or field exhumations to evaluate oxidation and hydrolysis may beneeded to address unforeseen questions. The work planned for these future research contracts iscurrently unfunded.
6
2. GENERAL BACKGROUND ON CHEMICAL DEGRADATION OF GEOSYNTHETICS
Chemical degradation of geosynthetics is a result of both environmental factors and polymercompositional factors. For a given polymer type, one can expect the greatest amount of chemicaldegradation to occur, in general, with polymers that have low molecular weights, low percentcrystallinity, low density, and low draw ratios (Elias, 1990). Polymer additives also influence thedegradation rate. Regarding environmental factors, one can expect the greatest amount ofdegradation to occur, in general, at relatively high temperatures, in moderate to high moistureconditions, in soils which are active chemically (especially in terms of pH and certain types of ionspresent), and with the geosynthetic under stress (Elias, 1990). Thickness of the polymer fibersmay also have a strong influence on the degradation rate, as degradation mechanisms aredependent on diffusion processes or exposure and removal of surface material (Wrigley, 1987).Key chemical degradation mechanisms in typical soil environments include oxidation, hydrolysis,and environmental stress cracking (ESC).
OXIDATION
The oxidation reaction can either be initiated by ultraviolet radiation or thermal energy. Since thegeosynthetic will be buried in most reinforcement applications, thermally activated oxidation is ofmost interest in the present study. Of the polymers used in geosynthetics, relatively speaking, PPis potentially the most susceptible to oxidation, followed by HDPE and PET which have arelatively low susceptibility. Though in actuality a rather complex reaction, conceptually,polyolefin (i.e., PP and HDPE) oxidation is the reaction of free radicals within the polymer withoxygen, resulting in breakdown and/or crosslinking of the molecular chains and embrittlement ofthe polymer.
Antioxidants are typically added to the polymer (sometimes multiple types are added to increaseeffectiveness) to prevent oxidation during processing and use. Broad classes of antioxidants oftenused in geosynthetics include phenolic stabilizers and hindered amine light stabilizers (HATS). Asthe antioxidants are used up, resistance of the polymer to oxidation will decrease. The rate ofpolymer oxidation is dependent on how much and what type of antioxidant is present initially, atwhat rate it is used up, how well it is distributed within the polymer, and how fast it can beleached out by the flow of fluids, such as water, into and around the polymer (Van Zanten, 1986).Environmental factors which affect the rate of oxidation include temperature, oxygenconcentration which in soil can vary from 21 percent in gravels at shallow depth to on the order of1 percent in fine-grained soils at deeper depths (Yanful, 1993; Yanful, et. al., 1993), and thepresence of transition metal ions such as iron (most common) or copper which act as a catalystand accelerate the oxidation reaction. Thermal oxidation at typical in-soil temperatures appears tobe quite slow.
HYDROLYSIS
Of the polymers typically used for geosynthetics, only PET is potentially susceptible to hydrolysis.Hydrolysis occurs when water molecules react with the polymer molecules, resulting in chainscission, reduced molecular weight, and strength loss. Hydrolysis is simply the very slow inversereaction of the synthesis of PET when water is present. The specifics of the reaction vary
7
depending on the pH of the liquid. This results in high pH (alkaline) hydrolysis being relativelyrapid, whereas neutral or low pH conditions can result in a slow hydrolysis rate. The rate ofhydrolysis is also highly temperature dependent and can become relatively rapid at hightemperatures in the vicinity of the glass transition temperature or above for the polymer, which ison the order of 70 oC to 80 oC (158 oF to 176 oF). The polymer does not need to be submergedfor hydrolysis to occur, as hydrolysis can occur in moderate to high humidity conditions, thoughthe reaction rate becomes slower as the humidity decreases (McMahon, et. al., 1959).
Hydrolysis appears to be the result of both a surface erosional phenomenon as well as adiffusional process of water to the polymer fiber core. These two phenomena have given rise tothe terms “outer” and “inner” hydrolysis. Outer, or surficial, hydrolysis is dominant in high pHconditions and is characterized by loss in fiber cross-sectional area with minimal reduction in themolecular weight of the polymer which remains (Anderson, et. al., 1992). Inner, or diffusionalcontrolled hydrolysis is dominant in neutral and acidic conditions and is characterized bysignificant losses in molecular weight of the polymer with minimal surficial erosion or damage(Anderson, et. al., 1992).
ENVIRONMENTAL STRESS CRACKING (ESC)
Rupture of a polymer when under stress is either ductile or brittle in nature. The ductile failuremode occurs when stresses are high enough to cause tie molecules to stretch out, lamellae toseparate and start unfolding, resulting in fracture of the spherulites and plastic flow of themolecular structure (Lustiger, 1983). When failure occurs in a brittle manner, stress levels areusually lower, allowing sufficient time for tie molecules to slowly disentangle themselves fromadjacent spherulites, initiating crack formation followed by slow crack growth (Bright, 1993).
ESC is the result of an accelerated crack initiation and growth process occurring when a polymeris subjected concurrently to a particular chemical environment and long-term stress. Thisaccelerated crack initiation and growth process can result in premature brittle failure. ESC resultsin molecular chain disentanglement rather than chain breakage or chemical change.
Evaluation of ESC has been focused on polyethylene due to its use in various critical applications(e.g., telephone transmission cables, natural gas pipe) and the potential sensitivity of somepolyethylenes to this phenomenon. The literature indicates that other polymers used forgeosynthetics may also experience some sensitivity to this phenomenon (Bright, 1993).
The results of previous studies show that polyethylene resistance to ESC can be improved byincreasing its average molecular weight, decreasing its molecular weight distribution, increasingits crystalline content, reducing the crystallite and/or spherulite size, increasing the degree oforientation, and using copolymerization (Wrigley, 1987). Therefore, the potential for ESC in agiven polymer can be controlled.
ESC is closely related to the more general phenomenon of stress cracking. The differencebetween the two is that the chemical present for ESC accelerates the chain disentanglementprocess, whereas in stress cracking no accelerating chemical is present. Chemicals identified inthe literature which can accelerate the stress cracking process include water, weak acids and
8

bases, alcohols, metallic soaps, and solvents (Wrigley, 1987). Water, and to some extent weakacids and bases, are “chemicals” which need to be considered for ESC in typical in-soilenvironments.
!i:!
i!,~l~~.,~l%,.~k
3. DESCRIPTION AND STATUS OF PROJECT TASKS(CURRENT RESEARCH CONTRACT)
The tasks for the current research contract and their status are summarized as follows:
TASK A - DETAILED RESEARCH WORK PLAN
The focus of this task is to develop a detailed research work plan for the project. The planninginvolved experts from all of the disciplines encompassed by the subject of study and an extensiveliterature review to take advantage of all available information and experience in developing theplan. The plan was reviewed by experts internationally as well as by the contributors to theproject. The Task A report was completed in November 1992.
TASK B -EXISTING(AGED)PROJECT EVALUATION
This task includes the selection, characterization, and sampling of approximately 20 geosyntheticsites to determine the amount of long-term geosynthetic strength loss occurring in actualgeosynthetic installations. The objective of this task is to obtain, as much as possible, agedgeosynthetic samples from sites in which the baseline is known, the geosynthetic is under load,and which are as old as possible (i.e., on the order of 5 to 10 years or more). It is unlikely,however, that the baseline can be determined with the needed degree of certainty for all 20 sites.Therefore, the data obtained in this task will also be used to establish an accurate baseline forexhumations performed at those sites in future geosynthetic durability research contracts.
Data to be obtained will include soil chemistry, gradation, strength, temperature, moisture, andstructure performance to define the total environment, and geosynthetic laboratory test data suchas tensile strength, creep behavior, visual appearance (micro level damage using ScanningElectron Microscopy (SEM) as well as damage at the macro level such as holes, cuts, generalabrasion, etc.), and any long-term chemical changes which have occurred through tests such asDifferential Scanning Calorimetry DSC), Oxidation Induction Time (OIT), melt flow index, HighPerformance Liquid Chromatography (HPLC), molecular weight determination, carboxyl endgroup (CEG) determination, and Thermogravimetric Analysis (TGA). Specific protocols are tobe developed, including exhumation, sample preparation, and testing procedures as needed, as acooperative effort between the geosynthetic industry and the research team. Since the chemicaland mechanical (e.g., strength) tests will be performed by the geosynthetic industry and willinvolve multiple laboratories, QA/QC procedures for this testing are to be developed to ensurethat interlaboratory bias is reduced to a minimum or eliminated. Some duplicate interlaboratorytesting may be required to spot check any observed differences between laboratories.
A final plan which identifies the sites selected for exhumation and the test protocols and programfor evaluating the exhumed samples was completed in November 1993. The sites selected and thesampling procedures have been approved. The chemical testing protocols and QA/QC proceduresto reduce or eliminate any interlaboratory bias have also been developed. Contributors to thestudy as well as a variety of other agencies, companies and individuals were contacted to identifycandidate sites. A total of 60 sites or groups of sites were identified, from which 28 sites orgroups of sites were selected for detailed evaluation in this study. The final sites were selected to
11
ensure that a variety of soil environments and geosynthetic products are evaluated. Preferencewas given to those sites in which at least some baseline data is available. A list of the selectedsites and their characteristics is provided in table 1. To date, 11 of the 28 “sites” have beenexhumed. No geosynthetic testing has been conducted thus far, with the exception of two sites inwhich only the tensile strength testing has been performed. Additional testing will not beconducted until the Task C testing, which will be used to fine tune the test protocols developed aspart of this task, is completed. Exhumed samples are being stored in a dark, climate controlledroom until the testing can be performed.
TASK C - LABORATORY CHARACTERIZATION OF UNAGED SAMPLES
This task includes the selection and detailed characterization of 14 unaged geosynthetic productsin addition to the products to be tested in Tasks D and E to provide a baseline data bank forgeosynthetic products typically used in geosynthetic reinforcement applications. In addition, theeffects of in-soil confinement on the short-term load-elongation response of various geosyntheticswill be investigated.
It is planned to perform the tests provided in table 2 for each of the 14 geosynthetic products. Inaddition, limited creep testing may be performed for products in which long-term creep test datais not available. This creep data will be used as baseline data for Task G.
The test protocols developed for Task B mentioned previously will also be used for Task C. TheTask C testing on unaged materials will be conducted before the testing on aged materials forTask B to allow refinement of the protocols, as it may not be possible to retest the aged materialsobtained in Task B due to material quantity limitations should the test protocols need to berefined. The Task C testing has not begun as yet.
The confined geosynthetic load-strain behavior study will consist of a literature review of pastattempts to determine this property before developing a detailed testing program and selecting atesting apparatus. The detailed testing program has been developed. It is anticipated that both atriaxial type confined load-extension device as well as a pullout box type device modified to allowloading the specimen at both ends will be used. Test variables such as specimen size, clampingsystem, soil placement procedures, extension testing displacement rate, and other test calibrationdetails will be evaluated before moving on to other variables. Once this is completed, othervariables such as soil type, confining pressure, and geosynthetic type will be investigated, Thiswork will be closely coordinated with the confined creep testing protocol development to beconducted in Task G. The actual in-soil testing proposed for Task C, other than some preliminaryprotocol development work, has not yet begun.
TASK D- OXIDATIVE DEGRADATION ANALYSIS
This task focuses on the thermally activated oxidative degradation of PP and HDPEgeosynthetics. This task consists of a laboratory study to develop test protocols and to evaluatethe effect key environmental factors in typical soil environments have on the rate of geosyntheticoxidative degradation.
12
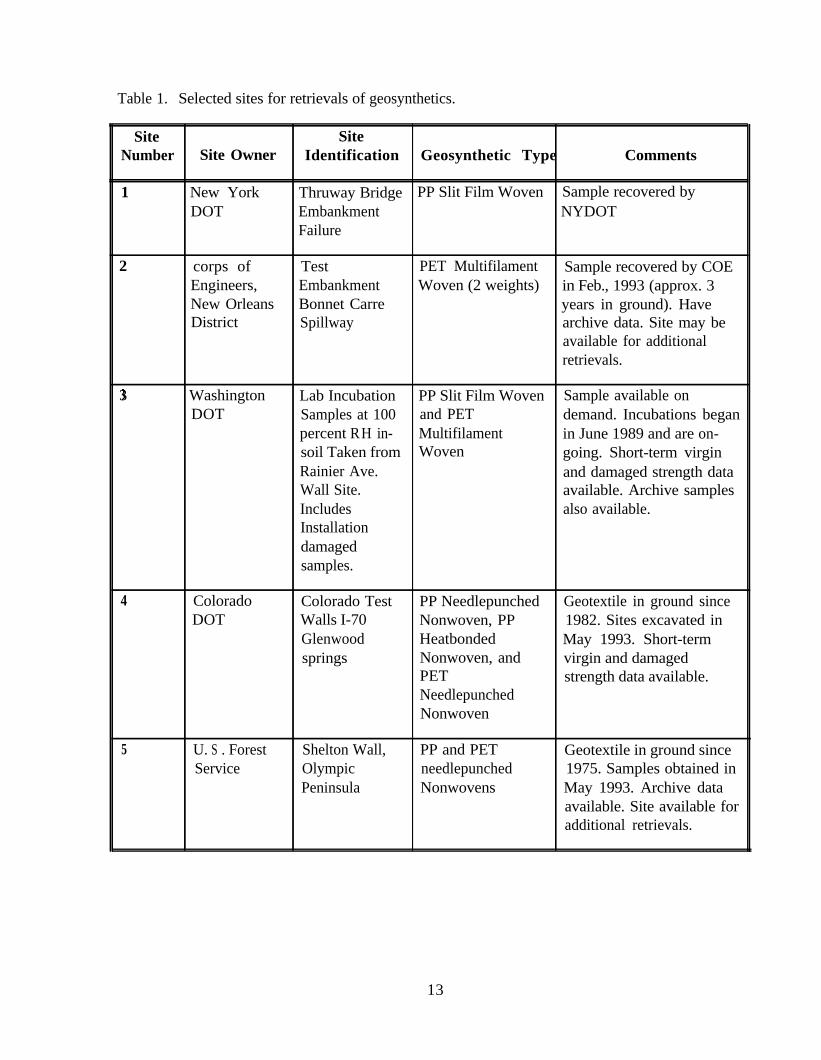
Table 1. Selected sites for retrievals of geosynthetics.
Site SiteNumber Site Owner Identification Geosynthetic Type Comments
1 New YorkDOT
Thruway Bridge PP Slit Film Woven Sample recovered byEmbankment NYDOTFailure
2 corps of Test PET Multifilament Sample recovered by COEEngineers, Embankment Woven (2 weights) in Feb., 1993 (approx. 3New Orleans Bonnet Carre years in ground). HaveDistrict Spillway archive data. Site may be
available for additionalretrievals.
3 WashingtonDOT
Lab Incubation PP Slit Film Woven Sample available onSamples at 100 and PET demand. Incubations beganpercent RH in- Multifilament in June 1989 and are on-soil Taken from Woven going. Short-term virginRainier Ave. and damaged strength dataWall Site. available. Archive samplesIncludes also available.Installationdamagedsamples.
4 ColoradoDOT
Colorado TestWalls I-70Glenwoodsprings
PP Needlepunched Geotextile in ground sinceNonwoven, PP 1982. Sites excavated inHeatbonded May 1993. Short-termNonwoven, and virgin and damagedPET strength data available.NeedlepunchedNonwoven
5 U. S . ForestService
Shelton Wall, PP and PETOlympic needlepunchedPeninsula Nonwovens
Geotextile in ground since1975. Samples obtained inMay 1993. Archive dataavailable. Site available foradditional retrievals.
13
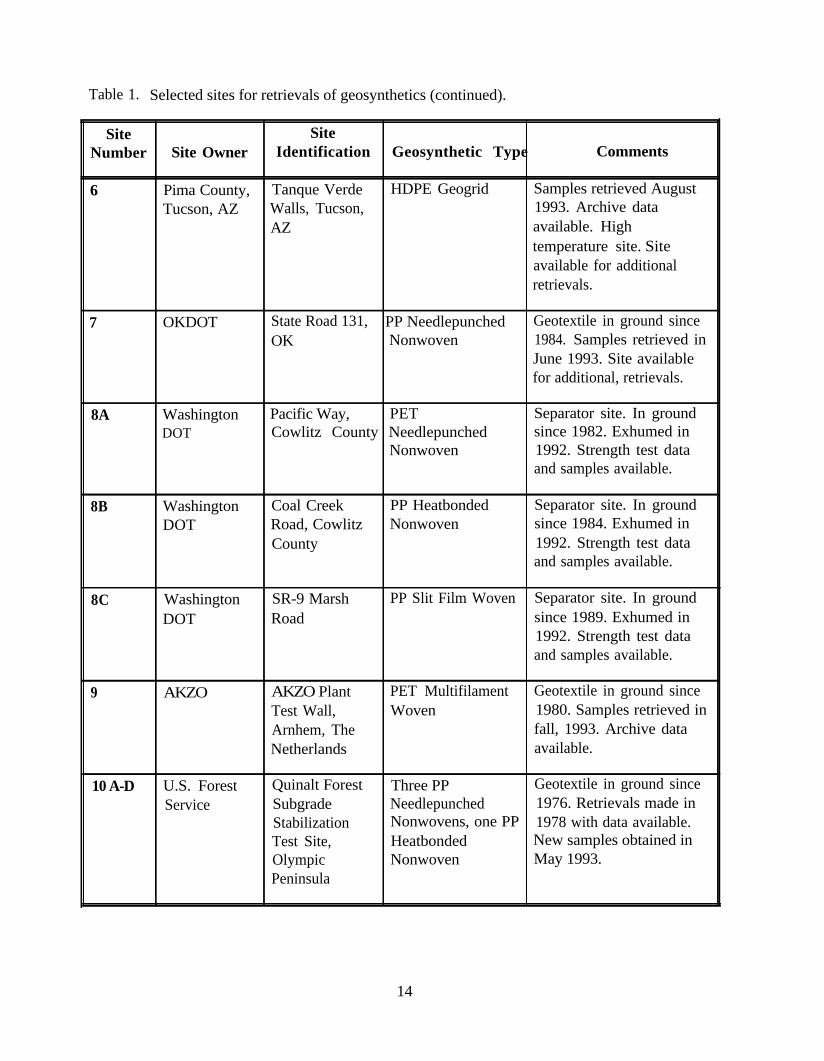
Table 1. Selected sites for retrievals of geosynthetics (continued).
Site SiteNumber Site Owner Identification Geosynthetic Type Comments
6 Pima County, Tanque Verde HDPE Geogrid Samples retrieved AugustTucson, AZ Walls, Tucson, 1993. Archive data
AZ available. Hightemperature site. Siteavailable for additionalretrievals.
7 OKDOT State Road 131, PP Needlepunched Geotextile in ground sinceOK Nonwoven 1984. Samples retrieved in
June 1993. Site availablefor additional, retrievals.
8A WashingtonDOT
Pacific Way, PETCowlitz County Needlepunched
Nonwoven
Separator site. In groundsince 1982. Exhumed in1992. Strength test dataand samples available.
8B WashingtonDOT
Coal CreekRoad, CowlitzCounty
PP HeatbondedNonwoven
Separator site. In groundsince 1984. Exhumed in1992. Strength test dataand samples available.
8C WashingtonDOT
SR-9 MarshRoad
PP Slit Film Woven Separator site. In groundsince 1989. Exhumed in1992. Strength test dataand samples available.
9 AKZO AKZO PlantTest Wall,Arnhem, TheNetherlands
PET MultifilamentWoven
Geotextile in ground since1980. Samples retrieved infall, 1993. Archive dataavailable.
10 A-D U.S. ForestService
Quinalt ForestSubgradeStabilizationTest Site,OlympicPeninsula
Three PP Geotextile in ground sinceNeedlepunched 1976. Retrievals made inNonwovens, one PP 1978 with data available.Heatbonded New samples obtained inNonwoven May 1993.
14
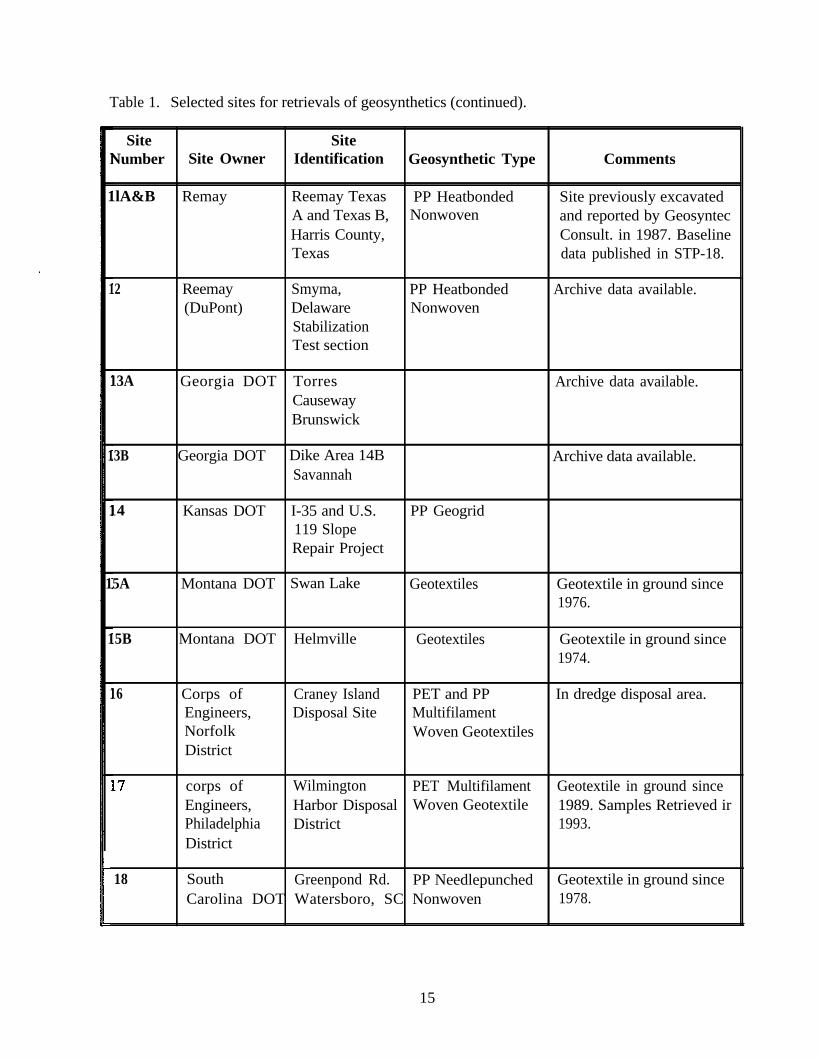
Table 1. Selected sites for retrievals of geosynthetics (continued).
Site SiteNumber Site Owner Identification Geosynthetic Type Comments
1lA&B Remay Reemay Texas PP Heatbonded Site previously excavatedA and Texas B, Nonwoven and reported by GeosyntecHarris County, Consult. in 1987. BaselineTexas data published in STP-18.
12 Reemay Smyma, PP Heatbonded Archive data available.(DuPont) Delaware Nonwoven
StabilizationTest section
13A Georgia DOT TorresCausewayBrunswick
Archive data available.
13B Georgia DOT Dike Area 14B Archive data available.Savannah
14 Kansas DOT I-35 and U.S. PP Geogrid119 SlopeRepair Project
15A Montana DOT Swan Lake Geotextiles Geotextile in ground since1976.
15B Montana DOT Helmville Geotextiles Geotextile in ground since1974.
16 Corps ofEngineers,NorfolkDistrict
Craney IslandDisposal Site
PET and PP In dredge disposal area.MultifilamentWoven Geotextiles
corps ofEngineers,PhiladelphiaDistrict
Wilmington PET Multifilament Geotextile in ground sinceHarbor Disposal Woven Geotextile 1989. Samples Retrieved irDistrict 1993.
18 South Greenpond Rd. PP Needlepunched Geotextile in ground sinceCarolina DOT Watersboro, SC Nonwoven 1978.
15
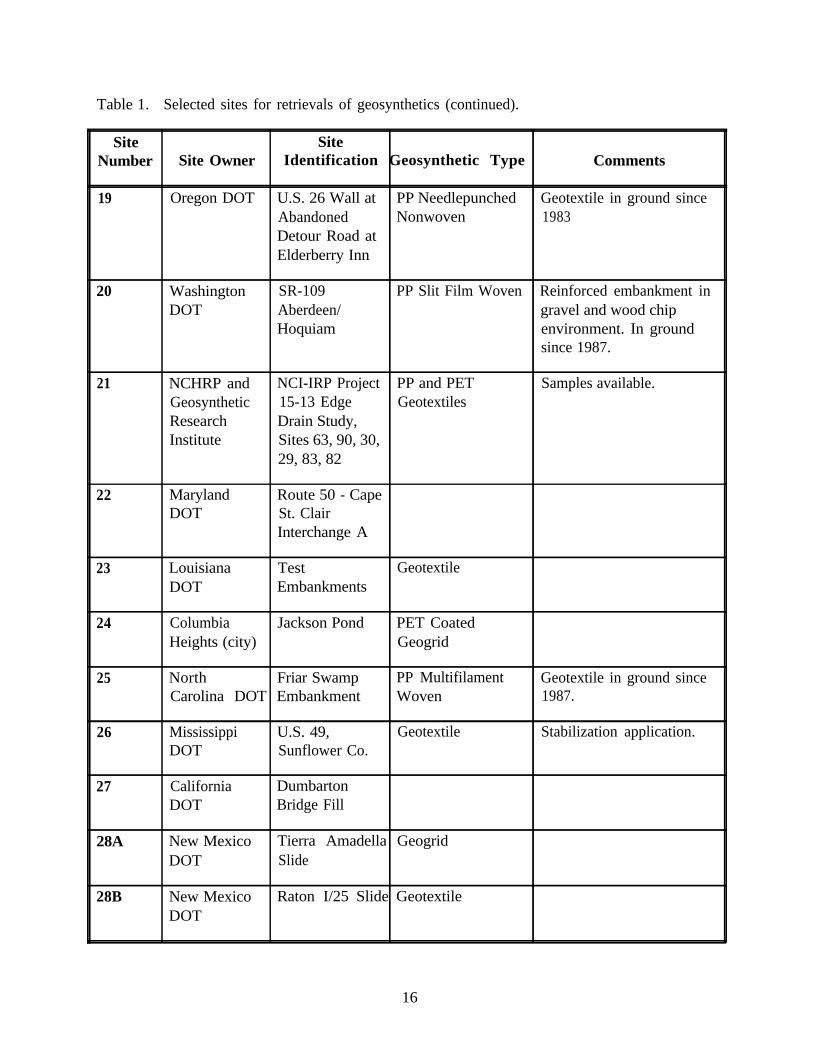
Table 1., Selected sites for retrievals of geosynthetics (continued).
Site SiteNumber Site Owner Identification Geosynthetic Type Comments
19 Oregon DOT U.S. 26 Wall at PP Needlepunched Geotextile in ground sinceAbandoned Nonwoven 1983Detour Road atElderberry Inn
20 WashingtonDOT
SR-109Aberdeen/Hoquiam
PP Slit Film Woven Reinforced embankment ingravel and wood chipenvironment. In groundsince 1987.
21 NCHRP and NCI-IRP Project PP and PET Samples available.Geosynthetic 15-13 Edge GeotextilesResearch Drain Study,Institute Sites 63, 90, 30,
29, 83, 82
22 MarylandDOT
Route 50 - CapeSt. ClairInterchange A
23
24
25
26
27
28A
28B
Louisiana Test GeotextileDOT Embankments
Columbia Jackson Pond PET CoatedHeights (city) Geogrid
North Friar Swamp PP MultifilamentCarolina DOT Embankment Woven
Mississippi U.S. 49, GeotextileDOT Sunflower Co.
California DumbartonDOT Bridge Fill
New Mexico Tierra Amadella GeogridDOT Slide
New Mexico Raton I/25 Slide GeotextileDOT
Geotextile in ground since1987.
Stabilization application.
16
This task consists of three phases. The first phase develops or fine tunes some of the testprotocols to be used for the laboratory testing to be conducted in subsequent phases.Additionally during this phase, equipment will be purchased and calibrated as necessary, andmaterials and samples will be prepared. Studies will be conducted on both reference polyolefins(HDPE pellets and isotactic PP powder) and some commercial geosynthetic products. Specificpreliminary studies are to include:
Thermal response of reference polymers (TGA and DSC).
Selection and fine tuning of test methods to chemically track oxidative degradation as itprogresses.
Evaluation of the shrinkage response of PP geotextiles at the highest temperatures anticipatedfor the testing to determine whether or not specimen framing to prevent shrinkage will berequired.
Evaluation of techniques to remove antioxidants so that the oxidation response of the basepolymer can be studied.
Calibration of OIT and HPLC using reference polymers with premeasured antioxidantconcentrations (i.e., model systems).
Water extraction studies to provide a preliminary evaluation of antioxidant leachability.
Evaluation of the oxidation response of a model polymer system (PP with known antioxidantconcentration) to exposure to various concentrations of a metal salt solution (specifically iron)as an aid to future selection of metal salt concentrations for later long-term studies.
Mechanical tests conducted to determine the statistically required number of specimens toaccount for product variability in the Phase 3 testing as well as to provide a baseline.
The second phase provides limited preliminary laboratory tests conducted on commercialgeosynthetic samples to provide a baseline for the Phase 3 testing. This baseline data includeschemical and mechanical properties of products to be tested in Phase 3, and preliminary short-term oven aging tests in extreme conditions to fine tune the long-term oven aging protocol andtest program in Phase 3. Table 2 provides a list of the tests anticipated to be conducted (with theexception of the tests only applicable to PET) in this phase.
The third phase consists of a long-term (i.e., up to 2.5 years in length as currently planned)systematic experimental program to evaluate the effect various environmental variables have onthe oxidative degradation rate of PP and HDPE geosynthetic products in an oven environment.Elevated temperature will be the primary environmental variable used to accelerate propertychanges such that measurable strength losses occur within the desired time frame. The researcherswill attempt to model this data as a function of temperature (i.e., the Arrhenius model combinedwith a rate expression, discussed later in this report) to permit extrapolation to typical in situtemperatures.
17
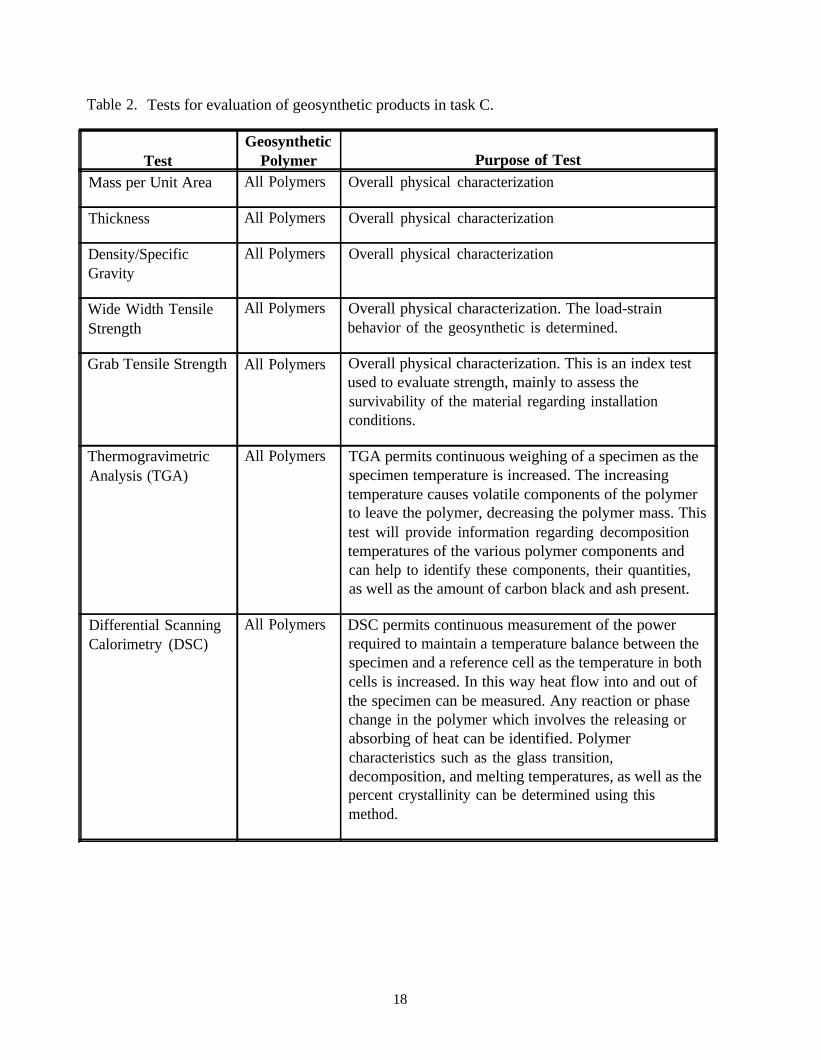
Table 2. Tests for evaluation of geosynthetic products in task C.
GeosyntheticTest Polymer Purpose of Test
Mass per Unit Area All Polymers Overall physical characterization
Thickness All Polymers Overall physical characterization
Density/Specific All Polymers Overall physical characterizationGravity
Wide Width Tensile All Polymers Overall physical characterization. The load-strainStrength behavior of the geosynthetic is determined.
Grab Tensile Strength All Polymers Overall physical characterization. This is an index testused to evaluate strength, mainly to assess thesurvivability of the material regarding installationconditions.
ThermogravimetricAnalysis (TGA)
All Polymers TGA permits continuous weighing of a specimen as thespecimen temperature is increased. The increasingtemperature causes volatile components of the polymerto leave the polymer, decreasing the polymer mass. Thistest will provide information regarding decompositiontemperatures of the various polymer components andcan help to identify these components, their quantities,as well as the amount of carbon black and ash present.
Differential Scanning All Polymers DSC permits continuous measurement of the powerCalorimetry (DSC) required to maintain a temperature balance between the
specimen and a reference cell as the temperature in bothcells is increased. In this way heat flow into and out ofthe specimen can be measured. Any reaction or phasechange in the polymer which involves the releasing orabsorbing of heat can be identified. Polymercharacteristics such as the glass transition,decomposition, and melting temperatures, as well as thepercent crystallinity can be determined using thismethod.
18
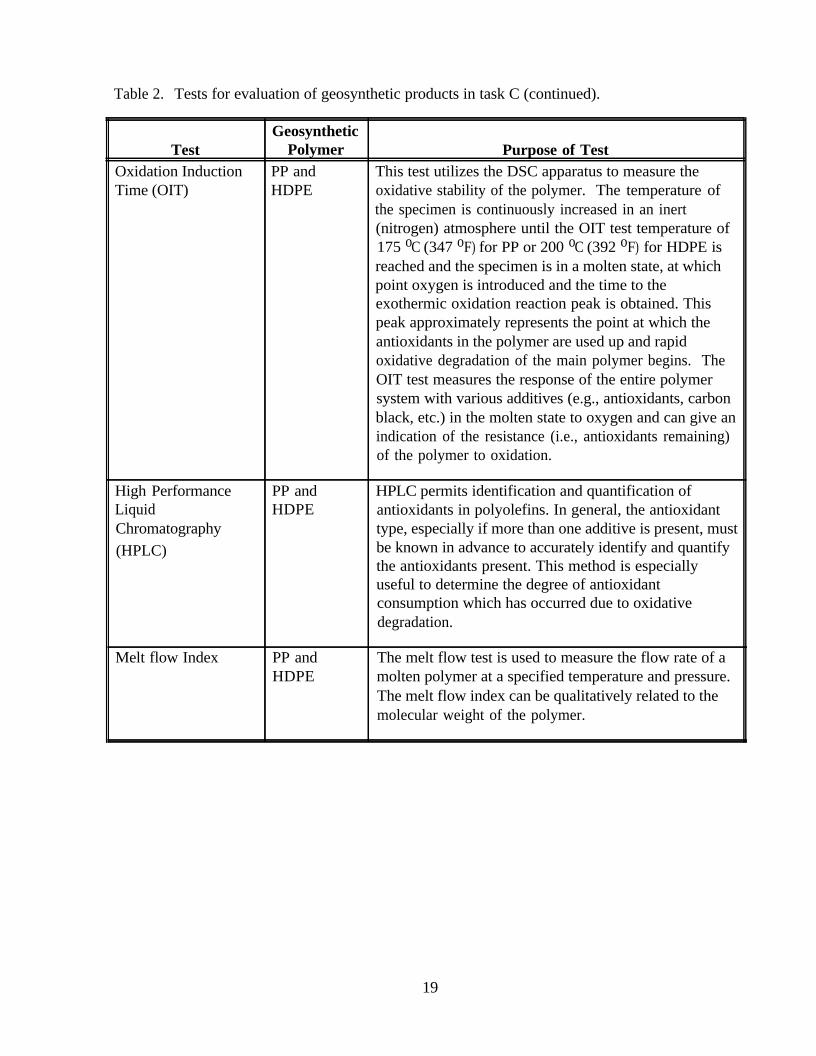
Table 2. Tests for evaluation of geosynthetic products in task C (continued).
GeosyntheticTest Polymer Purpose of Test
Oxidation Induction PP and This test utilizes the DSC apparatus to measure theTime (OIT) HDPE oxidative stability of the polymer. The temperature of
the specimen is continuously increased in an inert(nitrogen) atmosphere until the OIT test temperature of175 oC (347 oF) for PP or 200 oC (392 oF) for HDPE isreached and the specimen is in a molten state, at whichpoint oxygen is introduced and the time to theexothermic oxidation reaction peak is obtained. Thispeak approximately represents the point at which theantioxidants in the polymer are used up and rapidoxidative degradation of the main polymer begins. TheOIT test measures the response of the entire polymersystem with various additives (e.g., antioxidants, carbonblack, etc.) in the molten state to oxygen and can give anindication of the resistance (i.e., antioxidants remaining)of the polymer to oxidation.
High PerformanceLiquidChromatography(HPLC)
PP andHDPE
HPLC permits identification and quantification ofantioxidants in polyolefins. In general, the antioxidanttype, especially if more than one additive is present, mustbe known in advance to accurately identify and quantifythe antioxidants present. This method is especiallyuseful to determine the degree of antioxidantconsumption which has occurred due to oxidativedegradation.
Melt flow Index PP andHDPE
The melt flow test is used to measure the flow rate of amolten polymer at a specified temperature and pressure.The melt flow index can be qualitatively related to themolecular weight of the polymer.
19
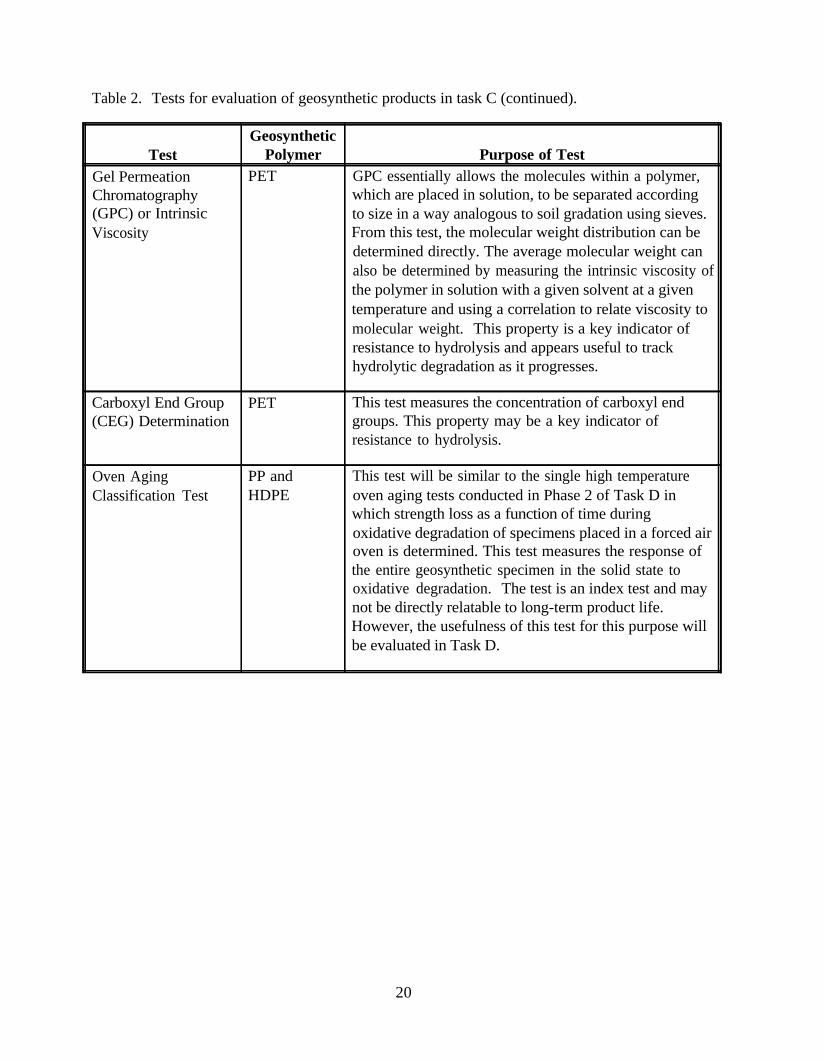
Table 2. Tests for evaluation of geosynthetic products in task C (continued).
GeosyntheticTest Polymer Purpose of Test
Gel Permeation PET GPC essentially allows the molecules within a polymer,Chromatography which are placed in solution, to be separated according(GPC) or Intrinsic to size in a way analogous to soil gradation using sieves.Viscosity From this test, the molecular weight distribution can be
determined directly. The average molecular weight canalso be determined by measuring the intrinsic viscosity ofthe polymer in solution with a given solvent at a giventemperature and using a correlation to relate viscosity tomolecular weight. This property is a key indicator ofresistance to hydrolysis and appears useful to trackhydrolytic degradation as it progresses.
Carboxyl End Group PET This test measures the concentration of carboxyl end(CEG) Determination groups. This property may be a key indicator of
resistance to hydrolysis.
Oven Aging PP andClassification Test HDPE
This test will be similar to the single high temperatureoven aging tests conducted in Phase 2 of Task D inwhich strength loss as a function of time duringoxidative degradation of specimens placed in a forced airoven is determined. This test measures the response ofthe entire geosynthetic specimen in the solid state tooxidative degradation. The test is an index test and maynot be directly relatable to long-term product life.However, the usefulness of this test for this purpose willbe evaluated in Task D.
20
Phase 3 will evaluate four or five polyolefin geosynthetics such that a range of chemicalproperties, fiber properties and overall geosynthetic constructions are evaluated. Two of theseproducts will, in addition to the commercial version, be specially produced without end-useantioxidants to allow assessment of the oxidative resistance of the base polymer so that the effectof the antioxidants on oxidative resistance can be determined. The key environmental variablesand test acceleration techniques evaluated in this task would be used to allow the protocoldeveloped to be related, at least to some degree, to typical in situ conditions. Environments to beevaluated include four temperatures, two oxygen concentrations, a dry and high humiditycondition, and two metal salt concentrations. Forced air ovens will be used to expose thegeosynthetic specimens to these conditions. Specimens will be allowed to degrade until a strengthloss of 50 percent is obtained, if possible. Typically, five sample retrievals performed during theduration of the test exposure time, with five specimens per retrieval, are planned for eachenvironmental condition and geosynthetic product tested. The test program may be adjusted asearly results become available. Some additional samples for additional retrievals will be includedat the lowest test temperature should longer incubation times than originally planned be required.
It is not the intent of this study to evaluate every possible combination of polymer chemicalmakeup currently available. Instead, the study is to develop a test protocol which can be used byvarious geosynthetic manufacturers and geosynthetic users to assess the potential long-termperformance of any given geosynthetic product.
Wide width tensile strength will be used to characterize the strength of the geosynthetics as ovenaging progresses. Specimen weight loss will also be measured. Scanning electron microscopy(SEM) will be conducted occasionally to evaluate the physical nature of the oxidative damage asit becomes more severe. HPLC and OIT tests will be conducted to attempt to track theconsumption of antioxidants as degradation progresses.
To date, Phases 1 and 2 of this task have been completed, and the specimens to be evaluated inPhase 3 have been placed in the ovens and have been incubating since early January, 1994. Thetest program has been adjusted based on the results of Phases 1 and 2 (provided in the nextchapter), with additional minor adjustments based on the early results from the Phase 3 testing.
TASK E - HYDROLYTIC DEGRADATION ANALYSIS
This task focuses on the hydrolytic degradation of PET geosynthetics. This task is strictly alaboratory study to develop test protocols and to systematically evaluate the effect keyenvironmental factors of concern in typical soil environments have on the rate of geosynthetichydrolytic degradation.
This task consists of three phases. The first phase provides the groundwork for the fine tuning ofthe experimental plan to be implemented in subsequent phases. During this phase, detailed testprotocols are to be developed or fine tuned, equipment will be purchased and calibrated asnecessary, and materials and samples will be prepared. Studies will be conducted on both areference polymer (e.g., PET flakes) and some commercial geosynthetic products, both in theform of fibers as well as complete geosynthetic products. Specific preliminary studies are toinclude:
21
Thermal response of reference polymers (TGA and DSC).
Selection and fine tuning of the best test methods to chemically track hydrolytic degradation(specifically molecular weight loss and surficial erosion) as it progresses.
Evaluation of the shrinkage response of PET geosynthetics at the highest test temperatures todetermine whether or not specimen framing to prevent shrinkage will be required.
Characterization of the PVC coating on coated geogrids, the nature of its degradation, andevaluation of experimental techniques to remove the PVC from the geogrid.
Initial studies using PET fibers to select environments appropriate for Phase 2 and 3experiments.
Preliminary development of long-term immersion test equipment and procedures.
Mechanical tests conducted to determine the statistically required number of specimens toaccount for product variability in the Phase 3 testing as well as to provide a baseline.
The second phase provides limited preliminary experiments conducted on commercialgeosynthetic samples to provide a baseline for the Phase 3 testing. This baseline data includeschemical and mechanical properties of products to be tested in Phase 3, and preliminary short-term immersion testing in “worst case” conditions to fine tune the long-term hydrolyticdegradation protocol and test program in Phase 3. Table 2 provides a list of the tests anticipatedto be conducted (with the exception of the tests only applicable to PP and HDPE) in this phase.A specific plan to evaluate the effect the PVC coating has on hydrolytic degradation of coatedPET geogrids will also be developed in this phase.
The third phase consists of a long-term (i.e., up to 2.5 years in length as currently planned)systematic experimental program to evaluate the effect various environmental variables have onthe hydrolytic degradation rate in laboratory immersion environment of typical PET geosyntheticproducts. Elevated temperature, and to some extent the pH of the immersion liquid, will be theprimary environmental variables used to accelerate degradation such that measurable strengthlosses occur within the desired time frame. This data will be modeled as a function oftemperature (i.e., the Arrhenius model combined with a rate expression, discussed later in thisreport) to permit extrapolation to typical in situ temperatures and/or as a function of pH to permitextrapolation from alkaline (and to some extent acidic) conditions to more typical neutralconditions found in situ.
It is specifically planned in Phase 3 to evaluate three PET geosynthetics such that a range ofchemical properties, fiber properties and overall geosynthetic constructions are evaluated. Theone coated geogrid product will be tested with and without the PVC coating to assess the long-term effect the coating has on hydrolysis of PET geosynthetics. It is not the intent of this study toevaluate every possible combination of polymer chemical makeup currently available, but insteadis to develop a test protocol which can be used by various geosynthetic manufacturers andgeosynthetic users to assess the potential long-term performance of any given geosynthetic
22
product. The key environmental variables and test acceleration techniques evaluated in this taskwould be used to allow the protocol developed to be related, at least to some degree, to typical insitu conditions. Environments to be evaluated include four temperatures, three alkaline immersionsolutions (both sodium and lime), one acidic solution (sulfuric acid), a neutral solution (water), amoderate and high humidity condition, and a limited study of hydrolysis of one product in soil atneutral pH. Hydrolysis reactors (i.e., an immersion tank) in which the solution is continuouslystirred will be used to expose the geosynthetic specimens to these conditions. Specimens will beallowed to degrade until a strength loss of 50 percent is obtained, if possible. Typically, fivesample retrievals performed during the duration of the test exposure time, with five specimens perretrieval, are planned for each environmental condition and geosynthetic product tested. The testprogram may be adjusted as early results become available. Some additional samples foradditional retrievals will be included at the lowest test temperature should longer incubation timesthan originally planned be required.
Wide width tensile strength will be used to characterize the strength of the geosynthetics ashydrolysis progresses. Specimen weight loss will also be measured. Scanning electronmicroscopy (SEM) will be conducted as needed to evaluate the physical nature of the hydrolyticdamage, especially in alkaline conditions, to help differentiate between inner and outer hydrolysisdegradation mechanisms. Hydrolysis will be tracked chemically using intrinsic viscosity todetermine molecular weight and by measuring the CEG.
To date, Phases 1 and 2 of this task have been completed, and the specimens to be evaluated inPhase 3 have been placed in the ovens and have been incubating since early January, 1994. Thetest program has been adjusted based on the results of Phases 1 and 2 (provided in the nextchapter), with additional minor adjustments based on the early results from the Phase 3 testing.
TASK F- BEHAVIORAL PATTERNS OF GEOSYNTHETIC AGING
In this task, all of the data generated in Tasks A through E will be analyzed to establish behaviorpatterns of geosynthetic aging. New procedures and design methodologies to account for and/orpredict changes in the long-term geosynthetic strength and deformation characteristics due toaging will be developed.
TASK G- DEVELOPMENT OF CREEP TESTING PROTOCOL
This task will parallel the confined in-soil load-elongation testing conducted in Task C, exceptthat the focus will be on time dependent behavior under constant load (i.e., creep). Additionally,unconfined creep tests to evaluate the stress crack resistance of HDPE geogrids and to evaluatetesting protocols will be conducted.
Regarding the confined in-soil creep tests, a test program will be developed by conducting aliterature review to define key variables and identify the most appropriate apparatus andpreliminary test protocols to investigate.the following considerations in mind:
These preliminary test protocols will be developed with
l Simplicity, reliability, and availability of test equipment.
23
. Ability to conduct a large number of tests.
l Ability to test a variety of geosynthetic and soil types.
l Ability to standardize soil preparation procedures.
l Ability to measure and evaluate patterns of relative displacement between the geosyntheticand the confining soil and to directly measure load in the geosynthetic.
l Ability to decouple the confined tensile response from the soil/geosynthetic interface shear,
Equipment used will likely be either a triaxial or a pullout type device similar to that used for TaskC, modified as appropriate. A trial test program is planned to more fully develop or adjust theselected protocol. The final protocol will be developed with consideration of the possibility oftesting either chemically degraded specimens or to chemically degrade specimens in the device atan elevated temperature or through long-term chemical submergence during the creep test. Oncethe final test protocol is developed, test variables such as soil type, geosynthetic type, confiningpressure, and geosynthetic load level will be evaluated. Some tests may be conducted in asubmerged condition.
To date, the literature review and preliminary test protocols for the confined creep testing havebeen completed, Preliminary testing to evaluate and refine the preliminary test protocols hasbegun.
Regarding the stress crack resistance testing and protocol development, the testing program willbe conducted using a four step approach. In the first two steps, HDPE resin materials will beevaluated, whereas in Steps 3 and 4, geogrid product will be evaluated. In Steps 1 and 4, notchedspecimens will be tested, whereas in Steps 2 and 3, unnotched specimens will be tested. Each ofthe four steps are summarized as follows:
1. Notched creep rupture resistance of three HDPE resins, of which one is a resin used forHDPE geogrids, one is a resin known to have low stress crack resistance, and one is a resinknown to have high stress crack resistance, will be determined at 50 oC (122 oF) in water.Five load levels will be tested which vary from 25 to 65 percent, and three specimens will betested at each load level. This testing is intended to verify that the selected protocol (ASTMD5397, modified to use water rather than Igepal as the surface wetting agent) willdiscriminate between a crack resistant and a crack sensitive material and that the resin used forgeogrids is crack resistant. Because the specimens are notched, this testing only evaluatescrack propagation.
2. The testing proposed for this step is the same as that to be performed in Step 1, except that allspecimens will be unnotched. Therefore, evaluates both crack initiation and crackpropagation. Comparison with Step 1 results will allow the effects of crack initiation to beseparated from the effects of crack propagation. This testing is intended to additionallydetermine if the test, with the added step of crack initiation, which is a more realistic situation
24
3.
for geogrids in situ, can still discriminate between crack resistant and crack sensitive resins. Itis hoped that these results will support the practice of notching to accelerate the test,
In this step, unnotched geogrid specimens will be tested using (creep) stress rupture testing.Test conditions will be similar to ASTM D5397, except that the clamping arrangement willnot pierce the specimens, water will be used as the environment, and the specimens areunnotched. Temperatures tested will be 50 oC (122 oF), 65 oC (149 oF), and 80 oC (176 oF),and the testing times will be extended to as much as 10,000 h. This testing is intended toassess the stress crack resistance of unnotched geogrid product at temperature levels knownto accelerate stress cracking. It is anticipated that this data can be used to make lifepredictions and to establish the safe design stress level which will preclude slow crack growthfailures. This data will provide a baseline for the development of accelerated test procedures.Furthermore, comparison of this data to data from Steps 1 and 2 will allow the effect ofmolecular orientation on stress crack resistance to be determined.
4. Tests performed in this step on geogrid specimens are the same as those performed in Step 3,except the geogrid will be notched in the relatively nonoriented geogrid nodal material. Someinitial parametric studies will be conducted in this step to determine the specific notchgeometry and location for the notched specimen testing. The objective of this step is toqualify an accelerated test which utilizes notched specimens that can be used to obtainquantitative design oriented data.
Scanning electron microscopy will be used to evaluate fracture surfaces. Index testing such asultimate tensile strength, polymer density, melt flow index, and percent crystallinity will be used tocharacterize the materials tested.
To date, the specimens to be tested in Steps 1 and 2 have been made, and the parametric study toevaluate notch details has begun. Unnotched specimens were loaded in May, 1994, and creepdata is being obtained.
TASK H-FINAL REPORT
This task consists of the development of a final report which summarizes the overall test programand research approach, a description of how each task was performed including test proceduresand apparatus used, a summary of all of the data obtained in the study, a discussion of thebehavior observed, and any conclusions which can be made. Detailed test results are to beprovided in a separate report.
A design chapter is also to be provided. This chapter will present methods for the determinationof long-term geosynthetic strength and deformational characteristics, including a step-by-stepapproach to be used in any reinforcement application. Recommended procedures for short-termtests needed to predict long-term geosynthetic performance for both design and quality controlpurposes, as well as geosynthetic specification guidelines, will be included.
This task is anticipated to be completed by the end of 1996.
25
4. TASK D, SUMMARY OF PHASE 1 AND 2 RESULTS
The specific testing program for this task is provided in chapter 3.0 of this report. This taskfocuses on the oxidation degradation mechanism. It must be understood that test results from thePhase 1 and 2 testing discussed, or in limited cases presented, herein are preliminary in nature andintended only for the purpose of developing the Phase 3 long-term testing program. Therelationship of the results from the Phase 1 and 2 testing to potential long-term product life is atthis point unknown.
CHARACTERISTICS OF PRODUCTS SELECTED FOR TESTING
Candidate products were initially selected during the Task A planning such that a variety ofproduct macrostructures and polymer compositions are evaluated. Due to budget limitations,only four to five geosynthetic products can be evaluated in this task in Phase 3. Testingperformed in Phases 1 and 2 was used to refine the product selection process. In addition toproduct variety, potential statistical product variability was also considered. It was desirable toselect products with relatively low property variability to minimize the number of specimensrequired. Strength reported later in this chapter was used to determine this. In general, it was feltthat chemical property variations would not be as great as the strength property variations andthat strength testing needs would control the number of specimens required. A summary of thefinal product selection, including the reference materials used only for Phase 1 and 2 test protocoldevelopment, is provided in table 3.
Up to 10 specimens of each geosynthetic product were tested to measure unit weight (ASTMD3776), thickness (ASTM D 1777), and tensile strength. Regarding tensile strength, the widestrip method (ASTM D4595, but modified for geogrids) was used. Additionally, the geogrid wastested to evaluate the effect the number of ribs tested in a given specimen had on the measuretensile strength.. Both single rib and an eight rib wide specimens were tested. No statisticaldifference in the measured strength per rib for the different specimen widths was observed.Therefore, all geogrid testing will utilize one rib wide specimens. A summary of the physicaltesting is provided in table 4.
The number of specimens required for strength testing was determined using the Student’s tdistribution as outlined in ASTM D4595. The coefficient of variation obtained for the sample forwide width strength was compared to the manufacturer’s reported values from quality controltesting, which was assumed to be representative of the variation for the population, as available(this data was available for two PP products). The sample and manufacturer values were found tobe similar. Furthermore, all specimens were taken from the center of the roll width, and all futurespecimens will be taken from the same area from the same geosynthetic roll. This was done tominimize specimen variation and to ensure that the recommended number of specimens will bestatistically adequate for the future testing.
27
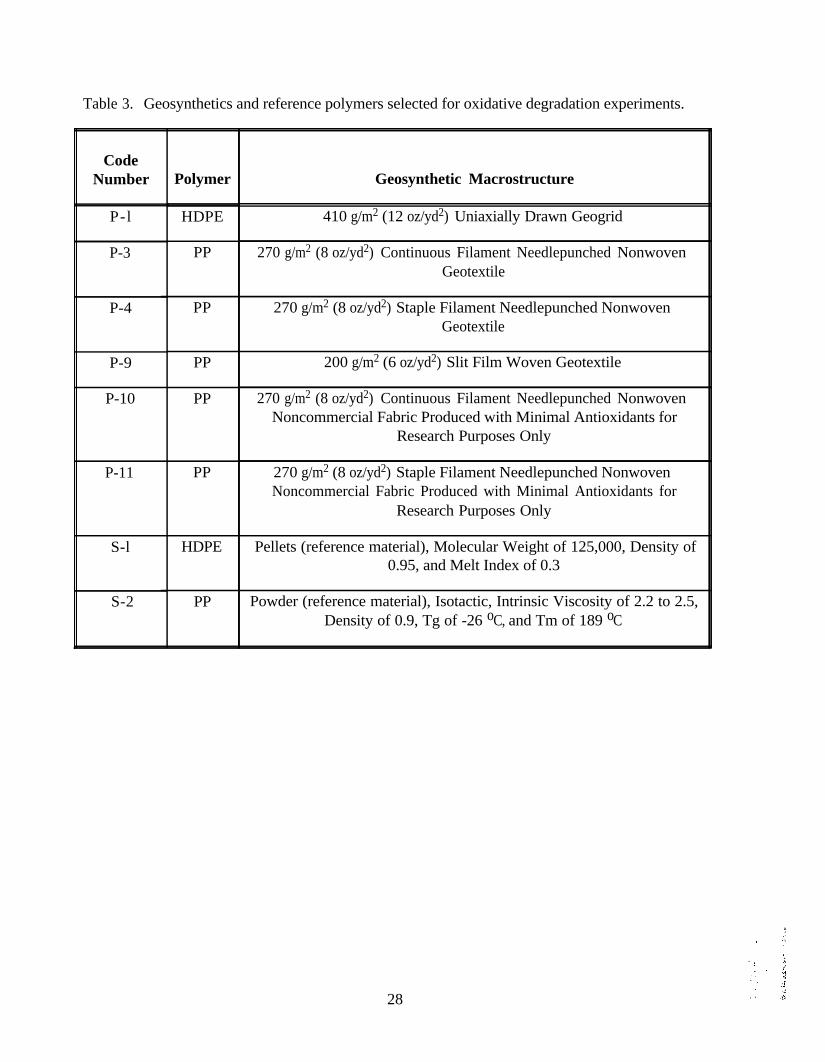
Table 3. Geosynthetics and reference polymers selected for oxidative degradation experiments.
CodeNumber
P-l
P-3
P-4
P-9
P-10
P-11
S-l
S-2
Polymer
HDPE
PP
PP
PP
PP
PP
HDPE
PP
Geosynthetic Macrostructure
410 g/m2 (12 oz/yd2) Uniaxially Drawn Geogrid
270 g/m2 (8 oz/yd2) Continuous Filament Needlepunched NonwovenGeotextile
270 g/m2 (8 oz/yd2) Staple Filament Needlepunched NonwovenGeotextile
200 g/m2 (6 oz/yd2) Slit Film Woven Geotextile
270 g/m2 (8 oz/yd2) Continuous Filament Needlepunched NonwovenNoncommercial Fabric Produced with Minimal Antioxidants for
Research Purposes Only
270 g/m2 (8 oz/yd2) Staple Filament Needlepunched NonwovenNoncommercial Fabric Produced with Minimal Antioxidants for
Research Purposes Only
Pellets (reference material), Molecular Weight of 125,000, Density of0.95, and Melt Index of 0.3
Powder (reference material), Isotactic, Intrinsic Viscosity of 2.2 to 2.5,Density of 0.9, Tg of -26 oC, and Tm of 189 oC
28
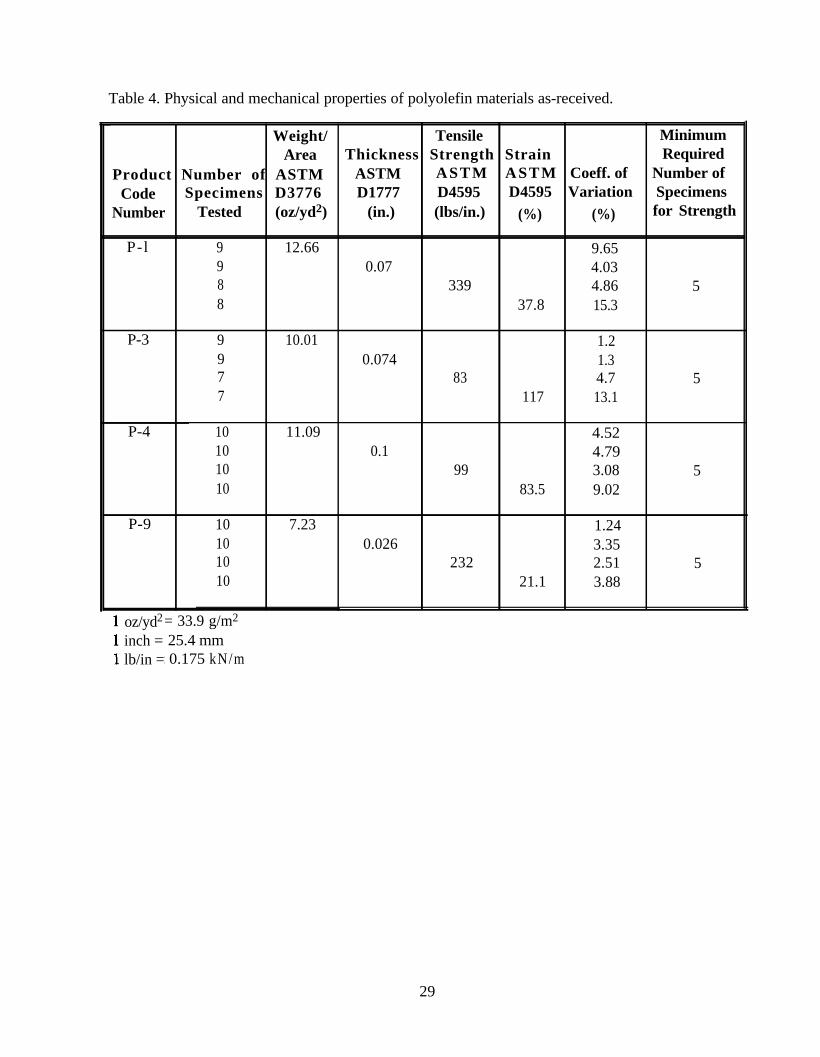
Table 4. Physical and mechanical properties of polyolefin materials as-received.
-Weight/ Tensile Minimum
Area Thickness Strength Strain RequiredProduct Number of ASTM ASTM ASTM ASTM Coeff. of Number of
Code Specimens D3776 D1777 D4595 D4595 Variation SpecimensNumber Tested (oz/yd2) (in.) (lbs/in.) (%) (%) for Strength
P-l 9 12.66 9.659 0.07 4.038 339 4.86 58 37.8 15.3
P-3 9 10.01 1.29 0.074 1.37 83 4.7 57 117 13.1
P-4 10 11.09 4.5210 0.1 4.7910 99 3.08 510 83.5 9.02
P-9 10 7.23 1.2410 0.026 3.3510 232 2.51 510 21.1 3.88
oz/yd2”= 33.9 g/m2
inch = 25.4 mmlb/in =: 0.175 kN/m
29
PROTOCOL DEVELOPMENT TO CHEMICALLY TRACK OXIDATIVE DEGRADATION
The focus of this subtask was to select and fine tune test methods which could be used tochemically track oxidation as it progresses. Chemically tracking oxidation as it progresses inpolyolefins is a very complex endeavor. Oxidation results mainly in antioxidant consumption atfirst but transitions to mainly degradation of the main polymer in the later stages of oxidation.Chemical tracking can either focus on the consumption of antioxidants or it can focus on changeswhich occur in the main polymer as oxidation progresses. Since a given polymer may contain acomplex mixture of antioxidants which work synergistically together, and since antioxidantpackages are usually considered proprietary, making antioxidant details difficult to obtain,quantitative tracking of antioxidant depletion is difficult. In the past, attempts were made withlimited success to track antioxidant depletion using OIT or HPLC.
Quantification and interpretation of changes in the main polymer as oxidation progresses are alsofraught with difficulties. For example, though molecular weight can be measured, oxidativedegradation does not always cause molecular weight to decrease, as either chain scission orcrosslinking can occur. Furthermore, oxidation occurs primarily on the polymer surface, leavingthe core of the polymer unaffected. Since the tests available to assess changes in the mainpolymer must analyze the entire polymer specimen, not just its surface material, degradation mustprogress to relatively high levels to raise the average response of the material to a sufficiently highlevel to detect.
Several test methods were investigated, and in some cases tests were conducted, to evaluate theirviability to track oxidative degradation of the main polymer. TGA and DSC tests were performedin both nitrogen (an inert environment) and air to assess the sensitivity of polymer decompositionand melting temperatures to oxidation. Though these test methods did show some sensitivity tothe presence of oxygen, these tests could not detect significant differences between products.These test methods are still somewhat useful for overall characterization of the polymers,however. Fourier Transform Infrared spectroscopy (FTlR) was also investigated as to its viabilityfor tracking oxidation, but no tests were performed. FTIR was considered unsuitable fordetecting oxidation as it progresses because of interpretation difficulties and inadequatesensitivity. It was concluded that, in general, measurement of changes to the main polymermaterial was not a viable approach to tracking degradation chemically.
OIT and HPLC were investigated regarding their viability to track antioxidant depletion asoxidation progresses. Detailed studies and geosynthetic product testing were conducted toinvestigate this. OIT tests were conducted on reference polymers and geosynthetic productsusing the most widely used procedure, ASTM D3895 as modified by Gray (1990). It was foundthat the test could not differentiate between different products, with OIT’s for P-l and S-lvarying from 5.12 to 5.26 min, respectively. Therefore, an investigation to determine how tomodify the test to better differentiate between products and ensure repeatability was conducted.The heating program, nitrogen and oxygen flow rates, rate of shifting from nitrogen to oxygen,and the metal used in the specimen pan were changed as a result of the investigation, causing theOIT to now vary from approximately 50 to 70 min for the HDPE products and 2.5 to 5.5 min forthe PP products. This method still did not provide adequate differentiation between PP products.It was found that the test temperature needed to be lowered from 200 oC (392 oF) to 175 oC
30
(347 oF) for the PP materials to provide adequate differentiation between products, yet stay abovethe melting temperature of PP. OIT calibration curves developed using the reference polymer S-2and known percentages of Irganox 1010 showed that the OIT test as modified was sensitive in aconsistent manner to antioxidant content. However, due to the complexities of antioxidantpackages in polymers, it was concluded that OIT could only be used as a qualitative assessment ofthe overall response of the polymer to oxidation and could not be the sole criterion used to trackoxidation.
Investigation of the HPLC method showed that antioxidant loss could be quantitatively trackedusing this method, even if more than one antioxidant is present, provided that the type ofantioxidant is known going into the test or that the components present can be isolated andidentified, and provided that the antioxidants in the mixture do not overlap in their responses inthe test. Preliminary studies to investigate the ability of the HPLC device to be calibrated tomeasure antioxidants typically used for geosynthetics were conducted. Based on these studies,HPLC appears to be the best method available to monitor antioxidant depletion as oxidationprogresses.
PRELIMINARY STUDIES OF ANTIOXIDANT LEACHABILITY IN WATER
A preliminary assessment of antioxidant leachability for PP geosynthetics immersed in water wasconducted. Specimens of three different PP products were placed in distilled water at 70 oC(158 oF) with stirring for 18 days. Changes in the product polymers with time were monitoredusing only the modified OIT test. The results indicated a rapid decrease in OIT in the first 2 to 5days followed by only slow changes. Though there were differences in the OIT decrease ratebetween the three products tested, the significance of those differences is unknown. Leaching bythis test method appears to be temperature, product, and antioxidant dependent and is thereforenot an appropriate method to obtain antioxidant free specimens for the Phase 3 testing.Furthermore, the relationship between antioxidant leaching in such severe test conditions or othersimilar types of data reported in the literature to realistic in situ conditions is unknown. It is notclear at this point if leaching of antioxidants through exposure to water in soil at in situtemperatures is really a significant issue at all. However, because of the available publishedinformation (Wisse, 1990) which indicates the potential for leaching to occur, a limited studyunder more realistic test conditions (i.e., high humidity oven aging experiments) will be conductedin the Phase 3 testing.
EFFECTS OF METAL SALT CONTAMINATION
The literature has indicated that certain transition metals in contact with polyolefins can acceleratethe rate of oxidation. Iron is the most common transition metal in soil and is therefore the focusof this study. Preliminary studies of this phenomenon were conducted to develop a preliminaryprotocol to prepare iron salt contaminated specimens, to assess the general effect concentration ofthe iron solution and time of exposure to the iron solution have on the potential degradation rate,and to select specific iron concentrations in the specimens for Phase 3 testing.
To this end, reference polymer S-2 was combined with a 0.10 percent Irganox 1010 concentration(i.e., antioxidant) and soaked in FeCl3 solution to form specimens with various percentages of
31
FeCl3
on a weight of FeCl3 per weight of polymer basis. The specimens were then pressed into afilm and subjected to OIT testing. The results indicated that iron contamination reduced OITtimes by a factor of 3 to 10 for FeCl3 concentrations in the specimens of 0.2 percent to 1.0percent, which is similar to what has been reported in the literature. For iron concentrationsgreater than 1.0 percent, there was little additional decrease in OIT. Therefore, ironconcentrations of 0.2 percent and 1.0 percent were selected for testing in Phase 3.
PRELIMINARY OVEN AGING EXPERIMENTS UNDER SEVER EXPOSURE CONDITIONS
The purpose of this subtask are to:
• Identify the best oven features to ensure uniformity of the test environment and to ensure thatthe selected equipment will allow the desired test program to be accomplished.
• Determine specimen installation procedures and other test protocol details for the oven agingexperiments.
• Obtain preliminary product performance data to help estimate the incubation times and definethe test program in Phase 3.
• Compare the results obtained from chemical tracking of the oxidation to the observed samplestrength losses to refine the chemical tracking program.
Based on previous experience, a forced air oven which meets the requirements of ASTM D3045and ASTM E145, Type II-B was selected for the experiments. Specifically a Blue-M 0.23 m3(8 ft3) Stabil-Therm Bench type oven with a temperature uniformity of ± 1 percent and ahorizontal air flow was selected. It was determined that specimens should be placed in the ovenparallel to the air flow spaced no closer together than 13mm (0.5 in.) apart.
A study to evaluate the shrinkage response of the geosynthetics at 90 oC (194 oF) wasconducted. Based on the literature, significant shrinkage can affect the mechanical properties aswell as the molecular structure of the polymer, and it is desirable to avoid such effects.Specimens are sometimes framed to prevent shrinkage can create load in the specimen, which canalso affect the response of the specimen to oxidation. Therefore, specimens of all the PPgeotextiles to be evaluated were placed in an oven at 90 oC (194 oF) for 40 days. No shrinkagewas observed. It was therefore decided that the specimens need not be framed.
Once the preliminary oven aging protocol was developed, a limited oven aging experiment wasconducted utilizing specimens of all the geosynthetic products listed in table 3. An exposuretemperature of 110 oC (230 oF) for 40 days. No shrinkage was observed. It was thereforedecided that the specimens need not be framed.
Once the preliminary oven aging protocol was developed, a limited oven aging experiment wasconducted utilizing specimens of all the geosynthetic products listed in table 3. An exposuretemperature of 110 oC (230 oF) was selected, which is similar to what is currently proposed inEurope for an oven aging index test. A high temperature was selected to insure that results couldbe obtained in a relatively short time and to eventually determine, after the Phase 3 testing iscomplete, if this relatively short-term high temperature test could be used to estimate the long-term performance of products in the future. Key issues regarding this determination are theproximity of this high temperature to the melt range for some products and the validity ofextrapolation of such data to in situ (i.e., low temperature) performance.
32
Specimens were allowed to incubate for up to 80 days. Three retrievals of three specimens perproduct were performed. Wide width strength tests, weight loss, and OIT tests were conductedfor each set of specimens. These results showed that considerable variation in product responseto the rather severe oxidative environment occurred. Whether or not such a wide spread inproduct response will occur at lower temperatures is unknown, but will be investigated in Phase3. Note also that the spread may not be significant in a practical sense if future estimates ofproduct life, which will not be possible to make until the Phase 3 results are available, indicatethat even the product with the most rapid degradation rate has an acceptable life.
Comparison of the strength loss data with OIT and weight loss measurements indicate only ageneral, qualitative correlation. The correlation was not adequate for quantitative analysis.Therefore, OIT and weight loss measurements will have only a limited usefulness in trackingoxidative degradation.
This preliminary oven aging data was used to refine the testing program for Phase 3.Furthermore, early Phase 3 test results have required that some additional changes be made to thetest program. The revised test program for Phase 3 as it currently stands is provided in table 5.
33
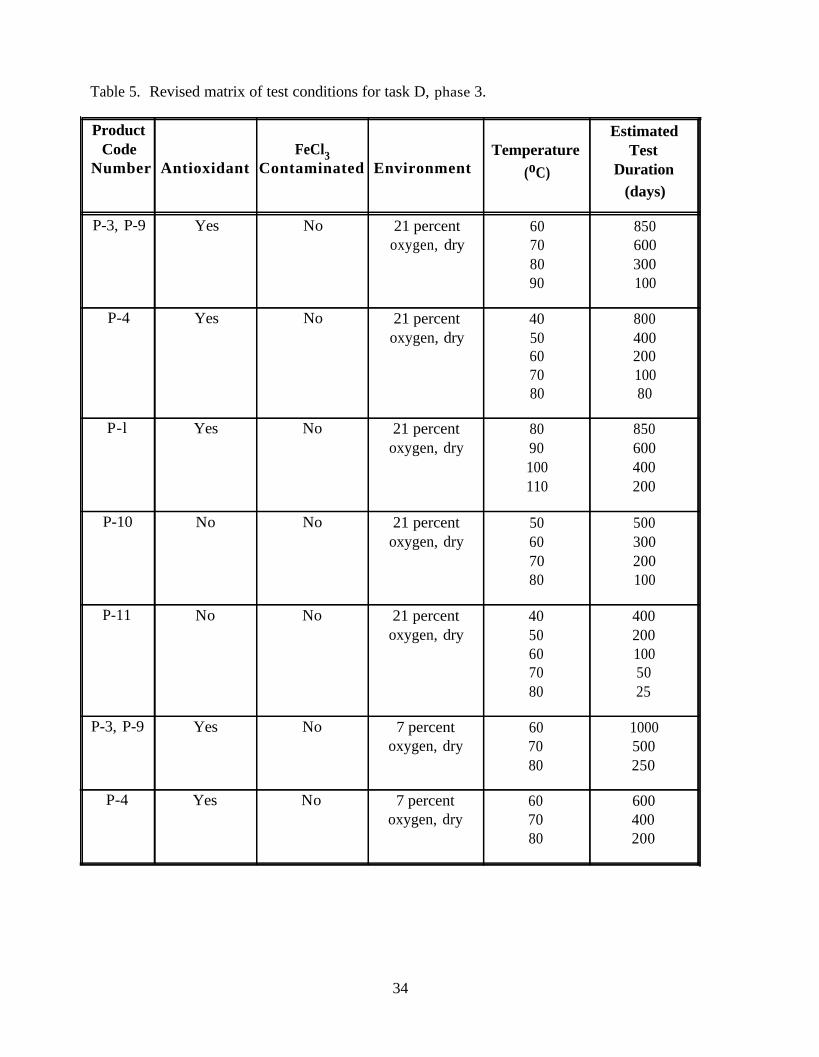
Table 5. Revised matrix of test conditions for task D, phase 3.
Product EstimatedCode FeCl3 Temperature Test
Number Antioxidant Contaminated Environment (oC) Duration(days)
P-3, P-9 Yes No 21 percent 60 850oxygen, dry 70 600
80 30090 100
P-4 Yes No 21 percent 40 800oxygen, dry 50 400
60 20070 10080 80
P-l Yes No 21 percent 80 850oxygen, dry 90 600
100 400110 200
P-10 No No 21 percent 50 500oxygen, dry 60 300
70 20080 100
P-11 No No 21 percent 40 400oxygen, dry 50 200
60 10070 5080 25
P-3, P-9 Yes No 7 percent 60 1000oxygen, dry 70 500
80 250
P-4 Yes No 7 percent 60 600oxygen, dry 70 400
80 200
34
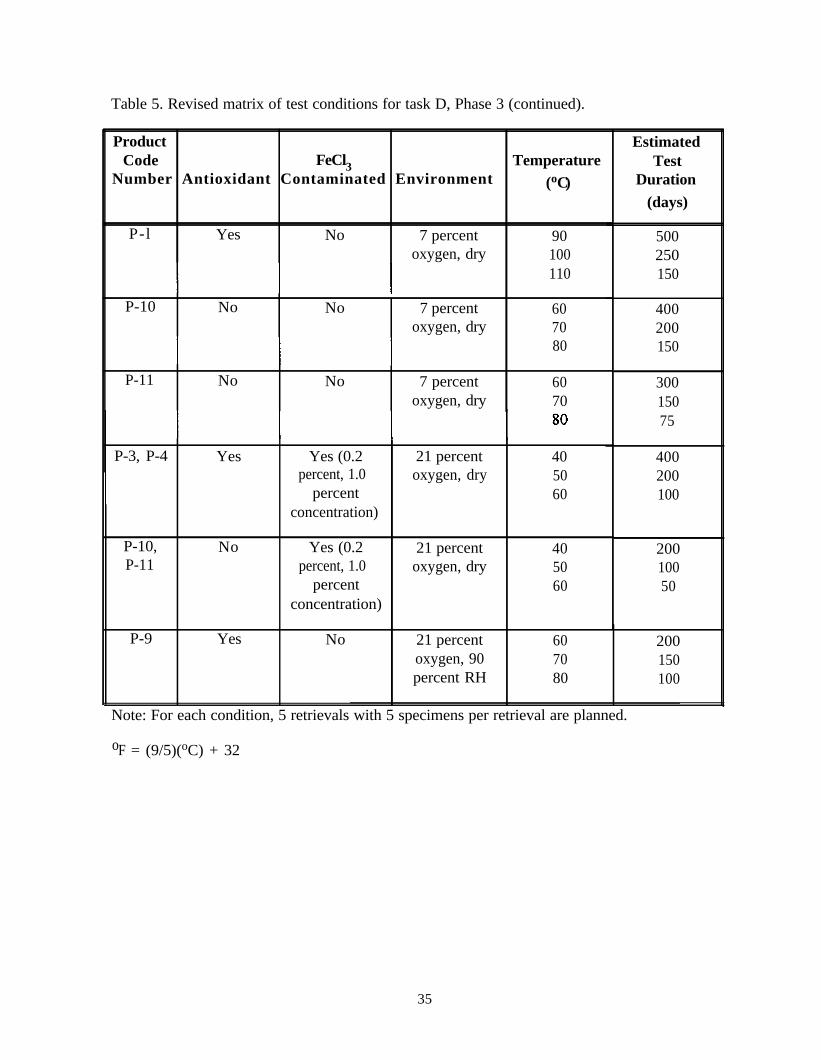
Table 5. Revised matrix of test conditions for task D, Phase 3 (continued).
ProductCode FeCl3 Temperature
Number Antioxidant Contaminated Environment (oC)
P-l Yes No 7 percent 90oxygen, dry 100
110
P-10 No No 7 percent 60oxygen, dry 70
80
P-11 No No 7 percent 60oxygen, dry 70
EstimatedTest
Duration(days)
500250150
400200150
30015075
P-3, P-4 Yes Yes (0.2percent, 1.0
percentconcentration)
21 percentoxygen, dry
40 40050 20060 100
P-10,P-11
No Yes (0.2percent, 1.0
percentconcentration)
21 percent 40 200oxygen, dry 50 100
60 50
P-9 Yes No 21 percent 60oxygen, 90 70percent RH 80
Note: For each condition, 5 retrievals with 5 specimens per retrieval are planned.
200150100
oF = (9/5)(oC) + 32
35
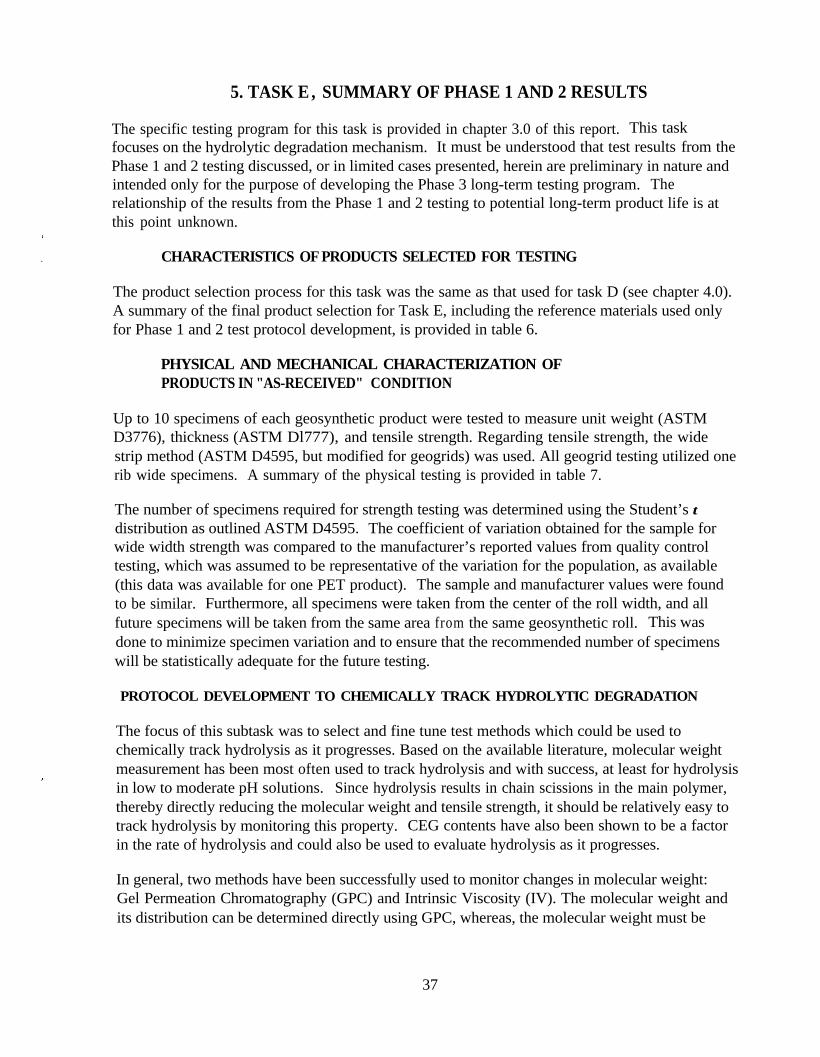
5. TASK E , SUMMARY OF PHASE 1 AND 2 RESULTS
The specific testing program for this task is provided in chapter 3.0 of this report. This taskfocuses on the hydrolytic degradation mechanism. It must be understood that test results from thePhase 1 and 2 testing discussed, or in limited cases presented, herein are preliminary in nature andintended only for the purpose of developing the Phase 3 long-term testing program. Therelationship of the results from the Phase 1 and 2 testing to potential long-term product life is atthis point unknown.
CHARACTERISTICS OF PRODUCTS SELECTED FOR TESTING
The product selection process for this task was the same as that used for task D (see chapter 4.0).A summary of the final product selection for Task E, including the reference materials used onlyfor Phase 1 and 2 test protocol development, is provided in table 6.
PHYSICAL AND MECHANICAL CHARACTERIZATION OFPRODUCTS IN "AS-RECEIVED" CONDITION
Up to 10 specimens of each geosynthetic product were tested to measure unit weight (ASTMD3776), thickness (ASTM Dl777), and tensile strength. Regarding tensile strength, the widestrip method (ASTM D4595, but modified for geogrids) was used. All geogrid testing utilized onerib wide specimens. A summary of the physical testing is provided in table 7.
The number of specimens required for strength testing was determined using the Student’s tdistribution as outlined ASTM D4595. The coefficient of variation obtained for the sample forwide width strength was compared to the manufacturer’s reported values from quality controltesting, which was assumed to be representative of the variation for the population, as available(this data was available for one PET product). The sample and manufacturer values were foundto be similar. Furthermore, all specimens were taken from the center of the roll width, and allfuture specimens will be taken from the same area from the same geosynthetic roll. This wasdone to minimize specimen variation and to ensure that the recommended number of specimenswill be statistically adequate for the future testing.
PROTOCOL DEVELOPMENT TO CHEMICALLY TRACK HYDROLYTIC DEGRADATION
The focus of this subtask was to select and fine tune test methods which could be used tochemically track hydrolysis as it progresses. Based on the available literature, molecular weightmeasurement has been most often used to track hydrolysis and with success, at least for hydrolysisin low to moderate pH solutions. Since hydrolysis results in chain scissions in the main polymer,thereby directly reducing the molecular weight and tensile strength, it should be relatively easy totrack hydrolysis by monitoring this property. CEG contents have also been shown to be a factorin the rate of hydrolysis and could also be used to evaluate hydrolysis as it progresses.
In general, two methods have been successfully used to monitor changes in molecular weight:Gel Permeation Chromatography (GPC) and Intrinsic Viscosity (IV). The molecular weight andits distribution can be determined directly using GPC, whereas, the molecular weight must be
37
Table 6. Geosynthetics and reference polymers selected for hydrolytic degradation experiments.
CodeNumber Polymer Geosynthetic Macrostructure
PET 540 g/m2 (16 oz/yd2) Continuous Spunbonded Filament NeedlepunchedNonwoven
PET 340 g/m2 (10 oz/yd2) PVC Dipped Woven Geogrid
PET 370 g/m2 (11 oz/yd2) Multifilament Woven Geotextile
PET Single Fiber Corresponding to P-6
P-5
P-6
P-7
P-8
S-3 PET Flakes (reference material), Inherent Viscosity 0.7, Density 1.385, andTg of 81 oC (178 oF)
Table 7. Physical and mechanical properties of polyester materials as-received.
Weight/Area
Product Number of ASTMCode Specimens D3776
Number Tested (oz/yd2)
TensileThickness Strength Strain
ASTM A S T M A S T MD1777 D4595 D4595(in.) (Ibs/in.) (%)
Coeff. ofVariation
(%)
MinimumRequired
Number ofSpecimens
for Strength
P-5 2.262.344.592.1
16.44
10.83
10.64
0.177204
75.35
15
55.110.315.4
P-6
P-7
0.051037
(lbs/rib) 17
3.13.84.37.4
1 oz/yd2 = 33.9 g/m2
0.031544
18.85
1 inch = 25.4 mm1 lb/in = 0.175 kN/m
38
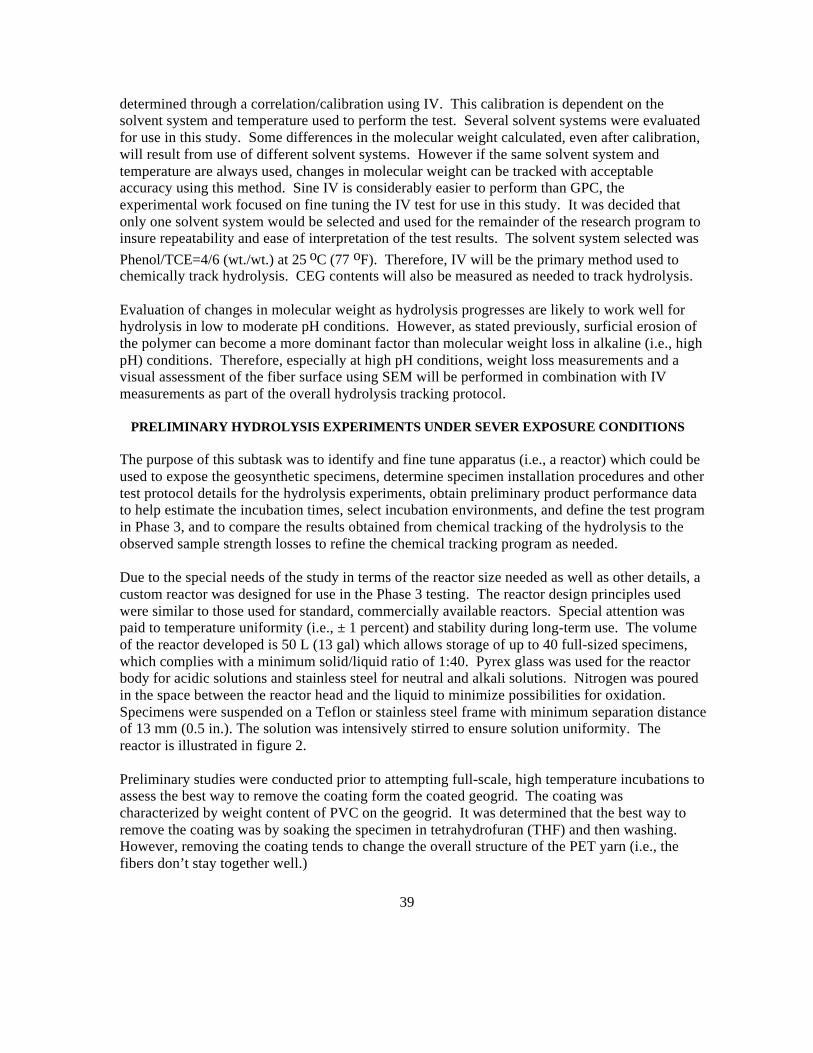
determined through a correlation/calibration using IV. This calibration is dependent on thesolvent system and temperature used to perform the test. Several solvent systems were evaluatedfor use in this study. Some differences in the molecular weight calculated, even after calibration,will result from use of different solvent systems. However if the same solvent system andtemperature are always used, changes in molecular weight can be tracked with acceptableaccuracy using this method. Sine IV is considerably easier to perform than GPC, theexperimental work focused on fine tuning the IV test for use in this study. It was decided thatonly one solvent system would be selected and used for the remainder of the research program toinsure repeatability and ease of interpretation of the test results. The solvent system selected wasPhenol/TCE=4/6 (wt./wt.) at 25 oC (77 oF). Therefore, IV will be the primary method used tochemically track hydrolysis. CEG contents will also be measured as needed to track hydrolysis.
Evaluation of changes in molecular weight as hydrolysis progresses are likely to work well forhydrolysis in low to moderate pH conditions. However, as stated previously, surficial erosion ofthe polymer can become a more dominant factor than molecular weight loss in alkaline (i.e., highpH) conditions. Therefore, especially at high pH conditions, weight loss measurements and avisual assessment of the fiber surface using SEM will be performed in combination with IVmeasurements as part of the overall hydrolysis tracking protocol.
PRELIMINARY HYDROLYSIS EXPERIMENTS UNDER SEVER EXPOSURE CONDITIONS
The purpose of this subtask was to identify and fine tune apparatus (i.e., a reactor) which could beused to expose the geosynthetic specimens, determine specimen installation procedures and othertest protocol details for the hydrolysis experiments, obtain preliminary product performance datato help estimate the incubation times, select incubation environments, and define the test programin Phase 3, and to compare the results obtained from chemical tracking of the hydrolysis to theobserved sample strength losses to refine the chemical tracking program as needed.
Due to the special needs of the study in terms of the reactor size needed as well as other details, acustom reactor was designed for use in the Phase 3 testing. The reactor design principles usedwere similar to those used for standard, commercially available reactors. Special attention waspaid to temperature uniformity (i.e., ± 1 percent) and stability during long-term use. The volumeof the reactor developed is 50 L (13 gal) which allows storage of up to 40 full-sized specimens,which complies with a minimum solid/liquid ratio of 1:40. Pyrex glass was used for the reactorbody for acidic solutions and stainless steel for neutral and alkali solutions. Nitrogen was pouredin the space between the reactor head and the liquid to minimize possibilities for oxidation.Specimens were suspended on a Teflon or stainless steel frame with minimum separation distanceof 13 mm (0.5 in.). The solution was intensively stirred to ensure solution uniformity. Thereactor is illustrated in figure 2.
Preliminary studies were conducted prior to attempting full-scale, high temperature incubations toassess the best way to remove the coating form the coated geogrid. The coating wascharacterized by weight content of PVC on the geogrid. It was determined that the best way toremove the coating was by soaking the specimen in tetrahydrofuran (THF) and then washing.However, removing the coating tends to change the overall structure of the PET yarn (i.e., thefibers don’t stay together well.)
39
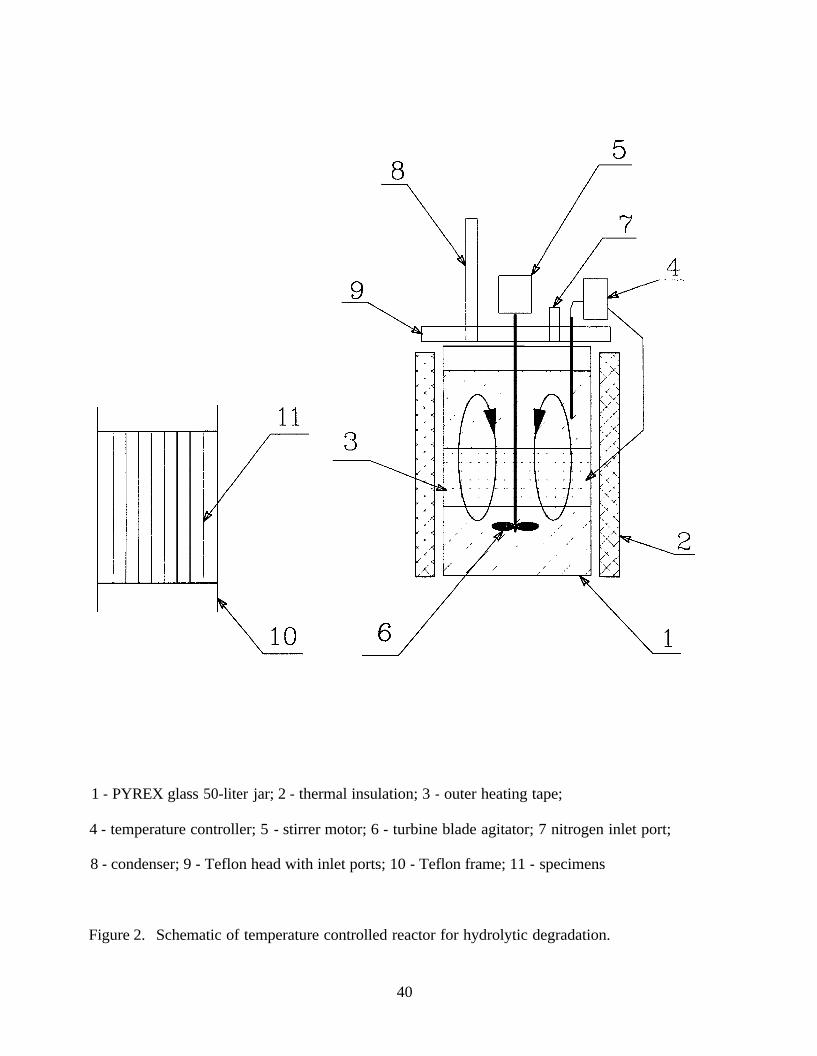
1 - PYREX glass 50-liter jar; 2 - thermal insulation; 3 - outer heating tape;
4 - temperature controller; 5 - stirrer motor; 6 - turbine blade agitator; 7 nitrogen inlet port;
8 - condenser; 9 - Teflon head with inlet ports; 10 - Teflon frame; 11 - specimens
Figure 2. Schematic of temperature controlled reactor for hydrolytic degradation.
40
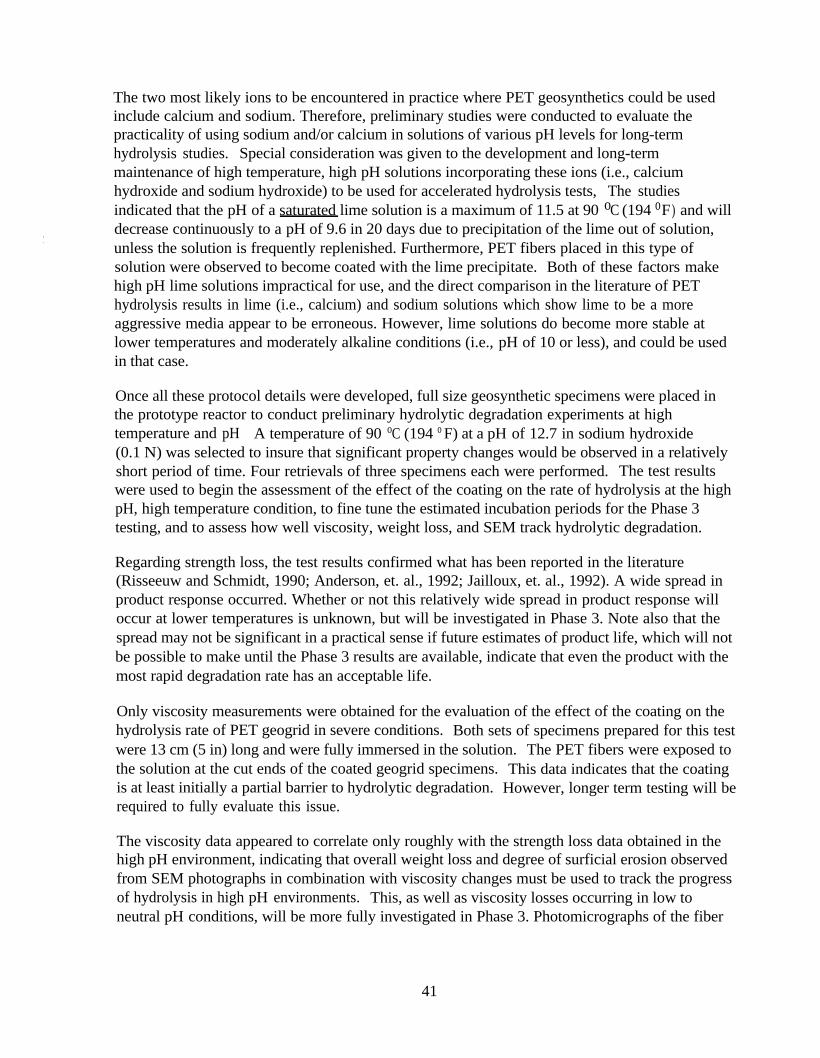
The two most likely ions to be encountered in practice where PET geosynthetics could be usedinclude calcium and sodium. Therefore, preliminary studies were conducted to evaluate thepracticality of using sodium and/or calcium in solutions of various pH levels for long-termhydrolysis studies. Special consideration was given to the development and long-termmaintenance of high temperature, high pH solutions incorporating these ions (i.e., calciumhydroxide and sodium hydroxide) to be used for accelerated hydrolysis tests, The studiesindicated that the pH of a saturated lime solution is a maximum of 11.5 at 90 oC (194 oF) and willdecrease continuously to a pH of 9.6 in 20 days due to precipitation of the lime out of solution,unless the solution is frequently replenished. Furthermore, PET fibers placed in this type ofsolution were observed to become coated with the lime precipitate. Both of these factors makehigh pH lime solutions impractical for use, and the direct comparison in the literature of PEThydrolysis results in lime (i.e., calcium) and sodium solutions which show lime to be a moreaggressive media appear to be erroneous. However, lime solutions do become more stable atlower temperatures and moderately alkaline conditions (i.e., pH of 10 or less), and could be usedin that case.
Once all these protocol details were developed, full size geosynthetic specimens were placed inthe prototype reactor to conduct preliminary hydrolytic degradation experiments at hightemperature and pH. A temperature of 90 oC (194 o F) at a pH of 12.7 in sodium hydroxide(0.1 N) was selected to insure that significant property changes would be observed in a relativelyshort period of time. Four retrievals of three specimens each were performed. The test resultswere used to begin the assessment of the effect of the coating on the rate of hydrolysis at the highpH, high temperature condition, to fine tune the estimated incubation periods for the Phase 3testing, and to assess how well viscosity, weight loss, and SEM track hydrolytic degradation.
Regarding strength loss, the test results confirmed what has been reported in the literature(Risseeuw and Schmidt, 1990; Anderson, et. al., 1992; Jailloux, et. al., 1992). A wide spread inproduct response occurred. Whether or not this relatively wide spread in product response willoccur at lower temperatures is unknown, but will be investigated in Phase 3. Note also that thespread may not be significant in a practical sense if future estimates of product life, which will notbe possible to make until the Phase 3 results are available, indicate that even the product with themost rapid degradation rate has an acceptable life.
Only viscosity measurements were obtained for the evaluation of the effect of the coating on thehydrolysis rate of PET geogrid in severe conditions. Both sets of specimens prepared for this testwere 13 cm (5 in) long and were fully immersed in the solution. The PET fibers were exposed tothe solution at the cut ends of the coated geogrid specimens. This data indicates that the coatingis at least initially a partial barrier to hydrolytic degradation. However, longer term testing will berequired to fully evaluate this issue.
The viscosity data appeared to correlate only roughly with the strength loss data obtained in thehigh pH environment, indicating that overall weight loss and degree of surficial erosion observedfrom SEM photographs in combination with viscosity changes must be used to track the progressof hydrolysis in high pH environments. This, as well as viscosity losses occurring in low toneutral pH conditions, will be more fully investigated in Phase 3. Photomicrographs of the fiber
41

surfaces indicated that significant surface erosion (i.e., “outer” hydrolysis) was occurring in thehigh pH solution.
This preliminary hydrolytic degradation data was used to refine the testing program for Phase 3.Furthermore, early Phase 3 test results have required that some additional changes be made to thetest program. The revised test program for Phase 3 as it currently stands is provided in table 8.
42
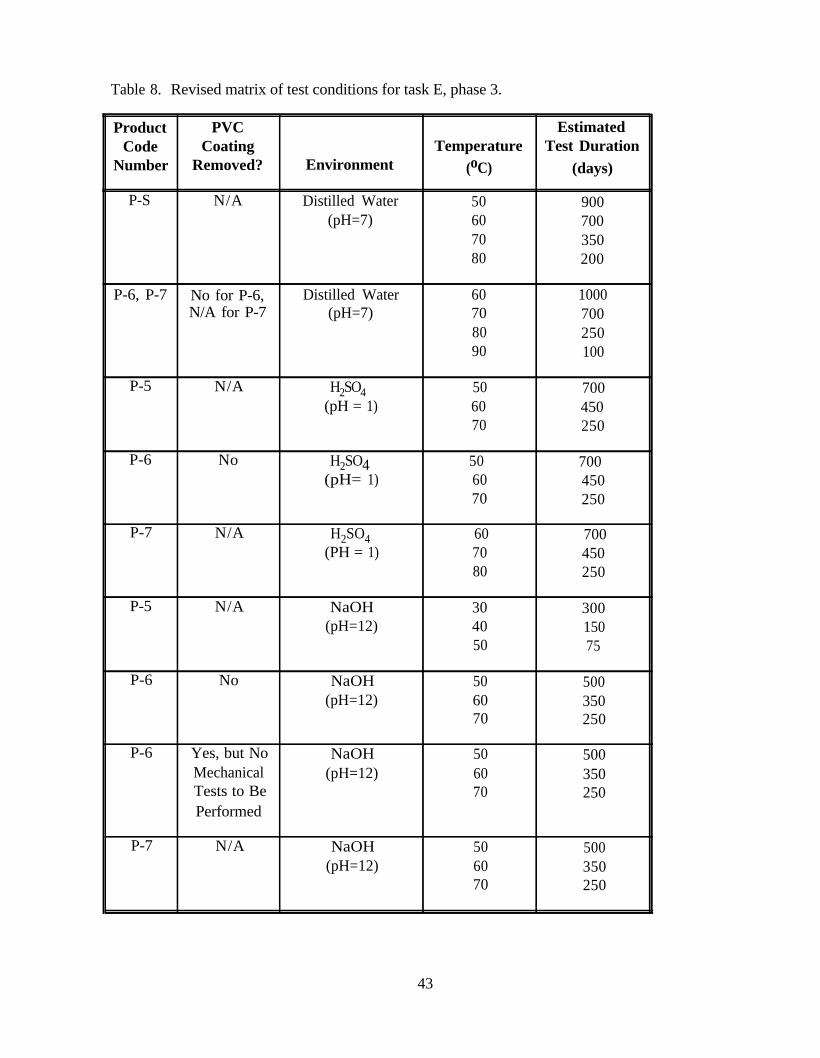
Table 8. Revised matrix of test conditions for task E, phase 3.
Product PVC EstimatedCode Coating Temperature Test Duration
Number Removed? Environment (oC) (days)
P-S N/A Distilled Water 50 900(pH=7) 60 700
70 35080 200
P-6, P-7 No for P-6, Distilled Water 60 1000N/A for P-7 (pH=7) 70 700
80 25090 100
P-5 N/A H2SO4 50 700(pH = 1) 60 450
70 250
P-6 No H2SO4 50 700(pH= 1) 60 450
70 250
P-7 N/A H2SO4 60 700(PH = 1) 70 450
80 250
P-5 N/A NaOH 30 300(pH=12) 40 150
50 75
P-6 No NaOH 50 500(pH=12) 60 350
70 250
P-6 Yes, but No NaOH 50 500Mechanical (pH=12) 60 350Tests to Be 70 250Performed
P-7 N/A NaOH 50 500(pH=12) 60 350
70 250
43
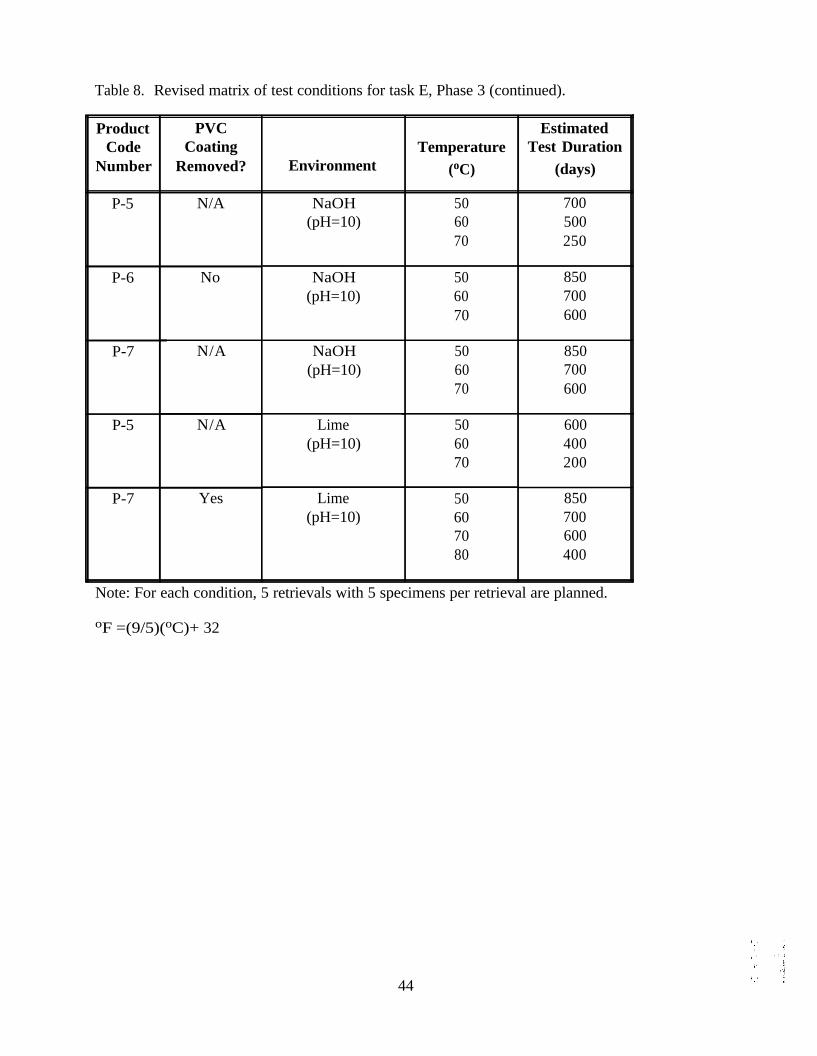
Table 8. Revised matrix of test conditions for task E, Phase 3 (continued).
Product PVCCode Coating
Number Removed?
P-5 N/A
P-6 No
P-7
P-5
P-7
N/A
N/A
Yes
Environment
NaOH(pH=10)
NaOH(pH=10)
NaOH(pH=10)
Lime(pH=10)
Lime(pH=10)
Temperature(oC)
50 70060 50070 250
50 85060 70070 600
50 85060 70070 600
50 60060 40070 200
50 85060 70070 60080 400
EstimatedTest Duration
(days)
Note: For each condition, 5 retrievals with 5 specimens per retrieval are planned.
oF =(9/5)(oC)+ 32
44
6. ISSUES TO BE ADDRESSED TO ACCOMPLISH LIFE PREDICTIONOF GEOSYNTHETIC REINFORCEMENT
Engineering design dictates that the length of time a material used as an integral part of astructure will remain functional be known with some degree of certainty. In the case ofgeosynthetic reinforcement, functionality is defined in terms of its strength, and to some extent itsload-strain characteristics. The length of time the material remains functional is defined as the lifeof the material. For example, if the material degrades and becomes too weak to support the loadsplaced upon it, the material fails and loses functionality. Life prediction of a given material is theultimate goal of tests to assess material durability.
Conditions in laboratory durability research studies are typically severe when compared to actualin-soil conditions so that test results can be obtained in a relatively short period of time.Temperature is usually the main accelerator used in these tests. The key to the prediction of thelife of a given polymeric product is the availability of proven extrapolation procedures. Forexample, if degradation tests are conducted at high temperatures, the test data must beextrapolated or otherwise somehow related to behavior at lower temperatures typical of in situconditions to be of any value. Furthermore, if property changes are measured over a relativelyshort period of time, say 2 or 3 years, as would be the case in a laboratory study, or even 10years, such as would be the case in a field exhumation study, that short-term data must beextrapolated to the desired design life of the material (typically on the order of 75 years or more).
How does one go about developing an extrapolation model to make use of the available short-term data? Such a model must consider the properties of the material itself in terms of how theenvironment affects that material, and must also consider the differences between the laboratoryenvironment and the anticipated in situ environment. At least for chemical reactions which canresult in material degradation, considerable data shows that most chemical reactions of this naturehave a strong temperature dependence as well as a dependence on the concentration/quantity ofthe chemicals involved in the reaction. In fact, such dependence can be used advantageously todevelop relationships which can be used for extrapolation purposes.
One relationship (i.e., equation) which is often used to develop extrapolation models is theArrhenius equation, which addresses the temperature dependency of the degradation reaction,combined with an appropriate rate expression, which addresses the time dependency of thereaction (Koerner, et. al., 1992; Shelton and Bright, 1993). A common form of this importantextrapolation tool is as follows:
45
where,t = time to a given strength loss, usually 50%, at the test conditionsT = temperature of the test environment, in oKto = time to the same given strength loss as for t, but in the in - situ environment
To = temperature of the in - situ environment, in oKR = universal gas constant, which is 8.314 J / moleU = effective activation energy, in J / mole
Equation 2 has been simplified by assuming that the reaction is first order by constituent. Shouldthe reaction become autocatalytic (i.e., the reaction accelerates due to the catalytic effects of oneor more of the reaction products themselves on the reaction) with time or after a certainmagnitude of property change, the reaction order could change, affecting the accuracy ofextrapolations performed with this equation. This issue will need to be considered whendeveloping a life prediction model for geosynthetics.
An Arrhenius plot, in which degradation data is plotted as the logarithm (base “e”) of thereciprocal of time versus the reciprocal of temperature using equation 2, is often used to representdata extrapolated using this model. A conceptual example of an Arrhenius plot is provided infigure 3. Note that temperature has an exponential effect on the time to a given level ofdegradation based on this model, and that the data used in the equation is obtained at a constantlevel of degradation in the material as represented in this case by the strength loss. This equationcould also be directly applied, for example, to the time required to reach a given loss in viscosityin the case of PET geosynthetics.
Data which fits this particular model well will plot as a straight line, with the slope of the linerelated to the effective activation energy. For this model to be completely valid, the activationenergy must not be a function of temperature or other factors within the time and temperaturerange of interest. Also note that the activation energy determined using this model is really acombined or average activation energy resulting from a number of degradation processes all goingon at the same time, hence the term “effective.” Due to this complexity in the activation energyfor a given material, it is quite possible to have nonlinearity in the Arrhenius plot, especially as thedifference between the lowest test temperature and the anticipated in situ temperature becomeslarge or if a transition such as the glass transition occurs within the temperature range of interest.It is therefore desirable to keep this difference in temperatures to a minimum.
It is anticipated that this model, or a modification of it, will be the primary tool used for analysisof the data obtained in Phase 3 of Tasks D and E, and the development of a life prediction modelfor geosynthetics. One of the key objectives for the Phase 3 testing is to define the activationenergies which can be expected for typical geosynthetics and if in fact the Arrhenius plots for the
46
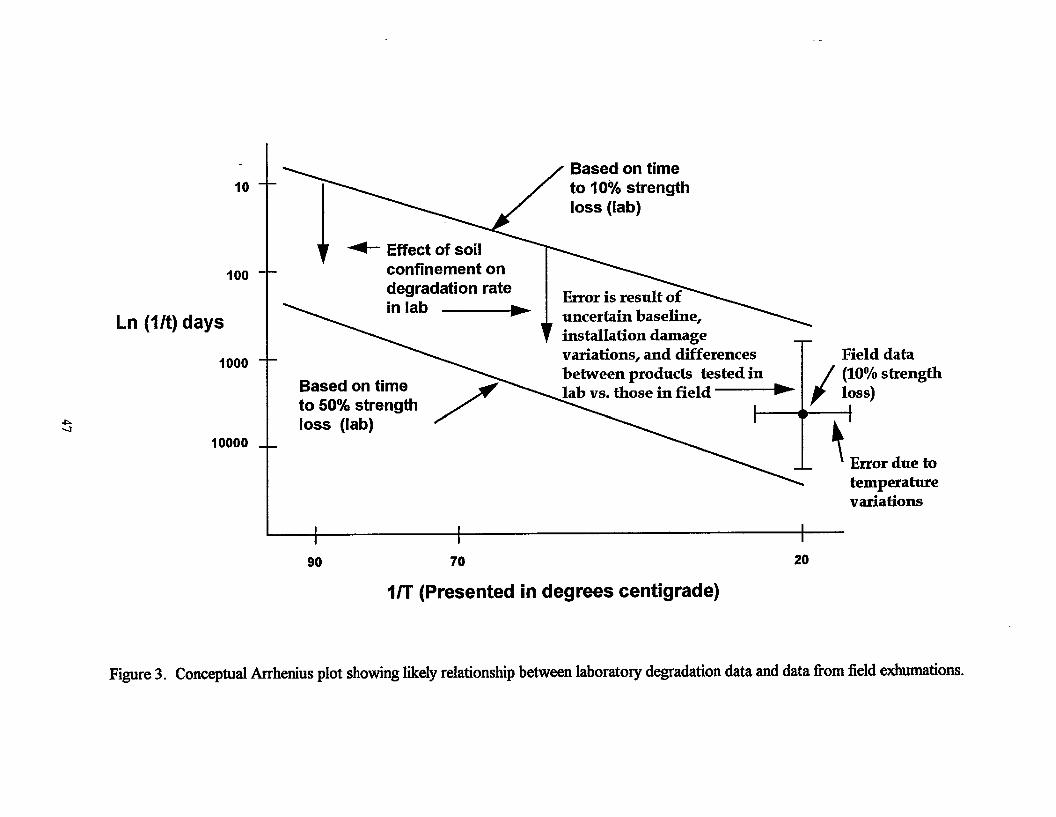
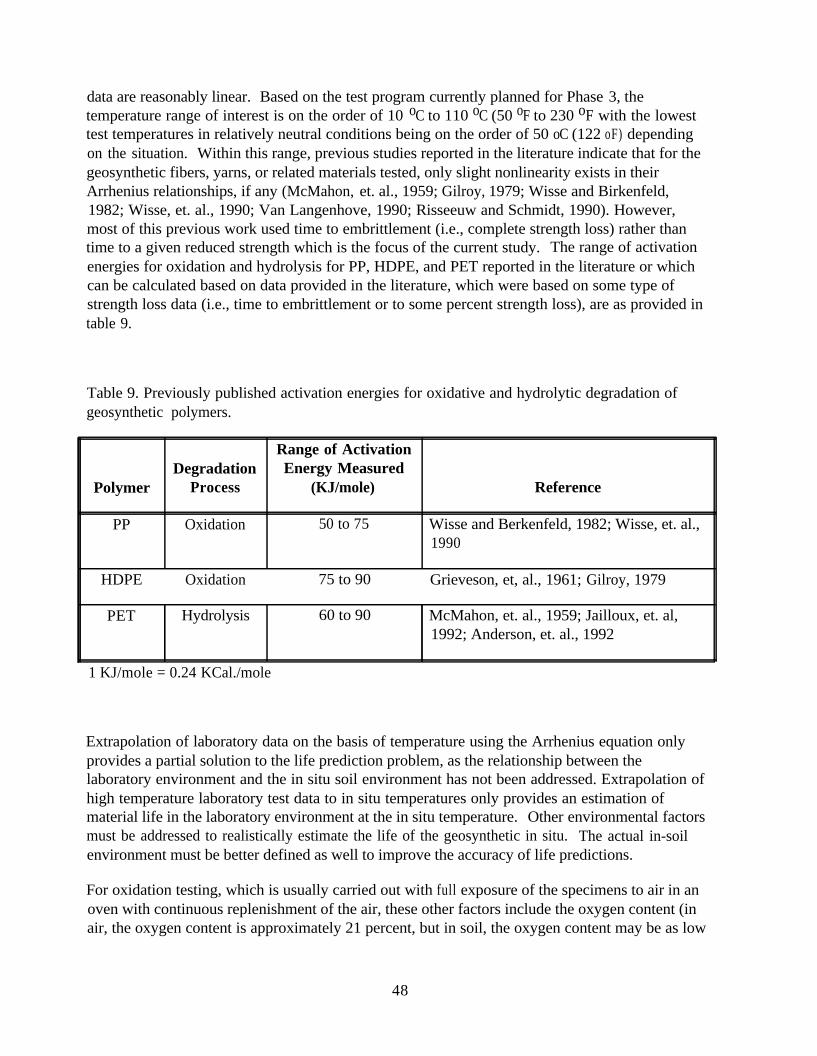
data are reasonably linear. Based on the test program currently planned for Phase 3, thetemperature range of interest is on the order of 10 oC to 110 oC (50 oF to 230 oF with the lowesttest temperatures in relatively neutral conditions being on the order of 50 oC (122 oF) dependingon the situation. Within this range, previous studies reported in the literature indicate that for thegeosynthetic fibers, yarns, or related materials tested, only slight nonlinearity exists in theirArrhenius relationships, if any (McMahon, et. al., 1959; Gilroy, 1979; Wisse and Birkenfeld,1982; Wisse, et. al., 1990; Van Langenhove, 1990; Risseeuw and Schmidt, 1990). However,most of this previous work used time to embrittlement (i.e., complete strength loss) rather thantime to a given reduced strength which is the focus of the current study. The range of activationenergies for oxidation and hydrolysis for PP, HDPE, and PET reported in the literature or whichcan be calculated based on data provided in the literature, which were based on some type ofstrength loss data (i.e., time to embrittlement or to some percent strength loss), are as provided intable 9.
Table 9. Previously published activation energies for oxidative and hydrolytic degradation ofgeosynthetic polymers.
Range of ActivationDegradation Energy Measured
Polymer Process (KJ/mole) Reference
PP Oxidation 50 to 75 Wisse and Berkenfeld, 1982; Wisse, et. al.,1990
HDPE Oxidation 75 to 90 Grieveson, et, al., 1961; Gilroy, 1979
PET Hydrolysis 60 to 90 McMahon, et. al., 1959; Jailloux, et. al,1992; Anderson, et. al., 1992
1 KJ/mole = 0.24 KCal./mole
Extrapolation of laboratory data on the basis of temperature using the Arrhenius equation onlyprovides a partial solution to the life prediction problem, as the relationship between thelaboratory environment and the in situ soil environment has not been addressed. Extrapolation ofhigh temperature laboratory test data to in situ temperatures only provides an estimation ofmaterial life in the laboratory environment at the in situ temperature. Other environmental factorsmust be addressed to realistically estimate the life of the geosynthetic in situ. The actual in-soilenvironment must be better defined as well to improve the accuracy of life predictions.
For oxidation testing, which is usually carried out with full exposure of the specimens to air in anoven with continuous replenishment of the air, these other factors include the oxygen content (inair, the oxygen content is approximately 21 percent, but in soil, the oxygen content may be as low
48
as 1 percent). Preliminary data relating the rate of oxidation in air to that in water (7 percent)based on laboratory studies in a gaseous environment indicates that lower oxygen content doessignificantly reduce the rate of oxidation (Van Langenhove, 1990; Wisse, et. al., 1990).Apparently, the air circulation velocity in the oven may also affect the measured life of thematerial tested. A study by Forsman (1964) indicates that substantially shorter oven lives areobtained in a forced air oven relative to a convection oven. Obviously, in soil, there is no airvelocity. Furthermore, the ability of oxygen to diffuse through the soil to the geosynthetic toreplenish the oxygen supply as the geosynthetic oxidizes may affect the rate of degradation.Based on recent studies of oxidation of mine tailings, oxygen diffusion rates could significantlyaffect oxygen availability as the soil becomes finer grained (Yanful, 1993). Measurement ofoxygen levels in actual wall or slope backfill soils is needed to better define the in-soilenvironment regarding this issue. Finally, the total volume of oxygen in the soil in the vicinity ofthe geosynthetic is less than that in open air because the soil particles take up a portion of thevolume (i.e., the oxygen is only in the pore spaces between the soil particles). These factors couldcause polymer life regarding oxidation to be much greater than predicted using high temperatureoven aging results and simple Arrhenius modeling using only temperature.
For hydrolysis testing, which usually carried out with full exposure of the specimens to water orother chemical solutions with vigorous stirring of the solution, these other factors include thevolume of water available to the soil (water is contained only within the pores between soilparticles), the ability of water to be replenished in the soil near the geosynthetic (soil permeabilitymay restrict water replenishment near the geosynthetic), and possibly the stirring action in thelaboratory test (water moves very slowly in typical backfill soils). There is no existing data whichrelates the laboratory hydrolysis immersion conditions to in-soil conditions. In dry climates, lackof saturation may also be a factor which reduces the rate of hydrolysis. Elevated pH levels aresometimes used to help accelerate the hydrolysis reaction in the laboratory. However, as yet therehave been no models developed which account for the combined effects of pH and temperature,though some preliminary data is available (Jailloux, et. al., 1992; Anderson, et. al., 1992). Thesefactors could cause polymer life regarding hydrolysis to be much greater than predicted using hightemperature laboratory hydrolysis test results and simple Arrhenius modeling using onlytemperature.
The effect of aggressive soil conditions on the rate of degradation such as a high iron content soilfor oxidation or a high pH soil for hydrolysis is not well known and adds additional complexity todeveloping life estimates. The effect of these particular soil conditions on polymer life will beinvestigated in the current research contract.
Preliminary experimental work will be conducted in the Phase 3 testing of Tasks D and E andcompared with the results from Task B to begin to relate the laboratory environment to the in situsoil environment. The relationship between the laboratory environment and the in situ soilenvironment is conceptually shown in figure 3 in the form of an Arrhenius plot. Note that thefield data obtained from Task B only provides one data point, which potentially has a great deal ofuncertainty associated with it, to relate the laboratory experimental data to the real performanceexpected in situ. The problem is that the in situ data from Task B only represents onetemperature. Laboratory studies at elevated temperatures and which are allowed to degrade tosay, 50 percent strength loss, in which the laboratory environment is adjusted to better simulate
49
true in situ soil conditions, are needed to accurately relate the laboratory environment to the insitu environment. Therefore, the Task B results can only be used as a reality check for thelaboratory simulations.
Obviously, reasonably accurate life prediction of geosynthetics for in situ conditions is currentlynot possible based on the available published data, and life prediction based on extrapolation oflaboratory test data will likely produce excessively conservative results. Better long-term data isneeded if reasonably accurate estimates of geosynthetic life are to be made and is hence one of themain reasons for performing Phase 3 of the current research contract.
Once the life prediction problem, considering all of the variables mentioned previously whichaffect life prediction, has been adequately tackled, must long-term (i.e., 2 to 5 years) laboratoryaging studies be conducted every time the life of a new product is to be estimated, or can a singletemperature short-term index test which has been “calibrated” based on the long-term testing beused to assess the potential long-term performance of a given product? The answer to thisquestion will depend on the variation in the activation energy for various products as well as thevariation from product to product regarding the effect various other environmental variables haveon product life. This will be investigated, at least partially, in Phase 3 of Tasks D and E. A short-term test to assess the potential life of a given new product is certainly a desired goal of the Phase3 testing.
50
7. SUMMARY OF SIGNIFICANT ACCOMPLISHMENTSAND LEARNING FROM THE STUDY TO DATE
Considering the information provided in this report, much has already been learned andaccomplished through this project. This learning and accomplishment are summarized as follows:
l Based on the literature review conducted for this project and the experience of those involvedin the project, the polymer and soil environmental factors which affect the geosyntheticdegradation rate have been identified as well as tests which potentially could be used to assessand quantify many of these factors.
l The literature review has helped to identify the issues which must be addressed to develop lifeprediction models for geosynthetics, especially with regard to relating the laboratoryenvironment to the in-soil environment.
l The study has created an environment which has promoted improved communication betweenthe industry, in particular their polymer experts and suppliers, and the portion of theengineering community which routinely uses geosynthetics. This has allowed the geosyntheticindustry to better understand the needs of those who use geosynthetics regarding durabilityissues, and has helped geosynthetic users to know what questions to ask and what can berealistically expected from the industry. A team spirit between the industry and thegeosynthetic users has begun to develop from this which was not present before the studybegan.
l Variations in the test protocols used to chemically characterize polymers, with specificreference to geosynthetics, which could significantly affect test results or make test resultsdifficult to interpret have been identified and corrections to the protocols made (e.g., the OITtest). These protocol variations help to explain why comparison and use of data provided inthe literature is difficult.
l From the effort to better define the test protocols, preliminary standardized test and QC/QAprocedures to be applied industry wide have been developed and will be further evaluatedduring the remainder of the research program. This has set into motion the ability of theindustry to perform the tests which will likely be recommended for future evaluation ofgeosynthetic durability, and the ability to develop a consensus on how those tests should beperformed and quality control maintained.
l A preliminary assessment has been made as to which chemical characterization tests (see table2 for the types of tests available) appear most useful to at least roughly characterize thepotential durability of a geosynthetic product with a minimal amount of effort. Initially, thesepotential tests appear more promising for durability characterization of PET products than forPP and HDPE products.
51
l The issues which must be addressed to chemically track geosynthetic polymer degradation aswell as the best tests to perform this tracking, and their limitations, have been preliminaryidentified, and attempts are being made to determine their usefulness.
l A preliminary test protocol for long-term durability performance testing of geosynthetics (i.e.,oven aging and immersion testing) has been developed.
l The long-term testing program needed to develop a model for life prediction of geosyntheticsand to establish a practical protocol to assess the durability of all geosynthetic products hasbeen set into motion.
l A separate but parallel effort by Transportation Research Board (TRB) committee A2K07 hasalready been initiated to develop the frame work necessary for rapid implementation of theresults of this study. This effort has also helped to identify just where the real needs in termsof geosynthetic durability knowledge are so that once the study is completed, a coherentrecommended practice to determine the long-term strength of geosynthetics can be developed.
l Based on the initial data and data provided in the literature, it appears that most geosyntheticproducts will have the durability needed for critical reinforcement applications, especially inrelatively neutral environments. In severe environmental conditions, preliminary resultsappear to indicate a fairly wide range of degradation rates. However, there is much to belearned yet before such preliminary predictions can become final conclusions.
52
REFERENCES
AASHTO (1994), Standard Specifications for Highway Bridges, AASHTO, Washington, DC.
Allen, T. M. (1991), “Determination of Long-Term Tensile strength of Geosynthetics: A State-of-the-Art Review,” Proceedings, Geosynthetics ‘91 Conference, Atlanta, pp. 351-379.
Allen, T. M. and Diekmann, J. (1994), State and Federal Transportation Agency Policies andUse of Specialty Retaining Walls: Summary of Survey Results, WSDOT Internal Report,Olympia, Washington.
Anderson, P. L., Jailloux, J.-M., and White, D. F. (1992), “Testing Durability of Polyester to BeUsed in Earth-Reinforced Structures,” Earth Reinforcement Practice, Balkema, Rotterdam,pp. 9-12.
Bright, D. G. (1993), “The Environmental Stress Cracking of Polymers Used in GeosyntheticProducts,” Proceedings Geosynthetics ‘93, Vancouver, B.C., pp. 925-934.
Darbin, M., Jailloux, J. M., and Montuelle, J. (1988), “Durability of Reinforced Earth Structures:the Results of a Long-Term Study Conducted on Galvanized Steel,” Proceedings Institutionof Civil Engineers, Part 1, No. 84, pp. 1029-1057.
Elias, V. (1990), Durability/Corrosion of Soil Reinforced Structures, FHWA/RD-89/186, FederalHighway Administration, Washington, DC.
Fettig, D. R. (1991), “A Team Player on the Industry’s Side,” Geotechnical Fabrics Report, Vol.9, No. 3, pp. 22-23.
Forsman, J. P. (1964), “Oven Aging of Polypropylene,” SPE Journal, No. 20, p. 729.
Gilroy, H. M. (1979), “Long-Term Photo- and Thermal Oxidation of Polyethylene,” Durability ofMacromolecular Materials, ASC Symposium Series 95, pp. 63-74.
Grieveson, B. M., Haward, R. N., and Wright, B. (1961), “The Thermal Oxidation of ZeglerPolyethylenes,” in High Temperature Resistance and Thermal Degradation of Polymers,Society of the Chem. Industry Monograph, No. 13, pp. 413-431.
Jailloux, J.-M., Anderson, P. L., and Thomas, R. (1992) “Chemical Compatibility Studies ofPolyester Fibers and Yarns to Be Used in Geocomposites,” Geotextiles and Geomembranes,Vol. 11, No. 3, pp. 277-290.
Koemer, R. M., Lord, A., and Halse, Y. (1992), “Arrhenius Modeling to Predict GeosyntheticDegradation,” Geotextiles and Geomembranes, Vol. 11, pp. 151-183.
53
Lustiger, A. (1983), “The Molecular Mechanism of Slow Crack Growth in Polyethylene,”Proceedings, Eighth Plastic Fuel Gas Pipe Symposium, American Gas Association:Arlington, Virginia, pp. 54-56.
McMahon, W., Birdsall, H. A., Johnson, G. R., and Camilli, C. T. (1959), “Degradation Studiesof Polyethylene Terephthalate,” Journal Chemical Engineering Data, Vol. 4, No. 1, pp. 57-79.
Risseeuw, P, and Schmidt, H. M. (1990), “Hydrolysis of HT Polyester Yarns at Moderatetemperatures,” Proceedings of the Fourth International Conference on Geotextiles,Geomembranes, and Related Products, The Hague, pp. 691-696.
Shelton, W. S., and Bright, D. G. (1993), “Using the Arrhenius Equation and Rate Expressions,to Predict the Long-Term Behavior of Geosynthetic Polymers,” Geosynthetics ‘93Conference, Vol. 2, Vancouver, B.C., pp. 789-802.
Task Force No. 27 (1989), “Design Guidelines for Use of Extensible Reinforcements(Geosynthetic) for Mechanically Stabilized Earth Walls in Permanent Applications,” JointCommittee of AASHTO-AGC-ARBTA on Materials.
Van Langenhove, L. (1990), “Conclusions of an Extensive BRITE-Research Program on Aging,”Proceedings of the Fourth International Conference on Geotextiles, Geomembranes, andRelated Products, The Hague, pp. 703-707.
Van Zanten, V., ed. (1986), Geotextiles and Geomembranes in Civil Engineering, Wiley-Halsted.
Weatherby, D. E. (1982), Tiebacks, Report No. FHWA/RD-82/047, Federal HighwayAdministration, Washington, DC.
Wisse, J. D. M., and Birkenfeld, S. (1982), “The Long-Term Thermo-Oxidative Stability ofPolypropylene Geotextiles in the Oosterschelde Project,” Proceedings of the SecondInternational Conference of Geotextiles, Las Vegas, 1982, pp. 283 to 288.
Wisse, J. D. M., Broos, C. J. M., and Boels, W. H. (1990), “Evaluation of the Life Expectancy ofPolypropylene Geotextiles Used in Bottom Protection Structures Around the Ooster ScheldeStorm Surge Barrier - A Case Study, ” Proceedings of the Fourth International Conferenceon Geotextiles, Geomembranes, and Related Products. The Hague, pp. 697-702.
Wrigley, N. E. (1987), “Durability and Long-Term Performance of Tensar Polymer Grids for SoilReinforcement,“Materials Science and Technology, Vol. 3, pp. 161-170.
Yanful, E. K. (1993), Oxygen Diffusion Through Soil Covers on Sulphidic Mine Tailings,” ASCEJournal of Geotechnical Engineering, Vol. 119, No. 8, pp. 1207-1228.
54
Yanful, E. K., Riley, M. D., Woyshner, M. R., and Duncan, J. (1993), “Construction andMonitoring of a Composite Soil Cover on an Experimental Waste-Rock Pile nearNewcastle, New Brunswick, Canada,” Canadian Geotechnical Journal, No. 30,pp. 588-599.

HNR- 10/1 -96 (925)EW


![Clotilde Rosa [Entrevista]](https://img.pdfslide.net/doc/110x75/63605fdf5e6ba0ceb50ed63e/clotilde-rosa-entrevista.jpg)


![On the Frontier [Rosa Praed]](https://img.pdfslide.net/doc/110x75/63592cb2ca12adf96502e73a/on-the-frontier-rosa-praed.jpg)


