Embed Size (px)
Citation preview
Original Article
Dynamics of nonlinearly dampedmicrocantilevers under electrostaticexcitation
S Chaterjee1 and G Pohit2
Abstract
Nonlinear dynamic behaviour of a cantilever microbeam actuated by a combination of DC and AC loading are
investigated in presence of squeeze-film damping. A reduced order model formulated accounting for the nonlinearities
of the system arising out of electrostatic forces and squeeze-film damping is numerically simulated to observe the large
amplitude dynamic characteristics near primary and superharmonic resonances. The emphasis is on the significance of
nonlinear damping in capturing the true dynamic characteristics of microsystems formulated as distributed parameter
model. The damping nonlinearity is found to considerably affect the dynamics with a profound stabilising effect on the
microsystem. Under the effect of large DC bias voltage, frequency–response curves obtained for different amplitudes
of AC excitation exhibit local and global bifurcations. Response sensitivity to initial conditions is investigated near
bifurcation points. Findings in the superharmonic resonance domain are emphasised.
Keywords
Microelectromechanical systems, squeeze-film damping, bifurcation, nonlinear resonance, dynamic pull-in
Date received: 20 July 2012; accepted: 21 September 2012
Introduction
Due to the nonlinear nature of the electrostatic forces,microelectromechanical systems (MEMS) gives rise tointeresting nonlinear phenomenon that can have sig-nificant impact in their applications as capacitiveswitches, resonators and micromirrors. Moreover,the damping of electrically actuated microstructuresvibrating in presence of fluid trapped in the narrowgap between deformable and fixed electrodes is domi-nated by nonlinear squeeze-film damping.1 There hasbeen much research work undertaken to address themanifestations of these nonlinearities.
In McCarthy et al.2 and Krylov and Maimon,3
dynamic pull-in instabilities were investigated forpurely DC loads under damped operating conditions.Purely DC loads and undamped operating conditionswere dealt in Chaterjee and Pohit.4 Dynamic charac-teristics of microstructures under combined DC andAC loading differ from those under purely DC loads.De and Aluru5 investigated the effects of electrostatic,mechanical, and fluidic nonlinearities on microstruc-tures. Full Lagrangian-based relaxation and Newtonschemes were presented to simulate period doublingroute to chaos under superharmonic excitations.Alsaleem et al.6 conducted experiment on a microcan-tilever attached to a proof mass at its end under low
pressure and revealed large primary and subharmonicdeflections with softening behaviour. Nayfeh andYounis7 studied a linearly damped clamped–clampedbeam microresonator using a combination of a shoot-ing technique and a reduced order model (ROM). Thedynamics of a doubly clamped microbeam for vari-ations in initial conditions were studied8 using long-time integration technique. Mestrom et al.9 comparedthe experimental observations of a doubly clampedbeam microresonator with the numerically simulatedresults. The frequency response curves revealed sub-harmonic resonance of order one-half preceded byperiod doubling bifurcation of period two. Harishet al.10 used a lumped model of a micro-ring resonatorto show jump phenomenon at high values of paramet-ric excitation. Zhu et al.11 studied the nonlinearcoupling effect between the adjacent microbeams of alarge array of interacting microcantilevers. Analysis
1Department of Mechanical Engineering, C V Raman College of
Engineering, Bhubaneswar, India2Department of Mechanical Engineering, Jadavpur University, Kolkata,
India
Corresponding author:
S Chaterjee, Department of Mechanical Engineering, C V Raman
College of Engineering, Bhubaneswar 752054, India.
Email: [email protected]
Proc IMechE Part C:
J Mechanical Engineering Science
227(3) 630–646
! IMechE 2012
Reprints and permissions:
sagepub.co.uk/journalsPermissions.nav
DOI: 10.1177/0954406212465371
pic.sagepub.com
suggested the existence of high-order parametric sub-harmonic resonance. Liu et al.12 studied aMEMS can-tilever system under the effect of nonlinear electrostaticactuation. Utilising Poincare maps, they have shownHopf bifurcation and period doubling route to chaosin absence of squeeze-film damping. Zamanian et al.13
simulated a doubly clamped beam microresonatorunder piezoelectric as well as electrostatic actuation.Electrostatic actuation is shown to have a profoundeffect on the nonlinear behaviour of the piezoelectric-ally actuated microbeam. Park et al.14 used finite elem-ent method (FEM) to model a doubly clamped beammicroresonator under linearised damping conditions.Stability of a microbeam resonator was studied15 usingphase plane diagrams and Poincare mapping. Effectsof quadratic and cubic nonlinearities due to nonlinearelectrostatic forces and nonlinear damping, respect-ively, were investigated16 utilising a ROM of aclamped–clamped microswitch.
Though nonlinear dynamic phenomena have beenobserved for microstructures actuated by a combinedDC and AC loading, majority of the research worksare restricted to lumped-parameter modelling6,9–12
with or without an arbitrarily assumed linear damp-ing7,8–12,14 of the microsystem. In this article, formu-lation of a distributed parameter model of amicrocantilever under the combined effect of DCand AC loading is derived accounting for nonlinearelectrostatic forces and nonlinear squeeze-film damp-ing. In the present study, the electrostatic force term isrepresented in its exact form unlike a truncated expan-sion series used by other existing models.9–11,16,17 Itmay be highlighted that in order to include squeeze-film damping characteristic in their nonlinear dynamicmodel, previous researchers7–12 have assumed a coef-ficient corresponding to linear viscous damping. Theemphasis of the present work is on capturing theactual dynamic behaviour of a microcantileverunder nonlinear squeeze-film damping with the damp-ing coefficient being a nonlinear function of the beamdisplacement. This article also focuses on rich non-linear phenomena observed in the superharmonic res-onance domain.
Governing equations
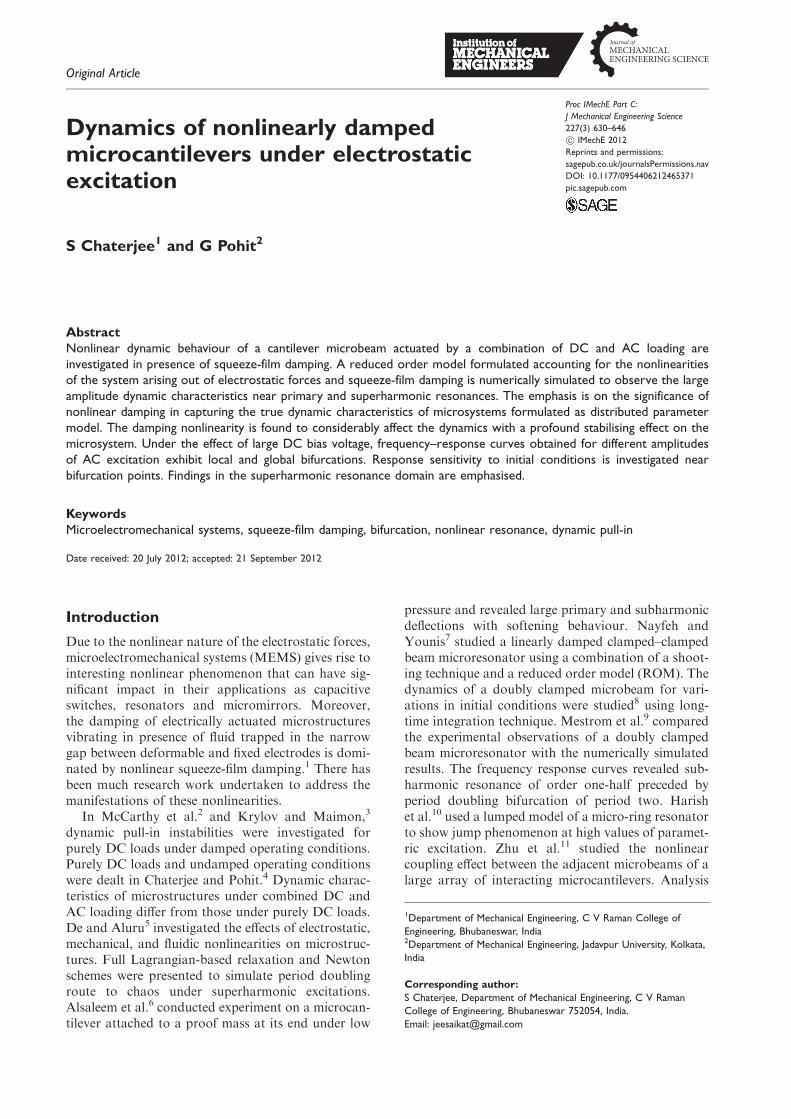
The model (Figure 1) shows a damped cantileverbeam of length l, width b, thickness h, which acts as
the deformable electrode, suspended above the rigidground plane by a small initial air-gap of d0. Whensubjected to a driving voltage VðtÞ comprising a DCbias voltage VDC and an AC component VAC cos ð!tÞ,the beam undergoes oscillatory motions and theseoscillations redistribute pressure in the air trapped inthe nonuniform gap spacing causing a damping effect.Let wðx, tÞ denote the transverse displacement of thebeam being dependent on the position x along thebeam length and time t. Following the elastic beamtheory, and, adding terms representing electrostaticexcitation and squeeze-film effect, the governingequation of the one-dimensional Euler-beam forsmall air-gap to length ratio17 is given by
�A@2w
@t2þ EI
@4w
@x4¼
1
2
"0bV2
d0 � wð Þ2� fd ðx, tÞ ð1aÞ
with the boundary conditions for a cantilever beam as
wð0, tÞ ¼ 0,@w
@x
����x¼0
¼ 0,@2w
@x2
����x¼l
¼ 0,@3w
@x3
����x¼l
¼ 0
ð1bÞ
where � is the density of the beam material; permit-tivity constant for free space "0¼ 8.854� 10�12 F/m;plate modulus for wide beams E ¼ E0=ð1� �2Þ, whereE0 is the Young’s modulus and � is the Poisson’s ratio.For slender beams E is equal to E0. The beam isassumed to be prismatic with rectangular cross sec-tion, thereby the moment of inertia and the area ofthe cross section can be given by I ¼ bh3=12 andA ¼ bh, respectively. The first term on the righthand side of equation (1a) represents the excitationforce per unit length while the second term representsthe force acting on the beam owing to the pressure ofthe squeezed air-film between the beam and theground plane.
The one-dimensional force due to squeeze-filmdamping is obtained by integrating the two-dimensional pressure distribution along the width ofthe beam, and, is given by
fd ðx, tÞ ¼
Z b
0
pðx, y, tÞ � pa½ �dy ð2Þ
where pðx, y, tÞ is the absolute pressure in the gap andpa is the ambient pressure. For slow (Reynoldsnumber less than unity) viscous motion within smallgaps and the motion of the beam being restricted to
Figure 1. A schematic diagram of an electrostatically actuated cantilever microbeam model.
Chaterjee and Pohit 631
normal approach, the pressure pðx, y, tÞ is governed bythe nonlinear Reynolds equation1
@
@x
�ag3
12�
@p
@x
� �þ@
@y
�ag3
12�
@p
@y
� �¼@
@t�agð Þ ð3aÞ
with the trivial boundary conditions, applicable forsmall air-gaps, as
pðx,0, tÞ ¼ pðx,b,tÞ ¼ pðl,y,tÞ ¼ pa, and,@pð0,y,tÞ
@x¼ 0
ð3bÞ
where �a is the density of ambient air; the nonuniformgap spacing gðx, tÞ ¼ d0 � wðx, tÞ; � is the dynamicviscosity of air under standard temperature and pres-sure. The trivial pressure boundary condition impliesambient pressure at the free edges of the moving can-tilever, and, the trivial flow condition implies fluidvelocity along the boundary of the fixed end of thecantilever is zero.
For very small air-gap, air in the gap is rarefiedeven under standard temperature and pressure condi-tions. In case of many microsystems, the rarefactioneffects can be accounted for by assuming slip-flowboundary conditions for the air flow. Assuming theflow to be incompressible, and, considering an effect-ive air viscosity �eff
1 to take into account the slip-flowconditions, equation (3a) can be reduced to
@
@x
ðd0 � wÞ3
�eff
@p
@x
� �þ@
@y
ðd0 � wÞ3
�eff
@p
@y
� �¼ 12 �
@w
@t
� �ð4Þ
where variable effective viscosity �effðx, tÞ ¼�=ð1þ 6KnÞ, calculated using Burgdorfer’s model;variable Knudsen number Kn ðx, tÞ ¼ �a=g;�a ¼ �0p0=pa is the mean free path at ambient pressurepa. The mean free path �0 at standard temperature andpressure p0¼ 1.013� 105Pa conditions is about65� 10�9m. Using equation (2) and the nondimen-sional variables �x ¼ x=l, �y ¼ y=b, �w ¼ w=d0,�g ¼ g=d0, �p ¼ p=pa, �t ¼ t=s, s ¼ l2ð
ffiffiffiffiffiffiffi�Ap
=ffiffiffiffiffiffiEIpÞ, equa-
tions (1) and (4) can be expressed as
@2w
@t2þ@4w
@x4¼
�2V2
1� wð Þ2� P
Z 1
0
p� 1ð Þdy ð5aÞ
wð0, tÞ ¼@w
@x
����x¼0
¼@2w
@x2
����x¼1
¼@3w
@x3
����x¼1
¼ 0 ð5bÞ
and
d0l
� �2 @
@x
ð1� wÞ3
�eff
@p
@x
� �þ
d0b
� �2 @
@y
ð1� wÞ3
�eff
@p
@y
� �
¼12
pa s�@w
@t
� �ð6aÞ
respectively, where �2 ¼ ð1=2Þð"0bl4=EId30Þ,
P ¼ l4bpa=EId0, VðtÞ ¼ VDC þ VAC cos ðs!tÞ; with thepressure boundary conditions, equation (3b), can berewritten as
pðx, 0, tÞ ¼ pðx, 1, tÞ ¼ pð1, y, tÞ ¼ 1,@pð0, y, tÞ
@x¼ 0
ð6bÞ
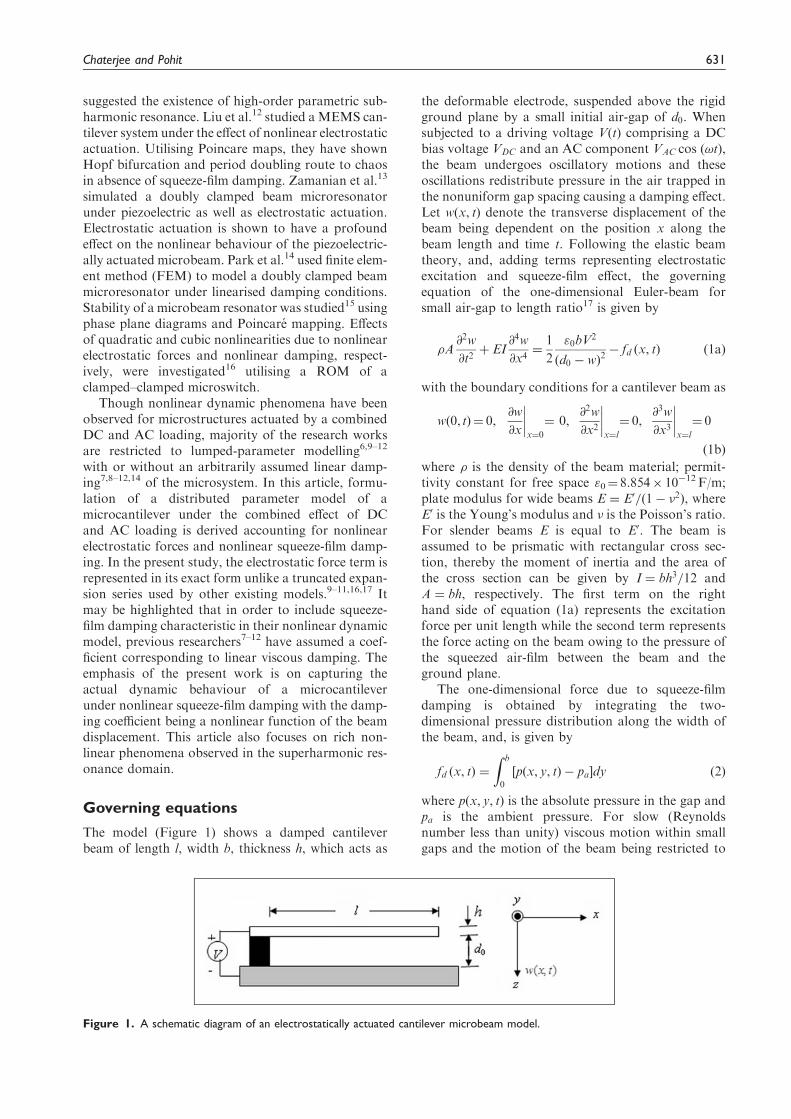
Figure 2. Variation of the nondimensional static tip-deflection w ðx ¼ 1Þ with DC bias voltage VDC .
632 Proc IMechE Part C: J Mechanical Engineering Science 227(3)
It may be noted that over-scores have been removedfor convenience.
Taking into consideration the boundary condi-tions, equation (6b), absolute pressure underneaththe vibrating plate can be written as
pðx, y, tÞ ¼ 1þ P�ðx, y, tÞ ð7Þ
where P�ðx, y, tÞ ¼ ðxÞð y� y2Þej ðs!Þt is used assum-ing, as in earlier works,2,3 the spatial distribution ofpressure to be separable being the product of a para-bolic function along the beam width and an unknownfunction ðxÞ along the beam length.
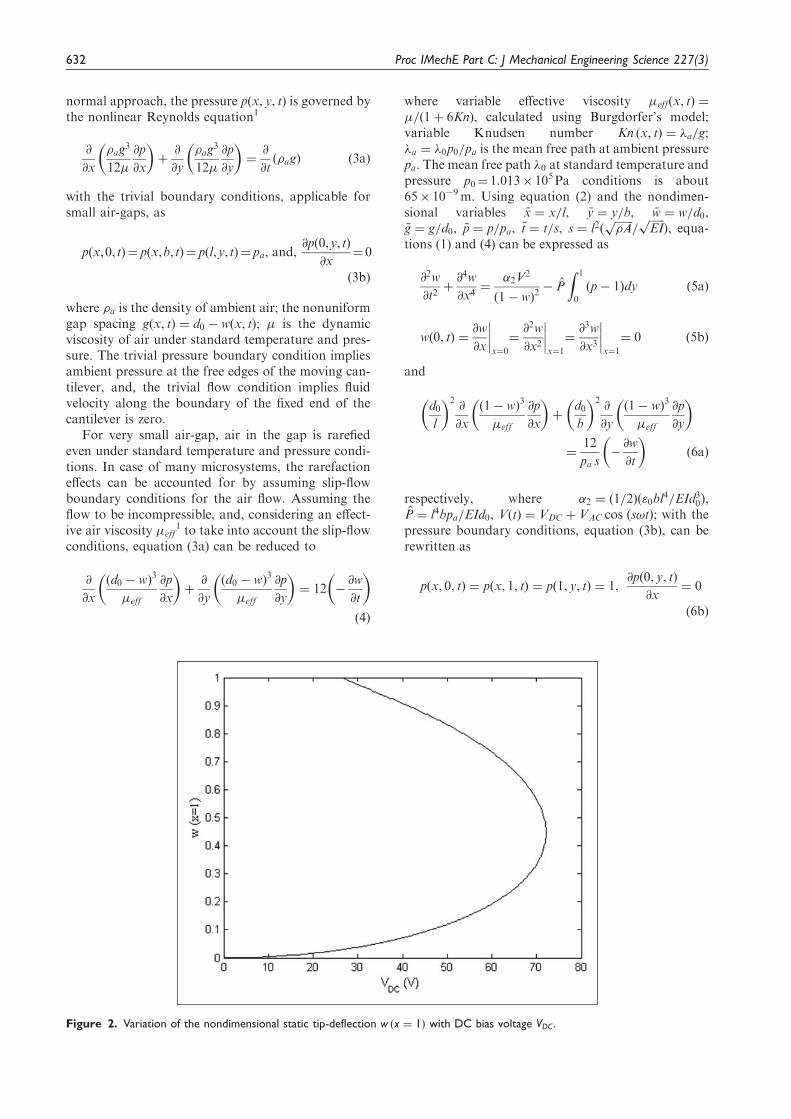
Figure 3. Frequency–response curve corresponding to the experimental observation of Pandey and Pratap.18 wmaxðx ¼ 1Þ
represents the nondimensional peak displacement of the tip of the microcantilever.
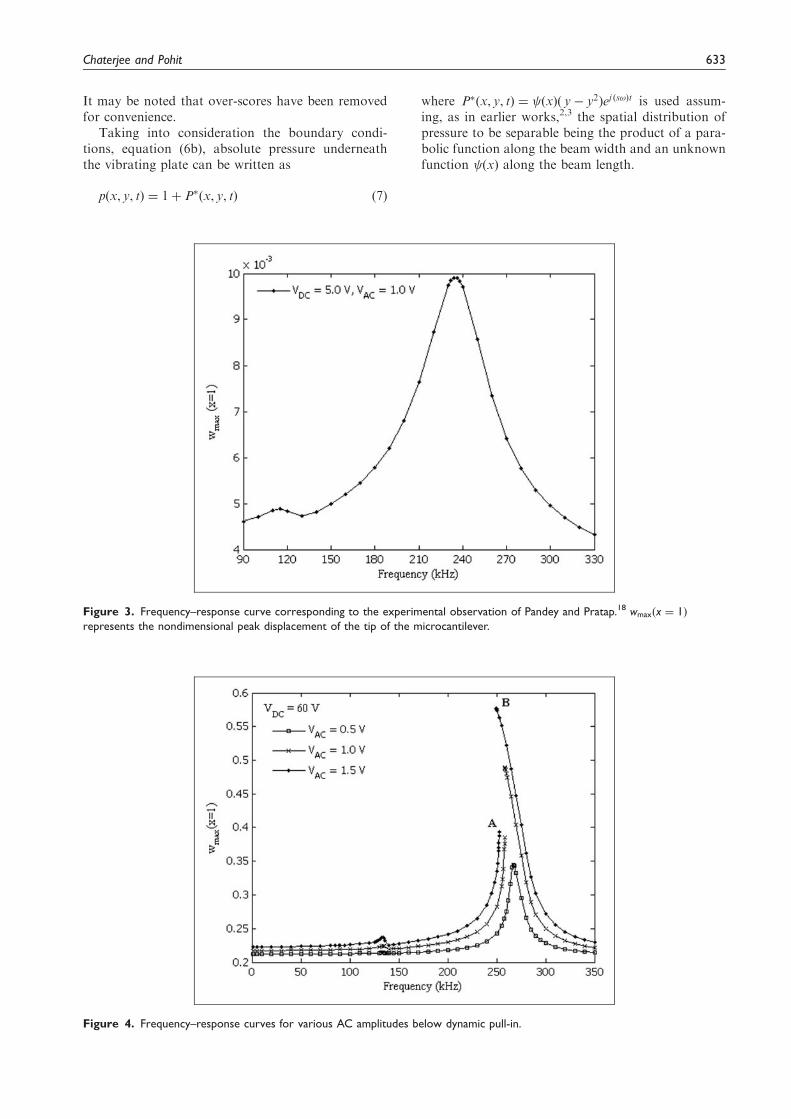
Figure 4. Frequency–response curves for various AC amplitudes below dynamic pull-in.
Chaterjee and Pohit 633
Substituting equation (7) in equation (6a) and inte-grating the resulting equation across the width of thebeam leads to
d0l
� �21
2�effð1�wÞ2 �
@w
@x
� �@
@x
�
þ1
6�effð1�wÞ3
@2
@x2þ1
6
@
@x
1
�eff
� �ð1�wÞ3
@
@x
�ej ðs!Þt
�d0b
� �22
�effð1�wÞ3 ej ðs!Þt
¼12
pa s�@w
@t
� �ð8Þ
For air-gap to length ratio d0=l less than 0:3, theðd0=lÞ
2 terms in the expression for the electrostaticforce can be safely neglected.4 As expressed in equa-tion (1a), the present model neglects the ðd0=lÞ
2 termsin the expression for the electrostatic force and thusassumes parallel plate capacitance. For compatibilityof the fluid model with the electrostatic model, theðd0=lÞ
2 terms in equation (8) are neglected3,14 toobtain the pressure function ðxÞ as
ðxÞ ¼6�effb
2
d20pa s
1
ð1� wÞ3@w
@te�j ðs!Þt ð9Þ
Using equations (7) and (9), equation (5a) can berewritten as
@2w
@t2þ@4w
@x4¼
�2V2
ð1� wÞ2�
�
ð1� wþ 6�Þð1� wÞ2@w
@t
ð10Þ
where � ¼ ð�l2=ffiffiffiffiffiffiffiffiffiffiffiffiEI�Ap
Þðb=d0Þ3; � ¼ �a=d0. The
second term on the right hand side of equation (10)denotes the damping term and is proportional to thebeam velocity with the coefficient being a nonlinearfunction of the beam displacement.
Linearised squeeze-film damping model
In order to comprehend the relative dominance of thenonlinear mechanisms and to facilitate a comparisonof nonlinear model and linearised model in the subse-quent sections, a model is derived retaining electro-static force as the only source of nonlinearity. Insteadof the fluidic nonlinearity due to nonlinear damping,the damping coefficient is represented by a linearterm. Incorporating the damping coefficient asobtained1 analytically using the linearised Reynoldsequation modified to take into account the slip-flowconditions, equation (1a) can be rewritten as
�A@2w
@t2þ EI
@4w
@x4¼
1
2
"0bV2
d0 � wð Þ2� c
@w
@tð11Þ
where the linear damping coefficient c ¼ �effb3=d30.
Using the nondimensional variables as mentioned ear-lier and removing the over-scores, equation (11) canbe expressed as
@2w
@t2þ@4w
@x4¼
�2V2
ð1� wÞ2�
�
ð1þ 6�Þ
@w
@tð12Þ
It may be noted that the above equation can bederived by linearising the nonlinear damping coeffi-cient, in equation (10), about the undeflected positionof the microcantilever.
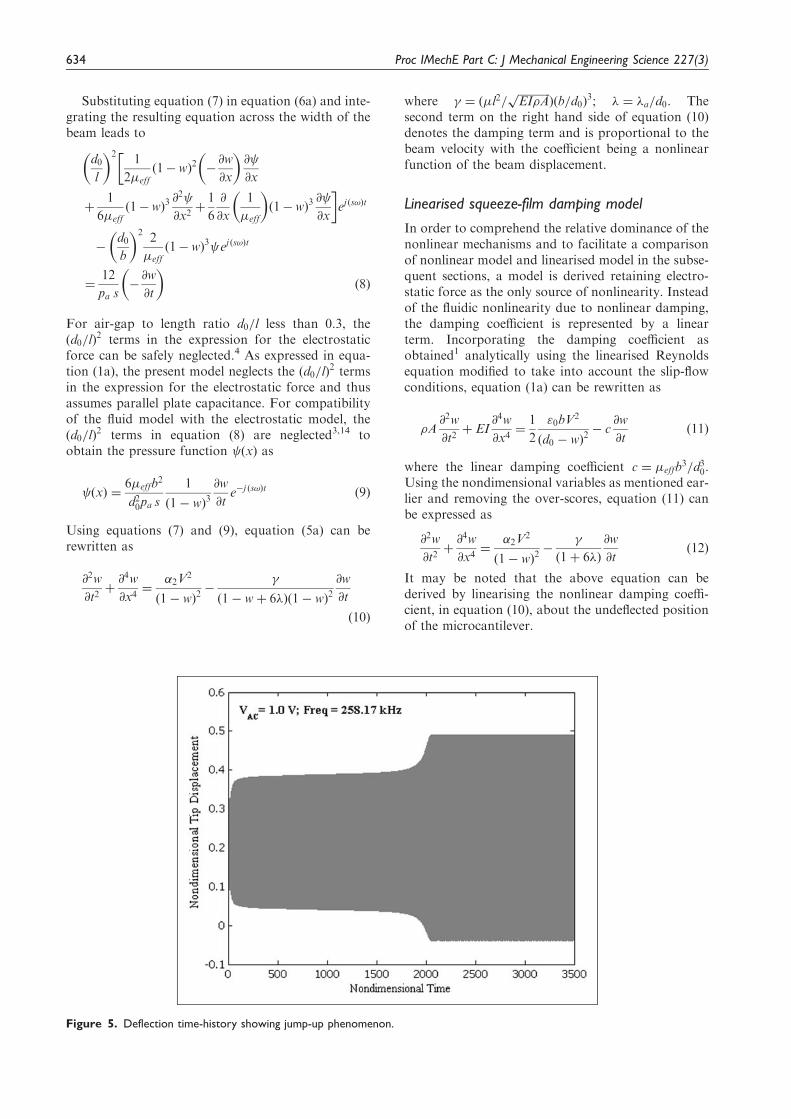
Figure 5. Deflection time-history showing jump-up phenomenon.
634 Proc IMechE Part C: J Mechanical Engineering Science 227(3)
Reduced order model
The method of Galerkin decomposition is employedto approximate the system equation (10) by a ROMcomposed of a finite number of discrete modal equa-tions. The process of Galerkin decomposition startswith separating the dependences of the deflection ofthe deformed beam wðx, tÞ into temporals and spatialsby functions aiðtÞ and ’iðxÞ respectively, in the form ofa series of products, i.e.
wðx, tÞ ¼XNi¼1
aiðtÞ’iðxÞ ð13Þ
where N represents the number of modes retained inthe solution. ’iðxÞ is the ith linear undamped modeshape of the undeflected microcantilever obtainedfrom the following linear undamped eigenvalue prob-lem of a straight beam
d4’idx4¼ s!ið Þ
2’i ð14aÞ
’ið0Þ ¼ 0,d’idx
����x¼0
¼ 0,d2’idx2
����x¼1
¼ 0,d3’idx3
����x¼1
¼ 0
ð14bÞ
where !i is the ith linear undamped natural frequency(rad/s) of the undeflected microcantilever; s!i ¼ 3:516for the first mode, 22:034 for the second mode, 61:70for the third mode, etc. It is worth mentioning that’iðxÞ is normalised such that
R 10 ’
2i dx ¼ 1.
Multiplying equation (10) by ð1� wþ 6�Þð1� wÞ2,substituting equation (13) and (14a) into the resulting
equation, multiplying by ’nðxÞ, and integrating theoutcome from x ¼ 0 to 1, the set of coupled nonlinearODEs can be derived as
ð1þ 6�Þd2andt2þ �
dandtþ ð1þ 6�Þðs!nÞ
2þ �2V
2�
an
� ð3þ 12�ÞXNi¼1
XNj¼1
d2aidt2
aj
Z 1
0
’n’i’jdx
� ð3þ 12�ÞXNi¼1
XNj¼1
aiaj ðs!iÞ2
Z 1
0
’n’i’jdx
þ ð3þ 6�ÞXNi¼1
XNj¼1
XNk¼1
d2aidt2
ajak
Z 1
0
’n’i’j’kdx
þ ð3þ 6�ÞXNi¼1
XNj¼1
XNk¼1
aiajakðs!iÞ2
Z 1
0
’n’i’j’kdx
�XNi¼1
XNj¼1
XNk¼1
XNp¼1
d2aidt2
ajakap
Z 1
0
’n’i’j’k’pdx
�XNi¼1
XNj¼1
XNk¼1
XNp¼1
aiajakapðs!iÞ2
Z 1
0
’n’i’j’k’pdx
� ð1þ 6�Þ�2V2
Z 1
0
’ndx ¼ 0,
n ¼ 1, 2, . . . . . . ,N ð15Þ
Reduced order linearised model
Following the same procedure as mentioned inprevious section, a set of coupled nonlinear
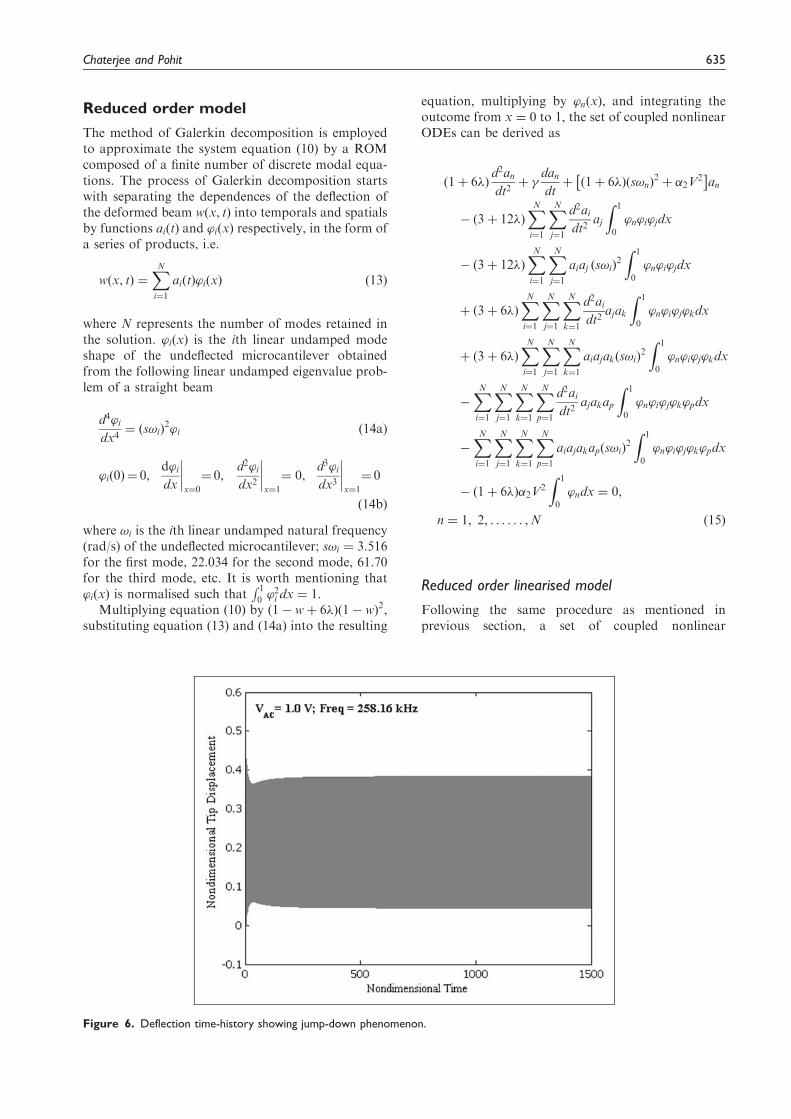
Figure 6. Deflection time-history showing jump-down phenomenon.
Chaterjee and Pohit 635
ODEs describing the linearised damping model (equa-tion (12)) can be derived as
d2andt2þanðs!nÞ
2þXNi¼1
XNj¼1
XNk¼1
d2aidt2
ajak
Z 1
0
’n’i’j’kdx
�2XNi¼1
XNj¼1
d2aidt2
aj
Z 1
0
’n’i’jdx
þXNi¼1
XNj¼1
XNk¼1
aiajakðs!iÞ2
Z 1
0
’n’i’j’kdx
�2XNi¼1
XNj¼1
aiaj ðs!iÞ2
Z 1
0
’n’i’jdx
þ�
1þ6�
� �dandtþXNi¼1
XNj¼1
XNk¼1
daidt
ajak
Z 1
0
’n’i’j’kdx
"
�2XNi¼1
XNj¼1
daidt
aj
Z 1
0
’n’i’jdx
#��2V
2
Z 1
0
’ndx¼ 0,
n¼ 1, 2, . . . . . . ,N ð16Þ
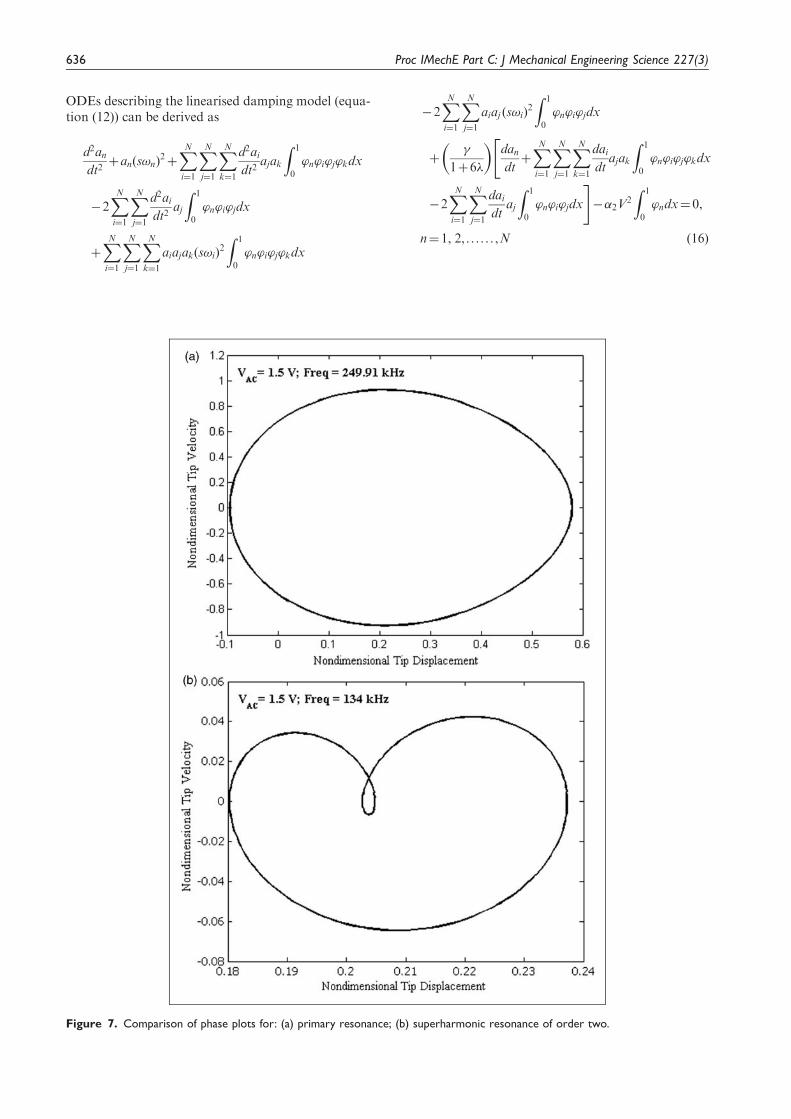
Figure 7. Comparison of phase plots for: (a) primary resonance; (b) superharmonic resonance of order two.
636 Proc IMechE Part C: J Mechanical Engineering Science 227(3)
Results
In this section, the entire analysis is carried out usingthe ROMs obtained while retaining4 five ðN ¼ 5Þmodes in equations (15) and (16). The dynamic ana-lysis under combined DC and AC loading is carriedout by numerically integrating for long time the non-explicit set of nonlinear ODEs. The time step used inthe simulations presented here is 0.03 ms which ensuresa large number (� 95) of simulation points per time
period even for the highest simulated frequency(350 kHz). The design parameters used in the presentanalysis (except for validation) are l¼ 90 mm,b¼ 10 mm, h¼ 2 mm, d0¼ 1.4 mm, E¼ 160� 109Pa,�¼ 2330 kg/m3, pa¼ 1.013� 105Pa, �¼ 1.8�10�5Ns/m2. The rest of the section is organised as fol-lows. Firstly, a static analysis is carried out to betterunderstand dynamic pull-in characteristics in compari-son to static pull-in behaviour of the system. Thenumerical procedure is validated next with the results
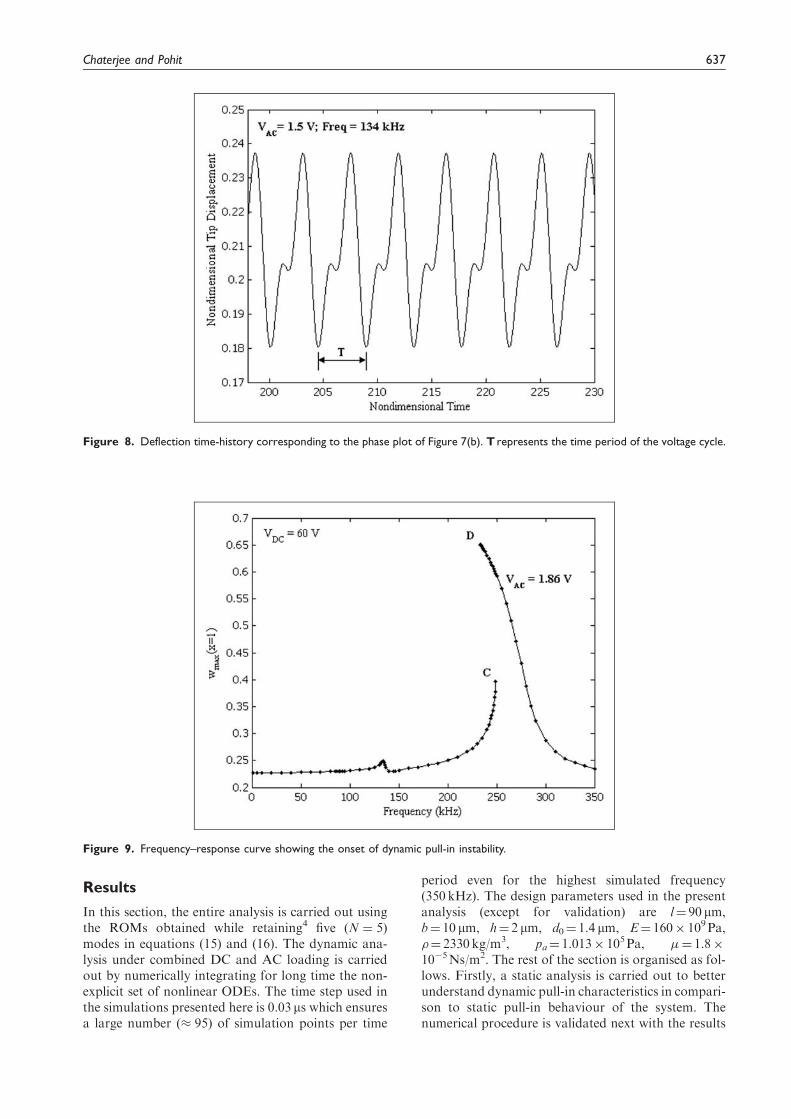
Figure 8. Deflection time-history corresponding to the phase plot of Figure 7(b). T represents the time period of the voltage cycle.
Figure 9. Frequency–response curve showing the onset of dynamic pull-in instability.
Chaterjee and Pohit 637
available in open literature. Non pull-in and pull-indynamics are discussed in details followed by astudy on the effects of initial displacement and initialvelocity conditions. Higher order superharmonicresonances are illustrated next. The section ends witha comparison between nonlinear and lineariseddamping models.
The static deflections are obtained by numericallysolving the set of nonlinear algebraic equationsobtained from equation (15) while considering aiðtÞ
being independent of time, VAC equal to zero, andall the time derivatives set equal to zero. Figure 2reveals the existence of two equilibrium solutionsw ðx ¼ 1Þ for each value of the gradually applied DCvoltage. As described in Chaterjee and Pohit,4 thelower stable branch and the upper branch of unstablefixed points (saddles) coalesce at certain voltage(&71V) known as static pull-in voltage, and, certaintip-deflection (w ¼ 0:448) known as static pull-indeflection.
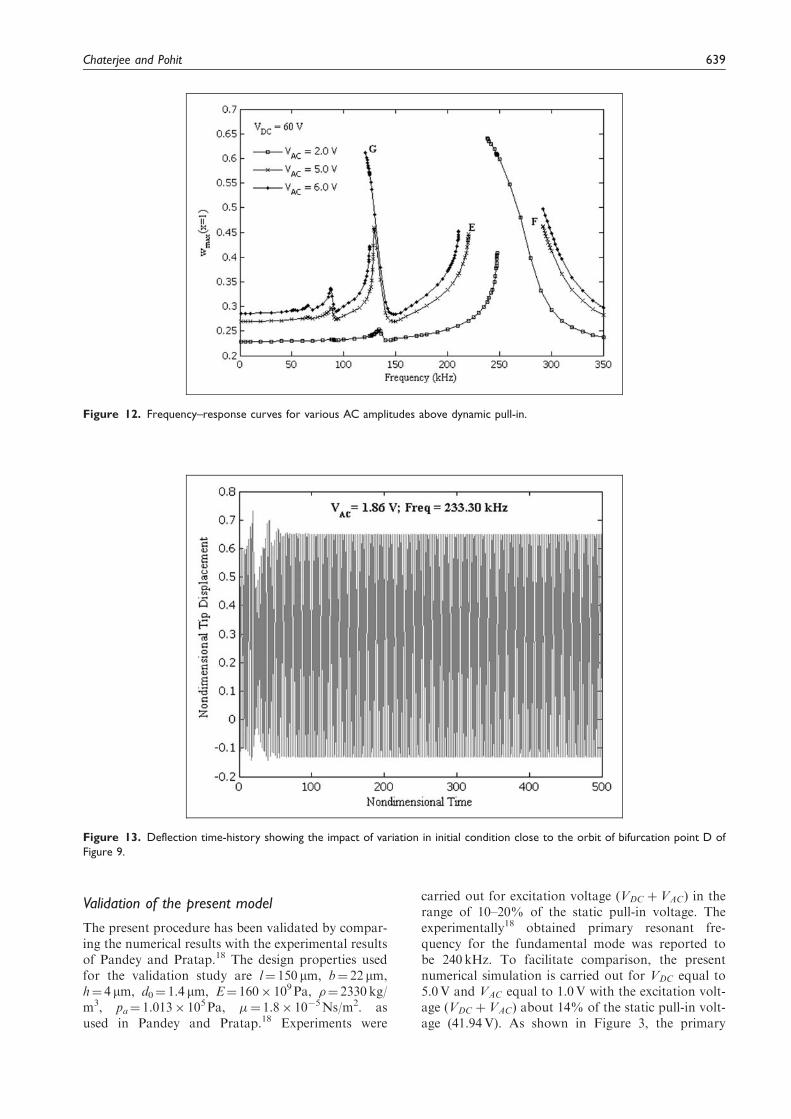
Figure 11. Phase plot at dynamic pull-in corresponding to primary resonance. ¨ represents the location of the saddle.
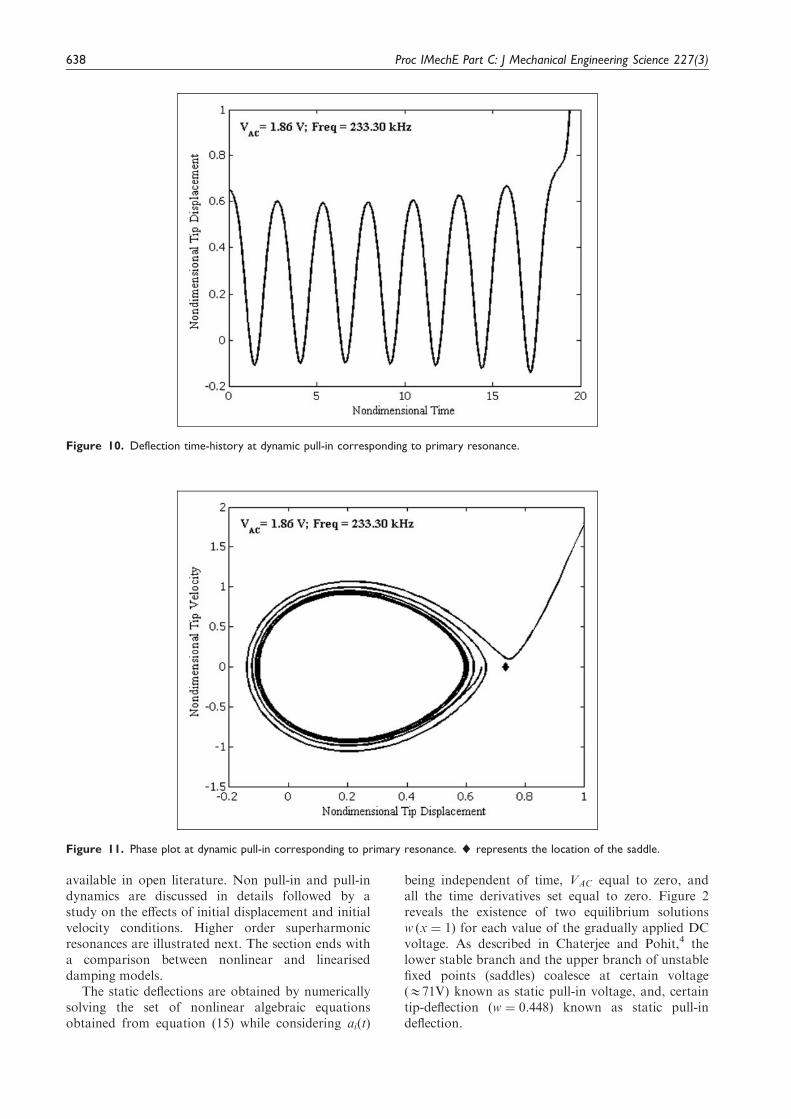
Figure 10. Deflection time-history at dynamic pull-in corresponding to primary resonance.
638 Proc IMechE Part C: J Mechanical Engineering Science 227(3)
Validation of the present model
The present procedure has been validated by compar-ing the numerical results with the experimental resultsof Pandey and Pratap.18 The design properties usedfor the validation study are l¼ 150 mm, b¼ 22 mm,h¼ 4 mm, d0¼ 1.4 mm, E¼ 160� 109Pa, �¼ 2330 kg/m3, pa¼ 1.013� 105Pa, �¼ 1.8� 10�5Ns/m2. asused in Pandey and Pratap.18 Experiments were
carried out for excitation voltage (VDC þ VAC) in therange of 10–20% of the static pull-in voltage. Theexperimentally18 obtained primary resonant fre-quency for the fundamental mode was reported tobe 240 kHz. To facilitate comparison, the presentnumerical simulation is carried out for VDC equal to5.0V and VAC equal to 1.0V with the excitation volt-age (VDC þ VAC) about 14% of the static pull-in volt-age (41.94V). As shown in Figure 3, the primary
Figure 13. Deflection time-history showing the impact of variation in initial condition close to the orbit of bifurcation point D of
Figure 9.
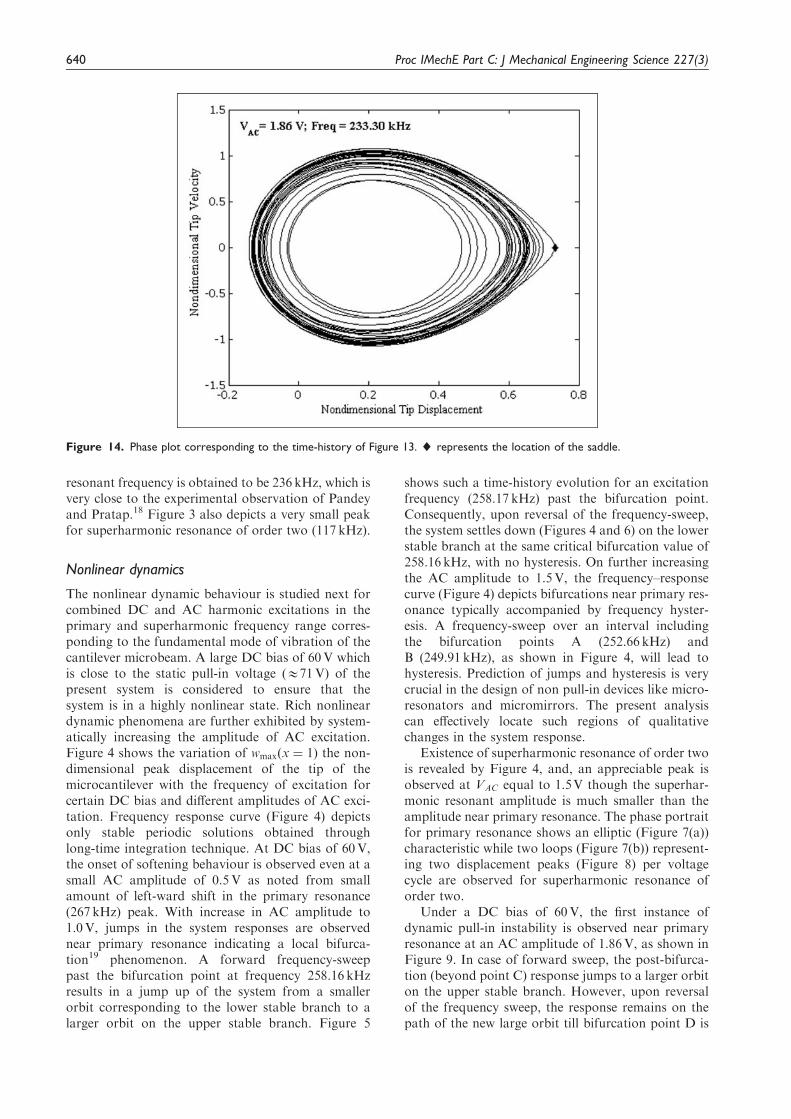
Figure 12. Frequency–response curves for various AC amplitudes above dynamic pull-in.
Chaterjee and Pohit 639
resonant frequency is obtained to be 236 kHz, which isvery close to the experimental observation of Pandeyand Pratap.18 Figure 3 also depicts a very small peakfor superharmonic resonance of order two (117 kHz).
Nonlinear dynamics
The nonlinear dynamic behaviour is studied next forcombined DC and AC harmonic excitations in theprimary and superharmonic frequency range corres-ponding to the fundamental mode of vibration of thecantilever microbeam. A large DC bias of 60V whichis close to the static pull-in voltage (&71V) of thepresent system is considered to ensure that thesystem is in a highly nonlinear state. Rich nonlineardynamic phenomena are further exhibited by system-atically increasing the amplitude of AC excitation.Figure 4 shows the variation of wmaxðx ¼ 1Þ the non-dimensional peak displacement of the tip of themicrocantilever with the frequency of excitation forcertain DC bias and different amplitudes of AC exci-tation. Frequency response curve (Figure 4) depictsonly stable periodic solutions obtained throughlong-time integration technique. At DC bias of 60V,the onset of softening behaviour is observed even at asmall AC amplitude of 0.5V as noted from smallamount of left-ward shift in the primary resonance(267 kHz) peak. With increase in AC amplitude to1.0V, jumps in the system responses are observednear primary resonance indicating a local bifurca-tion19 phenomenon. A forward frequency-sweeppast the bifurcation point at frequency 258.16 kHzresults in a jump up of the system from a smallerorbit corresponding to the lower stable branch to alarger orbit on the upper stable branch. Figure 5
shows such a time-history evolution for an excitationfrequency (258.17 kHz) past the bifurcation point.Consequently, upon reversal of the frequency-sweep,the system settles down (Figures 4 and 6) on the lowerstable branch at the same critical bifurcation value of258.16 kHz, with no hysteresis. On further increasingthe AC amplitude to 1.5V, the frequency–responsecurve (Figure 4) depicts bifurcations near primary res-onance typically accompanied by frequency hyster-esis. A frequency-sweep over an interval includingthe bifurcation points A (252.66 kHz) andB (249.91 kHz), as shown in Figure 4, will lead tohysteresis. Prediction of jumps and hysteresis is verycrucial in the design of non pull-in devices like micro-resonators and micromirrors. The present analysiscan effectively locate such regions of qualitativechanges in the system response.
Existence of superharmonic resonance of order twois revealed by Figure 4, and, an appreciable peak isobserved at VAC equal to 1.5V though the superhar-monic resonant amplitude is much smaller than theamplitude near primary resonance. The phase portraitfor primary resonance shows an elliptic (Figure 7(a))characteristic while two loops (Figure 7(b)) represent-ing two displacement peaks (Figure 8) per voltagecycle are observed for superharmonic resonance oforder two.
Under a DC bias of 60V, the first instance ofdynamic pull-in instability is observed near primaryresonance at an AC amplitude of 1.86V, as shown inFigure 9. In case of forward sweep, the post-bifurca-tion (beyond point C) response jumps to a larger orbiton the upper stable branch. However, upon reversalof the frequency sweep, the response remains on thepath of the new large orbit till bifurcation point D is
Figure 14. Phase plot corresponding to the time-history of Figure 13. ¨ represents the location of the saddle.
640 Proc IMechE Part C: J Mechanical Engineering Science 227(3)
reached. On continuation of a reverse sweep past thebifurcation point D, dynamic pull-in of the microcan-tilever occurs depicting a global bifurcation19 phe-nomenon. Figure 10 shows such a time-historyevolution for an excitation frequency (233.30kHz)past the bifurcation point D. The time-history is simu-lated with initial condition close to the orbit of bifur-cation point D. Pull-in of the microcantilever ismarked by the nondimensional tip displacementreaching a value of unity. The corresponding phaseplot (Figure 11) reveals that as the transient responseapproaches the saddle (corresponds to VDC equal to60V in Figure 2) located at nondimensional tip
displacement w ¼ 0:733, the motion diverges and thecantilever microbeam collapses onto the ground elec-trode (pull-in). Thus, failure of non pull-in MEMSdevices occurs under DC voltages lower than thestatic pull-in voltage when a small AC voltage issuperimposed. Response becomes dependent on theamplitude and frequency of AC excitation, and, thedirection (forward/backward) of sweep of operatingfrequency. The above findings can be effectivelyused in the design of pull-in MEMS devices likemicroswitches.
Frequency–response curves depicting stable peri-odic solutions for the DC bias of 60V and
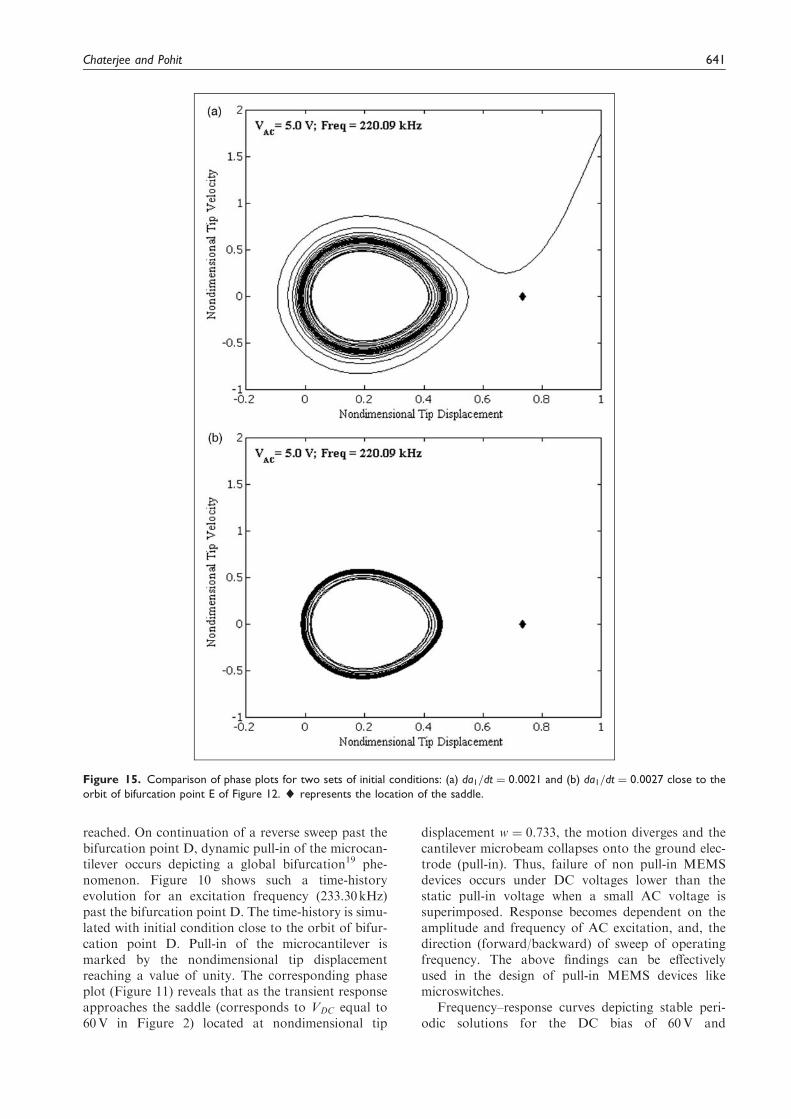
Figure 15. Comparison of phase plots for two sets of initial conditions: (a) da1=dt ¼ 0:0021 and (b) da1=dt ¼ 0:0027 close to the
orbit of bifurcation point E of Figure 12. ¨ represents the location of the saddle.
Chaterjee and Pohit 641
representative AC amplitudes higher than the dynamicpull-in voltage (1.86V) are shown in Figure 12. For ACamplitude of 2.0V, the frequency–response curve issimilar to that for 1.86V with a jump of the systemto a larger stable orbit on the upper branch in courseof forward frequency-sweep and a jump to pull-in nearprimary resonance in course of the reverse sweep. Onfurther increasing the AC amplitude, a conspicuouschange is observed near primary resonance as shownin Figure 12. For an AC amplitude of 5:0V, Figure 12shows a frequency band EF (220.08–291.74 kHz)where no stable solution of the system exist as thesystem escapes to dynamic pull-in. A forward fre-quency sweep past bifurcation point E (220.08 kHz)and a reverse sweep past bifurcation point F(291.74 kHz) result in dynamic pull-in instability. Onincreasing the AC amplitude to 6.0V, as shown inFigure 12, the frequency band further opens uparound the primary resonance and the locationsof the bifurcation points shift to higher values ofwmaxðx ¼ 1Þ. Thus, there exists a band of frequencywhere the system is most likely to experience dynamicpull-in. The band becomes wider at higher electrostaticstrengths and need to be accounted for while designingMEMS devices.
Sensitivity to initial conditions
It may be pointed out that any initial condition close tobifurcation point may not lead to pull-in. The dynamicresponse of a nonlinear system under external disturb-ance depends19 on factors like the system transientdynamics, the number of stable attractors available,and the size of the basin of attraction of each attractor.Depending upon the interaction of these factors at a
certain operating condition, the systemmay settle ontoa stable orbit or experience dynamic pull-in. Nearbifurcation points, the safe basin of attractionshrinks19 in size, and, a small variation in initial vel-ocity and displacement conditions affecting the systemtransient dynamics may bring a conspicuous change inthe system response. For example, under identical exci-tation conditions (VDC¼ 60V, VAC¼ 1.86V,Freq¼ 233.30 kHz), a variation in initial conditionclose to the orbit of bifurcation point D (Figure 9) isshown (Figures 13 and 14) to bring a qualitativechange in the system response depicted in Figures 10and 11. During simulation, if magnitude of single ini-tial condition (da1=dt) is changed from ð�0:0010Þ (cor-responds to Figures 10 and 11) to ð�0:0006Þ, the time-history (Figure 13) as well as the phase plot (Figure 14)depicts a stable and periodic motion. It is interesting tonote from the phase plot that the initial condition trig-gers a transient response that approaches very close tothe saddle followed by a retreat to settle onto a stableorbit. In order to make a comment on the possibleexistence of such a stable solution, the size of itsbasin of attraction6 needs to be estimated by long-time integration of equation (15) for various combin-ations of initial velocity and displacement conditions.The present work employs a five-mode ROM whichcorresponds to a ten-dimensional phase space.Consequently, generating the basins of attraction is anontrivial task for the present study unlike Alsaleemet al.,6 which deals with a two-dimensional phasespace. However, given the large size of the orbit(Figures 11 and 14) and the proximity to the saddle,the present analysis predicts that there exists a fairchance for the microcantilever to experience dynamicpull-in near bifurcation point D.
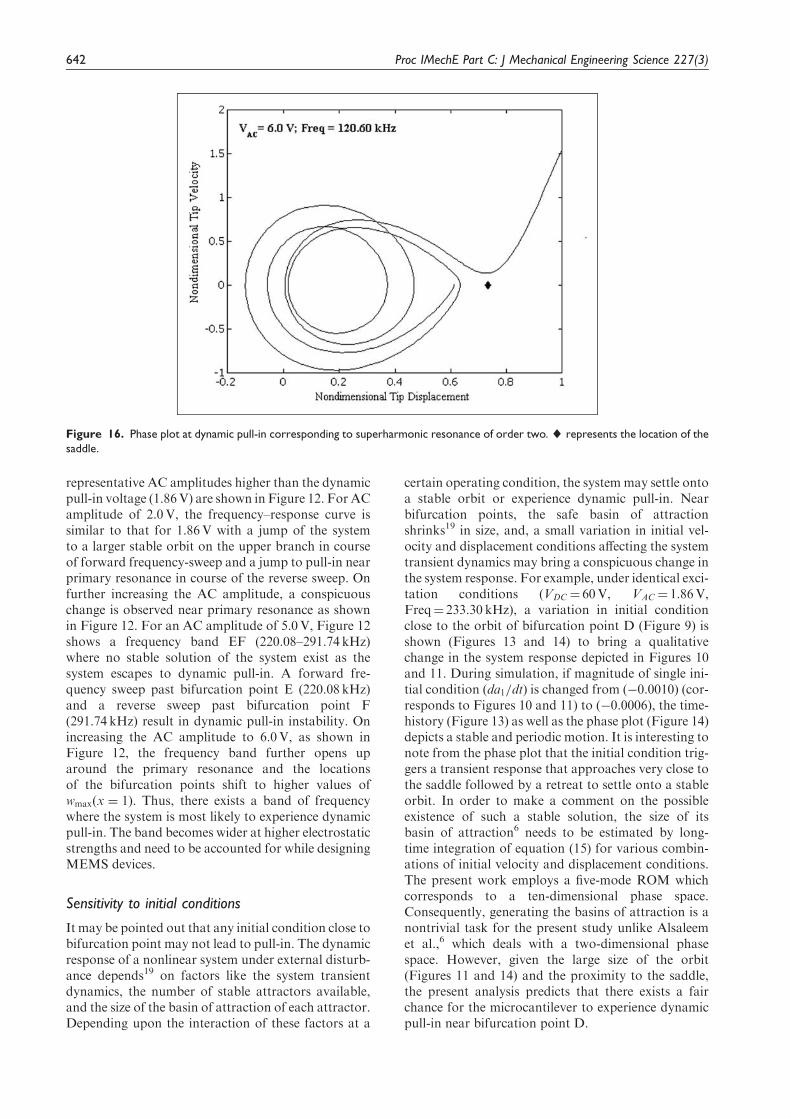
Figure 16. Phase plot at dynamic pull-in corresponding to superharmonic resonance of order two. ¨ represents the location of the
saddle.
642 Proc IMechE Part C: J Mechanical Engineering Science 227(3)
The same phenomenon is observed when simula-tion is carried out for a DC bias of 60V and ACamplitude of 5.0V. Figure 15 compares the phaseplots for an excitation frequency (220.09kHz) pastthe bifurcation point E (Figure 12) for two sets ofinitial conditions close to the orbit of bifurcationpoint E. The initial condition da1=dt is set equal to(0:0021) in Figure 15(a) and (0:0027) in Figure 15(b)while the rest of the initial conditions are kept identi-cal. As shown in Figure 15(a), the transient responseoscillates for a while as it approaches the saddle(located at w ¼ 0:733) and ultimately escapes topull-in. On the other hand, Figure 15(b) shows thatthe transient response settles onto a stable orbit quiteaway from the saddle. Thus, the frequency bands ofno stable solution shown in Figure 12 are not
necessarily the inevitable escape bands20 since inthese frequency intervals the system may acquire astable state under specific initial conditions.However, operation of a non pull-in device in thesefrequency bands will be highly unreliable and it will berelatively safer to design the operating frequenciesoutside these bands.
Superharmonic resonance
Figure 12 exhibits that superharmonic resonance oforder two is also present for a DC bias of 60V andAC amplitude of 2.0V and above. However, it isobserved that dynamic pull-in takes place duringreverse sweep past bifurcation point G (120.60 kHz)for an AC amplitude of 6.0V. Corresponding phase
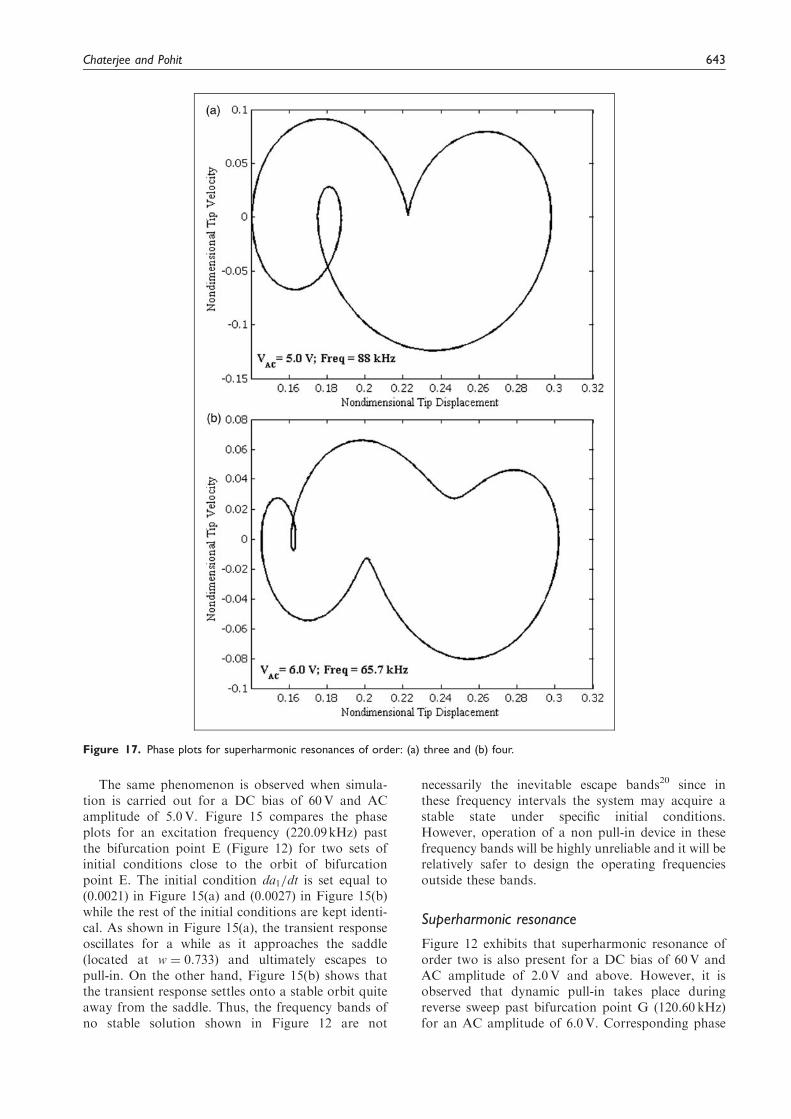
Figure 17. Phase plots for superharmonic resonances of order: (a) three and (b) four.
Chaterjee and Pohit 643
plot is shown in Figure 16. Comparison ofFigures 15(a) and 16 reveals the distinct extra loop(Figure 16) in the transient response for dynamicpull-in corresponding to superharmonic resonanceof order two. Existence of superharmonic resonancesof higher order (3rd and 4th order) is also revealed byFigure 12, and the corresponding phase plots areshown in Figure 17(a) and (b), respectively. Theabove findings further substantiate the possibilitiesof several potential applications21,22 of superharmo-nic resonances in MEMS devices.
Comparison between nonlinear and lineariseddamping models
This section presents a comparison of the dynamicbehaviour obtained with nonlinear and linearised
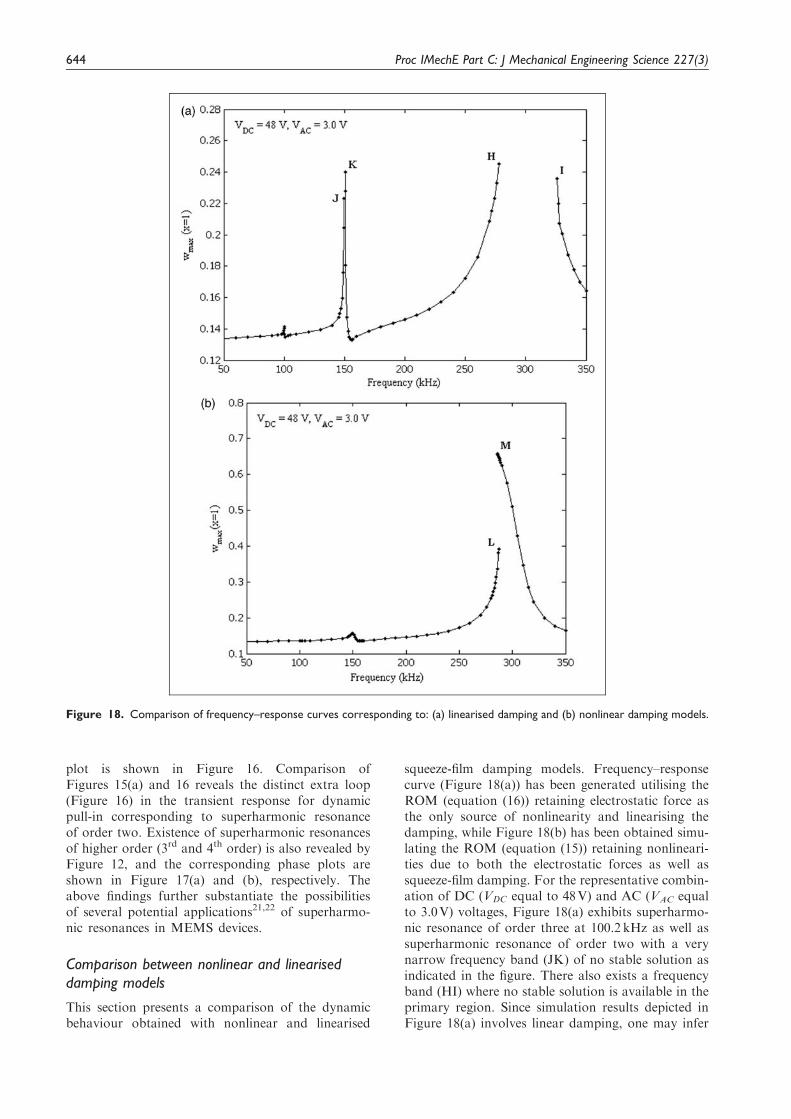
squeeze-film damping models. Frequency–responsecurve (Figure 18(a)) has been generated utilising theROM (equation (16)) retaining electrostatic force asthe only source of nonlinearity and linearising thedamping, while Figure 18(b) has been obtained simu-lating the ROM (equation (15)) retaining nonlineari-ties due to both the electrostatic forces as well assqueeze-film damping. For the representative combin-ation of DC (VDC equal to 48V) and AC (VAC equalto 3.0V) voltages, Figure 18(a) exhibits superharmo-nic resonance of order three at 100.2 kHz as well assuperharmonic resonance of order two with a verynarrow frequency band (JK) of no stable solution asindicated in the figure. There also exists a frequencyband (HI) where no stable solution is available in theprimary region. Since simulation results depicted inFigure 18(a) involves linear damping, one may infer
Figure 18. Comparison of frequency–response curves corresponding to: (a) linearised damping and (b) nonlinear damping models.
644 Proc IMechE Part C: J Mechanical Engineering Science 227(3)
that electrostatic excitation effect is the underlyingnonlinear phenomenon that determines the behaviourof the microcantilever in the primary and superhar-monic regions. On the other hand, Figure 18(b) rep-resents the simulation results of the same systemunder the same combination of DC (VDC equal to48V) and AC (VAC equal to 3.0V) voltages, theonly difference being nonlinear damping is con-sidered. Figure 18(b) reveals no appreciable peak forsuperharmonic resonance of order three while a stableresonant peak is observed for superharmonic reson-ance of order two (149.8 kHz). It is thus observed thatpresence of nonlinear damping can affect the dynam-ics of the system by suppressing much of the observed(Figure 18(a)) nonlinear phenomena. Moreover,instead of dynamic pull-in in the primary resonanceregion between H and I (Figure 18(a)), jump-up andjump-down in the response occur during frequencysweep (Figure 18(b)) beyond L and M, respectively,in the primary resonance region leading to frequencyhysteresis with large stable peak displacements(� 0:4� 0:7). Thus, nonlinear damping has not onlya stabilising effect on the dynamics of the system butalso brings a qualitative change in the response of thesystem.
Conclusions
The large amplitude dynamic behaviour of the micro-cantilever under the combined effect of DC bias andharmonic AC excitation is studied in the primary andsuperharmonic frequency range. The present model isvalid for incompressible flow in the slip-flow regime.Nonlinear phenomena of resonance-shift, jump with/without hysteresis, higher order superharmonic reson-ances, dynamic pull-in near primary as well as super-harmonic resonances, and escape frequency bandassociated with electrostatic MEMS have been pre-sented in this article. The significance of the dampingnonlinearity is also studied.
For large DC bias, the onset of local bifurcationphenomena such as resonance shift, and jumps in theresponse are observed for comparatively small ACamplitudes. Such regions of jumps and hysteresis areto be avoided while designing non pull-in devices. Onfurther increasing the AC amplitude, the systemresponse jumps to pull-in, indicating the onset of aglobal bifurcation phenomenon, typically in thecourse of reverse frequency-sweep. However, thesystem response is sensitive to initial conditions, andconsequently, the excitation that triggers dynamicpull-in may lead to a stable periodic motion for spe-cific initial conditions. This opens up a wide scope offunctionality of the same MEMS device. By suppress-ing superharmonic peaks and reducing dynamic pull-in zone, nonlinearity due to squeeze-film damping isfound to have a stabilising effect on the system whichis of practical significance for both pull-in and nonpull-in MEMS devices.
Funding
This research received no specific grant from any funding
agency in the public, commercial, or not-for-profit sectors.
References
1. Bao M and Yang H. Review of squeeze film air damp-ing in MEMS. Sensor Actuat A 2007; 136: 3–27.
2. McCarthy B, Adams G, McGruer N, et al. A dynamicmodel, including contact bounce, of an electrostatically
actuated microswitch. J Microelectromech Syst 2002;11: 276–283.
3. Krylov S and Maimon R. Pull-in dynamics of an elastic
beam actuated by continuously distributed electrostaticforce. J Vib Acoust 2004; 126: 332–342.
4. Chaterjee S and Pohit G. A large deflection model
for the pull-in analysis of electrostatically actuatedmicrocantilever beams. J Sound Vib 2009; 322: 969–986.
5. De SK and Aluru NR. Complex nonlinear oscillationsin electrostatically actuated microstructures.
J Microelectromech Syst 2006; 15: 355–369.6. Alsaleem FM, Younis MI and Ouakad HM. On the
nonlinear resonances and dynamic pull-in of electrosta-
tically actuated resonators. J Micromech Microeng2009; 19: 045013.
7. Nayfeh AH and Younis MI. Dynamics of MEMS res-
onators under superharmonic and subharmonic excita-tions. J Micromech Microeng 2005; 15: 1840–1847.
8. Nayfeh AH, Younis MI and Abdel-Rahman EM.
Dynamic pull-in phenomenon in MEMS resonators.Nonlinear Dyn 2007; 48: 153–163.
9. Mestrom RMC, Fey RHB, van Beek JTM, et al.Modelling the dynamics of a MEMS resonator: simu-
lations and experiments. Sensor Actuat A 2008; 142:306–315.
10. Harish KM, Gallacher BJ, Burdess JS, et al.
Experimental investigation of parametric and externallyforced motion in resonant MEMS sensors. J MicromechMicroeng 2009; 19: 015021.
11. Zhu J, Ru CQ and Mioduchowski A. High-order sub-harmonic parametric resonance of multiple nonlinearlycoupled micromechanical nonlinear oscillators. Acta
Mech, DOI: 10.1007/s00707-009-0242-8.12. Liu S, Davidson A and Lin Q. Simulation studies on
nonlinear dynamics and chaos in a MEMS cantilevercontrol system. J Micromech Microeng 2004; 14:
1064–1073.13. Zamanian M, Khadem SE and Mahmoodi SN.
Analysis of non-linear vibrations of a microresonator
under piezoelectric and electrostatic actuations. ProcIMechE, Part C: J Mechanical Engineering Science2009; 223: 329–344.
14. Park K, Chen Q and Lai YC. Energy enhancement andchaos control in microelectromechanical systems. PhysRev E 2008; 77: 026210.
15. Zamanian M and Khadem SE. Stability analysis of an
electrically actuated microbeam using the Melnikov the-orem and Poincare mapping. Proc IMechE, Part C: JMechanical Engineering Science 2011; 225: 488–497.
16. Liqin L, Gang TY and Zhiqiang W. Nonlinear dynam-ics of microelectromechanical systems. J Vib Contr2006; 12(1): 57–65.
17. Chaterjee S and Pohit G. Squeeze-film damping char-acteristics of cantilever microresonators for higher
Chaterjee and Pohit 645

modes of flexural vibration. Int J Eng Sci Technol 2010;2(4): 187–199.
18. Pandey AK and Pratap R. Effect of flexural modes on
squeeze film damping in MEMS cantilever resonators.J Micromech Microeng 2007; 17: 2475–2484.
19. Nayfeh AH and Balachandran B. Applied nonlinear
dynamics. New York: Wiley, 1995.20. Thompson JMT and Stewart HB. Nonlinear dynamics
and chaos. New York: Wiley, 2001.
21. Turner KL, Miller SA, Hartwells PG, et al. Five para-metric resonances in a microelectromechanical system.Nature 1998; 396: 149–151.
22. Wong AC and Nguyen CTC. Micromechanical mixers-filters (mixlers). J Microelectromech Syst 2004; 13(1):100–112.
646 Proc IMechE Part C: J Mechanical Engineering Science 227(3)


![Damped oscillations in a multiple delayed feedback NF-[Formula: see text]B signaling module](https://img.pdfslide.net/doc/110x75/634f49f3eb0b18f1440ac67d/damped-oscillations-in-a-multiple-delayed-feedback-nf-formula-see-textb-signaling.jpg)


