Embed Size (px)
Citation preview

Technical Tipslllllll
Effect of Different
Laboratory Techniques for Guanidinium-
Phenol- Chloroform RNA
Extraction on A26o/A28o and on
Accuracy of mRNA
Quantitation by Reverse
Transcriptase- PCR
Masahiko Yamaguchi, 1 Carl W. Dieffenbach, 2
Ray Connolly, 1 David F. Cruess, 3
Wendy Baur, 1 and John B. Sharefkin 1
1 Department of Surgery, New England Medical Center Hospitals, Boston,
Massachusetts, and the Departments of 2pathology and 3Biostatistics, The
Uniformed Services University of the Health Sciences, Bethesda, Maryland
A major application of PCR methods is detection of specific mRNA species and measurement of changes in mRNA transcript levels in cells and tissues by reverse transcript ion/polymerase chain reaction (RT/PCR) techniques. I1-41 Like Northern analysis, the RT/PCR method requires undegraded RNA. Obtaining RNA free of con tamina t ing genomic DNA to avoid a false signal from amplified genomic DNA is also crucial when positions of PCR primers relative to exon-exon borders in the gene being studied are u n k n o w n or when the gene has intronless pseudogene copies. Criteria for purity and intact- ness of extracted mRNA include find- ing well-defined 18S and 28S ribo- somal RNA bands by gel electrophore- sis and measurement of an A260/A280 absorption ratio of 1.7 or higher. (s)
A c o m m o n method for RNA extrac- tion is the g u a n i d i n i u m - p h e n o l - chloroform (GPC) method of Chomc- zynski et al. (6) This method and a re- lated commerical method using RNAzoI-B are stated to give RNA with A260/A280 >1.7 without the need for addit ional extraction steps. (6) Using GPC protocols, we often observed A260/A280 ratios below 1.7, despite careful avoidance of the aqueous/ organic interface when pipett ing to remove RNA after chloroform extrac- tion. Therefore, we investigated techni- cal and reagent factors that might lead to con tamina t ion of RNA using GPC methods and the comparative RT/PCR amplif icat ion efficiency and the level of genomic DNA contamina t ion of RNA specimens with widely varying absorbance ratios in the range from 1.45 to 1.99.
METHODS AND MATERIALS Cell Lines Employed Human endothelial cells (EC) were har- vested enzymatical ly from the saphe- nous vein and grown in M199 with 20% fetal calf serum (FCS) (Hyclone) conta in ing 100 Bg/ml added heparin, and with penici l l in-streptomycin, fungizone, t.-glutamine, and a bovine retinal extract conta in ing EC growth factors as previously described.(7) All experiments used third-passage con- fluent cultures grown with the same lots of FCS and retinal extract in gelatin-coated flasks.
RNA Preparation Total cell RNA was extracted by the GPC method of Chomczynski et al. ~6) Reagents were made RNase free by ei- ther double filtration through tandem 0.2-.um nitrocellulose/PVC Millex-GS filters (Millipore Corp.) or by DEPC treatment. Confluent EC monolayers in 25-cm 2 flasks were rinsed with ice- cold PBS and lysed directly in the flasks with 1 ml of denatur ing solution con- ta ining 4 M guan id in ium isothio- cyanate (Ultra Pure, BRL), 25 mM sodium citrate (Fisher Scientific) (pH 7.0), 0.5% N-lauryl sarcosine (Sigma), and 0.7 M 2-[3-mercaptoethanol (Sigma). Lysate was transferred to 5-ml polypropylene tubes, and 0.1 ml of 2 M sodium acetate (pH 4.0), 1 ml of H20- saturated phenol (Redistilled Nucleic Acid Grade, BRL), plus 0.2 ml of a 49:1 chloroform (ACS grade, Fisher Scienti- fic)/isoamyl alcohol (Sigma) mixture, was added. The mixture was vortexed for 15 sec, aliquoted into two new ep- pendorf tubes, and held on ice for 30 min. Following this, RNA extraction was accomplished in two addit ional steps.
Step A: Centrifugation Samples were centrifuged at 1.5 x 10⁴ g at 4~ for 30 min in a refrigerated mi- crocentri fuge (TOMY MTX- 150, Peninsula Laboratories, CA) using ei- ther fixed-angle (TMA-11) or swinging bucket (TMS-4) rotors.
Step B: Aqueous Phase Removal To avoid pipett ing excessively close to the aqueous/organic interface, a visual- ly estimated max imum of no more than 75% of the upper aqueous phase in each tube was removed wi th a Rainin P200 pipette, transferred to a new tube, and precipitated wi th an equal volume of isopropanol (ACS grade, Fisher) at -20~ for 2hr. After recentrifugation at 1.5 x 10⁴ g at 4~ for 30 min, the RNA pellet was dis- solved in 0.3 ml of the denatur ing so- lut ion described above and reprecipi- tated with 0.3 ml of isopropanol at -20~ for 1 hr. After a third centrifuga- tion at 1.5 x 10⁴ g at 4~ for 15 min, the RNA pellet was washed twice with 75~ ethanol, vacuum dried, and dis- solved in 30 B1 H20. UV absorption spectroscopy was performed with a DU Series 7000 Spectrophotometer (Beck-
286 PCR Methods and Applications 1:286-290�9 by Cold Spring Harbor Laboratory Press ISSN 1054-9803/92 $3.00
Cold Spring Harbor Laboratory Press on February 8, 2016 - Published by genome.cshlp.orgDownloaded from

mBIl|llll Technical Tips
man, CA) to measure A260 and A280 values.
Tests of the effect of five technical factors on the A260/A280 of RNA ex- tracted by this method were per- formed.
Test 1: Effect of Fixed-Angle Versus Swinging Bucket Rotor in Step A
To see if removal of the tube from the fixed-angle rotor and return of the in- terface angle to a level al ignment in the tube just before pipett ing caused residual contaminants to be left on the tube wall, which might thus lower the A260/A280 ratio, we compared the A260/A280 obtained with a swinging bucket versus a fixed angle rotor.
Test 2: Effect of 30 Min Versus 60 Min Initial Centrifugation Time in Step A
We also tested whether a longer (60 min) centrifugation t ime in Step A might more efficiently remove con- t aminan t material into the interface and thus raise the measured absor- bance ratio.
Test 3: Effect of Removing Aqueous Phase by Hand Pipetting or by Semiautomated Mechanical Pipetting Device in Step B A trial was done where half the samples underwent standard hand pipet t ing of the aqueous phase. The other samples were removed using the same pipette held in a vise just above a microcentrifuge tube held in a small rigid clamp adjustable by screw threads with vernier calibrations, as was the pipette plunger (Fig. 1). In this way we were able to pipette by serially advanc- ing the pipette tip only 1 m m below the surface of the aqueous phase, and then slowly wi thdrawing the plunger without vibration or malposi t io ining of the pipette tip. As in the hand pipet- t ing method, we only aspirated the up- permost 75% of the aqueous phase.
In an addit ional test of whether pipett ing too close to the interface would lower A2oo]A280, due to con- centration of con taminants just above the interface, the mechanical pipett ing device was used to remove serial 100-~1 fractions of the aqueous phase succes- sively closer to the interface (Fig. 2) and the A260/A280 of each fraction was measured.
FIGURE 1 Semiautomated mechanical pipetting device for removal of aqueous phase with minimal disturbance of aqueous/organic interface. The microadjustable vises, screw-threaded pistons for plunger control, and clamps were used to control pipette plunger and tube posi- tion within 0.5-mm tolerance during all pipetting steps. (I) Aqueous phase containing RNA. (2) Interface containing DNA and protein. (3) Organic phase.
Test 4: Effect of Method of Cell Removal
To test whether contamina t ion by gel- atin used for culture flask coating might lower A26o/A280, we performed RNA extraction from replicate cultures by trypsinization rather than direct lysis of both cells and under lying gela- tin coatings in the flask. Cells were washed 3x with cold PBS in the T-25 flasks and then collected from T-25 flasks by adding a solution of 0.005% wt/vol pure VMF trypsin (Worthington Corp.)/0.02% EDTA. The trypsin- loosened cells were washed once with 5% FCS in M199 and once with ice- cold PBS, and then pelleted at 240g at 4~ for 10 rain. The cell pellet was lysed with 1 ml of the same batch of denatur ing solution and subsequent RNA extraction clone in the same way as for cells lysed in the flask.
Test 5: Effect of Guanidinium Thiocyanate Reagent Source Since the original paper of Chomczynski et al. employed one source (Fluka) of guanidine
thiocyanate (GT), we compared RNA purity after using the GPC method with one GT brand (Fluka) for half the cells and a different brand (BRL) for replicate cell cultures.
S t a t i s t i c a l A n a l y s i s
Results were expressed as mean • but analyzed by a nonparametr ic
A260/A280 1st 100JJI : 1.81 + 0.04 (n=3) 2nd 100~JI : 1.75 + 0.05 (n=4) 3rd 100.ul : 1.85 + 0.09 (n=4) 4th 100jul : 1.83 + 0.05 (n=4)
FIGURE 2 Serial 100-~1 fractions of the aqueous phase were taken successively closer to the interface and the A260/A280 of each fraction was measured.
PCR Methods and Applications 287
Cold Spring Harbor Laboratory Press on February 8, 2016 - Published by genome.cshlp.orgDownloaded from
Technical Tipsllll|ll
method (Kruskal-Wallis analysis of variance) appropriate to a nonnormal - ly distributed ratio of two variables to compare A260/A280 ratios obtained by different techniques and reagents.
Tests for Correlation between A260/A280 Ratios and Efficiency of RT/PCR
To compare the quality of different RNA samples for mRNA detection by the RT/PCR method, we studied detec- t ion of mRNA for glyceraldehyde-3- phosphate dehydrogenase (GAPDH) because this gene is a mult icopy gene, ensuring high sensitivity for detection of con tamina t ing genomic DNA, and it has at least one intronless pseudogene copy, (8) so that spurious signal from contamina t ing genomic DNA cannot be el iminated by any choice of sense and antisense primers and must depend wholly on the extracted RNA being free of con tamina t ion by genomic DNA.
Sense and antisense primers and an oligonucleotide probe for a region be- tween the primers were chosen from a cDNA sequence for h u m a n GAPDH f9) (Table 1). Using RNA prepared by the above methods, reverse transcription was done in a 25-B1 reaction volume with 1 ug of total RNA, 500 units of MMLV-type RT enzyme (BRL), 0.5 ~g of antisense primer, and 0.5 mM each of all four dNTPs (Pharmacia) in RT buffer of 50 mM Tris/HCl (pH 8.3), 75 mM KC1, 3 mM MgC12, and 10 mM DTT. An initial mix of antisense primer, total RNA, and H20 was heated at 70~ for 6 min, and chilled on ice. RT buffer, dNTPs, DTT, and RT enzyme were then added, and incubated at 37~ for 30 min. The RT reaction was stopped by heat ing at 95~ for 10 min. Resultant GAPDH cDNA was amplified by PCR in a total volume of 100 ixl using 2 units of recombinant Thermus aquaticus DNA polymerase (Perkin- Elmer Cetus), 0.5 ~g of sense primer, 0.25 Ixg of addit ional antisense primer, and all four dNTPs (0.625 mM each) in a buffer with final concentrat ions of 22.5 mM Tris/HC1 (pH 8.3), 68.75 mM KC1, 3.25 mM MgCI2, and 0.01% gela- tin. Because we found frequent over- amplification of GAPDH product with extraneous probe-positive bands at 25 cycles or higher, we used either 16 or 20 cycles of PCR using a Perkin-Elmer
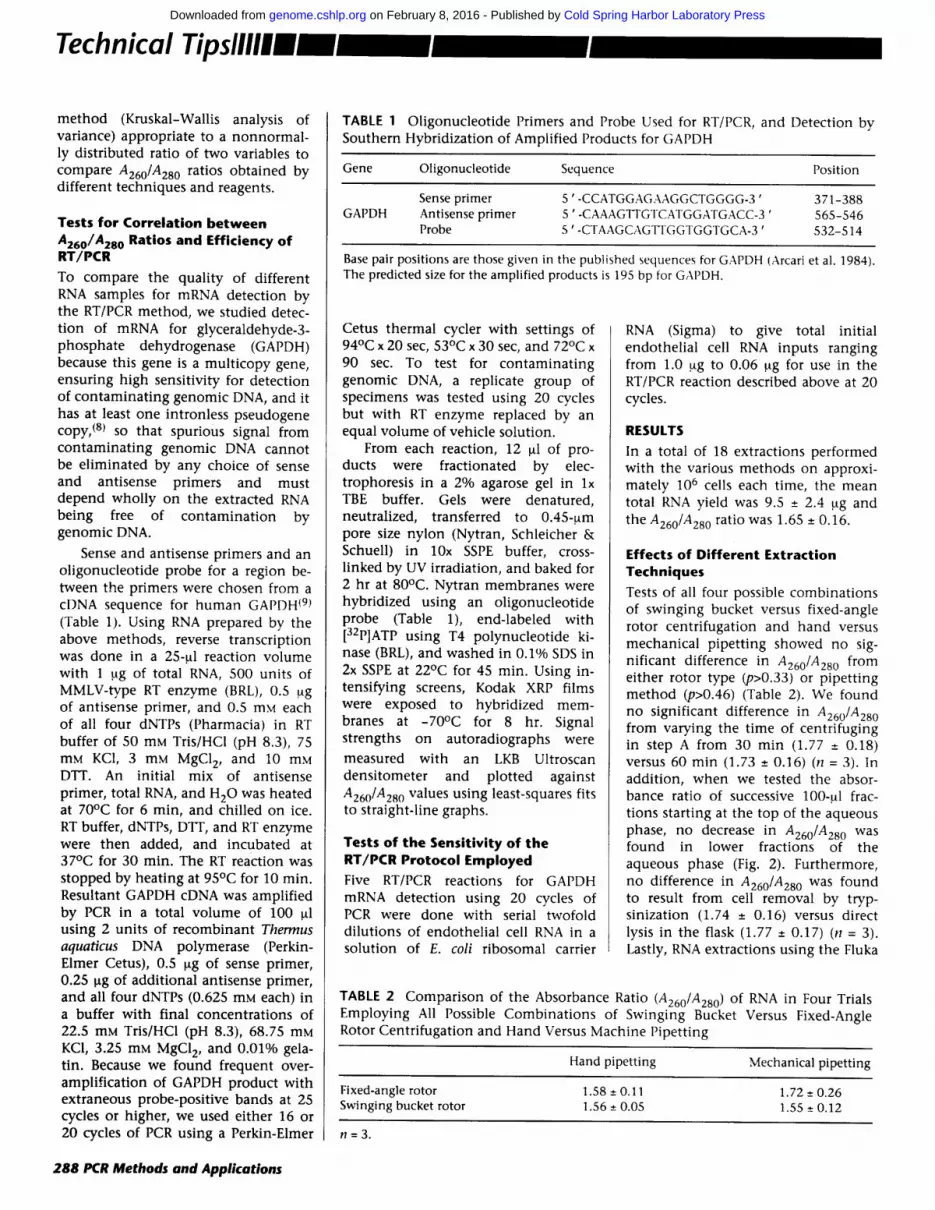
TABLE 1 Oligonucleotide Primers and Probe Used for RT/PCR, and Detection by Southern Hybridization of Amplified Products for GAPDH
Gene Oligonucleotide Sequence Position
GAPDH Sense primer 5 ' -CCATGGAGAAGGCTGGGG-3 ' 371-388 Antisense primer 5 ' -CAAAGTTGTCATGGATGACC-3 ' 565-546 Probe 5 ' -CTAAGCAGTFGGTGGTGCA-3 ' 532-514
Base pair positions are those given in the published sequences for GAPDH (Arcari et al. 1984). The predicted size for the amplified products is 195 bp for GAPDH.
Cetus thermal cycler with settings of 94~ x 20 sec, 53~ x 30 sec, and 72~ x 90 sec. To test for con tamina t ing genomic DNA, a replicate group of specimens was tested using 20 cycles but with RT enzyme replaced by an equal volume of vehicle solution.
From each reaction, 12 ~l of pro- ducts were fractionated by elec- trophoresis in a 2% agarose gel in lx TBE buffer. Gels were denatured, neutralized, transferred to 0.45-~m pore size nylon (Nytran, Schleicher & Schuell) in 10x SSPE buffer, cross- linked by UV irradiation, and baked for 2 hr at 80~ Nytran membranes were hybridized using an oligonucleotide probe (Table 1), end-labeled with [32p]ATP using T4 polynucleotide ki- nase (BRL), and washed in 0.1% SDS in 2x SSPE at 22~ for 45 rain. Using in- tensifying screens, Kodak XRP films were exposed to hybridized mem- branes at -70~ for 8 hr. Signal strengths on autoradiographs were
measured with an LKB Ultroscan densi tometer and plotted against A26o/A280 values using least-squares fits to straight-line graphs.
Tests of the Sensitivity of the RT/PCR Protocol Employed Five RT/PCR reactions for GAPDH mRNA detection using 20 cycles of PCR were done with serial twofold dilutions of endothelial cell RNA in a solution of E. coli ribosomal carrier
RNA (Sigma) to give total initial endothelial cell RNA inputs ranging from 1.0 .ug to 0.06 ~tg for use in the RT/PCR reaction described above at 20 cycles.
RESULTS In a total of 18 extractions performed with the various methods on approxi- mately 106 cells each time, the mean total RNA yield was 9.5 • 2.4 ug and the A26o/A280 ratio was 1.65 • 0.16.
Effects of Different Extraction Techniques Tests of all four possible combinat ions of swinging bucket versus fixed-angle rotor centrifugation and hand versus mechanical pipett ing showed no sig- nificant difference in A26o/A280 from either rotor type (p>0.33) or pipett ing method (p>0.46) (Table 2). We found no significant difference in A26o/A280 from varying the time of centrifuging in step A from 30 rain (1.77 • 0.18) versus 60 rain (1.73 • 0.16) (n = 3). In addition, when we tested the absor- bance ratio of successive 100-~1 frac- tions starting at the top of the aqueous phase, no decrease in A26o/A280 was found in lower fractions of the aqueous phase (Fig. 2). Furthermore, no difference in A260/A280 was found to result from cell removal by tryp- sinization (1.74 • 0.16) versus direct lysis in the flask (1.77 • 0.17) (n = 3). Lastly, RNA extractions using the Fluka
TABLE 2 Comparison of the Absorbance Ratio (A260/A280) of RNA in Four Trials Employing All Possible Combinat ions of Swinging Bucket Versus Fixed-Angle Rotor Centrifugation and Hand Versus Machine Pipetting
Hand pipetting Mechanical pipetting
Fixed-angle rotor 1.58 • 0.11 1.72 • 0.26 Swinging bucket rotor 1.56 • 0.05 1.55 • 0.12
n=3.
288 PCR Methods and Applications
Cold Spring Harbor Laboratory Press on February 8, 2016 - Published by genome.cshlp.orgDownloaded from

1111111 Technical Tips
reagent gave the A26o/A280 of 1.70 • 0.09 versus a value of 1.64 • 0.10 (n = 4) for RNA extracted using the BRL material-based reagents, showing no major differences based on the source of guan id in ium thiocyanate.
Comparison of Amplification Efficiency and Freedom from Contaminating Genomic DNA Signal Output Using RNA Samples with Varying Absorbance Ratios W h e n we ran an RT/PCR reaction to ampli fy GAPDH mRNA employing six RNA samples with widely varying A26o/A28o values obtained using the above methods, there was complete loss of GAPDH signal on Southern blots of amplif ied eDNA product in the control reactions performed without RT enzyme (Fig. 3). This confirmed that the RNA samples, despite the wide variation of their absorbance ratios, were free of detectable genomic DNA contamina t ion at 20 cycles of PCR. Whi le there was only poor correlation between signal strength and absor- bance ratio at 20 cycles of PCR (r = -0.49, p = 0.32), there was a much stronger positive correlation at 16 cycles of PCR (r = +0.71, p = 0.1). At 16 cycles, RNA samples with high A26o/A28o ratios in the range 1.7-1.9 gave approximately twice the signal strength obtained from samples with low ratios in the range 1.4-1.6 (Fig. 4). Since the mean signal strength detected with 20 cycles of PCR was 5.43-fold higher than the mean signal strength for all samples at 16 cycles, the results at 16 cycles appeared to be valid ones obtained below the plateau level of PCR amplif icat ion of GAPDH message under these conditions.
Test of the Sensitivity of the RT/PCR Method Employed Five successive serial twofold dilutions of input endothel ial cell RNA used in a 20~ RT/PCR reaction exhibited successive reductions in signal strength, and least-squares fits of densitometric signal strength versus to- tal input RNA showed strong correla- t ion to a linear plot of form [densito- metry signal = 89.5 (RNA in ~tg)-3.2, (r 2 >0.99), showing the ability of our RT/PCR protocol to detect differences
F I G U R E 3 RT/PCR reactions to detect mRNA for GAPDH were performed on six RNA samples using 16 cycles of PCR (lanes a-~), 20 cycles of PCR (lanes A-F), and 20 cycles of PCR without reverse transcriptase (lanes A' -F ' ). Sample A260/A280 values were 1.45 (lanes a, A, A ' ), 1.51
(lanes b, B, B'), 1.60 (lanes c, C, C') , 1.72 (lanes d, D, D') , 1.79 (lanes e, E, E'), and 1.99 (lanes f, Jr, F' ).
of as little as twofold in input mRNA quant i ty with a linear response of sig- nal to RNA input (Fig. 5).
DISCUSSION Variations in the purity of RNA ob- tained by GPC methods might prevent accurate mRNA quant i ta t ion if they af- fected the efficiency of RT/PCR reac- tions. Our results showing a twofold increase in GAPDH signal strength for RNA samples with higher absorbance ratios after 16 cycles of PCR (Fig. 4) suggest that this is in fact the case, be- cause the RT/PCR reaction done at 16 cycles of PCR is more likely to represent different signal strengths ac- curately than the reaction done at 20 cycles. Since our present method of performing RT/PCR can detect dif- ferences in input mRNA quant i ty of as little as twofold, the twofold variations in A26o/A280 over the range 1.4-1.9 be- tween samples might significantly dis- tort changes in mRNA transcript levels measured by RT/PCR methods. W h y samples of lower purity yielded lower signal strengths cannot be decided from these data. If the lower A260/A280 values were due to protein contamina- tion, it is possible that such proteins ei- ther included RNases that reduced mRNA input or else affected primer to target sequence b ind ing and/or en- zyme function.
These data suggest that when per- forming quanti tat ive RT/PCR experi- ments, such as drug dose-response studies comparing mRNA levels in mult iple RNA samples, it is desirable for all extracted mRNA samples to have similar A260/A280 values for a useful comparison of signal strengths from different samples. If different RNA samples are found to have significantly
varying A260/A280 values, these data suggest that addit ional phenol /chloro- form extraction steps must be per- formed to make the absorbance ratio uni formly high in all samples. With respect to DNA contaminat ion, how-
16 PCR C Y C L E S
1 1 .4
r=0.71429 D p=0.111 []
i I ~ I , I i I , I i I 1 .5 1 .6 1 .7 1 .8 1 .9 2 . 0
A26o A2so
A 2 0 PCR C Y C L E S
8 []
r=-0.48571 p=0.329
4
2 o
0 , I , 16 , I , I ~ I .4 1 .5 1. 1 .7 1 .8 1 .9
A26o
A2eo
FIGURE 4 Correlation between densito- metric signal strength of bands shown in Fig. 3 and the A260/A280 ratios of the RNA samples tested for GAPDH mRNA by the RT/PCR reactions. Least-squares fits show a positive correlation of signal strength with the A260/A280 ratio for the RT/PCR reaction performed at 16 cycles.
PCR Methods and Applications 289
Cold Spring Harbor Laboratory Press on February 8, 2016 - Published by genome.cshlp.orgDownloaded from

Technical TipslllllBi
8O
c 60
~ 4o
2 O
= . - . = .
�9 , - i , i , i . , . ,
0 . 0 0 . 2 0 .4 0 .6 0 .8 1 .0 1 .2
Total cellular RNA (gg)
FIGURE 5 Detection of GAPDH mRNA using RT/PCR performed on serial twofold dilutions of total cellular RNA to give RNA input ranging from 1.0 ~g (lane 1) to 0.06 pg (lane 5). Least-squares fits of densitometric signal strength versus total input RNA to a linear plot showed a strong positive correlation coefficient.
ever, our data showed tha t GPC method-ex t rac t ed RNA samples wi th a wide range of A260/A280 values were all free of detectable c o n t a m i n a t i o n by g e n o m i c DNA at least up to the level detected by 20 cycles of PCR and can be safely used for qual i ta t ive RT/PCR exper iments seeking to detect on ly posi t ive or absent signal for a particu- lar mRNA species. However, parallel tests for c o n t a m i n a t i n g genomic DNA using a d u m m y react ion w i t h o u t RT enzyme shou ld still be done wheneve r it is no t k n o w n if sense and ant isense pr imer pos i t ions f lank an in t ron . Our m e t h o d of test ing for DNA con t amina - t ion relied u p o n de tec t ion of the in- t ronless GAPDH gene, of wh ich on ly one copy may be present, and migh t therefore have been more sensit ive for DNA de tec t ion had extra pr imers been synthes ized to detect a sequence ent i re ly w i t h i n a k n o w n GAPDH in- t ron. Most primers, however , are no t des igned for the purpose of genomic DNA de tec t ion dur ing RT/PCR reac- t ions but for o ther criteria of amplif ica- t ion eff iciency and sequence un ique- ness; this is no t a major defect of a DNA de tec t ion m e t h o d if it can be s h o w n tha t no signal f rom DNA is added to distort RT/PCR results at the actual PCR cycle number s employed .
Our data do no t expla in w h y the GPC m e t h o d s somet imes result in total RNA samples wi th low A260/A280
values, since n o n e of the technica l var- iables s tudied was found to cause sig- n i f icant lowering of the absorbance ratio. These data do no t rule out the possibi l i ty t ha t some pro te in remains u n i n c o r p o r a t e d in the aqueous /o rgan ic interface but remains in the aqueous phase very close to the interface where major errors in h a n d p ipe t t ing migh t lead to its inc lus ion in the RNA sample. Occurrence of low values of the rat io in some RNA samples should no t affect the accuracy of RT/PCR studies if the precaut ions and extra steps listed above are kept in m i n d and used w h e n necessary.
ACKNOWLEDGMENTS
This work was suppor ted by Nat ional Inst i tutes of Heal th grant RO1- HL40680-03 to J.B.S.
REFERENCES
1. Rappolee, D.A., A. Wang, D. Mark, and Z. Werb. ] 989. Novel method for studying mRNA phenotypes in single or small numbers of cells. J. Cell. Biochem. 39: 1-11.
2. Chelly, J., J.-C. Kaplan, P. Maire, S. Gautron, and A. Kahn. 1988. Tran- scription of the dystrophin gene in human muscle and non-muscle tissues. Nature 333: 858-860.
3. Wang, A.M., M.V. Doyle, and D.F. Mark. 1989. Quantitation of mRNA by the polymerase chain reaction. Proc. Natl. Acad. Sci. 86: 9717-9721.
4. Robinson, M.O. and M.I. Simon. 1991. Determining transcript number using the polymerase chain reaction: Pgk-2, raP2, and PGK-2 transgene mRNA levels during spermatogenesis. Nucleic Acids Res. 19: 1557-1562.
5. Sambrook, J., E.F. Fritch, and T. Maniatis. 1989. Molecular cloning: A laboratory manual, 2nd ed. Cold Spring Harbor Laboratory, Cold Spring Harbor, New York.
6. Chomczynski, P. and N. 5acchi. 1987. Single-step method of RNA isolation by acid guanidinium thiocyanate- phenol-chloroform extraction. Anal. Biochem. 162: 156-159.
7. Sharefkin, J.B., H.E. Van Wart, D.F. Cruess, R.A. Albus, and E.M. Levine. 1986. Adult human endothelial cell enzymatic harvesting: Estimates of efficiency and comparison of crude and partially purified bacterial collagenase preparations by replicate
microwell culture and fibronectin degradation measured by enzyme- linked immunosorbent assay. J. Vasc. Surg. 4: 567-577.
8. Hanauer, A. and J.L. Mandel. 1984. The glyceraldehyde-3-phosphate de- hydrogenase gene family: Structure of a human cDNA and of an X chromo- some linked pseudogene; amazing complexity of the gene family in mouse. EMBO J. 3: 2627- 2633.
9. Arcari, P., R. Martinelli, and F. Salvatore. 1984. The complete se- quence of a full length cDNA for human liver glyceraldehyde-3-phos- phate dehydrogenase: Evidence for multiple mRNA species. Nucleic Acids Res. 12: 9179-9189.
10. Feldman, A.M., P.E. Ray, C.M. Silan, J.A. Mercer, W. Minobe, and M.R. Bristow. 1991. Selective gene expres- sion in failing human heart; quantifi- cation of steady-state levels of mes- senger RNA in endomyocardial biop- sies using the polymerase chain reac- tion. Circulation 83: 1866-1872.
Received September 16, 1991; accepted in revised form January 16, 1992.
290 PCR Methods and Applications
Cold Spring Harbor Laboratory Press on February 8, 2016 - Published by genome.cshlp.orgDownloaded from

10.1101/gr.1.4.286Access the most recent version at doi:1992 1: 286-290 Genome Res.
M Yamaguchi, C W Dieffenbach, R Connolly, et al. on accuracy of mRNA quantitation by reverse transcriptase-PCR.guanidinium-phenol-chloroform RNA extraction on A260/A280 and Effect of different laboratory techniques for
References
http://genome.cshlp.org/content/1/4/286.full.html#ref-list-1
This article cites 9 articles, 3 of which can be accessed free at:
License
Commons Creative
http://creativecommons.org/licenses/by-nc/3.0/.described at
a Creative Commons License (Attribution-NonCommercial 3.0 Unported License), as ). After six months, it is available underhttp://genome.cshlp.org/site/misc/terms.xhtml
first six months after the full-issue publication date (see This article is distributed exclusively by Cold Spring Harbor Laboratory Press for the
ServiceEmail Alerting
click here.top right corner of the article or
Receive free email alerts when new articles cite this article - sign up in the box at the
http://genome.cshlp.org/subscriptionsgo to: Genome Research To subscribe to
Copyright © Cold Spring Harbor Laboratory Press
Cold Spring Harbor Laboratory Press on February 8, 2016 - Published by genome.cshlp.orgDownloaded from


![Investigation of factors affecting fluorometric quantitation of cytosolic [Ca2+] in perfused hearts](https://img.pdfslide.net/doc/110x75/634ddcabd38be601b805ed3b/investigation-of-factors-affecting-fluorometric-quantitation-of-cytosolic-ca2.jpg)


