Embed Size (px)
Citation preview

DOI: https://doi.org/10.1590/1980-5373-MR-2020-0335Materials Research. 2021; 24(2): e20200335
Effect of Ti on Microstructure, Mechanical Properties and Corrosion Behavior of a Nickel-Aluminum Bronze Alloy
Pedro J. Riveroa* , C. Berlangaa , J. F. Palaciob , M. V. Biezma-Moraledac
aPublic University of Navarre, Materials Engineering Laboratory, Department Engineering, Campus Arrosadía S/N, 31006, Pamplona, Spain
bCentre of Advanced Surface Engineering, AIN, 31191, Cordovilla, Pamplona, SpaincUniversity of Cantabria, Department of Earth, Materials Science and Engineering, 39004,
Santander, Spain
Received: July 25, 2020; Revised: January 08, 2021; Accepted: February 07, 2021
Nickel-aluminum bronze (NAB) alloys are suitable, in cast condition, to be used in marine propellers due to its excellent behavior avoiding erosion and cavitation as well as corrosion. A complex microstructure, intrinsic to this copper base system, is the result of a well-controlled chemical composition. There are few works related to the effect of adding small quantities of specific chemical elements on NAB alloys properties. The aim of this paper is to study the effect of Ti on the microstructure, mechanical properties, and corrosion behavior of a particular NAB alloy, CuAl10Fe5Ni5 (C95500), and the comparison to the Ti-free NAB alloy. Although the as- cast microstructure is very similar for both materials, the addition of only 120 ppm Ti leads to a significant grain refinement that plays a key role on the mechanical properties. It has been observed an increase in both microhardness and nanohardness as well as in the resultant Young moduli values, meanwhile no significant impact on the corrosion susceptibility has been observed.
Keywords: Nickel–aluminum bronze (NAB), microstructure, grain reinforcement, nanohardness, corrosion
1. IntroductionNickel-aluminum bronze alloy (NAB) is a copper-based
alloy, which contains aluminum, nickel, iron, manganese, and other minor elements. It is widely used in marine engineering applications such as marine propellers, valves, etc. due to an excellent balance between seawater corrosion resistance and mechanical properties, in scenarios wherein erosion, erosion-corrosion and cavitation take place1-5. In addition, several works are also focused on enhancing mechanical properties or even corrosion resistance by using different heat treatments or hot rolling processes6,7. The main reason for the high corrosion resistance of NAB alloys has been related to the development of a protective layer of around 1 µm in thickness, rich in aluminum and copper oxides8, that is firmly adhered to the base material, and hence, providing low corrosion in natural water. However, there are different service conditions leading NAB alloys to suffer severe corrosion: P. Linhardt detailed localized corrosion in NAB in a hydropower plant9, H. N. Krogstad and R. Johnsen10 addressed pitting corrosion in CuAl10Fe5Ni5 galvanically coupled to AISI 316 stainless steel in seawater due to the selective attack of alpha phase at the bottom of the pitting. B.-B. Zhang et al.11,12 showed that selective corrosion is highly dependent on the pH and a corrosion wear mechanism was proposed, concluding that the tribocorrosion behavior of NAB alloy in seawater is closely related to the halide-ion concentration.
The most widely used NAB alloy is CuAl10Fe5Ni5 alloy (C95500), in cast condition, with a well-defined complex microstructure of α and β solid solution phases together with different forms of the intermetallic κ phases which present different chemical compositions13. It have been observed that this multiphase system is prone to suffer from corrosion failure, because there is an important effect of electrolyte composition leading to a change from passive to localized corrosion due to the different corrosion susceptibility of the individual phases14,15. This non homogeneous distribution of phases at room temperature has been formed during the solidification of the melt, resulting in phases with different amounts of alloying elements and hence showing, after thermal treatments, different corrosion morphologies16,17.
Corrosion resistance of NAB can be clearly improved by using different chemical or thermal strategies: Quin et al.18 detailed that chromium ion implantation onto an as-cast nickel-aluminum is an efficient alternative in a 3.5% NaCl solution; Wu et al.16 have studied the effect of different thermal treatments onto microstructure, mechanical properties and corrosion behavior, pointing out that erosion-corrosion resistance is improved by increasing hard phases such as β´; Murray et al.19 have recently shown that net-shape dense NAB using Surface Laser Melting manufacture presents superior mechanical strength and corrosion resistance in sea water than wrought or cast NAB. Lu et al.20 addressed the way that a Friction Stir Processed NAB, FSP, provokes an important *e-mail: [email protected]

Rivero et al.2 Materials Research
effect on microstructure with strengthening mechanisms due to grain refinement and second phase strengthening, providing good fatigue properties, since fatigue cracks can develop from surface shrinkage cavities produced in the casting process, as it has been observed by Taylor et al.21, then penalizing the service life of the components. Hazra et al.22 reported a failure of NAB due to multivariable causes prevailing cast defects. And Vazdirvanidis et al.23 have evaluated the failure and fracture analysis of a high-alloy Ni-Al bronze chain connector of a tube drawing machine, indicating that the fracture occurred by fatigue due to the combined result of poor machining quality and the brittle nature of the as-cast component. Oh-ishi et al.24 addressed the way that application of FSP to a cast NAB induces to a selective modification of the near-surface layers of material, associated with local microstructural changes.
Some strategies have been proposed to change grain size and optimize microstructure against some potential service problems. Moussa et al.25 used High Intensity Ultrasonic Treatment (HIUST) at different pouring temperatures during the casting process, performing an important refinement of the phases that might cause problems, and achieving an equiaxial distribution of alfa phase with direct impact on hardness. Wang et al.26 have evaluated the residual stress and microstructure evolution of shot peened Ni-Al bronze at elevated temperatures. The results indicate that the residual has not been released completely even at the highest aging temperature, which means that shot peening could enable Ni-Al bronze alloys to keep excellent thermal stability of beneficial compressive residual stress.
It is important to point out that little work has been done to evaluate the effect of the alloy content on the mechanical and corrosion properties of NAB alloys. Amongst them, Yang et al.27 considered Ni content effect and observed that the higher the Nickel content, the better the corrosion resistance of NAB because the percentage of the penalizing phase, β´ , decreases and a more stable protective oxide layer is developed. R. Manikandan et al.28 discussed the effect of the presence of Yttrium and Niobium on the mechanical properties of a NAB.
Also, very few studies focused on the effectiveness of nucleating agents in copper alloys have been published: Sadayappan et al.29 reported that boron and zirconium were the most effective grain refiners in yellow brass and silicon bronzes; Feng et al.30,31 detailed a novel method to improve the underwater performance of laser cladded NAB by adding titanium. The study relied on the effect of this alloying element on the constitution of the different phases , microstructure and corrosion resistance showing that plays a refinement role on surface because it induces a faster cooling rate; Zhao et al.32 observed selective phase grain refinement mechanisms in NABs. Finally, up to now, the effect of small amounts of titanium on the mechanical properties and corrosion resistance of these NABs has not been studied, considering the high impact of minor chemical composition changes on the said properties. Thus, the aim of this work is to assess the effect of the addition of 120 ppm of titanium as it is a powerful deoxidant during the casting of NAB alloys.
2. Materials and methodsIn this work, two NAB alloys (denoted as NAB alloy A
and NAB alloy B, respectively) have been manufactured by sand casting, followed by a dehydrogenation treatment in order to ensure a hydrogen content of less than 0.9 ppm. The chemical composition of both NAB alloys, in weight percentage, is Cu 79.8%, Al 9.5%, Fe 4.8%, Ni 4.6% and Mn 1.3%, respectively. However, in NAB alloy B a relatively small amount of Ti (120 ppm) has been added to evaluate its effect on the corresponding mechanical as well as corrosion properties. Wartsila Iberica S.A. provides specimens with its own chemical composition attending different and specific protocols. The composition analysis of the NAB samples have been performed by an inductively coupled plasma atomic emission spectroscopy (ICP-AES), whereas C was measured by Infrared (IR) absorption spectra. An addition check has been also performed in order to corroborate the carbon content determined by LECO analysis.
2.1. Morphological and chemical characterization
Metallographic preparation of the NAB samples included grinding from P120 to P1200 gritt using SiC abrasive papers with a final stage using diamond dispersion of 1 µm, to ensure mirror surface finish. In order to reveal the microstructure of both types of NAB samples, iron chloride and cupric ammonium chloride have been used as etching solutions. An Olympus image analysis software have been used to quantify the content of the different phases as well as the grain size, and a Hitachi S4800 Scanning Electron Microscope (SEM) have been used to obtain high resolution images of the surface. In the case of the backscattered images (BSE), the different chemical composition of the grains on the surface provides chemical contrast - the lighter the compound is, the darker it is shown on the image. It is coupled with an Oxford Instruments Energy Dispersive X-ray detector (EDX) that presents the mapping distribution of the different elements and the different spectra, offering accurate identification of the elements in the selected spot. In addition, X-ray diffraction (XRD) analysis has been performed to corroborate the presence of the different phases and the corrosion products after corrosion tests for NAB A and NAB B samples. A Bruker D8 Discover machine equipped with a Cu source (λKα1= 1.5406 Å; 40 kV; 30 mA) under Bragg-Brentano configuration was used. A scan covering 2ϴ angles from 30˚ to 90˚ at a scan rate of 0.02˚ every 10 seconds was performed on each sample.
2.2. Mechanical characterizationNanoindentation was performed using a Hysitron TI950
fitted with a Berkovich pyramid of 150 nm tip radius on the etched samples. A matrix of seven by seven indents, with a separation between them of 75 µm, has been done on each sample. The maximum load was 1000µN for all indents, with a loading ramp of 5 seconds, 2 seconds holding time and 5 seconds of unloading segment. Average values out of the forty-nine indents have been extracted for each sample using the Oliver and Pharr method33. Finally, Vickers microhardness at 30 gF load were also performed in order to determine the mechanical properties of the NAB samples.

3Effect of Ti on Microstructure, Mechanical Properties and Corrosion Behavior of a Nickel-Aluminum Bronze Alloy
2.3. Corrosion characterizationImmersion corrosion tests were carried out in a 3.5 wt. %
sodium chloride (NaCl) solution for a period of 720 hours. Experimental samples were immersed in 100 mL of solution and kept at the room temperature, being the ratio of surface area to solution volume 1:35 cm2/mL, respectively. After immersion, the samples were dried, and the degradation rate was determined by measuring the total weight loss from the samples. In addition, electrochemical corrosion tests using the Tafel extrapolation method have been done in order to determinate the corrosion rate (mm/year) of the samples. For this purpose, Autolab PGSTAT30 galvanostat/potentiostat system has been used at room temperature. The experiments were conducted with a three electrodes system composed of NAB alloys as the working electrode (WE), platinum wire as a counter electrode (CE), and an Ag/AgCl electrode as the reference electrode (RE). Before conducting all the experiments, the samples were immersed in the 3.5 wt.% NaCl electrolyte solution for 1 hour to make sure that the system was in steady state with the aim to stabilize the open circuit potential (OCP). The Tafel polarization measurements were obtained by scanning the electrode potential automatically from -150 to +150 mV at a scan rate of 0.5 mV.s-1, respectively. Finally, the corrosion products formed in these tests have been identified in the outer surface of the NAB samples by means of the Scanning Electron Microscopy fitted with the X-ray probe for chemical elements identification and X-ray diffraction (XRD) analysis.
3. Results
3.1. Morphological and chemical characterization
Firstly, the presence of various intermetallic kappa compounds (denoted as KI, KII, and KIII respectively) can
be easily identified on the SEM images as well as the corresponding alpha phase (see Figure 1). These intermetallic kappa compounds show a specific well-defined morphology, location and distribution in the structure which can be perfectly observed in NAB samples. According to this, the intermetallic KI compounds are easily recognized by its characteristic rosette morphology, whereas the intermetallic KII compounds show a well-defined rounded morphology and the intermetallic KIII compounds have precipitated as lamellar phase. In Figure 1b and 1d details of the previous images for both NAB alloy A and B can be observed.
The Energy Dispersive X-Ray (EDX) spectroscopy reveals that KII and KIII are nickel-rich precipitates based on NiAl in comparison to KI intermetallic compounds, which is richer in iron and based on Fe3Al. In Figure 2, the location of the analyzed areas is shown and in Table 1 the local EDX point analysis related to the different intermetallic compounds for the NAB alloy A is presented.
One aspect to highlight is that in the NAB alloy B, only intermetallic compounds corresponding to KI and KII morphologhies (rossette and rounded shapes respectively) are observed, whereas KIII morphologies are not that evident, as it can be appreciated in the SEM images of Figure 3 and in the corresponding EDX analysis in Table 2, respectively. KI with rossette morphology shows a high percentage (wt.%) in Fe, whereas KII with spherical morphology has a a high percentage in Ni in comparison with KI interemetallic compound,
Table 1. Local EDX point analysis of the alloy components (wt. %) detailed in Figure 2.
Spectrum Al Mn Fe Ni Cu Phase1 13.38 1.28 63.81 13.95 5.58 KI
2 20.54 1.19 12.50 31.36 34.42 KII
3 18.12 1.11 11.74 30.52 38.52 KIII
4 13.69 0.82 2.02 13.93 69.53 α
Figure 1. Backscattered electron (BSE) micrographs of the studied alloys: (a, b) NAB alloy A and (c, d) NAB alloy B. The white squares on the left images mark the areas that have been zoomed out on the right images.

Rivero et al.4 Materials Research
Table 2. Local EDX point analysis of the alloy components (wt. %) detailed in Figure 3.
Spectrum Al Mn Fe Ni Cu Phase
5 11.01 0.83 66.70 7.23 12.78 KI
6 14.25 1.40 46.18 12.93 24.05 KI
7 16.41 1.21 30.14 19.78 32.08 KII
8 11.89 1.03 7.31 7.03 72.53 α
Figure 3. Backscattered electron (BSE) micrographs of the NAB alloy B with the presence of the different Kappa intermetallic compounds with their corresponding morphology such as rosette (a, b), spheroidal (c) and alpha phase (d) with their corresponding area locations for the EDX compositional chemical analysis in the NAB alloy B.
Figure 2. Backscattered electron (BSE) micrographs of the NAB alloy A with the presence of the different Kappa intermetallic compounds with their corresponding morphology such as rosette (a), spheroidal (b), lamellar (c) and alpha phase (d) with their area locations used in the EDX compositional chemical analysis for NAB alloy A.
as was previously stated for NAB alloy A. After observing the chemical composition in both Tables, alpha phase in alloy A unbalanced the Ni and Fe content, in relation to alloy B where Ni/Fe content is close to 1. Meanwhile, Al and Mn content are similar in both alloys. This aspect could be associated to Ti as nucleates that favoured a different distribution of rich Ni and Fe kappa phases controlling the chemical composition of alpha phase in relation NAB alloy A. In addition, its notorious

5Effect of Ti on Microstructure, Mechanical Properties and Corrosion Behavior of a Nickel-Aluminum Bronze Alloy
3.2. Mechanical characterizationThe experimental results obtained from Vickers microhardness
measurements indicate that there is an important difference in the obtained hardness values. According to this, a higher value of microhardness has been observed for NAB alloy B in comparison to the NAB alloy A, showing a rise in microhardness from 172.89 HV (NAB alloy A) to 206.89 HV (NAB alloy B), implying an increase of 19.6%. The main conclusion that can be extracted from this experimental result is that titanium (Ti) is an effective reinforcing element. Optical microscopy images for both NAB samples allow clearly observing that the addition of Ti leads to an important change in the final microstructure (Figure 5), since an important grain size refinement is observed in the NAB alloy B.
According to the ASTM E 112-12, titanium has acted as a powerful grain refiner since NAB alloy B has a significantly smaller grain size (G=8.9) in comparison with NAB alloy A (G=6.7), being this grain refinement in the alpha phase, rich in Cu.
In addition it can be observed greater fraction area as clusters of smaller particles in alloy B in relation to alloy A due to a possible second phase arrangement and particular role of each phase, in the way observed by other authors34 where the grain refinement in the α phase involves dislocation segmentation in the precipitation-free zone and the twinning intersection in the precipitation zone. So, it can be concluded that the twinning and dislocation deformation associated to the presence of κ phases, in particular to the distorted lamellar KIII phase35, induces a severe influence on second phase fraction in final microstructure. Figure 5 details with rectangles these selected areas.
As a confirmation of the effects of the previously mentioned grain refinement due to the addition of only 120 ppm of titanium, and following the same trend indicated by the microhardness results, Figure 6 shows the results of nanoindentation tests up to a final load of 1 mN. A specific hardness of 4.46 GPa has been obtained for NAB alloy B (black plot), whereas a hardness value of 3.72 was reached for NAB alloy A (blue plot), also a rise of around 20% in nano-hardness. In addition, the unloading curves showed a high elastic behavior for both surfaces although the final depth was slightly smaller for NAB alloy B in comparison to the NAB alloy A. Moreover, the Young modulus for NAB alloy B is also higher, with a value of 143.7GPa, than that of NAB
Figure 4. XRD spectra for NAB alloy A (black plot) and NAB alloy B (red plot), respectively. In the insert, a zoomed view of the peak at approx. 65º showing a peak related to KIII intermetallic compounds in the Alloy A that is not as evident in Alloy B.
that Kappa phases are more susceptible to Ni content changes, in particular KII and KIII, respectively.
Finally, it should be noted that no titanium has been detected in any of the microanalysis carried out, which indicates that this element has been dissolved in the alpha phase and therefore has not precipitated, or even it could be under the limit of detection related to the EDX analysis. In addition, the XRD spectra also confirm that both NAB alloys show the same crystallographic peaks related to alpha (α) phase, whereas a small difference can be observed for the intermetallic compounds because a slight peak for a value of 2θ around of 65˚ is clearly observed for NAB alloy A but not for alloy B (see inset Figure 4). This peak can be associated to the KIII intermetallic compound. Other aspect to remark is that both alloys present similar sizes for all the intermetallic particles, no matter which type intermetallic we refer to. The area fraction for the bigger particles is similar in both samples too, 1.9% for NAB A and 2.5% for NAB B. On the contrary, the area fraction for the smaller particles is quite different in both materials, being 9.3% for NAB A and 16% for NAB B. The main contribution to the difference between the two is probably a much higher amount of KII in NAB B as it has been already demonstrated by the XRD spectrum of the Figure 4 that the NAB A presents a higher amount of KIII (visible peak around 64º for NAB A and less evident for NAB B).
Figure 5. Optical images of both NAB samples for NAB alloy A (left) and NAB alloy B with Ti (right) (scale bar 200 µm) with their corresponding difference in the grain size and size fraction areas of particles.

Rivero et al.6 Materials Research
alloy A, presenting on its side a value of 118.5 GPa. Finally, in Table 3 it is summarized the corresponding microhardness Vickers (HV), hardness values (H) and the Young modulus (E) values derived from nanoindentation tests and the relationship with their corresponding grain size.
Despite the differences in the values of hardness and Young’s modulus, both alloys show very similar H/E ratios, which would indicate the resistance to elastic deformation; H/E2 which is related to the wear resistance, and H3/E2 which would be related to the ability of dissipate energy in plastic deformation. Finally, after observing these experimental results, no significant differences in the chemical composition have been observed; nevertheless a higher fraction of smaller particles in alloy B could justify the different behavior. In addition, the solidification process has been performed
under the same cooling conditions in both NAB samples and cutting has been done in the identical direction free of solidification defects. Therefore it can be concluded that the resultant increase in mechanical properties of material can be associated to both microstructural factors: minor grain size and presence of a higher area fraction of smaller particles observed in alloy B in relation to alloy A. Nevertheless, the nature of the weight of each variable is difficult to assess since NAB alloys presents a complex and heterogeneous multiphase system36. The copper solid solution matrix, or α phase is mainly soft, while the intermetallic κ phases possess hard and brittle nature37. These different cluster distribution of K phases could lead to different mechanisms of reinforcement in both studied NAB alloys.
3.3. Corrosion characterizationFirst of all, the weight loss of the NAB samples has
been measured after one-month immersion in 3.5 wt.% NaCl electrolyte solution. The experimental results indicate that in both alloys the weight loss has been low, although titanium-containing alloy (NAB alloy B) shows a slightly better overall corrosion resistance (0.020%) than Ti-free alloy (0.034%), respectively. A statistical analysis according to Fisher’s least significant difference (LSD) procedure has been performed. The experimental data has been found that there are no significant differences in mass loss at a confidence level of 95% in both NAB samples, respectively. In addition, an aspect to remark is that after immersion corrosion test, the corrosion products have been easily removed without showing any sing of pitting corrosion in the surface of the samples. Due to this, it can be concluded that both NAB samples have suffered general corrosion and the Tafel extrapolation method has been performed in order to determine the overall corrosion rate (see Figure 7). In both cases, the polarization curves are associated to the formation of copper oxides (CuO and Cu2O). In addition, a similar value of corrosion rate (mm/year) and polarization resistance (Rp) have been obtained for both NAB samples, which it is indicative of no significant differences observed after the electrochemical corrosion tests. Nevertheless, in the current densities from 10-8 A/cm2 to 10-6 A/cm2, according Figure 7, variations in anodic behavior can be seen in both materials which could be related to local breaks in the protective layer and/or selective corrosion of some of the alloy phases. In addition, it is well known that the kappa phases are anodic with respect to the alpha phase, but within them, recent studies have shown with Volta potential maps that the most anodic is the KI phase. Due to this, it can be deduced that despite the maximum Volta potential differences between constituents of NAB are
Figure 6. Nanoindentation curves for a final load of 1 mN in the NAB alloy A (blue plot) and in the NAB alloy B (black plot), respectively.
Table 3. Summary of the experimental data derived from the mechanical tests such as nanoindentation curves with their corresponding values of hardness as well as Young modulus and microhardness Vickers (HV) with its relationship with the resultant grain size obtained by ASTM E112-12, respectively.
Type of sample HV30gF
Hardness (GPa)
Young modulus (GPa) H/ E H/E2 H3/E2 Grain size
(G)NAB alloy A 172.46 ± 23.5 3.72 ± 0.80 118.5 ± 18.8 0.031 ± 0.004 0.00026 ± 0.0004 0.0037 ± 0.0016 6.7 ± 0.3NAB alloy B 206.89 ± 20.2 4.46 ± 0.81 143.7 ± 21.7 0.031 ± 0.004 0.00021 ± 0.0005 0.0043 ± 0.0018 8.9 ± 0.4
Figure 7. Tafel polarization curves corresponding to NAB samples tested in 3.5 wt.% NaCl solution for NAB alloy A (orange plot) and NAB alloy B (blue plot), respectively.
7Effect of Ti on Microstructure, Mechanical Properties and Corrosion Behavior of a Nickel-Aluminum Bronze Alloy
Table 4. Summary of the experimental data derived from the corrosion immersion test and potentiodynamic polarization curves of the Tafel method.
Type of sample
Weight loss (immersion test)
Open Circuit Potential (OCP)
Corrosion rate (mm/year)
Polarization resistance (Ω.cm-2)
NAB alloy A 0.034% -150 mV 0.021 2.4x10⁵
NAB alloy B 0.020% -148 mV 0.023 2.1x10⁵
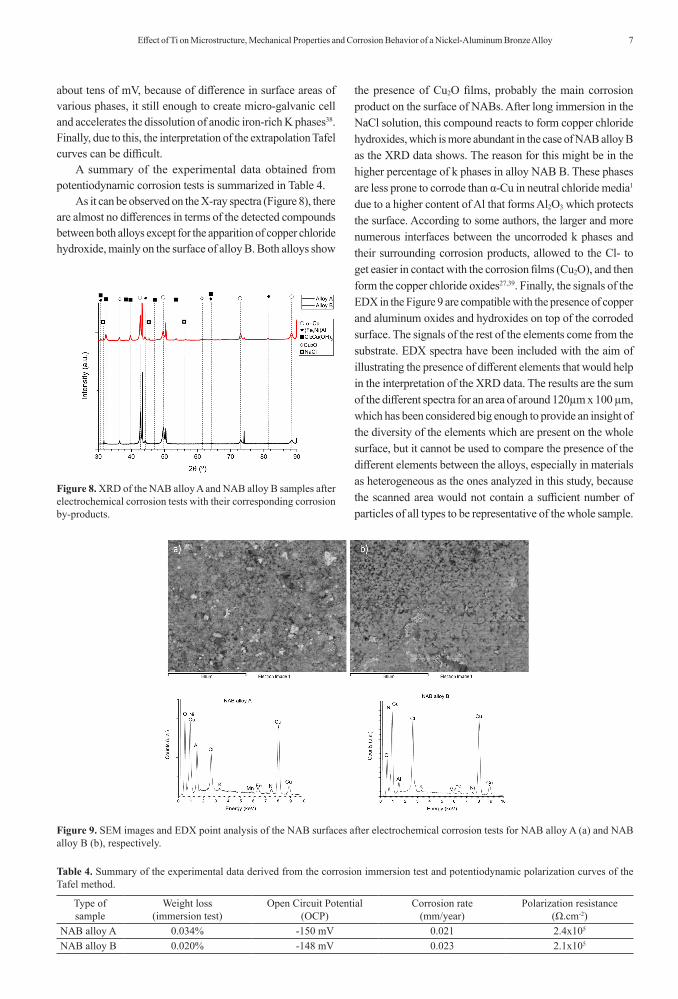
Figure 8. XRD of the NAB alloy A and NAB alloy B samples after electrochemical corrosion tests with their corresponding corrosion by-products.
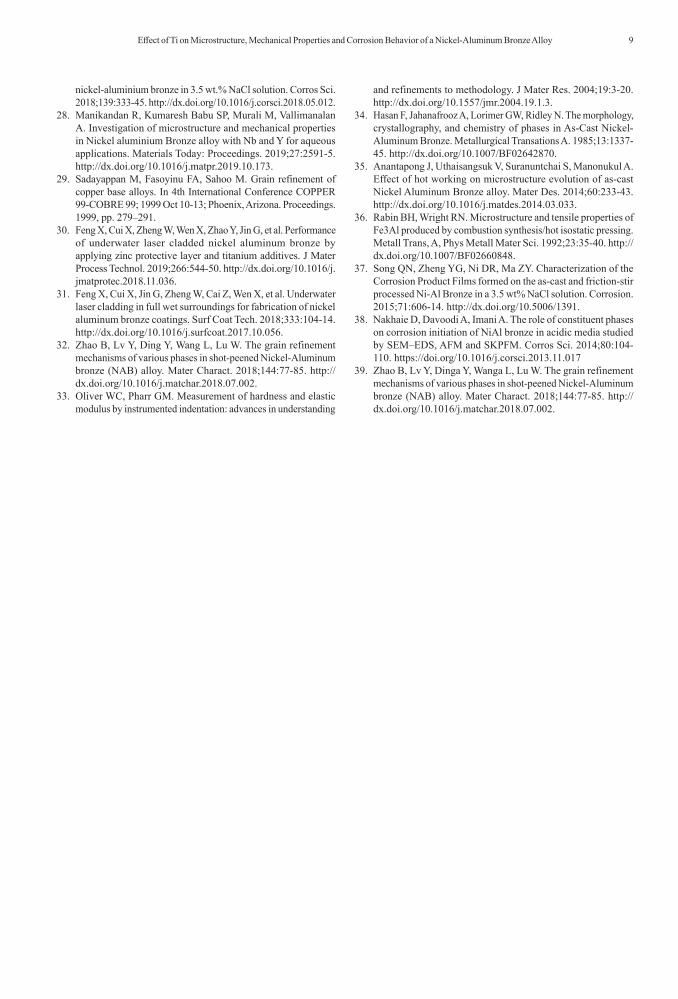
Figure 9. SEM images and EDX point analysis of the NAB surfaces after electrochemical corrosion tests for NAB alloy A (a) and NAB alloy B (b), respectively.
about tens of mV, because of difference in surface areas of various phases, it still enough to create micro-galvanic cell and accelerates the dissolution of anodic iron-rich K phases38. Finally, due to this, the interpretation of the extrapolation Tafel curves can be difficult.
A summary of the experimental data obtained from potentiodynamic corrosion tests is summarized in Table 4.
As it can be observed on the X-ray spectra (Figure 8), there are almost no differences in terms of the detected compounds between both alloys except for the apparition of copper chloride hydroxide, mainly on the surface of alloy B. Both alloys show
the presence of Cu2O films, probably the main corrosion product on the surface of NABs. After long immersion in the NaCl solution, this compound reacts to form copper chloride hydroxides, which is more abundant in the case of NAB alloy B as the XRD data shows. The reason for this might be in the higher percentage of k phases in alloy NAB B. These phases are less prone to corrode than α-Cu in neutral chloride media1 due to a higher content of Al that forms Al2O3 which protects the surface. According to some authors, the larger and more numerous interfaces between the uncorroded k phases and their surrounding corrosion products, allowed to the Cl- to get easier in contact with the corrosion films (Cu2O), and then form the copper chloride oxides27,39. Finally, the signals of the EDX in the Figure 9 are compatible with the presence of copper and aluminum oxides and hydroxides on top of the corroded surface. The signals of the rest of the elements come from the substrate. EDX spectra have been included with the aim of illustrating the presence of different elements that would help in the interpretation of the XRD data. The results are the sum of the different spectra for an area of around 120µm x 100 µm, which has been considered big enough to provide an insight of the diversity of the elements which are present on the whole surface, but it cannot be used to compare the presence of the different elements between the alloys, especially in materials as heterogeneous as the ones analyzed in this study, because the scanned area would not contain a sufficient number of particles of all types to be representative of the whole sample.

Rivero et al.8 Materials Research
4. ConclusionsIn this work, it has been presented a comparative study
between two different NAB samples with a slightly change on chemical composition based on the addition of 120 ppm of Ti. The SEM images, EDX and XRD results have shown the presence of different kappa intermetallic compounds in each sample with different chemical compositions. In addition, the microhardness and nanohardness tests have corroborated that the sample composed of Ti presents better mechanical properties with a higher value of hardness and Young modulus which is associated to a grain size reduction of the NAB sample with Ti. Finally, after performing electrochemical corrosion and immersion tests, the addition of 120 pm Ti has not caused significant differences in corrosion behavior compared to non-titanium alloy. In further works, pending completion, the cross section of the corrosion surface of the studied specimens will be observed and the type of attack observed will be evaluated in order to be able to analyze Tafel extrapolation results in more detail.
5. AcknowledgementsThe authors are grateful to the company Wärtsilä Iberica
S.A. Cantabria. Spain, for the supply of NAB samples.
6. References1. Wharton JA, Barik RC, Kear G, Wood RJK, Stokes KR, Walsh
FC. The corrosion of nickel-aluminium bronze in seawater. Corros Sci. 2005;47:3336-67. http://dx.doi.org/10.1016/j.corsci.2005.05.053.
2. Basumatary J, Wood RJK. Synergistic effects of cavitation erosion and corrosion for nickel aluminium bronze with oxide film in 3.5% NaCl solution, Wear, 376–377. Part B. 2017;1:1286-97. http://dx.doi.org/10.1016/j.wear.2017.01.047.
3. Zhang LM, Ma AL, Yu H, Umoh AJ, Zheng YG. Correlation of microstructure with cavitation erosion behaviour of a nickel-aluminum bronze in simulated seawater. Tribol Int. 2019;136:250-8. http://dx.doi.org/10.1016/j.triboint.2019.03.071.
4. Al-Hashem A, Caceres PG, Riad WT, Shalaby HM. Cavitation corrosion behavior of cast Nickel-Aluminum bronze in seawater. Corrosion. 1995;51:331-42. http://dx.doi.org/10.5006/1.3293598.
5. Barik RC, Wharton JA, Wood RJK, Tana KS, Stokes KR. Erosion and erosion–corrosion performance of cast and thermally sprayed nickel–aluminium bronze. Wear. 2005;259:230-42. http://dx.doi.org/10.1016/j.wear.2005.02.033.
6. Dharmendra C, Amirkhiz BS, Lloyd A, Ram GDJ, Mohammadi M. Wire-arc additive manufactured nickel aluminum bronze with enhanced mechanical properties using heat treatments cycles. Additive Manufacturing. 2020;36:101510. http://dx.doi.org/10.1016/j.addma.2020.101510.
7. Zeng Y, Yang F, Chen Z, Guo E, Gao M, Wang X, et al. Enhancing mechanical properties and corrosion resistance of nickel-aluminum bronze via hot rolling process. J Mater Sci Technol. 2021;61:186-96. http://dx.doi.org/10.1016/j.jmst.2020.05.024.
8. Schüssler A, Exner HE. The corrosion of nickel-aluminium bronzes in seawater-I. Protective layer formation and the passivation mechanism. Corros Sci. 1993;34:1793-802. http://dx.doi.org/10.1016/0010-938X(93)90017-B.
9. Linhardt P. Unusual corrosion of nickel‐aluminium bronze in a hydroelectric power plant. Mater Corros. 2015;66(12):1536-1541. https://doi.org/10.1002/maco.201508323.
10. Krogstad HN, Johnsen R. Corrosion properties of nickel-aluminium bronze in natural seawater: effect of galvanic
coupling to UNS S31603. Corros Sci. 2017;121:43-56. http://dx.doi.org/10.1016/j.corsci.2017.03.016.
11. Zhang B-B, Wang J-Z, Yuan J-Y, Yan F-Y. Tribocorrosion behavior of nickel aluminum bronze in seawater: identification of corrosion-wear components and effect of pH. Mater Corros. 2018;69:106-14. http://dx.doi.org/10.1002/maco.201709648.
12. Zhang B-B, Wang J-Z, Yuan J-Y, Yan F-Y. Tribocorrosion behavior of nickel-aluminium bronze sliding against alumina under the lubrication by seawater with different halide concentrations. Friction. 2019;7:444-56. http://dx.doi.org/10.1007/s40544-018-0221-y.
13. Culpan EA, Rose G. Microstructural characterization of cast nickel aluminium bronze. J Mater Sci. 1978;13:1647-57. http://dx.doi.org/10.1007/BF00548728.
14. Süry P, Oswald HR. On the corrosion behaviour of individual phases present in aluminium bronzes. Corros Sci. 1972;12(1):77-80. https://doi.org/10.1016/S0010-938X(72)90581-1
15. Al-Hashem A, Riad W. The role of microstructure of nickel–aluminium–bronze alloy on its cavitation corrosion behavior in natural seawater. Mater Charact. 2002;48:37-41. http://dx.doi.org/10.1016/S1044-5803(02)00196-1.
16. Wu Z, Cheng YF, Liu L, Lv W, Hu W. Effect of heat treatment on microstructure evolution and erosion-corrosion behavior of a nickel-aluminum bronze alloy in chloride solution. Corros Sci. 2015;98:260-70. http://dx.doi.org/10.1016/j.corsci.2015.05.037.
17. Böhm J, Linhardt P, Strobl S, Haubner R, Biezma MV. Microstructure of a heat treated nickel-aluminum bronze and its corrosion behavior in simulated fresh and sea water. Materials Performance and Characterization. 2016;5:689-700. http://dx.doi.org/10.1520/MPC20160029.
18. Qin Z, Luo Q, Zhang Q, Wu Z, Liu L, Shen B, et al. Surface & Coatings Technology Improving corrosion resistance of nickel-aluminum bronzes by surface modification with chromium ion implantation. Surf Coat Tech. 2018;334:402-9. http://dx.doi.org/10.1016/j.surfcoat.2017.11.066.
19. Murray T, Thomas S, Wu Y, Neil W, Hutchinson C. Selective laser melting of nickel aluminium bronze. Additive Manufacturing. 2020;33:101122. http://dx.doi.org/10.1016/j.addma.2020.101122.
20. Lv Y, Nie B, Wang L, Cui H, Li L, Wang R, Lyu F. Optimal microstructures on fatigue properties of friction stir processed NiAl bronze alloy and its resistant fatigue crack growth mechanism. Mater Sci Eng A. 2020;771:138577. http://dx.doi.org/10.1016/j.msea.2019.138577.
21. Taylor D, Knott JF. Growth of fatigue cracks from casting defects in nickel–aluminium bronze. Met Technol. 1982;9:221-8. http://dx.doi.org/10.1179/030716982803286160.
22. Hazra M, Balan KP. Failure of a nickel aluminium bronze (NAB) canned motor pump impeller working under polluted sea water – Influence of material selection, section thickness dependent microstructure and temper annealing heat treatment. Eng Fail Anal. 2016;70:141-56. http://dx.doi.org/10.1016/j.engfailanal.2016.07.010.
23. Vazdirvanidis A, Bouzouni M, Pantazopoulos G. Failure and fracture analysis of a high-alloy Ni-Al bronze chain connector of a tube drawing machine. Eng Fail Anal. 2020;110:104432. http://dx.doi.org/10.1016/j.engfailanal.2020.104432.
24. Oh-ishi K, Mcnelley R. Microstructural modification of as-cast NiAl bronze by friction stir processing. Metallurgical Transations A. 2004;35A:2951-61. http://dx.doi.org/10.1007/s11661-004-0242-1.
25. Moussa ME, Waly MA, Amin M. Effect of high intensity ultrasonic treatment on microstructural modification and hardness of a nickel-aluminum bronze alloy. J Alloys Compd. 2018;741:804-13. http://dx.doi.org/10.1016/j.jallcom.2018.01.218.
26. Wang C, Jiang C, Chen M, Wang L, Liu H, Ji V. Residual stress and microstructure evolution of shot peened Ni-Al bronze at elevated temperatures. Mater Sci Eng A. 2017;707:629-35. http://dx.doi.org/10.1016/j.msea.2017.09.098.
27. Yang F, Kang H, Guo E, Li R, Chen Z, Zeng Y, et al. The role of nickel in mechanical performance and corrosion behaviour of
9Effect of Ti on Microstructure, Mechanical Properties and Corrosion Behavior of a Nickel-Aluminum Bronze Alloy
nickel-aluminium bronze in 3.5 wt.% NaCl solution. Corros Sci. 2018;139:333-45. http://dx.doi.org/10.1016/j.corsci.2018.05.012.
28. Manikandan R, Kumaresh Babu SP, Murali M, Vallimanalan A. Investigation of microstructure and mechanical properties in Nickel aluminium Bronze alloy with Nb and Y for aqueous applications. Materials Today: Proceedings. 2019;27:2591-5. http://dx.doi.org/10.1016/j.matpr.2019.10.173.
29. Sadayappan M, Fasoyinu FA, Sahoo M. Grain refinement of copper base alloys. In 4th International Conference COPPER 99-COBRE 99; 1999 Oct 10-13; Phoenix, Arizona. Proceedings. 1999, pp. 279–291.
30. Feng X, Cui X, Zheng W, Wen X, Zhao Y, Jin G, et al. Performance of underwater laser cladded nickel aluminum bronze by applying zinc protective layer and titanium additives. J Mater Process Technol. 2019;266:544-50. http://dx.doi.org/10.1016/j.jmatprotec.2018.11.036.
31. Feng X, Cui X, Jin G, Zheng W, Cai Z, Wen X, et al. Underwater laser cladding in full wet surroundings for fabrication of nickel aluminum bronze coatings. Surf Coat Tech. 2018;333:104-14. http://dx.doi.org/10.1016/j.surfcoat.2017.10.056.
32. Zhao B, Lv Y, Ding Y, Wang L, Lu W. The grain refinement mechanisms of various phases in shot-peened Nickel-Aluminum bronze (NAB) alloy. Mater Charact. 2018;144:77-85. http://dx.doi.org/10.1016/j.matchar.2018.07.002.
33. Oliver WC, Pharr GM. Measurement of hardness and elastic modulus by instrumented indentation: advances in understanding
and refinements to methodology. J Mater Res. 2004;19:3-20. http://dx.doi.org/10.1557/jmr.2004.19.1.3.
34. Hasan F, Jahanafrooz A, Lorimer GW, Ridley N. The morphology, crystallography, and chemistry of phases in As-Cast Nickel-Aluminum Bronze. Metallurgical Transations A. 1985;13:1337-45. http://dx.doi.org/10.1007/BF02642870.
35. Anantapong J, Uthaisangsuk V, Suranuntchai S, Manonukul A. Effect of hot working on microstructure evolution of as-cast Nickel Aluminum Bronze alloy. Mater Des. 2014;60:233-43. http://dx.doi.org/10.1016/j.matdes.2014.03.033.
36. Rabin BH, Wright RN. Microstructure and tensile properties of Fe3Al produced by combustion synthesis/hot isostatic pressing. Metall Trans, A, Phys Metall Mater Sci. 1992;23:35-40. http://dx.doi.org/10.1007/BF02660848.
37. Song QN, Zheng YG, Ni DR, Ma ZY. Characterization of the Corrosion Product Films formed on the as-cast and friction-stir processed Ni-Al Bronze in a 3.5 wt% NaCl solution. Corrosion. 2015;71:606-14. http://dx.doi.org/10.5006/1391.
38. Nakhaie D, Davoodi A, Imani A. The role of constituent phases on corrosion initiation of NiAl bronze in acidic media studied by SEM–EDS, AFM and SKPFM. Corros Sci. 2014;80:104-110. https://doi.org/10.1016/j.corsci.2013.11.017
39. Zhao B, Lv Y, Dinga Y, Wanga L, Lu W. The grain refinement mechanisms of various phases in shot-peened Nickel-Aluminum bronze (NAB) alloy. Mater Charact. 2018;144:77-85. http://dx.doi.org/10.1016/j.matchar.2018.07.002.


