Embed Size (px)
Citation preview

Experimental Cell Research 171 (1987) 448-459
Effect of Tunicamycin on Cell Cycle Progression in Budding Yeast
MARINA VAI, LAURA POPOLO, and LILIA ALBERGHINA’ Sezione di Biochimica Comparata, Dipartimento di Fisiologia e Biochimica Generali,
Universitci di Milano, Via Celoria, 26, 20133 Milan, Italy
Tunicamycin, an inhibitor of one of the earliest steps in the synthesis of N-linked oligosaccharides, prevents bud formation and growth in Saccharomyces cerevisiae cells that are either growing exponentially or recovering from different cell cycle arrests at start. Analysis of tunicamycin-treated cells by flow microfluorometry clearly shows that cells have a postsynthetic DNA content, but there is no evidence of an increase in binucleate cells. Therefore tunicamycin affects bud emergence and initiation of DNA synthesis, two events correlated under physiological conditions, in different ways. A bulk glycoprotein synthesis is shown to be required for bud emergence and localized chitin deposition, probably to sustain directional secretory vesicle transport, which allows polar growth of the bud. No evidence for a glycoprotein requirement for entrance into the S phase is obtained from the present experiments. @ 1987 Academic PWSS, h.
Tunicamycin, an antibiotic analogous to UDP-ZV-acetylglucosamine, inhibits the first reaction of the dolichol pathway, which leads to the N-glycosylation of proteins [l-3]. This pathway is quite similar in fungi, yeasts, and mammalian cells [49], suggesting that this modification plays an essential role in all eukaryotic cells [lO-151. Recently the involvement of N-glycosylated proteins in the Gi/S transition of the yeast cell cycle has been proposed [16, 171. In fact, tunicamycin appears to cause a G1 arrest of Saccharumyces cereuisiae cells in the unbudded phase and to prevent the cells from entering the S phase, as indicated by the inhibition of the radioactive precursor incorporation into DNA [161. The same results were obtained using a temperature-sensitive N-glycosylation mutant of S. cereuisiae (alg I-1) which is blocked at the level of the addition of the first mannose residue to the lipid-linked oligosaccharide precursor [18]. At the non- permissive temperature, this mutant shows a first cell cycle arrest with a terminal phenotype identical to that of wild-type cells treated with tunicamycin [19].
In this paper we investigate the effects of tunicamycin on the cell cycle progression in budding yeast, using flow microfluorometry to determine the DNA content in control and tunicamycin-treated populations. In recent years we have in fact established flow microfluorometry, of both DNA and protein contents, as a powerful tool to analyze yeast cell cycle under balanced conditions of growth [2&22], during perturbations of physiological conditions, for example, after treatment with a protein synthesis inhibitor [23], or during cell cycle arrest in a cdc mutant [24].
’ To whom correspondence and reprint requests should be addressed.
448 Copyright @ 1987 by Academic Press, Inc. All rights of reproduction in any form reserved
0014-4827/87 so3.00

Tunicamycin and cell cycle in yeast 449
MATERIALS AND METHODS Strains and growth conditions. S. cereuisiae haploid strains S288C (MATa SLJC2, mal, mel, ga12,
CUPl), A364A (adel, ade2, ural, his7, lys2, tyrl, gall, a), and 321, which carries the temperature- sensitive mutation cdc25-1 in the same genetic background as A364A, were used throughout this study. These strains were obtained from the Yeast Genetic Stock Center (Berkeley, CA).
The growth medium was made up with 6.7 gihter Difco yeast nitrogen base (YNB) without amino acids, 2% glucose, and with the appropriate supplements as described previously for the two auxotroph mutants [25]. For nitrogen-free medium (YNB-N), (NH&SO4 was omitted. All cultures were grown in batches in a shaking water bath, at 24°C for A364A and 321 and at 30°C for S288C.
In the nitrogen starvation experiments exponentially growing cells were shifted from nitrogen- containing to nitrogen-free medium by collection on membrane filters (1.2 pm pore size). Cells were then resuspended in YNB-N and left for about 20 h.
Tunicamycin was obtained from Sigma and dissolved in dimethyl sulfoxide (2 mg/ml stock solu- tion). a-Factor (aF), from Bachem (Basel), was resuspended in 10 mM HCl, 0.1 ti EDTA, and 1 mM /I-mercaptoethanol(O.3 mM stock solution).
Determination of cell number and percentage of budded cells. Growth was monitored as the increase in cell number determined using a Coulter ZBl counter (Coulter Electronics, Harpenden, UK) as previously described [21]. The proportion of cells with buds was determined by direct microscopic counting of at least 400 cells after mild sonication of small samples of cell cultures.
Flow-cytometric analysis of cellular DNA content. Samples of cells were mildly sonicated, collect- ed by centrifugation, washed and resuspended in 70% ethanol, and stored at 4°C before analysis. Fluorescent staining of DNA was performed as follows: cells were mildly sonicated, collected by centrifugation, washed, and treated with RNase (1 mg/ml) in phosphate-buffered saline (PBS) for 60 min at 37°C. Then they were washed with PBS and stained with 46 l&f propidium iodide in 50 mM ‘I&, pH 7.7, and 15 mM MgClr for 15 min at room temperature. Total fluorescence intensities were determined on at least 10’ cells with an FACS IV fluorescence activated cell sorter (Becton and Dickinson) equipped with a 5-W argon-ion laser yielding 400 mW at 488 nm under experimental conditions.
Calcofluor staining of chitin. In order to observe the localization of chitin, the fluorescence produced by interaction between the polysaccharide and a brightener, Calcofluor White MR2 New (a gift from Dr. E. Cabib, National Institutes of Health, Bethesda, MD), was used. Cells, futed in 10% Formalin and mildly sonicated, were stained with 0.2% Calcofluor for 5 min and examined under a Leitz Dialux 20EB fluorescence microscope at x 1000.
Fluorescent staining of nuclei. Nuclei were stained with 4’,6’-diamino-2-phenylindole.2HCl (DAPI) according to [26] and observations were made as described above.
Photomicroscopy. Calcofluor- and DAPI-stained cells were photographed using Ilford FP4 films on a Leitz Dialux 20EB fluorescence microscope at x1000. Exposure times for cells stained with Calcofluor and DAPI were 1 and 30 s, respectively.
RESULTS
Efiects of Tunicamycin on Exponentially Growing S. cerevisiae Cells
When tunicamycin (10 ug/ml) is added LO exponentially growing cells of S. cereuisiae (A364A strain) at a cell density of 6x lo6 cells/ml, growth, monitored as as increase in cell number, proceeds for about 2.5-3 h and then ceases (Fig. 1 A). Upon addition of the inhibitor, the frequency of budded cells progressively declines, as shown in Fig. lB, going from a value of approx 65% to only 12% after 4 h of treatment. The increase in cell number which occurs after tunicamy- tin addition is approximately 1.5 to 1.6-fold, suggesting that the cells which at the moment of the drug addition have already entered the S+G,+M phases of the cycle (roughly coincident with the fraction of budded cells that is about 65 %) are able to complete one cell division before arresting. Thus, the addition of tunica- mycin to exponentially growing yeast cells seems to bring about a pattern of growth inhibition typical of a first cycle arrest [27], with cells accumulating with a

450 Vai, Popolo, and A Jberghina
A
40 -
u.-
0’ ” ” ” ” TM
f
B
.
r
40 z
:: g
2 60;c
20 0
* o- 012345676
Fig. 1. Effect of tunicamycin on growth and cell division in S. cereuisiae. (A) Increase in cell number; (II) percentage of budded cells. At time=0 tunicamycin (10 ug/ml) was added to a culture of A364A strain exponentially growing at 24°C in YNB/glucose medium. 0, Control culture; 0, tunicamycin-treated culture.
uniform morphology as unbudded ones. To better characterize the specific cell cycle stage at which cells are arrested by tunicamycin, a flow-cytometric analysis was performed during the TM treatment. The DNA distribution for untreated exponentially growing cells is shown in Fig. 2 a. Following tunicamycin addition, the peak corresponding to the presynthetic DNA content is considerably reduced
r b
Channel number
Fig. 2. DNA distributions in S. cereuisiae cells at different times after tunicamycin addition. A culture of A364A strain was treated as indicated in Fig. 1 and at the times indicated cellular DNA content was analyzed by flow cytometry. Control culture in exponential growth (a) and in stationary phase (b) (27 h from the beginning of the experiment). Culture treated with tunicamycin for 1 h (c), 3 h (4, 4 h (e), and 27 h v).

Tunicamycin and cell cycle in yeast 451
50 100 150 50 100 150
Channel number
Fig. 3. DNA distributions in S. cereuisiae cells released from a-factor cell cycle arrest in the presence of tunicamycin. Exponentially growing cells of A364A strain were treated at a cell density of about 5~10~ cells/ml with 1 pitI aF for 3 h. After removal of aF, cells were resuspended in fresh medium in the presence and absence of tunicamycin (10 ug/ml). At the times indicated flow- cytometric analyses were performed. Yeast cells treated for 3 h with aF (a). Control culture after 1 h (b) 2 h (c), 3 h (d), and 20 h (e) from the removal of aF. Cells were released from the aF arrest and treated with tunicamycin (10 pg/ml) for 1 h (t), 2 h (g), 3 h (h), and 20 h (r).
(Figs. 2c and 2 6) and after 4 h of treatment most of the cells are in the G,+M phases of the cell cycle (Fig. 2 e). After 27 h of tunicamycin addition the control culture has reached the stationary phase with 18% budded cells and a large fraction of cells with a presynthetic DNA content (Fig. 2 6), while the tunicamy- tin-treated cells clearly show a postsynthetic DNA content (Fig. 2~9 and a strong inhibition of budding (only 9% budded cells). These quite unexpected results indicate that tunicamycin affects bud emergence and DNA synthesis in different ways, strongly inhibiting the first pathway, while DNA replication can proceed apparently unaltered. Very similar results have also been obtained with a lower concentration (3 ug/ml) of tunicamycin (data not shown).
Eflects of Tunicamycin on Recovery from Different Types of Cell Cycle Arrest at “Start”
To gather more information on the effects of tunicamycin on cell cycle progres- sion in yeast, cells were synchronized by using different types of cell cycle arrests at start [28], and then their capacity to undergo bud emergence and DNA synthesis in the presence of tunicamycin was evaluated during the release from the cell cycle arrest. At first, haploid cells of mating type a were blocked at start by treatment with the pheromone a-factor. The mating pheromones a and a- factors induce cells of the opposite mating type to arrest in the Gr phase, at the

452 Vai, Popolo, and Alberghina
0 1 2 3 4
Time (hours)
Fig. 4. Effect of tunicamycin on budded cells after a-factor treatment. A364A cells were treated with aF as described in Fig. 3. The arrow indicates tunicamycin (10 pg/ml) addition. 0, Control culture during recovery from aF treatment; 0, Tunicamycin-treated cells during recovery from aF treatment.
major regulatory area called start, and then to undergo morphological changes characteristic of the acquisition of a competent state for the mating process 1291. The arrest induced by aF resembles that of a class I start mutant, for example, cdc28 [30, 311.
Haploid cells of the A364A strain treated for 2 h with aF (1 p.it4) show a rapid decrease in the percentage of budded cells, which reaches 10% in less than 3 h, and an increase of cells in Gi phase as shown by the DNA distribution reported in Fig. 3a. After removal of the pheromone, cells were resuspended in fresh medium in the presence and in the absence of tunicamycin (10 &nl). The control culture undergoes a synchronous relief from the G, arrest as indicated by the increase in the percentage of budded cells (Fig. 4), by the changes in the distribution of DNA content in the population (Figs. 3 b-3 d), and by an increase in cell number (data not shown). On the contrary, the tunicamycin-treated culture does not show any increase in the percentage of budded cells (Fig. 4) and hence in cell number (data not shown). The DNA distributions indicate a progressive reduction of Gi cells, with a parallel increase of cells in the G,+M phases of the cell cycle (Figs. 3$-h). After longer periods of treatment with the inhibitor (20 h), the tunicamycin-treated cells are still blocked in G2 (Fig. 3 i), while the control cells. have almost reached stationary phase, showing the onset of a typical Gi arrest (Fig. 3e).
A second type of cell cycle arrest in G,, that induced by the thermosensitive start cdc25 mutation, was then examined. The cdc2.5 mutant is a class II start mutant [30] which at restrictive temperature arrests before the state of compe- tence for conjugation, resembling in some aspects nutrient-starved cells [24]. When cdc25 cells growing at 24°C (permissive temperature) are transferred to 36°C (restrictive temperature), a cell cycle arrest in G, takes place and is detected as a decrease in the percentage of budded cells and as an increase in the fraction of cells with a presynthetic DNA content [24, 251.

Tunicamycin and cell cycle in yeast 453
b I
Channel number
Fig. 5. DNA distributions obtained for cdc25, cells after a shift from restrictive to permissive temperature in presence of tunicamycin. A culture of cdc2.SI mutant cells exponentially growing at 24°C in YNB/glucose medium was shifted for 4 h at 36°C. Then it was transferred to 24°C in the absence or presence of tunicamycin (10 &ml) and cellular DNA content was analyzed. cdc25-I cells 4 h at 36*C (a), cdc25-I cells 1.5 h after the shift from 36°C to 24°C (b). cdc25-I cells treated for 1.5 h (c), 7 h (d), and 21 h (e) with tunicamycin (10 &ml) after the shift from 36 to 24°C.
Exponentially growing cdc25-I cells were first transferred to 36°C for 4 h: the percentage of budded cells decreases from a value of about 60 % to about 32 %, while a large fraction of cells of the population has a Gr DNA content (Fig. 5 a). Then the culture was transferred to the permissive temperature and tunicamycin (10 clla/ml> was added (at a density of about 6x lo6 cells/ml). The addition of the inhibitor causes a further marked decrease in the percentage of budded cells (Fig. 6) which is accompanied by an increase in the fraction of cells in the G2 phase of the cell cycle, as shown by flow-cytometric analysis performed during tunicamy- tin treatment (Fig. 5). After 7 h the tunicamy~in-treated culture shows a large fraction of cells with a postsynthetic DNA content (Fig. 5 d) and almost the total population has an unbudded morphology (Fig. 6, 9% budded). Long after the antibiotic addition (21 h), the peak corresponding to the Gt cells is considerably more reduced [Fig. 5 e). The control culture, arrested at 36°C and reported at the permissive temperature without tunicamycin, promptly resumes growth (Fig. 6) with a typical DNA distribution of actively growing cells (Fig. 5 b).
012345676
Time ( hours)
Fig. 6. Effect of tunicamycin on the percentage of budded cells in cdc25 cells recovering from cell cycle arrest at restrictive temperature. cdc25-Z cells were treated as described in Fig. 5. After the shii from 36 to 24°C (time=O) the percentage of budded cells was determined at different times in the absence (0) or presence (0) of tunicamycin (10 &ml).
454 Vai, Popolo, and Alberghina
012345676
Time ( hours 1
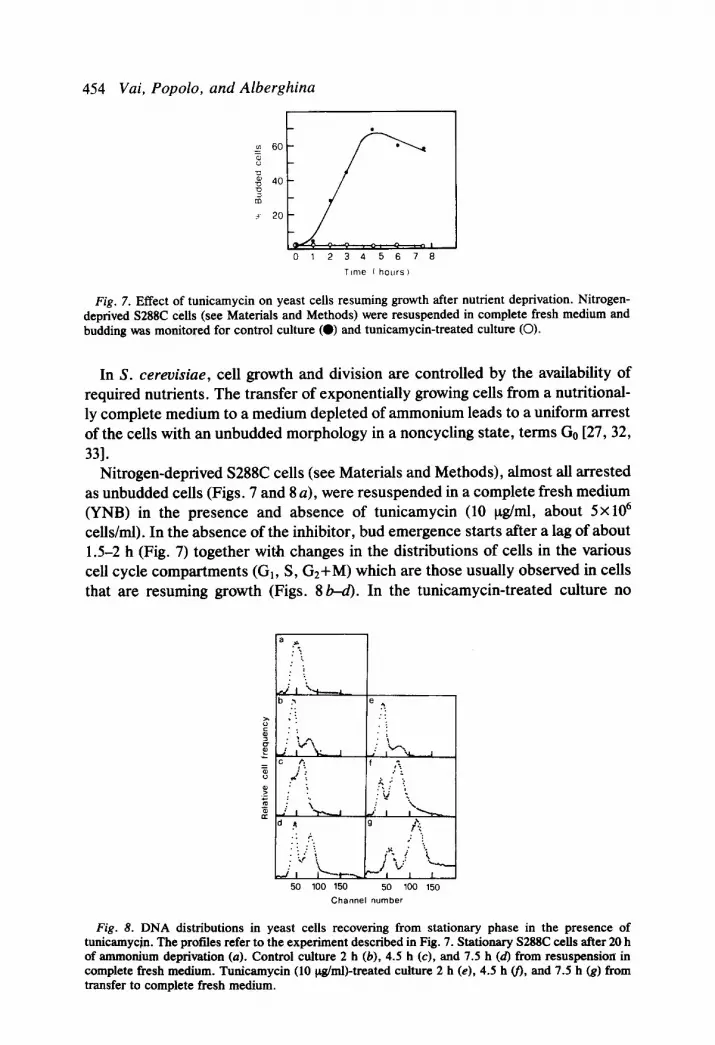
Fig. 7. Effect of tunicamycin on yeast cells resuming growth after nutrient deprivation. Nitrogen- deprived S288C cells (see Materials and Methods) were resuspended in complete fresh medium and budding was monitored for control culture (0) and tunicamycin-treated culture (0).
In S. cereuisiae, cell growth and division are controlled by the availability of required nutrients. The transfer of exponentially growing cells from a nutritional- ly complete medium to a medium depleted of ammonium leads to a uniform arrest of the cells with an unbudded morphology in a noncycling state, terms Go [27, 32, 331.
Nitrogen-deprived S288C cells (see Materials and Methods), almost all arrested as unbudded cells (Figs. 7 and 8 a), were resuspended in a complete fresh medium (YNB) in the presence and absence of tunicamycin (10 ug/ml, about 5~ lo6 cells/ml). In the absence of the inhibitor, bud emergence starts after a lag of about 1.5-2 h (Fig. 7) together with changes in the distributions of cells in the various cell cycle compartments (G,, S, G,+M) which are those usually observed in cells that are resuming growth (Figs. 8&Q. In the tunicamycin-treated culture no
50 100 150 50 100 150 Channel number
Fig. 8. DNA distributions in yeast cells recovering from stationary phase in the presence of tunicamycjn. The profiles refer to the experiment described in Fig. 7. Stationary S288C cells after 20 h of ammonium deprivation (a). Control culture 2 h (b), 4.5 h (c), and 7.5 h (d) from resuspension in complete fresh medium. Tunicamycin (10 &n&treated culture 2 h (e), 4.5 h v), and 7.5 h (g) from transfer to complete fresh medium.

Tunicamycin and cell cycle in yeast 455
Fig. 9. Fluorescent photomicrographs of DAPI-stained nuclei. Samples were prepared and photo- graphed as described under Materials and Methods. Fluorescent micrographys were printed at identical enlarger (12X) and exposure settings. (A) Exponentially growing yeast cells; (B) nitrogen- starved cells treated for 7.5 h with tunicamycin (10 Kg/ml).
increase in budding (Fig. 7) or in cell number (data not shown) takes place, while flow-cytometric analysis indicates a remarkable reduction of the peak corre- sponding to the presynthetic DNA content and an increase in the fraction of the G2 cells. The time course of changes in the cell cycle distributions of the tunicamycin-treated cells is shown in Figs. 8e-8g. In Fig. 8g it is particularly evident that the distribution of DNA undergoes a slight shifting and expansion. This effect can be ascribed to mitochondrial DNA synthesis, which is affected differently during blocks of the cell cycle [34-361.
The nutritional condition of the recovery from stationary phase does not affect DNA distributions since similar results have been obtained when nitrogen- starved S288C cells were resuspended in a complete rich medium (YEPD) in the presence and absence of tunicamycin (data not shown).
Analysis of Nuclei by Fluorescent Staining
In order to verify whether tunicamycin-treated cells, having a G2 DNA content, are blocked before or after mitosis, a fluorescence microscopic examination of the DAPI-stained cells was performed. Upon addition of tunicamycin, cells appear to have a single nucleus (Fig. 9B); the failure to accumulate as binucleate cells suggests that tunicamycin prevents cells from carrying out nuclear division. Moreover, nitrogen-starved cells treated with tunicamycin show a more diffused

456 Vai, Popolo, and Alberghina
Fig. 10. Fluorescent photomicrographs of Calcofluor-stained cells. (A) Control culture; (B) tunica- mycin-treated cells. Photomicroscopy was performed as described under Materials and Methods and in Fig. 9.
cytoplasmic fluorescence than the control culture (Figs. 9A, and 9B), probably due to mitochondrial DNA.
Chitin Deposition in Tunicamycin-Treated Cells
Chitin, whose synthesis is temporally and spatially regulated during the S. cereuisiae cell cycle [37], is deposited as a ring at the base of the neck of yeast cells that are about to bud [38]. This ring, which can be stained selectively with the fluorescent dye Calcofluor, remains as a bud scar on the mother cell wall at a site usually adjacent to the previous site of bud emergence [39]. When exponen- tially growing yeast cells were stained with Calcofluor, they displayed a typical polar clustering of bud scars (Fig. lOA), while the tunicamycin-treated cultures showed an altered staining pattern. These cells, although unbudded, continue to accumulate chitin at the pole opposite to the bud scars. Following a long tunica- mycin treatment the cells appear unable to organize chitin into normal rings and a brightly fluorescent area due to chitin deposition is particularly evident (Fig. 1OB).
DISCUSSION We have shown that S. cereuisiae tunicamycin-treated cells are not able to bud,
show a delocalized deposition of chitin on the cell surface, and are cell cycle arrested, with a postsynthetic (G2) DNA content and no evidence of increased binucleate cells.

Tunicamycin and cell cycle in yeast 457
This phenotype is observed in tunicamycin-treated cells, which are obtained either from exponentially growing cultures or from cells that were recovering from a cycle arrest at start obtained by a-factor treatment, by nitrogen starvation, or in a temperature-sensitive start mutant (cdc25), brought to restrictive tempera- ture. These results indicate that tunicamycin inhibits cell cycle progression at levels different from those observed in other microorganisms [40]. Bud emer- gence and initiation of DNA replication are events that are usually correlated [37] and that take place after the traverse of start [41]. Treatment with tunicamycin sharply inhibits bud emergence and profoundly alters the localized synthesis of chitin, which is one of the developmental processes occurring during bud forma- tion [42-44]. On the other hand, the initiation of DNA replication appears to occur normally in the tunicamycin-treated cells, which arrest as unbudded cells with a postreplicative G2 content of DNA. Since the percentage of binucleate cells does not increase in the treated populations, it seems that tunicamycin treatment also impedes nuclear division. Tunicamycin, at the concentrations used in the experiments reported in this paper, has been shown in our laboratory to largely inhibit the glycosylation of proteins in budding yeast as detected by two- dimensional gel electrophoresis [ 171.
Cellular glycoproteins are either secreted or localized in the plasma membrane, and therefore the formation of secretory vesicles is greatly dependent on the availability of glycoproteins. A severe shortage of glycoproteins brought about by the tunicamycin treatment may thus greatly reduce the traffic of vesicles, which are required for polar growth in budding yeast and which, among other things, transport cell wall material and enzymes to the emerging bud [45-521. The delocalized synthesis of chitin may derive from the loss of the proper directional vesicle traffic with a concomitant generalized activation of the chitin synthetase zymogen as observed in several instances during cell cycle arrest [42,43,53,541.
More difficult to explain is the block of nuclear division. One possible clue could come from the observed tight association of vesicles with the cytoskeleton structure [49, 55-581 (especially with actin) which would be perturbed by the inhibition of vesicle formation caused by tunicamycin and by recalling that a proper cytoskeleton organization, with the formation of the mitotic spindle, is required for nuclear division to occur [41, 49, 551.
It was quite unexpected to find that tunicamycin does not inhibit DNA synthe- sis; previous experiments had indicated so [16]. One possible explanation is the difference in the methods used to monitor DNA replication. Using flow micro- fluorometry, we have detected the synthesis of DNA by measuring the increase of cellular DNA content in the tunicamycin-treated populations: we have there- fore used a fluorescent determination of DNA as a segregated parameter to describe the nuclear division cycle events. Instead in the cited report the synthe- sis of DNA was measured by incorporation of a radioactive precursor into DNA by aliquots of the culture. Measurement of the radioactivity incorporated into DNA may not be a very reliable estimation of DNA synthesis if treatment with tunicamycin reduces the precursor uptake, as observed in other systems [59].
Another possibility is that the glycoprotein(s) eventually required for the Gr to

458 Vai, Popolo, and Alberghina
S transition is not needed in large amounts and that a residual (preferential?) synthesis of these glycoproteins may also take place in the presence of tunicamy- tin. A small difference in the extent of the inhibition by tunicamycin in the two reported sets of experiments may thus yield the apparently conflicting results.
Further investigations on the temperature-sensitive mutant algl-1 defective in the IV-glycosylation of the proteins will shed more light on the requirement of glycoproteins in the cell cycle progression in yeast, although it is becoming quite clear that under conditions of perturbed growth during cell cycle arrest, it is possible to bypass normally required regulatory steps.
The authors thank Dr. G. Frascotti for skillful assistance in the flow-cytometric analyses and Dr. F. Rodriguez for assistance in photomicroscopy experiments. This work was partially supported by Grant CT 8500583 from Consiglio Nazionale delle Ricerche (CNR), Rome.
REFERENCES 1. Tkacz, J. S., and Lampen, J. 0. (1975) Biochem. Biophys. Res. Commun. 65, 248. 2. Lehfe, L., and Tanner, W. (1976) Febs Letr. 71, 167. 3. Takatsuki, A., Shimizu, K., and Tamura, G. (1972) J. Antibiot. 25, 75. 4. Selitrennikoff, C. P. (1979) Arch. Biochem. Biophys. 195, 243. 5. Lehle, L. (1980) Eur. J. Biochem. 109, 589. 6. Byrd, S. C., Tarentino, A. L., Maley, F., Atkinson, P. H., and Trimble, R. B. (1982) J. Biol.
Chem. 257, 14657. 7. Ferro-Novick, S., (1985) Trends Biochem. Sci. 11, 1425. 8. Schekman, R. (1985) Anna. Rev. Cell Biol. 1, 115. 9. Komfeld, R., and Komfeld, S. (1985) Annu. Rev. Biochem. 54, 631.
10. Ashwell, G., and Harford, S. (1982) Annu. Rev. Biochem. 51, 531. 11. Machida, C. A., & Kabat, D. (1982) J. Biol. Chem. 257, 14018. 12. Barnes, G., Hansen, W. J., Holcomb, C. L., and Rine, J. (1984) Mol. Cell Biol. 4, 2381. 13. Julius, D., Schekman, R., and Thomer, S. (1984) Cell 36, 309. 14. Ferro-Novick, S., Novick, P., Field, C., and Schekman, R. (1984) J. Cell Biol. 98, 35. 15. Rose, M. C., Voter, W. A., Sage, H., Brown, C. F., and Kaufman, B. (1984) J. Biol. Chem. 259,
3167. 16. Arnold, E., and Tanner, W. (1982) Febs Letr. 148, 49. 17. Popolo, L., Vai, M., and Alberghina, L. (1986) .I. Biol. Chem. 261, 3479. 18. Huffaker, T. C., and Robbins, P. W. (1980) J. Biol. Chem. 257, 3203. 19. Klebl, F., Huffaker, T., and Tanner, W. (1984) Exp. Cell Res. 150, 309. 20. Alberghina, L., Mariani, L., Martegani, E., and Vanoni, M. (1983) Biotechnol. Bioeng. 25, 1295. 21. Vanoni, M., Vai, M., Popolo, L., and Alberghina, L. (1983) J. Bacterial. 156, 1282. 22. Vanoni, M., Vai, M., and Frascotti, G. (1984) Cytometry 5, 530. 23. Popolo, L., Vanoni, M., and Alberghina, L. (1982) Exp. Cell Res. 142, 69. 24. Martegani, E., Vanoni, M., and Baroni, M. (1984) Eur. J. Biochem. 144, 205. 25. Popolo, L., and Alberghina, L. (1984) Proc. Natl. Acad. Sci. USA 81, 120. 26. K&z, S., and Lindquist, S. (1986) Cell 45, 771. 27. Hartwell, L. H. (1974) Bacterial. Rev. 38, 164. 28. Hartwell, L. H., Culotti, S., Pringle, S. R., and Reid, B. J. (1974) Science 183, 46. 29. Bucking-Throm, E., Duntze, W., Hartwell, L. H., and Manney, T. R. (1973) Exp. Cell Res. 76,
99. 30. Reed, S. I. (1980) Genetics 95, 561. 31. Reed, S. I., Barros Lopez, M. A., Ferguson, S., Hadwiger, J. A., Ho, J. Y., Horwitz, R., Jones,
C. A., Lorincz, A. T., Hendenhall, M. D., Peterson, T. A., Richardson, S. L., and Wittenberg, C. (1985) Symp. Quant. Biol. 50, 627.
32. Pinon, R. (1978) Chromosoma 67, 263. 33. Pinon, R. (1979) J. Mol. Biol. 129, 433. 34. Petes, T. D., and Fangman, W. L. (1973) Biochem. Biophys. Res. Commun. 55, 6093. 35. Stevens, B. S. (1977) Biol. Cell 28, 37.

Tunicamycin and cell cycle in yeast 459
36. Conrad, M. N., and Newlon, C. S. (1982) Curr. Genet. 6, 147. 37. Cabib, E., and Farkas, V. (1971) Proc. Natl. Acad. Sci. USA 68, 2052. 38. Cabib, E., and Bowers, B. (1975) J. Bacterial. 124, 1586. 39. Freifelder, D. (1960) J. Bacterial. 80, 567. 40. Chaffin, W. L. (1985) J. Gen. Microbial. 131, 1853. 41. Pringle, J. R., and Hartwell, L. H. (1981) in The Molecular Biology of the Yeast Saccharomyces:
Life Cycle and Inheritance (Strathem, J. N., Jones, E. W., and Broach, J. R., Eds.) Vol. 1, p. 97. Cold Spring Harbor Laboratory, NY.
42. Sloat, B. F., and Pringle, J. R. (1978) Science 200, 1171. 43. Sloat, B. F., Adams, A., and Pringle, J. R., (1981) J. Cell biol. 89, 395. 44. Lachapelle, M., and Boothroyd, R. E. (1986) Canad. J. Bot. 64, 193. 45. Matile, P., Moor, H., and Robinow, C. F. (1%9) in The Yeasts (Rose, A. H., and Harrison, J. S.,
Eds.), Vol. 1, p. 220, Academic Press, New York. 46. Sentandreu, R., and Northcote, D. H. (1969) J. Gen. Microbial. 55, 393. 47. Cortat, M., Matile, P., and Wiemken, A. (1972) Arch. Mikrobiol. 82, 189. 48. Tkacz, J., and Lampen, J. (1973) J. Bacterial. 113, 1073. 49. Byers, B., and Goetsh, L. (1975) J. Bacterial. 124, 511. 50. Schekman, R., and Novick, P. (1982) in The Molecular Biology of the Yeast Saccharomyces:
Metabolism and Gene Expression (Strathem, J. N., Jones, E. W., and Broach, J. R., Eds.), Vol. 1, p. 361, Cold Spring Harbor Laboratory, NY.
51. Schekman, R. (1982) Trends Biochem. Sci. 7, 243. 52. Novick, P., and Schekman, R. (1983) J. Cell Biol. 96, 541. 53. Schekman, R., and Brawley, V. (1979) Proc. Natl. Acad. Sci. USA 16, 645. 54. Roberts, R. L., Bowers, B., Slater, M. L., and Cabib, E. (1983) Mol. Cell Biol. 3, 922. 55. Byers, B. (1981) in The Molecular Biology of the Yeast Saccharomyces: Life Cycle and Inherit-
ance (Strathem, J. N., Jones, E. W., and Broach, J. R., Eds.), Vol. 1, p. 59, Cold Spring Harbor Laboratory, NY.
56. Alison, E., Adams, M., and Pringle, J. R. (1984) J. Cell Biol. 98, 934. 57. Kilmartin, J. V., and Adams, A. E. M. (1984) J. Cell Biol. 98, 922. 58. Novick, P., and Botstein, D. (1985) Cell 40, 405. 59. Olden, K., Pratt, B. M., Jaworski, C. and Yamada, K. M. (1979) Proc. Natl. Acad. Sci. USA 76,
791.
Received December 18, 1986 Revised version received February 14, 1987
Printed in Sweden


