Embed Size (px)
Citation preview

Effects of Mechanical uncouplers, Diacetyl Monoxime and Cytochalasin-D on the
Electrophysiology of Perfused Mouse Hearts
Linda C. Baker, Robert Wolk, Bum-Rak Choi, Simon Watkins, Patricia Plan, Anisha Shah2, Guy
Salama1
University of Pittsburgh Department of Cell Biology and Physiology and the Department of Medicine, Division of
Cardiology2
Pittsburgh, PA 15261
Running Title: Anti-Arrhythmic Actions of DAM and Cyto-D in Mouse Hearts
Discipline: Experimental; Object of Study: Heart; Level: Organ; Field of Study: Electrophysiology.
Key words and Abbreviations: optical action potentials, APs; intracellular calcium, [Ca2+]i;cytochalasin-D, cyto-D; diacetyl monoxime, DAM; restitution kinetics, RK;
1Corresponding Author:
Guy Salama, PhD University of Pittsburgh, School of Medicine Dept. of Cell Biology and Physiology and Physiology S314 Biomedical Science Tower 3500 Terrace St.Pittsburgh, PA 15261 Phone: 412-648-9354 Fax: 412-648-8330 E-mail: [email protected]
Articles in PresS. Am J Physiol Heart Circ Physiol (June 10, 2004). 10.1152/ajpheart.00234.2004
Copyright © 2004 by the American Physiological Society.

Abstract
Chemical uncouplers, diacetyl monoxime (DAM) and cytochalasin-D (cyto-D) are used
to abolish cardiac contractions in optical studies, yet alter intracellular Ca2+ ([Ca2+]i)
handling and vulnerability to arrhythmias in a species dependent manner. The effects of
uncouplers were investigated in perfused mouse hearts labeled with Rhod-2/AM or di-4-
ANEPPS to map [Cai2+]i transients ( em=585 20 nm) and action potentials (APs), ( em >
610 nm; ex= 530 20 nm). Confocal images showed that Rhod-2 is primarily in the
cytosol. DAM (15 mM) and cyto-D (5 M) increased AP durations (APD75=20.0 3 to 46.6
5 and 39.9 8 ms, respectively, n=4) and refractory periods (RPs=45.14 12.1 to 82.5 3.5
and 78 4.24 ms, respectively). Cyto-D reduced conduction velocity by 20% within 5 min
and DAM by 10% gradually in 1 hour (n=5 each). Uncouplers did not alter the direction and
gradient of repolarization which progressed from apex to base, in 15 3 ms. Peak systolic
[Ca2+]i increased with cyto-D from 743 47 (n=8) to 944 17 nM (n=3, p=0.01) but
decreased with DAM to 398 44 nM (n=3, p < 0.01). Diastolic [Ca2+]i was higher with
cyto-D (544 80 nM, n = 3) and lower with DAM (224 31, n = 3) compared to controls
(257 30 nM, n=3). DAM prolonged [Ca2+]i transients at 75% recovery (54.3 5 to 83.6 1.9
ms), while cyto-D had no effect (58.6 1.2 ms; n=3). Burst pacing routinely elicited long
lasting ventricular tachycardia VT but not fibrillation. Uncouplers flattened the slope of AP
restitution kinetic curves and blocked VT induced by burst pacing.
2

Introduction
Molecularly engineered mice have been extensively used to genetically alter a specific
component of a complex signaling process and to develop models of human diseases. Transgenic
mice are used as models for various cardiac diseases and offer an effective strategy to elucidate
the mechanisms underlying long QT-related arrhythmias, metabolic diseases and the pathology
of heart failure (29). A limitation of mouse models is the small size of the heart making it
difficult to study changes in contractility, electrophysiology and vulnerability to arrhythmias in
intact hearts. The challenge of measuring changes in cardiac phenotype has been partly
overcome by applying optical technique to map electrical activity but a major technical difficulty
in the application of optical techniques to measure APs and [Ca2+]i transients has been the
distortion of the signals by movement due to muscle contractions.
Several approaches have been used to reduce movement artifacts: a) perfusion in Ca2+
free Tyrode’s solution to abolish contractions, an approach applicable to amphibian hearts (38);
b) design perfusion chambers to mechanically stabilize the heart (18, 37); c) perfusion with an
inhibitor of L-type voltage-gated Ca2+ channels, ICa,L to reduce [Ca2+]i and force generations
(16); d) perfusion with a chemical uncoupler of excitation-contraction like diacetyl monoxime
(DAM) and cytochalasin D (cyto-D) to block force by a direct inhibition of the contractile
filaments (5, 14).
Chemical uncouplers can potentially provide a practical approach to block movement
artifacts and have been used to inhibit contractions during optical recordings, particularly for
measurements of the recovery phase of the AP and [Ca2+]i transients which tend to be distorted
by movement artifacts.
DAM acts as a chemical phosphatase, exerts its biological effects by altering protein
phosphorylation and blocks contractions through the inhibition of myosin ATPase activity such
3

that the rise of intracellular [Ca2+]i elicited by an AP fails to generate force (2, 6). However,
DAM also alters repolarization and reduces AP durations (APD) in several species of cardiac
tissues, such as cat ventricular muscles (43), dog Purkinje fibres (4) and guinea pig papillary
muscle (27). In contrast, DAM prolonged APDs in rat Purkinje fibres (12, 13) and mouse
ventricles (3). In sheep and guinea pig ventricular muscles, DAM reduced calcium and
potassium conductance (27).
Cytochalasin-D (Cyto-D) was shown to disrupt F-actin filaments in the cytoskeleton and
unexpectedly blocked contractions by disrupting F-actin in myofibrils with little effect on APDs
of ventricular rat (40) and canine myocytes (5). Cyto-D was considered to be a better uncoupler
than DAM because of its negligible effects on APDs, transmural propagation velocity and
repolarization gradients (5, 44). However, cyto-D was shown to abolish Ca2+ mediated inward
rectification of K+ channels (31) and to modulate the kinetics of voltage-gated Na+ current (40)
by disrupting the cytoskeleton of cardiac myocytes.
The interpretation of optical data obtained using chemical uncouplers must be carefully
re-examined in light of their multiple effects on ionic channels, gap junctions and intracellular
Ca2+ handling in myocytes (12, 13, 21, 27, 28, 30, 39, 42-44). There is also little doubt that the
electrophysiological effects of cyto-D and DAM are species dependent (39) yet they have not
been extensively studied in murine hearts. Here, we examine the effects of cyto-D and DAM
(using the lowest concentrations that block force reliably) on APs and [Ca2+]i transient and on the
vulnerability to arrhythmias in mouse hearts.
4

Methods
Preparations
All animal procedures complied with NIH guidelines and were approved by the IACUC of
the University of Pittsburgh. FVB mice were anaesthetized with pentobarbital (50 mg/kg) and
heparinized (35 mg/kg) with an intra-peritoneal injection. The heart was rapidly excised,
cannulated, placed in a chamber specially designed to immobilize the ventricles, paced, and a
chosen region was imaged on a photodiode array. The perfusate contained (in mM): 112 NaCl,
1.0 KH2PO4, 25.0 NaHCO3, 1.2 MgSO4, 5.0 KCl, 50.0 Dextrose, 1.8 CaCl2, at pH 7.4 and was
gassed with 95% O2 and 5% CO2. Perfusion pressure was adjusted to 60-80 mm Hg by
controlling the flow rate of a peristaltic pump. The temperature of the bath surrounding the heart
was kept at 37o C by continuously monitoring the temperature with a thermistor, which
controlled a heating coil located in the back of the chamber, via a feedback amplifier. In pilot
studies, left ventricular pressure was measured using an intra-ventricular balloon (23) to ensure
that the concentrations of uncoupler effectively blocked contractions. Left ventricular diastolic
and systolic pressures were measured, the heart was allowed to reach a stable steady state then
various concentrations of DAM or cyto-D were added to the perfusate to arrest contractions. The
minimum concentrations of DAM and cyto-D that reliably reduced developed pressure by > 90%
were 15 mM and 5 M, respectively, after 2-5 min of continuous perfusion. Left peak systolic,
end-diastolic pressures, and maximum and minimum dP/dt were measured with a Digi-Med
heart performance analyzer.
Hearts were stained with the voltage-sensitive dye di-4-ANEPPS (10.0 l of 1 mg/ml
dissolved in DMSO) or the calcium indicator dye, Rhod-2 (0.2 mg in 0.2 ml DMSO). The dyes
were delivered as a single one-time bolus through a port in the bubble trap, which served as a
5

compliance chamber and was located proximal to the aortic cannula. [Ca2+]i was calibrated as
previously described (11). Briefly, Rhod-2 exhibits >100-fold increase in fluorescence emission
(F) at 585 nm upon binding to Ca2+ with ex = 530 20 nm. Fmax determined by adding 100 M
2,2’ dithiodipyridine and 10 M A23187 to the port in the bubble trap in perfusate containing 5
mM Ca2+, resulting in a peak F in 2 min. A rapid saturation of [Ca2+]i was achieved because 2,2’
dithiodipyridine elicited rapid release of Ca2+ from the sarcoplasmic reticulum by oxidizing
critical sulfhydryl activating ryanodine receptors while A23187 facilitated Ca2+ entry in heart
cells. (32) Fmin was then determined by perfusing the hearts with perfusate containing 5 mM
EGTA for 20-30 min. The absolute fluorescence intensity recorded during a cardiac AP or a Ca2+
transient is dependent on the optical apparatus, the depth of staining and the physiological
condition of the heart; under the current experimental conditions, the mouse ventricular AP
upstroke and Ca2+ transient produced fractional fluorescence change of 10-12 % and 30-35%,
respectively.
Confocal Images
The subcellular distribution of Rhod-2 was examined by confocal microscopy in perfused mouse
hearts loaded with Rhod-2 to discriminate between mitochondrial vs. cytosolic loading. The
perfused heart was mounted horizontally in a chamber with a Sylgard bottom carved in the shape
of the heart and a 3 mm diameter glass window (0.2 mm thick) on the bottom. The chamber was
placed on the stage of the inverted microscope such that the objective viewed the left ventricular
epicardium. To acquire confocal images, KCl (20 mM) was added to the perfusate to arrest the
heart. An argon laser excited the epicardial surface and fluorescence was collected through a
confocal aperture by a photomultiplier under manual gain and black-level control. Confocal
images were recorded from hearts loaded with Rhod-2 then after perfusion with 20 M digitonin
6
and 2 M free Ca2+ to permeabilize cell membranes and release Rhod-2 trapped in the cytosol
while retaining Rhod-2 trapped in mitochondria and other subcellular organelles. (15)
Optical Apparatus, Computer Interface, Analysis
The optical apparatus, computer interface, and analysis of APs have been previously
described (3). Briefly, light from a 100-W tungsten-halogen lamp was collimated, passed
through a 530 20 nm interference filter, and focused on the epicardial surface of the left
ventricle of the mouse heart. The fluorescence from dye bound to the heart was passed through a
cut-off filter (>610nm) for di-4-ANEPPs or an interference filter (585 20 nm) for Rhod-2. An
image of the heart was focused on a 12X12-element photodiode array of which 124 diodes were
simultaneously monitored. Each diode recorded the summed electrical activity from a 312X312
m2 region of the ventricle with a depth of 70 m. Image magnification was X 4.5 and a 4 X 4
mm2 tissue area was viewed by the array. The photocurrent from each diode was passed through
a current-to-voltage converter (50 M feedback resistor), AC or DC coupled, amplified (1, 50,
200 or 100X), digitized at 2000 frames/sec at a 12-bit resolution (DAP 3200e/214 Microstar
Laboratories) and stored in computer memory.
APDs were determined from measurements of the time point of maximum upstroke velocity,
(dF/dt)max minus the time-point at which the downstroke recovered to 75% back to baseline, that
is APD75. APs with signal to noise ratios of <10 or excessive movement artifact were not
included in the analysis. Conduction velocities were calculated as previously described. (36) The
duration of [Ca2+]i transients was determined from the maximum first derivative of the [Ca2+]i
upstroke to the time point of 75% recovery of [Ca2+]i to its original baseline (DCaT75). The rise
time of the Ca2+ transient was taken as the time-to-peak from the minimum to the maximum of
the [Ca2+]i upstroke (3). [Ca2+]i was calibrated from hearts loaded with Rhod-2 AM, using the
equation: [Ca2+] = Kd * [(F-Fmin)/ (Fmax-F)] where Kd is 710 nM, Fmin is the Rhod-2 fluorescence
7
when all the dye is in the free form or in zero Ca2+ and Fmax is the Rhod-2 fluorescence when all
the dye is bound to Ca2+ or in a Ca2+ saturated solution, as previously described. (11)
Programmed Stimulation
APD was characterized as a function of basic cycle length (CL) using basic pacing at S1-S1
intervals of 40 -200ms, in increments of 20 ms. Based on the measurements of spatial dispersion
of repolarization, single premature stimuli were delivered at decreasing coupling intervals at the
base or apex of the heart. The heart was paced at a basic interval or CL (e.g., S1-S1= 200 ms) for
10 beats to obtain a stable APD. Every 10th beat, an extra impulse S2 was applied to interrupt the
basic CL. The S1-S2 interval was gradually decreased in 1 or 2 ms steps (particularly in the steep
zone of the restitution curve) until S2 failed to capture an AP. The refractory period at that site
was defined as the shortest S1-S2 interval that elicited a propagating AP. Ventricular arrhythmias
in the murine heart were induced by applying a train of stimuli, burst pacing. Burst pacing
consisted of 10 electrical impulses, 1 millisecond in duration, with 15 ms inter-pulse interval at 3
times threshold voltage.
Statistics
Data are presented as mean standard deviation and changes in APDs recorded under
different conditions were compared by paired or unpaired Student's t test, as appropriate. The
results were considered significant for p < 0.05.
Results
Effects of DAM and Cyto-D on mouse AP
A digital picture of a perfused mouse heart is shown mounted in a chamber to abate
movement artifacts without chemical uncouplers, with examples of 4 simultaneously recorded
APs from different sites on the heart (Fig. 1A). The left epicardium faces the optical apparatus
8

and a silhouette of the array is superimposed on the heart to identify the region of optical
recordings. In Figure 1 (panels b-d), the silhouette of the array is illustrated with the AP recorded
by each diode drawn in its respective location from hearts perfused with control solutions (panel
b), 15 mM DAM (panel c) or 5 M cyto-D (panel d). Below each panel, a trace of AP recordings
from a diode at the center of the field of view is shown at a fast sweep speed. Upon the addition
of the chemical uncouplers, there was an immediate (within a minute) and marked prolongation
of APDs with APD75 increasing from 20.0 3 ms in controls (n = 8) to 46.6 5 ms in DAM (n =
4) and 39.9 ms in cyto-D (n = 4) (Table 1). Both uncouplers increased the refractory periods of
the epicardial APs, which would in principle increase the wavelength of reentrant circuits (Table
1). The chemical uncouplers caused marked changes in the shape and time course of APs. In
particular, note the spike and dome appearance of APs in hearts treated with cyto-D.
In control mouse hearts, APDs are shorter at the apex than the base of the left ventricle
producing a gradient of repolarization of 10.4 4.1 ms. (3) Gradients of APDs were within
experimental error similar in controls and hearts treated with chemical uncouplers. In DAM and
cyto-D, APDs increased progressively in going from apex to base with APD75 increasing from
63 4 ms to 69 5 ms with DAM and from 45 5 to 50 8ms with cyto-D.
Effects of Uncouplers on Restitution Kinetics and Conduction Velocity
Abrupt changes in heart rate or the firing of a premature impulse can produce dynamic
heterogeneities of AP amplitudes (APA) and durations. In mouse hearts, APDs are considerably
shorter than in other mammalian hearts, show only a slight variation as a function of rate (Fig.
2A) and tend to have flat APD restitution curves. In the presence of DAM and cyto-D, APDs
varied steeply as a function of cycle length (CL) for long CLs; however, for short CL that are 10-
15 ms above the refractory period, the curve remained flat and close to zero (Fig. 2A). In Figure
2B, the restitution kinetics curve of the AP amplitude is compared before and after the addition
9

of DAM or cyto-D by plotting the AP amplitude (APA) as a function of S1-S2 intervals. With
cyto-D and DAM, the shortest possible S1-S2 intervals were considerably longer than in controls
because the uncouplers increased APDs and refractory periods. As a result, the steep phases of
the restitution kinetics curves at S1-S2 < 75 ms were abolished. From the analysis of AP
recordings from 8 sites per heart, DAM and cyto-D increased the refractory periods from 45.14
2.1 (n = 8 hearts) to 82.5 3.5 (n = 4) and 78 4.24 ms (n = 4), respectively. At the longer S1-S2
intervals (> 75 ms), the chemical uncouplers had a slightly steeper restitution kinetics curves
compared to controls. Cyto-D reduced conduction velocity from 0.55 0.03 m/s in controls to
0.47 0.08 m/s (n=4) which was statistically significant (p <0.01, ANOVA) and there was a
tendency by DAM to reduce velocity from 0.58 0.06 m/s to 0.54 0.04 m/s DAM (n=5) that did
not reach statistical significance (Fig. 2C).
Effects of Uncouplers on Intracellular Ca2+ transients
Hearts were loaded with Rhod-2/AM and the left ventricles were imaged on the array to
record [Ca2+]i transients from multiple sites. A symbolic map of the array and the [Ca2+]i
transients recorded by each diode are shown in their respective locations (Fig. 3A). The shape
and time course of [Ca2+]i transients are shown for 4 diodes at faster sweep speeds (Fig. 3B) from
a heart paced at 200 ms cycle length. Figure 3C compares Ca2+ transients from a control heart
and in the presence of DAM or cyto-D where all 3 signals were calibrated in terms of free
cytosolic Ca2+, as described in methods (Fig. 3C). DAM decreased diastolic and systolic [Ca2+]i
whereas cyto-D increased both (Table 2). DAM produced a statistically significant prolongation
of the duration of [Ca2+]i transients whereas cyto-D had negligible effects (Table 2).
10

Distribution of Rhod-2 in Mouse Ventricular Myocytes
The intracellular distribution of Rhod-2 in perfused murine hearts was examined by
confocal microscopy from hearts loaded with Rhod-2/AM using identical conditions that were
used to load the hearts with Rhod-2 to map [Ca2+]i transients. Confocal images of the Rhod-2
distribution in a cell on the epicardium of the perfused heart revealed a pattern of cytosolic
milieu without the punctate appearance of mitochondrial loading (Fig. 4A, n=4). The loading
procedure resulted in a similar distribution of dye throughout the epicardium with no apparent
hot spots of high Rhod-2 fluorescence which would be expected if the dye was accumulated in
subcellular organelles with higher concentrations of hydrolyzed dye and/or high [Ca2+]i (ie. in the
sarcoplasmic reticulum network or the mitochondria). To verify that Rhod-2 was not trapped in a
subcellular compartment, the heart was perfused with digitonin for 10 min to increase the
permeability of the cellular plasma membrane cells without compromising the integrity of
subcellular organelles. Low Ca2+ (2 M) was used in the perfusate containing digitonin to
maintain a high level of Rhod-2 fluorescence and a normal mitochondrial potential (15). As
shown in Figure 4B, perfusion with digitonin resulted in an extensive loss of Rhod-2 from all
regions of the cells with similar observations made throughout the epicardium, indicating that the
dye was not trapped in subcellular compartments (n=4 hearts).
Anti-Arrhythmic Actions of Uncouplers
The chemical uncouplers prolonged APDs and refractory periods and eliminated the
steep phase of restitution kinetic curves without significantly changing gradients of refractoriness
but decreasing conduction velocity. Because these changes in the myocardial substrate can
potentially reduce the vulnerability to arrhythmias, we tested for the propensity to arrhythmias by
applying burst stimulation in attempts to elicit ventricular tachycardia (VT). The incidence of
arrhythmias in control hearts was compared to that in hearts perfused with a chemical uncoupler.
11
In most control hearts (n = 8/10), one or two bursts (10 pulses per burst) were sufficient to elicit
an immediate monomorphic VT. In a few hearts, several bursts were required to elicit VT
(n=2/10). Most VTs were long lasting, 30 s to an hour (n = 6/10 hearts) (Fig. 5a) or
spontaneously returned to sinus rhythm in 15-20 min (n=4/10). In contrast, burst pacing of
isolated hearts perfused with DAM (Fig. 5b) or cyto-D (Fig. 5c) triggered the firing of APs but
the hearts became quiescent immediately after the end of the burst (n = 5 for cyto-D and n = 5
for DAM). In control hearts, patterns of activation during VTs were highly reproducible
exhibiting stable frequencies ranging from 10-19 Hz, (n = 6) for the duration of the arrhythmia
(Fig. 6).
Discussion
Optical mapping has become an established technique to investigate mechanisms
underlying cardiac arrhythmias, metabolic diseases, and the pathology of heart failure by
providing accurate recordings of cardiac APs and [Ca2+]i transients at high spatial and temporal
resolution. However, muscle contractions produce movement artifacts, which can distort optical
signals raising concerns regarding their validity, particularly of the recovery phase of APs and
[Ca2+]i transients. Mechanical immobilization of the heart has been extensively used to abate
movement artifacts relative to the voltage-dependent component of the optical signal (18, 37).
Another approach has been to block force and movement artifacts by reducing [Ca2+]i with Ca2+
free Tyrode’s solution (38) or blocking L-type Ca2+ channels (16) which alters the substrate
being investigated. Alternatively, pharmacological agents were used as chemical uncouplers of
contractions which ideally eliminate force generation without affecting the shape, time course or
propagation of the cardiac AP or of [Ca2+]i transients. DAM and cyto-D have been extensively
used as chemical uncouplers in cardiomyocytes because they interfere with the contractile
12

apparatus at the level of the myofibrils presumably without significantly changing [Ca2+]i (5, 14)
Unfortunately, these uncouplers are far from ideal and are found to alter the myocardial substrate
through changes intracellular Ca2+ handling, ion channels and AP characteristics in a species
dependent manner.
Multiple Effects of DAM
DAM was first introduced as a nucleophilic agent with phophatase-like activity, that acts
by removing the phosphate groups required for protein activation. Its phosphatase activity
appears to be nonspecific having numerous effects at the cellular level by altering the properties
of ion channels, gap junctions and other intracellular processes regulated by phosphorylation. In
cat ventricular muscle, DAM was found to inhibit contractions and depress the plateau phase of
the action potential (43). DAM has been shown to alter delayed rectifier K+ current and L-type
Ca2+ current in certain species. DAM prolongs APD in mouse and rat but shortens APD in rabbit
and guinea pig hearts yet depresses contraction in all these species. Since DAM has opposite
effects on APDs in different species, the depression of contractions cannot be explained simply
by an inhibition of L-type Ca2+ currents. It has been suggested that the lengthening effect of
DAM on APD results mainly from the simultaneous reduction of both the slow inward calcium
current and the transient outward current, two antagonistic currents with unequal influences on
AP plateau development.(13) In guinea pig myocytes, DAM reduced voltage gated Ca2+ currents
and the inward and delayed rectifying K+ currents. (28)
In rat ventricular myocytes, DAM produced a rapid, dose-dependent, and reversible
blockade of gap junctional conductance (4), that potentially reduced conduction velocity in heart
muscle. Interestingly, DAM reduced gap junction conductance in neonatal rat cardiomyocytes
without changing the phosphorylation state of connexin 43, the main gap junctional protein in rat
hearts.(17) The reduced conductance of connexin 43 without a change in protein phosphorylation
13
state suggested that DAM acted at associated regulatory proteins that determine the functional
state of gap junctions (17) or acted by an entirely different mechanism. Our current results on
mouse hearts are consistent with these previous observations since DAM tended to decrease
conduction velocity in mouse ventricles and prolonged APDs, consistent with observations in rat
heart APs.
DAM was also shown to reduce L-type Ca2+ current in rabbit, rat, and guinea pig
ventricular myocytes. In rat heart trabeculae, DAM at 10-20 mM decreased peak systolic [Ca2+]i
with no significant changes in the time course of [Ca2+]i transients.(1) However, in murine
hearts, we found a substantial prolongation in the duration of [Ca2+]i transients induced by DAM.
Others have shown an increased sensitivity of mouse hearts to changes in [Ca2+]o within the
physiologic range compared to the rat (7) which could account for the different effects of DAM
on [Ca2+]i transient in mice and rats. In the current experiments, the rise time of [Ca2+]i
transients measured at 200 ms cycle length were increased by DAM from 14.1 1.2 to
25.0 3.31 ms (n=5). It is interesting to note that the rise times of [Ca2+]i in mouse hearts (14.1
1.2 ms) were considerably shorter than in guinea pig hearts (25.65 5 ms). (11)
Actions of Cyto-D
The exact molecular basis for cardiac contraction failure induced by cyto-D
remains unknown. Cytochalasins selectively bind to rapidly polymerizing and depolymerizing
actin filaments and disrupt F-actin of the cytoskeleton by binding to the net polymerizing end of
actin filament. Cyto-D has been the agent of choice to disrupt cytoskeletal actin but in skinned
rat myocytes, cyto-D interacts with sarcomeric actin and shifts the force vs. pCa curve to lower
pCa values. (8) The direct interaction of cyto-D with sarcomeric actin can account for the
inhibition of cardiac contractions and the interaction with cytoskeletal actin may account for the
various effects on ion channels. Other experiments suggest that cyto-D (10 M) does not directly
14

bind to cytoskeletal actin but reduces the activation of an actin-depolymerizing factor (cofilin)
that binds to actin, leading to the depolymerization of F-actin and the subsequent reduction of the
Ca2+ current, ICa-L. (35) Similarly, cyto-D was found to reduce the Na+ current through a decrease
in open probability and perhaps by slowing the inactivation rate. (40) The interaction of cyto-D
(10 M) with the cytoskeleton of guinea pig ventricular myocytes has been implicated as the
mechanism for reducing the inward and delayed rectifying K+ currents (31) and for the
acceleration of the run-down of ATP-sensitive K+ (KATP) channels.(19) Jalife et al recorded
optical APs from murine hearts and reported a prolongation of APDs by cyto-D and at higher
concentrations of cyto-D (80 M) reported a ‘hump’ on the plateau phase.(22) In conclusion, the
interplay of all these effects of cyto-D on ion channels must be considered to explain the changes
in AP and [Ca2+]i transients that are elicited by cyto-D.
Restitution Kinetics and Ventricular Arrhythmias
The restitution kinetics of APs was measured by pacing the heart at a basic cycle length
(S1-S1=200 ms) for 10 beats then applying a premature stimulus at varying S1-S2 intervals. The
short duration of the mouse heart AP made it difficult to detect small decreases in APDs of the
premature beats, particularly during the steep slope of the restitution curve. We therefore plotted
the restitution of APA that depends on the restitution of inward currents (INa and ICa) and
indirectly on K+ repolarizing currents. We have previously shown that APA decreases with
decreasing S1-S2 interval in mice. (3)
DAM and cyto-D prolonged APDs in mouse ventricles as well as the APD vs. cycle
length and AP amplitude restitution curve. The changes in APD as a function of cycle length are
most likely mediated by rate dependent changes in Ca2+ and K+ conductance. (10) DAM and
cyto-D caused marked changes in the restitution curve of AP amplitude; both increased
refractoriness, made the curve steeper at long cycle lengths and flatter at short cycle lengths.
15

Their effects on refractoriness may be due to their actions on both depolarizing and repolarizing
currents which in the mouse are dominated by voltage gated sodium and calcium channels, INa,
ICa-L and by the transient outward currents I t.o.,f and I t.o.,s. more related to the delayed rectifier
potassium current as previously described in other species.
Electrical restitution has been suggested to play an important role in the initiation and
maintenance of arrhythmias.(24) The rationale behind the restitution kinetics hypothesis is that a
dynamic change in APD (i.e. long to short APD) causes the subsequent wave front to encounter
refractory myocardium resulting in unidirectional conduction block and wave breakup, which
promotes the initiation and maintenance of VF. (24) Theoretical and experimental studies have
proposed that the slope of the restitution curve can serve as an index of vulnerability to
arrhythmia. (9, 20, 25, 33, 34) If the slope is > 1, a small perturbation in diastolic interval (DI)
produces a larger change in APD, which becomes amplified upon iteration. Eventually, DI
reaches a value shorter than the refractory period resulting in local conduction block, wave break
and turbulence.
Hearts treated with cyto-D or DAM had flatter restitution curves and had a reduced
vulnerability to arrhythmias, which is consistent with the restitution kinetics hypothesis. Indeed,
burst pacing consistently elicited ventricular arrhythmias in control mice but in hearts treated
with an uncoupler, all attempts to induce an arrhythmia failed (n = 5/5 for DAM and n = 5/5 for
DAM). The anti-arrhythmic actions of chemical uncouplers in murine hearts could also be due to
the lengthening of reentrant wavelengths as a result of prolonged APDs and slower conduction
velocity. In swine hearts, Lee et al showed that DAM converts ventricular fibrillation (VF) to
tachycardia whereas cyto-D did not alter the organization or dynamics of fibrillation. (26)
16

Can Mouse Ventricles Fibrillate?
Vaidya et al challenged the critical mass hypothesis for fibrillation by showing that VT
(n=4/5) and VF (n=4/7) could be induced by burst pacing the small heart of a mouse. (41) In
contrast, the present experiments failed to elicit VF even in mice that were not treated with a
chemical uncoupler. Here, VTs were readily obtained by burst pacing, were long lasting and did
not progress to VF. It should be noted; however, that the stimulation protocol used by Vaidya et
al was significantly different from the current protocol, as multiple bursts (20 stimuli each) of
different cycle length (shorter than that needed for 1:1 capture), of various stimulation strengths
and at various location were needed to elicit VT or VF.(41) In addition, VF was only observed in
hearts that were not perfused with DAM and the numbers of bursts needed to elicit VF and the
duration of VF episodes was not reported. (41)
Distribution of Rhod-2 in mouse Hearts
This study validates the measurement of cytosolic [Ca2+]i in perfused mouse hearts with
Rhod-2. A criticism against the use of Rhod-2 to measure cytosolic [Ca2+]i is that the dye has a
positive charge, which results in dye accumulation in the mitochondria (due to their negative
potential inside-120 to –180 mV). The mitochondrial content could raise the background
fluorescence and give errors in diastolic and systolic [Ca2+]i. We have previously shown in
perfused rabbit hearts that Rhod-2 can be used to selectively measure intracellular cytosolic
calcium with negligible contributions from dye loaded in mitochondria, sarcoplasmic reticulum
or nuclei. In addition, Rhod-2 loaded in endothelial cells was minimal making it the best dye to
measure cytosolic [Ca2+]i transients in intact hearts. (15) We further examined the distribution of
Rhod-2 in isolated guinea pig hearts and showed that the dye was remarkably selective for the
cytosol and did not load in mitochondria compared to Fura-2 and Fluo-3. (15) Here, we
examined the distribution of Rhod-2 in mouse hearts by loading perfused hearts with Rhod-2,
17

immobilizing the heart with 20 mM KCl and placing the immobilized heart on a confocal
microscope. As shown in figure 4A, epicardial cells from the perfused heart were effectively and
rapidly loaded with Rhod-2 within 5-10 min after passing a bolus of dye with the coronary
perfusate. Rhod-2 fluorescence did not exhibit a punctate appearance of mitochondrial loading
that is typically seen with tetramethylrhodamine ethyl ester (TMRE, a voltage sensitive dye used
to measure mitochondrial potential). (15) The subsequent perfusion of the same hearts with
digitonin revealed that Rhod-2 became freely permeable across the plasma membrane and within
5-10 min diffused out of the cells and was washed out by the perfusion. No significant dye was
found trapped in subcellular organelles (Fig. 4B). Similar results were obtained with confocal
images of mouse, guinea pig and rabbit myocytes. Thus, reports of mitochondrial dye
accumulation appear to be highly dependent on staining conditions (temperature and time).
Reversibility of Chemical Uncouplers
Most studies observed an effective recovery of contractions after washing out DAM but
not after wash out cyto-D. In mouse hearts perfused with DAM or cyto-D (at concentrations that
decreased left ventricular pressure by 90%), the subsequent wash out of the uncouplers
partially reversed the suppression of developed pressure by 50% of the original pressure with
cyto-D and 70% with DAM. Other studies in mouse myocytes and canine trabeculae showed that
the block of force by cyto-D could not be reversed by extensive washing. (5, 22) Our partial
recovery of force after treatment with cyto-D in the present experiments was most likely due to
the lower concentrations used to block contractions.
In summary, DAM and cyto-D inhibit contraction but are far from being ideal uncouplers
and should be used with caution in studies of arrhythmia mechanisms because of marked effects
on APs, [Ca2+]i transients, APDs, conduction velocity and refractoriness.
18

Acknowledgements
This study was supported by National Institutes of Health (NIH) grants HL
59614, HL 57929 and HL 69097 to Dr. G. Salama, HL-70250 to Dr. Barry London and
Postdoctoral Fellowships from the Western Pennsylvania Affiliate of the American Heart
Association to Drs. L Baker, R. Wolk, A. Shah and B-R Choi. The authors thank William
Hughes of our Departmental machine shop for the construction of optical components
and the mouse chamber and Greg J. Szekeres of our Departmental electronic shop for
building the computer interface.
19

References
1. Backx PH, Gao WD, Azan-Backx MD, and Marban E. Mechanism of force inhibition by 2,3-butanedione monoxime in rat cardiac muscle: roles of [Ca2+]i and cross-bridge kinetics. JPhysiol 476: 487-500, 1994. 2. Backx PH, Gao WD, Azan-Backx MD, and Marban E. Regulation of intracellular calcium in cardiac muscle. Adv Exp Med Biol 346: 3-10, 1993. 3. Baker LC, London B, Choi BR, Koren G, and Salama G. Enhanced dispersion of repolarization and refractoriness in transgenic mouse hearts promotes reentrant ventricular tachycardia. Circ Res 86: 396-407, 2000. 4. Bergey JL, McCallum JD, and Nocella K. Antiarrhythmic evaluation of verapamil,nifedipine, perhexiline and skf 525-A in four canine models of cardiac arrhythmias. Eur J Pharmacol 70: 331-343, 1981. 5. Biermann M, Rubart M, Moreno A, Wu J, Josiah-Durant A, and Zipes DP.Differential effects of cytochalasin D and 2,3 butanedione monoxime on isometric twitch force and transmembrane action potential in isolated ventricular muscle: implications for opticalmeasurements of cardiac repolarization. J Cardiovasc Electrophysiol 9: 1348-1357, 1998. 6. Blanchard EM, Smith GL, Allen DG, and Alpert NR. The effects of 2,3-butanedione monoxime on initial heat, tension, and aequorin light output of ferret papillary muscles. PflugersArch 416: 219-221, 1990. 7. Brooks WW and Conrad CH. Differences between mouse and rat myocardialcontractile responsiveness to calcium. Comp Biochem Physiol A Mol Integr Physiol 124: 139-147, 1999. 8. Calaghan SC, White E, Bedut S, and Le Guennec JY. Cytochalasin D reduces Ca2+sensitivity and maximum tension via interactions with myofilaments in skinned rat cardiacmyocytes. J Physiol 529 Pt 2: 405-411, 2000. 9. Cao JM, Qu Z, Kim YH, Wu TJ, Garfinkel A, Weiss JN, Karagueuzian HS, and Chen PS. Spatiotemporal heterogeneity in the induction of ventricular fibrillation by rapid pacing: importance of cardiac restitution properties. Circ Res 84: 1318-1331, 1999. 10. Carmeliet E. Repolarisation and frequency in cardiac cells. J Physiol (Paris) 73: 903-923, 1977. 11. Choi BR and Salama G. Simultaneous maps of optical action potentials and calciumtransients in guinea-pig hearts: mechanisms underlying concordant alternans. J Physiol 529 Pt 1: 171-188, 2000. 12. Coulombe A, Lefevre IA, Deroubaix E, and Coraboeuf E. Effect of diacetyl monoxime on transient outward current in rat ventricular myocytes. Pflugers Arch 414 Suppl 1: S173-174, 1989. 13. Coulombe A, Lefevre IA, Deroubaix E, Thuringer D, and Coraboeuf E. Effect of 2,3-butanedione 2-monoxime on slow inward and transient outward currents in rat ventricular myocytes. J Mol Cell Cardiol 22: 921-932, 1990. 14. Davidenko JM, Pertsov AV, Salomonsz R, Baxter W, and Jalife J. Stationary and drifting spiral waves of excitation in isolated cardiac muscle. Nature 355: 349-351, 1992. 15. Del Nido PJ, Glynn P, Buenaventura P, Salama G, and Koretsky AP. Fluorescence measurement of calcium transients in perfused rabbit heart using rhod 2. Am J Physiol 274: H728-741, 1998.
20

16. Dillon SM. Optical recordings in the rabbit heart show that defibrillation strength shocks prolong the duration of depolarization and the refractory period. Circ Res 69: 842-856, 1991. 17. Duthe F, Dupont E, Verrecchia F, Plaisance I, Severs NJ, Sarrouilhe D, and Herve JC. Dephosphorylation agents depress gap junctional communication between rat cardiac cells without modifying the Connexin43 phosphorylation degree. Gen Physiol Biophys 19: 441-449, 2000.18. Efimov IR, Huang DT, Rendt JM, and Salama G. Optical mapping of repolarization and refractoriness from intact hearts. Circulation 90: 1469-1480, 1994. 19. Furukawa T, Yamane T, Terai T, Katayama Y, and Hiraoka M. Functional linkage of the cardiac ATP-sensitive K+ channel to the actin cytoskeleton. Pflugers Arch 431: 504-512, 1996.20. Gilmour RF and Chialvo DR. Electrical restitution, critical mass, and the riddle of fibrillation. J Cardiovasc Electrophysiol 10: 1087-1089., 1999. 21. Gwathmey JK, Hajjar RJ, and Solaro RJ. Contractile deactivation and uncoupling of crossbridges. Effects of 2,3-butanedione monoxime on mammalian myocardium. Circ Res 69: 1280-1292, 1991. 22. Jalife J, Morley GE, Tallini NY, and Vaidya D. A fungal metabolite that eliminatesmotion artifacts. J Cardiovasc Electrophysiol 9: 1358-1362, 1998. 23. Kameyama T, Chen Z, Bell SP, Fabian J, and LeWinter MM. Mechanoenergetic studies in isolated mouse hearts. Am J Physiol 274: H366-374, 1998. 24. Karma A. Electrical alternans and spiral wave breakup in cardiac tissue. Chaos 4: 461-472, 1994. 25. Karma A. Spiral breakup in model equations of action potential propagation in cardiac tissue. Physical Review Letters 71: 1103-1106, 1993. 26. Lee MH, Lin SF, Ohara T, Omichi C, Okuyama Y, Chudin E, Garfinkel A, Weiss JN, Karagueuzian HS, and Chen PS. Effects of diacetyl monoxime and cytochalasin D on ventricular fibrillation in swine right ventricles. Am J Physiol Heart Circ Physiol 280: H2689-2696, 2001. 27. Li T, Sperelakis N, Teneick RE, and Solaro RJ. Effects of diacetyl monoxime on cardiac excitation-contraction coupling. J Pharmacol Exp Ther 232: 688-695, 1985. 28. Liu Y, Cabo C, Salomonsz R, Delmar M, Davidenko J, and Jalife J. Effects of diacetyl monoxime on the electrical properties of sheep and guinea pig ventricular muscle.Cardiovasc Res 27: 1991-1997, 1993. 29. London B. Cardiac arrhythmias: from (transgenic) mice to men. J CardiovascElectrophysiol 12: 1089-1091, 2001. 30. Lopatin AN and Nichols CG. 2,3-Butanedione monoxime (BDM) inhibition of delayed rectifier DRK1 (Kv2.1) potassium channels expressed in Xenopus oocytes. J Pharmacol Exp Ther 265: 1011-1016, 1993. 31. Mazzanti M, Assandri R, Ferroni A, and DiFrancesco D. Cytoskeletal control of rectification and expression of four substates in cardiac inward rectifier K+ channels. Faseb J 10: 357-361, 1996. 32. Prabhu SD and Salama G. Reactive disulfide compounds induce Ca2+ release fromcardiac sarcoplasmic reticulum. Arch Biochem Biophys 282: 275-283, 1990. 33. Qu Z, Weiss JN, and Garfinkel A. Cardiac electrical restitution properties and stability of reentrant spiral waves: a simulation study. Am J Physiol 276: H269-283., 1999. 34. Riccio ML, Koller ML, and Gilmour RF. Electrical restitution and spatiotemporalorganization during ventricular fibrillation. Circ Res 84: 955-963., 1999.
21

35. Rueckschloss U and Isenberg G. Cytochalasin D reduces Ca2+ currents via cofilin-activated depolymerization of F-actin in guinea-pig cardiomyocytes. J Physiol 537: 363-370, 2001.36. Salama G, Kanai A, and Efimov IR. Subthreshold stimulation of Purkinje fibers interrupts ventricular tachycardia in intact hearts. Experimental study with voltage-sensitive dyes and imaging techniques. Circ Res 74: 604-619, 1994. 37. Salama G, Lombardi R, and Elson J. Maps of optical action potentials and NADH fluorescence in intact working hearts. Am J Physiol 252: H384-394, 1987. 38. Salama G and Morad M. Merocyanine 540 as an optical probe of transmembraneelectrical activity in the heart. Science 191: 485-487, 1976. 39. Sellin LC and McArdle JJ. Multiple effects of 2,3-butanedione monoxime. PharmacolToxicol 74: 305-313, 1994. 40. Undrovinas AI, Shander GS, and Makielski JC. Cytoskeleton modulates gating of voltage-dependent sodium channel in heart. Am J Physiol 269: H203-214, 1995. 41. Vaidya D, Morley GE, Samie FH, and Jalife J. Reentry and fibrillation in the mouseheart. A challenge to the critical mass hypothesis. Circ Res 85: 174-181, 1999. 42. Verrecchia F and Herve JC. Reversible blockade of gap junctional communication by 2,3-butanedione monoxime in rat cardiac myocytes. Am J Physiol 272: C875-885, 1997. 43. Wiggins JR, Reiser J, Fitzpatrick DF, and Bergey JL. Inotropic actions of diacetyl monoxime in cat ventricular muscle. J Pharmacol Exp Ther 212: 217-224, 1980. 44. Wu J, Biermann M, Rubart M, and Zipes DP. Cytochalasin D as excitation-contraction uncoupler for optically mapping action potentials in wedges of ventricular myocardium. J Cardiovasc Electrophysiol 9: 1336-1347, 1998.
22
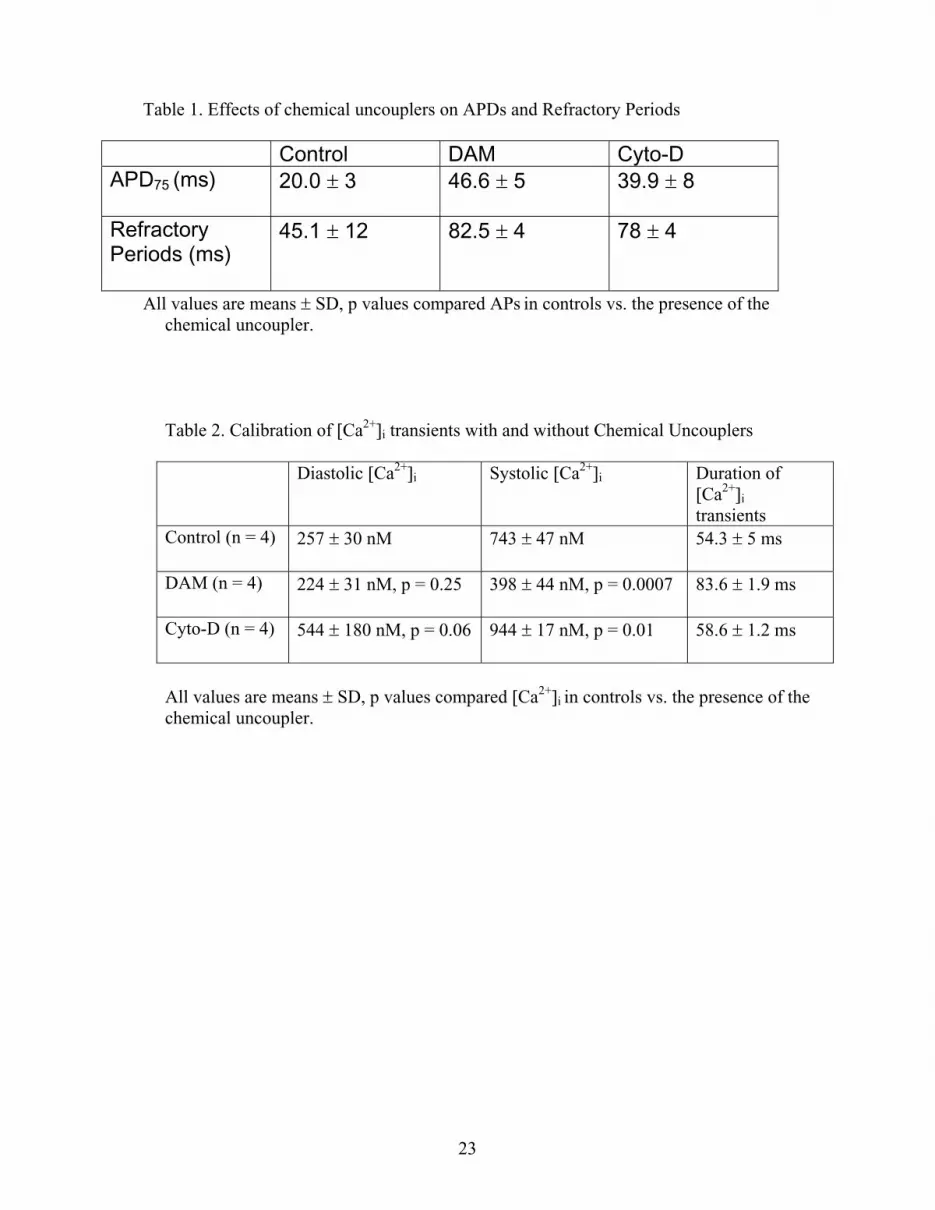
Table 1. Effects of chemical uncouplers on APDs and Refractory Periods
Control DAM Cyto-DAPD75 (ms) 20.0 3 46.6 5 39.9 8
RefractoryPeriods (ms)
45.1 12 82.5 4 78 4
All values are means SD, p values compared APs in controls vs. the presence of the chemical uncoupler.
Table 2. Calibration of [Ca2+]i transients with and without Chemical Uncouplers
Diastolic [Ca2+]i Systolic [Ca2+]i Duration of[Ca2+]i
transientsControl (n = 4) 257 30 nM 743 47 nM 54.3 5 ms
DAM (n = 4) 224 31 nM, p = 0.25 398 44 nM, p = 0.0007 83.6 1.9 ms
Cyto-D (n = 4) 544 180 nM, p = 0.06 944 17 nM, p = 0.01 58.6 1.2 ms
All values are means SD, p values compared [Ca2+]i in controls vs. the presence of the chemical uncoupler.
23
Figure Legends
Figure 1. Mapping Electrical Activity of Mouse Hearts
a: Digital picture of a mouse heart placed in a chamber designed to reduce movement artifacts. A
silhouette of the array is superimposed on the left ventricle of the mouse heart to identify the
region of tissue viewed by the photodiode array. APs recorded simultaneously from 4 regions of
the ventricle are illustrated to demonstrate the quality of signals sampled at 12-bit resolution,
1,000 frames per s, from a 330x330 m2 area of tissue.
b, c and d: Effects of Chemical Uncouplers on mouse APs
Optical APs were recorded from control (b), DAM (c) and Cyto-D (d) treated hearts then
displayed on a symbolic map of the array, where each box represents a diode in which the AP
recorded by that diode is shown. Optical APs from 1 diode are shown at a fast sweep speed to
illustrate the marked changes in the time course and shape of AP elicited by DAM and cyto-D.
Note the prolongation of APDs with DAM and cyto-D and the spike and dome appearance of AP
in cyto-D.
Figure 2. Effects of DAM and cyto-D on Restitution Kinetics and Conduction velocity
a) Plot of APD75 vs. CL for control hearts compared to perfusion with DAM and cyto-D.
Each data point represents the mean of APD75 measured from 8 diodes at the center of the
array times 4 hearts, before and after perfusion with DAM or cyto-D. Data obtained before
perfusion with a chemical uncoupler are grouped in one trace. DAM and cyto-D enhanced
the rate dependence of APDs in mouse hearts. The SD of each data point was 5% of the
mean.
b) Restitution kinetics of the AP amplitude. Hearts were paced at a basic CL (S1-S1=200
ms) and every 10th beat, a premature impulse was applied at varying S1-S2 intervals.
24

S1-S2 varied in steps of 5 ms and then steps of 1-ms as S1-S2 approached the refractory
period. Note that DAM and cyto-D increased refractory periods. The SD of each data
point was 5% of the mean.
c) Conduction velocities in control, DAM or cyto-D. At time, t = 0 DAM or cyto-D were
added to the perfusate and conduction velocity was measured every 5 min for an hour.
The SD of each data point was 5% of the mean.
Figure 3. Effects of Chemical Uncouplers on [Ca2+]i transients
a) Map of simultaneously recorded [Ca2+]i transients from a mouse heart loaded with Rhod-
2. The [Ca2+]i transients recorded by each diode are drawn in their location in the
symbolic map of the array.
b) [Ca2+]i transients recorded in control conditions from four diodes are shown at fast
sweep speed.
c) Calibration of [Ca2+]i transients for controls and hearts perfused with DAM or cyto-D.
Diastolic and systolic [Ca2+]i levels increased with Cyto-D but decreased with DAM.
Figure 4. Distribution of Rhod-2 in Murine Heart
a) Confocal fluorescence image of epicardial cells from a mouse heart loaded with Rhod-
2/AM and perfused with dye-free Ringer’s solution. Rhod-2 images did not produce a
punctuate appearance typical of mitochondrial dye loading but exhibited a rather
homogeneous distribution of fluorescence with the expected exclusion of dye from
regions dense with contractile proteins.
b) The possibility that Rhod-2/AM diffuses, accumulates and becomes trapped in the
mitochondria was further tested by permeabilizing the cells with digitonin, which
25

allowed for the washout of cytosolic Rhod-2 with no detectable levels of Rhod-2 trapped
in mitochondria.
Figure 5. Anti-Arrhythmic Effects of Uncouplers
Burst stimulation was applied after a basic drive rate (S1-S1=200 ms) of 10 beat and was
followed by an interruption of pacing. Burst stimulation applied near the apex of the left
ventricle failed to produce arrhythmias in hearts perfused with DAM (n = 5) (A) or cyto-D (n =
5) (B). In contrast, burst pacing of control mouse hearts induced VT (n = 8/10). Dark Bar
denotes the interval during which burst pacing was applied.
Figure 6. A) Action Potentials from a mouse heart one minute after the arrhythmia began.
This an example of optical action potentials from one diode recorded from a control mouse
with no addition of DAM or Cyto-D.
B) FFT Spectra of a mouse heart one minute after the arrhythmia began. FFT spectra were
analyzed over a 1.25 second time interval. Per spectra of voltage oscillations displayed a
monomorphic VT with one single dominant frequency of 13 Hz.
C) Activation Map from a mouse heart one minute after the arrhythmia began. In this and
subsequent activation maps, the first site to depolarize is depicted in “light gray” (i.e., time
t=0.0ms) and subsequent depolarizations are depicted in increasingly darker shades, with
isochronal lines 1 ms apart.
D) Action Potentials from a mouse heart three minutes after the arrhythmia began.
26

E) FFT Spectra of a mouse heart three minutes after the arrhythmia began. The FFT
spectrum analyzed over a 1.25 second interval, displayed a power spectrum with one single
dominant frequency of 12.5 Hz indicative of a monomorphic VT.
F) Activation map from the mouse heart three minutes after the onset of VT.
27

Figure 1
Time (sec)
Time (sec) Time (sec)
0.2 sec
a) Ventricular Action Potentials b) Control
c) DAM d) Cyto-D

Figure 2
0
20
40
60
80
100
120
0 20 40 60 80 100 120 140 160 180 200
S1-S2 Interval (ms)
% A
PA
ControlDAMCyto-D
b)
a)
c)
0
0.1
0.2
0.3
0.4
0.5
0.6
0.7
0.8
0.9
1
0 10 20 30 40 50 60Minutes
Velo
city
(m/s
)
ControlDAMCyto-D
0
10
20
30
40
50
60
70
40 60 80 100 120 140 160 180 200
Cycle Length (ms)
APD
75(m
s)
ControlDAMCyto-D

Figure 3
a)
b)
0.5 1.0 1..5 2.0
0
200
400
600
800
1000
Control Cyto-D
DAM
Time (sec)
Cai
Time (sec)
c)
(nM)

Figu
re 4
a)
b)

Figure 5
a) DAM
b) Cyto-D
c) Control
Time (sec)
Time (sec)
Time (sec)
Burst Pacing
Burst Pacing
Pacing
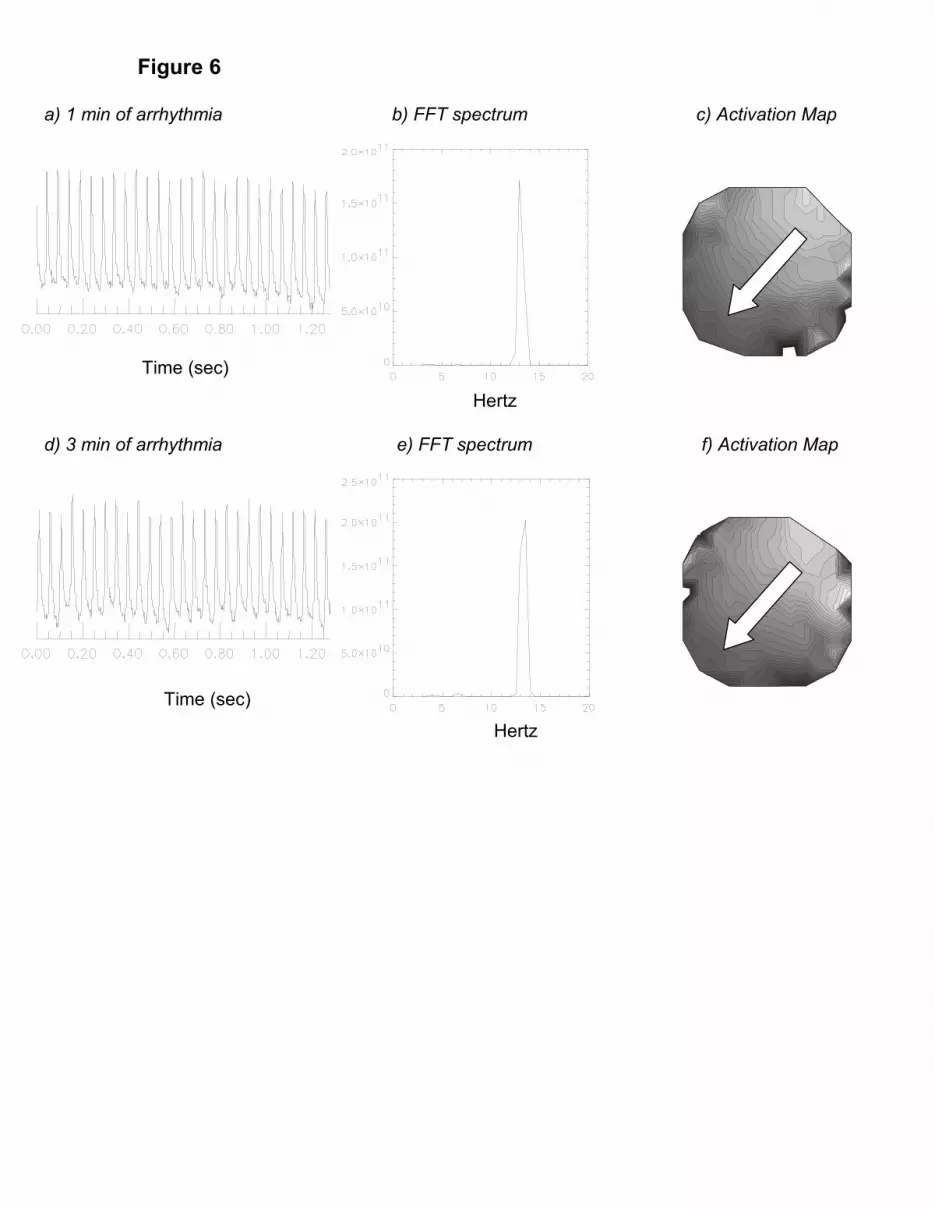
Figure 6
Time (sec)
Hertz
a) 1 min of arrhythmia b) FFT spectrum c) Activation Map
d) 3 min of arrhythmia e) FFT spectrum f) Activation Map
Hertz
Time (sec)

![Investigation of factors affecting fluorometric quantitation of cytosolic [Ca2+] in perfused hearts](https://img.pdfslide.net/doc/110x75/634ddcabd38be601b805ed3b/investigation-of-factors-affecting-fluorometric-quantitation-of-cytosolic-ca2.jpg)


