Embed Size (px)
Citation preview
Effects of Saltwater Pulses on Soil Microbial Enzymes and OrganicMatter Breakdown in Freshwater and Brackish Coastal Wetlands
Shelby Servais1,2 & John S. Kominoski1 & Carlos Coronado-Molina3 & Laura Bauman1& Stephen E. Davis4 &
Evelyn E. Gaiser1 & Stephen Kelly3 & Christopher Madden3& Viviana Mazzei1 & David Rudnik5 & Fabiola Santamaria3 &
Fred H. Sklar3 & Joseph Stachelek3,6 & Tiffany G. Troxler1,7 & Benjamin J. Wilson1
Received: 26 June 2019 /Revised: 14 January 2020 /Accepted: 23 January 2020# This is a U.S. government work and its text is not subject to copyright protection in the United States; however, its text may be subject to foreign copyright
protection 2020
Abstract
Coastal freshwater and brackish wetlands are exposed to pulses of saltwater during times of reduced freshwater flows (i.e., dry seasons,
droughts), periodic storm surges, and increased tidal extent associated with rising seas. The effects of saltwater pulses on belowground
processing rates of detrital organicmatter asmediated bymicrobial activities are uncertain. Our objectiveswere to quantifywhether and
how pulses of saltwater (i) change soil porewater physicochemistry, (ii) change soil microbial extracellular enzyme activities, and (iii)
change root litter breakdown over time in freshwater and brackish marshes. From 2014 to 2016, we simulated saltwater intrusion as
monthly in situ pulsed additions of artificial seawater in experimental dosing chambers (1.4m diameter) within freshwater and brackish
marshes of Everglades National Park. At monthly intervals, we collected soil porewater chemistry, and measured microbial extracel-
lular enzymes, elemental stoichiometric ratios, and breakdown rates (k) of incubated (0–30 cm depth) root litter and compared these
responses over time. Saltwater pulses increased sulfate and nitrogen concentrations in porewater at the freshwater site. However,
saltwater pulses generally decreased porewater constituents (e.g., dissolved organic carbon, dissolved nitrogen and phosphorus species)
at the brackish site. One saltwater pulse increased root litter k by 1.25-fold in the brackish marsh. However, long-term (740 days) k in
brackish wetlands, and both short- and long-term k in freshwater wetlands, were not affected by 24 monthly pulses of saltwater.
Enzyme activities fluctuated with time and did not respond to multiple saltwater pulses. Our results suggest that detrital organic matter
stocks and associated soil microbial activities are relatively resistant to single and multiple (n = 24) pulses of saltwater.
Keywords Saltwater intrusion . Extracellular enzyme activities . Peat collapse . Root litter breakdown . Everglades . Coastal
wetlands
Communicated by Zhanfei Liu
Electronic supplementary material The online version of this article
(https://doi.org/10.1007/s12237-020-00708-1) contains supplementary
material, which is available to authorized users.
* Shelby Servais
1 Department of Biological Sciences and Southeast Environmental
Research Center, Florida International University, Miami, FL 33199,
USA
2 Present address: United States Department of Agriculture, National
Institute of Food and Agriculture, Kansas City, MO 64133, USA
3 Everglades Systems Assessment Section, South Florida Water
Management District, West Palm Beach, FL 33406, USA
4 Everglades Foundation, Palmetto Bay, FL 33157, USA
5 Everglades National Park, Homestead, FL 33034, USA
6 Department of Fisheries and Wildlife, Michigan State University,
East Lansing, MI 48824, USA
7 Sea Level Solutions Center, Florida International University,
Miami, FL 33199, USA
Estuaries and Coasts
https://doi.org/10.1007/s12237-020-00708-1
Introduction
Organic matter breakdown is a fundamental ecosystem process
that contributes to the regulation of carbon (C) storage and
nutrient cycling (Hoorens et al. 2003). Ecosystem C storage at
large spatial scales is dependent upon the transformation of C
mediated by microbial and biochemical processes (Sinsabaugh
and Follstad Shah 2012). It is important to understand how
ecosystems maintain or lose stored C and how biogeochemical
processes are altered by changing environmental conditions
(Chambers et al. 2019). Across diverse ecosystems, a positive
balance between inputs relative to losses of organic matter sup-
ports soil accretion and C storage (Chapin et al. 2006, Nyman
et al. 2006, McKee 2011). This balance is important in wetland
ecosystems where slow breakdown of organic matter resulting
from submersion and burial in low oxygen promotes C accu-
mulation in the soil (Mitsch and Gosselink 2007). Furthermore,
the rate of soil organic matter breakdown relative to rates of
autotrophic organic C inputs determines the rates of nutrient
cycling and soil accretion or subsidence (Newman et al.
2001) and overall net ecosystem C storage (Chapin et al. 2006).
Organic-rich soils are prevalent throughout peat-based wet-
lands like the Florida Everglades (Craft and Richardson 2008),
but loss of soil elevation is likely a landscape-scale feature of
sea-level rise and saltwater intrusion (Wanless and Vlaswinkel
2005; Day et al. 2011; Wilson et al. 2018; Chambers et al.
2019). For example, historic peat collapse, or soil subsidence,
likely led to the formation of coastal bays in the Everglades
(Wanless and Vlaswinkel 2005). Recently, soil elevation loss
in the Everglades has accelerated and has been linked to in-
creased microbial breakdown (Chambers et al. 2015) and to
reductions in fine root biomass associated with saltwater intru-
sion (Wilson et al. 2018; Charles et al. 2019). Additionally,
reduced plant inputs of root and detritus into the soil organic
matter pool have been hypothesized to transition wetlands from
C sinks to C sources (Chambers et al. 2019). With accelerating
rates of sea-level rise and reduced freshwater flows to the sea,
coastal freshwater wetlands are increasingly threatened by nov-
el exposure to saltwater which alters soil biogeochemistry
(White and Kaplan 2017; Tully et al. 2019), thereby increasing
microbial breakdown and stimulating organic C loss (Craft
2007; Chambers et al. 2011; Weston et al. 2011; Herbert et al.
2018). Despite increases in saltwater intrusion from drought,
sea-level rise, and freshwater diversion (Herbert et al. 2015;
Tully et al. 2019), few studies have directly tested the effects
of saltwater additions on C cycling in coastal wetland soils
(Servais et al. 2019).
Soil microbes are considered “first responders” and rapidly
change community structure and function upon exposure to
environmental stimuli (Chambers et al. 2016; Herbert et al.
2018). Soil microbial extracellular enzymes catalyze the reac-
tion of high-molecular-weight organic matter into assimilable
forms (Dick 1994, Schimel andWeintraub 2003), which enable
microbial communities to obtain C and limiting nutrients
(Burns 1982). The relationship between extracellular enzyme
activities and the rate of breakdown of organic material in wet-
lands is well documented (Jackson et al. 1995, Freeman et al.
1996, Kang and Freeman 1999, Schimel and Weintraub 2003).
Increased enzyme activities can increase the rate of organic
matter breakdown, and previous studies have tested how chang-
ing environmental conditions can alter the relationship between
enzyme activities and the breakdown of organic matter (Allison
and Vitousek 2004; Rejmánková and Sirová 2007). However, it
is unclear how environmental changes (e.g., saltwater pulses)
affect the relationship between enzyme activities and organic
matter breakdown. Both increases (Morrissey et al. 2014) and
decreases (Servais et al. 2019) in extracellular enzyme activities
have been reported with elevated salinity, but both studies re-
ported decreased soil organic matter C with elevated salinity.
Quantifying how microbial extracellular enzyme activities and
organic matter breakdown rates change with exposure to salt-
water pulses is needed to the potential mechanisms of microbe-
mediated C loss in coastal wetlands undergoing saltwater intru-
sion (Chambers et al. 2015, 2016, 2019).
Here, we tested how short- and long-term responses of soil
microbes to monthly pulsed saltwater additions affect soil C in
freshwater and brackish wetlands. We used the Florida
Coastal Everglades as a model system to investigate the ef-
fects of saltwater pulses on the breakdown of soil organic
matter. The Everglades is particularly vulnerable to saltwater
intrusion because of declines in seasonal freshwater delivery
(McIvor et al. 1994, Odum et al. 1995, Sklar et al. 2002), a
naturally low topographic incline (Ross et al. 2000), and rap-
idly increasing rates of sea-level rise (Wdowinski et al. 2016,
Dessu et al. 2018). Our objectives were to test how both single
(i.e., one pulse) and multiple (i.e., 24 pulses over two years)
saltwater pulses affect microbial activities and in situ organic
matter processing rates in freshwater compared to brackish
marshes of Everglades National Park. We quantified effects
of saltwater pulses on porewater chemistry, microbial extra-
cellular enzyme activity associated with bulk soil and root
litter, bulk soil, and root litter elemental stoichiometry, and
root litter breakdown rates (k). We used a path analysis to
identify how changes in k were explained by differences in
porewater chemistry, extracellular enzyme activity, and organ-
ic matter stoichiometry at each marsh. We hypothesized that if
soils are exposed to saltwater pulses, then extracellular en-
zyme activities would be inhibited. We also hypothesized that
soils exposed to repeated saltwater pulses would have higher
microbial extracellular enzyme activities that affect organic
matter C and nutrient concentrations (i.e., increased soluble
reactive P, total inorganic N, sulfate, and dissolved organic C
[DOC]). We also predicted that microbe-mediated increases in
root litter C and nutrient concentrations and decreases in
C:nutrient ratios would lead to increased root litter breakdown
rates (Fig. 1).
Estuaries and Coasts
Methods
Study Marshes
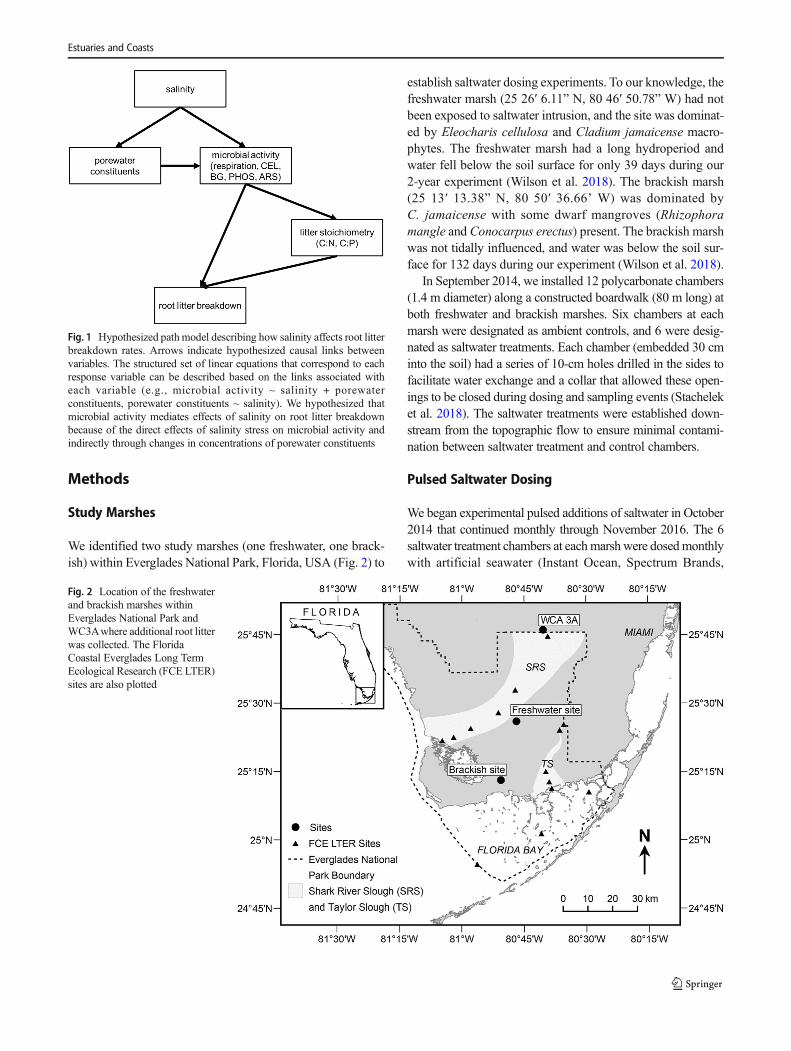
We identified two study marshes (one freshwater, one brack-
ish) within Everglades National Park, Florida, USA (Fig. 2) to
establish saltwater dosing experiments. To our knowledge, the
freshwater marsh (25 26′ 6.11” N, 80 46′ 50.78” W) had not
been exposed to saltwater intrusion, and the site was dominat-
ed by Eleocharis cellulosa and Cladium jamaicense macro-
phytes. The freshwater marsh had a long hydroperiod and
water fell below the soil surface for only 39 days during our
2-year experiment (Wilson et al. 2018). The brackish marsh
(25 13′ 13.38” N, 80 50′ 36.66’ W) was dominated by
C. jamaicense with some dwarf mangroves (Rhizophora
mangle and Conocarpus erectus) present. The brackish marsh
was not tidally influenced, and water was below the soil sur-
face for 132 days during our experiment (Wilson et al. 2018).
In September 2014, we installed 12 polycarbonate chambers
(1.4 m diameter) along a constructed boardwalk (80 m long) at
both freshwater and brackish marshes. Six chambers at each
marsh were designated as ambient controls, and 6 were desig-
nated as saltwater treatments. Each chamber (embedded 30 cm
into the soil) had a series of 10-cm holes drilled in the sides to
facilitate water exchange and a collar that allowed these open-
ings to be closed during dosing and sampling events (Stachelek
et al. 2018). The saltwater treatments were established down-
stream from the topographic flow to ensure minimal contami-
nation between saltwater treatment and control chambers.
Pulsed Saltwater Dosing
We began experimental pulsed additions of saltwater in October
2014 that continued monthly through November 2016. The 6
saltwater treatment chambers at eachmarsh were dosedmonthly
with artificial seawater (Instant Ocean, Spectrum Brands,
Fig. 2 Location of the freshwater
and brackish marshes within
Everglades National Park and
WC3Awhere additional root litter
was collected. The Florida
Coastal Everglades Long Term
Ecological Research (FCE LTER)
sites are also plotted
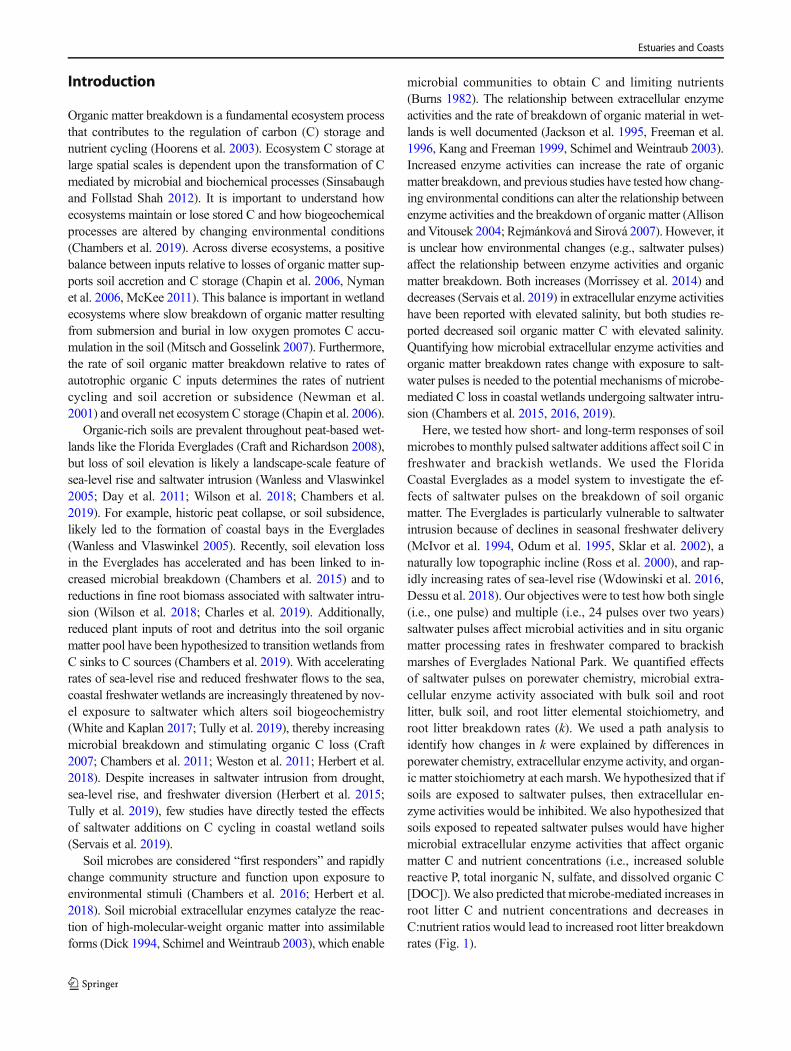
Fig. 1 Hypothesized path model describing how salinity affects root litter
breakdown rates. Arrows indicate hypothesized causal links between
variables. The structured set of linear equations that correspond to each
response variable can be described based on the links associated with
each variable (e.g., microbial activity ~ salinity + porewater
constituents, porewater constituents ~ salinity). We hypothesized that
microbial activity mediates effects of salinity on root litter breakdown
because of the direct effects of salinity stress on microbial activity and
indirectly through changes in concentrations of porewater constituents
Estuaries and Coasts
Blacksburg, VA, USA; Atkinson and Bingman 1997) mixed
with ambient water obtained at or near each study site.We dosed
the equivalent amount of site water to the 6 control chambers at
each marsh. Dosing mixtures for saltwater treatments were ad-
justed, to control for dilution, based on ambient conditions at the
study marsh each month to account for seasonal changes in
water level and surface water salinity at each marsh. We used
a mass balance equation for the volume of dose-water to be
added to each mesocosm as described in Stachelek et al.
(2018). Our target was to double ambient porewater salinities
at freshwater and brackish sites for 24 h post-dosing. Therefore,
the target porewater salinity for the brackish marsh was 20 ppt,
and the salinity of the dosing solution ranged from 30.7–
65.0 ppt (Stachelek et al. 2018). The target porewater salinity
for the freshwater marsh was 5 ppt, and the salinity of the dosing
solution ranged from 26.8 to 68.0 ppt.
Before each dosing event, experimental dosing chambers
were sealed to maintain treatment exposure. Artificial seawa-
ter solution was pumped through a hose to irrigate the surface
of each treatment chamber. We were careful to not apply the
dosing mixture directly on the vegetation and rinsed plants off
with freshwater immediately following dosing. We kept the
chambers closed for 24 h post-dosing to allow the dosing
water to mix with the porewater; after sampling, we reopened
the dosing chambers to allow for ambient exchange and to
minimize any chamber effects.
Porewater Physicochemistry
Three porewater sippers with an aquarium aeration stone
(4 cm long × 1 cm diameter) were inserted to a 15-cm depth
within each chamber. Porewater was collected monthly, 24 h
after each dosing event, using a 60-mL syringe by placing
suction on the sipper and evacuating at least one sipper vol-
ume before sampling. Water was field filtered (0.7-μm GF/F)
into clean HDPE bottles. Porewater was analyzed for temper-
ature, salinity, and pH immediately after extraction using a
YSI Model 600 XL (Xylem, Inc., Yellow Springs, OH, USA).
Porewater soluble reactive phosphorus (SRP), total dis-
solved P (TDP), and total dissolved N (TDN) were analyzed
by the South Florida Water Management District Water
Quality Laboratory on an Alpkem Flow Solution Analyzer
(OI Analytical, College Station, TX, USA) following
Standard Method 4500-P F (SRP) and Solorzano and Sharp
(1980, TDP). Ammonium (NH4+) and dissolved inorganic N
(DIN) were measured using a Lachat Flow Injection Analyzer
(Lachat Instruments, Loveland, CO, USA) following
Standard Method 4500-NH3 H (NH4+) or Standard Method
4500-N C (DIN). Sulfate (SO42−) was analyzed using an ion
chromatograph (Metrohm 881, Riverview, FL, USA).
Dissolved organic C (DOC) was analyzed using a Shimadzu
TOC-L analyzer (Shimadzu Scientific Instruments, Columbia,
MD, USA) following Standard Method 5310 B. Alkalinity
and pH were determined using an automated titrator
(Metrohm 855 Titrator, Herisau, Switzerland) following
Standard Method 2320 B (Alkalinity) and a modification to
Standard Method 4500 H+ B (pH). Chloride (Cl−) and sulfate
(SO42−) were measured using aMetrohm 881 Compact IC Pro
System (Metrohm, Riverview, FL, USA) following Standard
Method 4110 B. Porewater sulfide (HS−) concentrations were
quantified following the methods of McKee et al. (1988). Soil
redox potential was measured using standard techniques
(Faulkner et al. 1989). Briefly, three platinum-tipped probes
were inserted to 15 cm depth in each plot and allowed to
equilibrate for 30 min before measurement.
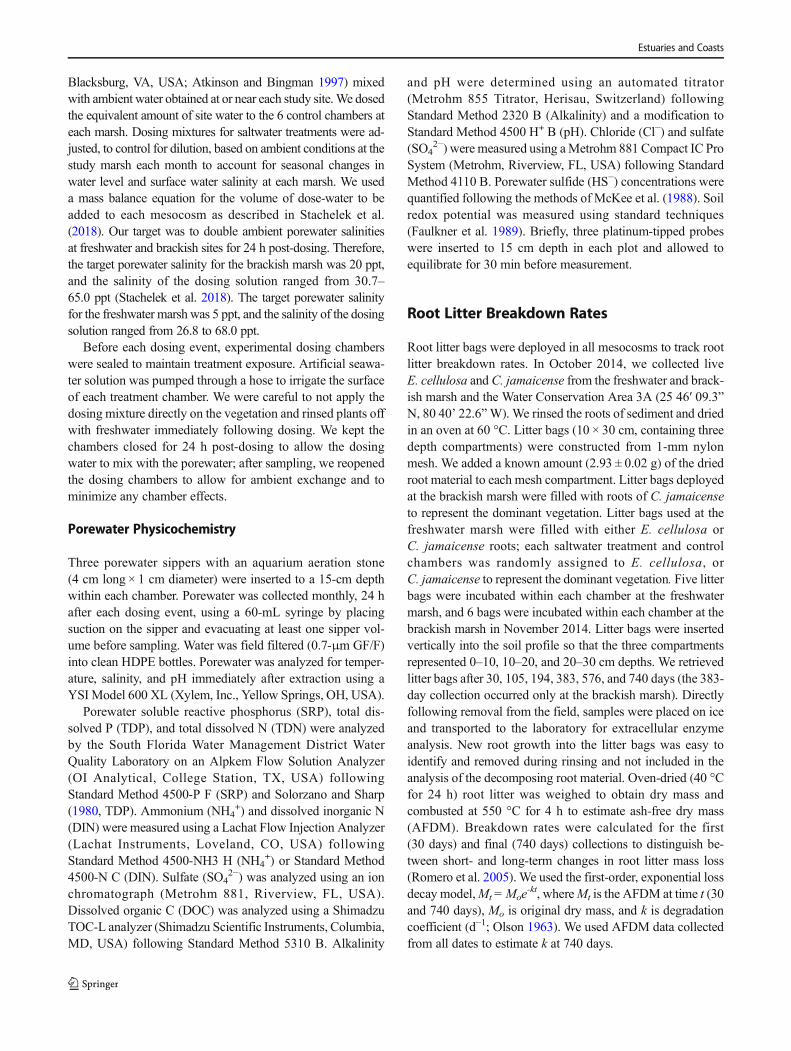
Root Litter Breakdown Rates
Root litter bags were deployed in all mesocosms to track root
litter breakdown rates. In October 2014, we collected live
E. cellulosa and C. jamaicense from the freshwater and brack-
ish marsh and the Water Conservation Area 3A (25 46′ 09.3”
N, 80 40’ 22.6”W).We rinsed the roots of sediment and dried
in an oven at 60 °C. Litter bags (10 × 30 cm, containing three
depth compartments) were constructed from 1-mm nylon
mesh. We added a known amount (2.93 ± 0.02 g) of the dried
root material to each mesh compartment. Litter bags deployed
at the brackish marsh were filled with roots of C. jamaicense
to represent the dominant vegetation. Litter bags used at the
freshwater marsh were filled with either E. cellulosa or
C. jamaicense roots; each saltwater treatment and control
chambers was randomly assigned to E. cellulosa, or
C. jamaicense to represent the dominant vegetation. Five litter
bags were incubated within each chamber at the freshwater
marsh, and 6 bags were incubated within each chamber at the
brackish marsh in November 2014. Litter bags were inserted
vertically into the soil profile so that the three compartments
represented 0–10, 10–20, and 20–30 cm depths. We retrieved
litter bags after 30, 105, 194, 383, 576, and 740 days (the 383-
day collection occurred only at the brackish marsh). Directly
following removal from the field, samples were placed on ice
and transported to the laboratory for extracellular enzyme
analysis. New root growth into the litter bags was easy to
identify and removed during rinsing and not included in the
analysis of the decomposing root material. Oven-dried (40 °C
for 24 h) root litter was weighed to obtain dry mass and
combusted at 550 °C for 4 h to estimate ash-free dry mass
(AFDM). Breakdown rates were calculated for the first
(30 days) and final (740 days) collections to distinguish be-
tween short- and long-term changes in root litter mass loss
(Romero et al. 2005). We used the first-order, exponential loss
decay model,Mt=Moe-kt, whereMt is the AFDM at time t (30
and 740 days), Mo is original dry mass, and k is degradation
coefficient (d−1; Olson 1963). We used AFDM data collected
from all dates to estimate k at 740 days.
Estuaries and Coasts
Root Litter Elemental Content and Stoichiometry
Root litter nutrient accumulation or loss was tracked by mea-
suring elemental C, N, and P content and their ratios. We
calculated the absolute mass as the product of dry mass re-
maining and C, N, or P content of litter following the methods
of Davis III et al. (2003). After retrieval from the field, we
rinsed the roots of sediment and dried them in an oven at
60 °C. Subsamples of root litter were ground to a homoge-
neous powder using a ball mill (Spex CertiPrep, Metuchen,
New Jersey) and analyzed for %C, %N, and %P content. Root
tissue %C and %N were analyzed using a Carlo Erba
Elemental Analyzer (Carlo Erba, Milan, Italy), and %P was
determined acid digestion of ground, combusted samples that
were analyzed spectrophotometrically (Solórzano and Sharp
1980). Molar ratios (C:N, C:P, N:P) were calculated for all
root samples. The elemental content of root litter was also
measured on a subsample of the initial starting material.
E. cellulosa was 45.0 %C, 0.35% N, and 0.02 %P.
C. jamaicense was 45.8 %C, 0.3 %N, and 0.03 %P.
Extracellular Enzyme Potential
We measured extracellular enzyme activities on root litter,
after it was rinsed of sediment, during each litter bag collec-
tion. We measured the fluorometric activities of the following
extracellular enzymes with the substrate (in parentheses): acid
phosphatase (4-MUF- phosphate), arylsulfatase (4-MUF- sul-
fate), β-1,4-glucosidase (4-MUF- β-D glucopyranoside), β-
1,4-cellobiosidase (4-MUF- β-D cellobioside), and leucine
aminopeptidase (L-Leucine-7-amido-4-methylcoumarin hy-
drochloride) using previously described methods (Saiya-
Cork et al. 2002). Briefly, root litter subsamples (approximate-
ly 1 g) were taken from each root litter bag compartment,
homogenized in 60 mL of 50 mM of sodium acetate buffer,
and loaded onto a 96-well plate with the appropriate substrate
(Servais et al. 2019). Fluorescence was read at 365 nm exci-
tation and 450 nm emission using a Synergy H1 microplate
reader (BioTek, Winooski, Vermont, USA). We incorporated
blanks and controls within each microplate to account for
autofluorescence and quenching.
Bulk Soil Properties
In addition to root litter bag collections, we collected soil cores
(2.3 cm diameter × 30 cm deep) after 2 years of monthly ex-
perimental dosing. We collected one core from each chamber
and sectioned it into three depths (0–10, 10–20, 20–30 cm).
We analyzed soil at each depth section for extracellular en-
zyme potential and %C, %N, and%P, as well as C:N, C:P, and
N:P molar ratios, as described above. To estimate the mass of
the living microorganisms within the soil, we determined the
microbial biomass C from soil subsamples from the 0–10 and
10–20 cm depths using chloroform fumigation and potassium
sulfate extraction methods following Vance et al. (1987).
Dissolved organic C samples were analyzed with a
Shimadzu 5000 TOC Analyzer (Shimadzu Scientific
Instruments, Columbia, MD, USA). We calculated microbial
biomass C as the difference in DOC between non-fumigated
and fumigated samples.
Data Analyses
We calculated the average salinity, pH, alkalinity, DOC, TDN,
NH4+, SRP, TDP, SO4
2−, HS−, temperature, and soil redox
measured 24 h after each monthly dosing event for 2 years
for each marsh site. We compared means of all biogeochem-
ical parameters usingWelch’s two-sample t test. We compared
enzyme potential (acid phosphatase, alkaline phosphatase,
arylsulfatase, β-1,4-glucosidase, β-1,4-cellobiosidase, and
leucine aminopeptidase), root liter proportion AFDM remain-
ing, and root litter stoichiometry (%C, %N, %P, C:N, C:P,
N:P) among control and saltwater treatment chambers using
a two-way repeated measure analysis of variance
(rmANOVA). For the brackish marsh, treatment (n = 2) and
date (n = 6) were fixed factors, and chamber was a random
factor. For the freshwater marsh treatment (n = 2), date (n =
5), and species of the litter were fixed factors, and chamber
was a random factor. We analyzed each soil depth (0–10, 10–
20, and 20–30 cm) separately. All two-way rmANOVA anal-
yses were assessed for temporal differences using the least
squared means (LSMEANS), with the date as a model effect
(R package lsmeans, Lenth 2017). All proportion data (pro-
portion AFDM root litter remaining, %C, %N, and %P) were
transformed by taking the arcsine square root of each datum
before the analysis. For soil extracellular enzyme activity
measured at year two, we compared the saltwater treatment
to control within each marsh using Welch’s two-sample t test.
All statistical analyses were performed using RStudio version
1.0.136 (R Core Team 2017).
We used a path analysis to estimate hypothesized correla-
tions between variables (e.g., Manning et al. 2015). We con-
structed a path model with hypothesized links based on pre-
vious studies of how stoichiometry, salinity, and enzyme ac-
tivities affect litter breakdown rates (e.g., Servais et al. 2019,
Fig. 1). We used eleven predictor variables for root litter k
when it was affected by our saltwater treatment: phosphatase,
arylsulfatase, β-1,4-glucosidase, and β-1,4-cellobiosidase en-
zyme activities, salinity, litter C:N, litter C:P, porewater DOC,
porewater TN and TDN, porewater SRP, and porewater SO42
−. We removed links from the model to improve model parsi-
mony in cases where maintaining a specific link had a negli-
gible impact on the overall model fit based on nonsignificant
parameter estimates. We evaluated the support for each model
based on Akaike’s Information Criterion (AIC; Anderson and
Burnham 2002). To increase the number of replicates in our
Estuaries and Coasts
path analysis, we used individual replicates of k, C:N, C:P, and
extracellular enzyme activities from each depth.
Results
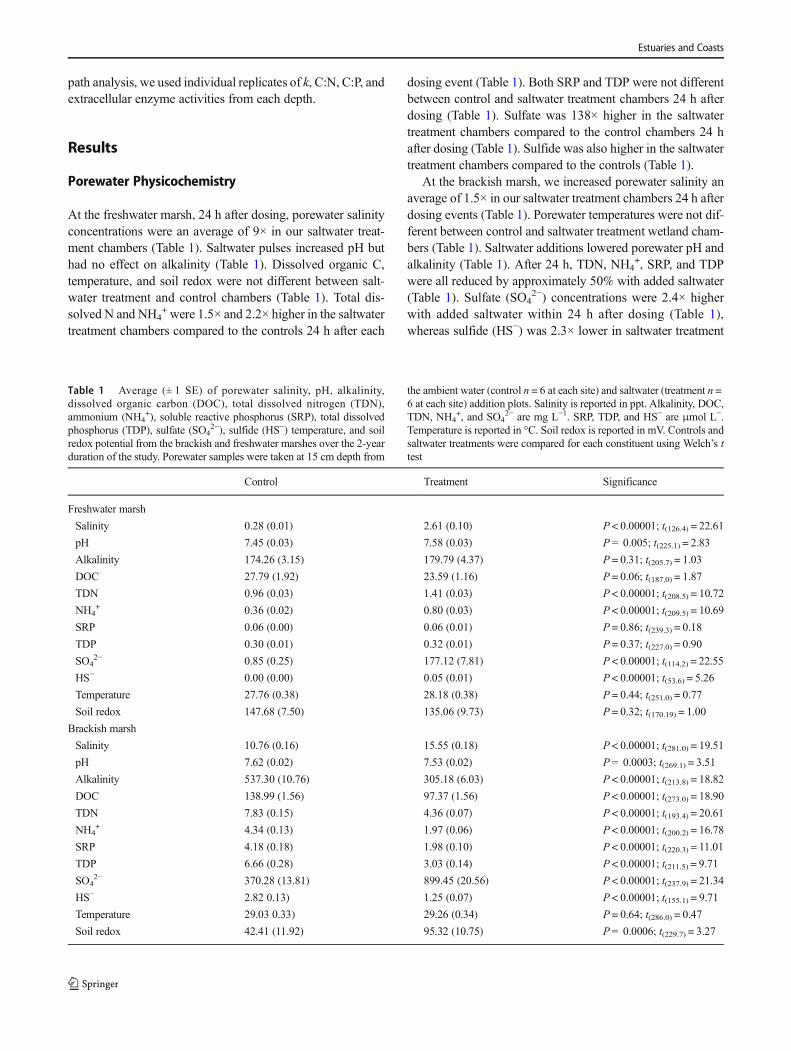
Porewater Physicochemistry
At the freshwater marsh, 24 h after dosing, porewater salinity
concentrations were an average of 9× in our saltwater treat-
ment chambers (Table 1). Saltwater pulses increased pH but
had no effect on alkalinity (Table 1). Dissolved organic C,
temperature, and soil redox were not different between salt-
water treatment and control chambers (Table 1). Total dis-
solved N and NH4+were 1.5× and 2.2× higher in the saltwater
treatment chambers compared to the controls 24 h after each
dosing event (Table 1). Both SRP and TDP were not different
between control and saltwater treatment chambers 24 h after
dosing (Table 1). Sulfate was 138× higher in the saltwater
treatment chambers compared to the control chambers 24 h
after dosing (Table 1). Sulfide was also higher in the saltwater
treatment chambers compared to the controls (Table 1).
At the brackish marsh, we increased porewater salinity an
average of 1.5× in our saltwater treatment chambers 24 h after
dosing events (Table 1). Porewater temperatures were not dif-
ferent between control and saltwater treatment wetland cham-
bers (Table 1). Saltwater additions lowered porewater pH and
alkalinity (Table 1). After 24 h, TDN, NH4+, SRP, and TDP
were all reduced by approximately 50% with added saltwater
(Table 1). Sulfate (SO42−) concentrations were 2.4× higher
with added saltwater within 24 h after dosing (Table 1),
whereas sulfide (HS−) was 2.3× lower in saltwater treatment
Table 1 Average (± 1 SE) of porewater salinity, pH, alkalinity,
dissolved organic carbon (DOC), total dissolved nitrogen (TDN),
ammonium (NH4+), soluble reactive phosphorus (SRP), total dissolved
phosphorus (TDP), sulfate (SO42−), sulfide (HS−) temperature, and soil
redox potential from the brackish and freshwater marshes over the 2-year
duration of the study. Porewater samples were taken at 15 cm depth from
the ambient water (control n = 6 at each site) and saltwater (treatment n =
6 at each site) addition plots. Salinity is reported in ppt. Alkalinity, DOC,
TDN, NH4+, and SO4
2− are mg L−1. SRP, TDP, and HS− are μmol L−.
Temperature is reported in °C. Soil redox is reported in mV. Controls and
saltwater treatments were compared for each constituent using Welch’s t
test
Control Treatment Significance
Freshwater marsh
Salinity 0.28 (0.01) 2.61 (0.10) P < 0.00001; t(126.4) = 22.61
pH 7.45 (0.03) 7.58 (0.03) P= 0.005; t(225.1) = 2.83
Alkalinity 174.26 (3.15) 179.79 (4.37) P = 0.31; t(205.7) = 1.03
DOC 27.79 (1.92) 23.59 (1.16) P = 0.06; t(187.0) = 1.87
TDN 0.96 (0.03) 1.41 (0.03) P < 0.00001; t(208.5) = 10.72
NH4+ 0.36 (0.02) 0.80 (0.03) P < 0.00001; t(209.5) = 10.69
SRP 0.06 (0.00) 0.06 (0.01) P = 0.86; t(239.3) = 0.18
TDP 0.30 (0.01) 0.32 (0.01) P = 0.37; t(227.0) = 0.90
SO42− 0.85 (0.25) 177.12 (7.81) P < 0.00001; t(114.2) = 22.55
HS− 0.00 (0.00) 0.05 (0.01) P < 0.00001; t(53.6) = 5.26
Temperature 27.76 (0.38) 28.18 (0.38) P = 0.44; t(251.0) = 0.77
Soil redox 147.68 (7.50) 135.06 (9.73) P = 0.32; t(170.19) = 1.00
Brackish marsh
Salinity 10.76 (0.16) 15.55 (0.18) P < 0.00001; t(281.0) = 19.51
pH 7.62 (0.02) 7.53 (0.02) P= 0.0003; t(269.1) = 3.51
Alkalinity 537.30 (10.76) 305.18 (6.03) P < 0.00001; t(213.8) = 18.82
DOC 138.99 (1.56) 97.37 (1.56) P < 0.00001; t(273.0) = 18.90
TDN 7.83 (0.15) 4.36 (0.07) P < 0.00001; t(193.4) = 20.61
NH4+ 4.34 (0.13) 1.97 (0.06) P < 0.00001; t(200.2) = 16.78
SRP 4.18 (0.18) 1.98 (0.10) P < 0.00001; t(220.3) = 11.01
TDP 6.66 (0.28) 3.03 (0.14) P < 0.00001; t(211.5) = 9.71
SO42− 370.28 (13.81) 899.45 (20.56) P < 0.00001; t(237.9) = 21.34
HS− 2.82 0.13) 1.25 (0.07) P < 0.00001; t(155.1) = 9.71
Temperature 29.03 0.33) 29.26 (0.34) P = 0.64; t(286.0) = 0.47
Soil redox 42.41 (11.92) 95.32 (10.75) P= 0.0006; t(229.7) = 3.27
Estuaries and Coasts
compared to control chambers (Table 1). Soil redox was ap-
proximately 50 mV higher in the saltwater treatment com-
pared to the control chambers (Table 1).
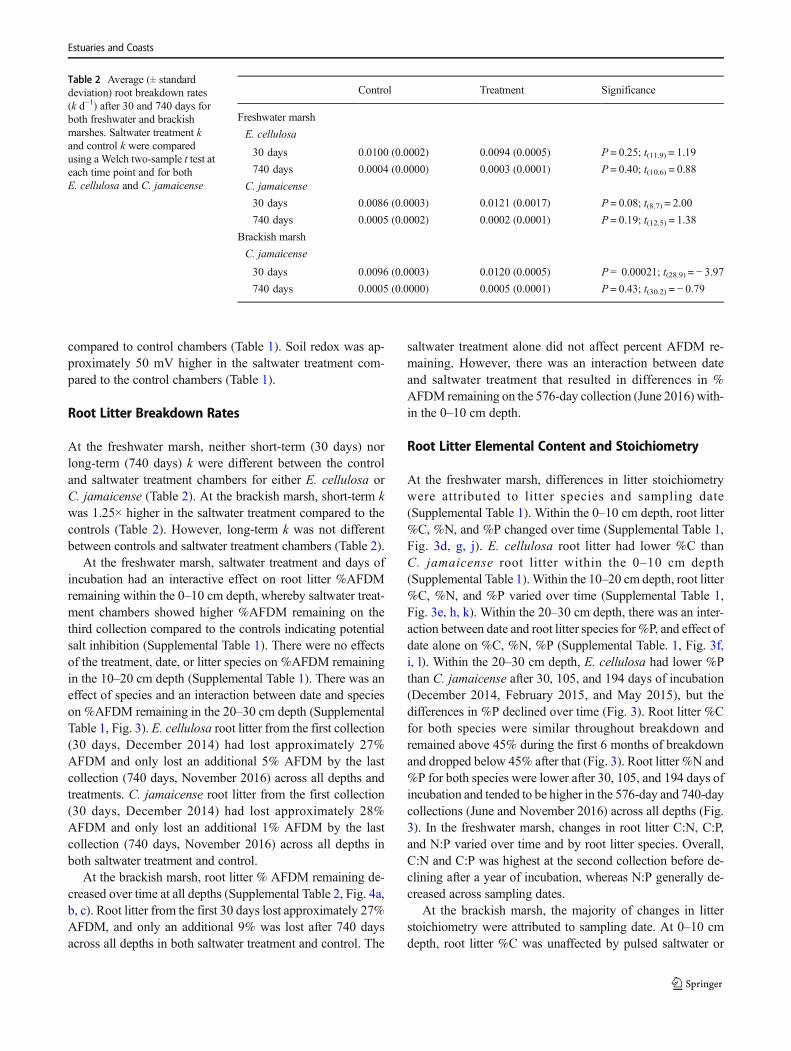
Root Litter Breakdown Rates
At the freshwater marsh, neither short-term (30 days) nor
long-term (740 days) k were different between the control
and saltwater treatment chambers for either E. cellulosa or
C. jamaicense (Table 2). At the brackish marsh, short-term k
was 1.25× higher in the saltwater treatment compared to the
controls (Table 2). However, long-term k was not different
between controls and saltwater treatment chambers (Table 2).
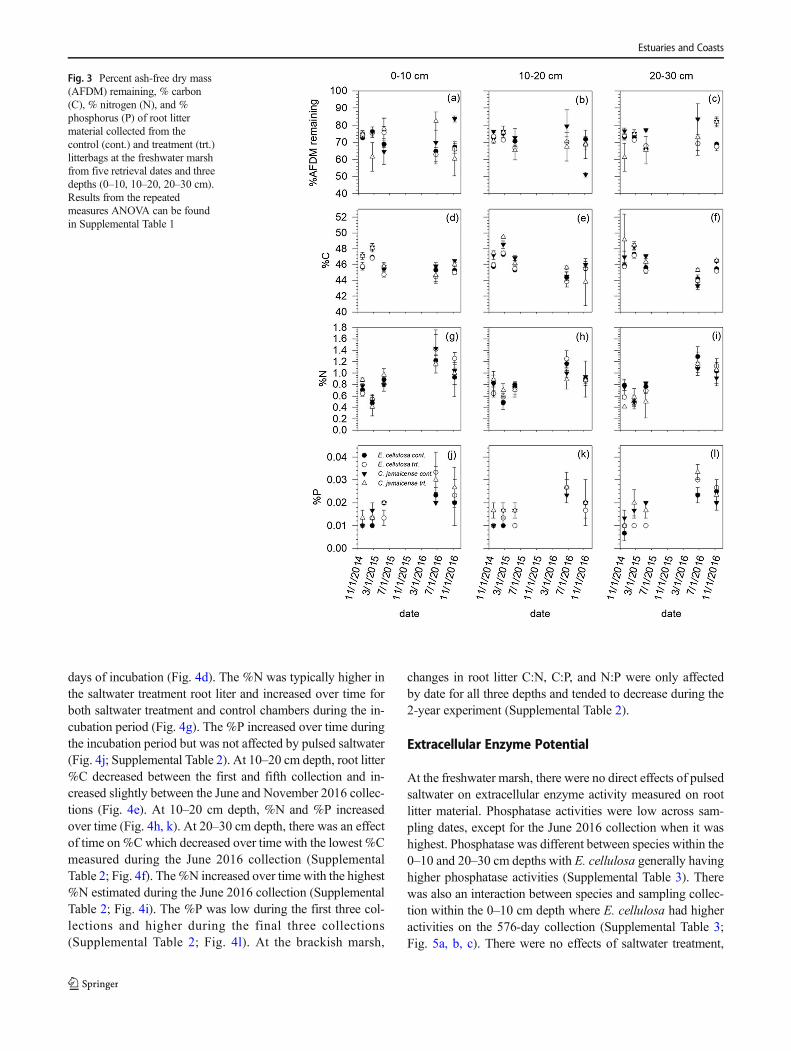
At the freshwater marsh, saltwater treatment and days of
incubation had an interactive effect on root litter %AFDM
remaining within the 0–10 cm depth, whereby saltwater treat-
ment chambers showed higher %AFDM remaining on the
third collection compared to the controls indicating potential
salt inhibition (Supplemental Table 1). There were no effects
of the treatment, date, or litter species on %AFDM remaining
in the 10–20 cm depth (Supplemental Table 1). There was an
effect of species and an interaction between date and species
on %AFDM remaining in the 20–30 cm depth (Supplemental
Table 1, Fig. 3). E. cellulosa root litter from the first collection
(30 days, December 2014) had lost approximately 27%
AFDM and only lost an additional 5% AFDM by the last
collection (740 days, November 2016) across all depths and
treatments. C. jamaicense root litter from the first collection
(30 days, December 2014) had lost approximately 28%
AFDM and only lost an additional 1% AFDM by the last
collection (740 days, November 2016) across all depths in
both saltwater treatment and control.
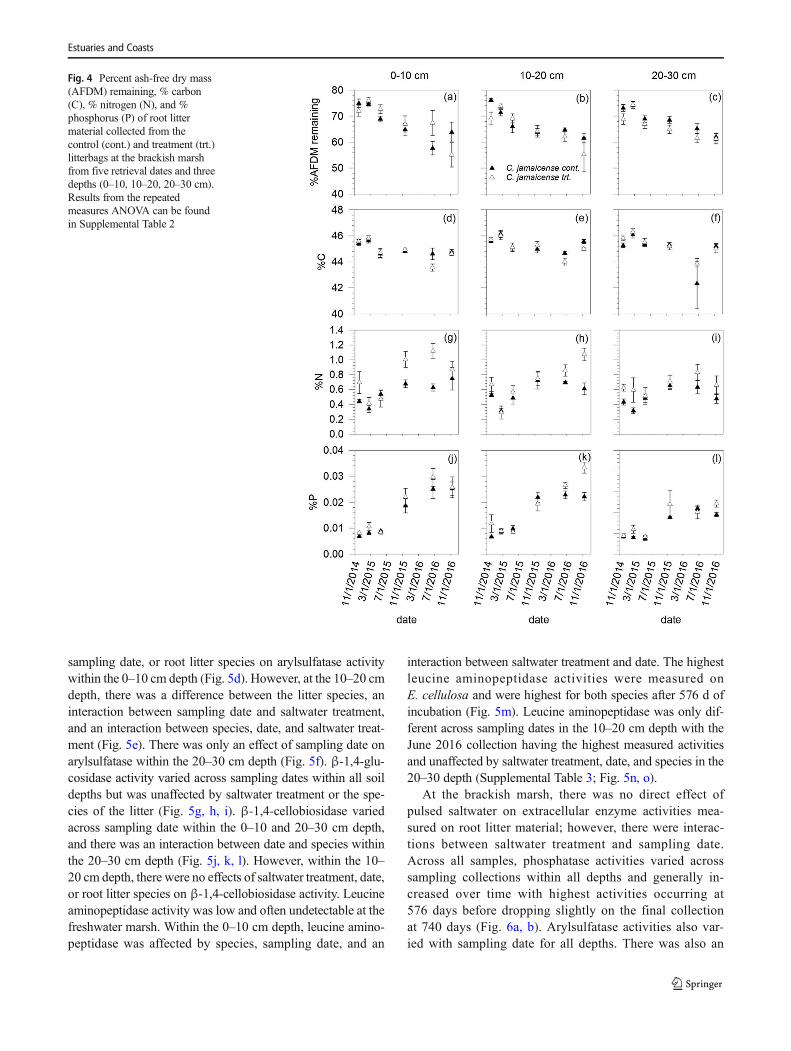
At the brackish marsh, root litter % AFDM remaining de-
creased over time at all depths (Supplemental Table 2, Fig. 4a,
b, c). Root litter from the first 30 days lost approximately 27%
AFDM, and only an additional 9% was lost after 740 days
across all depths in both saltwater treatment and control. The
saltwater treatment alone did not affect percent AFDM re-
maining. However, there was an interaction between date
and saltwater treatment that resulted in differences in %
AFDM remaining on the 576-day collection (June 2016) with-
in the 0–10 cm depth.
Root Litter Elemental Content and Stoichiometry
At the freshwater marsh, differences in litter stoichiometry
were attributed to litter species and sampling date
(Supplemental Table 1). Within the 0–10 cm depth, root litter
%C, %N, and %P changed over time (Supplemental Table 1,
Fig. 3d, g, j). E. cellulosa root litter had lower %C than
C. jamaicense root litter within the 0–10 cm depth
(Supplemental Table 1).Within the 10–20 cm depth, root litter
%C, %N, and %P varied over time (Supplemental Table 1,
Fig. 3e, h, k). Within the 20–30 cm depth, there was an inter-
action between date and root litter species for %P, and effect of
date alone on %C, %N, %P (Supplemental Table. 1, Fig. 3f,
i, l). Within the 20–30 cm depth, E. cellulosa had lower %P
than C. jamaicense after 30, 105, and 194 days of incubation
(December 2014, February 2015, and May 2015), but the
differences in %P declined over time (Fig. 3). Root litter %C
for both species were similar throughout breakdown and
remained above 45% during the first 6 months of breakdown
and dropped below 45% after that (Fig. 3). Root litter %N and
%P for both species were lower after 30, 105, and 194 days of
incubation and tended to be higher in the 576-day and 740-day
collections (June and November 2016) across all depths (Fig.
3). In the freshwater marsh, changes in root litter C:N, C:P,
and N:P varied over time and by root litter species. Overall,
C:N and C:P was highest at the second collection before de-
clining after a year of incubation, whereas N:P generally de-
creased across sampling dates.
At the brackish marsh, the majority of changes in litter
stoichiometry were attributed to sampling date. At 0–10 cm
depth, root litter %C was unaffected by pulsed saltwater or
Table 2 Average (± standard
deviation) root breakdown rates
(k d−1) after 30 and 740 days for
both freshwater and brackish
marshes. Saltwater treatment k
and control k were compared
using aWelch two-sample t test at
each time point and for both
E. cellulosa and C. jamaicense
Control Treatment Significance
Freshwater marsh
E. cellulosa
30 days 0.0100 (0.0002) 0.0094 (0.0005) P = 0.25; t(11.9) = 1.19
740 days 0.0004 (0.0000) 0.0003 (0.0001) P = 0.40; t(10.6) = 0.88
C. jamaicense
30 days 0.0086 (0.0003) 0.0121 (0.0017) P = 0.08; t(8.7) = 2.00
740 days 0.0005 (0.0002) 0.0002 (0.0001) P = 0.19; t(12.5) = 1.38
Brackish marsh
C. jamaicense
30 days 0.0096 (0.0003) 0.0120 (0.0005) P= 0.00021; t(28.9) = − 3.97
740 days 0.0005 (0.0000) 0.0005 (0.0001) P = 0.43; t(30.2) = − 0.79
Estuaries and Coasts
days of incubation (Fig. 4d). The %N was typically higher in
the saltwater treatment root liter and increased over time for
both saltwater treatment and control chambers during the in-
cubation period (Fig. 4g). The %P increased over time during
the incubation period but was not affected by pulsed saltwater
(Fig. 4j; Supplemental Table 2). At 10–20 cm depth, root litter
%C decreased between the first and fifth collection and in-
creased slightly between the June and November 2016 collec-
tions (Fig. 4e). At 10–20 cm depth, %N and %P increased
over time (Fig. 4h, k). At 20–30 cm depth, there was an effect
of time on%Cwhich decreased over time with the lowest %C
measured during the June 2016 collection (Supplemental
Table 2; Fig. 4f). The%N increased over time with the highest
%N estimated during the June 2016 collection (Supplemental
Table 2; Fig. 4i). The %P was low during the first three col-
lections and higher during the final three collections
(Supplemental Table 2; Fig. 4l). At the brackish marsh,
changes in root litter C:N, C:P, and N:P were only affected
by date for all three depths and tended to decrease during the
2-year experiment (Supplemental Table 2).
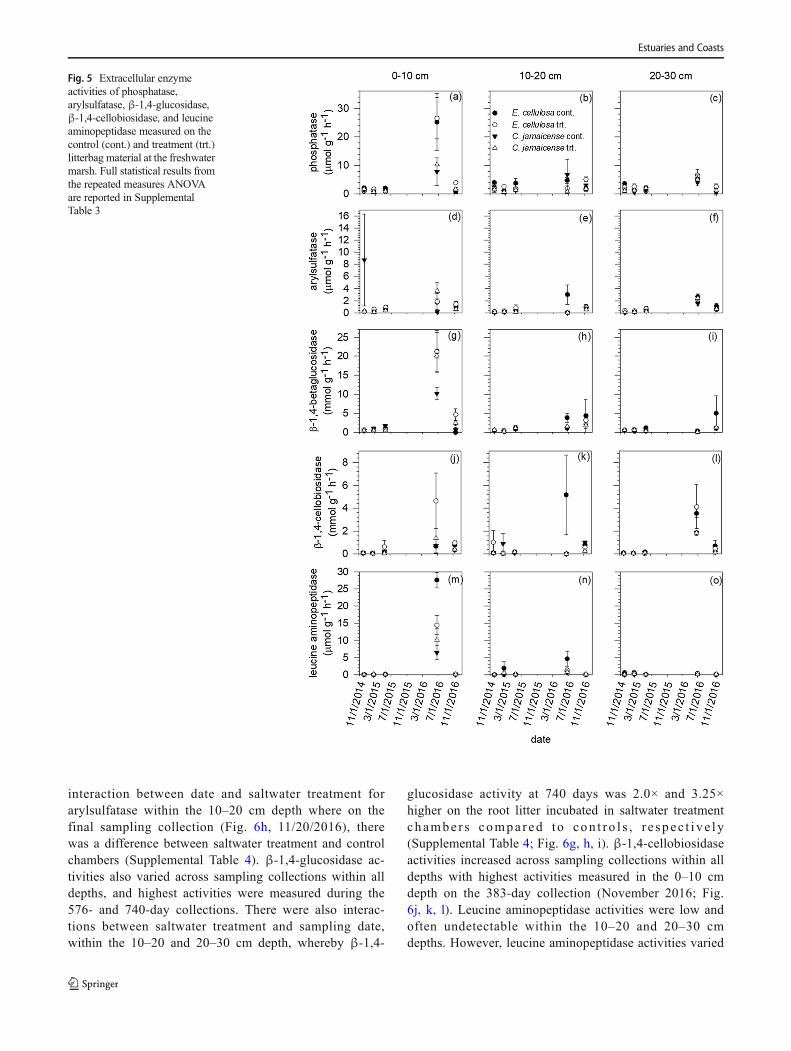
Extracellular Enzyme Potential
At the freshwater marsh, there were no direct effects of pulsed
saltwater on extracellular enzyme activity measured on root
litter material. Phosphatase activities were low across sam-
pling dates, except for the June 2016 collection when it was
highest. Phosphatase was different between species within the
0–10 and 20–30 cm depths with E. cellulosa generally having
higher phosphatase activities (Supplemental Table 3). There
was also an interaction between species and sampling collec-
tion within the 0–10 cm depth where E. cellulosa had higher
activities on the 576-day collection (Supplemental Table 3;
Fig. 5a, b, c). There were no effects of saltwater treatment,
Fig. 3 Percent ash-free dry mass
(AFDM) remaining, % carbon
(C), % nitrogen (N), and %
phosphorus (P) of root litter
material collected from the
control (cont.) and treatment (trt.)
litterbags at the freshwater marsh
from five retrieval dates and three
depths (0–10, 10–20, 20–30 cm).
Results from the repeated
measures ANOVA can be found
in Supplemental Table 1
Estuaries and Coasts
sampling date, or root litter species on arylsulfatase activity
within the 0–10 cm depth (Fig. 5d). However, at the 10–20 cm
depth, there was a difference between the litter species, an
interaction between sampling date and saltwater treatment,
and an interaction between species, date, and saltwater treat-
ment (Fig. 5e). There was only an effect of sampling date on
arylsulfatase within the 20–30 cm depth (Fig. 5f). β-1,4-glu-
cosidase activity varied across sampling dates within all soil
depths but was unaffected by saltwater treatment or the spe-
cies of the litter (Fig. 5g, h, i). β-1,4-cellobiosidase varied
across sampling date within the 0–10 and 20–30 cm depth,
and there was an interaction between date and species within
the 20–30 cm depth (Fig. 5j, k, l). However, within the 10–
20 cm depth, there were no effects of saltwater treatment, date,
or root litter species on β-1,4-cellobiosidase activity. Leucine
aminopeptidase activity was low and often undetectable at the
freshwater marsh. Within the 0–10 cm depth, leucine amino-
peptidase was affected by species, sampling date, and an
interaction between saltwater treatment and date. The highest
leucine aminopeptidase activities were measured on
E. cellulosa and were highest for both species after 576 d of
incubation (Fig. 5m). Leucine aminopeptidase was only dif-
ferent across sampling dates in the 10–20 cm depth with the
June 2016 collection having the highest measured activities
and unaffected by saltwater treatment, date, and species in the
20–30 depth (Supplemental Table 3; Fig. 5n, o).
At the brackish marsh, there was no direct effect of
pulsed saltwater on extracellular enzyme activities mea-
sured on root litter material; however, there were interac-
tions between saltwater treatment and sampling date.
Across all samples, phosphatase activities varied across
sampling collections within all depths and generally in-
creased over time with highest activities occurring at
576 days before dropping slightly on the final collection
at 740 days (Fig. 6a, b). Arylsulfatase activities also var-
ied with sampling date for all depths. There was also an
Fig. 4 Percent ash-free dry mass
(AFDM) remaining, % carbon
(C), % nitrogen (N), and %
phosphorus (P) of root litter
material collected from the
control (cont.) and treatment (trt.)
litterbags at the brackish marsh
from five retrieval dates and three
depths (0–10, 10–20, 20–30 cm).
Results from the repeated
measures ANOVA can be found
in Supplemental Table 2
Estuaries and Coasts
interaction between date and saltwater treatment for
arylsulfatase within the 10–20 cm depth where on the
final sampling collection (Fig. 6h, 11/20/2016), there
was a difference between saltwater treatment and control
chambers (Supplemental Table 4). β-1,4-glucosidase ac-
tivities also varied across sampling collections within all
depths, and highest activities were measured during the
576- and 740-day collections. There were also interac-
tions between saltwater treatment and sampling date,
within the 10–20 and 20–30 cm depth, whereby β-1,4-
glucosidase activity at 740 days was 2.0× and 3.25×
higher on the root litter incubated in saltwater treatment
chambe r s compa r ed t o con t r o l s , r e s pec t i v e l y
(Supplemental Table 4; Fig. 6g, h, i). β-1,4-cellobiosidase
activities increased across sampling collections within all
depths with highest activities measured in the 0–10 cm
depth on the 383-day collection (November 2016; Fig.
6j, k, l). Leucine aminopeptidase activities were low and
often undetectable within the 10–20 and 20–30 cm
depths. However, leucine aminopeptidase activities varied
Fig. 5 Extracellular enzyme
activities of phosphatase,
arylsulfatase, β-1,4-glucosidase,
β-1,4-cellobiosidase, and leucine
aminopeptidase measured on the
control (cont.) and treatment (trt.)
litterbag material at the freshwater
marsh. Full statistical results from
the repeated measures ANOVA
are reported in Supplemental
Table 3
Estuaries and Coasts
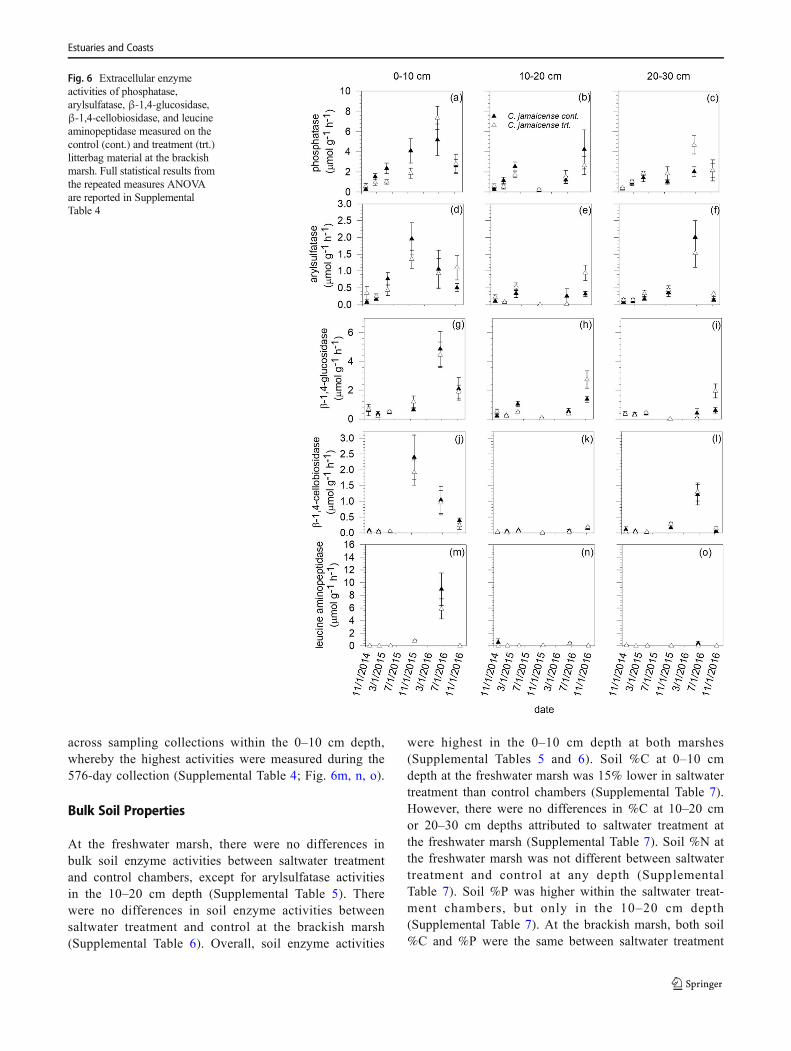
across sampling collections within the 0–10 cm depth,
whereby the highest activities were measured during the
576-day collection (Supplemental Table 4; Fig. 6m, n, o).
Bulk Soil Properties
At the freshwater marsh, there were no differences in
bulk soil enzyme activities between saltwater treatment
and control chambers, except for arylsulfatase activities
in the 10–20 cm depth (Supplemental Table 5). There
were no differences in soil enzyme activities between
saltwater treatment and control at the brackish marsh
(Supplemental Table 6). Overall, soil enzyme activities
were highest in the 0–10 cm depth at both marshes
(Supplemental Tables 5 and 6). Soil %C at 0–10 cm
depth at the freshwater marsh was 15% lower in saltwater
treatment than control chambers (Supplemental Table 7).
However, there were no differences in %C at 10–20 cm
or 20–30 cm depths attributed to saltwater treatment at
the freshwater marsh (Supplemental Table 7). Soil %N at
the freshwater marsh was not different between saltwater
treatment and control at any depth (Supplemental
Table 7). Soil %P was higher within the saltwater treat-
ment chambers, but only in the 10–20 cm depth
(Supplemental Table 7). At the brackish marsh, both soil
%C and %P were the same between saltwater treatment
Fig. 6 Extracellular enzyme
activities of phosphatase,
arylsulfatase, β-1,4-glucosidase,
β-1,4-cellobiosidase, and leucine
aminopeptidase measured on the
control (cont.) and treatment (trt.)
litterbag material at the brackish
marsh. Full statistical results from
the repeated measures ANOVA
are reported in Supplemental
Table 4
Estuaries and Coasts
and control for all depths (Supplemental Table 7). Soil
%N was only different in the 10–20 cm depth and was
lower in the saltwater treatment chambers (Supplemental
Table 7). Microbial biomass C was not different between
saltwater treatment and control at ei ther marsh
(Supplemental Tables 5 and 6).
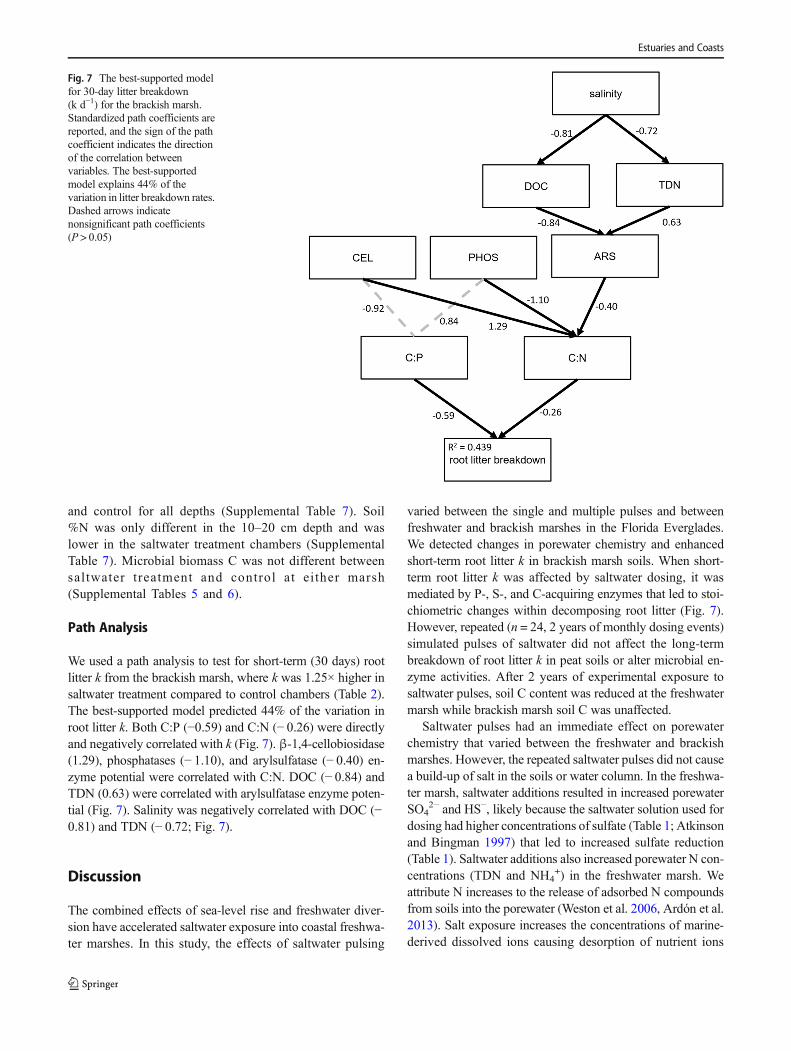
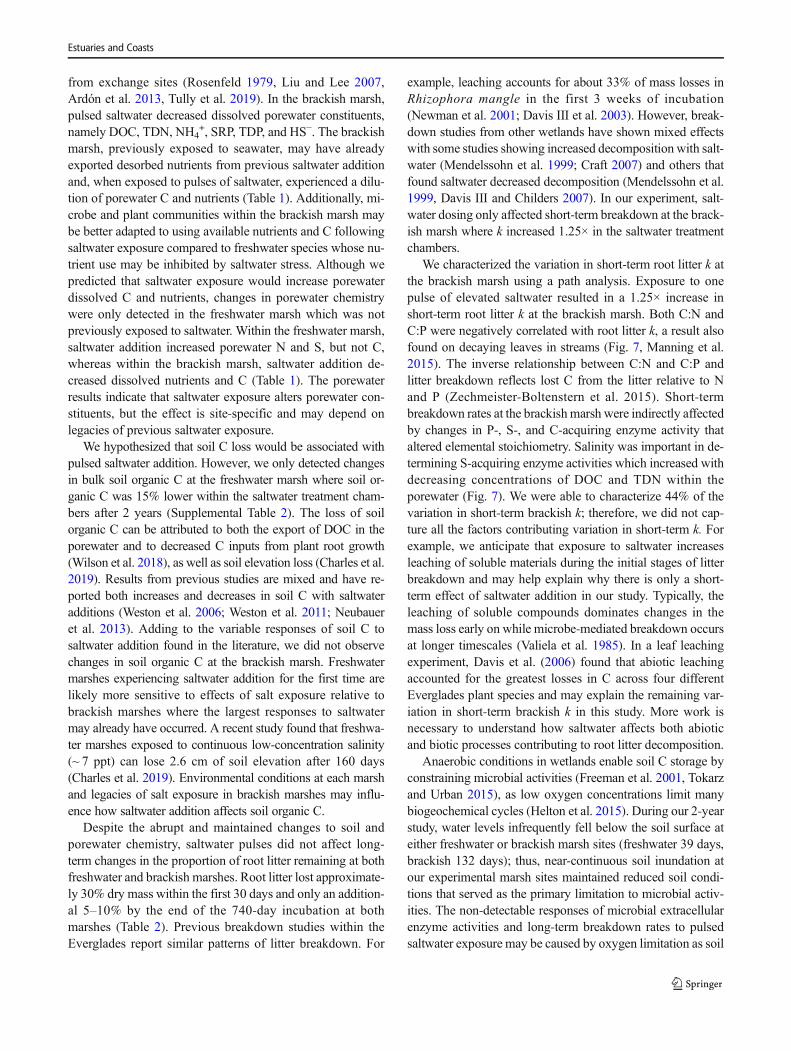
Path Analysis
We used a path analysis to test for short-term (30 days) root
litter k from the brackish marsh, where k was 1.25× higher in
saltwater treatment compared to control chambers (Table 2).
The best-supported model predicted 44% of the variation in
root litter k. Both C:P (−0.59) and C:N (− 0.26) were directly
and negatively correlated with k (Fig. 7). β-1,4-cellobiosidase
(1.29), phosphatases (− 1.10), and arylsulfatase (− 0.40) en-
zyme potential were correlated with C:N. DOC (− 0.84) and
TDN (0.63) were correlated with arylsulfatase enzyme poten-
tial (Fig. 7). Salinity was negatively correlated with DOC (−
0.81) and TDN (− 0.72; Fig. 7).
Discussion
The combined effects of sea-level rise and freshwater diver-
sion have accelerated saltwater exposure into coastal freshwa-
ter marshes. In this study, the effects of saltwater pulsing
varied between the single and multiple pulses and between
freshwater and brackish marshes in the Florida Everglades.
We detected changes in porewater chemistry and enhanced
short-term root litter k in brackish marsh soils. When short-
term root litter k was affected by saltwater dosing, it was
mediated by P-, S-, and C-acquiring enzymes that led to stoi-
chiometric changes within decomposing root litter (Fig. 7).
However, repeated (n = 24, 2 years of monthly dosing events)
simulated pulses of saltwater did not affect the long-term
breakdown of root litter k in peat soils or alter microbial en-
zyme activities. After 2 years of experimental exposure to
saltwater pulses, soil C content was reduced at the freshwater
marsh while brackish marsh soil C was unaffected.
Saltwater pulses had an immediate effect on porewater
chemistry that varied between the freshwater and brackish
marshes. However, the repeated saltwater pulses did not cause
a build-up of salt in the soils or water column. In the freshwa-
ter marsh, saltwater additions resulted in increased porewater
SO42− and HS−, likely because the saltwater solution used for
dosing had higher concentrations of sulfate (Table 1; Atkinson
and Bingman 1997) that led to increased sulfate reduction
(Table 1). Saltwater additions also increased porewater N con-
centrations (TDN and NH4+) in the freshwater marsh. We
attribute N increases to the release of adsorbed N compounds
from soils into the porewater (Weston et al. 2006, Ardón et al.
2013). Salt exposure increases the concentrations of marine-
derived dissolved ions causing desorption of nutrient ions
Fig. 7 The best-supported model
for 30-day litter breakdown
(k d−1) for the brackish marsh.
Standardized path coefficients are
reported, and the sign of the path
coefficient indicates the direction
of the correlation between
variables. The best-supported
model explains 44% of the
variation in litter breakdown rates.
Dashed arrows indicate
nonsignificant path coefficients
(P > 0.05)
Estuaries and Coasts
from exchange sites (Rosenfeld 1979, Liu and Lee 2007,
Ardón et al. 2013, Tully et al. 2019). In the brackish marsh,
pulsed saltwater decreased dissolved porewater constituents,
namely DOC, TDN, NH4+, SRP, TDP, and HS−. The brackish
marsh, previously exposed to seawater, may have already
exported desorbed nutrients from previous saltwater addition
and, when exposed to pulses of saltwater, experienced a dilu-
tion of porewater C and nutrients (Table 1). Additionally, mi-
crobe and plant communities within the brackish marsh may
be better adapted to using available nutrients and C following
saltwater exposure compared to freshwater species whose nu-
trient use may be inhibited by saltwater stress. Although we
predicted that saltwater exposure would increase porewater
dissolved C and nutrients, changes in porewater chemistry
were only detected in the freshwater marsh which was not
previously exposed to saltwater. Within the freshwater marsh,
saltwater addition increased porewater N and S, but not C,
whereas within the brackish marsh, saltwater addition de-
creased dissolved nutrients and C (Table 1). The porewater
results indicate that saltwater exposure alters porewater con-
stituents, but the effect is site-specific and may depend on
legacies of previous saltwater exposure.
We hypothesized that soil C loss would be associated with
pulsed saltwater addition. However, we only detected changes
in bulk soil organic C at the freshwater marsh where soil or-
ganic C was 15% lower within the saltwater treatment cham-
bers after 2 years (Supplemental Table 2). The loss of soil
organic C can be attributed to both the export of DOC in the
porewater and to decreased C inputs from plant root growth
(Wilson et al. 2018), as well as soil elevation loss (Charles et al.
2019). Results from previous studies are mixed and have re-
ported both increases and decreases in soil C with saltwater
additions (Weston et al. 2006; Weston et al. 2011; Neubauer
et al. 2013). Adding to the variable responses of soil C to
saltwater addition found in the literature, we did not observe
changes in soil organic C at the brackish marsh. Freshwater
marshes experiencing saltwater addition for the first time are
likely more sensitive to effects of salt exposure relative to
brackish marshes where the largest responses to saltwater
may already have occurred. A recent study found that freshwa-
ter marshes exposed to continuous low-concentration salinity
(~ 7 ppt) can lose 2.6 cm of soil elevation after 160 days
(Charles et al. 2019). Environmental conditions at each marsh
and legacies of salt exposure in brackish marshes may influ-
ence how saltwater addition affects soil organic C.
Despite the abrupt and maintained changes to soil and
porewater chemistry, saltwater pulses did not affect long-
term changes in the proportion of root litter remaining at both
freshwater and brackish marshes. Root litter lost approximate-
ly 30% dry mass within the first 30 days and only an addition-
al 5–10% by the end of the 740-day incubation at both
marshes (Table 2). Previous breakdown studies within the
Everglades report similar patterns of litter breakdown. For
example, leaching accounts for about 33% of mass losses in
Rhizophora mangle in the first 3 weeks of incubation
(Newman et al. 2001; Davis III et al. 2003). However, break-
down studies from other wetlands have shown mixed effects
with some studies showing increased decomposition with salt-
water (Mendelssohn et al. 1999; Craft 2007) and others that
found saltwater decreased decomposition (Mendelssohn et al.
1999, Davis III and Childers 2007). In our experiment, salt-
water dosing only affected short-term breakdown at the brack-
ish marsh where k increased 1.25× in the saltwater treatment
chambers.
We characterized the variation in short-term root litter k at
the brackish marsh using a path analysis. Exposure to one
pulse of elevated saltwater resulted in a 1.25× increase in
short-term root litter k at the brackish marsh. Both C:N and
C:P were negatively correlated with root litter k, a result also
found on decaying leaves in streams (Fig. 7, Manning et al.
2015). The inverse relationship between C:N and C:P and
litter breakdown reflects lost C from the litter relative to N
and P (Zechmeister-Boltenstern et al. 2015). Short-term
breakdown rates at the brackishmarsh were indirectly affected
by changes in P-, S-, and C-acquiring enzyme activity that
altered elemental stoichiometry. Salinity was important in de-
termining S-acquiring enzyme activities which increased with
decreasing concentrations of DOC and TDN within the
porewater (Fig. 7). We were able to characterize 44% of the
variation in short-term brackish k; therefore, we did not cap-
ture all the factors contributing variation in short-term k. For
example, we anticipate that exposure to saltwater increases
leaching of soluble materials during the initial stages of litter
breakdown and may help explain why there is only a short-
term effect of saltwater addition in our study. Typically, the
leaching of soluble compounds dominates changes in the
mass loss early on while microbe-mediated breakdown occurs
at longer timescales (Valiela et al. 1985). In a leaf leaching
experiment, Davis et al. (2006) found that abiotic leaching
accounted for the greatest losses in C across four different
Everglades plant species and may explain the remaining var-
iation in short-term brackish k in this study. More work is
necessary to understand how saltwater affects both abiotic
and biotic processes contributing to root litter decomposition.
Anaerobic conditions in wetlands enable soil C storage by
constraining microbial activities (Freeman et al. 2001, Tokarz
and Urban 2015), as low oxygen concentrations limit many
biogeochemical cycles (Helton et al. 2015). During our 2-year
study, water levels infrequently fell below the soil surface at
either freshwater or brackish marsh sites (freshwater 39 days,
brackish 132 days); thus, near-continuous soil inundation at
our experimental marsh sites maintained reduced soil condi-
tions that served as the primary limitation to microbial activ-
ities. The non-detectable responses of microbial extracellular
enzyme activities and long-term breakdown rates to pulsed
saltwater exposure may be caused by oxygen limitation as soil
Estuaries and Coasts
inundation and waterlogging can result in decreases in the
production of new enzymes and increased concentrations of
enzyme inhibitors (Pulford and Tabatabai 1988; Freeman et al.
1996). Since the timing of the dry-down events overlaps the
sampling of decomposing root litter, we cannot directly test
effects of water level on k or enzyme activities. However, we
have shown that dry-down events interact with salinity pulses
to increase CO2 release from brackish marshes (Wilson et al.
2018). In studies manipulating both water level and salinity,
water level seems to contribute more to changes in C and N
cycling (Liu et al. 2017). Pulses of saltwater nearly doubled
brackish soil redox potential, yet soils remained reduced and
there was little change in enzyme activities compared to the
controls. Additionally, higher enzyme activities associated
with roots and soils at shallower depths compared to those at
lower depths provide further evidence that oxygen-limited
conditions might have suppressed microbial activity in our
study marshes and maintained slow breakdown rates despite
changes in salinity as has been shown in other studies where
reduced soil conditions and inundation limited microbe-
mediated breakdown of organic matter (McKee and Seneca
1982; White and Trapani 1982).
Extracellular enzyme activities changed more with time
than with treatment and generally increased during the first
year (Figs. 5 and 6). However, we detected increased β-1,4-
glucosidase activity on decomposing root litter after 2 years of
pulsed salinity dosing at the brackish marsh. Previous studies
have suggested that increases inβ-1,4-glucosidase activity are
explained by increases in cellobiose (Chröst 1991).β-1,4-glu-
cosidase is a mediator of cellulose degradation and can be
considered the rate-limiting step in the degradation of cellu-
lose (Sinsabaugh et al. 1993; Alef and Nannipieri 1995).
Previous salt dosing studies also found a negative effect of
salinity on glucosidase activities in soils (Jackson and
Vallaire 2009; Neubauer et al. 2013). However, in our study,
we did not detect higher activities of β-1,4-glucosidase on the
bulk soil and the increasedβ-1,4-glucosidase we did detect on
root litter did not contribute to changes in k.
Our results indicate that microbial enzyme activities in re-
duced soils of coastal wetland ecosystems have low sensitivity
to pulsed saltwater addition and are not a predominant biolog-
ical factor explaining observed C losses (Wilson et al. 2018).
Changes in environmental conditions may alter the composi-
tion of the biologically active microbial community that is
producing extracellular enzymes (Kearns et al. 2016).
Although the focus of this study was on how microbial func-
tioning (i.e., extracellular enzymes) responded to repeated
pulses of saltwater, but there is some evidence that our salt-
water treatment affected microbial community structure at the
freshwater marsh but not at the brackish marsh (Martens-
Habbena, unpublished data). In an experimental wetland
mesocosm study, freshwater marsh soils continuously ex-
posed to saltwater had reduced extracellular enzyme activities
(Servais et al. 2019). In mangrove soils of the Everglades,
inundation has been shown be a stronger control on enzyme
activities than salinity (Chambers et al. 2016). Other studies
have documented how inundation controls microbial func-
tioning. For example, Freeman et al. (1996) found that P-,
S-, and C-acquiring enzymes activities were increased up to
70% within peat soils after water table drawdown. Therefore,
we may expect drier conditions to increase enzyme activity
and organic mineralization (Freeman et al. 1996) and drier
soils to be more sensitive to pulsed saltwater exposure.
Changes in microbe-mediated breakdown may only occur
with sustained saltwater exposure, more extreme levels of
salinity, or when other controls on microbial processing, like
inundation, are also altered.
Conclusions
Coastal peat soils are susceptible to large-scale C loss from
extended duration saltwater exposure (Wanless and
Vlaswinkel 2005; Day et al. 2011). In the Florida
Everglades, soil loss has occurred over the past 2000 years
ago, leading to the formation of coastal lakes and lagoons
(Wanless and Vlaswinkel 2005). Evidence from our experi-
mental salinity dosing in a brackish marsh illustrates that C
losses are occurring further inland as a result of saltwater
exposure that is exacerbated by sea-level rise and drought
events (Wanless and Vlaswinkel 2005; Wilson et al. 2018;
Chambers et al. 2019). However, our results also suggest that
increased breakdown of plant root-derived, detrital organic
matter may not be the primary mechanism of soil elevation
and C loss within the Everglades. The lack of strong microbe-
mediated responses to pulsed saltwater in our study might also
be because the salinity level was not high enough to elicit
responses or that responses to saltwater have already been
triggered. Additionally, inundation and reduced conditions in
coastal wetlands limit the decomposing processes of soil mi-
crobial communities associated with organic matter and may
explain the lack of strong responses to pulsed saltwater dosing
we found in our study (Chambers et al. 2019). Future research
priorities should focus on how environmental conditions (e.g.,
drought, temperature) interact with saltwater exposure to af-
fect microbial community structure and function in coastal
wetland soils. Understanding the underlyingmechanisms con-
trolling organic matter breakdown, such as microbial extracel-
lular enzyme activities, is critical to understanding how bio-
geochemical cycling will be altered by climate change and
land management (Sinsabaugh et al. 2002).
Acknowledgments We thank R. Stolee, G. Cabral, K. Morales, and D.
Segrera for field and laboratory assistance. We thank the Everglades
Section of the South Florida Water Management District, and
Estuaries and Coasts
Everglades National Park for providing facilities support during this
research.
Funding Information Funding for this research was provided by the
Florida Sea Grant (R/C-S-56). Additional funding and support were pro-
vided by the National Science Foundation award (DEB-1237517) to the
Florida Coastal Everglades Long Term Ecological Research (FCE LTER)
Program. S. Servais was supported by Florida Sea Grant (R/C-S-56), FCE
LTER, and the Florida International University’s Dissertation Year
Fellowship. This manuscript is contribution number 27 of the Sea Level
Solutions Center and contribution number 948 from the Southeast
Environmental Research Center in the Institute of Environment at
Florida International University.
References
Alef, K., and P. Nannipieri. 1995. Methods in applied soil microbiology
and biochemistry (No. 631.46 M592ma). Academic Press.
Allison, S.D., and P.M. Vitousek. 2004. Extracellular enzyme activities
and carbon chemistry as drivers of tropical plant litter decomposi-
tion. Biotropica 36 (3): 285–296.
Anderson, D.R., and K.P. Burnham. 2002. Avoiding pitfalls when using
information-theoretic methods. The Journal of Wildlife
Management, pp.: 912–918.
Ardón, M., J.L. Morse, B.P. Colman, and E.S. Bernhardt. 2013.
Drought-induced saltwater incursion leads to increased wet-
land nitrogen export. Global Change Biology 19 (10): 2976–
2985.
Atkinson, M.J., and C. Bingman. 1997. Elemental composition of com-
mercial seasalts. Journal of Aquariculture and Aquatic Sciences 8
(2): 39–43.
Burns, R.G. 1982. Enzyme activity in soil: Location and a possible role in
microbial ecology. Soil Biology and Biochemistry 14 (5): 423–427.
Chambers, L.G., K.R. Reddy, and T.Z. Osborne. 2011. Short-term
response of carbon cycling to salinity pulses in a freshwater
wetland. Soil Science Society of America Journal 75 (5):
2000–2007.
Chambers, L.G., S.E. Davis, T.G. Troxler, and J.A. Entry. 2015. Sea level
rise in the Everglades: Plant-soil-microbial feedbacks in response to
changing physical conditions. Microbiology of the Everglades
Ecosystem: 89–112.
Chambers, L.G., R. Guevara, J.N. Boyer, T.G. Troxler, and S.E. Davis.
2016. Effects of salinity and inundation on microbial community
structure and function in a mangrove peat soil. Wetlands 36 (2):
361–371.
Chambers, L.G., H.E. Steinmuller, and J.L. Breithaupt. 2019. Toward a
mechanistic understanding of “peat collapse” and its potential con-
tribution to coastal wetland loss. Ecology: e02720.
Chapin, F.S., G.M. Woodwell, J.T. Randerson, E.B. Rastetter, G.M.
Lovett, D.D. Baldocchi, et al. 2006. Reconciling carbon-cycle con-
cepts, terminology, and methods. Ecosystems 9 (7): 1041–1050.
Charles, S.P., J.S. Kominoski, T.G. Troxler, E.E. Gaiser, S.
Servais, B.J. Wilson, et al. 2019. Experimental saltwater in-
trusion drives rapid soil elevation and carbon loss in fresh-
water and brackish Everglades marshes. Estuaries and Coasts
42 (7): 1868–1881.
Chröst, R.J. 1991. Environmental control of the synthesis and activity of
aquatic microbial ectoenzymes. In Microbial enzymes in aquatic
environments, 29–59. New York, NY: Springer.
Craft, C. 2007. Freshwater input structures soil properties, vertical accre-
tion, and nutrient accumulation of Georgia and US tidal marshes.
Limnology and Oceanography 52 (3): 1220–1230.
Craft, C.B., and C.J. Richardson. 2008. Soil characteristics of the
Everglades peatland. In Everglades experiments, 59–72. New
York, NY: Springer.
Davis, S.E., III, and D.L. Childers. 2007. Importance of water source in
controlling leaf leaching losses in a dwarf red mangrove
(Rhizophora mangle L.) wetland. Estuarine, Coastal and Shelf
Science 71 (1–2): 194–201.
Davis, S.E., III, C. Coronado-Molina, D.L. Childers, and J.W. Day Jr.
2003. Temporally dependent C, N, and P dynamics associated with
the decay of Rhizophora mangle L. leaf litter in oligotrophic man-
grove wetlands of the Southern Everglades. Aquatic Botany 75 (3):
199–215.
Davis, S.E., III, D.L. Childers, and G.B. Noe. 2006. The contribution of
leaching to the rapid release of nutrients and carbon in the early
decay of wetland vegetation. Hydrobiologia 569 (1): 87–97.
Day, J.W., G.P. Kemp, D.J. Reed, D.R. Cahoon, R.M. Boumans,
J.M. Suhayda, and R. Gambrell. 2011. Vegetation death and
rapid loss of surface elevation in two contrasting Mississippi
delta salt marshes: The role of sedimentation, autocompaction
and sea-level rise. Ecological Engineering 37 (2): 229–240.
Dessu, S.B., R.M. Price, T.G. Troxler, and J.S. Kominoski. 2018.
Effects of sea-level rise and freshwater management on long-
term water levels and water quality in the Florida Coastal
Everglades. Journal of Environmental Management 211:
164–176.
Dick, R.P. 1994. Soil enzyme activities as indicators of soil Quality1.
Defining soil quality for a sustainable environment: 107–124.
Faulkner, S.P., W.H. Patrick Jr., and R.P. Gambrell. 1989. Field tech-
niques for measuring wetland soil parameters. Soil Science Society
of America Journal 53 (3): 883–890.
Freeman, C., G. Liska, N.J. Ostle, M.A. Lock, B. Reynolds, and J.
Hudson. 1996. Microbial activity and enzymic decomposition pro-
cesses following peatland water table drawdown. Plant and Soil 180
(1): 121–127.
Freeman, C., N. Ostle, and H. Kang. 2001. An enzymic ‘latch’ on a global
carbon store. Nature 409 (6817): 149.
Helton, A.M., M. Ardón, and E.S. Bernhardt. 2015. Thermodynamic
constraints on the utility of ecological stoichiometry for explaining
global biogeochemical patterns. Ecology Letters 18 (10): 1049–
1056.
Herbert, E.R., P. Boon, A.J. Burgin, S.C. Neubauer, R.B.
Franklin, M. Ardón, K.N. Hopfensperger, L.P. Lamers, and
P. Gell. 2015. A global perspective on wetland salinization:
Ecological consequences of a growing threat to freshwater
wetlands. Ecosphere 6 (10): 1–43.
Herbert, E.R., J. Schubauer-Berigan, and C.B. Craft. 2018.
Differential effects of chronic and acute simulated seawater
intrusion on tidal freshwater marsh carbon cycling.
Biogeochemistry: 1–18.
Hoorens, B., R. Aerts, and M. Stroetenga. 2003. Does initial litter chem-
istry explain litter mixture effects on decomposition?Oecologia 137
(4): 578–586.
Jackson, C.R., and S.C. Vallaire. 2009. Effects of salinity and nutrients on
microbial assemblages in Louisiana wetland sediments.Wetlands 29
(1): 277–287.
Jackson, C.R., C.M. Foreman, and R.L. Sinsabaugh. 1995. Microbial
enzyme activities as indicators of organic matter processing rates
in a Lake Erie coastal wetland.Freshwater Biology 34 (2): 329–342.
Kang, H., and C. Freeman. 1999. Phosphatase and arylsulphatase activ-
ities in wetland soils: Annual variation and controlling factors. Soil
Biology and Biochemistry 31 (3): 449–454.
Kearns, P.J., J.H. Angell, E.M. Howard, L.A. Deegan, R.H. Stanley, and
J.L. Bowen. 2016. Nutrient enrichment induces dormancy and
Estuaries and Coasts
decreases diversity of active bacteria in salt marsh sediments.Nature
Communications 7: 12881.
Liu, Z., and C. Lee. 2007. The role of organic matter in the sorption
capacity of marine sediments.Marine Chemistry 105 (3): 240–257.
Liu, X., A. Ruecker, B. Song, J. Xing, W.H. Conner, and A.T.
Chow. 2017. Effects of salinity and wet–dry treatments on C
and N dynamics in coastal-forested wetland soils: Implications
of sea level rise. Soil Biology and Biochemistry 112: 56–67.
Manning, D.W., A.D. Rosemond, J.S. Kominoski, V. Gulis, J.P.
Benstead, and J.C. Maerz. 2015. Detrital stoichiometry as a critical
nexus for the effects of streamwater nutrients on leaf litter break-
down rates. Ecology 96 (8): 2214–2224.
McIvor, C.C., J.A. Ley, and R.D. Bjork. 1994. Changes in freshwater
inflow from the Everglades to Florida bay including effects on biota
and biotic processes: A review, 117–146. Everglades: The ecosys-
tem and its restoration.
McKee, K.L., and E.D. Seneca. 1982. The influence of morphology in
determining the decomposition of two salt marsh macrophytes.
Estuaries 5 (4): 302–309.
McKee, K.L., I.A. Mendelssohn, and M.W. Hester. 1988. Reexamination
of pore water sulfide concentrations and redox potentials near the
aerial roots of Rhizophora mangle and Avicennia germinans.
American Journal of Botany 75: 1352–1359.
McKee, K.L. 2011. Biophysical controls on accretion and elevation
change in Caribbean mangrove ecosystems. Estuarine, Coastal
and Shelf Science 91 (4): 475–483.
Mendelssohn, I.A., B.K. Sorrell, H. Brix, H.H. Schierup, B. Lorenzen,
and E.Maltby. 1999. Controls on soil cellulose decomposition along
a salinity gradient in a Phragmites australis wetland in Denmark.
Aquatic Botany 64 (3–4): 381–398.
Mitsch, W.J., and J.G. Gosselink. 2007. Wetlands. 4th ed.
Morrissey, E.M., J.L. Gillespie, J.C. Morina, and R.B. Franklin.
2014. Salinity affects microbial activity and soil organic mat-
ter content in tidal wetlands. Global Change Biology 20 (4):
1351–1362.
Neubauer, S.C., R.B. Franklin, and D.J. Berrier. 2013. Saltwater intrusion
into tidal freshwater marshes alters the biogeochemical processing
of organic carbon. Biogeosciences 10 (12): 8171.
Newman, S., H. Kumpf, J.A. Laing, and W.C. Kennedy. 2001.
Decomposition responses to phosphorus enrichment in an
Everglades (USA) slough. Biogeochemistry 54 (3): 229–250.
Nyman, J.A., R.J. Walters, R.D. Delaune, and W.H. Patrick Jr. 2006.
Marsh vertical accretion via vegetative growth. Estuarine, Coastal
and Shelf Science 69 (3–4): 370–380.
Odum, W.E., E.P. Odum, and H.T. Odum. 1995. Nature’s pulsing para-
digm. Estuaries 18 (4): 547.
Olson, J.S. 1963. Energy storage and the balance of producers and de-
composers in ecological systems. Ecology 44 (2): 322–331.
Pulford, I.D., and M.A. Tabatabai. 1988. Effect of waterlogging on en-
zyme activities in soils. Soil Biology and Biochemistry 20 (2): 215–
219.
R Core Team (2017) R: A language and environment for statistical com-
puting. In: R Foundation for statistical computing. Austria. URL,
Vienna https://www.R-project.org/
Rejmánková, E., and D. Sirová. 2007. Wetland macrophyte decom-
position under different nutrient conditions: Relationships be-
tween decomposition rate, enzyme activities and microbial bio-
mass. Soil Biology and Biochemistry 39 (2): 526–538.
Romero, L.M., T.J. Smith III, and J. W. Fourqurean. 2005. Changes
in mass and nutrient content of wood during decomposition in
a South Florida mangrove forest. Journal of Ecology 93 (3):
618–631.
Rosenfeld, J.K. 1979. Ammonium adsorption in nearshore anoxic sedi-
ments. Limnology and Oceanography 24 (2): 356–364.
Ross, M.S., J.F. Meeder, J.P. Sah, P.L. Ruiz, and G.J. Telesnicki. 2000.
The southeast saline Everglades revisited: 50 years of coastal vege-
tation change. Journal of Vegetation Science 11 (1): 101–112.
Saiya-Cork, K.R., R.L. Sinsabaugh, and D.R. Zak. 2002. The effects of
long term nitrogen deposition on extracellular enzyme activity in an
Acer saccharum forest soil. Soil Biology and Biochemistry 34 (9):
1309–1315.
Schimel, J.P., andM.N.Weintraub. 2003. The implications of exoenzyme
activity on microbial carbon and nitrogen limitation in soil: A theo-
retical model. Soil Biology and Biochemistry 35 (4): 549–563.
Servais, S., J.S. Kominoski, S.P. Charles, E.E. Gaiser, V. Mazzei, T.G.
Troxler, and B.J. Wilson. 2019. Saltwater intrusion and soil carbon
loss: Testing effects of salinity and phosphorus loading on microbial
functions in experimental freshwater wetlands. Geoderma 337:
1291–1300.
Sinsabaugh, R.L., and J.J. Follstad Shah. 2012. Ecoenzymatic stoichiom-
etry and ecological theory. Annual Review of Ecology, Evolution,
and Systematics 43: 313–343.
Sinsabaugh, R.L., R.K. Antibus, A.E. Linkins, C.A. McClaugherty,
L. Rayburn, D. Repert, and T. Weiland. 1993. Wood decompo-
sition: Nitrogen and phosphorus dynamics in relation to extra-
cellular enzyme activity. Ecology 74 (5): 1586–1593.
Sinsabaugh, R.L., M.M. Carreiro, and S. Alvarez. 2002. Enzyme and
microbial dynamics of litter decomposition. In Enzymes in the envi-
ronment, activity, ecology, and applications, 249–265. New York,
Basel: Marcel Dekker.
Sklar, F., C. McVoy, R. VanZee, D.E. Gawlik, K. Tarboton, D. Rudnick,
S. Miao, and T. Armentano. 2002. The effects of altered hydrology
on the ecology of the Everglades. In The Everglades, Florida Bay,
and coral reefs of the Florida Keys: An ecosystem sourcebook.
Florida: CRC Press, Boca Raton.
Solórzano, L., and J.H. Sharp. 1980. Determination of total dissolved
phosphorus and particulate phosphorus in natural waters 1.
Limnology and Oceanography 25 (4): 754–758.
Stachelek, J., S.P. Kelly, F.H. Sklar, C. Coronado-Molina, T. Troxler, and
L. Bauman. 2018. In situ simulation of sea-level rise impacts on
coastal wetlands using a flow-through mesocosm approach.
Methods in Ecology and Evolution 9 (8): 1908–1915.
Tokarz, E., and D. Urban. 2015. Soil redox potential and its impact on
microorganisms and plants of wetlands. Journal of Ecological
Engineering 16 (3): 20–30.
Tully, K., K. Gedan, R. Epanchin-Niell, A. Strong, E.S.
Bernhardt, T. BenDor, M. Mitchell, J. Kominoski, T.E.
Jordan, S.C. Neubauer, and N.B. Weston. 2019. The invisible
flood: The chemistry, ecology, and social implications of
coastal saltwater intrusion. BioScience 69 (5): 368–378.
Valiela, I., S.D. Allen, R. Van Etten, D. Goehringer, and S. Volkmann.
1985. Decomposition in salt marsh ecosystems: The phases and
major factors affecting disappearance of above-ground organic mat-
ter. Journal of Experimental Marine Biology and Ecology 89 (1):
29–54.
Vance, E.D., P.C. Brookes, and D.S. Jenkinson. 1987. An extraction
method for measuring soil microbial biomass C. Soil Biology and
Biochemistry 19 (6): 703–707.
Wanless, H.R., and B. Vlaswinkel. 2005. Coastal landscape and
channel evolution affecting critical habitats at Cape Sable,
Everglades National Park, Florida. Final report to
Everglades National Park . Homestead: United States
Department of the Interior.
Wdowinski, S., R. Bray, B.P. Kirtman, and Z. Wu. 2016. Increasing
flooding hazard in coastal communities due to rising sea level:
Case study of Miami Beach, Florida. Ocean & Coastal
Management 126: 1–8.
Weston, N.B., R.E. Dixon, and S.B. Joye. 2006. Ramifications of in-
creased salinity in tidal freshwater sediments: Geochemistry and
Estuaries and Coasts
microbial pathways of organic matter mineralization. Journal of
Geophysical Research: Biogeosciences 111 (G1).
Weston, N.B., M.A. Vile, S.C. Neubauer, and D.J. Velinsky. 2011.
Accelerated microbial organic matter mineralization following salt-
water intrusion into tidal freshwater marsh soils. Biogeochemistry
102 (1–3): 135–151.
White, E., and D. Kaplan. 2017. Restore or retreat? Saltwater intrusion
and water management in coastal wetlands. Ecosystem Health and
Sustainability 3 (1).
White, D.A., and J.M. Trapani. 1982. Factors influencing disappearances
of Spartina Alterniflora from litterbags. Ecology, pp.: 242–245.
Wilson, B.J., S. Servais, V. Mazzei, J.S. Kominoski, M. Hu, S.E. Davis,
E. Gaiser, F. Sklar, L. Bauman, S. Kelly, and C. Madden. 2018.
Salinity pulses interact with seasonal dry-down to increase ecosys-
tem carbon loss in marshes of the Florida Everglades. Ecological
Applications 28 (8): 2092–2108.
Zechmeister-Boltenstern, S., K.M. Keiblinger, M. Mooshammer, J.
Peñuelas, A. Richter, J. Sardans, and W. Wanek. 2015. The applica-
tion of ecological stoichiometry to plant–microbial–soil organic
matter transformations. Ecological Monographs 85 (2): 133–155.
Estuaries and Coasts