Embed Size (px)
Citation preview

NBER WORKING PAPER SERIES
EFFECTS OF THE TAX REFORM ACT OF 1986 ON CORPORATE FINANCIAL POLICYAND ORGANIZATIONAL FORM
Roger H. Cordon
Jeffrey MacKie-Mason
Working Paper No. 3222
NATIONAL BUREAU OF ECONOMIC RESEARCH1050 Massachusetts Avenue
Caabridge, MA 02138
January 1990
We are grateful for helpful comments from Glenn Hubbard and Joel Slearod.Brian Erard of the IRS provided us with some summary statistics that have notyet been published, based on individual returns. MacKie-Maaon gratefullyacknowledges financial support from a Rackham Faculty Research Grant. Thispaper is part of NBER's research program in Taxation. Any opinions expreasedare those of the authors not thoae of the National Bureau of Economic
Research.

NBER Working Paper #3222January 1990
EFFECTS OF THE TAX REFORM ACT OF 1986 ON CORPORATE FINANCIAL POLICYAND ORGANIZATIONAL FORM
ABSTRACT
We examine the effects of the Tax Reform Act of 1986 on the financial decisionsmade by firms. We review the theory and empirical predictions of prior literature forcorporate debt policy, for dividend and equity repurchase payouts to shareholders, andfor the choice of organizational form. We then compare the predictions to post-1986experience. The change in debt/value ratios has been substantially smaller than expected.Dividend payouts increased as predicted, but stock repurchases increased even more rapidlywhich was unexpected and is difficult to understand. Based on very scant data, it appearsthat some activities have shuffled among organizational forms; in particular, loss activitiesmay have been moved into corporate form where they are deducted at a higher tax rate,while gain activities may have shifted towards noncorporate form, to be taxed at thelower personal rates. In addition, several interesting new issues are raised. One concernspreviously neglected implications for the effective tax on retained erarnings that followfrom optimal trading strategies when long- and short-term capital gains are taxed atdifferent rates. Also, new interest allocation rules for multinational corporations providea substantial incentive for many firms to shift their borrowing abroad.
Roger H. GordonDepartment of Economics
University of MichiganAnn Arbor, MI 48109-1220
Jeffrey MacKie-MasonDepartment of Economics
University of MichiganAnn Arbor, MI 48109-1220
The Tax Reform Act of 1986 (hereafter TRA86) included the most extensive changes
in the U.S. tax law since the dramatic increase in corporate and personal tax rates during
World War II. For many years tax economists have found that it is difficult to estimate
the effect of taxes on corporate behavior because there has been so little variation in
corporate tax policy. The major changes introduced by the TRA86 offer an opportunity
to assess how well previous analyses succeeded in predicting the effects of tax changes, and
an opportunity to obtain new understanding about taxes and corporate behavior.
The objective of this paper is to examine the effects of the tax reform on the financial
decisions made by firms. Taking as given its real decisions, a firm has substantial flexibility
in deciding on the source of finance for its operations, and even on the legal form of
ownership. To begin with, corporations can finance themselves through both debt and
equity. Additional equity finance can be obtained either through retained earnings or
through new share issues. When payments get made to equity holders, they can take the
form of dividends or share repurchases. Shares of other firms as well as of one's own firm
can be repurchased. More fundamentally, a firm need not necessarily set itself up as a
corporation for both legal and tax purposes. By becoming a subchaper S corporation,
its income is taxed solely under the personal income tax, even though it retains many of
the others benefits of the corporate form of organization. In addition, it can become a
partnership or proprietorship for tax or legal reasons.1
Past work has presumed that taxes play an important role in these decisions. If so,
then the extensive changes in the tax law that were enacted in 1986 should have led to
Firms can make choices about organizational form when they are first formed, but later in life theycan also choose to shift between one form and another, with some costs.
1

noticeable changes in these decisions. What was forecasted and what happened?
In section 1, we focus on a corporation's decision to use debt V3. equity finance. We
present various theoretical models that have been developed to describe a firm's decisions,
then use the models to forecast what should have happened as a result of the 1986 t
reform. We find that the actual change in debt/value ratios has been substantially smaller
than the models predict. We discuss some reasons for the surprise. In addition, we raise
some new issues, including the implications for the effective tax on retained earnings that
follow from optimal trading strategies, and the incentives provided by the new interest
allocation rules for multinational corporations to shift their borrowing abroad.
Section 2 then examines the decision to pay dividends V3. use the same funds to reduce
new share issues or to repurchase existing shares of one's own firm or of other firms. Finally,
section 3 examines the choice of organizational form. Results are summarized briefly in
section 4.
1. DEBT VS. EQUITY FINANCE
A. Forecasts from the traditional theory
During the last decade, there have been a variety of approaches in the theoretical
literature to the determinants of a corporation's debt—equity ratio. To begin with, Miller—
Modigliani (1961) emphasized that interest payments but not dividends are deductible
under the corporate income tax, implying that a shift of a dollar from equity to debt finance
lowers corporate tax payments each year by ri, where r is the corporate tax rate and i is
the nominal interest rate. This tax savings from additional use of corporate debt would
be traded off with the increased risk of costly bankruptcy that results. As the literature
developed, real bankruptcy costs included not only administrative costs,2 but also a variety
of extra monitoring and agency costs arising from the conflicts of interest between different
classes of creditors in bankruptcy, and even in anticipation of the possibility of bankruptcy.3
2 Warner (1977) presented data indicating that these were small.
See, for example, Myers (1977), Jensen and Meckling (1976), Bulow and Shoven (1978), and White(1980, 1989).
2

Suppose the additional costs that arise from the marginal dollar of debt can be expressed
a.s a general function of the existing debt—value ratio, C(D/V), where C(.) is assumed to
be increasing in DIV. If the firm adds debt until the extra tax savings are just offset at
the margin by extra bankruptcy costs, then in equilibrium ri = C(D/V).Miller (1977) pointed out that this model entirely ignores personal taxes. Yet, under
the personal income tax non:iinal income from debt (interest payments) is entirely taxed
at ordinary rates, while nominal income from equity consists not only of dividends, which
are also taxed at ordinary rates,4 but also of capital gains, which are not. Capital gains
are taxed only when the asset is sold, allowing a gain from deferral of tax payments. In
addition, prior to the TRA86 capital gains were taxed at only forty percent of the ordinary
rate if the asset had been owned for over six months and were entirely tax exempt if the
asset were held until death.5 The less favorable tax treatment of debt income under the
personal income tax offset to some degree the more favorable tax treatment of debt under
the corporate income tax.
To understand the implications of taking personal taxes into account, let 2 represent
the ordinary tax rate of the marginal investor in corporate debt, and let e represent the
net taxes on a dollar of income to equity, received in some combination of dividends and
capital gains.6 If a firm owns an asset earning i before tax, and finances this asset by debt,
then no corporate taxes are due on the resulting net income, but personal tax liabilities
equal ti. In contrast, if the asset were financed with equity, corporate tax liabilities would
be Ti, leaving net of corporate tax income of (1 — r)i received by equity holders. They pay
a tax at rate e on this income, implying total tax payments of (T + (1 —T)e)i under equity
finance.7 If additional debt is used to finance the firm until the tax savings that result are
In fact, prior to the TRA86, the first $100 in dividends received by an individual were tax-free. Sincevirtually all dividends are received by shareholders with more than 1100 in dividend income, this provisionshould have no effect on marginal tax rates.
Prior to July, 1984 the holding period for long-term gains vu one year, and prior to October, 1979,the long-term rate was fifty percent of the ordinary income tax rate.
6 For capital gains, we use the accrual equivalent tax rate, rather than taxes currently paid.
If the asset earned more than i, with the additional income accruing to the original equity holders,then the same amount of taxes would be paid on The additional income, regardless of the choice of debtvs. equity finance at the margin.
3

just offset at the margin by additional bankruptcy costs, then in equilibrium8
(r + (1 — r)e — t)i = C(D/V). (1)
In order to summarize the incentives to use debt finance under the tax law immediatel
prior to the 1986 reform, each of these tax parameters must be measured. Consider first
the marginal effective tax rate on income at the corporate level. During this period,
corporations with substantial income faced a statutory tax rate equal to .46. Corporations
with losses were allowed to use these losses to offset any profits earned during the previous
three years, or profits they may earn during the following fifteen years. In addition,corporations with taxable income below $100,000 in a year faced lower statutory corporate
tax rates. Furthermore, the effective marginal tax rate was reduced by the limitation on
ue of the investment tax credit to 85% of tax payments.9 Using time-series data available
nternafly at the Treasury, Altshuler and Auerbach (1990) calculated that on average the
corporate tax rate that applied to interest deductions was only .318 during the early 1980's.
Measuring the ordinary tax rate faced by the "marginal investor" in corporate debt is
even more difficult since investors in many different tax brackets invest in bonds. Gordon
and Bradford (1980) show that the tax rate on interest income embedded in the market's
evaluation of bonds is a weighted average of the marginal tax rates of all investors active in
the bond market. One possible approach to measure this weighted average of marginal tax
rates is to compare the interest rates on taxable and tax-exempt bonds that otherwise have
similar characteristics. Poterba (1989) compares the yield on long-term Treasury bonds to
state and local municipal bonds and finds that the average t over 1981—1985 is O.202.'°
8 See Gordon (1982) for a formal derivation.
Given this limitation, tax payments equal iY — min(.85rY,C), where Y equals taxable income, and Cequals the amount of investment tax credits. The marginal tax rate in a given year drops to .15r when thelimitation on investment tax credits is binding. Carryover of credits complicates this calculation, however.
10 Gordon and Malkiel (1981) compare the yields on taxable and tax-exempt bonds issued simultansouslyby the same corporation by looking at firms that issued tax-exempt industrial revenue bonds (IRBs)along with ordinary bonds with the same nontax provisions. This alternative approach ensures that thecomparison holds everything other than tax status constant. They estimated i to be 0.225 in 1978. TheTRA86 restricted the use of IRBs for private investment, so we cannot use this superior method to estimatethe implicit tax rate post-TRA86. We thus rely on Poterba's approach, which he does use to estimatefor 1987—8.
4

We now estimate the marginal tax rate on equity income. If the fraction d of the
nominal income accruing to equity holders takes the form of dividends, and capital gains
are always realized long—term, then e =dt + (1 — d)gclt. Here, g measures the fraction of
long—term gains which are taxable implying that g = .4 prior to 1986, while a is intended
to capture the benefits from deferring the payment of accruing tax liabilities on capital
gains until the asset is sold, and the benefits of being exempted from tax on gains on assets
still held at death. The conventional assumption in the literature has been to assume that
the effective tax rate on capital gains is halved due to deferral, and halved again due to
the exemption at death, implying that a .25.11
We estimate d by taking the average ratio of aggregate corporate dividend payments to
after—tax corporate profits during 1984 through 1986, as reported in the National Income
and Product Accounts, which equals .560.12 Given these parameter values, r+(1—r)e—t =
.199.13 Therefore, $.199 more is paid in taxes on a dollar of pre-tax corporate income if
this income belongs entirely to equityholders than if it belongs entirely to debtholders.
What would have happened to the tax incentive to use debt under the TRA86, as
calculated using this traditional approach? Many incentives changed under the TRA86.
To begin with, the maximum statutory tax rate was cut from 46% in 1986 to 40% in 1987
and 34% in 1988 and thereafter. This rate now applies to income over $75,000, rather than
$100,000, so fewer firms are likely to face the lower bracket rate. In addition, the likelihood
that a corporation will have tax losses has fallen due to the reduction in initial depreciation
allowances on purchases of new physical capital.14 The repeal of the investment tax credit
See, for example, Feldstein, Dicks—Mireaux, and Poterba (1983).
12 After—tax corporate profits include the inventory valuation adjustment and the capital consumptionadjustment. We exclude financial sector firms throughout the paper.
13 Miller (1977) argued that in equilibrium t would adjust until this expression equaled zero, whileDeAngelo—Masulis (1980) argued that r should adjust until in equilibrium this expression equaled zero.Rather than relying on their theoretical results, which depend on the assumption that marginal bankruptcycosts are zero, we used the best empirical estimates we could find for each parameter.
14 For a sample of approximately 1400 firms with complete data in Compustat, average loss carryforwardshave fallen since 1986 from about 30% of net sales to 8% in 1988, even though after-tax corporate profitshave fallen during this same period from $191 billion to $186 billion according to the Surve of CurrentBusiness (Table 1.16), July 1989.
5

also eliminates the effect of the limitation on allowed tax credits, which had lowered the
effective marginal tax rate.
All of these changes raise the fraction of corporate income taxable at the maximum
rate. However, the TRA86 also increased the importance of the alternative minimum tax
Companies paying the alternative minimum tax face a marginal tax rate of 20%. Some
of the companies paying the alternative minimum tax may otherwise have faced a lower
marginal rate, due to the effects of tax losses and progressivity in the rate schedule, but
some may otherwise have faced a 34% marginal tax rate. Without access to confdential
tax returns we cannot redo the calculations reported in Altshuler and Auerbach (1990) for
post—1986 data, and thus simply assumed that the average corporate tax rate that applied
to interest deductions during 1987—8 was 85% of the maximum statutory rate, rather than
69.2%, as found during the early 1980's by Altshuler and Auerbach.
The cut in personal tax rates in 1986 should also have reduced t. Using municipal bond
return data, Poterba (1989) implicitly estimates that the personal tax rate on the marginal
investor in taxable bonds was 19% in 1987, and 15.5% in 1988. In addition, individuals
could no longer exclude the first $100 in dividend income, though for the most part this
should not affect marginal incentives.
The remaining parameters to be estimated are d, a, and g. Using the estimated equa-
tion for dividends in Poterba (1987), we forecast that the TRA86 should increase the
dividend payout rate by 12.3% in 1987 and by another 4.7% in 1988, raising d from .588 to
.711 and .758 in 1987 and 1988 respectively.15 In addition, long—term gains became fully
taxable, so g = 1.0. While the timing of realizations is likely to change under the new law,
we initially maintain the conventional assumption that a =0.25.
We have collected our calculations in Table 1. According to the discussion above, the
tax rate (corporate and personal) on equity is r + (1 —r)e, while the tax rate (personal
only) on debt is i. Comparing 1988 to 1986 shows that the tax rate on income to debt
is estimated to fall from .202 to .155, while the tax rate on income to equity falls only
15 We report increase3 in the dividend payout rate relative to 1986 values. However, to calculate thepre-TRAS6 tax incentive for debt above, we used the average value for 1984—1986.
6

from .401 to .379, implying a net increase in the tax advantage of debt from .199 to .224.
Therefore, the TRA86 provided some incentive to increase debt financing.
Why does debt look more attractive? The estimated magnitude of the fall in the
tax cost of debt is not surprising, given the general drop in both personal and corporate
statutory tax rates.16 Why did the tax cost of equity fall by less? There are two factors at
play here. First, the estimated personal tax rate on equity income is estimated to increase
slightly from .122 to .127. Although personal tax rates were cut, Poterba forecasts that
more equity income will be in the form of dividends, which remain more highly taxed than
capital gains (because capital gains taxes are still deferred until realization or forgiven at
death). The shift from capital gains to dividends more than compensates for the decrease
in the tax rate on the marginal investor's income.
The second factor in the tax cost of equity is the effective corporate tax rate. We
believe that the fall in this rate was also relatively small (from .318 to .289) despite the
deeper cut in statutory rates (from .46 to .34) because of the simultaneous changes in
depreciation and investment tax credits. With a broader tax base and no credits firms
will be less likely to face a zero tax rate (tax exhaustion). The statutory rate fell, but the
likelihood of actually paying that tax rate increased, with the net effect that the expected
corporatetax rate didnot fall by much.
Thus, offsetting changes in the corporate tax rules and in the composition of equity
income should limit the change in the tax cost of equity, while the debt cost appears to
have fallen more substantially. The combined effect is for firms to have a higher incentive
to borrow.
What effect should this change in incentives have on the average corporate debt—value
ratio? To our knowledge, no one has attempted to estimate directly the relationship
between the debt incentive of equation (1) and firm debt ratios. There are two reasons
why such studies have not been feasible. First, there has been very little time-series
variation in many of the tax parameters during the period since World War II. Second, it
is difficult to measure accurately many of the tax parameters, as evidenced by the work of
16 Financial intermediaries are important investora in bonds, implying that changes in corporate tax ratescan also affect the tax rate on debt.
7
Altshuler and Auerbach (1990). As a result, many authors have attempted to estimate the
effect of various partial proxies for the effective marginal tax advantage of debt on debt
ratios. Typical proxies with sufficient time-series variation include depreciation deductions,
loss carryforwards, and investment tax credits.'7 However, most of these studies have no
carefully specified the relationship between the proxies and the marginal tax advantage of
debt, and in fact many of them have obtained estimated coefficients that have the wrong
sign according to the theory.18 Thus it would be very difficult to use these estimates to
forecast the effects of the 1986 tax changes.
,Another approach was taken by Gordon (1982), who tested the sensitivity of debt—
value ratios to changes in market interest rates, through running a regression of the form
DIV = be + be i +... using time-series data. As seen in equation (1), the incentive to use
debt should instead be a function of the product of the market interest rate and a tax term.
However, if the tax term were unchanging during the sample period, then the debt—value
ratio is simply a function of the market interest rate, and we can interpret b1 as equalling
b(r + e(1 — r) — t). The specification then implies that b, should remain constant over
time, even if tax rates do change. We therefore assume that the tax incentive term had
been constant during the sample period 1956-80 at our estimated 1986 value of .199. We
then infer from the estimated parameters that the debt—value ratio should have increased
by .234 from 1986 to 1987, but only by .155 from 1986 to 1988, due to both the changes
in the tax law and the observed increase in market interest rates.
MacKie-Mason (1989, 1990) takes a different approach to studying the determinants of
financing decisions. Rather than estimate models of firm debt/value ratios, these papers
study incremental choices; the first considers the choice between stock and bonds when
a firm publicly issues securities, and the second considers the choice between private and
public sources of funds. The econometric results indicate that the public debt-equity
choice depends significantly on implicit variation in a firm's effective marginal tax rate.
Specifically, if a firm has high non-debt tax shields (loss carryforwards and investment tax
17Examples include Titman and Wesuel. (1988); Mig and Peter.on (1986); Auerbsch (1985); Bradley,Jarrell and Kim (1984); Long and Malitz (1985).
MacKie-Muon (1990) diacuese. these problems in more detail.
8

credits) when it is near tax-exhaustion, then those shields have a substantial probability
of crowding out interest deductions on new debt, and the first study finds that those firms
are less likely to issue bonds. In essence, the analysis uses publicly available information
to identify those firms likely to have a low expected marginal corporate tax rate, and then
estimates the difference in debt—equity choices for those firms.
We have used the estimates in MacKie-Mason (1990) to forecast the ratio of new debt
issues to equity issues after the tax reform. We first calculated the predicted fraction of
debt issues in 1987 and 1988 using the observed values for firm characteristics. We then
attempt to forecast what the fraction of debt issues would have been if there had been no
tax reform. To do this we used the following method to estimate what loss carryforwards
and ITC would have been. We assumed that ITC would have been the same fraction
of new capital expenditures as in 1985,19 and that tax loss carryforwards would remain
unchanged in 1987 and 1988 from its previous value.20 The results are shown in Table 2.
The forecast is that the effect of the TRA86 on the fraction of new issues that are debt
rather than equity should be an increase in the debt share of .02 in 1987 and .06 in 1988.
Without the TR.A86, debt issues in 1987 are forecast to increase over 1986 by 8%, but
then fall by 11% from 1987 to 1988, due to variation in other factors.
We shall return in Section i.E to compare the forecasts with actual financing practices
in 1987 and 1988. We now continue our survey of theory and forecasts, considering some
elaborations on the theory presented above, some new issues raised by the TRA86, and
some alternative theories.
B. Further elaborations on the traditional model
In the above discussion, we assumed that the costs of extra debt, as measured by the
function C(D/V), do not change as a result of the Tax Reform Act. These costs are
presumed to arise primarily as a result of the conflicts of interest between debt and equity
holders, giving the firm the incentive to make value-reducing decisions that aid equity
19 We use 1985 as the base year because the repeal of ITC was retroactive to January 1, 1986.
20 Alternative assumptions about TLCF made no difference to the forecasts.
9

holders at the expense of debt holders and leading debt holders in response to spend
resources monitoring the firm. To the degree to which debt holders and equity holders
are the same people, however, this conflict of interests is reduced since redistribution
among securities no longer implies redistribution among investors. Under the tax law
prior to 1986, portfolio holdings were highly segmented, with interest-bearing assets held
by individuals and institutions in low or zero tax brackets and equity held by those in
high tax brackets — those in high tax brackets benefited much more from the favorable
treatment of capital gains on equity.2' As a result of the TRA86, however, the tax benefit
of capital gains was substantially reduced, reducing tax distortions to portfolio choice. if
portfolios become more balanced, conflicts of interest between debt holders and equity
holders should become less important. As a result, the costs of extra debt are less (the
function C(D/V) shifts downward) and use of debt should increase by more than forecast
using the above model.22
Another weakness of the traditional theory is its naive treatment of capital gains.
Recent research on optimal trading strategies suggests that the effects of the tax treatment
of capital gains can be far more complicated than presumed in the above discussion.2' The
effective tax rate on additional retentions depends heavily on the trading strategies followed
by investors. For example, under both the old and the new laws, investors would have the
incentive to sell immediately securities that have dropped in price in order to claim the
tax loss without delay. In addition, calculations reported by Constantinides (1984) suggest
that under the old law investors also had the incentive to sell gains as soon as they become
long-term, rather than holding gains to defer the capital gains tax. By selling as soon
as gains become long-term and then reinvesting, the investor acquired the right to realize
any drop in price during the following year as a short-term loss, a right that was valuable
enough that it paid to realize the long-term gain. If investors did follow this strategy of
For evidence on portfolio holdings see, for example, King and Leape (1984). Note, however, that ifequity is owned directly by investors in high tax brackets, but corporate bonds sre owned by corporatedefined—benefit pension funds, where the corporation is the residual claimant on the assets, then the incomefrom both the equity and the debt accrue to those in high tax brackets.
22 For further discussion, see Gordon (1989).
23 See, for example, Constantinides (1984) and Stiglitz (1983).
10

selling losses short-term and gains just after they became long-term, so that all securities
were turned over each year, then the cx anie expected increase in capital gains taxes when
a firm retains aix extra dollar would be t/3 + .4t(1 — ), where $ is the probability that
the value of the firm falls during the year.24 Under this trading rule, the value of a
should be 1 + 1.5$, rather than 0.25 as assumed above.25 For a variety of reasons, actual
trading strategies are likely to involve much less trade, implying a lower value of a, but
not necessarily one dose to 0.25.
Under the Tax Reform Act of 1986, long-term capital gains are no longer taxed at a
lower rate, eliminating the attractiveness of selling gains. The optimal trading strategy
now becomes selling losses and holding gains.26 The change in trading strategy implies a
drop in a after 1986. How large a drop is difficult to judge, but any drop makes equity
more attractive. Suppose for instance that the correct value for a pre-TRA86 was .50 but
that the value then dropped to .25 after the reform. Then the forecasted change in DIV
between 1986 and 1988 decreases from .155, the value calculated above, to .127.
C. New issues raised by the Tax Reform Act of 1986
The Tax Reform Act of 1986 included several new provisions not present in previous
legislation, which could also affect corporate debt—equity ratios. Understandably, previous
theories did not examine the effects of such provisions. The first provision restricts interest
deductions on Schedule A under the personal income tax to mortgage interest on a first
or second house, and investment interest up to the amount of investment income. The
24 One omitted complication is that the tax law forces individuals to use long-term capital gains to offsetshort-term capital losses, with only the aei loss deductible. Another is that only $3000 in net losses canbe deducted from other income. Some ways to relax these constraints are discussed in Stiglitz (1983).
25 The value of a is the factor that converts the capital gains tax rate on long-term gains, gi, into anaccrual-equivalent tax rate. The factor is greater than one with frequent trading because incrementalretained earnings in gain years are taxed at gi, but retentions in loss years are taxed at the full personalrate, t.
26 In addition, the probability of experiencing a capital lose on a particular asset would change dueto changes in debt—equity ratios, changes in dividend payout rates, and the change in trading strategy.Trading strategy matters because of the longer holding period for gains. The conditional probability ofan asset experiencing a capital loea—a drop in price below the original basis—falls the longer the asset isheld as long as the asset has a positive expected nominal rate of return.
11

deductibility of consumer interest payments (except those related to a business) is being
phased out during 1987—90. What should the effects of these provisions be?
To begin with, individuals have the incentive to convert nonmortage debt into mortgage
debt, thereby making the interest payments deductible, or alternatively to use any holding
of taxable bonds to repay nonmortgage debt. As long as an individual's total net debt had
been less than the allowed amount of mortgage debt under the statute, then this conversion
is feasible and should be the only effect of the new provision.27 To the extent that there
are transactions costs from this conversion, the net tax effect can be no larger than these
transactions costs.
What happens if the individual's total net debt had been greater than the allowed
amount of mortgage debt?28 This is most likely to occur for the wealthiest individuals
who for tax reasons have had the incentive to borrow heavily and invest the funds in more
lightly-taxed assets such as corporate equity. These individuals would prefer borrowing
by the corporations in which they own shares to personal borrowing. At the margin, they
face a tax rate on interest income of t = 0, so that equation (1) implies a very strongincentive for corporations to make increased use of debt finance.29 As in the proof of the
Modigliani and Miller (1958) theorem, corporate borrowing replaces individual borrowing.
In particular, corporations can borrow to repurchase the shares of these individuals, who
then use the proceeds to repay their excess debt.
In Table 3 we present some evidence on personal borrowing patterns. There was a dra-
matic increase in mortgage borrowing in 1986 and 1987, as expected. Mortgage borrowing
has fallen off in 1988 and the first quarter of 1989, but the level is still substantially higher
than it was pre-TRA86. Consumer credit reached its peak during 1984—85, and fell off
considerably from 1986 on. Thus, it appears that there was significant substitution from
27 Of course, the individual must also hold enough home equity to secure the necary mortgage debt.Manchester and Poterba (1989) estimate that there was a potential stock of $2.5 trillion in unused mortgageborrowing in 1985, and that if the $100,000 limit on tax-deductible second mortgage debt had been inplace only 10.5% of homeowners would have been constrained.
28 "Net" debt does not include debt used to finance portfolio investments, since interest on this debt isstill deductible.
29 Feldstein (1989) also makes this argument about the effects of the limitation of interest deductions oncorporate borrowing.
12

consumer credit to mortgage borrowing. In addition, total borrowing had been increasing
almost linearly from 1980—1986 but fell well below the trend line after the TRA86.
The aggregate flows in Table 3 are for all individuals in the U.S., but the interest deduc-
tion provisions of the TRA86 affect only those individuals who itemize. Most individuals
with mortgages are itemizers, but many who use consumer credit are not, and nonitem-
izers faced no change in the tax cost of borrowing. The other part of Table 3 reports
preliminary data on interest deductions claimed by itemizers during 1986—88. Mortgage
interest paid by itemizers has steadily increased, while consumer interest paid by itemizers
(i.e., deductions grossed up by the fraction that is deductible under the new law) has fallen
significantly. The ratio of nonmortgage to mortgage interest for itemizers has fallen from
59% in 1986 to 45% in 1988.°
A related provision of the new law limited the tax deductibility of losses arising from
"passive" investments such as shares in a limited partnership or income from rental hous-
ing.3' These losses arise in part because of the deduction of interest payments on debt
incurred as part of the business activity. Again, these individuals could attempt to sub-
stitute mortgage debt for the passive business debt. If this is not feasible, however, then
they would face a reduced marginal tax rate on income from these passive activities. For
passive investments undertaken after October, 1986 that incur net tax losses, the marginal
tax rate is zero. For earlier passive investments that have losses, phase—in rules allow some
fraction of these losses to be deducted from taxable income. Simple calculations suggest
that the marginal tax rate on this income is approximately .825t in 1987 and .5i in 1988.32
If these individuals are also corporate shareholders, they would again have an increased
incentive to substitute corporate borrowing for personal borrowing due to the drop in the
personal tax rate applying to interest deductions. This new provision therefore should also
increase corporate incentives to issue debt.
30 See the paper by Feenberg and Skinner in this volume for further evidence on shifts from consumercredit to mortgage borrowing.
31 Note that aggregate partnership income reported on individual returns has been negative since 1981.
32 Under the phase—in rules, 65% of the losses in 1987 could be deducted, 40% of the losses in 1988, 20%of those in 1989, and 10% of those in 1990. The figures in the text use these rules, but take into accountthe benefit of carryover of losses disallowed inan earlier year assuming a 10% discount rate.
13

A third provision in the new law requires that affiliated corporations eligible to ifie a
consolidated return allocate worldwide interest deductions across the various companies in
proportion to their assets to determine domestic and foreign source income. Previously, an
affiliated group could calculate income separately for each company, allowing it to a1locat
interest deductions to particular firms in order to minimize total tax payments by the
group. As long as most other countries continue to follow the previous accounting practice,
there will be complicated interactions between the provisions in different countries. In fact,
the rules may have a "beggar-thy-neighbor" effect, by increasing tax payments to the U.S.
at the expense of tax payments to foreign governments.
Consider the following example. In the simplest terms, a U.S. firm with foreign branch
operations pays a total tax bill consisting of foreign taxes plus pre—credit U.S. taxes minus
foreign tax credits:
r1i4 + Tu(y + ;) — min[rj4,rtty;]
where r i5 the tax rate in country i with I the foreign country and u the U.S.; and y
is source income in country i as defined by country i's tax law. Suppose a U.S. multina-
tional has domestic capital K5, and foreign branch capital Kf, and increases borrowing
enough to make additional interest payments of i. U.S. pre-credit tax payments fall by i-,,i
regardless of where the borrowing takes place since tax is levied on worldwide income, If
the firm has excess foreign tax credits (7sy c then the foreign tax credit falls by
r5i(Ki/(K5 + K1)) under the new interest allocation rules, again regardless of the location
of the borrowing. However, foreign tax payments may depend on the borrowing location:
with a source-based deduction, foreign taxes fall by r1i only when the borrowing is done
abroad. Thus, a multinational with excess foreign tax credits and foreign branch opera-
tions will reduce its total tax liability by doing all borrowing abroad. In contrast, if the
firm does not have excess foreign tax credits then the location of the interest deductions
does not affect total tax payments.33
If foreign governments do adopt the same tax provision for the allocation of interest deductions, thenthe location of the interat deduction becomes irrelevant, but the effective corporate tax rate applied tointerest deductions becomes (K1r1 +K.rs)/(Kf + K5), which is simply a weighted average of the foreignand domestic tax rates, rather than r5 as assumed above.
14

D. Other theories of corporate financial policy
In response to the poor performance of empirical tests of the traditional model of corpo-
rate financial policy used above, Myers and Majiuf (1984) developed an alternative model,
focusing on the conflicts of interest between existing equity holders and new creditors (both
equity and debt). They argued that a firm's manager has better information about the
true value of the existing firm than the market does, and wants to use this information to
the advantage of existing equity holders. As a result, the manager may issue new shares
either because the market overestimates the true value per share or because the firm in fact
needs further funds to finance valuable new investment projects. Investors therefore must
react cautiously when the firm issues new securities since the fact that the firm chooses
to make the new issue suggests that the firm's share price may be too high. This caution
makes it more expensive for the firm to go to the market for new funds, and more so for
new equity than for new debt since the return on equity is much more sensitive to the true
value of the firm. Myers and Majluf then conclude that the firm would always prefer to
issue debt rather than equity, and would find internal finance preferable (if available) to
outside finance.34 Firms may also concentrate their issues of new securities during periods
in which the market is relatively well informed about the situation of the firm, thereby
lessening the need for caution on the part of purchasers of these new issues.
The theory did not directly focus on tax effects. It would appear that taxes reinforce
the firm's preference for new debt issues over new equity issues, but create an incentive to
issue new debt even when internal finance is available for needed projects.
What would the Tax Reform Act of 1986 do to corporate financial policy according
to this theory? Under the reform, corporate tax payments went up, at least during the
first few years. As a result, the internal funds available for new investment projects drop.
Firms therefore would be forced to seek outside finance more frequently, where outside
finance normally takes the form of debt. Therefore, debt-equity ratios should grow, at
least for those firms in which internal funds are not sufficient to finance desired investment
projects.
If the firm cannot iasue new debt, due perh&p. to credit rationing as described by Stiglitz and Weiss(1981), then it may choose to issue new equity.
15

E. Evidence on debt—equity ratios after the reforms
What in fact happened to debt—value ratios in response to the TRA86? Table 4 reports
figures calculated from the balance sheet data of 996 firms on the Compustat tape.35 The
first row reports debt/value ratios from 1985—8, using data on book debt and the market
value of equity. Here, we find that debt/value ratios did increase, as forecast, but that the
increase was only .041 from 1986 to 1988, in contrast to the forecasted increase of .155.36
Why might the theory have forecast a much larger change than in fact was observed?
One possible explanation is that the adjustment of corporate capital structure is a costly
process that is likely to occur gradually. Auerbach (1985) makes a simple attempt to model
dynamics, and finds that only 27.4% of the adjustment takes place each year, implying
that 52.7% of the adjustment should have taken place after two years. This would imply
a long run increase in D/V of only .078, which still seems very small.
A second possible explanation is that some of our tax parameters are estimated poorly,
leading us to overestimate the size of the tax change. For example, our estimate of the
effective corporate tax rate in 1986 was based heavily on calculations by Altshuler and
Auerbach for the early 1980's, when the state of the economy was much different,37 while
our estimate for the corporate tax after 1986 was simply a guess. Had the ratio between
the effective and the statutory corporate tax rates not changed as a result of the TRA86,
then debt-value ratios would have been forecast to decrease.38 To explore the possible
importance of this explanation, we compared what happened to firms that were more or
less likely to face a lower effective corporate tax rate. In particular, we compared firms
35 We only selected finns from the Primary, Secondary and Tertiary tape, so our sample is biased towardslarge firma. Our selection criteria were that the finns be nonfinancial, and that they have complete datafor all of the variables in each comparison. Book debt is the sum of short- and long-term, and the marketvalue of equity is measured using the price on the last trading day of the year.
36 The debt/value rations for our sample are very similar to the values for the entire nonfinancial corporatesector as reported by the Federal Reserve — .24 in 1985, and .29 in 1988 (Balance Sheets for the U.S.Economy, April 1989) — so our reliance on a sample does not appear to introduce important bias.
For instance, the importance of tax loss carryforwards was likely much higher during the middle of adeep recession in the early 1980's than in 1986, after several years of relative prosperity.
For example, if the ratio of the effective to the statutory tax rate remained equal to the Altshuler andAuerbach estimate for the early 1980a, then the tax incentive favoring debt would drop from .199 in 1986to .177 in 1988.
16

whose ITC credits in 1986, as a fraction of after—tax profits, were below V3. above the
median value for firms in the sample. Those with large ITC's were more likely to face a
binding restriction on credits in 1986, reducing their effective corporate tax rate then but
not (to the same degree) in 1988. As a result, they should have increased their debt/value
ratios more in response to the tax change, and this is indeed what we find. Even for those
with larger ITC's in 1986, however, who should have faced a time pattern o! tax rates
similar to those used in our calculations, the observed increase in use of debt was smali
relative to the forecasts.
Similarly, little is known about the effective capital gains tax rate, given its heavy
dependence on trading strategies which themselves are affected by the tax law. We showed
above that the forecasted change in D/V was sensitive to the assumptions made about
the values of o before and after the reform. Before the reform, more trade should have
occurred due to the favored treatment of capital gains. This raises the effective tax rate on
retained earnings, making debt finance more attractive. Perhaps we underestimated the
magnitude of the change in trading strategies brought about by the tax reform, causing
us to overestimate the increased tax incentive to issue debt. To test the plausibility of this
explanation, we would need data before and after the reform on the fraction of shares sold
each year, both long-term and short-term, but such data are not currently available.
In addition, the above calculations assumed a closed economy. Yet corporate securities
are increasingly being purchased by foreign investors. Equity is no longer as favored under
the U.S. personal income tax, due to the increased tax rate on capital gains and the general
reduction in the importance of taxes due to the drop in tax rates,39 but barring similar
changes in foreign tax laws, foreign holding of U.S. equities should remain as favored as
before.4° We would therefore forecast an international shift in portfolios, with foreigners
increasingly owning the equity in U.S. firms, implying on net a smaller drop in the personal
tax advantage of equity after 1986. As a result, debt/value ratios should not have increased
According to our figures in Table 1, the difference in the personal tax rates on income from debt V3.equity had been (.202 — .122) = .08 in 1986, but only (.155 — .127) = .028 in 1988.
40 As Whafley shows elsewhere in this volume, many other countries have also recently revised their taxsystems, usually in a manner similar to the U.S. tax reform. Thus, U.S. equity may now also be lessfavored in other countries.
17

by as much as was previously forecast, assuming a closed economy. How important this
effect should be is hard to judge. Was there any observable shift toward foreign ownership of
the equity in U.S. firms? Scholes and Wolfson (1988) report a large and sustained increase
in foreign acquisisions of U.S. firms starting in the fourth quarter of 1986. International
portfolio shifts may therefore be part of the explanation for the small change in debt/value
ratios.
A third explanation would appeal to some of the other complications discussed in Sec-
tion 1.C. Some would have led us to forecast an even larger increase in D/V, so do not help
directly in explaining the smaller than expected increase. One complication that does lead
to a reduced forecast of D/V is the interest allocation rule for multinationals. In order
to test the importance of this complication, we calculated the change in debt/value ratios
for the subsample of firms that reported no foreign income tax payments, which presum-
ably were firms unaffected by this complication.41 For these purely domestic firms, 1)/V
increased by .060 from 1986 to 1988, which is still small relative to the above forecasts.42
Perhaps the poor forecasts simply result from the limits of past empirical work on
firms' responsiveness to tAx incentives rather than weaknesses in the procedures used for
calculating tax incentives. If so, we have learned that corporate debt policy is quiteinsensitive to tax incentives.
One possible direction in which to seek an explanation for the small increase in the D/V
ratio is through non-tax changes in the bankruptcy and agency cost function, C(D/V).
If C(D/V) shifted up, debt would be relatively less desirable. A number of factors may
have changed bankruptcy and agency costs. For instance, the October 1987 stock market
crash may have increased the perceived level of risk, leading to higher required risk premia
on debt. Other factors to consider include recent institutional developments such as the
emergence of a market for below-investment-grade debt ("junk" bonds), and the growth
41 If multinationals shift borrowing abroad in response to the new interset allocation rules then domesticdebt/value ratios might decline. However, in many cases the data are reported on a consolidated basis, inwhich case there may be no effect on the observed D/V. Because of the data complications, we focus hereonly on firma with no foreign operations.
42 However, if we also take into account Auerbach'a (1985) estimated adjustment rate, the predictedlong-term change is .114, which is not too far from the .155 predicted by the theory.
18

of leverage buyouts of firms, though the timing of these events would themselves need to
be explained.
We also examined the degree to which firms that faced higher bankruptcy risk in 1985
behaved differently in response to the TItA86. These firms presumably had a higher
debt/value ratio than desired in 1985, so would be trying to reduce it during the following
few years, leading to a smaller increase in DIV.43 For a bankruptcy indicator, we used
1/ZPROB, where ZPROB is a discriminant function predictor of bankruptcy estimated
by Altman (1966); a high value of 1/ZPROB indicates a relatively high probability of
declaring bankruptcy. We find that firms facing a higher risk of bankruptcy (high ZPINV
in Table 4) did not change their debt/value ratios much in response to the TRA86, whereas
firms facing little risk responded much more.44
We also tested the accuracy of the forecasted effects of the tax reform on the fraction of
new public issues that are debt, based on the estimates in MacKie-Mason (1990). In Table
5, we report the number of new stock and bond issues from 1980 to 1988. As predicted,
we observe an increase in the fraction of debt issues from 46% in 1986 to 52% and 66%
in 1987 and 1988 respectively, implying an increase of 6% by 1987 and 20% by 1988. The
forecasts were for 54% and 43% debt issues in 1987 and 1988. The 1987 forecast was very
accurate, but 1988 was extremely underforecast. Since we don't know if the poor forecast
in 1988 is due to bad estimates of the tax or other effects, it is difficult to infer whether
the estimated impact of TRA86 on debt issues (an additional 2% in 1987 and 6% in 1988)
is reasonable.
How do we reconcile a large shift towards debt issues with a rather small change in
debt—value ratios? First, as seen in the right—hand side of Table 5, the amount of capital
raised by debt vs. equity did not change much during the time period, due presumably
On the other hand, they should have faced a lower effective corporate tax rate in 1985, reducing theiroptimal debt/value ratio then, causing the forecasted change to be larger.
Further results on the pattern of response across firms are available in Givoly, Hayn, Ofer, and Sang(1989). They regress changes in debt/value ratios between 1986 and 1987 on a variety of variables. Theirresults agree with our inferences: different firms were affected by the reform in accordance with the standardtheories of bankruptcy cost and non-debt tax shield effects. However, several of the explanatory variablesin their analysis include book debt or the market value of equity, which are also in the dependent variable,so the results of their OLS regreesions are likely to be biased and inconsistent. We avoid endogeneity byusing 1985 values to classify the firms.
19

to changing relative sizes of issues. In addition, the change in the market value of equity
depends not only on new issues, but also on stock repurchases, dividend payments, as well
as revaluations of etsting capital by the market, and book debt changes include private
borrowing as well as public issues. The value of most equities rose dramatically during the
first three quarters of 1987 then crashed, leaving average equity values at about the same
level at the end of 1988 as at the time of the tax reform. Therefore, the revaluation effect
may not be important during this period, but changes in share repurchases and dividend
payout rates were important, as seen below.
One important uncontrolled factor ii' all of the analysis is the effect of the 1987 stock
market crash on short-run financing choices.45 Even if psychological and institutional ef-
fects do not persist in the long-run, they may have affected financing behavior substantially
during 1987 and 1988, which are the only years we have data for. Casual reading of the
Wail Street Journal suggests that the crash led to a dramatic drop in the rate of equity
financing during 1988. If so, debt—value ratios would have been even lower without the
crash. This only reinforces the puzzling lack of change in debt/value ratios.
2. CORPORATE DISTRIBUTIONS VIA DIVIDENDS, SHARE REPUR-CHASES, OR MERGERS
A. Traditional story
L1nder the tax law prior to the• TRA86, most corporations faced a tax incentive to
make payments to shareholders in the form of share repurchases rather than dividend
payments.46 When payouts are made via share repurchases, the distribution is taxed as
a capital gain under the personal income tax, but would be taxed at ordinary rates if the
payout had taken the form of a dividend payment.47 Since at least long-term capital gains
The crash may be one reason that we underpredicted the fraction of debt issues (overpredicted equityissues) for 1988.
46 Since new share issues are simply negative share repurchases, the theory simultaneously forecasts atax savings from simultaneously reducing new share issues and dividend payments.
In order to prevent a wholesale shift from dividend payments to share repurchases, the IRS holds thatif a corporation repurchases shares at regular time intervals or proportionately from all share holders, thenthe capital gains that result would be taxed at ordinary rates. Corporations can easily avoid having theirrepurchases taxed as ordinary income, however, simply by repurchasing shares on the open market andnot at regular intervals.
20

were taxed at a lower rate prior to the TRA86, dividend payments were discouraged by
the tax law. Even when the tax rate is the same on dividends and capital gains, there
would still be a tax advantage to share repurchases. Whichever form of payout occurs,
shareholders are not taxed on the return of their initial investment. With share repurchases,
this exemption takes the form of a deduction of the initial purchase price (basis) when each
share is sold. With dividend payments, if payouts have been so large that all accumulated
earnings within the firm have been paid out, then any further dividend payments are
classified as "return of capital" and are untaxed. With either form of payout, the total
nominal tax exemption is the same, but the exemption occurs much earlier in time when
share repurchases are used.
As a result of this tax advantage to share repurchases, economists have long been
puzzled why corporations pay dividends at alL48 Attempts to explain the payment of
dividends have normally assumed some nontax benefit from dividend payments that can
offset the tax disadvantage of dividends. One story that has been explored in several
papers is the use of dividends to signal the current profitability of the firm.49 While
these papers do not attempt to distinguish dividends from share repurchases, Gordon arid
Maikiel (1981) argue that dividends rather than share repurchases might be preferable as
a signal because the tax disadvantage of dividends implies that in equilibrium less payout
will occur, implying lower cash-flow pressure on the firm than if repurchases are used as a
signal.5° Another approach, explored in Poterba and Summers (1985), is to assume that
shareholders want dividends for liquidity reasons, and liquidity is valuable enough that
shareholders desire dividends in spite of the tax disadvantage. Share repurchases are less
attractive than dividends since investors must spend the time and brokerage costs to sell
some fraction of their shares.
48 Perhape, corporations had not yet fully realized the tax benefits from shifting to share repurchase.Shoven (1987) and MacKie-Mason (1989b) report that corporations were in fact increasing their relianceon share repurchases during the early 1980's.
See, for example, Bhattacharya (1979) and Miller and Rock (1985).
50 Bernheim (1988) presents a formal model of this effect. Barclay and Smith (1987) point out thatrepurchases may be costly because of an adverse selection problem: repurchases may exploit superiorinformation available to managers who hold shares at the expense of other shareholders.
21

Under either story, the lower the tax rate on dividend income, the larger the amount
that should be paid as dividends. Poterba (1987) estimates the sensitivity of the dividend
payout rate to the tax treatment of dividends using a simple time-series model with a
dynamic structure. From his estimates we forecast that the TRA86 should have resulted
in an 8.5% increase in corporate dividends in 1987 and an additional 10.8% increase in
i988.'
B. Alternative story of dividends
An alternative approach to explaining dividend payments, known as the "new view,"
appears in Auerbach (1979), Bradford (1981), and King (1977). These papers assume
that a corporation cannot in fact repurchase shares. Either it pays dividends or else it
reinvests the funds in new physical capital, resulting in capital gains to shareholders52 If
it pays dividends, it does so until it is indifferent between that and reinvesting another
dollar, implying that the capital gains, q, that result from reinvesting an extra dollar
satisfy (1 — gat)q = (1 — t). Here, the right—hand side represents the net—of—tax income
shareholders receive if an extra dollar is paid as dividends, while the left—hand side measures
the net—of—capital—gains—tax income that results from retaining and reinvesting an extra
dollar. If q is greater than (1 —i)/(1 — gat), even when all profits are reinvested, then no
dividends would be paid.
Under this theory, what effects should the TRA86 have on the dividend payout rate?
Since dividends equal corporate net—of—tax cash flow minus expenditures on new invest-
ment, dividends change due to a change in the investment rate, in tax payments, or in pre-
tax cash flow. But changes in investment incentives were relatively minor in the TRA86,53
The TRA8G increased tax payments of firms, at least in the first few years following the
tax reform. Any effects of the TRAS6 on pre-tax cash flow would be indirect, arising from
Poterba forecasts an immediate 8.1% increase in dividends after the TRA86, but his forecast holdseverything else constant. We calculated a one-period static forecast using actual values for corporateearnings and lagged values of earnings and dividends since these weren't in fact constant.
32 Use of debt finance is assumed to be constrained by exogenous factors.
For a discussion of the implications of the TItA86 for investment incentives, see Auerhach (1989).Investment in fact increased, implying a larger forecasted fall in dividends under this view.
22

general equilibrium effects. In in fact pre-tax cash flow and investment were little affected
by the TR.A86, then this theory forecasts that corporate dividends should fall by the same
amount that corporate tax payments went up.54
C. Dividends vs. purchase of shares in other firms
Rather than repurchasing its own shares, a firm could instead purchase the shares of
other firms. Such portfolio investments, funded by foregone dividends, would have slightly
different tax consequences than repurchase of the firm's own shares. Both save taxes that
would have been paid on the foregone dividends,55 and both lead to personal capital gains
taxes on the sale of shares to the firm. However, the firm will owe some taxes on any
dividend income it receives on the shares it purchases,56 and would owe capital gains taxes
if it sells any of these shares. In addition, the firm can be subject to an accumulated
earnings tax if it receives earnings from financial assets beyond the reasonable needs of the
business.
These various corporate taxes can be avoided, however, if the firm acquires at least
80% of the stock of any given company. Doing so, though, can lead to yet different tax
implicatiois than simply repurchasing one's own shares, as summarized in Auerbach and
Reishus (1988). To begin with, if either firm had unused tax losses, then these losses can
be used to offset the taxable profits of the other firm. This potential gain from a merger
should become less important as a result of the TRA86 since tax losses will become less
common, and also since the act itself restricted the ability of the merged firm to make use
of tax losses built up by one of the separate firms.
In addition, the acquiring firm can step—up the basis of any assets it purchases, though
in exchange the shareholders of the selling firm would owe capital gains taxes on the
Note the parallel between this argument and that resulting from the Myers and MajIuf (1984) modelof debt policy. Myers and Majluf took dividend payments as exogenous and tied debt finance to corporatecash flow, whereas this modal of dividend policy takes debt finance as exogenous and ties dividend paymentsto corporate cash flow. There has not yet been an explicit marriage of these two theories.
If these share purchases had instead been funded by debt issues, then both would lead to the sameincrease in interest deductions.
56 Under the previous law, 15% of dividend receipts were included in taxable income. This fraction wasincreased to 20% by the TRA86.
23

increase in basis. Letting AB represent the step—up in basis, z represent the present
value of depreciation deductions per dollar of initial cost of an asset,57 and c represent the
effective capital gains tax rate on the sale, then the overall tax savings equals AB(rz—
which is positive as long as rz > c.58 The TRA86 included several changes which together
should have eliminated any tax savings from such a step—up in basis. First, tax lifetimes
for depreciation purposes were generally lengthened, the discount rate used in calculating
z was increased as a result of the drop in tax rates, and r was cut, all reducing rz. Prior
to the TRA86, capital gains taxes were generally paid just under the individual income
tax, based on the General Utilities doctrine, and at a maximum tax rate of 20%. if an
installment sale were used, the capital gains tax payments could be postponed, reducing
the effective tax rate yet further. Under the TRA86, personal capital gains tax rates on
long term gains generally increased, though they were cut on short term gains. In addition,
the General Utilities doctrine was repealed, so that capital gains will be taxed at both the
corporate and personal levels if a firm liquidated some or all of its assets as part of the
takeover. Also, installment sales are usually disallowed under the Act. In combination,
these increases in capital gains tax rates should be sufficient to guarantee that rr < c,
implying a tax loss from a step-up in basis.59
These tax changes should a11 make mergers less attractive. How large an effect would
be expected? Auerbach and Reishus (1988) found that tax incentives were not capable
of explaining the pattern of mergers that occurred prior to 1986, and forecast that little
change in merger behavior should be expected.
D Evidence on dividend payout and merger rates
We now examine how the pattern of payouts from corporations to equity investors has
changed since the TRA86. Corporate after-tax profits and dividend payments for 1984—
We assume implicitly here that assets are depreciated using some form of declining balance formula,but without a switch to straight-line depreciation.
58 If rz Cc, then the firms can engage in a nontaxable merger, to avoid the rssulting tax increase.
See the appendix in Scholes and Wolfson (1988) for a more complete discussion of the effects of theTRA86 on merger incentives.
24

1989 (first quarter) are given in Table 6. The table also presents our forecasts of the effect
of the TRA86 on dividend payments, based on Poterba's (1987) econometric estimates.6°
The first thing to note is that dividends have dramatically increased as a fraction of
after-tax profits.6' This is consistent with the traditional view that there is some non-tax
benefit to paying dividends so that dividends will increase when the tax cost falls. The
increase contradicts the "new view" discussed in section 2.B.62 In fact, the forecasts based
on Poterba's estimates are quite reasonable. The payout ratio was forecast to increase 12%
in 1987, and another 3% in 1988 (from .59 to .71 and .76, respectively); the actual ratio
increased 11% points in 1987 and 3% in 1988.
The theory forecasts, however, that dividends will increase relative to share repurchases.
At the bottom of Table 6, we report the net amount spent on share repurchases during the
same time period,63 the total payouts to equity holders (dividends plus share repurchases),
and the fraction of total payouts to equity holders that took the form of dividends. Total
payouts to equity holders increased dramatically in 1988 and again in the first quarter
of 1989. While dividends increased slightly as a fraction of total payouts in 1987, they
fell sharply relative to total payouts in 1988 and even more so in 1989 — in spite of the
increase in nominal dividend payments, share repurchases increased much more quickly.
How is this sharp increase in share repurchases to be explained? The traditional theory
unambiguously forecasts that dividends should have increased relative to repurchases of
both a firm's own shares and purchases of shares in other firms. The forecasts based on
the Auerbach—Bra.d.ford—King model are also sharply inconsistent with the evidence, since
their models would forecast a drop in payouts, in contrast to the observed increase; they
also assume that repurchases are not possible. Perhaps firms have only recently learned
We report data for the nonfinancial corporate sector, on a national income basis. Poterba (1987)estimated his dividend regressions on a gross domestic product basis.
61 Dividends are generally much more stable than after-tax profits, implying that the payout rate riseswhen after-tax profits fall as they did after 1986. We did not attempt to estimate to what degree theincreased payout rate was larger than would be expected given this fall in after-tax profits.
62 Poterba (1987) also rejects the "new view" for the pre-TRA86 period.
63 These data, from the Flow of Funds Accounts, do not distinguish between purchases of a firm's ownshares and purchases of shares of other firms.
25

about the advantages of repurchases (see, e.g., Shoven (1987)), or only ;ecently realized
that the I.R.S. will not reclassify these capital gains as dividends. If firms have been so
unsophisticated about the tax law, this would undermine much of the research on corporate
taxation. Dividend behavior continues to be a puzzle to tax economists.
We did not expect the TRA86 to have major effects on merger activity, since tax
effects appeared to be small in the past. However, in a recent paper Scholes and Wolfson
(1988) claim to find significant changes in merger activity following the Act. In Table 7 we
reproduce some of the data they present on acquisitions of U.S. firms by U.S. firms (we have
extended their series from 1987-4 to 1989-1). The numbers are striking, and challenge the
forecasts. The constant dollar volume of acquisitions jumped dramatically in the fourth
quarter of 1986, after the TRA86 passed but before its relevant provisions took effect.
The one-quarter jump is not that surprising: firms that were already planning mergers
may simply have rushed to beat the General Utilities deadline and thus save substantial
amounts on capital gains taxes, However, there seems to have been a persistent reduction
in the level of U.S. acquisitions following 1986. The mean rate of acquisitions is $34 billion
per quarter, w. $40 billion per quarter during the prior year. It is hard to believe that the
lowered rate of activity as late as 1989—i is still due to the rush to beat General Utilities
two years earlier. On the other hand, the rate began increasing again towards the end of
this period, and the difference in means is not statistically siguiflcant.64
3. EFFECTS ON THE CHOICE OF ORGANIZATIONAL FORM
A. Theoretical considerations
Following the assumptions made by Harberger (1962), much of the literature on the
incentive effects of the corporate income tax has assumed that production is done by
corporations in certain industries and by unincorporated firms in others. In fact, firms can
choose among several different organizational forms for tax and legal purposes. Gravelle
64 Scholes and Wolfson (1988) also show changes in the types of domestic acquirers. Notably, managementunit buyouts and going-private transactions incressed, which they argue happened because these transac-tions are likely to rely more on nontax factors, and thus do not suffer as much from the TRA86. Theyalso show striking effects for acquisitions of U.S. firms by foreign companies, with a large and sustainedincrease beginning in fourth quarter 1986.
26

and KotLikoff (1988, 1989) emphasize that many industries contain a sizeable number of
both corporate and noncorporate firms, and that these proportions shift over time. Interest
in a firm's choice of organizational form is starting to receive more attention.65
What affects a firm's choice of organizational form? Taxes clearly are one consideration.
If a firm is an ordinary (C) corporation, its income is taxed first at corporate rates with the
remainder taxed again at personal rates when received as dividends or when capital gains
are realized. Losses can be carried backwards or forwards across time to offset taxable
profits in other years but cannot directly result in tax refunds. In contrast the income
of a partnership, sole proprietorship, or subchapter S corporation is taxed each year at
the personal income tax rate of each owner. Losses can be used to offset taxes on other
personal income.66
Whether a firm would pay less in taxes as a corporation or a.s a parknrship/proprietor
ship depends on its circumstances. If the corporate income tax rate were below the personai
income tax rate of the owners, if the personal taxes paid on corporate after-a.x income
were low enough (e.g. if little is paid in dividends and sharo r not sold';, x. d if the firm
has taxable profits, then the firm would pay less in taxes by nccrporating.67 Sici1arly. if
the firm has losses which can be deducted against corporate prc'fs of other a.liated flrms
and the corporate tax rate is higher than personal tax rates, then the corporate 1mm of
ownership incurs lower tax liability. In other cases, the firm would pay less in taxee by
remaining unincorporated (or operating as an S corporation).
Another tax consideration potentially enters when some of the income of the firm is
taxable as capital gains, e.g. sales of property by a real estate firm. The relative tax
rate on capital gains has been different under the corporate income tax than under the
personal income tax. In general, capital gains have been more favorably treated under
the personal income tax, making the corporate form less attractive if the firm receives
a nonnegligible fraction of its income in the form of capital gains. However, suppose a
For other references, see Scholes and Wolf.aon (1987) and Gravelle (1988).
66 The TRA.86 introduced restrictions on the use of some losses to offset other sources of income; wediscuss these restrictions below.
67See, for example, Feldstein and Slemrod (1980) for further discussion.
27
corporation separately incorporated an asset about to be sold and then made a liquidating
payment of the sales proceeds to the shareholders. Prior to the TRAS6 the General Utilities
doctrine allowed the resulting capital gains to be taxed only at the personal level, implying
no difference in the effective tax treatment of capital gains from such sales under corporate
vs. partnership forms of organization.
Taxes are obviously not the only consideration affecting a firm's choice of organizational
form. We focus on the choice between ordinary (C) corporations and S corporations. To
begin with, there are some eligibility requirements for S corporations: no more than 35
shareholders, not part of an affiliated group, only individual (not corporate) shareholders,68
only one class of stock, and not a domestic international sales corporation (DISC). In
addition, some states tax S corporations under their state corporate tax, rather than
under the personal tax, requiring these companies to maintain two sets of tax accounts,
one for state and one for Federal taxes. Except for these considerations, however, C and S
corporations are treated the same, e.g. both have limited liability. There are presumed to
be many important non-tax distinctions between corporations and partnerships, however.
For example, corporations have limited liability, they can trade ownership shares more
easily, they can base compensation of managers on the price of a publicly-traded ownership
share, and so on.69 There has been little careful economic analysis, however, of the nontax
factors that are likely to be important.
The TRA86 had conflicting effects on a firm's choice between C and S status. We discuss
first the new advantages of an S election. To begin with, in most cases the personal tax
rate was cut by more than the corporate tax rate, increasing the attraction of receiving
income as an S rather than as a C corporation.7° Perhaps more importantly, the General
Utilities doctrine was repealed for corporations. Thus, the capital gains on a sale of assets
68 Some estates and trusts csn be shareholders.
69 If a firm is organized as a limited partnership, all investors except the general partner can have limitedliability. Further, the general psrtner can be a corporation, giving it limited liability. Also, ownershipshares in some partnerships have been publicly traded; however, the 1987 tax law requires that most newpublicly-traded partnerships be taxed as corporations.
70 The first $50,000 of corporate income is still taxed at less than the 28% and 33% marginal personalrates. However, that income will be subject to double taxation so the desirability of C status still dependson the degree of tax deferral through retaining earnings in the corporation.
28
in corporate form will now be taxed first at the full corporate rate, and then again at the
full personal rate. Since no corporate tax applies to an S corporation, capital gains are
taxed only at the personal rate of the shareholders. Any firm that earns substantial income
from capital gains, or that is liquidated or purchased in a taxable takeover, will reap large
tax savings from choosing S status.71
In addition, S corporations are not subject to the new alternative minimum tax (AMT)
faced by C corporations. This factor will be especially important for firms with suhstartiai
tax deferrals and accounting practices that lead to large book income relative to taxable
income, because the AMT includes 50% of that difference in the alternative tax base.
Second, income from a C corporation cannot be used to offset "passive" losses, whereas
income (to nonmanagers) from an S corporation can be.72
These gains were emphasized by Scholes and Wolfson (1988) and Plesko i988), who
predicted as a result that S corporations would become a much more important lorm
alter the TRA86. The TRA86 also introduced some offsein.g costs to t choice of
S corporation status, however. For instance, most fringe benefits that are deducdhle
from C corporation income will be deductible for S corporations oniy to the extent that
these deductions are allowed under the personal income tax. The higher floors set on
many personal deductions mean that some expenses will generate lower tax savings in
S corporation form. In particular, health and accident benefit insurance can be fully
deducted by a C corporation, but only medical expenses in excess of 7.5% of adjusted
gross income are deductible from the personal tax base. In addition, the new passive
loss restrictions can work against some S corporations: if the firm earns losses then passive
shareholders cannot use those losses to offset ordinary personal income. Although the same
71Changing to a partnership may not be as favorable because disincorporation is a taxable event subject
to the capital gains tax. However, the partnership form may be more desirable after the repeal of GeneraJUtilities for new firms just starting up.
72 In some cases, an identical result can be achieved by having the C corporation purchase the activitygenerating the passive loss. These losses then offset the income of the C corporation, and the same amountof corporate tax is avoided. However, transactions coats may be lower if individuals own some partnershipand some S corporation shares, tailoring their portfolio to individual needs, rather than arranging ownershipof C corporations so that the shareholders collectively benefit from the merger of corporate gains andpassive losses.
29
loss carryback and carryforward provisions are available for C and passive S corporations,
this is an unfavorable change for passive S shareholders from the pre-TRA86 rules.
One significant provision may make a switch from C to S status less appealing than the
choice of S status for a new firm. With the repeal of the General Utilities doctrine, Congress
expected that many C corporations would retain their status but then strategically switch
to S status just before a major asset sale or liquidation in order to avoid the corporate
capital gains tax. Section 1374 was enacted to remove this incentive. Under Section 1374,
firms that convert to S status must pay tax at the top corporate rate on any "built-in gains"
realized during the 10 years following conversion. Built-in gains are defined to include any
difference between the fair market value of the firm at conversion and the C corporation
tax basis at that time. Thus, a firm that switches to S status and liquidates the next day
will pay the full corporate tax on the entire capital gain. In principle, this provision should
not make the incentives for choosing S status different for existing and new firms, since
in both cases the favorable capital gains treatment for an S corporation applies equally to
all gains incurred after the date of S election. However, the added transactions costs of
bookkeeping and negotiating with the I.R.S. about the amount of the built-in gains from
a conversion may be sufficient to reduce the desirability of converting from C to S status.
B. Empirical evidence
How large an effect would these changes in tax incentives likely have on firms' choices
of organizational form? Unfortunately, the quantitative importance of tax incentives rel-
ative to the various nontax considerations has not yet been explored.73 However, on the
assumption that the TRA86 provided the only change in the incentives for choosing a
particular form since 1985, we can attempt to forecast the direction of the effects, and
compare the forecasts to the data.
We showed above that the TRAS6 changed both the benefits and costs of electing non-
corporate tax status. Although there are no careful measurements of the relative value
of the different provisions to firms, it seems plausible to think that for a typical firm the
See Plesko (1988) for an exception. We are currenbly attempting such empirical work.
30

choice of S status looks more favorable than it did before 1986. The main benefits are
the lower tax rates available at the personal level, and the single-taxation of new capital
gains; the main costs appear to be the reduced deductibility of some noncash forms of
compensation and increased transaction costs arising from the taxation of built—in gains
when a company shifts from C to S status. If this judgement is correct, then there should
be a shift of economic activity towards the noncorporate sector. Of course, any givers
firm would be more likely to shift to S status if it can satisfy the eligibility requirements
described above without substantial changes.
In Figure 1 we present data from the NIPA accounts on profits plus interest in various
corporate and noncorporate sectors of the economy since 1980. Except for the bad year
for corporations in 1982, the level of capital income is almost the same in the ccrporate
and noncorporate sectors. These magnitudes suggest that more attention to noricorporate
business taxation and organizational choice incentives may well be warranted. However,
the TRA86 had no apparent impact on the relative levels of activity Capital income has
been relatively stable since 1986, with no trend in either series.4
Unfortunately the tax incentives which are our primary interest make it unlikely that
measures of net income can be very informative. Given differences in corporate and per-
sonal tax rates, and the varying treatment of capital gains, the choice of organizational
form will depend in part on whether the firm is earning profits or losses. (For example, the
aggregate taxable income of partnerships has been negative since 1981.) The same firm
may be organized in different forms at different times precisely because of its time path of
gains and losses. For example, S corporations were often recommended as an initial status
for new firms that expected losses (while depreciation on initial investment was high and
revenues low) because the losses could immediately offset personal income, but a change
to C status would follow as the need for broader ownership increased. Thus, annual net
income may be a poor measure of the amount of economic activity undertaken in various
organizational forms.
NIPA measures of capital income since 1986 are still preliminary because they do not yet reflect actualcorporate tax collections. The July 1990 revisions will be the first to incorproate actual 1986 corporatetax data. Thus, we cannot he confident about the apparent lack of change in the series after 1986.
3'

Information about the assets of firms choosing each form of organization would be
much more informative. For example, in 1985 partnerships had 1/10as much in assets
as corporations, but corporations had taxable income of $266 billion while partnerships
reported income of —$17 billion. Unfortunately this information is not yet available for
the period after the TR.A86.
Another piece of evidence about post-TRAS6 activity is available. Firms electing to
be taxed as an S corporation must file Form 2553 with the I.R.S. We present semi-annual
data on these filings for recent years in Figure 2. Two points are striking. First, there
was a massive surge in S elections immediately following the TRA86: about 375,000 filings
during the first six months of 1987, compared to an average six-month rate of about 150,000
during 1983—1986. Second, no trend was apparent before 1987, but the filing rate has been
higher during every period after the reform than during any prior period. Thus, we see
evidence both that a large number of existing firms elected to convert from C to S status
(the initial surge) and that many more firms are continuing to choose S status (presumably
both further conversions and a higher rate of new S incorporation).
Unfortunately, just looking at the number of firms does not indicate the amount of
economic activity. For example, many of the new S corporations may be very small, with
most assets remaining under C status despite the increased number of S corporations.
One bit of evidence from tax returns is available at this time. The net income from
partnerships and S corporations reported on individual tax returns is presented in Table
8. From 1981 to 1986 this reported income averaged —$2.2 billion. In a remarkable
turnaround, $32 billion in positive (net) income was reported in 1987. Although we cannot
tell the extent to which assets and activities moved among different forms, it appears that
the nature of activity changed dramatically. Much of the difference could be due to passive
losses borne by individuals who did not have offsetting passive gains. However, the total
profits for the subset of partnerships with positive income were only $32 billion in 1985.
Thus, to explain the 1987 reported profits in Table 8, either almost all passive losses
were not deductible, or more likely a substantial amount of loss activity was shifted into
corporate form, where it could be deducted at a higher tax rate, while gains were left to
be taxed at the lower personal rates.
32

4. CONCLUSIONS
How successful were the traditional models of corporate financial policy in forecasting the
response of corporations to the Tax Reform Act of 1986? Results are mixed at best.
To begin with, traditional models implied that the tax incentive to use debt V3. equity
increased substantially as a result of the tax reform. Given the available empirical evidence
on the responsiveness of debt/value ratios to tax incentives, this led us to forecast that
debt/value ratios would increase by .155, in contrast to an observed increase of only .041.
While the actual change was in the forecasted direction, its magnitude was far smaller
than forecast.
We discussed some possible explanations for the lower-than-expected changes in deht/
value ratios, but available data and models are inadequate to test their plausibility. Of
particular interest is the possibility that the effective tax on retained earnings has beei
underestimated in the past because of naive assumptions about optimal trading strategies.
Recent developments in trading theory suggest that a lower rantai gains tax rate encour-
ages higher share turnover and thus a higher tax on retentions, giving firms an incentive to
rely more heavily on debt. If so, then TRA86 may have reduced the penalty on retained
earnings by equalizing the taxation of capital gains and ordinary income.
In addition, some aspects of the Tax Reform Act raised interesting new issues for future
research. One possibly important effect is the change in the relative desirability of overseas
borrowing for multinational corporations. The "one-taxpayer" interest allocation rules will
allow many firms to reduce their foreign tax liability (without affecting U.S. tax liability)
by borrowing through their foreign branch operations rather than domestically.
We also examined the implications of the tax reform for the form of corporate payouts.
Dividend payments were discouraged by the tax law far more before the reform than after,
leading most traditional theories to forecast an increase in the fraction of payouts taking the
form of dividends. While dividends did in fact increase, and by an amount quite consistent
with the forecasts in Poterba (1987), repurchases of shares increased at a much faster rate
implying a sharp drop irs the fraction of payouts taking the form of dividends. We had
no convincing explanation. The Auerbach—Bradford--King model of dividend policy would
have forecast a fall in dividend payments, which was also inconsistent with the evidence.
33

What about a firm's choice of organizational form? Our assessment was that the
existing theory was not capable of forecasting how the changes in the tax law would affect
the attractiveness of the corporate relative to various noncorporate forms of organization.
The data show that a large number of firms elected S corporation status, but we do not yet
know how much economic activity these firms represent. The first piece of available tax
evidence suggests that loss operations have shifted towards the more highly-taxed corporate
sector, while gain operations are being taxed at the lower personal rates. Further analysis
awaits the release of post-TRAS6 tax data by the I.R.S.
One of the main problems in developing and testing models of the effects of taxes on
corporate financial policy prior to the Tax Reform Act had been the lack of variation
in tax policy since World War II. Given the sharp changes in incentives created by this
Act, economists will now be in a much better position to refine their understanding of the
determinants of corporate financial policies. Our results show that they need to.
34

REFERENCES
Altman, E. I. (1968) "Financial Ratios, Discriminant Analysis, and the Prediction of Cor-
porate Bankruptcy," Journal of Finance, 23, 589—609.
Altshuler, R. and A. J. Auerbach (1990) "The Significance of Tax Law Asymmetries: An
Empirical Investigation," Forthcoming, Quarterly Journal of Economics.
Ang, J. S. and D. R. Peterson (1986) "Optimal Debt Versus Debt Capacity: A DisequiUb
Hum Model of Corporate Debt Behavior," in Research in Finance, vol. 6, ed. Chen,
A. W.. Greenwich, CT: JAI Press.
Auerbach, A. J. (1979) "Wealth Maximization and the Cost of CapitaL" Quarterly Journal
of Economics, 93, 433—46.
Auerbach, A. J. (1985) "Real Determinants of Corporate Leverage," in Corporate Capital
StrnctlLres in the United States, ed. Friedman, B. M.. ChIzo: University of Chicago
Press.
Auerbach, A. J. and D. Reishus (1988) "The Effects of Taxation on the Merger Decision,"
in Corporate Takeovers, ed. Auerbach, A.. Chicago: Chicago University Press.
Barclay, M. and C. W. Smith, Jr. (1987) "Corporate Payout Policy: Cash Dividends versus
Share Repu.rchases," Working Paper, William E. Simon Graduate School of Business.
Bernheim, B. D. (1988) "Dividends versus Share Repurchases as Signals of Profitability,"
Working Paper, Stanford University.
Bhattacharya, S. (1979) "Imperfect Information, Dividend Policy, and the "Bird in the
Hand" Fallacy," Bell Journal of Economics, 10, 225—235.
Bradford, D. F. (1981) "The Incidence and Allocation Effects of a Tax on Corporate
Distributions," Journal of Public Economics, 15, 1—22.
Bradley, M., G. A. Jarrell, and E. H. Kim (1984) "On the Existence of an Optimal Capital
Structure: Theory and Evidence," Journal of Finance, 39, 857—878.
3,5

Bulow, 3. and 3. Shoven (1978) "The Bankruptcy Decision," Bell Journal of Economics,
9, 437—56.
Constantinides, G. M. (1984) "Optimal Stock Trading with Personal Taxes," Journal of
Financial Economics, 13, 65—89.
DeAngelo, H. and R. W. Masulis (1980) "Optimal Capital Structure Under Corporate and
Personal Taxation," Journal of Financial Economics, 8, 3—29.
Feldstein, M. S. (1989) "Excess Debt and Unbalanced Investment: The Case for a Cashulow
Business Tax," Testimony before the Committee on Ways and Means, U.S. Congress,
January 31.
Feldstein, M. S. and 3. Slemrod (1980) "Personal Taxation, Portfolio Choice, and the Effect
of the Corporation Income Tax," Journal of Political Economy, 88, 854—866.
Feldstein, M. S., L. Dicks-Mireaux, and 3. Poterba (1983) "The Effective Tax Rate and
the Pretax Rate of Return." Journal of Public Economics, 21, 129—58.
Givoly, D., C. Hayn, A. R. Ofer, and 0. Sang (1989) "Taxes and Capital Structure: Evi-
dence from Firms' Response to the Tax Reform Acto of 1986," Northwestern University
Graduate School of Business Working Paper.
Gordon, R. H. (1982) "Interest Rates, Inflation, and Corporate Financial Policy," Brooking
Papers on Economic Activity, 2, 461—88.
Gordon, R. H. (1989) "Do Publicly Traded Corporations Act in the Public Interest?,"
Working Paper, University. of Michigan.
Gordon, R. H. and D. F. Bradford (1980) "Taxation and the Stock Market Valuation of
Capital Gains and Dividends," Journal of Public Economics, 14, 109—136.
Gordon, R. H. and B. G. Malkiel (1981) "Corporation Finance," in How Taxes Affect
Economic Behavior, ed. H. 3. Aaron and 3. A. Pechman. Washington, D.C.: Brookings
Institution.
Gravelle, 3. G. (1988) "Corporate Taxation and the Efficiency Gains of the 1986 Tax
Reform Act—A New Look," Working Paper, Congressional Research Service.
36

Gravelle, J. G. and L. J. Kotlikoff (1988) "Does the Harberger Model Greatly Understate
the Excess Burden of the Corporate Income Tax?," NBER Working Paper No. 2742.
Gravelle, J. G. and L. J. Kotlikoff (1989) "The Incidence and Efficiency Costs of Corporate
Taxation When Corporate and Noncorporate Firms Produce the Same Goods," Journal
of Political Economy, 97, 749—81.
Harberger, A. C. (1962) "The Incidence of the Corporation Income Tax," Journal f Fo
litical Economy, 70, 215—240.
Jensen, M. C. and W. H. Meckling (1976) "Theory of the Firm: Managerial Behavior,
Agency Costs and Ownership Structure," Journal of Financial Economic.., 3, 305—60.
King, M. A. (1977) Public Policy and the Corporation. London: Chapman and Hall.
King, M. A. and 3. I. Leape (1984') "Wealth and Portfolio Composition: Theory and
Evidence," NBER Working Paper No. 1468.
Long, M. S. and I. B. Malitz (1985) "Investment Patterns and Financial Leverage," in
Corporate Capital Siructurej in the United States, ed. Friedman, B. M.. Chicago:
University of Chicago Press.
MacKie-Mason, 3. K. (1990) "Do Taxes Affect Corporate Financing Decisions?." Forth-
corning in Journal of Finance.
MacKie-Mason, J. K. (1989) "Do Firms Care Who Provides Their Financing?," in Invest-
ment, Information and Credit Markets, ed. R. G. Hubbard, forthcoming. Chicago:
Chicago University Press.
Manchester, J. and J. Poterba (1989) "Second Mortgages and Household Saving," Regional
Science and Urban Economics, 19, 325—346.
Miller, M. and K. Rock (1985) "Dividend Policy Under Asymmetric Information," Journal
of Finance, 40, 1031—1051.
Miller, M. H. (1977) "Debt and Taxes," Journal of Finance, 32, 261—275.
37

Miller, M. H. and F. Modigliani (1961) "Dividend Policy, Growth and the Valuation of
Shares," Journal of Business, 34, 411—33.
Modigliani, F. and M. H. Miller (1958) "The Cost of Capital, Corporation Finance, and
the Theory of Investment," American Economic Review, 48, 261—97.
Myers, S. C. (1977) "Determinants of Corporate Borrowing," Journal of Financial Eco-
nomics, 5, 147—175.
Myers, S. C. and N. S. Majiuf (1984) "Corporate Financing and Investment Decisions When
Firms have Information that Investors Do Not Have," Journal of Financial Economics,
13, 187—221.
Plesko, G. A. (1988) "Choice of Corporate Entity: The Use of S Corporations Before
and After the Tax Reform Act of 1986," Working Paper, Office of Tax Analysis, U.S.
Department of Treasury.
Poterba, J. (1987) "Tax Policy and Corporate Savings," Brooking Papers on Economic
Activity, 2, 455—503.
Poterba, 3. and L. Summers (1985) "The Economic Effects of Dividend Taxation," in
Recent Advances in Corporate Finance, ed. E. I. Altman and M. G. Subrahmanyam.
Homewood, IL: R. D. Irwin.
Poterba, 3. M. (1989) "Tax Reform and the Market for Tax-Exempt Debt," NBER Working
Paper No. 2900.
Scholes, M. S. and M. A. Wolfson (1987) "Taxes and Organization Theory," Working
Paper, Stanford Graduate School of Business.
Scholes, M. S. and M. A. Wolfson (1988) "The Effects of Changes in Tax Laws on Corporate
Reorganization Activity," Working Paper, Stanford Graduate School of Business.
Shoven, John B. (1987) "The Tax Consequences of Share Repurchases and Other Non-Divi-
dend Cash Payments to Equity Owners," in Tar Policy and the Economy, ed. L. H.
Summers. Cambridge: MIT Press.
38

Stiglitz, J. E. (1983) "Some Aspects of the Taxation of Capital Gains," Journal of Public
Economics, 21, 257—294.
Stiglitz, J. E. and A. Weiss (1981) "Credit Rationing in Markets with Imperfect Informa-
tion," American Economic Revsew, 71, 393—410.
Warner, J. B. (1977) "Bankruptcy Costs: Some Evidence," JolLmnal of Finance, 32,
337—347.
White, M. J. (1980) "Public Policy Toward Bankruptcy: Me-First and Other Priority
Rules," Bell Journal of Economics, 11, 550—64.
White, M. J. (1989) "The Corporate Bankruptcy Decision," Journal of Economic Perspec-
iives, 3, 129—151.
39

Table 1
Tax Advantage to Debt Finance
Tax rate on equity: T + (1— T)eTax rate on debt: I
T effective marginal corporate tax rate on interest deductionse effective marginal personal tax rate on equity income
= di + (1 — d)gaitax rate of marginal investor in debt
d dividend payout ratio
g fraction of long-term capital gains that are taxablea present-value factor for capital galna deferral
Parameter 1986 1987 1988
T 0.318 0.340 0.289e 0.122 0.149 0.127
1 0.202 0.190 0.155
d 0.560 0.711 0.758
g 0.400 1.000 1.000
a 0.250 0.250 0.250
Equity Tax 0.401 0.438 0.379
Debt Tax 0.202 0.190 0.155
Difference 0.199 0.248 0.224
Source Noies:
T from Altahuler and Auerbach (1987) for 1986; 0.85* statutory rate for 1987—1988.
I from Poterba (1989).
d from NIPA for 1986 (average 1984—86). Forecasts based on Poterba (1989) for 1987—88.
a from Feldatein, Dicks-Mireaux and Poterba (1983).
Otber parameters calculated as described in text.
40

Table 2
Predicted Fraction of Debt Issues in Public Offerings
1986 1987 1988
Witb TR.A86 0.46 0.54 0.43
Without TRA86 0.41 0.52 0.37
Difference 0.05 0.02 0.06
Source: Based on model estimates in MacKie-Mason (1990). Predictions "with TR.A86" use observed valuesfor all explanatory variables. Predictions "without TRA86" replace actual ITC/ZPROB (investment taxcredits interacted with a tax exhaustion predictor; see text) with estimate of its value without the taxreform. See text and MacKie-Mason (1990) for details.
Noie: The estimates in MacKie-Mason (1990) were based on a sample of individual firms with a much higherdebt fraction in 1986 (72%) than the population mean (46%). The discrete choice estimation method usedsets the intercept to correctly predict the mean fraction of debt issues. To correct for the different mean inthe full population we subtracted an intercept dummy equal to —0.2 from the regression function.
41

Table 3
Flow of Borrowing aid Interest Deductions by Individuals
Flow of Total Borrowing
Year Nonfarm Mortgages Consumer Credit
(Billions of nominal dollars)
Interest Reported on Schedule A
Mortgages Consumer Credit
(Millions of nominal dollars)
1980 96.4 2.61981 73.8 16.9
1982 52.9 16.4
1983 120.4 49.0
1984 136.7 81.6
1985 157.0 82.5
1986 216.7 58.0
1987 233.9 32.9
1988 219.6 51.1
1989—1 187.0 34.9
122.2 71.7
134.5 65.3
138.5 62.3
- Source3: Borrowing flows: Board of Governors of the Federal Reserve System, Flow of Fund8 A ccounis, FirstQuarter 1989, June 2, 1989. Interest reported: Tabluation provided by Brian Erard, IRS, from IRS taxreform panel study sample.
Notes: 1989 data are at an annual rate for first quarter only. Nonmortgage interest reported is the interestdeducted on Schedule A grnssed up by the allowable fraction of total interest (100%, 65% and 40% in1986—88, respectively).
42

Table 4
Average Debt/Value Changes Since 1985
(996 Compustat firms; book debt and market equity)
1985 1986 1987 1988
Debt/Value
Changes since 1985
0.398 0.403 0.441 0.439
All firms
1985 ITC: low1985 ITC: higb
1985 ZPINV: low1985 ZPINV: higb
Foreign ops: yesForeign ops: no
0.005 0.043 0.041
0.000 0.036 0.030
0.010 0.050 0.052
0.011 0.068 0.069
-0.001 0.018 0.014
0.014 0.038 0.040
0.006 0.052 0.060
Source: 1988 Compustat Primary, Secondary and Tertiary tape. Sample size is 996 firms, except for "ForeignOps" for whicb only 778 firms had nonmissing data.
Notes:1. The debt/value ratio is calculated as (book debt) / (book debt + market value of equity), with the marketvalue of equity measured on 12/3 1, and with book debt equal to the sum of short-term and long-term debt.2. Firms split approximately at median value of ITC/(sfter-tax income), which was 0.0445; 491 firms in"low".3. ZPINV is 1/ZPROB, where ZPROB is Altman's (1966) predictor of firm bankruptcy. Firms split approx-imately at median value of ZPINV, which was 0.504; 495 firms in "low".
4. We determine whether a firm has foreign operations based on whether it reports any foreign income taxpayments on its Form 10K. 404 firms are classified as having foreign operations.
43

1980
1981
1982
1983
1984
1985
1986
19871988
826 515 0.381135 423 0.27
746 595 0.441765 589 0.251038 587 0.361175 1020 0.471846 1551 0.461676 1851 0.53
983 1885 0.66
12.7 40.0 0.76
14.2 3.47 0.71
13.4 42.3 0.76
29.8 43.6 0.59
8.8 56.1 0.86
18.4 81.7 0.82
34.2 168.6 0.83
37.6 181.7 0.7322.2 170.4 0.89
Source: U.S. Securities and Exchange Commission, SEC Monthly Saisical Review, vol. 48, Tables M-371and M-375, various issues.
Noes:1. "Stocks" are primary, public offerings of conventional common stock.
2. "Bonds" are primary, public offerings of non-convertible bonds.3. December 1988 data used in calculating 1988 totals are preliminary.
44
Table 5
Stock and Bond Issues
Number of Issues Amount in $ billionsStocks Bonds Debt Fraction Stocks Bonds Debt Fraction

Table 6
Corporate Payouts to Equity
(Billions of dollars)
1984 1985 1986 1987 1988 1989—1 1984-86 AvgProfit after tax
DividendsForecast diva
147.9 154.2 152.8 137.2 142.4 123.4
81.0 84.0 89.9 95.5 103.3 109.697.5 108.0
151.6
85.0
Payout ratioForecast ratio
Net repurchasesTotal payouts
0.548 0.545 0.588 0.696 0.725 0.8880.711 0.758
74.5 81.5 80.8 76.5 130.5 180.0155.5 165.5 170.7 172.0 233.8 289.6
0.560
78.9
163.9
Diva/payouts 0.521 0.508 0.527 0.555 0.442 0.378 0.518
Source: Board of Governors of the Federal Reserve, Flow of Funds Accosnta, Firsi Quaiier 1989, June 2,1989.
Nojes:
1. 1989 data are at an annual rate for first quarter only.2. Payout ratio is defined as (Net diva) / (After-tax profit + CCA + WA). This Is the dividend payout ofbook income, not payout of cash flow (which includes depreciation).
3. Dividend forecast is based on Poterba (1987), Table 5. The forecast used actual values for all explanatoryvariables, converted to 1982 dollars. The results were then reinfiated to nominal dollars.4. E.epurchasea are net of new equity Issues.
45

Table 7
Domestic Merger and Acquisition Activity
(Billions of
Quarter U
1987-4
S acquis. of US firms
1985-4 48.60
1986-1 31.65
1986-2 46.22
1986-3 35.33
Avg. 40.45
1986-4 67.44
1987-1 22.02
1987-2 31.65
1987-3 32.98
1987-4 33.96
1988-1 27.71
1988-2 42.18
1988-3 28.86
1988-4 57.74
1989-1
Avg.
28.62
33.97
Sources: Nominal merger values from Mergers and Acquisizons, various issues. CPI-Urban from US. De-
partment of Commerce, Bureau ofEconomic Analysis, Survej of Ctirren Business, various issues. This
table reproduces and extends part of Table 1 in Scholes and Woifson (1988).
46

Table 8
Income from Partnerships and S Corporations Reported onIndividual Income Tax Returns
(Billions of nominal dollars)
Year Net Reported Income
1980 10.1
1981 -0.9
1982 -1.7
1983 -0.5
1984 -2.2
1985 -2.2
1986 -5.9
1987 32.1
Source: U.S. Internal Revenue Service, Saiisics of Income Bs1lein, various issues.
47
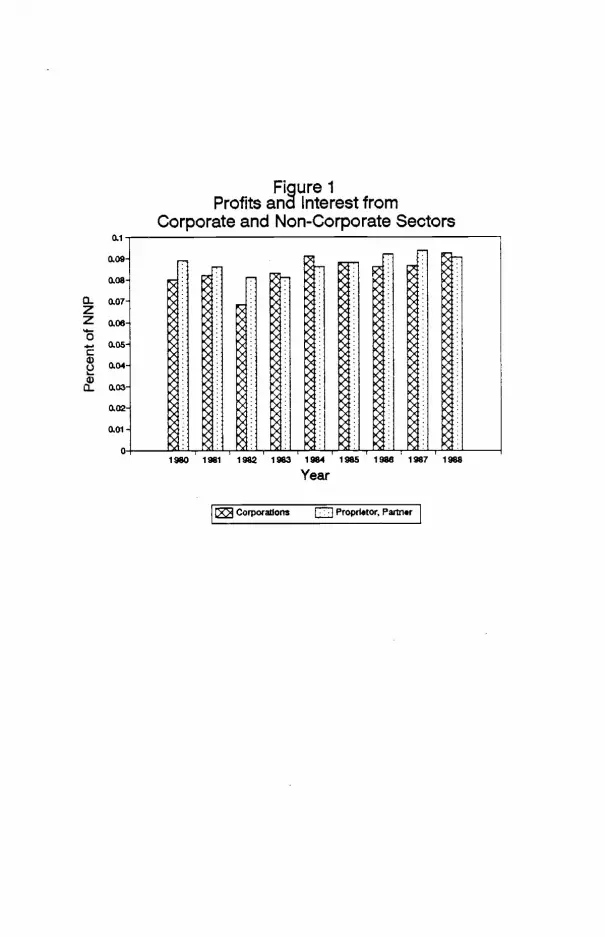
0zz0
0a-
Figure 1Profits and Interest from
Corporate and Non-Corporate Sectors
Corporallons Propdetor. Paim.r
Year

0C)C
C0CCl,
0I—
Figure 2S Corporation Elections (Form 2553)
1983-1988
83:1 83:2 84:1 84:2 8,5:1 85:2 88.1 88:2 87:1 87:2 82:1 88:2
Year: halfSourc.: Plasko (1988)