Embed Size (px)
Citation preview
International Studies ProgramInternational Studies ProgramWorking Paper 08-12December 2008
Pakistan: ComprehensivePakistan: Comprehensive Individual Income Tax Reform: Round 2
Sally WallaceSally WallaceHarini Kannan

International Studies Program Andrew Young School of Policy Studies Georgia State University Atlanta, Georgia 30303 United States of America Phone: (404) 651-1144 Fax: (404) 651-4449 Email: [email protected] Internet: http://isp-aysps.gsu.edu Copyright 2006, the Andrew Young School of Policy Studies, Georgia State University. No part of the material protected by this copyright notice may be reproduced or utilized in any form or by any means without prior written permission from the copyright owner.
International Studies Program Working Paper 08-12
Pakistan: Comprehensive Individual Income Tax Reform: Round 2 Sally Wallace Harini Kannan December 2008
International Studies Program Andrew Young School of Policy Studies The Andrew Young School of Policy Studies was established at Georgia State University with the objective of promoting excellence in the design, implementation, and evaluation of public policy. In addition to two academic departments (economics and public administration), the Andrew Young School houses seven leading research centers and policy programs, including the International Studies Program. The mission of the International Studies Program is to provide academic and professional training, applied research, and technical assistance in support of sound public policy and sustainable economic growth in developing and transitional economies. The International Studies Program at the Andrew Young School of Policy Studies is recognized worldwide for its efforts in support of economic and public policy reforms through technical assistance and training around the world. This reputation has been built serving a diverse client base, including the World Bank, the U.S. Agency for International Development (USAID), the United Nations Development Programme (UNDP), finance ministries, government organizations, legislative bodies and private sector institutions. The success of the International Studies Program reflects the breadth and depth of the in-house technical expertise that the International Studies Program can draw upon. The Andrew Young School's faculty are leading experts in economics and public policy and have authored books, published in major academic and technical journals, and have extensive experience in designing and implementing technical assistance and training programs. Andrew Young School faculty have been active in policy reform in over 40countries around the world. Our technical assistance strategy is not to merely provide technical prescriptions for policy reform, but to engage in a collaborative effort with the host government and donor agency to identify and analyze the issues at hand, arrive at policy solutions and implement reforms. The International Studies Program specializes in four broad policy areas: Fiscal policy, including tax reforms, public expenditure reviews, tax administration reform Fiscal decentralization, including fiscal decentralization reforms, design of intergovernmental
transfer systems, urban government finance Budgeting and fiscal management, including local government budgeting, performance-
based budgeting, capital budgeting, multi-year budgeting Economic analysis and revenue forecasting, including micro-simulation, time series
forecasting, For more information about our technical assistance activities and training programs, please visit our website at http://isp-aysps.gsu.edu or contact us by email at [email protected].
ACKNOWLEDGEMENTS These working papers are the reports that were a joint product of a team from the Federal Board of Revenue (FBR), Government of Pakistan, the Andrew Young School of Public Policy (AYSPS) at the Georgia State University, and the World Bank. The views, expressed in the reports, are of the authors and not of the Government of Pakistan. The FBR team was headed by Mr. Ahmad Waqar, Secretary Revenue Division and Chairman FBR, and Mr. M. Abdullah Yusuf, former Chairman FBR, and included Mr. Mumtaz Haider Rizvi, Member Fiscal Research and Statistics, Dr. Ather Maqsood Ahmed, former Member Fiscal Research and Statistics, Mrs. Robina Ather Ahmed, Chief Fiscal Research and Statistics, Mr. Umar Wahid, Secretary Fiscal Research and Statistics, Mr. Mir Ahmed Khan, Second Secretary Fiscal Research and Statistics, and Mr. Naeem Ahmed, Second Secretary Fiscal Research and Statistics. The final report was prepared by Kaspar Richter (World Bank), and Jorge Martinez-Vazquez (AYSPS). The background studies (listed below), were drafted by Robina Ather Ahmed, James Alm, Roy Bahl, Musharraf Cyan, Mir Ahmad Khan, Jorge Martinez-Vazquez, Geerten Michelse, Mark Rider, Wayne Thirsk, Umar Wahid and Sally Wallace. The tax revenue simulation results in the report are based on micro-simulation models developed by Mark Rider and Sally Wallace with Harini Kannan. The GST chapter draws extensively on a review of Pakistan’s sales tax by Rebecca Millar and Christophe Waerzeggers from June 2008. The final report also benefited from the Pakistan tax administration review by Carlos Silvani, Edmund Biber, William Crandall, Wyatt Grant, Orlando Reos and Geoff Seymour from September 2008. Peer reviewer comments from Kai-Alexander Kaiser, Senior Economist, World Bank; Michael Keen, Advisor, International Monetary Fund; Dr. Ahmad Khan, former Member FBR; Russell Krelove, Senior Economist, International Monetary Fund, and Eduardo Ley, Lead Economist, World Bank greatly enhanced the quality of the report. Dr. Ahmad Khan and Dr. A. R. Kemal reviewed the background studies, and Ehtisham Ahmad commented on the concept paper. Anjum Ahmad, Shamsuddin Admad, Mihaly Kopanyi, Hanid Mukhtar, and Saadia Refaqat from the World Bank provided useful feedback. Mirafe Marcos helped greatly by providing the draft chapter of the provincial background study. The team would like to thank Satu Kahkonen, Lead Economist, Miria Pigato, Sector Manager, Ijaz Nabi, former Sector Manager, Yusupha Crookes, Country Director, and Ernesto May, Sector Director, for continued support and guidance throughout all stages of this report. Muhammad Shafiq, Nimanthi Attapattu, and Irum Touqeer handled with great ease all arrangements for the missions and for the processing of the report. The team benefited enormously from the close collaboration of the Government of Pakistan ever since this work was launched in January 2007. The team is very grateful to Mr. M. Abdullah Yusuf, who conceived the idea for this report, and to Dr. Ather Maqsood Ahmed, who developed the framework and coordinated the inputs of the FBR team. The team is greatly indebted for the outstanding support and assistance of FBR’s Fiscal Research and Statistics Wing. Its contribution is immense: it co-authored three background studies; provided comments, feedback, and guidance to the team throughout the analysis and report preparation; and facilitated the interaction with other departments, including the Budget Wing, Debt Office, and the Economic Affairs Division of the Ministry of Finance.
Background Papers for the Pakistan Tax Policy Report
08-07 Bahl, Roy, Wallace, Sally and Cyan, Musharraf. Pakistan: Provincial Government Taxation.
08-08 Thirsk, Wayne. Tax Policy in Pakistan: An Assessment of Major Taxes and Options for Reform.
08-09 Michelse, Geerten. Pakistan – a Globalized Tax World – An Analysis of its International Tax Practice.
08-10 Alm, James and Khan, Mir Ahmad. Assessing Enterprise Taxation and the Investment Climate in
Pakistan.
8-11 Ahmed, Robina Ather and Rider, Mark. Pakistan’s Tax Gap: Estimates by Tax Calculation and
Methodology.
08-12 Sally Wallace and Harini Khan. Pakistan: Comprehensive Individual Tax Reform: Round 2
08-13 Wahid, Umar and Wallace, Sally. Incidence of Taxes in Pakistan: Primer and Estimates
1
Pakistan: Comprehensive Individual Income Tax Reform: Round 2
Sally Wallace and Harini Kannan Department of Economics, Andrew Young School of Policy Studies, Georgia State University
Overview
Pakistan’s individual income tax falls on the earnings of salaried individuals,
unincorporated businesses, and individuals with other incomes. The individual income tax is
collected through: a number of withholding mechanisms (including retentions by employers),
estimated payments, and final tax return reconciliations. The laws governing the taxation of
individual income are not integrated. In 2006 there were five primary tax returns that individuals
could be required to file, each with different tax rate schedules, depending on the type of income
and taxpayer. For example, salaried individuals are subject to a traditional marginal tax rate
structure, but some retailers are taxed under a presumptive tax system, while other individuals
and non-incorporated businesses pay largely through a final withholding system with differential
rates.
2 International Studies Program Working Paper Series
Besides the complexity of returns and rate schedules, personal income taxation is subject
to a large array of exemptions and deductions. The current system, as has been analyzed in
previous sections leads to significantly lower tax revenues, high administration and compliance
costs, distortions in economic behavior with large excess tax burdens, and the unfair distribution
of tax burdens. Even accounting for revenue receipts is complicated by the use of myriad
withholding schemes, and the lack of classification of receipts from current liability, past
liability, and penalties and interest. Therefore, the individual income tax system and
administration in Pakistan is badly in need of simplification and rationalization.
The fundamental proposal for comprehensive individual income tax reform in Pakistan is
to provide an integrated income tax structure that pertains to income of all individuals (including
non-incorporated businesses) and which otherwise dramatically simplifies the taxation of
individual income in Pakistan. An integrated individual income tax would treat individuals
(salaried employees, self-employed businesses, and other non-corporate entities) in a similar way
by applying a given tax rate structure to taxable income. However, in many countries, in recent
times, capital income is treated differently from earned income, in what has become known as a
“dual income tax” system. There are many good reasons for treating capital income differently,
including the high mobility of capital in a globalized world, easing the administrative and
compliance burden, or enabling government to target economic development; the downside is
that the differential treatment of wage and earned income vis-a-vis capital income raises fairness
and equity concerns.
In the first long-term reform proposal for Pakistan we analyze the following individual
income tax package: 1) a flat rate income tax with a minimum exempt income threshold applying
to most income, 2) a separate tax on capital income also with a a flat tax rate but no minimum
Pakistan: Comprehensive Individual Income Tax Reform: Round 2 3
income threshold, and 3) rationalization of the withholding system. A second reform scenario
replaces the flat rate income tax rate with a two-tiered rate—12 percent for those with taxable
income less than Rs 300,000 and an 18 percent rate for those with taxable income greater than Rs
300,000.
More specifically, the Scenario 1 includes the following reform options:
• A flat 15 percent tax rate on all non-capital income, with a threshold of Rs 130,435 and a
maximum deduction of 10 percent for medical expenses and mortgage interest.1
• A flat 10 percent tax rate on capital income;
• Flat 10 percent withholding rates on various withholding taxes for income items;
• Elimination of the withholding tax on transactions;
• Elimination of all individual income tax exemptions (previously analyzed and re-
estimated here under the new proposed tax rates);
• Taxation of short term capital gains at 10 percent.
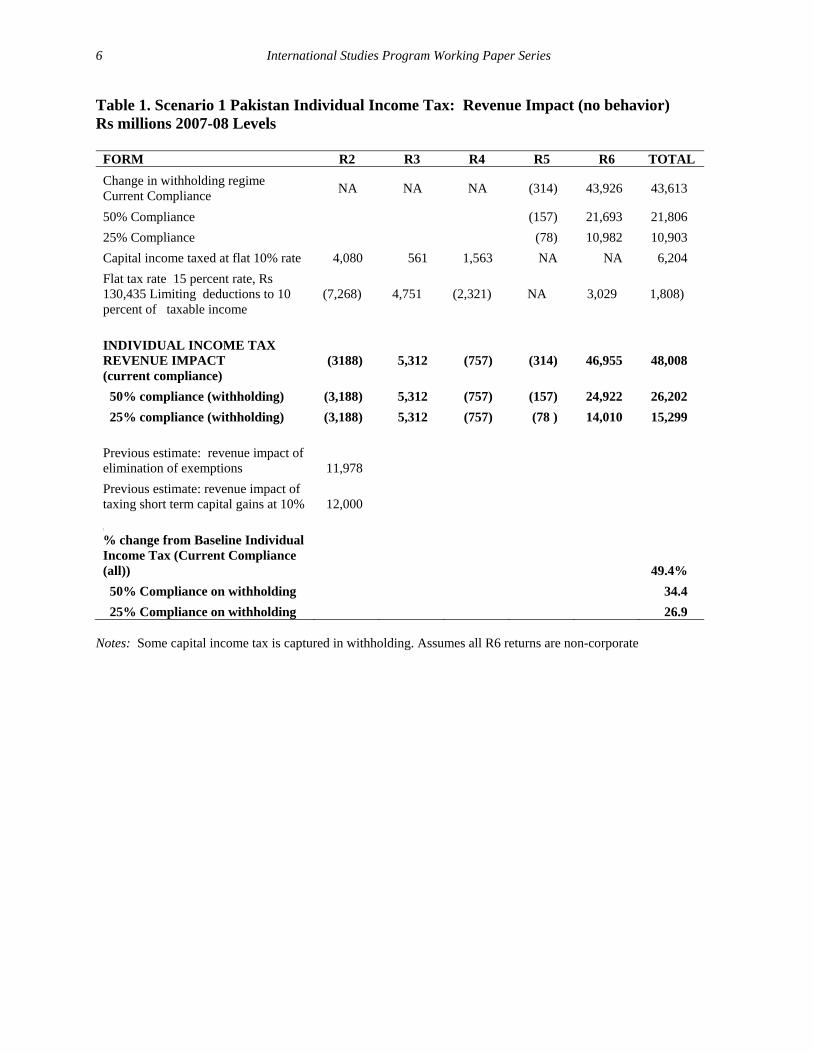
For 2007-08 the net revenue impact of this reform package would have been an estimated
increase in individual income tax revenue of 53.8 percent—or Rs 71.9 billion. The summary of
the simulation results are shown in Table 1. These estimates are static in the sense that no
behavioral responses are assumed on the side of taxpayers to the changes in tax structure. In
addition, we first assume that compliance and enforcement of the system will remain at the same
level as in 2007 (“current law compliance”). For most of the reforms, this is a reasonable
assumption. However, in the case of the withholding tax reforms, the net effect of the reform
1 We would have preferred to analyze a reform option with a small number of specific deductions, but we do not have detailed data to do such estimation. The 10 percent limitation is an estimate of the level of deductions currently taken for medical and mortgage interest. The threshold is set to a value approximately equal to twice the per capita income in Pakistan. In the second reform option, we impose the two-tiered rate.
4 International Studies Program Working Paper Series
increases the withholding rate substantially for most withholding categories. It is very unlikely
that the potential level of revenues that we estimate will actually be collected. Therefore, we
also report revenue estimates assuming that 25 percent and 50 percent of the estimated potential
liability for the withholding taxes can actually be collected.
The revenue estimates are reported by “R form” category net of withholding taxes and
withholding. The returns are associated with the following groups:
R2: Non-salaried individuals and AOPs (self-employed)
R3: Salaried individuals (this is the employer’s certificate in lieu of return)
R4: Salaried individuals with other sources of income (this is the employer’s certificate in
lieu of return)
R5: Self-employed whose receipts/value of goods is chargeable under section 5, 6, and
169 of the Income Tax Ordinance, 2001
R6: Retailers with turnover Rs 5 million or less
Withholding taxes come in a variety of forms. As explained below, we had to allocate
the withholding payments to the individual and corporate income taxes, and within individual
income tax receipts, we had to attribute withholding payments to the various R forms. The total
level of taxes coming in through the withholding system is very large and the revenue impacts of
the reform options are also very large.
The largest revenue impacts (over 90 percent of the total impact) in the withholding
category come from the change in withholding tax on contracts and supply of goods and imports.
Under current law, these items are taxed at rates of between 0.75 and 6 percent. Under the
reform scenario, the tax rate would be a flat 10 percent rate. If we assume lower levels of
Pakistan: Comprehensive Individual Income Tax Reform: Round 2 5
compliance (and/or enforcement) of 50 and 25 percent, the increased withholding tax revenues
are estimated at Rs 21.8 billion and Rs 10.9 billion respectively.
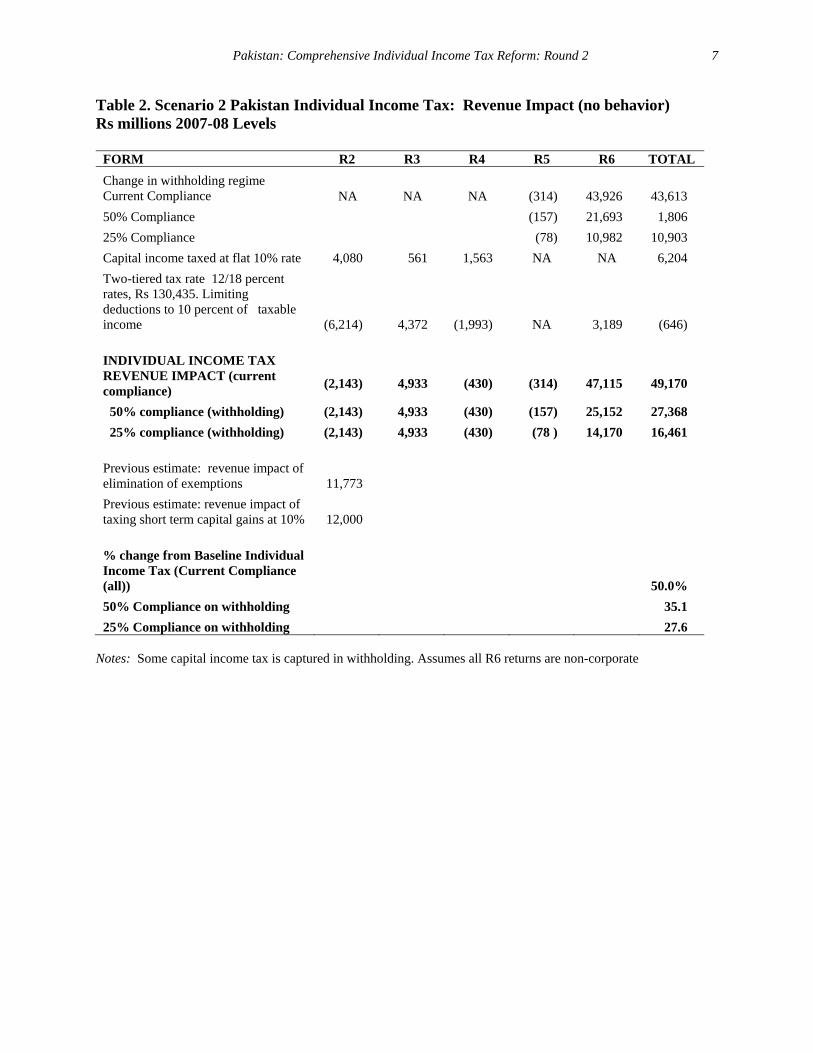
An alternative reform option is a two-rate income tax structure, holding all other aspects
of the reform as outlined above. A two-tiered rate structure would introduce some progressivity
into the reform package. We simulated a number of alternative options but present the revenue
implications of the following in Table 2:
• Threshold of Rs 130,435 and a limitation of deductions for medical and mortgage
expense of not more than 10 percent of taxable income.
• 12 percent tax rate for taxable income up to Rs 300,000; 17 percent tax rate for taxable
income over Rs 300,000
• A flat 10 percent tax rate on capital income;
• Flat 10 percent withholding rates on various withholding taxes for income items;
• Elimination of the withholding tax on transactions;
• Elimination of all individual income tax exemptions (previously analyzed and re-
estimated here under the new proposed tax rates);
• Taxing short term capital gains at 10 percent.
Under this scenario (reported in Table 2), the revenue implications are quite similar to the
first (flat rate) scenario. The difference here is that the progressivity of the system is greater
under scenario 2 relative to scenario 1. However, in both cases, due to the relatively high
threshold, the distribution of the tax burden continues to be larger in the top three population
deciles—the 8th, 9th and 10th deciles.
6 International Studies Program Working Paper Series
Table 1. Scenario 1 Pakistan Individual Income Tax: Revenue Impact (no behavior) Rs millions 2007-08 Levels
FORM R2 R3 R4 R5 R6 TOTAL
Change in withholding regime Current Compliance NA NA NA (314) 43,926 43,613
50% Compliance (157) 21,693 21,806
25% Compliance (78) 10,982 10,903
Capital income taxed at flat 10% rate 4,080 561 1,563 NA NA 6,204
Flat tax rate 15 percent rate, Rs 130,435 Limiting deductions to 10 percent of taxable income
(7,268) 4,751 (2,321) NA 3,029 1,808)
INDIVIDUAL INCOME TAX REVENUE IMPACT (current compliance)
(3188) 5,312 (757) (314) 46,955 48,008
50% compliance (withholding) (3,188) 5,312 (757) (157) 24,922 26,202
25% compliance (withholding) (3,188) 5,312 (757) (78 ) 14,010 15,299
Previous estimate: revenue impact of elimination of exemptions 11,978
Previous estimate: revenue impact of taxing short term capital gains at 10% 12,000
\
% change from Baseline Individual Income Tax (Current Compliance (all))
49.4%
50% Compliance on withholding 34.4
25% Compliance on withholding 26.9 Notes: Some capital income tax is captured in withholding. Assumes all R6 returns are non-corporate
Pakistan: Comprehensive Individual Income Tax Reform: Round 2 7
Table 2. Scenario 2 Pakistan Individual Income Tax: Revenue Impact (no behavior) Rs millions 2007-08 Levels
FORM R2 R3 R4 R5 R6 TOTAL
Change in withholding regime Current Compliance NA NA NA
(314)
43,926
43,613
50% Compliance (157) 21,693 1,806
25% Compliance (78) 10,982 10,903
Capital income taxed at flat 10% rate 4,080 561 1,563 NA NA 6,204
Two-tiered tax rate 12/18 percent rates, Rs 130,435. Limiting deductions to 10 percent of taxable income (6,214) 4,372
(1,993) NA 3,189 (646)
INDIVIDUAL INCOME TAX REVENUE IMPACT (current compliance)
(2,143)
4,933
(430)
(314)
47,115
49,170
50% compliance (withholding) (2,143) 4,933 (430) (157) 25,152 27,368
25% compliance (withholding) (2,143) 4,933 (430) (78 ) 14,170 16,461
Previous estimate: revenue impact of elimination of exemptions 11,773
Previous estimate: revenue impact of taxing short term capital gains at 10% 12,000
% change from Baseline Individual Income Tax (Current Compliance (all))
50.0%
50% Compliance on withholding 35.1
25% Compliance on withholding 27.6 Notes: Some capital income tax is captured in withholding. Assumes all R6 returns are non-corporate
8 International Studies Program Working Paper Series
Details of the Analysis
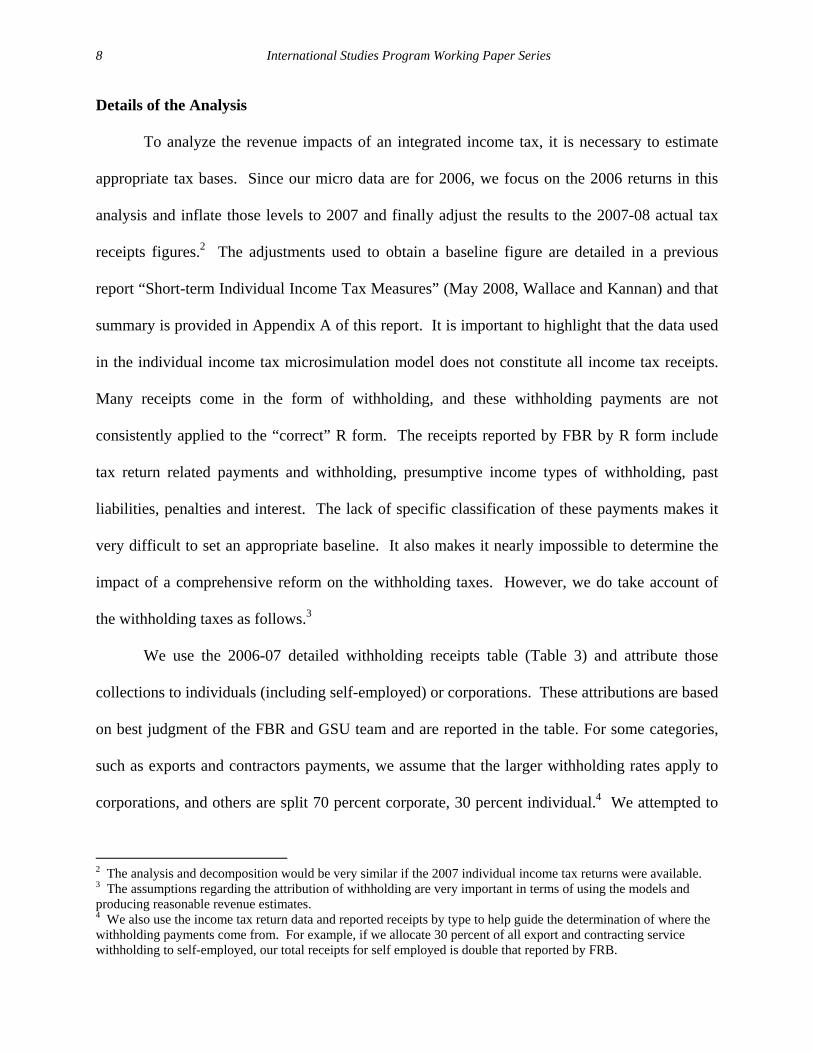
To analyze the revenue impacts of an integrated income tax, it is necessary to estimate
appropriate tax bases. Since our micro data are for 2006, we focus on the 2006 returns in this
analysis and inflate those levels to 2007 and finally adjust the results to the 2007-08 actual tax
receipts figures.2 The adjustments used to obtain a baseline figure are detailed in a previous
report “Short-term Individual Income Tax Measures” (May 2008, Wallace and Kannan) and that
summary is provided in Appendix A of this report. It is important to highlight that the data used
in the individual income tax microsimulation model does not constitute all income tax receipts.
Many receipts come in the form of withholding, and these withholding payments are not
consistently applied to the “correct” R form. The receipts reported by FBR by R form include
tax return related payments and withholding, presumptive income types of withholding, past
liabilities, penalties and interest. The lack of specific classification of these payments makes it
very difficult to set an appropriate baseline. It also makes it nearly impossible to determine the
impact of a comprehensive reform on the withholding taxes. However, we do take account of
the withholding taxes as follows.3
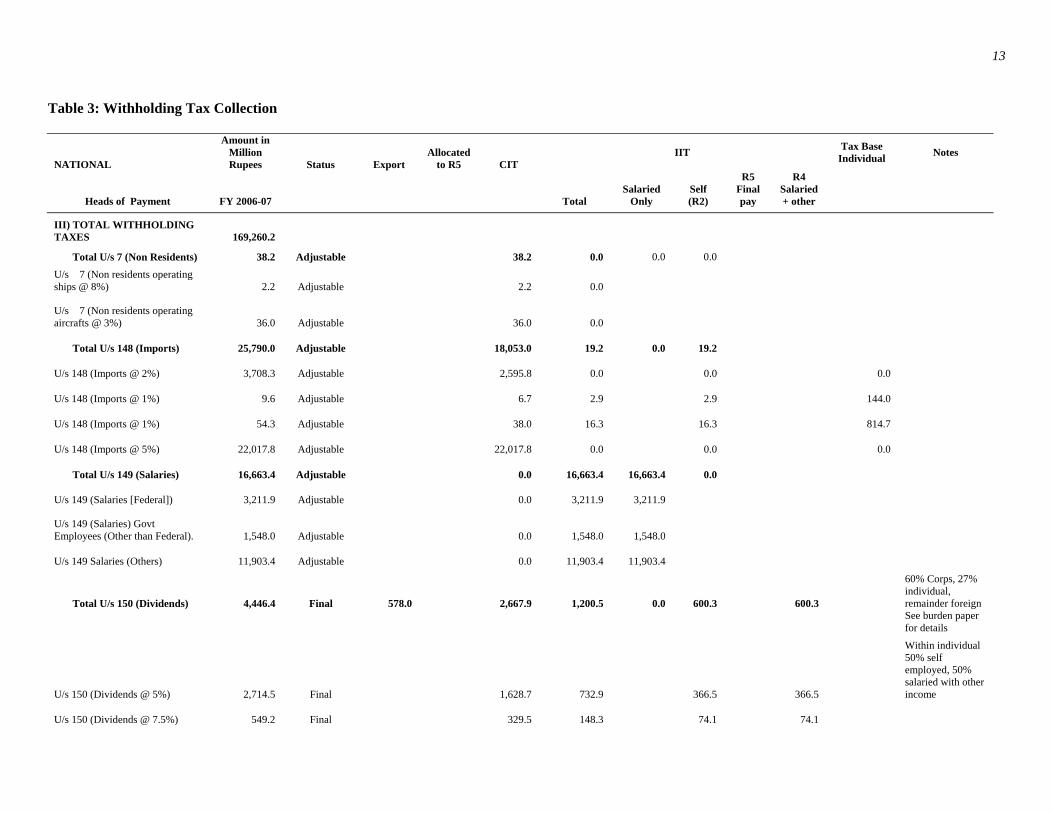
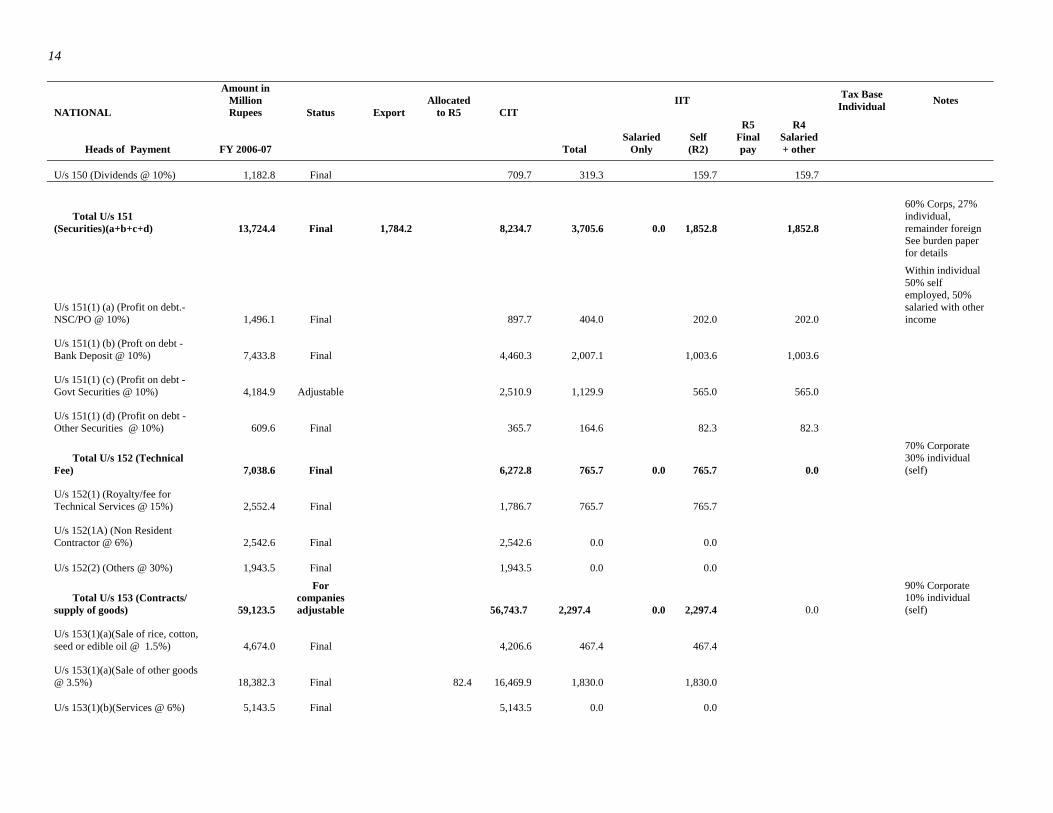
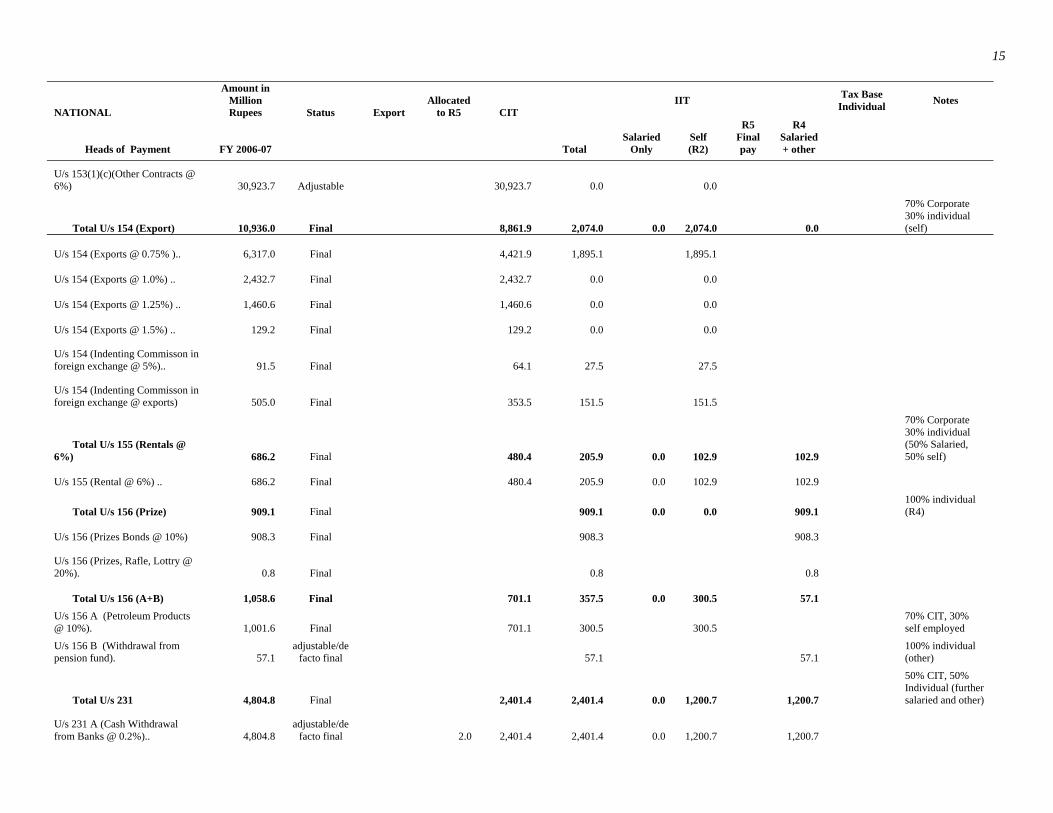
We use the 2006-07 detailed withholding receipts table (Table 3) and attribute those
collections to individuals (including self-employed) or corporations. These attributions are based
on best judgment of the FBR and GSU team and are reported in the table. For some categories,
such as exports and contractors payments, we assume that the larger withholding rates apply to
corporations, and others are split 70 percent corporate, 30 percent individual.4 We attempted to
2 The analysis and decomposition would be very similar if the 2007 individual income tax returns were available. 3 The assumptions regarding the attribution of withholding are very important in terms of using the models and producing reasonable revenue estimates. 4 We also use the income tax return data and reported receipts by type to help guide the determination of where the withholding payments come from. For example, if we allocate 30 percent of all export and contracting service withholding to self-employed, our total receipts for self employed is double that reported by FRB.
Pakistan: Comprehensive Individual Income Tax Reform: Round 2 9
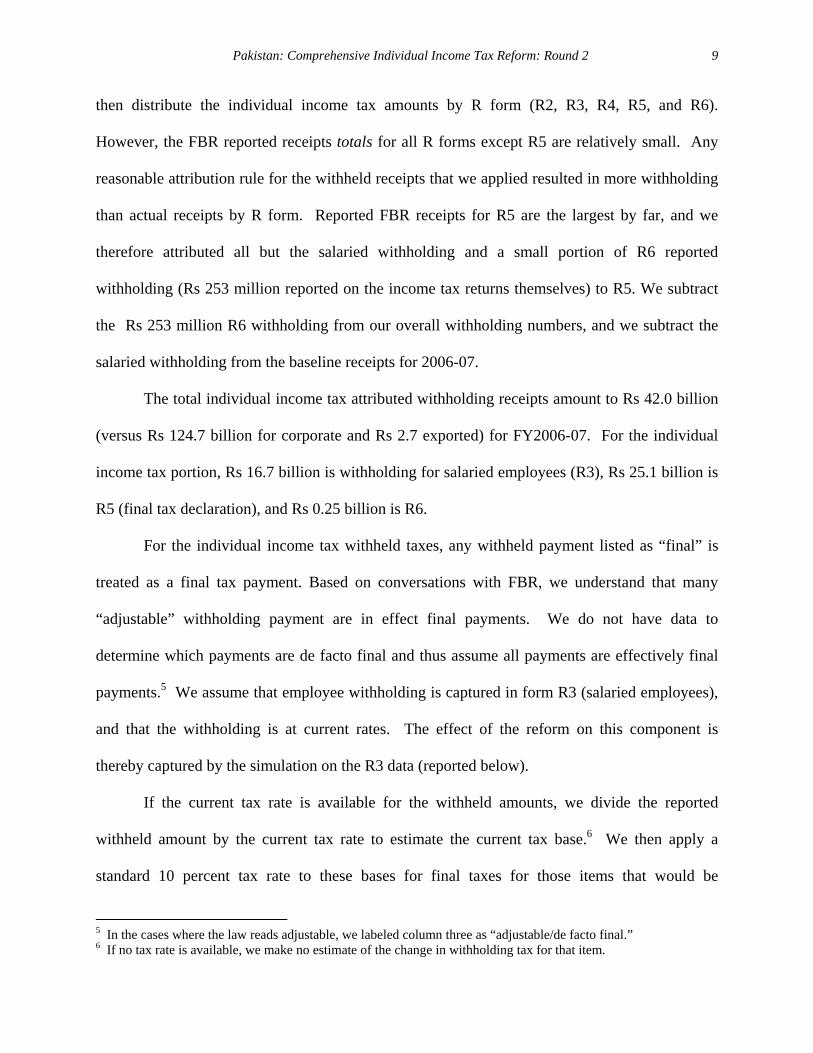
then distribute the individual income tax amounts by R form (R2, R3, R4, R5, and R6).
However, the FBR reported receipts totals for all R forms except R5 are relatively small. Any
reasonable attribution rule for the withheld receipts that we applied resulted in more withholding
than actual receipts by R form. Reported FBR receipts for R5 are the largest by far, and we
therefore attributed all but the salaried withholding and a small portion of R6 reported
withholding (Rs 253 million reported on the income tax returns themselves) to R5. We subtract
the Rs 253 million R6 withholding from our overall withholding numbers, and we subtract the
salaried withholding from the baseline receipts for 2006-07.
The total individual income tax attributed withholding receipts amount to Rs 42.0 billion
(versus Rs 124.7 billion for corporate and Rs 2.7 exported) for FY2006-07. For the individual
income tax portion, Rs 16.7 billion is withholding for salaried employees (R3), Rs 25.1 billion is
R5 (final tax declaration), and Rs 0.25 billion is R6.
For the individual income tax withheld taxes, any withheld payment listed as “final” is
treated as a final tax payment. Based on conversations with FBR, we understand that many
“adjustable” withholding payment are in effect final payments. We do not have data to
determine which payments are de facto final and thus assume all payments are effectively final
payments.5 We assume that employee withholding is captured in form R3 (salaried employees),
and that the withholding is at current rates. The effect of the reform on this component is
thereby captured by the simulation on the R3 data (reported below).
If the current tax rate is available for the withheld amounts, we divide the reported
withheld amount by the current tax rate to estimate the current tax base.6 We then apply a
standard 10 percent tax rate to these bases for final taxes for those items that would be
5 In the cases where the law reads adjustable, we labeled column three as “adjustable/de facto final.” 6 If no tax rate is available, we make no estimate of the change in withholding tax for that item.
10 International Studies Program Working Paper Series
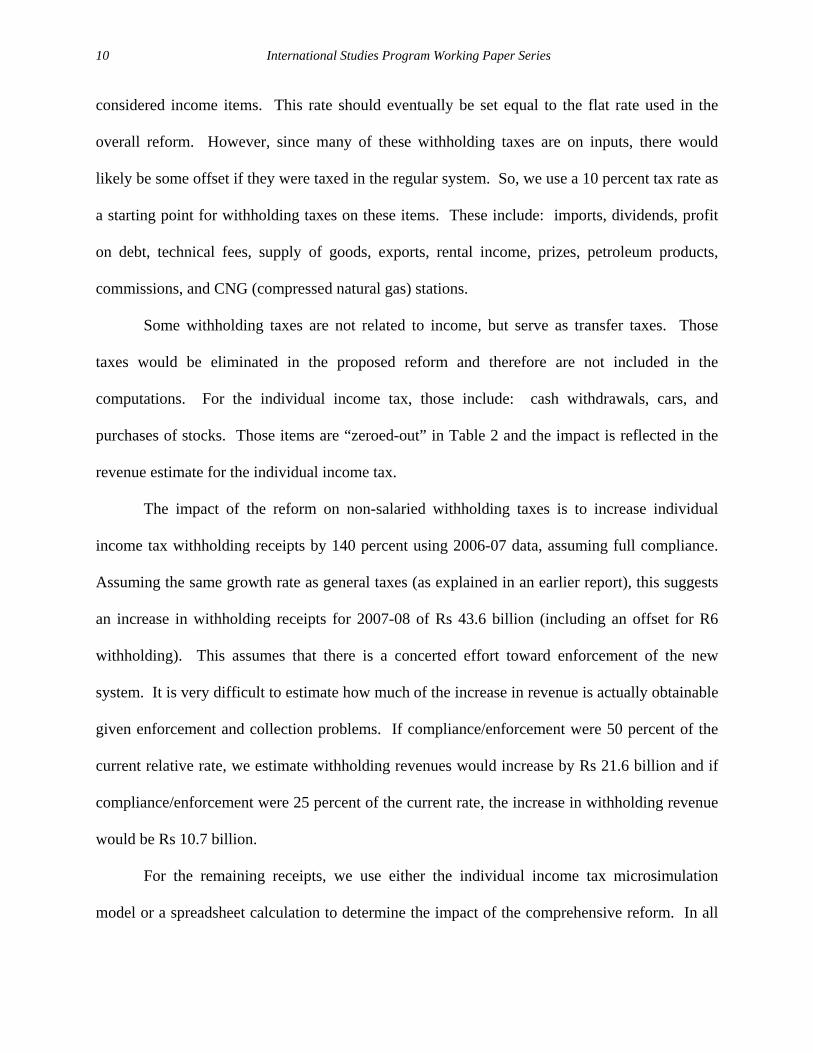
considered income items. This rate should eventually be set equal to the flat rate used in the
overall reform. However, since many of these withholding taxes are on inputs, there would
likely be some offset if they were taxed in the regular system. So, we use a 10 percent tax rate as
a starting point for withholding taxes on these items. These include: imports, dividends, profit
on debt, technical fees, supply of goods, exports, rental income, prizes, petroleum products,
commissions, and CNG (compressed natural gas) stations.
Some withholding taxes are not related to income, but serve as transfer taxes. Those
taxes would be eliminated in the proposed reform and therefore are not included in the
computations. For the individual income tax, those include: cash withdrawals, cars, and
purchases of stocks. Those items are “zeroed-out” in Table 2 and the impact is reflected in the
revenue estimate for the individual income tax.
The impact of the reform on non-salaried withholding taxes is to increase individual
income tax withholding receipts by 140 percent using 2006-07 data, assuming full compliance.
Assuming the same growth rate as general taxes (as explained in an earlier report), this suggests
an increase in withholding receipts for 2007-08 of Rs 43.6 billion (including an offset for R6
withholding). This assumes that there is a concerted effort toward enforcement of the new
system. It is very difficult to estimate how much of the increase in revenue is actually obtainable
given enforcement and collection problems. If compliance/enforcement were 50 percent of the
current relative rate, we estimate withholding revenues would increase by Rs 21.6 billion and if
compliance/enforcement were 25 percent of the current rate, the increase in withholding revenue
would be Rs 10.7 billion.
For the remaining receipts, we use either the individual income tax microsimulation
model or a spreadsheet calculation to determine the impact of the comprehensive reform. In all
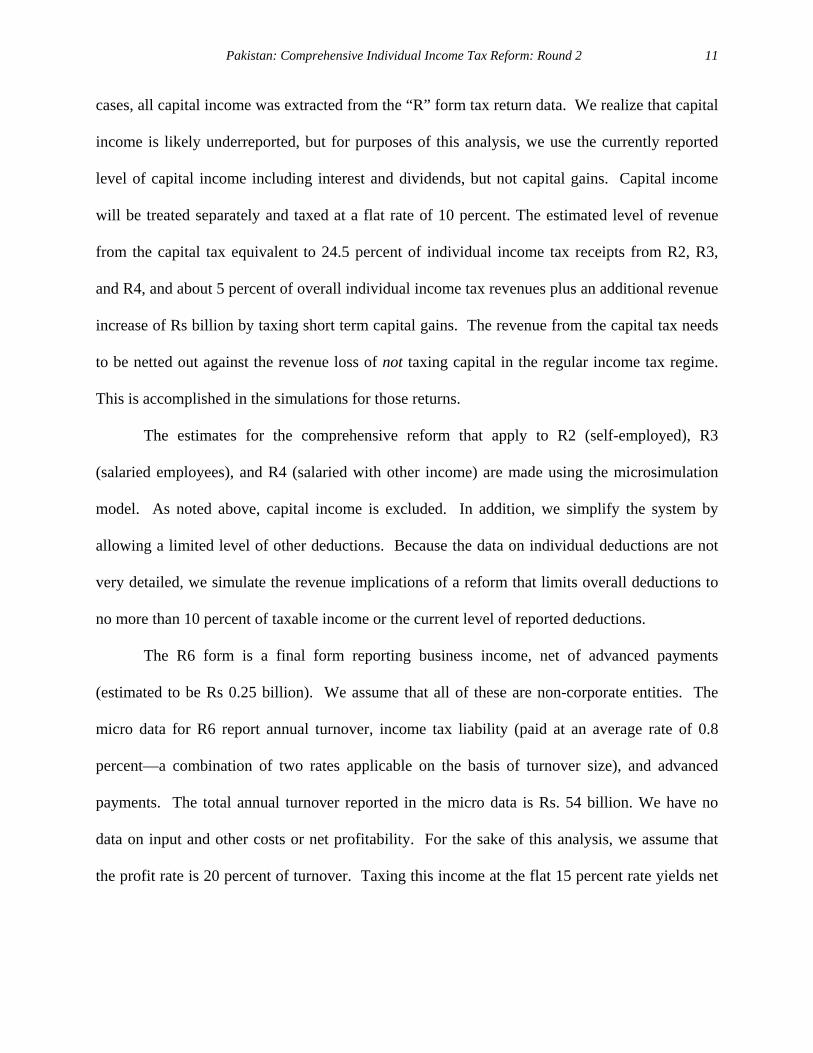
Pakistan: Comprehensive Individual Income Tax Reform: Round 2 11
cases, all capital income was extracted from the “R” form tax return data. We realize that capital
income is likely underreported, but for purposes of this analysis, we use the currently reported
level of capital income including interest and dividends, but not capital gains. Capital income
will be treated separately and taxed at a flat rate of 10 percent. The estimated level of revenue
from the capital tax equivalent to 24.5 percent of individual income tax receipts from R2, R3,
and R4, and about 5 percent of overall individual income tax revenues plus an additional revenue
increase of Rs billion by taxing short term capital gains. The revenue from the capital tax needs
to be netted out against the revenue loss of not taxing capital in the regular income tax regime.
This is accomplished in the simulations for those returns.
The estimates for the comprehensive reform that apply to R2 (self-employed), R3
(salaried employees), and R4 (salaried with other income) are made using the microsimulation
model. As noted above, capital income is excluded. In addition, we simplify the system by
allowing a limited level of other deductions. Because the data on individual deductions are not
very detailed, we simulate the revenue implications of a reform that limits overall deductions to
no more than 10 percent of taxable income or the current level of reported deductions.
The R6 form is a final form reporting business income, net of advanced payments
(estimated to be Rs 0.25 billion). We assume that all of these are non-corporate entities. The
micro data for R6 report annual turnover, income tax liability (paid at an average rate of 0.8
percent—a combination of two rates applicable on the basis of turnover size), and advanced
payments. The total annual turnover reported in the micro data is Rs. 54 billion. We have no
data on input and other costs or net profitability. For the sake of this analysis, we assume that
the profit rate is 20 percent of turnover. Taxing this income at the flat 15 percent rate yields net

12 International Studies Program Working Paper Series
revenue of Rs 1.6 billion in the model—an increase of nearly 4 times the current simulated level
of revenue.
13
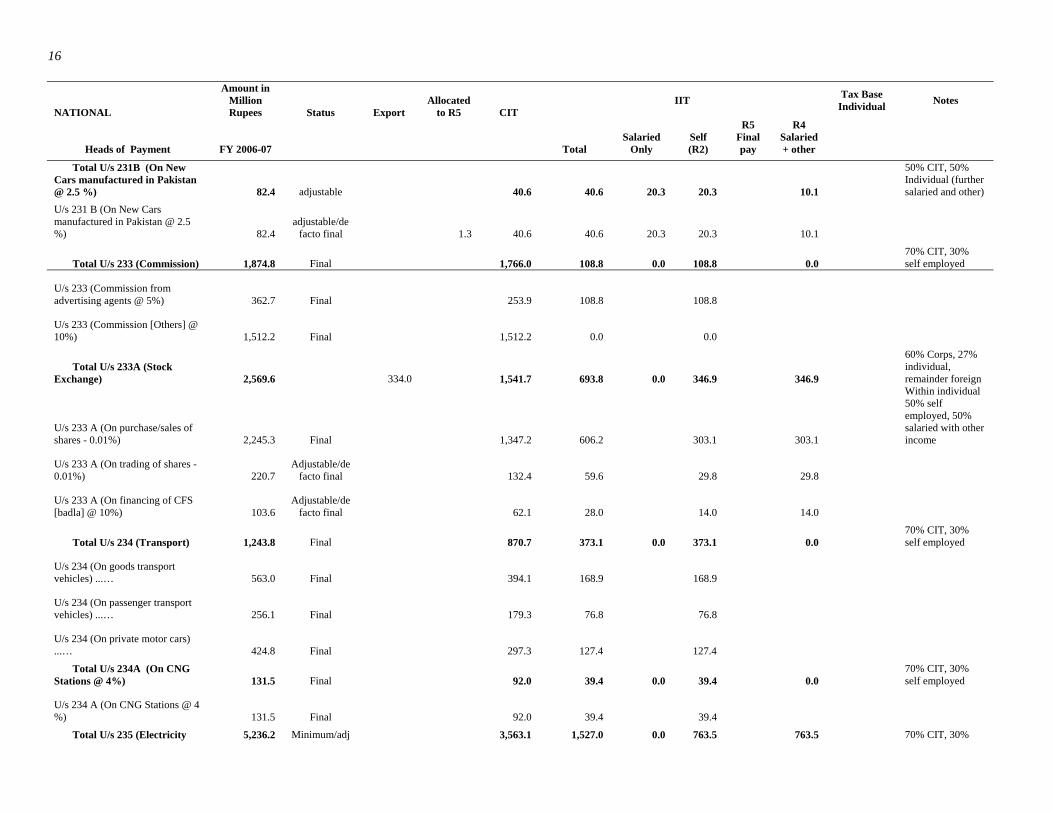
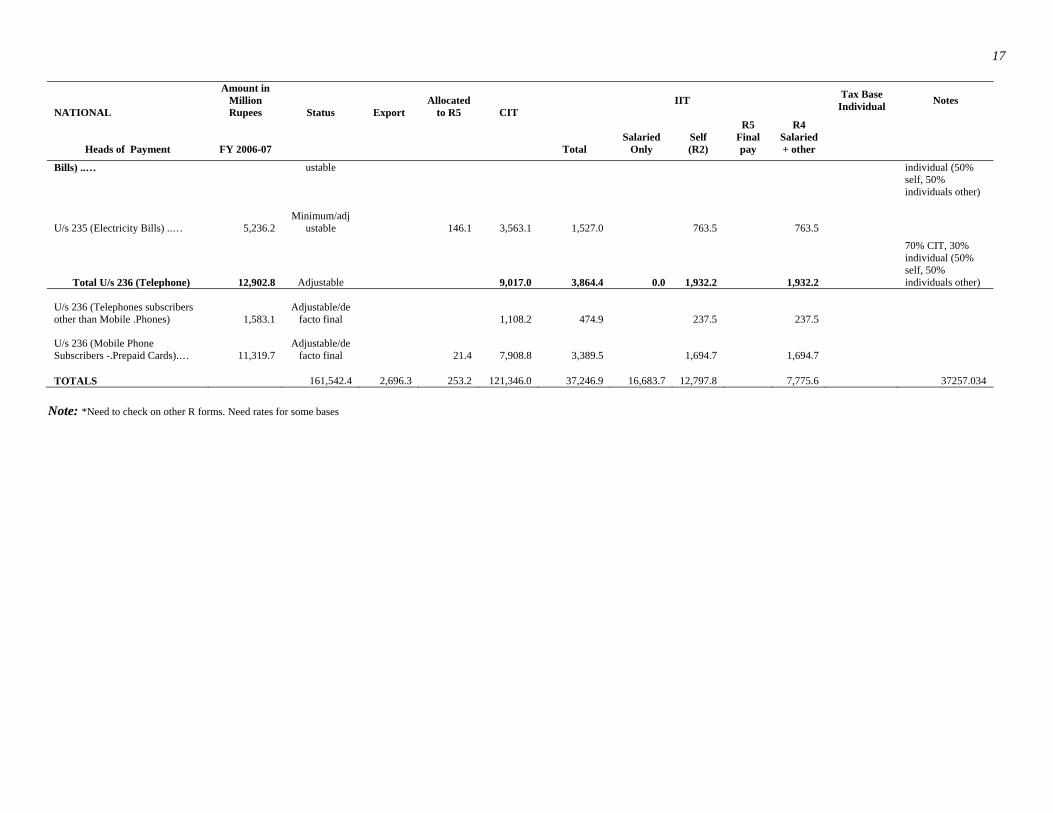
Table 3: Withholding Tax Collection
NATIONAL
Amount in Million Rupees Status Export
Allocated to R5 CIT
IIT Tax Base Individual Notes
Heads of Payment FY 2006-07 Total Salaried
Only Self (R2)
R5 Final pay
R4 Salaried + other
III) TOTAL WITHHOLDING TAXES 169,260.2
Total U/s 7 (Non Residents) 38.2 Adjustable 38.2 0.0 0.0 0.0
U/s 7 (Non residents operating ships @ 8%) 2.2 Adjustable 2.2 0.0
U/s 7 (Non residents operating aircrafts @ 3%) 36.0 Adjustable 36.0 0.0
Total U/s 148 (Imports) 25,790.0 Adjustable 18,053.0 19.2 0.0 19.2
U/s 148 (Imports @ 2%) 3,708.3 Adjustable 2,595.8 0.0 0.0 0.0
U/s 148 (Imports @ 1%) 9.6 Adjustable 6.7 2.9 2.9 144.0
U/s 148 (Imports @ 1%) 54.3 Adjustable 38.0 16.3 16.3 814.7
U/s 148 (Imports @ 5%) 22,017.8 Adjustable 22,017.8 0.0 0.0 0.0
Total U/s 149 (Salaries) 16,663.4 Adjustable 0.0 16,663.4 16,663.4 0.0
U/s 149 (Salaries [Federal]) 3,211.9 Adjustable 0.0 3,211.9 3,211.9
U/s 149 (Salaries) Govt Employees (Other than Federal). 1,548.0 Adjustable 0.0 1,548.0 1,548.0
U/s 149 Salaries (Others) 11,903.4 Adjustable 0.0 11,903.4 11,903.4
Total U/s 150 (Dividends) 4,446.4 Final 578.0 2,667.9 1,200.5 0.0 600.3 600.3
60% Corps, 27% individual, remainder foreign
See burden paper for details
U/s 150 (Dividends @ 5%) 2,714.5 Final 1,628.7 732.9 366.5 366.5
Within individual 50% self employed, 50% salaried with other income
U/s 150 (Dividends @ 7.5%) 549.2 Final 329.5 148.3 74.1 74.1
14
NATIONAL
Amount in Million Rupees Status Export
Allocated to R5 CIT
IIT Tax Base Individual Notes
Heads of Payment FY 2006-07 Total Salaried
Only Self (R2)
R5 Final pay
R4 Salaried + other
U/s 150 (Dividends @ 10%) 1,182.8 Final 709.7 319.3 159.7 159.7
Total U/s 151 (Securities)(a+b+c+d) 13,724.4 Final 1,784.2 8,234.7 3,705.6 0.0 1,852.8 1,852.8
60% Corps, 27% individual, remainder foreign
See burden paper for details
U/s 151(1) (a) (Profit on debt.- NSC/PO @ 10%) 1,496.1 Final 897.7 404.0 202.0 202.0
Within individual 50% self employed, 50% salaried with other income
U/s 151(1) (b) (Proft on debt - Bank Deposit @ 10%) 7,433.8 Final 4,460.3 2,007.1 1,003.6 1,003.6
U/s 151(1) (c) (Profit on debt - Govt Securities @ 10%) 4,184.9 Adjustable 2,510.9 1,129.9 565.0 565.0
U/s 151(1) (d) (Profit on debt - Other Securities @ 10%) 609.6 Final 365.7 164.6 82.3 82.3
Total U/s 152 (Technical Fee) 7,038.6 Final 6,272.8 765.7 0.0 765.7 0.0
70% Corporate 30% individual (self)
U/s 152(1) (Royalty/fee for Technical Services @ 15%) 2,552.4 Final 1,786.7 765.7 765.7
U/s 152(1A) (Non Resident Contractor @ 6%) 2,542.6 Final 2,542.6 0.0 0.0
U/s 152(2) (Others @ 30%) 1,943.5 Final 1,943.5 0.0 0.0
Total U/s 153 (Contracts/ supply of goods) 59,123.5
For companies adjustable 56,743.7 2,297.4 0.0 2,297.4 0.0
90% Corporate 10% individual (self)
U/s 153(1)(a)(Sale of rice, cotton, seed or edible oil @ 1.5%) 4,674.0 Final 4,206.6 467.4 467.4
U/s 153(1)(a)(Sale of other goods @ 3.5%) 18,382.3 Final 82.4 16,469.9 1,830.0 1,830.0
U/s 153(1)(b)(Services @ 6%) 5,143.5 Final 5,143.5 0.0 0.0
15
NATIONAL
Amount in Million Rupees Status Export
Allocated to R5 CIT
IIT Tax Base Individual Notes
Heads of Payment FY 2006-07 Total Salaried
Only Self (R2)
R5 Final pay
R4 Salaried + other
U/s 153(1)(c)(Other Contracts @ 6%) 30,923.7 Adjustable 30,923.7 0.0 0.0
Total U/s 154 (Export) 10,936.0 Final 8,861.9 2,074.0 0.0 2,074.0 0.0
70% Corporate 30% individual (self)
U/s 154 (Exports @ 0.75% ).. 6,317.0 Final 4,421.9 1,895.1 1,895.1
U/s 154 (Exports @ 1.0%) .. 2,432.7 Final 2,432.7 0.0 0.0
U/s 154 (Exports @ 1.25%) .. 1,460.6 Final 1,460.6 0.0 0.0
U/s 154 (Exports @ 1.5%) .. 129.2 Final 129.2 0.0 0.0
U/s 154 (Indenting Commisson in foreign exchange @ 5%).. 91.5 Final 64.1 27.5 27.5
U/s 154 (Indenting Commisson in foreign exchange @ exports) 505.0 Final 353.5 151.5 151.5
Total U/s 155 (Rentals @ 6%) 686.2 Final 480.4 205.9 0.0 102.9 102.9
70% Corporate 30% individual (50% Salaried, 50% self)
U/s 155 (Rental @ 6%) .. 686.2 Final 480.4 205.9 0.0 102.9 102.9
Total U/s 156 (Prize) 909.1 Final 909.1 0.0 0.0 909.1 100% individual (R4)
U/s 156 (Prizes Bonds @ 10%) 908.3 Final 908.3 908.3
U/s 156 (Prizes, Rafle, Lottry @ 20%). 0.8 Final 0.8 0.8
Total U/s 156 (A+B) 1,058.6 Final 701.1 357.5 0.0 300.5 57.1
U/s 156 A (Petroleum Products @ 10%). 1,001.6 Final 701.1 300.5 300.5
70% CIT, 30% self employed
U/s 156 B (Withdrawal from pension fund). 57.1
adjustable/de facto final 57.1 57.1
100% individual (other)
Total U/s 231 4,804.8 Final 2,401.4 2,401.4 0.0 1,200.7 1,200.7
50% CIT, 50% Individual (further salaried and other)
U/s 231 A (Cash Withdrawal from Banks @ 0.2%).. 4,804.8
adjustable/de facto final 2.0 2,401.4 2,401.4 0.0 1,200.7 1,200.7
16
NATIONAL
Amount in Million Rupees Status Export
Allocated to R5 CIT
IIT Tax Base Individual Notes
Heads of Payment FY 2006-07 Total Salaried
Only Self (R2)
R5 Final pay
R4 Salaried + other
Total U/s 231B (On New Cars manufactured in Pakistan @ 2.5 %) 82.4 adjustable 40.6 40.6 20.3 20.3 10.1
50% CIT, 50% Individual (further salaried and other)
U/s 231 B (On New Cars manufactured in Pakistan @ 2.5 %) 82.4
adjustable/de facto final 1.3 40.6 40.6 20.3 20.3 10.1
Total U/s 233 (Commission) 1,874.8 Final 1,766.0 108.8 0.0 108.8 0.0 70% CIT, 30% self employed
U/s 233 (Commission from advertising agents @ 5%) 362.7 Final 253.9 108.8 108.8
U/s 233 (Commission [Others] @ 10%) 1,512.2 Final 1,512.2 0.0 0.0
Total U/s 233A (Stock Exchange) 2,569.6 334.0 1,541.7 693.8 0.0 346.9 346.9
60% Corps, 27% individual, remainder foreign
U/s 233 A (On purchase/sales of shares - 0.01%) 2,245.3 Final 1,347.2 606.2 303.1 303.1
Within individual 50% self employed, 50% salaried with other income
U/s 233 A (On trading of shares - 0.01%) 220.7
Adjustable/de facto final 132.4 59.6 29.8 29.8
U/s 233 A (On financing of CFS [badla] @ 10%) 103.6
Adjustable/de facto final 62.1 28.0 14.0 14.0
Total U/s 234 (Transport) 1,243.8 Final 870.7 373.1 0.0 373.1 0.0 70% CIT, 30% self employed
U/s 234 (On goods transport vehicles) ...… 563.0 Final 394.1 168.9 168.9
U/s 234 (On passenger transport vehicles) ...… 256.1 Final 179.3 76.8 76.8
U/s 234 (On private motor cars) ...… 424.8 Final 297.3 127.4 127.4
Total U/s 234A (On CNG Stations @ 4%) 131.5 Final 92.0 39.4 0.0 39.4 0.0
70% CIT, 30% self employed
U/s 234 A (On CNG Stations @ 4 %) 131.5 Final 92.0 39.4 39.4
Total U/s 235 (Electricity 5,236.2 Minimum/adj 3,563.1 1,527.0 0.0 763.5 763.5 70% CIT, 30%
17
NATIONAL
Amount in Million Rupees Status Export
Allocated to R5 CIT
IIT Tax Base Individual Notes
Heads of Payment FY 2006-07 Total Salaried
Only Self (R2)
R5 Final pay
R4 Salaried + other
Bills) ..… ustable individual (50% self, 50% individuals other)
U/s 235 (Electricity Bills) ..… 5,236.2 Minimum/adj
ustable 146.1 3,563.1 1,527.0 763.5 763.5
Total U/s 236 (Telephone) 12,902.8 Adjustable 9,017.0 3,864.4 0.0 1,932.2 1,932.2
70% CIT, 30% individual (50% self, 50% individuals other)
U/s 236 (Telephones subscribers other than Mobile .Phones) 1,583.1
Adjustable/de facto final 1,108.2 474.9 237.5 237.5
U/s 236 (Mobile Phone Subscribers -.Prepaid Cards).… 11,319.7
Adjustable/de facto final 21.4 7,908.8 3,389.5 1,694.7 1,694.7
TOTALS 161,542.4 2,696.3 253.2 121,346.0 37,246.9 16,683.7 12,797.8 7,775.6 37257.034 Note: *Need to check on other R forms. Need rates for some bases
18 International Studies Program Working Paper Series
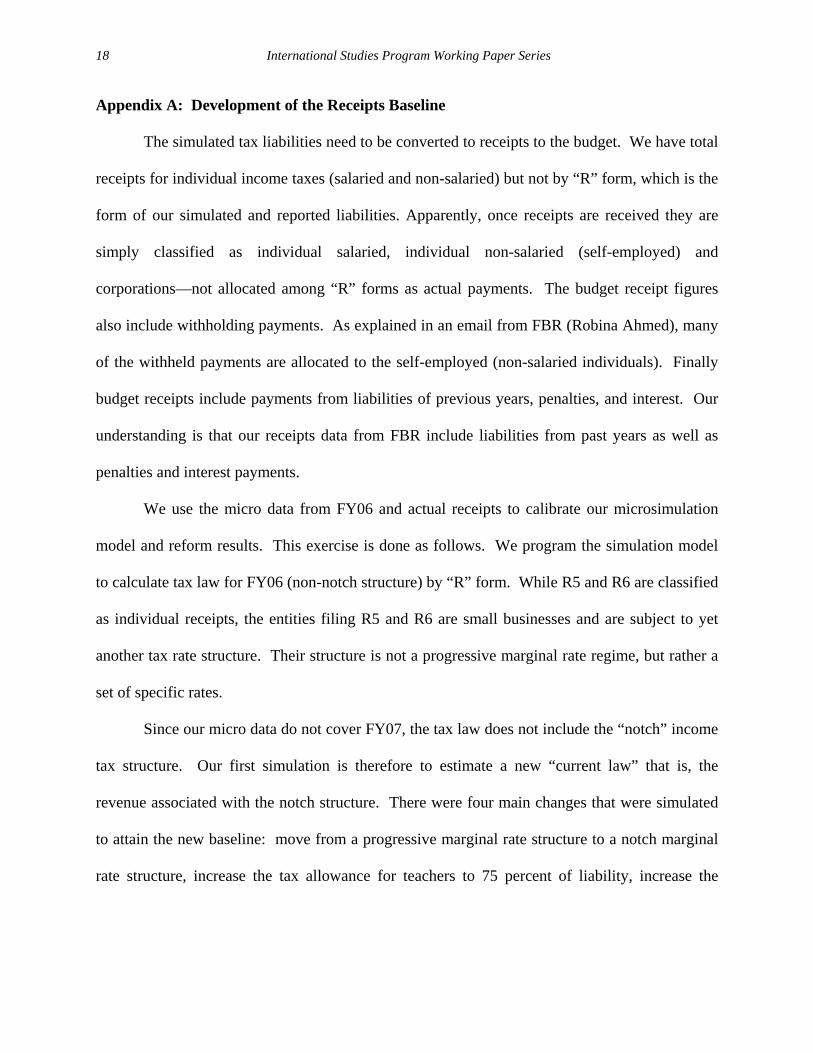
Appendix A: Development of the Receipts Baseline
The simulated tax liabilities need to be converted to receipts to the budget. We have total
receipts for individual income taxes (salaried and non-salaried) but not by “R” form, which is the
form of our simulated and reported liabilities. Apparently, once receipts are received they are
simply classified as individual salaried, individual non-salaried (self-employed) and
corporations—not allocated among “R” forms as actual payments. The budget receipt figures
also include withholding payments. As explained in an email from FBR (Robina Ahmed), many
of the withheld payments are allocated to the self-employed (non-salaried individuals). Finally
budget receipts include payments from liabilities of previous years, penalties, and interest. Our
understanding is that our receipts data from FBR include liabilities from past years as well as
penalties and interest payments.
We use the micro data from FY06 and actual receipts to calibrate our microsimulation
model and reform results. This exercise is done as follows. We program the simulation model
to calculate tax law for FY06 (non-notch structure) by “R” form. While R5 and R6 are classified
as individual receipts, the entities filing R5 and R6 are small businesses and are subject to yet
another tax rate structure. Their structure is not a progressive marginal rate regime, but rather a
set of specific rates.
Since our micro data do not cover FY07, the tax law does not include the “notch” income
tax structure. Our first simulation is therefore to estimate a new “current law” that is, the
revenue associated with the notch structure. There were four main changes that were simulated
to attain the new baseline: move from a progressive marginal rate structure to a notch marginal
rate structure, increase the tax allowance for teachers to 75 percent of liability, increase the
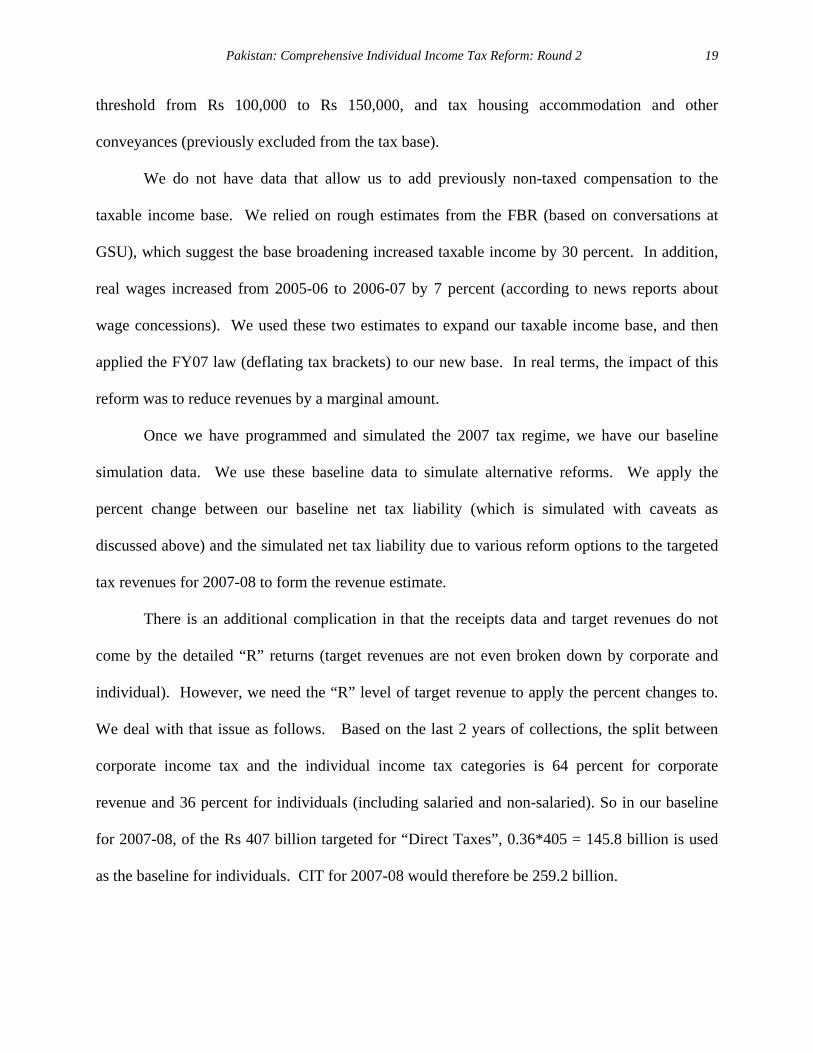
Pakistan: Comprehensive Individual Income Tax Reform: Round 2 19
threshold from Rs 100,000 to Rs 150,000, and tax housing accommodation and other
conveyances (previously excluded from the tax base).
We do not have data that allow us to add previously non-taxed compensation to the
taxable income base. We relied on rough estimates from the FBR (based on conversations at
GSU), which suggest the base broadening increased taxable income by 30 percent. In addition,
real wages increased from 2005-06 to 2006-07 by 7 percent (according to news reports about
wage concessions). We used these two estimates to expand our taxable income base, and then
applied the FY07 law (deflating tax brackets) to our new base. In real terms, the impact of this
reform was to reduce revenues by a marginal amount.
Once we have programmed and simulated the 2007 tax regime, we have our baseline
simulation data. We use these baseline data to simulate alternative reforms. We apply the
percent change between our baseline net tax liability (which is simulated with caveats as
discussed above) and the simulated net tax liability due to various reform options to the targeted
tax revenues for 2007-08 to form the revenue estimate.
There is an additional complication in that the receipts data and target revenues do not
come by the detailed “R” returns (target revenues are not even broken down by corporate and
individual). However, we need the “R” level of target revenue to apply the percent changes to.
We deal with that issue as follows. Based on the last 2 years of collections, the split between
corporate income tax and the individual income tax categories is 64 percent for corporate
revenue and 36 percent for individuals (including salaried and non-salaried). So in our baseline
for 2007-08, of the Rs 407 billion targeted for “Direct Taxes”, 0.36*405 = 145.8 billion is used
as the baseline for individuals. CIT for 2007-08 would therefore be 259.2 billion.
20 International Studies Program Working Paper Series
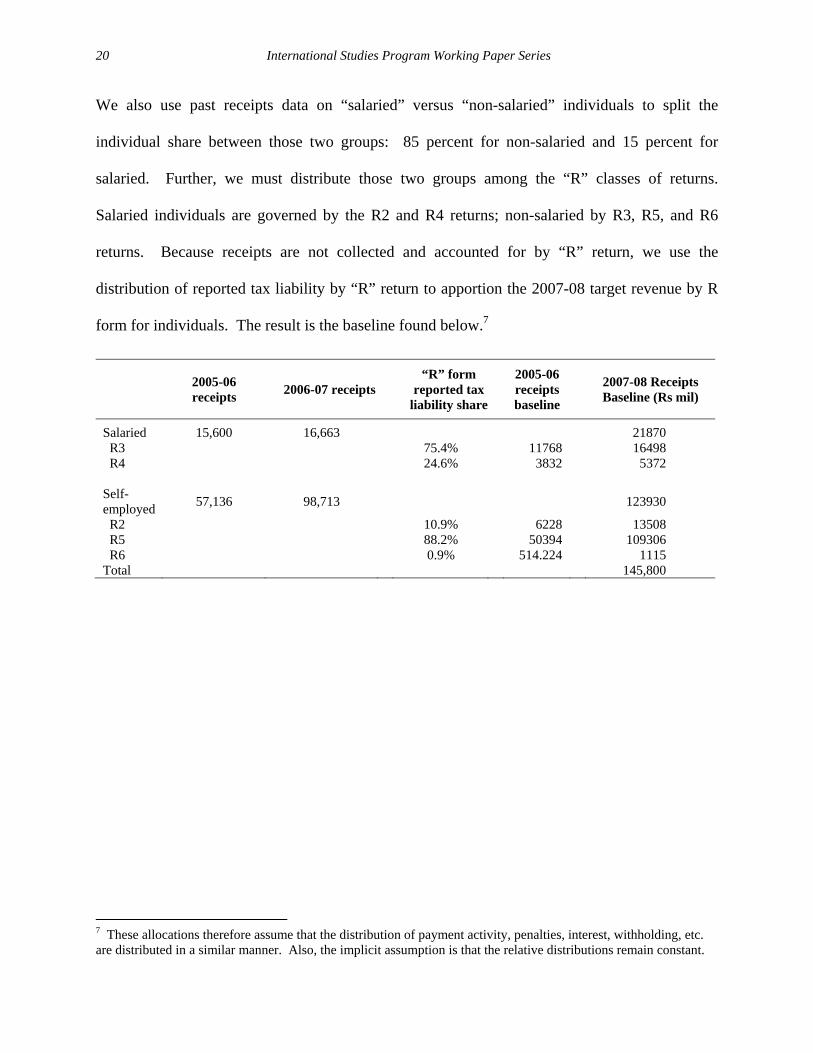
We also use past receipts data on “salaried” versus “non-salaried” individuals to split the
individual share between those two groups: 85 percent for non-salaried and 15 percent for
salaried. Further, we must distribute those two groups among the “R” classes of returns.
Salaried individuals are governed by the R2 and R4 returns; non-salaried by R3, R5, and R6
returns. Because receipts are not collected and accounted for by “R” return, we use the
distribution of reported tax liability by “R” return to apportion the 2007-08 target revenue by R
form for individuals. The result is the baseline found below.7
7 These allocations therefore assume that the distribution of payment activity, penalties, interest, withholding, etc. are distributed in a similar manner. Also, the implicit assumption is that the relative distributions remain constant.
2005-06 receipts 2006-07 receipts
“R” form reported tax
liability share
2005-06 receipts baseline
2007-08 Receipts Baseline (Rs mil)
Salaried 15,600 16,663 21870 R3 75.4% 11768 16498 R4 24.6% 3832 5372 Self-employed 57,136 98,713 123930
R2 10.9% 6228 13508 R5 88.2% 50394 109306 R6 0.9% 514.224 1115 Total 145,800