Embed Size (px)
Citation preview
Published: November 30, 2011
r 2011 American Chemical Society 251 dx.doi.org/10.1021/la2036949 | Langmuir 2012, 28, 251–258
ARTICLE
pubs.acs.org/Langmuir
Electric Birefringence of Dispersions of PlateletsMaría L. Jim�enez,*,†,‡ Lucia Fornasari,‡ Francesco Mantegazza,§ Maurice C. D. Mourad,||,^ andTommaso Bellini‡
†Department of Applied Physics, Faculty of Science, University of Granada, Granada, Spain‡Dipartimento di Chimica, Biochimica e Biotecnologie per la Medicina, Universit�a di Milano, Milano (MI), Italy§DIMS, Universit�a di Milano�Bicocca, Monza (MB), Italy
)Van’t Hoff Laboratory for Physical and Colloid Chemistry, Debye Institute for NanoMaterials Science, Utrecht University, Utrecht,The Netherlands^London Centre for Nanotechnology, University College London, London, United Kingdom
1. INTRODUCTION
Electric birefringence spectroscopy (EBS) is a powerfulelectro-optic tool to examine the structure and interfacial prop-erties of colloidal suspensions.1,2 With EBS we measure thestationary component of the birefringenceΔn = n||� n^ inducedin the suspension through the application of an AC field E. n|| andn^indicate the refractive indexes of the suspension along andperpendicular to the field, respectively. In suspensions of non-spherical rigid particles,Δn reflects the anisotropy of their orien-tational distribution, in turn due to the torque on the particlesexerted by the electric field. The frequency dependence of Δn isloaded with information about the particles and about the pro-cesses taking place at their surfaces. EBS is thus both an insightfultechnique to explore electrokinetic phenomena and a character-ization tool enabling us to determine the electric and opticalproperties of the particle, e.g., their surface conductivity and re-fractive index.3,4 Despite its potential, few studies are devoted tothe EBS response,5�10 none of them dealing with plate-likeparticles. Apart from a recent report on a single frequency,11 thusfar electric birefringence studies of oblate particles have focusedexclusively on the transient response to pulsed fields.12�18
In this article we offer the first EBS study of a suspension ofdisk-like particles, providing a quantitative analysis of the high-frequency portion of the spectra, and we discuss the features of
the particles that can be captured by this technique. We alsodescribe, for the first time, the anomalous birefringence effect19
in a dilute suspension of disk-like particles.This article is organized as follows. In section 2 we introduce
the electric birefringence techniques for charged colloids. In sec-tion 3 we briefly introduce the experimental setup and colloidalsuspension. In section 4 we describe the EBS and transient elec-tric birefringence (TEB) data obtained by studying the plateletdispersion. In section 5 we discuss the results in light of a modelthat takes into account the disk-like shape of the particles. Insection 6 we describe the anomalous orientation of mixtures ofGibbsite and spherical particles.
2. ELECTRIC BIREFRINGENCE SPECTROSCOPY ANDTRANSIENT ELECTRIC BIREFRINGENCE
Charged colloidal particles suspended in an aqueous solventhave a complex frequency-dependent electric polarizability thatdepends on the combination of many factors: the materials theyare made of, their shape and size, the electric double layer thatsurrounds the particles, and the conductivity of the electrolyte
Received: September 21, 2011Revised: November 11, 2011
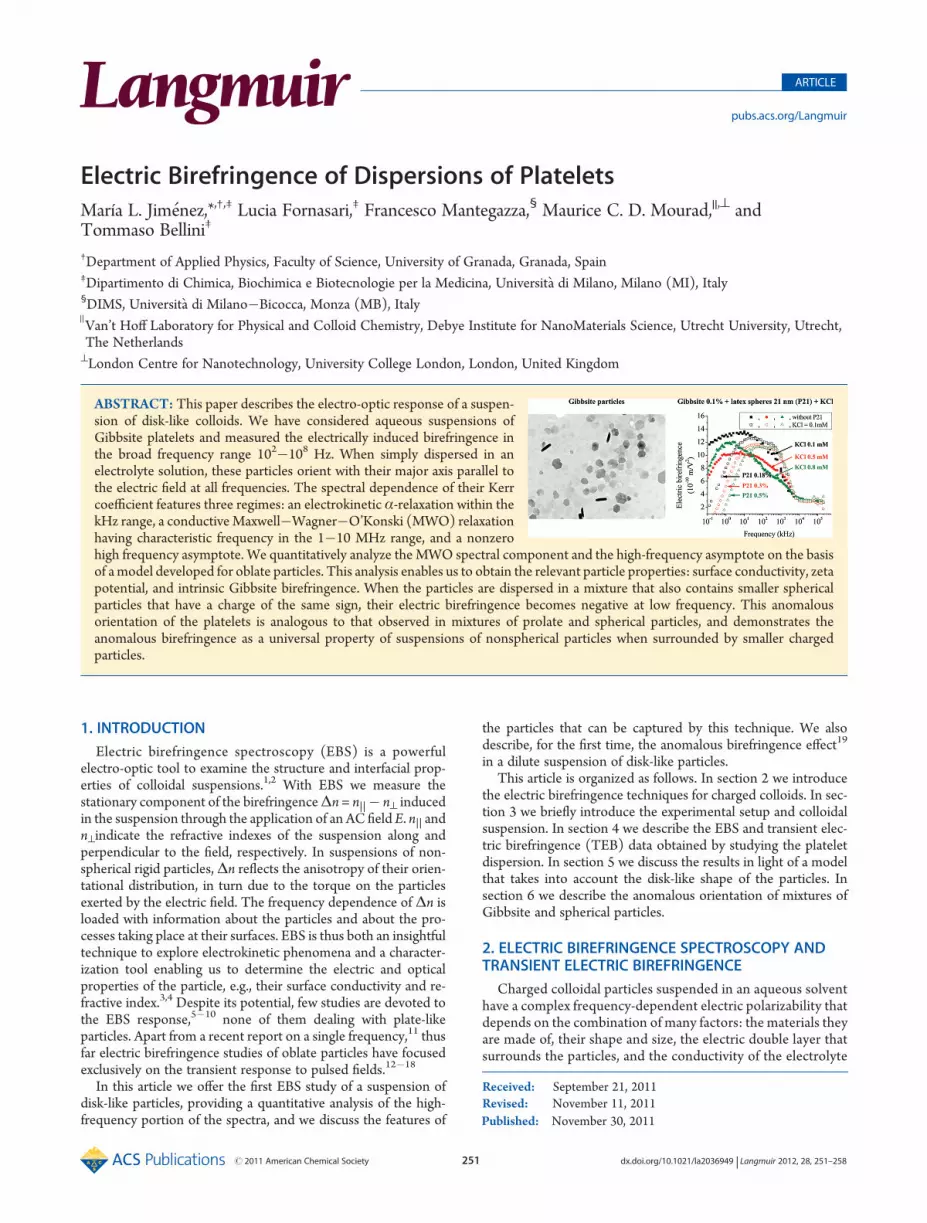
ABSTRACT: This paper describes the electro-optic response of a suspen-sion of disk-like colloids. We have considered aqueous suspensions ofGibbsite platelets and measured the electrically induced birefringence inthe broad frequency range 102�108 Hz. When simply dispersed in anelectrolyte solution, these particles orient with their major axis parallel tothe electric field at all frequencies. The spectral dependence of their Kerrcoefficient features three regimes: an electrokinetic α-relaxation within thekHz range, a conductiveMaxwell�Wagner�O’Konski (MWO) relaxationhaving characteristic frequency in the 1�10 MHz range, and a nonzerohigh frequency asymptote. We quantitatively analyze the MWO spectral component and the high-frequency asymptote on the basisof amodel developed for oblate particles. This analysis enables us to obtain the relevant particle properties: surface conductivity, zetapotential, and intrinsic Gibbsite birefringence. When the particles are dispersed in a mixture that also contains smaller sphericalparticles that have a charge of the same sign, their electric birefringence becomes negative at low frequency. This anomalousorientation of the platelets is analogous to that observed in mixtures of prolate and spherical particles, and demonstrates theanomalous birefringence as a universal property of suspensions of nonspherical particles when surrounded by smaller chargedparticles.

252 dx.doi.org/10.1021/la2036949 |Langmuir 2012, 28, 251–258
Langmuir ARTICLE
solution in which they are suspended. When the particles havenonspherical shape, their polarizability is anisotropic both at thefrequencies of the forcing electric field and at the opticalfrequency used to probe the system. Here we focus on disk-shaped particles and call αa
e and αbe the electric polarizability
parallel and perpendicular to their symmetry axes (a and b arethe small and large semiaxes, respectively), and Δαe = αa
e � αbe
the polarization anisotropy. With “electric” we refer to fieldfrequencies in the range 102 Hz < ν < 108 Hz used in EBS toinduce optical anisotropy. Analogous formalisms are used toindicate the optical polarizabilities αa
o, αbo, and Δαo = αa
o � αbo.
When the particles are made of an isotropic material, both Δαo
and Δαe are determined solely by the shape and by the diffe-rences in refractive index and electric permittivity between parti-cles and solvent. In this case, for oblate particles, both values arenegative. However, although it is common that spherical colloidsare internally isotropic, many of the nonspherical particles have acrystalline internal structure (related to their anisotropic growth)and have thus electrical and optical properties non fully reducibleto the geometrical effects.
The presence of the electric field affects the particles orienta-tions either directly, through the electric coupling with the in-duced electric dipole p, or indirectly, through the viscous forcesarising because of electro-osmosis. In both cases, as the electricfield is applied, the orientational distribution of the particles f(θ)becomes anisotropic (θ is the angle between E and the symmetryaxis of the particle), making the whole suspension optically aniso-tropic. The resulting macroscopic birefringence is related tof(θ) as1
Δn ¼ Δnsatϕ ÆP2ðcos θÞæ ð1Þwhere ϕ is the volume fraction of the particles, ÆP2(cos θ)æ is theaverage value of the second Legendre polynomial of the orienta-tional distribution, quantifying the degree of alignment of theparticles, and
Δnsat ¼ Δαo=ð2nsε0VpÞ ð2Þis the optical birefringence in the limit of perfectly alignedsample and ϕ = 1. ns is the refractive index of the suspendingmedium, ε0 is the vacuum permittivity, and Vp is the particlevolume.
Typically, the electric field favors the alignment of the majoraxis of disk-like particles along E, so that their symmetry axis ispredominantly perpendicular to E, a situation corresponding tonegative values of ÆP2(cos θ)æ. In the limit of strong field, whenthe disks are all oriented with their longest axis parallel to E,ÆP2(cos θ)æ = �1/2. This marks a significant difference withrespect to prolate particles, for which the large E limit yieldsÆP2(cos θ)æ = 1. For both prolate and oblate particles, Δn isnormally positive, a situation physically corresponding to the factthat the coupling with E orients the particle so that its axis havingthe largest optical polarizability is along E.
At low fields, Δn depends on E2. Such a quadratic depen-dence is expected because of the intrinsic symmetry of thesystem with respect to the transformation E f �E. Indeed,both the electric torque τE = p � E and the viscous torque τHdepend, at the lowest order, on E2.4,20 Because of thisproportionality, when a sinusoidal electric field of frequencyν is applied to the suspension, Δn has two spectral compo-nents: a DC component ΔnDC and a 2ν component withamplitude ΔnAC, mirroring, respectively, the DC and the 2ν
components of E2
Δn ¼ ΔnDCðνÞ þ ΔnACðνÞ sinð2νtÞ ð3ÞIt could appear surprising that an oscillating field gives rise to a
ΔnDC term. A purely electric coupling yields a nonvanishingΔnDC when a nonvanishing real part of α
e(ν) is present. Indeed,as E oscillates, the induced dipole also oscillates at the samefrequency. Hence, the in-phase component of the induced dipole,depending on the real part of αe(ν), is thus always reverting itssign as E does. Hence the electric torque, originating from theproduct of two terms switching sign at the same time, retains itssign, giving thus rise to the DC component. Analogous thinkingapplies to the hydrodynamic torque as well. The viscous flowsprovided by the electro-osmosis of a nonperturbed electric doublelayer do not give rise to hydrodynamic torques. Nonzero τH canbe produced by electro-osmotic flows around particles withpolarized electric double layers. Since such a polarization oscil-lates with E, the electro-osmotic viscous flows that result from thecoupling of E with the local excess of ions, acquire a E2 depend-ence and develop a quadrupolar-type space pattern that provides aDC torque. This type of flow is also found in the so-called induced-charge electro-osmosis of neutral conductive particles.21
In the experiments here reported we determine the time-averaged birefringence ÆΔnæ = ΔnDC(ν). Because of the E2
scaling, the electro-optic spectra measured by EBS are expressedin terms of Kerr constant B
BðνÞ ¼ ΔnDCðνÞλðE02=2Þ ð4Þ
where λ is the wavelength of the incident beam and E02 is the
squared amplitude of E. In this paper we do not investigate theoscillatory term ΔnAC(ν), whose frequency dependence is notvery informative since it mainly depends on the rotationaldiffusion coefficient(Θ) of the particles. This dependence arisesbecause the orientational distribution of the particles relaxes in acharacteristic time of τR = 1/6Θ and thusΔnAC(ν) dies offwhenthe frequency of the oscillation of E2 is such that(2ν)�1 < τR, i.e.,when ν > 3Θ, a frequency of the order of 0.5 kHz. In this case, theE2 period is too short for the particles to randomize by rotationaldiffusion.
An explicit expression for B(ν) is available when the viscoustorque does not contribute significantly to the orientation of theparticles.22 In this limit B(ν) becomes
BðνÞ ¼ ΔαoΔαeðνÞϕ30nsλεokBTVp
ð5Þ
where kB is the Boltzmann constant, T is the absolute tempera-ture, andΔαe is the real part of the anisotropic component of thepolarizability. Hence, when the viscous torque can be neglected,B(ν) enables direct access to the properties of the particles thatcontrol their polarizability. This makes EBS sharply differentfrom dielectric spectroscopy where the measured quantity de-pends on a more complex combination of the properties of theparticles and of their suspending solution instead.
A second type of experiments that we report on in this workis the measurement of the transient electric birefringence (TEB),that is, of the time dependence of Δn after switching off theelectric field.Δn relaxes to zero because thermal diffusion rando-mizes the particle orientation previously induced by the field.From the TEB characteristic time τR we extract the rotational

253 dx.doi.org/10.1021/la2036949 |Langmuir 2012, 28, 251–258
Langmuir ARTICLE
diffusion coefficient, in turn enabling to obtain information aboutthe size of the particles.
3. MATERIALS AND METHODS
3.1. Materials. Colloidal Gibbsite particles (γ-Al(OH)3) are a kindgift from H. Lekkerkerker. They were synthesized in the Utrechtlaboratory following the procedure in ref 23. The Gibbsite structure isa stacking of Al�OH layers, in which each Al3+ is surrounded by sixhydroxyl groups. Gibbsite forms hexagonal platelets that maintain theirshape in water. In aqueous dispersions, Gibbsite surfaces have a pHdependent electric charge. The structure of the Gibbsite crystals suggeststhat the acidity of the Al�OH groups at the edges is different from thaton the faces. Therefore, the isoelectric point of the edges is likely to bedifferent from that on the faces. This is also suggested by the results in ref24, where two isoelectric points are identified at pH 7 (edges) and pH9�10 (faces). We work with nonbuffered suspensions, with a resultingpH ∼6 at which both faces and edges of the particle are positivelycharged, even though the charge has been found to be non homo-geneous, having a larger charge density at the edges than at the faces.24
The suspensions were prepared by dilution to ϕ = 0.001�0.005 andsonicated prior to measurements.
Figure 1 shows a TEM picture (courtesy of H. Lekkerkerker) wherethe hexagonal shape of the Gibbsite platelets can be clearly appreciated.The picture also indicates that particles are much more monodispersethan typical clay particles and have an average diameter 132 nm. FromAFM analysis23 the thickness for these particles can be estimated. Thetypical aspect ratio for the particles used in the experiments herereported is F = 13. At pH∼6 the electrophoretic mobility ue is between5� 10�8 and 6� 10�8m2 V�1 s�1.24 Using the Smoluchowski equation(ue = ((ε0εm)/η)ζ), we obtain ζ ≈ 65�75 mV.
Experiments have been also performed in mixtures of Gibbsiteparticles and polystyrene positively charged latex spherical particles(PS) having radius of 19 nm (Interfacial Dynamics Corporation, USA)with concentrations ranging between 0.18% and 1%. Since both particleshave charge of the same sign, mixtures were stable.
All dispersions have been prepared in KCl electrolytic solutions at lowionic strength, in the range 0.1�1 mM.3.2. Methods. The birefringence is measured by propagating a
linearly polarized He�Ne laser beam (λ = 632 nm) through a cellcontaining the suspension and analyzing the resulting polarization. Thecell has an optical path length l = 1 cm and contains planar stainless steelelectrodes positioned so to create an electric field perpendicular to thelight beam and at 45� from the incident polarization. After leaving thecell, the beam goes through (i) a quarter wave plate with fast axis parallelto the incident polarization and (ii) an analyzer at an angle of 90� � α
from it. With this configuration, the analysis of the transmitted intensityat variable α enables maximizing the signal, detecting the sign of thebirefringence and compensating the residual birefringence of the cellwindow. Details about the experimental setup are described elsewhere.2
The transmitted intensity I(t) is collected by a photodiode and sent to adigital oscilloscope for recording, averaging on about 10 pulses andprocessing. The whole system is computer controlled.
The electric field is shaped in sine-wave pulses of zero average andvariable-frequency as sketched in Figure 2a. The pulse is generated by acombination of commercial waveform generators and amplifiers. Thefrequency is in the range 100 Hz to 200 MHz.25 The pulse duration waschosen to be in the range 30�50ms > τR, therefore enabling the suspen-sion to reach its equilibrium orientation distribution in the presence ofthe field. Figure 2b shows a typical Δn(t) response. In the experimentshere reported the field amplitude E0 < 10 V/mm.We have systematicallychecked that E is low enough to ensure the proportionalityΔn � E2.
From the recorded I(t), we extract Δn(t) as
Δn ¼ λ
πlarcsin
ffiffiffiffiII0
rsin α
!� α
0@
1A ð6Þ
where I0 is the intensity for E = 0.ΔnDC(ν) is extracted from the data by computing, at each given
frequency, the average value of Δn(t) over the time interval 25 ms < t <40 ms (shadowed in Figure 2c), roughly corresponding to the last thirdof the electric field pulse, where the suspension has reached a stationarybehavior after the completion of the transient response that follows theswitching on of the field. From ΔnDC(ν), B(ν) spectra are extractedthrough eq 4.
Valuable information is also extracted from the relaxation of Δn(t)after switching off the electric field. When monodisperse suspensionsare considered, Δn(t) decays as a simple exponential, its characteristictime being τR. In polydisperse suspensions, the transient electricbirefringence can be usefully approximated by a stretched expone-ntial relaxation26 added to a linear decay that takes into account the
Figure 1. TEM picture of the Gibbsite platelets where the bar indicates1000 nm.
Figure 2. Electric pulse (a) and electric birefringence response(b) measured as a function of time for Gibbsite 0.1% v/v in a 0.5 mMof KCl solution, and ν = 100 Hz. (c) Kerr constant of the same suspen-sion measured as a function of time for the electric pulses of the frequ-ency indicated. (d) Transient electric birefringence measured after theswitch off of an oscillatory pulse of 10 kHz for the same suspension. Thesolid line is the best fit to the experimental data of eq 7 plus a linearthermal drift.

254 dx.doi.org/10.1021/la2036949 |Langmuir 2012, 28, 251–258
Langmuir ARTICLE
thermal drift
Δn ¼ Δn0 exp½ � ðt=τSÞγ� � pt ð7Þ
where Δn0 is the birefringence before switching off the electric field,γ is the stretching exponent (0 < γ < 1), and τS the characteristic time,depending on the rotational diffusion coefficient Θ. In the simplestcase of monodisperse particles, γ = 1, τS = τR = 1/(6Θ). The secondaddend in eq 7 takes into account that the applied electric field caninduce Joule heating in the sample and this leads in first approximationto an apparent electric birefringence linearly dependent on time.
4. EXPERIMENTAL RESULTS
In Figure 2, panels b and c, we show the birefringence and Kerrconstant, respectively, of a suspension of Gibbsite particles withϕ = 0.001 and 0.5 mM KCl resulting from the application of40 ms long electric pulses of various frequencies. Only at thelowest frequencies (Figure 2, panels b and c, ν = 100 Hz) areboth DC and 2ν components evident. As the frequency increases,the amplitude of the 2ν component vanishes, as shown in Figure 2cwhere B(t) data obtained at four different frequencies are overlaid.
Figure 2d shows the relaxation ofΔn(t) after switching off theelectric field in a ϕ = 0.001 Gibbsite suspension (ν = 10 kHz, 0.5Mm KCl). In this figure t = 0 corresponds to the switching-offtime. Systematic measurements indicate that the shape of Δn(t)is independent from field frequency and ionic strength.
Figure 3a shows B vs ν in the frequency range explored byEBS, and for three Gibbsite dispersions, with ϕ = 0.001 anddifferent ionic strengths. As is evident, the EBS spectra containfeatures (decays, inflection points, maxima) over most of the ex-plored range that show some dependence on the ionic strength.An increasing behavior is found between the electric birefringence
and the particle concentration (Figure 3b), suggesting that inter-particle interactions do not play an important role at these con-centrations. However, in the limit of high frequency, the Kerrconstant reaches a plateau value B∞ whose value is indepen-dent from the ionic strength, although it is found to be linearlydependent on ϕ, as shown in Figure 4.
5. DISCUSSION
We first focus on the transient behavior after the removal ofthe external field, which depends exclusively on the shape andsize of the particles. Birefringence relaxation in Figure 2d wasfitted by eq 7 plus a linear decay function in order to account forthe long-time thermal drift. Relaxations were fitted for variousionic strengths and frequencies of the external field, obtaining thevalues τS = (0.49( 0.01) ms and γ = 1.00( 0.01. Hence, rathersurprisingly, despite the polydispersity appearing in Figure 1, therelaxation is a single exponential, as would be expected formonodisperse systems.
Since there is no analytical expression for the diffusion coeffi-cients of hexagonal platelets, we approximate the polygonalGibbsitedisks as oblate spheroids, of which the diffusion coefficient isknown27
Θ ¼ kBT8πηa3
32ð2� F2ÞG� 1
1� F4
!
G ¼ 1ffiffiffiffiffiffiffiffiffiffiffiffiffiF2 � 1
p arctanð ffiffiffiffiffiffiffiffiffiffiffiffiffiF2 � 1
p Þð8Þ
where η is the solvent viscosity. On the basis of the resultingvalues of the fitting parameters τS and γ of the birefringencerelaxation and keeping constant F = 13, we obtain the twosemiaxes a = 7.5 nm and b = 98 nm, the latter value 25% largerthan the one obtained by the analysis of TEM images. Thedifference may be attributed to the spheroidal approximation andto polydispersity. Although the mean size determined fromTEMpictures results from a simple numerical averaging, that of the EBsignal is not. Since both optical and electric polarizations increasewith the particle volume, the bulkier particles give a highercontribution to the total birefringence and dominate the aver-aging, yielding a larger mean size. In the following we will use ourTEB-based size estimations to analyze EBS data.
EBS spectra as those shown in Figure 3 clearly encompassprocesses taking place in various region of the explored spectralrange. Upon increasing the frequency, B grows, reaches a maxi-mum, decays, and saturates to a high frequency asymptote.
Figure 3. (a) Kerr constant measured as a function of the frequency ofthe applied field for aqueous solutions of Gibbsite 0.1% v/v with KCl0.1 mM (full squares), KCl 0.5 mM (open circles), and KCl 0.8 mM(full triangles). Lines are the best fit of eqs 9�13 to the high frequencypart of the spectra. (b) Kerr constant as a function of the frequency of theapplied field for aqueous suspensions with KCl 0.5 mM and Gibbsite0.1% w/v (full squares), 0.2% w/v (open circles), 0.4% (full up triangles),and 0.5% w/v (open down triangles).
Figure 4. High frequency value of the Kerr constant measured as afunction of the volume fraction ϕ of solids. The solid line is a linear fit.

255 dx.doi.org/10.1021/la2036949 |Langmuir 2012, 28, 251–258
Langmuir ARTICLE
A closer inspection clearly reveals that the decay is actually theresult of two separate processes, one taking place in the range10�100 kHz and the second in the range 1�10 MHz. The twoprocesses are distinguishable thanks to the double inflection pointdisplayed by the data, with a range ofminimum slope around 1MHz.
EBS spectra here reported for Gibbsite are analogous to thosepreviously observed for suspensions of rod-like particles. We cantranslate the analysis performed there to the present study anddistinguish three spectral ranges. In the kHz range, the particleresponse is given by the combination of both electric and viscouscomponents in the torque. In this frequency range, the hydro-dynamic torque is not negligible4,28 and can display nonmono-tonic behavior as a function of frequency.22 Furthermore, in thisfrequency range the electric torque is also complicated by thepresence of the concentration polarization, i.e., of a neutralelectrolyte gradient that modifies the electric double layer andthe induced dipole. Because of this complex combination offactors, the electrokinetic behavior of colloids in this regime hasbeen extensively studied almost exclusively in the case ofspherical particles. In the case of nonspherical particles thereare no analytical solutions for the frequency behavior of theinduced dipole at the kHz range. Approximate models are avail-able only for the characteristic times of this low frequency relaxa-tion and for the limiting frequencies of this regime (ν f 0 andν = 0.1�1 MHz).29,30
Much simpler is the behavior at frequencies larger than 100 kHz.At these frequencies the viscous torque can be neglected, and theelectric torque is not affected by concentration polarization.3,5,31,32
Therefore, eq 5 becomes correct and enables us to relate EBSspectra to the frequency dependence of the polarization anisotropyΔαe. Moreover, in this regime the effects of the double layer can betaken into account by attributing an effective surface conductanceKσ to the particles.3,5,32 Hence, the electric polarization of theparticles can be determined by using standard electrostatic ap-proaches for a dielectric-conductive body (the particle, havingconductivity Kp and permittivity εp) imbedded in a dielectric-conductive medium (the electrolyte solution, of conductivity Ks
and permittivity εs). Since this classic problem was first solvedby Maxwell,33 later applied to spheres by Wagner,34 and finallyextended to charged particles with an effective surface conductivityby O’Konski35 this regime is typically referred to as Maxwell�Wagner�O’Konski (MWO) regime. In this frequency range, thepolarization spectra exhibit a relaxation in the interval 100 kHz to10 MHz. In the low limit part of this frequency range, chargesaccumulate on both sides of the particles because of the conductiv-ity mismatch between particle and solution. For frequencies lagerthan 10MHz, conduction charges have not enough time to displaceand the residual induced dipole coefficient is due to the permittivitymismatch between particle and solution. Analysis of EBS in termsof the MWO model has been carried out in detail in the case ofprolate particles,3�5 but no analogous study is available for the caseof disk-like particles.
TheMWOelectric polarizability of platelets along their princi-pal axes is given by4,29,30,36
αea, b ¼ 4πab2
3ε0εs
K�p � K�
s
K�s þ ðK�
p � K�s ÞLa, b
ð9Þ
whereKp/ (Ks
/) are the complex conductivity of particle (medium)
K�pðsÞ ¼ KpðsÞ þ iωε0εpðsÞ
La,b are the so-called “depolarization factors” that have differentvalues for electric fields parallel vs perpendicular to the symmetryaxis of the particles.
For frequencies well-above the MWO relaxation, eq 9 sim-plifies into
αea, bð∞Þ ¼ 4πab2
3ε0εs
εp � εsεs þ ðεp � εsÞLa, b ð10Þ
In this high frequency asymptote, the particle polarizabilitydepends on the electric permittivity mismatch only, WHEREASion effects are negligible. eq 10, when combined with eq 5,enables to quantitatively discuss the high frequency asymptotemeasured by EBS. The fitting of the data in Figure 4 yields B∞/ϕ =2.9 � 10�7 m/V2. By assuming εp = 2.5 and εm = 78.5, for therelative electric permittivity of Gibbsite37 and water respectively,and by relying on the particle size determined via the TEBrelaxation, from eq 10, we obtainΔαexp
0 =�6.2� 10�35 Fm2. Byusing this value in eqs 2 and 5, we determine the saturatedbirefringence Δnsat =�0.0088, a value that cannot be comparedwith previous estimates obtained from magnetic birefringence38
since the particle size and solvent were in that case different. It isinteresting to compare the value obtained for Δnsat with thesaturated birefringence that would be calculated by assumingthe Gibbsite particles to be internally isotropic with a refrac-tive index related to the low-frequency dielectric coefficient asεp = np
2. Such an estimate leads toΔn=�0.062, a valuemarkedlydifferent fromΔnsat. This difference indicates that Gibbsite parti-cles actually have an intrinsic birefringence, a notion that appearsquite reasonable given the crystalline anisotropic structure ofthese particles.38,39 Accordingly, we assume different values ofthe refractive index along the particle symmetry axes
np;a ¼ np þ 23Δni
np;b ¼ np � 13Δni
ð11Þ
where np = (np,a + 2np,b)/3 is the average refractive index ofthe particle and Δni is its intrinsic optical anisotropy (Δni =np,a � np,b). By using again eq 10 with values of the refractiveindices depending on the particle orientation and by holdingfixed np = 1.57, we can adjust Δni so as to match Δnsat. In thisway we obtain Δni = 0.07. The intrinsic birefringence ofGibbsite particles is thus positive, the refractive index alongthe symmetry axis being larger than the one along the longaxis. This effectively lowers the overall optical anisotropy ofthe particles Δnsat since in this case shape and intrinsicbirefringence have antagonistic effects.38,39
As the frequency is lowered from the high-frequencyasymptote into the MWO relaxation range, the contributionsof ions to the particle polarizability are no longer negligible. Inorder to make a quantitative use of eq 9 to interpret the data,the particle conductivity Kp need to be expressed in terms ofthe effective surface conductivity Kσ, incorporating, in theMWO regime, the effect of the electric double layer.40 It can bedemonstrated that spheroidal particles, both oblate and pro-late, having a conductive surface behave as particles having ananisotropic bulk conductivity, i.e., with a volume conductivitythat depends on the particle orientation. For oblate particles,

256 dx.doi.org/10.1021/la2036949 |Langmuir 2012, 28, 251–258
Langmuir ARTICLE
these volume conductivities are4,5,30
Kp;a ¼ 3Kσa2bc
2b2 � a2
c2
!log
c þ ba
� �� b
c
" #
Kp;b ¼ 3Kσc2ab
� a4
2c4log
b þ ca
� �þ b
2b2 � a2
2c3
" #
c ¼ ffiffiffiffiffiffiffiffiffiffiffiffiffiffib2 � a2
p
ð12Þ
By combining eq 12 with eq 9, it is possible to determine thefrequency dependence of the two components of the polariz-ability of the particles. They are both expected to follow a Debye-type relaxation4
αea, b ¼ αe
a, bð∞Þ þ αea, bð0Þ � αe
a, bð∞Þ1 þ ð2πντa, bÞ2
ð13Þ
where τa,b are the inverse of the characteristic frequency τa,b =1/ωa,b and αa,b
e (0) is the low frequency limit of eq 9. Both quan-tities depend on the conductivity and relative electric permittivityof bothmedium and particles and on the shape and orientation ofthe particle3,4
αea, bð0Þ ¼ 4πab2
3ε0εs
Kp � Ks
Ks þ ðKp � KsÞ
La, bωa, b ¼ 1ε0
ð1� La, bÞKs þ La, bKp;a, p;b
ð1� La, bÞεs þ La, bεpð14Þ
In Figure 5a we plot the parallel and perpendicular electricpolarizability and Δαe computed for the MWO regime fromeqs 9�14 for the case of a platelet of semiaxis 7.5 and 98 nmsuspended in a electrolyte solutionwith 0.5mMKCl, and assumingan electric potential at the particle surface of ζ = 100 mV.
Analogously to was what found for prolate particles,3,4 as thefrequency increases, both the parallel and perpendicular polariz-abilities relax to a lower value with increasing frequency. Theirdifference is characterized by a dip resulting from the difference inthe relaxation frequency of the two components. The depth of thisdip strongly depends on the difference between Kp,a and Kp,b.
4 InFigure 5, panels b and c, we plotΔαe for particles of the dimensionsof Gibbsite, while varying KCl and ζ potentials, respectively. Asvisible, the relaxation time decreases with increasing the ζ potential(i.e., the surface conductivity) and with increasing KCl concentra-tion (i.e., medium conductivity).
From eq 5 we have Δα(ω) = (B(ω)/B∞)Δα(∞); hence, wecan obtain the experimental value of Δα(ω) by using eq 10 andthe experimental values of the electric birefringence. Hence, wecould in principle combine eqs 5 and 9�14 to fit the spectra inFigure 3 and extract the surface conductivity of the particles.However, this cannot be done because the dip present in thecalculated spectra is not found in the experimental data. This is anindication that the charge is probably not uniformly distributedon the surface, a situation that makes the surface conductivityinhomogeneous and thus invalidates eq 12 for the equivalentconductivities. This is analogous to what was observed bystudying the EBS response of rod-like particles in the limit oflow surface charge.7 Also in that case we interpreted the lack ofthe dip as an effect of uneven charge distribution.
We thus decided to fit the data by setting the conductivityacross the disk Kp,a= 0 and extracting the conductivity tangentialto the disk, i.e., the conductivity resulting from the ionic densityon the proximity of the flat disk surfaces. With this assumption,by fitting the data in Figure 3 we obtain Kσ = 0.35 nS (KCl0.1 mM), 0.51 nS (KCl 0.5 mM), and 0.33 nS (KCl 0.8 mM), asreported in Table 1. From these values it is possible to extract thesurface charge density, or equivalently the electrical potential atthe surface by virtue of the Bikerman equation40 that relatessurface conductivity and ζ-potential under the assumptionsthat the double layer thickness is much smaller than the particlesize and that there is no conduction in the stagnant part of thedouble layer
Kσ ¼ 2e2z2NkBTk
Dþðe�zeζ=2kBT � 1Þ 1 þ 3mþ
z2
!"
þD�ðezeζ=2kBT � 1Þ 1 þ 3m�
z2
� ��ð15Þ
In this way we obtain ζ = 100 mV (KCl 0.1 mM), 86 mV (KCl0.5 mM), and 65 mV V(KCl 0.8 mM), as reported in Table 1. Ineq 15, e is the electron charge, z is the valence of the ions in themedium, N is the salt number concentration, k is the inverse of
Table 1. Surface Conductivities and Zeta Potentials ofGibbsite Particles
system Kσ(nS) ζ (mV)
Gibbsite 0.1% +KCl 0.1 mM 0.35 ( 0.02 100 ( 2
Gibbsite 0.1% +KCl 0.5 mM 0.51 ( 0.02 85 ( 2
Gibbsite 0.1% +KCl 0.8 mM 0.326 ( 0.009 64 ( 1
Gibbsite 0.1% + PS 0.18%+KCl 0.1 mM 0.69 ( 0.04 128 ( 3
Gibbsite 0.1% + PS 0.3% + KCl 0.1 mM 0.75 ( 0.03 132 ( 2
Gibbsite 0.1% + PS 0.5% + KCl 0.1 mM 0.82 ( 0.04 136 ( 2
Gibbsite 0.1% + PS 1.0% + KCl 0.3 mM 0.93 ( 0.02 117 ( 1
Figure 5. (a) Normalized electric polarizability parallel and perpendi-cular to the particle symmetry axis and absolute value of the polarizabilityanisotropy calculated for platelets of semiaxis 7.5 and 98 nm, ζ = 100mVand 0.5 mM KCl (αi
n,e = (αie)/(4πab2ε0εs), with i = a, b). (b)
Polarizability anisotropy |Δαn,e| = |αan,eαb
n,e| calculated for KCl0.5 mM and ζ from 20 to 100 mV. The arrow indicates the directionof the increment of ζ. (c) The same as in panel b but for ζ = 100 mV andKCl from 0.1 to 1 mM. The arrow indicates the direction of increasingKCl concentration.

257 dx.doi.org/10.1021/la2036949 |Langmuir 2012, 28, 251–258
Langmuir ARTICLE
the Debye length, D+ and D� are the diffusion coefficients ofcations (anions), and m+ and m� are the dimensionless quan-tities indicating the contribution of electro-osmosis to surfaceconductivity of cations (anions). The ζ-potential values obtainedthrough this analysis are compatible with the values above-mentioned. Furthermore, these ζ-potential values agree withthe expectation that an increment of the ionic strength induces adecrease of the double layer thickness, bringing about a decreasein the electric potential.
6. ANOMALOUS EFFECT IN PLATELETS
The electrically induced birefringence of colloidal suspensionsis quite generally positive, that is n )� n^ > 0, as commonly foundexperimentally41�44 and theoretically.3,25,30 In fact, only suspen-sions with a large concentration of particles12,45 or containingparticles bearing a permanent electric dipole exhibit a negativeKerr coefficient.44 Common nonspherical particles align withtheir longest axis along the field. However, it was recently shownthat rod-like particles, even at high dilution, when dispersedtogether with charged nanospheres (whose concentration is inthe range of 1% vol.) can revert their normal orientation and alignwith their longer axis perpendicularly to the field in the limit oflow frequency electric fields.19 Such effects have been interpretedas ultimately due to solvent flow and viscous drag: the smallspheres accumulate around the spheroid asymmetrically, a situa-tion that provokes a modified electro-osmotic flow and, in turn,yielding a negative hydrodynamic torque.19,46 This effect hasbeen also shown in ref 22, through numerical computations.However, these studies on the anomalous orientation in colloidalmixtures were all restricted to elongated rod-like particles.
We have therefore investigated the behavior of the Gibbsitedisk-like particles when mixed in suspension with small sphericalparticles. Measurements performed on suspensions of sphericalparticles only indicate that the small spherical particles do notcontribute, by themselves, to the electric birefringence. The EBSspectra of the mixtures are shown in Figure 6 for differentconcentrations and ionic strength, as specified in the caption.As visible, the presence of the smaller colloids greatly affects thelow frequency part of the spectrum, driving it toward negativeKerr coefficients as the concentration of the smaller colloidsincreases.
Because the MWO section of the spectrum is, however, notsignificantly modified, we can analyze it by using the modelintroduced above and again extract the surface conductivity andzeta potential of the Gibbsite particles. The results of this methodcan be found in Table 1. We find that as the smaller particles areadded to the suspension, the ζ potential of the Gibbsite particlesincreases from 100 to 130 mV, possibly through the adsorp-tion of a fraction of them on positively charged sites on the sur-faces of the disks. As such sites are saturated, a phenomenon thatapparently takes place even at the lowest concentration hereconsidered of added small spheres, further addition of smallerspherical particles does no longer change the surface potential.We also find the expected decrease of the surface potential withionic strength.
Negative electric birefringence with static fields has also beenfound in concentrated suspension of clay12 and rod-like45 parti-cles. In our case, the suspensions are diluted with respect to clayparticles, which are the ones that provide the Kerr signal. How-ever, these suspensions are concentrated in secondary nonbire-fringent latex spheres. Hence, there is an analogy with concen-trated suspensions, which can be seen as mixtures in which therole of primary and secondary particles are played by the clayparticles themselves. This analogy suggests that the mechanismof Kerr signal inversion may be similar.
The high frequency MWO analysis confirms that, apart fromsome increase of its effective charge, the properties of Gibbsiteplatelets in the mixtures remain basically unvaried. Nevertheless,as in the case of rod-like particles, the presence of smaller spheresdramatically changes the low frequency behavior: as the con-centration of the spheres increases, the Kerr coefficient measuredat the lowest frequency decreases and eventually becomes nega-tive, indicating that in these conditions, disk-like colloidalparticles have the tendency to align with their shortest axis inthe field direction.
7. CONCLUSIONS
In this paper we present an experimental study of the electro-optic behavior of suspensions of monodisperse plate-like Gibb-site particles.
A first set of evidence was obtained through TEB, i.e., bystudying the birefringence relaxation observed after switching offthe electric field.We find that the TEB decays is well described bya single exponential function. From the characteristic time wecould extract the size of the particles, which compares well withthose measured from electron microscopy images.
We studied the electric birefringence spectra in a widefrequency range (from 0.1 kHz up to 200 MHz) of the appliedelectric field and examined the three different regimes that couldbe distinguished in the spectra.(i) The high frequency plateau of the spectra depends on the
dielectric and optical properties of the particles. From thehigh frequency asymptote we could determine that Gibb-site particles have internal optical anisotropy and, there-fore, we could quantify their intrinsic birefringence.
(ii) In the MHz-frequency range, where the electric birefrin-gence dispersion is the result of the Maxwell�Wagner-O’Konski polarization, we analyzed the data developing asuitable model that takes into account the oblate shape ofthe particles. Such a quantitative analysis enabled us todetermine the zeta potential and the surface conductivityof the Gibbsite particles for various ionic strengths.
Figure 6. Kerr constant measured as a function of the frequency of theapplied field for mixtures of Gibbsite and spherical PS particles. Fullsquares: Gibb 0.1% +KCl 0.1mM; open circles: Gibb 0.1% + PS 0.18%+KCl 0.1 mM; full triangles: Gibb 0.1% + PS 0.3% + KCl 0.1 mM; opentriangles: Gibb 0.1%+ PS 0.5%+KCl 0.1mM; full diamonds: Gibb 0.1%+PS 1.0% + KCl 0.3 mM. Lines are the best fit of eqs 9�13 to the highfrequency part of the spectra.

258 dx.doi.org/10.1021/la2036949 |Langmuir 2012, 28, 251–258
Langmuir ARTICLE
(iii) In the low-frequency part of the birefringence spectra,viscous and electric torques act on the particle leading toa complex behavior. This complexity is clearly apparentin the intriguing behavior of mixtures for which thebirefringence even becomes negative. When combinedwith the analogous behavior observed for rod�spheremixtures, this finding confirms the universality of thisanomalous orientation in mixtures containing nonsphe-rical colloids.
’AUTHOR INFORMATION
Corresponding Author*E-mail: [email protected].
’ACKNOWLEDGMENT
Financial support for this work from Junta de Andalucía, Spain(Project PE-2008-FQM-3993) is gratefully acknowledged. M.L.J.is supported by Programa Ram�on y Cajal of the Ministerio deCiencia en Innovaci�on, Spain.
’REFERENCES
(1) O’Konski, C. T. Molecular Electro-Optics; Marcel Dekker:New York, 1976.(2) Fredericq, E.; Houssier, C. Electric Dichroism and Electric Bi-
refringence; Clarendon: Oxford, U.K., 1973.(3) Saville, D. A.; Bellini, T.; Degiorgio, V.; Mantegazza, F. J. Chem.
Phys. 2000, 113, 6974–6983.(4) Bellini, T.; Mantegazza, F. Interfacial Electrokinetics and Electro-
phoresis; Delgado, A. V., Ed.; Marcel Dekker: NewYork, 2002; Chapter 14.(5) Bellini, T.; Mantegazza, F.; Degiorgio, V.; Avallone, R.; Saville,
D. A. Phys. Rev. Lett. 1999, 82, 5160–5163.(6) O’Konski, C. T.; Krause, S. J. Phys. Chem. 1970, 74, 3243–3250.(7) Mantegazza, F.; Bellini, T.; Degiorgio, V.; Delgado, A. V.; Arroyo,
F. J. J. Chem. Phys. 1998, 109, 6905–6910.(8) Watanabe, H.; Morita, A. Adv. Chem. Phys. 1984, 56, 255–409.(9) Stoylov, S. P.; Stoylova, E.; Sturm, J.; Weill, G. Biophys. Chem.
1996, 58, 157–164.(10) van der Zande, B. M. I.; Koper, G. J. M.; Lekkerkerker, H. N.W.
J. Phys. Chem. B 1999, 103, 5754–5760.(11) Dozov, I.; Paineau, E.; Davidson, P.; Antonova, K.; Baravian, C.;
Bihannic, I.; Michot, L. J. J. Phys. Chem. B 2011, 115, 7751–7765.(12) Holzheu, S.; Hoffmann, H. J. Phys. Chem. B 2002, 106,
4412–4418.(13) Bakk, A.; Fossum, J. O.; da Silva, G. J.; Adland, H. M.;
Mikkelsen, A.; Elgsaeter, A. Phys. Rev. E 2002, 65, 021407.(14) Hinds, I. C.; Ridler, P. J.; Jennings, B. R. Clay Miner. 1996,
31, 549–556.(15) Sasai, R.; Ikuta, N.; Yamaoka, K. J. Phys. Chem. 1996, 100,
17266–17275.(16) Yamaoka, K.; Peikov, V.; Sasai, R.; Stoylov, S. P. Colloids Surf. A
1999, 148, 43–59.(17) Zhivkov, A.M.; Stoylov, S. P.Colloids Surf. A 2002, 209, 315–318.(18) Shah, M. J. J. Phys. Chem. 1963, 67, 2215–2219.(19) Mantegazza, F.; Caggioni, M.; Jim�enez, M. L.; Bellini, T. Nat.
Phys. 2005, 1, 103–106.(20) Jim�enez,M. L.; Bellini, T.Curr. Opin. Colloids Interface Sci 2010,
15, 131–144.(21) Bazant, M. Z.; Squires, T. M. Curr.Opin. Colloids Interface Sci
2010, 15, 203–213.(22) Fixman, M. J. Chem. Phys. 2006, 124, 214506.(23) Wijnhoven, J. E. G. J.; van’t Zand, D. D.; van der Beek, D.;
Lekkerkerker, H. N. W. Langmuir 2005, 21, 10422–10427.(24) Wierenga, A. M.; Lenstra, T. A. J.; Philipse, A. P. Colloids Surf. A
1998, 134, 359–371.
(25) Mantegazza, F.; Bellini, T.; Buscaglia, M.; Degiorgio, V.; Saville,D. A. J. Chem. Phys. 2000, 113, 6984–6991.
(26) Degiorgio, V.; Bellini, T.; Piazza, R.; Mantegazza, F.; Goldstein,R. E. Phys. Rev. Lett. 1990, 64, 1043–1046.
(27) Pecora, R. Dynamic Light Scattering. Applications of PhotonCorrelation Spectroscopy; Plenum: New York, 1985.
(28) Teubner, M. J. Chem. Phys. 1982, 76, 5564–5573.(29) Grosse, C.; Pedrosa, S.; Shilov, V. N. J. Colloid Interface Sci.
1999, 220, 31–41.(30) Shilov, V. N.; Borkovskaja, Y. B.; Budankova, S. N. Molecular
and colloidal electro-optics; Stoylov, S. P., Stoimenova, M.V., Eds.; Taylorand Francis Group: Boca Raton, FL, 2007.
(31) Dukhin, S. S.; Shilov, V. N.Dielectric Phenomena and the DoubleLayer in Disperse Systems and Polyelectrolytes; Wiley: New York, 1974.
(32) Grosse, C. Interfacial Electrokinetics and Electrophoresis; Delgado,A.V., Ed.; Marcel Dekker: New York, 2002; Chapter 11.
(33) Maxwell, J. C. Electricity and Magnetism; Clarendon: Oxford,U.K., 1892.
(34) Wagner, K. W. Arch. Elektrotech. 1914, 2, 371–387.(35) O’Konski, C. T. J. Phys. Chem. 1960, 64, 605–619.(36) Stratton, J. A.Electromagnetic Theory; MacGraw-Hill: NewYork,
1941.(37) Rasa, M.; Philipse, A. P. Phys. Rev. E 2003, 68, 031402.(38) van der Beek, D.; Petukhov, A. V.; Davidson, P.; Ferr�e, J.; Jamet,
J. P.; Wensink, H. H.; Vroege, G. J.; Bras, W.; Lekkerkerker, H. N. W.Phys. Rev. E 2006, 73, 041402.
(39) Verhoeff, A. A.; Brand, R. P.; Lekkerkeker, H. N. W.Mol. Phys.2011, 109, 1363–1371.
(40) Lyklema, J. Fundamentals of Interface and Colloid Science, Vol. II:Solid-Liquid Interfaces; Academic Press: New York, 1995.
(41) Batchelor, P.; Meeten, G. H.; Maitland, G. C. J. Colloid InterfaceSci. 1987, 117, 360–365.
(42) Bellini, T.; Piazza, R.; Sozzi, C.; Degiorgio, V. Europhys. Lett.1988, 7, 561–565.
(43) Degiorgio, V.; Mantegazza, F.; Giardini, M.; Piazza, R.; Bellini,T. J. Phys. IV 1993, 3, 129–142.
(44) Stoylov, S. P. Colloid Electro-Optics; Academic: London, 1991.(45) Kramer, H.; Degglemann, M.; Graf, C.; Hagenb€uchle, M.;
Johner, C.; Weber, R. Macromolecules 1992, 25, 4325–4328.(46) Fornasari, L.; Mantegazza, F.; Jim�enez, M. L.; Buscaglia, M.;
Bellini, T. Phys. Rev. E 2009, 79, 060401(R).


