Embed Size (px)
Citation preview
REE Financial Performance
October 2013
Munich, Nov 15, 2013
EOR -
Enhanced Oil Recovery
Introduction to Linde’s EOR/EGR living examples
Alessandro GorlaGasWorld
Dubai, Dec 5th, 2013
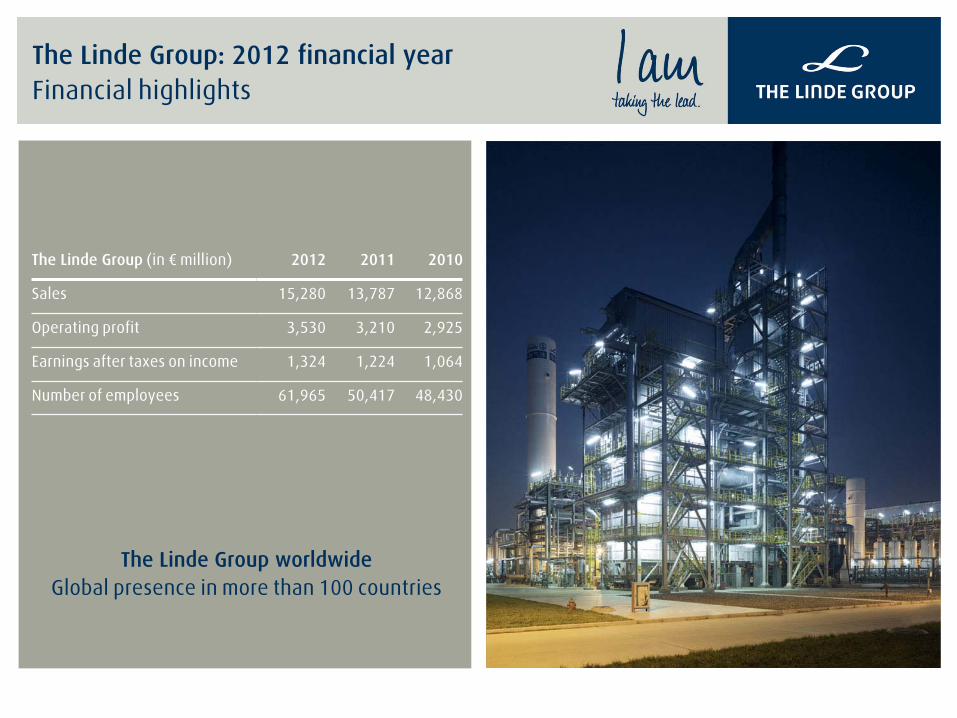
The Linde Group: 2012 financial year
Financial highlights
The Linde Group
(in €
million) 2012 2011 2010
Sales 15,280 13,787 12,868
Operating profit 3,530 3,210 2,925
Earnings after taxes on income 1,324 1,224 1,064
Number of employees 61,965 50,417 48,430
The Linde Group worldwide
Global presence in more than 100 countries
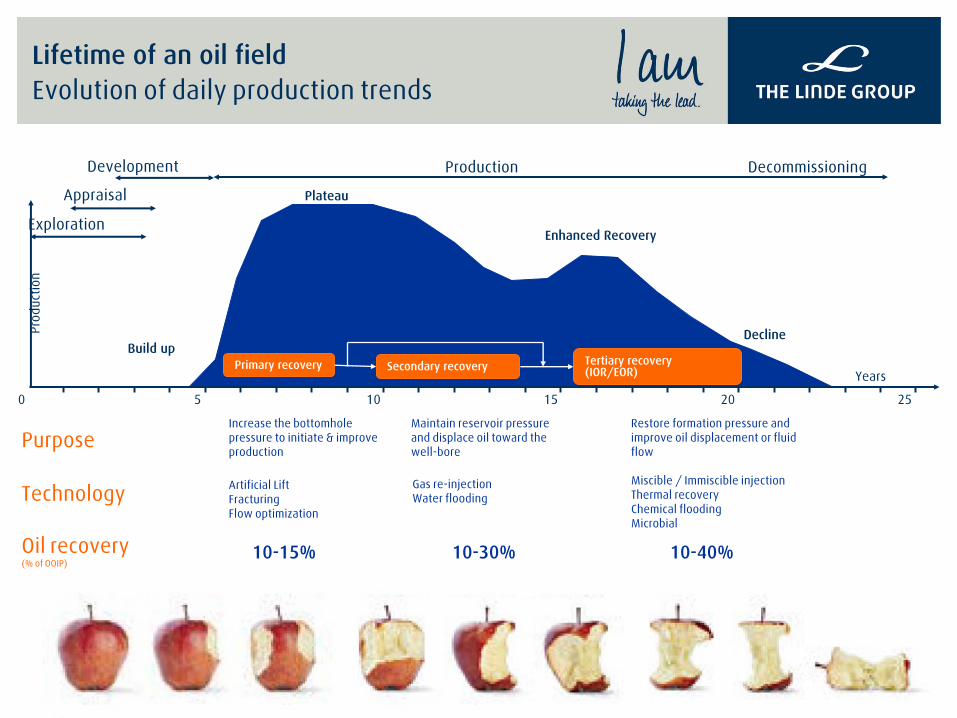
Build up
Plateau
Enhanced Recovery
Decline
Exploration
Appraisal
Development Production Decommissioning
Prod
uctio
n
Years
0 5 10 15 20 25
Primary recovery Secondary recovery Tertiary recovery(IOR/EOR)
Increase the bottomhole
pressure to initiate & improve production
Maintain reservoir pressure and displace oil toward the well-bore
Restore formation pressure and improve oil displacement or fluid flow
Purpose
Technology
Oil recovery(% of OOIP)
Artificial LiftFracturingFlow optimization
Gas re-injectionWater flooding
Miscible / Immiscible injectionThermal recoveryChemical floodingMicrobial
10-15% 10-30% 10-40%
Lifetime of an oil field
Evolution of daily production trends
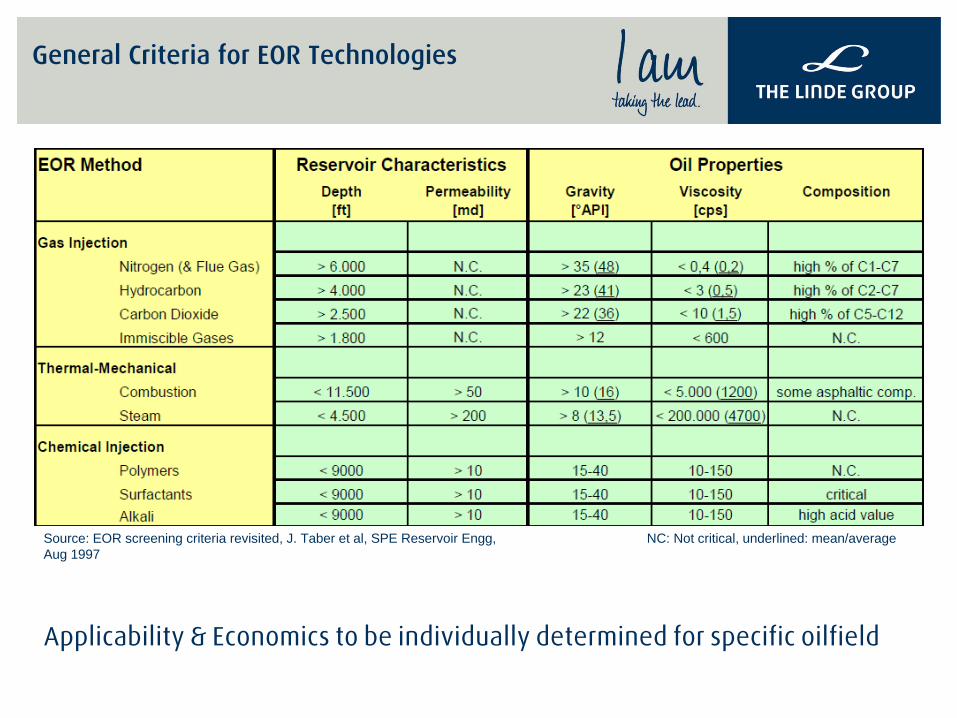
NC: Not critical, underlined: mean/averageSource: EOR screening criteria revisited, J. Taber et al, SPE Reservoir Engg, Aug 1997
Applicability & Economics to be individually determined for specific oilfield
General Criteria for EOR Technologies
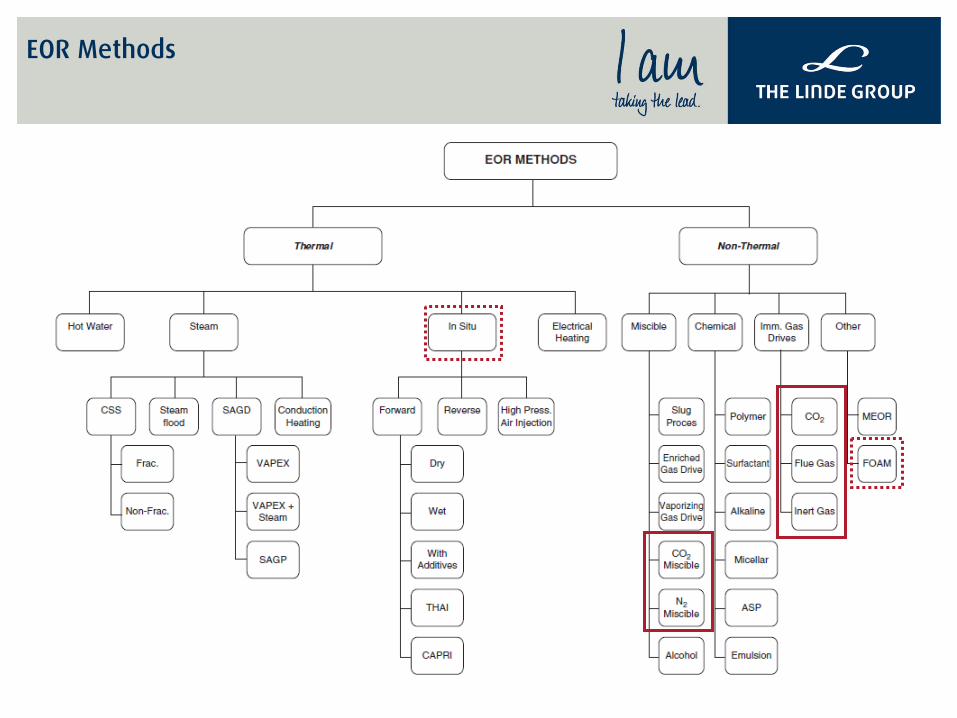
EOR Methods
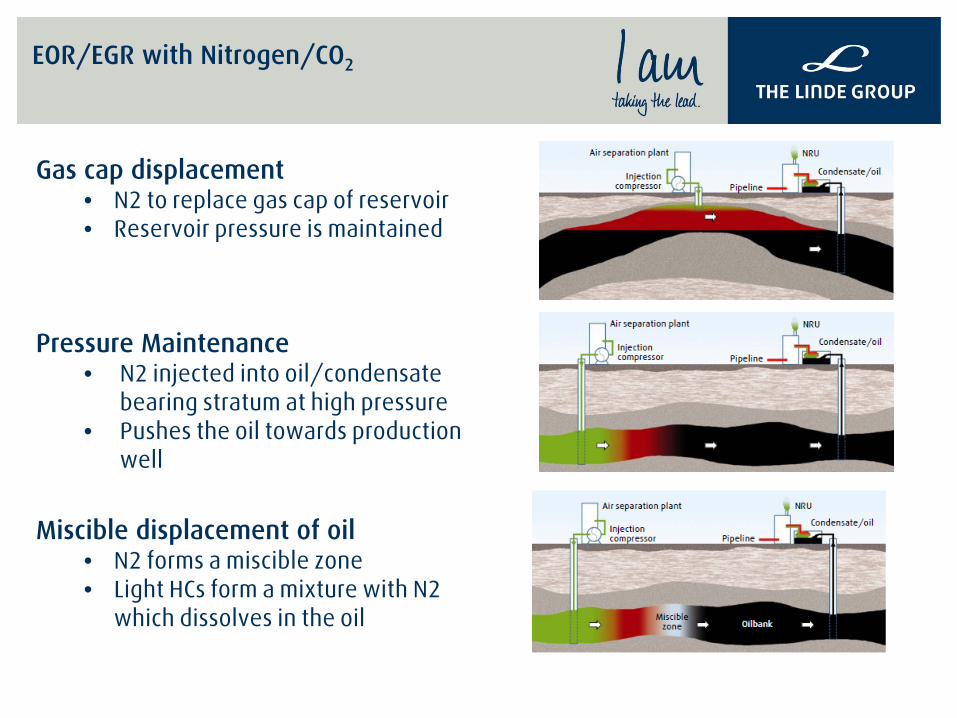
Gas cap displacement• N2 to replace gas cap of reservoir• Reservoir pressure is maintained
Pressure Maintenance• N2 injected into oil/condensate
bearing stratum at high pressure• Pushes the oil towards production
well
Miscible displacement of oil• N2 forms a miscible zone• Light HCs
form a mixture with N2 which dissolves in the oil
EOR/EGR with Nitrogen/CO2
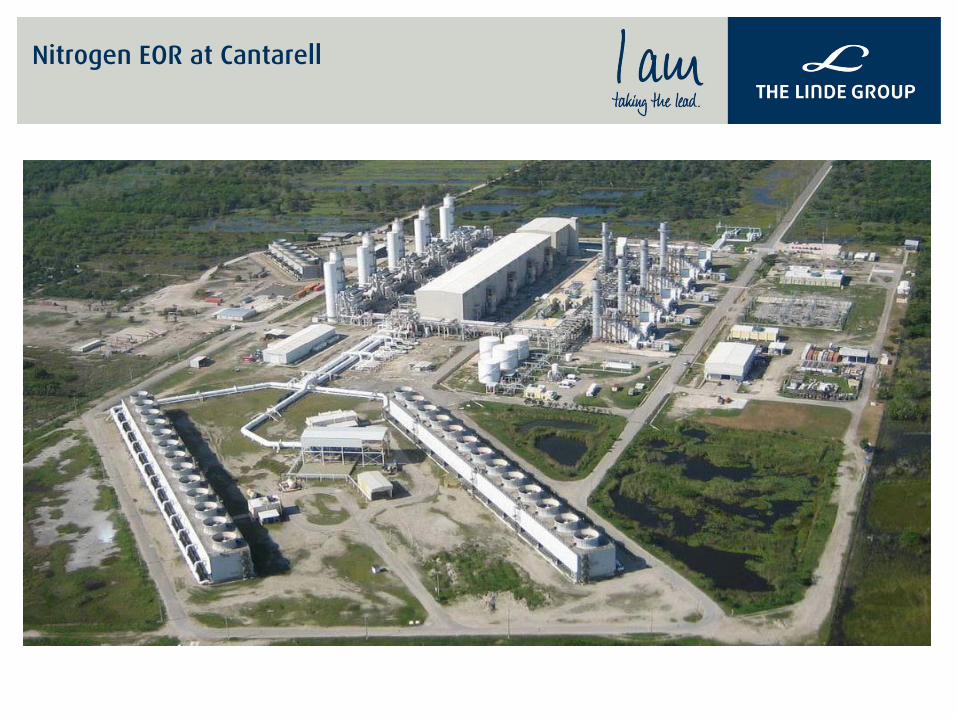
Nitrogen EOR at Cantarell
DOS BOCASDOS BOCASESCALA GRAFICAESCALA GRAFICA
KAXKAX--11UECHUECH
KABKAB--101101
SINANSINAN101A101A1A1A
YUMYUM--22401401
MAYMAY--11
MISONMISON--11
KIXKIX--11KIXKIX--22
YAXCHEYAXCHE--11
00 30 Km30 Km
CIUDAD DELCIUDAD DELCARMEN CARMEN
OCHOCH POLPOLBATABBATAB
TOLOCTOLOCCAANCAAN
CHUCCHUC
200 m.200 m.
100 m.100 m.
50 m.50 m.
25 m.25 m.
IXTALIXTAL
MALOOBMALOOB--103103
ZAAPZAAP--11KUKU
LUMLUM--11BACABBACAB
IXTOCIXTOC--11TARATUNICHTARATUNICH
301301201201
10110111
ABKATUNABKATUN
EKEKBALAMBALAM
FRONTERAFRONTERA
TAKINTAKIN
22--BB
620620500500 540540 580580460460
21302130
21702170
20902090
20502050
75 km75 km
KutzKutzAkalAkalNohochNohochChacChacCANTARELLCANTARELL
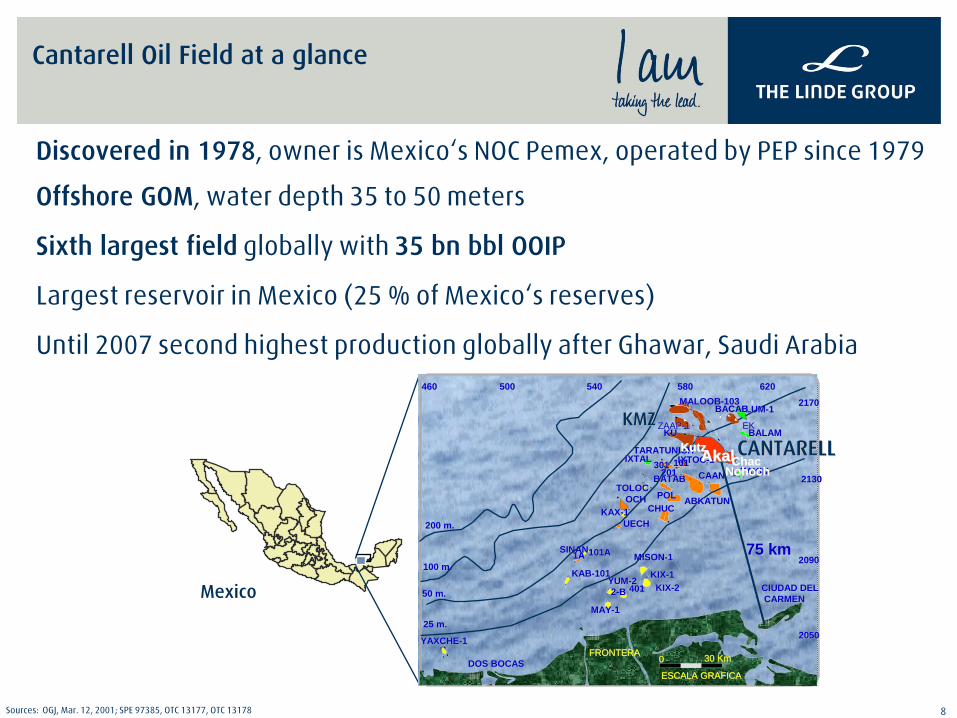
Discovered in 1978, owner is Mexico‘s NOC Pemex, operated by PEP since 1979
Offshore GOM, water depth 35 to 50 meters
Sixth largest field
globally with 35 bn bbl OOIP
Largest reservoir in Mexico (25 % of Mexico‘s reserves)
Until 2007 second highest production globally after Ghawar, Saudi Arabia
KMZKMZ
Mexico
Sources: OGJ, Mar. 12, 2001; SPE 97385, OTC 13177, OTC 13178 8
Cantarell
Oil Field at a glance
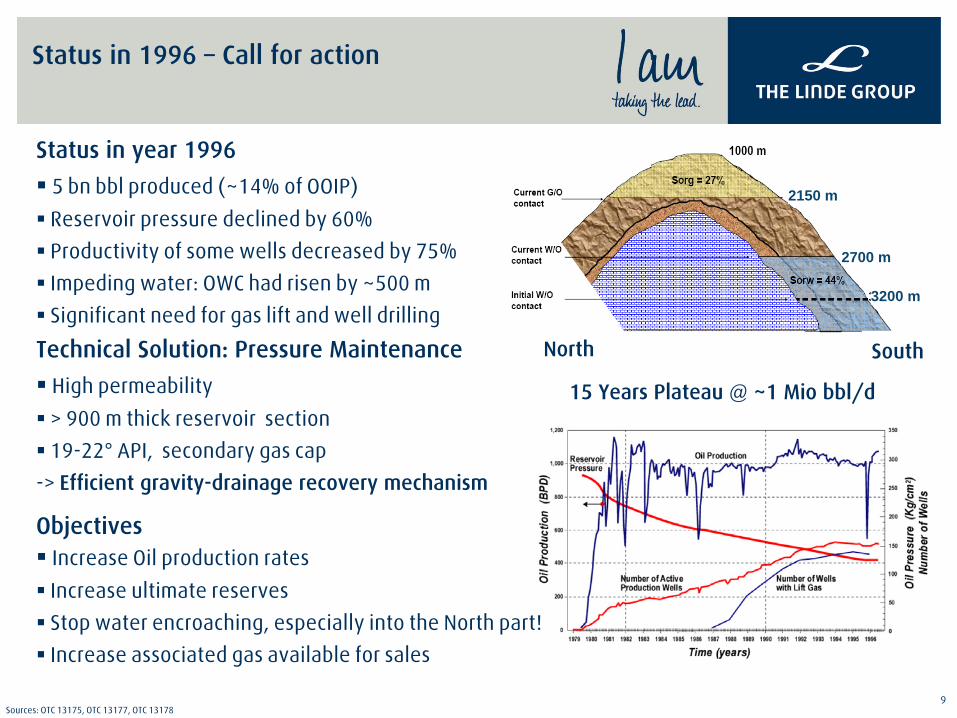
3200 m
2700 m
2150 m
North South
Sources: OTC 13175, OTC 13177, OTC 131789
Status in year 1996 5 bn bbl produced (~14% of OOIP)
Reservoir pressure declined by 60% Productivity of some wells decreased by 75% Impeding water: OWC had risen by ~500 m Significant need for gas lift and well drilling
Technical Solution: Pressure Maintenance High permeability
> 900 m thick reservoir section 19-22° API, secondary gas cap -> Efficient gravity-drainage recovery mechanism
Objectives Increase Oil production rates
Increase ultimate reserves Stop water encroaching, especially into the North part! Increase associated gas available for sales
15 Years Plateau @ ~1 Mio bbl/d
Status in 1996 –
Call for action
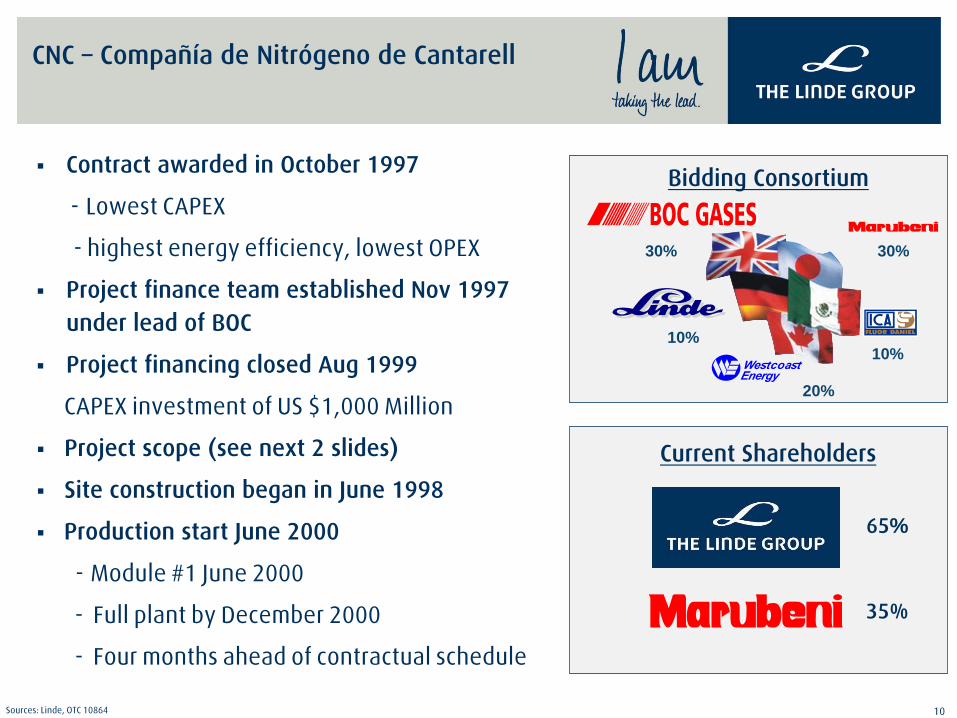
Contract awarded in October 1997
-
Lowest CAPEX
-
highest energy efficiency, lowest OPEX
Project finance team established Nov 1997 under lead of BOC
Project financing closed Aug 1999
CAPEX investment of US $1,000 Million
Project scope (see next 2 slides)
Site construction began in June 1998
Production start June 2000
-
Module #1 June 2000
-
Full plant by December 2000
-
Four months ahead of contractual schedule
30%
10%
20%
10%
30%
Bidding
Consortium
Current
Shareholders
35%
65%
Sources: Linde, OTC 10864 10
CNC –
Compañía de Nitrógeno
de Cantarell
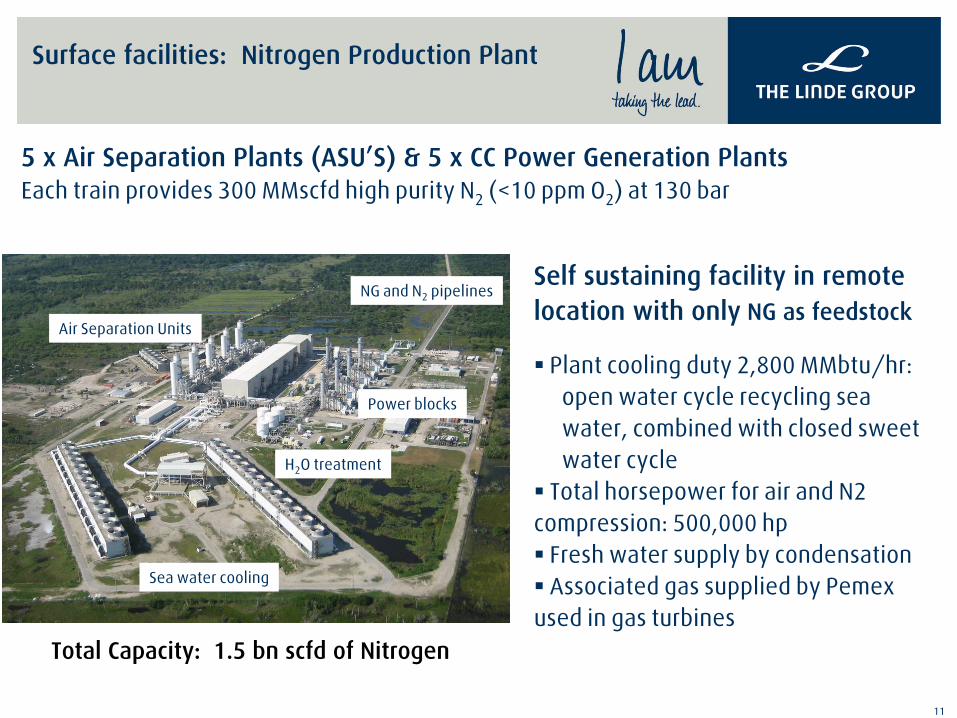
Self sustaining facility in remote location with only
NG as feedstock
Plant cooling duty 2,800 MMbtu/hr:open water cycle recycling sea water, combined with closed sweet water cycle
Total horsepower for air and N2 compression: 500,000 hp Fresh water supply by condensation
Associated gas supplied by Pemex used in gas turbines
5 x Air Separation Plants (ASU’S) & 5 x CC Power Generation PlantsEach train provides 300 MMscfd
high purity N2
(<10 ppm
O2
) at 130 bar
11
Air Separation Units
Power blocks
Sea water cooling
H2
O treatment
NG and N2
pipelines
Total Capacity: 1.5 bn
scfd
of Nitrogen
Surface facilities: Nitrogen Production Plant
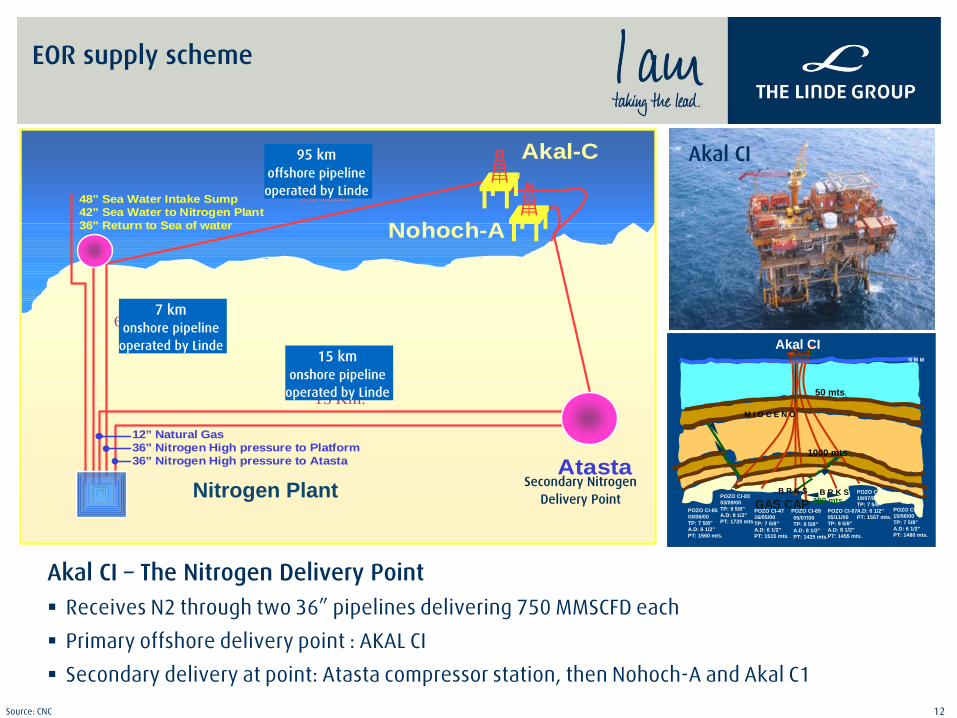
Atasta
Nohoch-A
Akal-C
12” Natural Gas36” Nitrogen High pressure to Platform36” Nitrogen High pressure to Atasta
6.9 Km.6.9 Km.
95 Km.95 Km.
15 Km.15 Km.
48” Sea Water Intake Sump42” Sea Water to Nitrogen Plant36” Return to Sea of water
Nitrogen Plant
95 km offshore pipeline operated by Linde
15 km onshore pipeline
operated by Linde
7 km onshore pipeline
operated by Linde
Secondary Nitrogen Delivery Point
Source: CNC 12
M I O C E N O
B R K S B R K S
N M M
50 mts.
POZO CI-8303/09/00TP: 9 5/8”A.D: 8 1/2”PT: 1720 mts.
GAS CAPPOZO CI-4919/07/00TP: 7 5/8”A.D: 6 1/2”PT: 1557 mts.
POZO CI-8503/06/00TP: 7 5/8”A.D: 6 1/2”PT: 1560 mts.
POZO CI-4716/05/00TP: 7 5/8”A.D: 6 1/2”PT: 1515 mts.
POZO CI-6705/11/00TP: 9 5/8”A.D: 8 1/2”PT: 1455 mts.
POZO CI-8715/06/00TP: 7 5/8”A.D: 6 1/2”PT: 1480 mts.
POZO CI-69
1000 mts.
100 mts.
05/07/00TP: 9 5/8”A.D: 8 1/2”PT: 1425 mts.
Akal CI
Akal CI –
The Nitrogen Delivery Point Receives N2 through two 36”
pipelines delivering 750 MMSCFD each
Primary offshore delivery point : AKAL CI
Secondary delivery at point: Atasta
compressor station, then Nohoch-A and Akal C1
Akal CI
EOR supply scheme
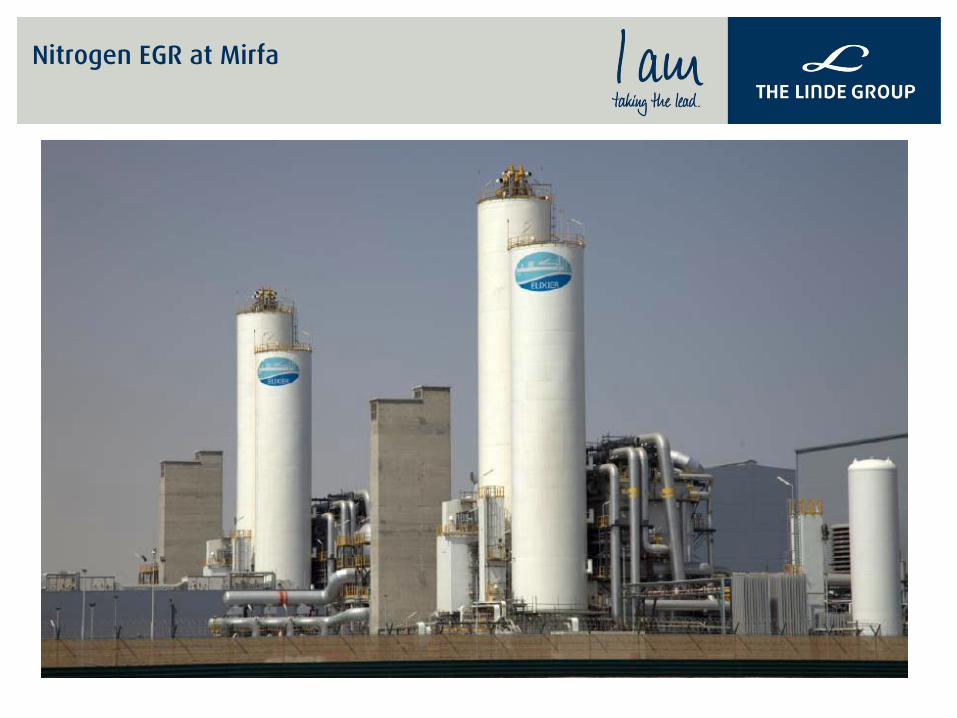
Nitrogen EGR at Mirfa
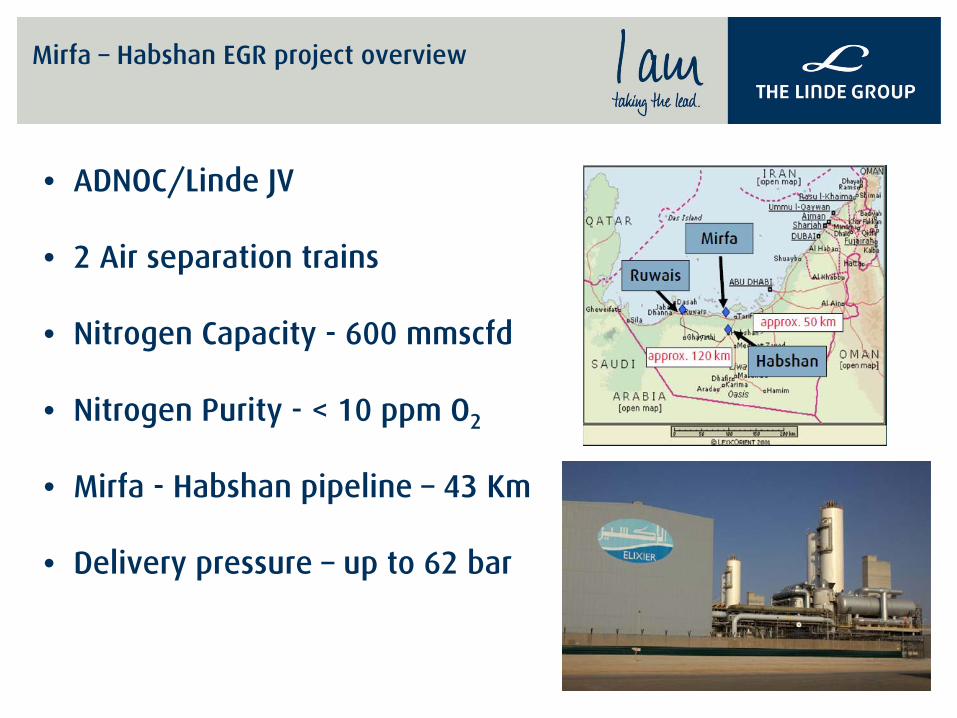
• ADNOC/Linde
JV
• 2 Air separation trains
• Nitrogen Capacity -
600 mmscfd
• Nitrogen Purity -
< 10 ppm
O2
• Mirfa
-
Habshan
pipeline –
43 Km
• Delivery pressure –
up to 62 bar
Mirfa
–
Habshan
EGR project overview
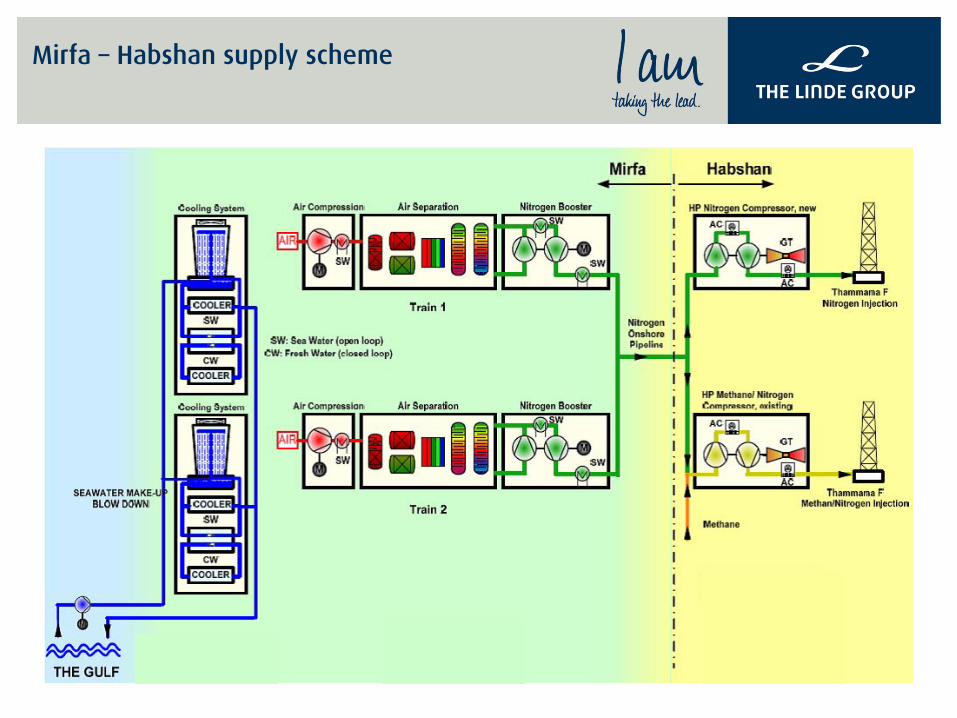
Mirfa
–
Habshan
supply scheme
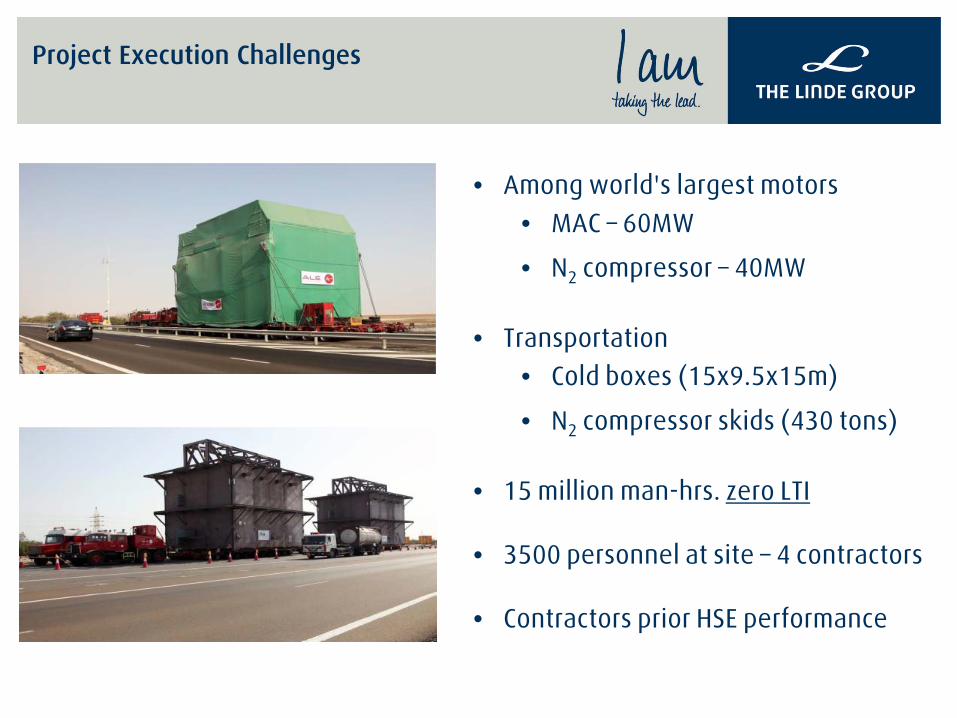
• Among world's largest motors• MAC –
60MW
• N2
compressor –
40MW
• Transportation • Cold boxes (15x9.5x15m)
• N2
compressor skids (430 tons)
• 15 million man-hrs. zero LTI
• 3500 personnel at site –
4 contractors
• Contractors prior HSE performance
Project Execution Challenges
Questions?


![[Steroid drugs and GM-CSF modulates activity of Egr-1 in glioma cells]](https://img.pdfslide.net/doc/110x75/634ba973e2b881b8bf020038/steroid-drugs-and-gm-csf-modulates-activity-of-egr-1-in-glioma-cells.jpg)


