Embed Size (px)
Citation preview

This article appeared in a journal published by Elsevier. The attachedcopy is furnished to the author for internal non-commercial researchand education use, including for instruction at the authors institution
and sharing with colleagues.
Other uses, including reproduction and distribution, or selling orlicensing copies, or posting to personal, institutional or third party
websites are prohibited.
In most cases authors are permitted to post their version of thearticle (e.g. in Word or Tex form) to their personal website orinstitutional repository. Authors requiring further information
regarding Elsevier’s archiving and manuscript policies areencouraged to visit:
http://www.elsevier.com/copyright

Author's personal copy
Enhanced persistence of natural super-hydrophilicity in TiO2–SiO2 compositethin films deposited via a sol–gel route
M. Houmard a,b,*, D. Riassetto b, F. Roussel c, A. Bourgeois d, G. Berthomé a, J.C. Joud a, M. Langlet b
a SIMaP (Grenoble Institute of Technology), BP 75, 38402 Saint Martin d’Hères, Franceb LMGP (Grenoble Institute of Technology), Minatec, BP 257, 38016 Grenoble Cedex 1, Francec CMTC (Grenoble Institute of Technology), BP 75, 38402 Saint Martin d’Hères, Franced SOPRA-SA, 26 rue Pierre Joigneaux, 92270 Bois Colombes, France
a r t i c l e i n f o
Article history:Received 2 July 2008Accepted for publication 4 September 2008Available online 18 September 2008
Keywords:Super-hydrophilicityTiO2–SiO2 thin filmsSol–gel processSelf-cleaning surface
a b s t r a c t
TiO2–SiO2 composite thin films have been deposited via a sol–gel route. Their morphological, physico-chemical, and wettability properties have been studied. It is shown that composite films exhibit an unex-pected natural super-hydrophilicity that persists with time in the absence of any UV light exposure.Depending on the experimental conditions, this natural super-hydrophilicity can persist for at least eightweeks in ambient aging conditions. Such a property allows envisaging applications to surfaces withenhanced cleanability in atmospheres where UV light is not permanently present. It is shown that naturalcarbon contamination does not preponderantly influence the persistent super-hydrophilicity of TiO2–SiO2 composite films. This property is then studied and discussed with respect to the film morphologicaland physico-chemical properties.
� 2008 Elsevier B.V. All rights reserved.
1. Introduction
Titanium oxide, preferentially in its anatase polymorphic form,exhibits a photo-induced super-hydrophilicity, i.e., a surface show-ing a water contact angle of zero or near zero degree under UVexposure [1,2]. Therefore, after UV exposure, pollutant adsorbedon a TiO2 coated surface can easily be rinsed by water, withoutthe need of any detergent, resulting in a so-called ‘self-cleaning’surface or, more realistically speaking, a surface with enhancedcleanability. However, the photo-induced super-hydrophilicity ofTiO2 rapidly vanishes when the surface is stored in the absenceof UV [1]. Consequently, TiO2 films, which have already been com-mercialized for outdoor applications under sunlight UV, are notreally adapted when the UV radiation is not permanent, as in in-door conditions. We have recently shown that this limitation canpartially be overcome via the addition of a silica component incrystalline TiO2 films [3,4]. Resulting TiO2–SiO2 composite filmsnot only exhibit an unexpected natural super-hydrophilicity, with-out UV need, but this property can also persist for a long time inthe absence of any UV light. It is known that TiO2–SiO2 compositeshave a strong catalytic power [5–15] and this property is oftenattributed to deprotoned TiO�x and/or protoned SiOþx unitiesformed at granular interfaces of such composites. As proposed inour previous papers, these charged unities may in turn favour a
molecular or dissociative water adsorption, which would induceenhanced wettability properties leading to a natural and persistentsuper-hydrophilicity of TiO2–SiO2 composite films [3,4]. We haveshown that such a natural and persistent super-hydrophilicitycan also be observed in SiO2/TiO2 or TiO2/SiO2 bi-layer films [16].This observation suggests that TiO�x and/or SiOþx unities may alsobe formed at planar TiO2–SiO2 interfaces. Since the electrical neu-trality of the whole bi-layer film must be satisfied, interfacialcharge imbalances created at TiO2–SiO2 interfaces should be com-pensated for by counter charges at the bi-layer film outer surface.So-formed negative or positive surface charges would in turnfavour the molecular or dissociative water adsorption yielding anatural and persistent super-hydrophilicity. Furthermore, whenTiO2–SiO2 composite films are deposited from a TiO2 crystallinesuspension, they include a crystalline TiO2 component that makesthem photo-active, i.e., such films exhibit a photocatalytic activity[3]. Thus, once super-hydrophilic properties start to disappear overfilm aging, owing to a progressive carbon contamination, thephoto-activity of composite films allows an easy super-hydrophi-licity photo-regeneration through a rapid UV light exposure yield-ing photocatalytic decomposition of the carbon contamination. It isthus inferred that an ideal composite film should (i) be composedof TiO2–SiO2 granular interfaces that yield natural and persistentsuper-hydrophilic properties and (ii) exhibit an optimal TiO2
content that yields an efficient super-hydrophilicity photo-regen-eration. Beside granular interface effects, other physico-chemicaland structural properties can also influence wettability proper-ties of TiO2–SiO2 composite films. In particular, morphological
0039-6028/$ - see front matter � 2008 Elsevier B.V. All rights reserved.doi:10.1016/j.susc.2008.09.016
* Corresponding author. Address: SIMaP (Grenoble Institute of Technology), BP75, 38402 Saint Martin d’Hères, France.
E-mail address: [email protected] (M. Houmard).
Surface Science 602 (2008) 3364–3374
Contents lists available at ScienceDirect
Surface Science
journal homepage: www.elsevier .com/locate /susc
Author's personal copy
properties (surface roughness, open porosity) are an important as-pect to consider. In a previous work, composite films with 80 TiO2–20 SiO2 molar composition were deposited from a TiO2 anatasecrystalline suspension and SiO2 polymeric sols of various formula-tions [4]. We showed that varying the sol formulation influencedthe formation mechanisms of composite films, together with theirmorphological and wettability properties. However, no clear corre-lation could be evidenced between morphology and wettability. Inthe present work, our studies have been extended to a wider rangeof TiO2–SiO2 compositions. Morphological and physico-chemicalproperties of derived composite films have been studied with re-spect to sol formulations. Persistence of the natural super-hydro-philicity is discussed in relation to surface physico-chemical andmorphological properties.
2. Experimental
2.1. Preparation of TiO2–SiO2 solutions and composite films
Silica–titania composite films containing 20, 40, 60 and 80 mol%of SiO2 were deposited from mixtures of a TiO2 anatase crystallinesuspension and polymeric SiO2 solutions. A polymeric mothersolution (MS) was first prepared by mixing tetraisopropyl orthoti-tanate (TIPT) with deionised water, hydrochloric acid, and absoluteethanol as a solvent [17]. TIPT concentration in the solution was0.4 M, and the TIPT/H2O/HCl molar composition was 1/0.82/0.13.The solution was aged at room temperature for two days beforeuse. Then, a crystalline suspension (CS) of TiO2 nano-crystallitesin absolute ethanol was prepared from the MS using a multi-stepprocedure that has been previously detailed [18]. Briefly, the MSwas firstly diluted in an excess of deionised water (H2O/TIPT molarratio of 90) and autoclaved at 130 �C for 6 h. Autoclaving yieldedthe crystallization of TiO2 particles diluted in the aqueous medium.An exchange procedure was then performed in order to removewater from the sol and to form a CS in absolute ethanol. The finalTiO2 concentration in ethanol was 0.24 M. The CS was composed ofTiO2 nano-particles crystallized in the anatase phase with a diam-eter of about 5–6 nm [3]. Previous works have shown that CS prep-aration conditions give rise to a very stable sol, which indicatesthat no significant crystal aggregation takes place during aging atroom temperature [18]. Consequently, this suspension can bestored for several weeks before being used for pure TiO2 film depo-sition or TiO2–SiO2 composite sol preparation. In parallel, poly-meric silica sols with different formulations were elaboratedfrom tetraethoxysilane (TEOS), following a previously publishedprocedure [4]. Four silica sols, labelled S1 to S4, have been formed,whose sol–gel formulations are declined in Table 1. Finally, S1–S4sols were mixed in 20, 40, 60 and 80 Si/(Si + Ti) molar ratios withthe crystalline suspension, yielding TiO2–SiO2 solutions whichwere used for composite film deposition.
Mixed sols were stirred for 30 min, after what film depositionwas performed on (100) silicon wafers by spin-coating (300 lLof sol, spin-speed of 3000 rpm) at room temperature. Prior deposi-tion, the substrates were cleaned with ethanol, then dried with airspray. As deposited films were then heat-treated for 2 h at 500 �C.Thicknesses of resulting composite films varied between ca. 30 and
70 nm, depending on the formulation of the silica sol. These thick-ness variations are primarily related to differences in silica sol con-centration (S1 compared to S2, S3 and S4). They can also beinduced by modifications in the rheology of mixed sols, in relationto their formulation, and by porosity effects, which will be dis-cussed in next parts of this article. For comparison, pure TiO2 andSiO2 films were also deposited from the pure CS and a pure S1 silicasol, respectively, and subsequently annealed for 2 h at 500 �C be-fore study. In following sections, films Sx-X will correspond to filmsdeposited from a sol Sx (where x = 1–4) with a Si/(Si + Ti) ratio of Xmol%.
2.2. Characterizations
2.2.1. Wettability measurementsSurface hydrophilicity of the films was quantified from mea-
surements of the water contact angle. Experiments wereperformed at 20 �C within an environmental chamber using aKRUSS G 10 goniometer connected with a video camera. Severaldeionised water droplets (pH 5.7) of 0.5 lL volume were spreadon the samples and water contact angles were measured at differ-ent points on the thin film surface for statistical purpose. Then,samples were stored in the dark under ambient conditions in openatmosphere. Over aging, water contact angles were periodicallymeasured using the previously mentioned statistical procedure inorder to study the effects of natural aging on the film wettability.
2.2.2. X-ray photoelectron spectroscopySurface analysis was performed by X-ray photoelectron spec-
troscopy (XPS) using a XR3E2 apparatus from Vacuum Generatoremploying an Mg Ka source (1253.6 eV). The X-ray source wasoperated at 15 kV for a current of 20 mA. Before collecting data,the samples were put in equilibrium for 12 h in an ultra high vac-uum chamber (10�10 mbar) to control desorption time under vac-uum of the studied samples. Photoelectrons were collected by ahemispherical analyzer at a constant take-off angle of 90�. Spectrawere calibrated with respect to the C1s peak at 284.6 eV. O1s, Ti2p
and Si2p peaks were empirically deconvoluted according to a previ-ously published procedure [3]. Deconvolutions were performedusing a 10% Lorentzian/Gaussian function after subtraction of thebackground by the Shirley method. Full widths at half maximum(FWHM) of composite films were fixed equal to those depictedfor pure TiO2 or SiO2 films. The O1s peak of composite films wasdeconvoluted into two components, namely a TiO2 and a SiO2 com-ponent, whose FWHM were fixed at 1.5 ± 0.1 eV and 1.9 ± 0.2 eV,respectively. Binding energies of these components were subse-quently compared to those of peaks measured for pure TiO2 andSiO2 films, located at 529.8 eV and 532.9 eV, respectively. TheTi2p peak could be deconvoluted into two Ti4+ and Ti3+ compo-nents. However, these deconvolutions showed that the Ti3+ contri-bution was extremely weak (around 2%) for pure TiO2 as well ascomposite TiO2–SiO2 films, and this contribution will be neglectedin this study. The Si2p was rigorously described by one unique Si4+
component. The FWHM of the Ti4+ (Ti2p) and Si4+ (Si2p) componentswere fixed at 1.3 ± 0.1 eV and 2 ± 0.2 eV, respectively, and bindingenergies of these peaks measured for composite films were com-pared to those measured for pure TiO2 and SiO2 films, located at458.5 and 103.6 eV, respectively.
2.2.3. Open porosity assessmentOpen porosity of the films was studied by an ellipsometric
porosimetry at atmospheric (EPA) pressure method using a com-mercially available device (EPA SOPRA). This device relies on thecoupling of a pressure controlled chamber and a spectroscopicellipsometer. Experimental set-up and exploitation procedures in-volved in the EPA method have been fully detailed in a previously
Table 1Formulation of silica sols S1, S2, S3 and S4: TEOS concentration (C), pH and H2O/TEOSmolar ratio (Rw)
Silica sol C (mol/L) pH Rw
S1 1.5 3.5 2.2S2 0.24 3.5 2.2S3 0.24 3.5 1S4 0.24 2 0.5
M. Houmard et al. / Surface Science 602 (2008) 3364–3374 3365

Author's personal copy
published article [19]. It has been shown that this method is partic-ularly well adapted to the characterization of mesoporous thinfilms with a pore size in the 2–30 nm range. Briefly, the methodis based on adsorption–desorption isotherms associated with cap-illary condensation of water when a porous sample is exposed to acontinuous flux of air with a fixed partial pressure of water. Duringthe adsorption sequence, the partial pressure of wet air increasesand water progressively fills open porosity of the sample while,during the desorption sequence, condensed water is progressivelyreleased from the pores. The experimental device yields a fast par-tial pressure equilibration at each adsorption–desorption step,which allows performing an ellipsometric measurement of the filmthickness and complex expression of the refractive index at eachpoint of the isotherm. At each point, the volume of water adsorbedin the pores is calculated using a self-consistent Lorentz–Lorenzeffective medium approximation (EMA) model. This model allowsa determination of the relative volumetric fraction of adsorbedwater (Vwater/Vfilm in vol%) from the experimentally measured com-plex expression of the refractive index. The Vwater/Vfilm value de-duced when all mesopores are filled with water finally yields adetermination of the volume fraction occupied by open pores inthe film. This procedure has been successfully used to depictporosity variations in our composite films [4]. Analysis of theadsorption–desorption isotherms also gives an insight of the poresize distribution (PSD) [19]. This analysis is based on an exploita-tion of the Kelvin equation. Basically, this equation relates the par-tial pressure of water at which the capillary condensation occurs,which is characterized by a rapid variation of the adsorbed wateramount, to the radius of curvature of the meniscus in the pores.An adaptation of this equation, which accounts for the pore shape,finally yields a determination of the characteristic pore dimen-sions. In this study, open porosity of our films has been consideredto consist in pores of radius rp interconnected by necks of smallerradius rn. Since the effective radius of curvature of the condensedwater meniscus is different during adsorption and desorption se-quences, adsorption–desorption isotherms usually produce a hys-teresis loop. The adsorption branch of the loop is related tocapillary condensation in the pores, while the desorption branchis associated with capillary evaporation from the necks. As previ-ously discussed, analysis of the isotherms yielded an accurate esti-mation of the size distribution for both the pores and necks presentin our composite films [4].
2.2.4. Total porosity assessmentThe film refractive indices were measured by ellipsometry with
a Gaertner L116B ellipsometer operating at 633 nm wavelength.The total volume porosity (P in vol%) was then derived from refrac-tive index values using the Lorentz–Lorenz relationship (1) [20]:
1� p=100 ¼ ðn2Þ=ðN2i � 1Þ � ðN2
i þ 2Þ=ðn2 þ 2Þ ð1Þ
where n is the measured refractive index of the film and Ni accountsfor the refractive index of the bulk material: N1 = 2.50 for anataseTiO2, N2 = 1.45 for SiO2, and Nc for a bulk composite of givenTiO2–SiO2 composition. It has been considered that the refractiveindex of a bulk composite is described by a Lorentz–Lorenz mixinglaw (2) [21]:
ðN2c �1Þ=ðN2
c þ2Þ¼ f1ðN21�1Þ=ðN2
1þ2Þþ f2ðN22�1Þ=ðN2
2þ2Þ ð2Þ
where f1 and f2 are the molar fractions of TiO2 and SiO2 in the com-posite film, respectively.
2.2.5. Morphological studiesThe film morphology was characterized by surface imaging and
RMS roughness measurements using an atomic force microscope
(AFM, digital instrument nanoscope multimode) in tapping mode.RMS roughness values were estimated by spectral analysis on1 lm2 areas. Surface imaging was also performed by field emissiongun-scanning electron microscopy (FEG-SEM) using a ZEISS Ultra55 microscope operated at 4 kV.
3. Results and discussion
3.1. Surface chemistry of composite films
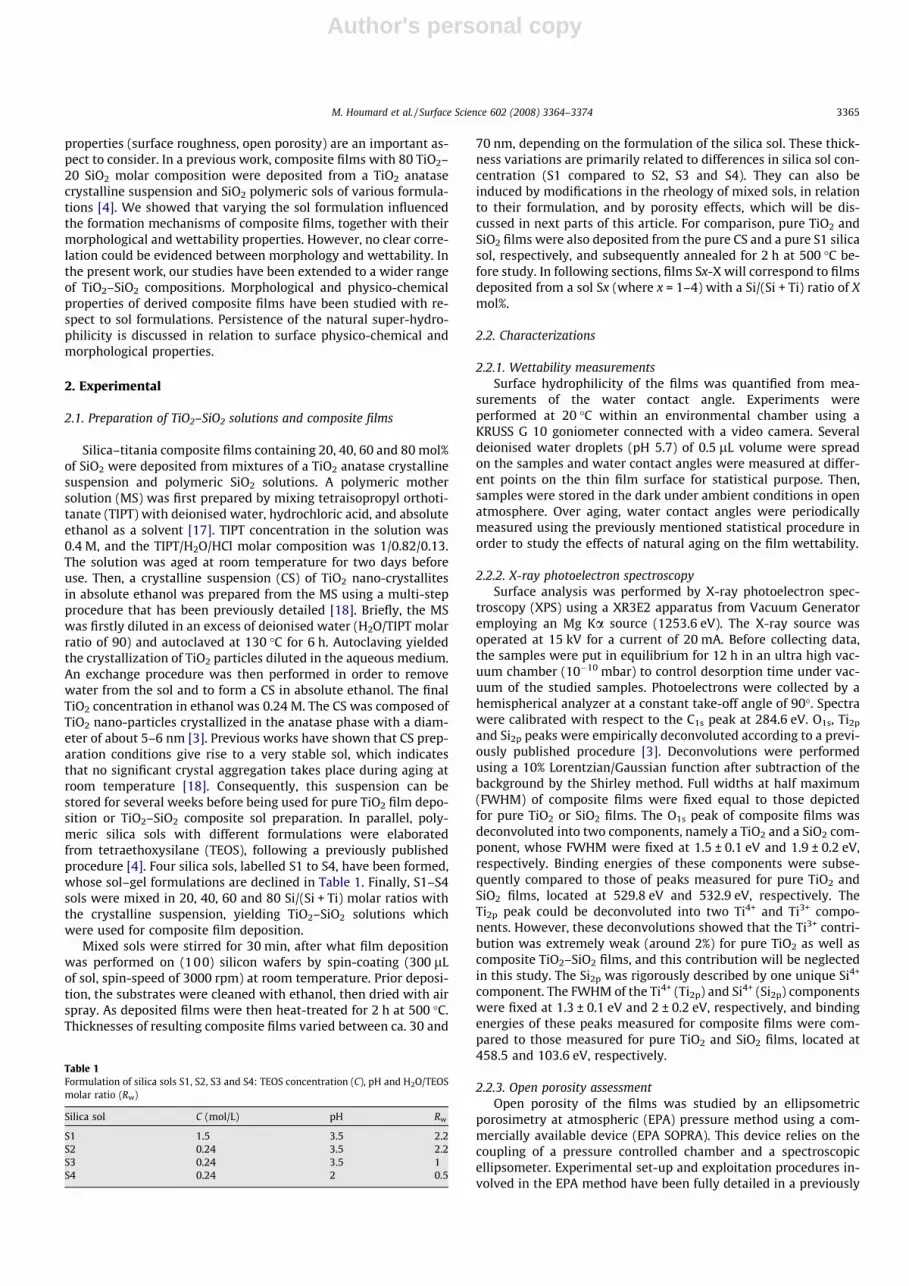
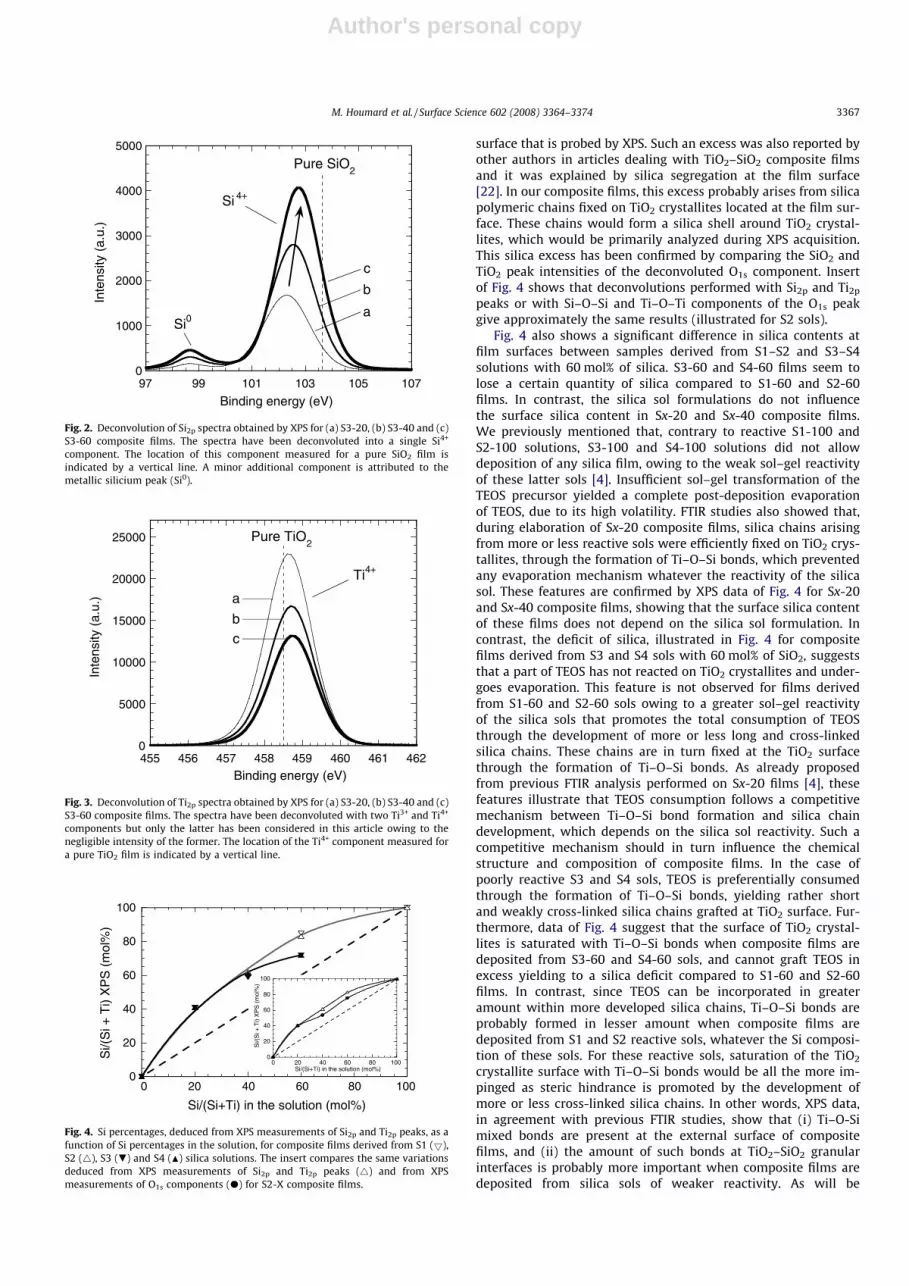
In a previous paper, we have discussed the formation mecha-nisms of TiO2–SiO2 composites films according to transmissionFTIR measurements [4]. These studies clearly showed that ourcomposite films were constituted of TiO2 nano-crystallites, of ca.5–6 nm in diameter according to X-ray diffraction measurements[3], embedded within a silica network, and this network was moreor less developed, depending on the reactivity of S1–S4 sols. TheseFTIR measurements also showed that the silica sol reactivity de-creased in the order S1 > S2� S3 > S4. In the present work, sincewettability properties are essentially induced by surface mecha-nisms, surface chemical properties of composite films have beenextensively studied by XPS. Figs. 1–3 present the O1s, Si2p, andTi2p peaks, respectively, for composite films deposited from S3 solswith silica contents of 20, 40 and 60 mol%. Similar trends were ob-served for composite films deposited from S1, S2 and S4 sols (notillustrated here). Figs. 1–3 illustrate an increase in the Si4+ andSi–O–Si peak intensities and a decrease in the Ti4+ and Ti–O–Tipeak intensities when increasing Si content in the sols. Further-more, besides a Si4+ peak, Fig. 2 depicts an additional peak localizedat approximately 98.7 eV, which corresponds to the metallic silici-um (Si0) arising from the silicium substrate used in this study.However, no clear correlation could be made between appearanceof this additional peak of weak intensity and the sol formulations.It is possible that this artefact ensues from scratches in the film,yielding denuded substrate areas. Intensities of the Si2p and Ti2p
peaks, corrected with the sensitivity factors of silicium and tita-nium (data from the XPS PHI handbook), respectively, allowed tocalculate Si/(Si + Ti) molar fractions at the surfaces of compositefilms deposited from S1 to S4 solutions with silica contents of 20,40 and 60 mol%, as illustrated in Fig. 4. The Si/(Si + Ti) molar frac-tion estimated for composite films appears to be significantly supe-rior to the fraction in corresponding mixed sols, whatever theirchemical composition. It would suggest a silica excess at the film
526 528 530 532 534 5360
5000
10000
15000
20000
25000
30000
35000
Inte
nsity
(a.
u.)
Binding energy (eV)
Ti-O-Ti Si-O-Si
Pure SiO2
Pure TiO2
a
b
c
Fig. 1. Deconvolution of O1s spectra obtained by XPS for (a) S3-20, (b) S3-40 and (c)S3-60 composite films. The spectra have been deconvoluted into two Ti–O–Ti andSi–O–Si components. The locations of these components measured for pure TiO2
anatase and SiO2 films are indicated by vertical lines.
3366 M. Houmard et al. / Surface Science 602 (2008) 3364–3374
Author's personal copy
surface that is probed by XPS. Such an excess was also reported byother authors in articles dealing with TiO2–SiO2 composite filmsand it was explained by silica segregation at the film surface[22]. In our composite films, this excess probably arises from silicapolymeric chains fixed on TiO2 crystallites located at the film sur-face. These chains would form a silica shell around TiO2 crystal-lites, which would be primarily analyzed during XPS acquisition.This silica excess has been confirmed by comparing the SiO2 andTiO2 peak intensities of the deconvoluted O1s component. Insertof Fig. 4 shows that deconvolutions performed with Si2p and Ti2p
peaks or with Si–O–Si and Ti–O–Ti components of the O1s peakgive approximately the same results (illustrated for S2 sols).
Fig. 4 also shows a significant difference in silica contents atfilm surfaces between samples derived from S1–S2 and S3–S4solutions with 60 mol% of silica. S3-60 and S4-60 films seem tolose a certain quantity of silica compared to S1-60 and S2-60films. In contrast, the silica sol formulations do not influencethe surface silica content in Sx-20 and Sx-40 composite films.We previously mentioned that, contrary to reactive S1-100 andS2-100 solutions, S3-100 and S4-100 solutions did not allowdeposition of any silica film, owing to the weak sol–gel reactivityof these latter sols [4]. Insufficient sol–gel transformation of theTEOS precursor yielded a complete post-deposition evaporationof TEOS, due to its high volatility. FTIR studies also showed that,during elaboration of Sx-20 composite films, silica chains arisingfrom more or less reactive sols were efficiently fixed on TiO2 crys-tallites, through the formation of Ti–O–Si bonds, which preventedany evaporation mechanism whatever the reactivity of the silicasol. These features are confirmed by XPS data of Fig. 4 for Sx-20and Sx-40 composite films, showing that the surface silica contentof these films does not depend on the silica sol formulation. Incontrast, the deficit of silica, illustrated in Fig. 4 for compositefilms derived from S3 and S4 sols with 60 mol% of SiO2, suggeststhat a part of TEOS has not reacted on TiO2 crystallites and under-goes evaporation. This feature is not observed for films derivedfrom S1-60 and S2-60 sols owing to a greater sol–gel reactivityof the silica sols that promotes the total consumption of TEOSthrough the development of more or less long and cross-linkedsilica chains. These chains are in turn fixed at the TiO2 surfacethrough the formation of Ti–O–Si bonds. As already proposedfrom previous FTIR analysis performed on Sx-20 films [4], thesefeatures illustrate that TEOS consumption follows a competitivemechanism between Ti–O–Si bond formation and silica chaindevelopment, which depends on the silica sol reactivity. Such acompetitive mechanism should in turn influence the chemicalstructure and composition of composite films. In the case ofpoorly reactive S3 and S4 sols, TEOS is preferentially consumedthrough the formation of Ti–O–Si bonds, yielding rather shortand weakly cross-linked silica chains grafted at TiO2 surface. Fur-thermore, data of Fig. 4 suggest that the surface of TiO2 crystal-lites is saturated with Ti–O–Si bonds when composite films aredeposited from S3-60 and S4-60 sols, and cannot graft TEOS inexcess yielding to a silica deficit compared to S1-60 and S2-60films. In contrast, since TEOS can be incorporated in greateramount within more developed silica chains, Ti–O–Si bonds areprobably formed in lesser amount when composite films aredeposited from S1 and S2 reactive sols, whatever the Si composi-tion of these sols. For these reactive sols, saturation of the TiO2
crystallite surface with Ti–O–Si bonds would be all the more im-pinged as steric hindrance is promoted by the development ofmore or less cross-linked silica chains. In other words, XPS data,in agreement with previous FTIR studies, show that (i) Ti–O-Simixed bonds are present at the external surface of compositefilms, and (ii) the amount of such bonds at TiO2–SiO2 granularinterfaces is probably more important when composite films aredeposited from silica sols of weaker reactivity. As will be
0
1000
2000
3000
4000
5000
97 99 101 103 105 107
Pure SiO2
Si 4+
Inte
nsity
(a.
u.)
Binding energy (eV)
Si0
c
b
a
Fig. 2. Deconvolution of Si2p spectra obtained by XPS for (a) S3-20, (b) S3-40 and (c)S3-60 composite films. The spectra have been deconvoluted into a single Si4+
component. The location of this component measured for a pure SiO2 film isindicated by a vertical line. A minor additional component is attributed to themetallic silicium peak (Si0).
455 456 457 458 459 460 461 4620
5000
10000
15000
20000
25000
Inte
nsity
(a.
u.)
Binding energy (eV)
Ti4+
Pure TiO2
cb
a
Fig. 3. Deconvolution of Ti2p spectra obtained by XPS for (a) S3-20, (b) S3-40 and (c)S3-60 composite films. The spectra have been deconvoluted with two Ti3+ and Ti4+
components but only the latter has been considered in this article owing to thenegligible intensity of the former. The location of the Ti4+ component measured fora pure TiO2 film is indicated by a vertical line.
0
20
40
60
80
100
Si/(
Si +
Ti)
XP
S (
mol
%)
Si/(Si+Ti) in the solution (mol%)
0
20
40
60
80
100
0 20 40 60 80 100
Si/(
Si +
Ti)
XP
S (
mol
%)
Si/(Si+Ti) in the solution (mol%)
0 20 40 60 80 100
Fig. 4. Si percentages, deduced from XPS measurements of Si2p and Ti2p peaks, as afunction of Si percentages in the solution, for composite films derived from S1 (5),S2 (4), S3 (.) and S4 (N) silica solutions. The insert compares the same variationsdeduced from XPS measurements of Si2p and Ti2p peaks (4) and from XPSmeasurements of O1s components (d) for S2-X composite films.
M. Houmard et al. / Surface Science 602 (2008) 3364–3374 3367

Author's personal copy
discussed below, formation of mixed bonds at the film surface hasa possible important incidence on the wettability properties ofcomposite films.
In Figs. 1–3, vertical lines indicate the reference positions of O1s,Si2p, and Ti2p peaks measured for pure SiO2 (S1-100) and TiO2 (Sx-0) films. Shifts in binding energies are clearly observed betweenpeaks of pure and composite films. Compared to a pure TiO2 film,Ti2p and Ti–O–Ti component of the O1s peak observed for compos-ite films are shifted toward greater energies, and these shifts (+0.1to +0.2 eV) are rather weakly marked whatever the silica sol for-mulation. Compared to a pure SiO2 film, Si2p and Si–O–Si compo-nent of the O1s peak in composite film spectra are shifted towardlower energies, and these shifts appear quite markedly, as illus-trated in Fig. 5. The literature dealing with binary TiO2–SiO2 sys-tems mentions such energy shifts in the case of TiO2–SiO2
composite powders [22,23] and for ultra-thin films of SiO2 (TiO2)deposited on TiO2 (SiO2) [24–27]. These shifts are explained byelectronic interactions occurring at granular or planar TiO2–SiO2
interfaces via Ti–O–Si mixed bonds. These interactions would beinduced by an interfacial substitution of Si (Ti) atoms by Ti (Si)atoms less (more) electronegative and more (less) polarizablewithin a SiO2 (TiO2) host network. Peak shifts observed in XPSspectra suggest that such interactions take place in our compositefilms. They may result from (i) the aforementioned silica chain fix-ation mechanism occurring through Ti–O–Si bond formation, and/or (ii) a diffusion process in the solid phase of Ti4+ (Si4+) cations inthe SiO2 (TiO2) network occurring during thermal treatment at500 �C. Both processes can lead to the production of interfacial re-gions with Ti–O–Si mixed bonds. Therefore, shifts illustrated inFigs. 1–3 and 5 confirm the presence of Ti–O–Si mixed bonds atthe external surface of composite films and more pronouncedshifts observed for S3–S4 composite films suggest that, for a sameTiO2–SiO2 composition, a larger number of Ti–O–Si bonds areformed in films deposited from the less reactive silica sols S3 andS4. However, for all silica sol formulations, Fig. 5 shows a continu-ous decrease of Si2p and Si–O–Si peak shifts with an increasing sil-ica amount in composite films. Normally, we might expect thatshifts, i.e., Ti–O–Si bonds effects, increase at least up to silicaamounts that yield a nearly equal content of TiO2 and SiO2 compo-nents. Nevertheless, trends illustrated in Fig. 5 are in agreementwith data of Barranco et al. dealing with ultra-thin SiO2 filmsdeposited on TiO2 substrates [25]. In this work, XPS energy shiftsare described as resulting from the sum of ‘polarization’ and ‘bond-ing’ interactions at TiO2–SiO2 interfaces, where bonding interac-tions are restricted to first monolayers and polarization effectscan extend to several nanometers. With this description, it is in
particular explained why the Si2p shift decreases from a maximal1.3 eV value (comparable to our maximal shift) to 0 eV when theSiO2 thickness increases from that of a monolayer to that of a bulkmaterial. The fraction of polarised Si atoms in the silica film contin-uously decreases with increasing SiO2 thickness, and interfacialinteraction effects are consecutively less and less marked. Wecan in turn extrapolate this model to describe Si2p shifts illustratedin Fig. 5 in terms of charge effects at TiO2–SiO2 granular interfacesin our composite films. Owing to their greater sol–gel reactivity, S1and S2 promote the development of longer and more cross-linkedsilica chains at TiO2 crystallite surfaces, yielding embedment ofTiO2 crystallites within a more or less developed silica network.Fraction of polarised Si atoms within this network is thus reducedcompared to what occurs in presumably shorter silica chainsformed at TiO2 crystallite surfaces when composite films aredeposited from much less reactive S3 and S4 sols. It explainswhy, for a fixed silica content, shifts are more pronounced in thecase of S3-S4 composite films than for S1-S2 ones. Furthermore,increasing the silica content in composite films, whatever the silicasol reactivity, should promote similar dilution effects yielding XPSshift decreases, despite the probable formation of a greater amountof Ti–O–Si bonds. Concerning Ti2p shifts, as for Si2p, articles dealingwith ultra-thin TiO2 films deposited on SiO2 substrates also put inevidence a decreasing shift with higher TiO2 thicknesses due to adecreasing fraction of polarised Ti atoms in TiO2 films [26,27].But, contrary to Si2p shifts evidenced in the present study, Ti2p
shifts did not appreciably vary for our composite films depositedfrom sols of various silica contents and formulations. It is impor-tant here to recall that our composite films are deposited from a li-quid suspension of anatase TiO2 crystallites. Since the average TiO2
crystallite size is the same for all films studied here, with a diam-eter of ca. 5–6 nm [3], the fraction of polarised Ti atoms in TiO2
crystallites, and consequently the related Ti2p shifts, do not signif-icantly vary with sol formulations. To summarize, though XPS dataevidence the presence and effect of Ti–O–Si mixed bonds at TiO2–SiO2 granular interfaces, XPS is not the best tool to quantify sucheffects.
XPS analyses also allowed an estimation of the carbon percent-age at film surfaces. This estimation was performed after aging thefilms for two months in natural ambient conditions. XPS detectionof carbon is essentially due to a surface contamination that natu-rally occurs in ambient atmosphere during film aging. This con-tamination can explain losses of hydrophilicity in our films uponaging [3,4]. Fig. 6 shows the percentage of surface carbon (calcu-lated from the ratio of C1s peak intensity to the sum of C1s, Si2p,Ti2p and O1s peak intensities) as a function of the Si content in dif-ferent silica sols. This figure depicts a gradual decrease of surface
-1.4
-1.2
-1
-0.8
-0.6
-0.4
-0.2
0
Shi
ft (e
V)
Si/(Si+Ti) in the solution (mol%)
aSi-O-Si
Si2p
b
c
d
0 20 40 60 80 100
Fig. 5. Shifts of the XPS peak positions for composite films derived from S1 (5), S2(D), S3 (.) and S4 (N) silica solutions. (a) and (b) (full curves) depict Si2p shifts forcomposite films derived from S1–S2 and S3–S4 solutions, respectively. (c) and (d)(doted curves) depict shifts of the O1s Si–O–Si component for composite filmsderived from S1–S2 and S3–S4 solutions, respectively.
0
5
10
15
20
25
30
35
% C
arbo
n on
surf
ace
(XP
S)
Si/(Si+Ti) in the solution (mol%)0 20 40 60 80 100
Fig. 6. Carbon percentages, deduced from XPS measurements of the C1s peak, as afunction of Si percentage in the solution, for composite films derived from S1 (5),S2 (4), S3 (.) and S4 (N) silica solutions.
3368 M. Houmard et al. / Surface Science 602 (2008) 3364–3374

Author's personal copy
carbon percentage when increasing silica content in the solution,and similar trends are observed whatever the silica sol formulationand reactivity. In other words, the greater the silica amount is, theless polluted the surface is, and this phenomenon appears to beindependent of previously discussed chemical structure and com-position effects.
3.2. Morphology of composite films
As mentioned in introduction and discussed in Section 3.3, wet-tability properties can be influenced by morphology features. Inthe present study, such features have been analyzed using variouscharacterizations. Figs. 7 and 8 show variations of the refractive in-dex and thickness of composite films, respectively, versus the silicacontent in S1–S4 mixed solutions. In Fig. 7 is also represented indoted line the refractive index variations of bulk composite mate-rials of various silica amounts, as determined using the Lorentz–Lorenz mixing law. As explained in experimental section, filmand corresponding bulk composite refractive index values werethen used to estimate the total volume porosity of composite filmsthrough a Lorentz–Lorentz relationship. Porosity variations areillustrated in Fig. 9 for the different films studied in this work.For composite films derived from a same silica sol formulation,Fig. 7 indicates that the refractive index does not vary significantlywith the silica composition. However, since the refractive index ofbulk composites gradually decreases when increasing the silicaamount, trends illustrates in Fig. 7 depict that composite films ofgreater silica content behave closer to corresponding bulk compos-ites, which in turn indicates a decreasing porosity of compositefilms. This porosity decrease is clearly evidenced in Fig. 9 whenincreasing the silica amount above 20 mol%. Besides, Fig. 9 illus-trates that the porosity of all Sx-20 films is greater than that of apure TiO2 (Sx-0) film. Fig. 9 also shows that, for a same silica con-tent, porosity of composite films decreases in the orderS4 > S3 > S2 > S1, whatever the TiO2–SiO2 composition of mixedsols. Such features mean that, for a given silica content, increasingthe silica sol reactivity leads to less porous films. This behaviourwas already observed in our previous study dealing with 80TiO2–20SiO2 composites [4]. As explained in the previous section, com-posite films derived from reactive S1 and S2 sols can be repre-sented as anatase crystallites embedded in a silica networkconstituted of rather long and cross-linked chains. Cross-linkingtends to fill in the pores within the silica network. In contrast, com-posite films derived from poorly reactive S3 and S4 sols are prob-ably constituted of rather linear silica chains that interconnectTiO2 crystallites. Voids created in between poorly cross-linked
chains contribute to a greater porosity of these films. A comparisonbetween Figs. 8 and 9 shows that thickness variations follow sametrends as porosity variations in the case of composite films depos-ited from S2 to S4 sols. This observation expresses that, for thesesols of identical Si + Ti precursor concentration (0.24 mol/L), filmthickness is only determined by porosity effects. In contrast, thethickness variations for S1 films do not correlate porosity varia-tions, as illustrated in Figs. 8 and 9. Thickness of such films contin-uously increases with increasing silica content. Since the S1 sol ismuch more concentrated in silica than other Sx solutions (see Ta-ble 1), increasing the silica fraction in mixed sols yields an increasein the total precursor concentration and thickness of derived films.Rheology of the S1-X mixed sols is probably also modified whenincreasing the silica content, which may contribute as well to mod-ifications in the thickness of derived films. Thus, in the case of S1derived composite films, thickness variations depict a complexcombination of sol formulation and film compactness features.
EPA method was used to assess the open porosity in compositefilms deposited from S1 and S4 sols. A comparison between Fig. 9and insert of Fig. 9 shows that a great part of the total porosity con-sists in open mesopores. Actually, in some case the fraction of openpores is probably underestimated. Indeed, pores probed by EPAmethod are presumably not always totally filled by water duringwater adsorption cycles. It can arise from (i) a too large size ofsome pores, which are consequently out of the detection rangeby EPA method, or (ii) a premature filling of inter-pore necks, in-volved in water adsorption cycles through capillary flow mecha-nism, which can lead to imprisonment of air in pores of the filmand consecutive water impregnation impingement. In any cases,
1.5
1.7
1.9
2.1
2.3
2.5
Ref
ract
ive
inde
x at
633
nm
Si/(Si+Ti) in the solution (mol%)
0 20 40 60 80 100
Fig. 7. Refractive index at 633 nm as a function of Si percentage in the solution forcomposite films derived from S1 (5), S2 (4), S3 (.) and S4 (N) silica solutions. Thedoted line depicts the same refractive index variations for bulk TiO2–SiO2
composites, as calculated using a Lorentz–Lorenz mixing law.
0
40
80
120
160
Thi
ckne
ss (
nm)
Si/(Si+Ti) in the solution (mol%)0 20 40 60 80 100
Fig. 8. Thickness as a function of Si percentage in the solution for composite filmsderived from S1 (5), S2 (4), S3 (.) and S4 (N) silica solutions.
0
10
20
30
40
50
60
70
80
Tot
al p
oros
ity (
vol%
)
Si/(Si+Ti) in the solution (mol%)
0
10
20
30
40
50
60
70
80
0 10 20 30 40 50 60
Ope
n p
oro
sity
(vo
l%)
Si/(Si+Ti) in the solution (mol%)
0 20 40 60 80 100
Fig. 9. Total volume porosity as a function of Si percentage in the solution forcomposite films derived from S1 (5), S2 (4), S3 (.) and S4 (N) silica solutions.Insert shows the same variations for the open volume porosity of S1 (5) and S4 (N)composite films.
M. Houmard et al. / Surface Science 602 (2008) 3364–3374 3369

Author's personal copy
data of Fig. 9 and insert of Fig. 9 show that open porosity followssame trends as total porosity, i.e., both types of porosities decreasewhen the silica content increases above 20 mol%, and the openporosity decrease is much more important for composite filmsdeposited from a poorly reactive S4 solution. Let us note that openporosity of a pure S1-100 silica film could not be assessed using theEPA method owing to the very weak volume fraction of pores forsuch a film, less than 1 vol% in total porosity according to refractiveindex measurements. Open pores radii were also estimated fromEPA method (Table 2). Open pores appear to be much larger whenfilms are deposited from a poorly reactive S4 sol, and they increasein size when increasing the silica amount in S4 composite films,despite decreasing trends of open and total volume porosities.Such an increase in pore size was all the more underlined as iso-therm curves, used to estimate pore radii, did not go to saturationin the case of a S4-60 film exposed to ca. 100% humidity (not illus-trated here). It means that, owing to the large pore size in this film,water impregnation was by far incomplete. Consequently, poresize could not be estimated for this composite film. In contrast,in the case of films derived from a reactive S1 sol, mesoporesessentially induced by the TiO2 component are gradually replacedby micropores when increasing the silica amount. These microp-ores are too small to be quantified using the EPA method. Pore sizereduction, together with open and total porosity variations illus-trated in Fig. 9, confirm that the silica network developed from areactive S1 sol exhibits a greater compactness than that inducedby a poorly reactive S4 sol, which in turn impacts porosity of de-rived composite films. Finally, Table 2 also shows that the RMSroughness of S4 composite films, as deduced from AFM measure-ments, is rather well correlated to the pore size, which suggeststhat roughness of these films is at least partially induced by poros-ity effects. In contrast, composite films derived from a S1 sol exhi-bit weaker RMS roughness, and roughness only slightly increaseswhen increasing the silica content.
Fig. 10 shows AFM and FEG-SEM images of S1-20, S1-60, S4-20and S4-60 composite films. As previously shown in our previousarticle for Sx-20 films, microscopy methods provide complemen-tary insights into the morphology of composite films, since theydepict size scales that cannot be probed by EPA method. Accordingto FEG-SEM images, composite films illustrated in Fig. 10 present asponge-like structure with large surface macro-cavities. These cav-ities are much more marked in the case of S4 derived films (Fig. 10cand d) and, for these films, they seem to increase in size with a sil-ica content increase, which supports a competition between poros-ity decrease and pore size increase, as depicted in Fig. 9 and Table2. Conversely, cavities are less apparent when increasing the silicacontent in S1 derived films (Fig. 10a and b), which correlates pre-viously described volume porosity and pore size decreases. Originof surface macro-cavities is not yet clearly established. As previ-ously discussed [4], modifications in the structure of silica chainsfixed on TiO2 crystallites, which arise from modifications in the sil-
ica sol formulation and reactivity, can provoke variations in themorphological properties of composite films. AFM images furnishsome additional information on the morphology of compositefilms. On the one hand, these images evidence granular particleswhose size increases with increasing the silica content, whateverthe formulation of silica sol. Let us note that grain sizes depictedby AFM ensue from convolution effects of the actual grain sizeand size of the AFM tip. However, size increases illustrated inFig. 10 seem realistic and may traduce the formation of a silicashell around TiO2 crystallites (or crystallite agglomerates), whosedevelopment is all the more marked as the Si content is increased.On the other hand, in contrast to other characterizations, AFMimages do not evidence significant differences between S1 and S4films of identical silica content. In particular, differences in RMSroughness illustrated in Table 2 are not confirmed by significantdifferences in AFM images between composite films of identicalsilica content. Actually, RMS roughness does not necessarily depictperfectly surface morphology features and, for this reason, wetta-bility specialists preferentially use a ‘roughness parameter’, whichis defined as the ratio (r) of the real surface of a material to the pro-jected planar surface [28,29]. In our AFM acquisition conditions,we found that the r value varied extremely weakly in a 1.1–1.2range for all surfaces studied here. All in all, it seems therefore that,in the present study, RMS roughness values provide a betterdescription of the film surface morphology, whatever the limita-tions of such a parameter.
3.3. Wettability measurements
As shown in previous sections, the formulation of silicon–tita-nium mixed sols greatly influences the morphological as well aschemical composition and structure of TiO2–SiO2 composite films.Wettability properties of these films have been studied with re-spect to the sol formulations. Fig. 11 illustrates evolutions of thenatural water contact angle over aging in natural atmosphere forSx-60 composite films deposited from S1 to S4 sols. These filmsare also compared to a pure silica S1-100 film. Immediately afterthermal treatment at 500 �C, all the films exhibit a super-hydro-philic character. Then, contact angles gradually increase over aging.Compared to composite films, a pure silica film rapidly loses its ini-tial super-hydrophilicity. For composite films, the contact angle in-crease is much slower as the silica sol reactivity decreases, i.e., forS3-60 and S4-60 films. These data confirm previous conclusionsdrawn in the case of Sx-20 films [4], showing that decreasing thesilica sol reactivity, i.e., increasing the amount of Ti–O–Si mixedbounds at TiO2–SiO2 granular interfaces, is correlated to a super-hydrophilicity persistence. Fig. 12 depicts water contact anglesmeasured on films, deposited from sols of various formulationsand silicon–titanium compositions, and subsequently aged for 8weeks under atmospheric conditions. This figure confirms a betterhydrophilicity persistence of composite films issued from less reac-tive S3 and S4 silica sols, whatever the TiO2–SiO2 stoichiometry.Fig. 12 also shows that, for a same silica sol formulation and reac-tivity, an optimal super-hydrophilicity persistence is obtained for aSi/(Si + Ti) sol composition of 60 mol%. Consequently, it appearsthat S3-60 and S4-60 maintain their initial super-hydrophilicityfor eight weeks or more, i.e., these films exhibit a water contact an-gle of 5� or less after eight weeks. Let us recall that such behaviourwas evidenced without any UV exposure over aging. As explainedbefore, for traditional surface behaviours, loss of super-hydrophi-licity over aging is principally related to carbon contaminationkinetics. However, in the present study, such a conclusion cannotdepict wettability behaviours of composite films. Indeed, carboncontamination trends illustrated in Fig. 6 do not correlate at allwettability trends illustrated in Fig. 12. On the one hand, watercontact angles increase when increasing the silica amount of com-
Table 2Mean pore (rp) and neck (rn) radii, as deduced from EPA method measurements, andRMS roughness, as deduced from AFM characterizations, for composite films derivedfrom S1 and S4 silica solutions and with 20, 40 and 60 mol% of SiO2
Film nomenclature Mean pore radii rp/rn (nm) RMS roughness (nm)
TiO2 CS 3.0/2.0 2.7S1-20 2.5/2.0 4.7S1-40 micropores + 5.5/3.3 4.6S1-60 micropores 5.3S4-20 5.0/3.7 8.8S4-40 7.5/5 9.2S4-60 out of detection range 10.9
Values measured on a pure TiO2 film are provided as well.
3370 M. Houmard et al. / Surface Science 602 (2008) 3364–3374

Author's personal copy
posite films above 60 mol%, which is in contradiction with data ofFig. 6 showing a continuous decrease of the carbon contaminationwith increasing silica content. On the other hand, for same silicacontents, Fig. 12 shows that wettability behaviours are stronglyinfluenced by the silica sol formulation and reactivity, which isnot observed for carbon contamination. In contrast, according toprevious discussions, trends illustrated in Figs. 11 and 12 can be re-lated to an increasing amount of Ti–O–Si bounds at TiO2–SiO2
granular interfaces, in relation to the sol formulation andreactivity.
As mentioned in introduction, we suspect that interactions atgranular TiO2–SiO2 interfaces can induce particular wettabilitybehaviours. However, other factors can also influence the wettabil-ity of our films. According to De Gennes et al. [30], morphologicalproperties, such as surface roughness or open porosity, influencethe water contact angle measurement via enhanced water wetta-
Fig. 10. FEG–SEM (left) and AFM images (right) for composite films (a) S1-20, (b) S1-60, (c) S4-20 and (d) S4-60.
M. Houmard et al. / Surface Science 602 (2008) 3364–3374 3371

Author's personal copy
bility at the surface of rough hydrophilic films or enhanced waterimpregnation within porous films. On the one hand, the roughnessof a given material is usually related to its apparent contact angle(h*), i.e., the measured contact angle, through the Wenzel equation(3) [28]:
cos h� ¼ r � cos h: ð3Þ
where r is the roughness parameter, previously defined in Section3.2, and h is the Young contact angle induced only by chemical sur-face interactions, i.e., which would be measured on an ideally flatsurface [31]. From this equation, it appears that the roughness en-hances the surface wetting behaviour, i.e., h* < h, of a naturallyhydrophilic surface (h < 90�). On the other hand, when the openporosity favours a surface water impregnation, Bico et al. have pro-posed a specific model where wettability relies on the behaviour ofa water droplet deposited on a composite surface that consists ofwater and solid material [32]. In that case, the apparent contact an-gle is a function of the solid fraction at the material surface (fs)according to Eq. (4):
cos h� ¼ 1� fs � ð1� cos hÞ: ð4Þ
This relation depicts that surface wettability is all the more en-hanced as the film exhibits a greater fraction of surface pores, i.e.,a smaller fs value. Consequently, it is interesting to analyze in whichextent morphology features can participate in mechanisms that in-duce persistent super-hydrophilicity in our composite films. Sinceopen and total volume porosities follow rather similar trends, wehave first chosen to study relations between the morphologicaland wettability properties of our composite films as a function of
the total porosity, as determined from ellipsometric measurement.These relations are illustrated in Fig. 13 for films aged over eightweeks under ambient conditions. For a constant TiO2–SiO2 compo-sition, Fig. 13 depicts a fairly good correlation between a largerporosity and a reduced contact angle. However, a larger porositydoes not intrinsically yield a better wettability behaviour, sinceFig. 13 also shows that, for a same volume porosity, the water con-tact angle strongly decreases when increasing the Si/(Si + Ti) molarratio from 20% to 60%, i.e., when increasing the amount of Ti–O–Sibounds at TiO2–SiO2 granular interfaces. Actually, the best super-hydrophilicity persistence is observed for a S4-60 film that doesnot exhibit the largest (open or total) fraction of porosity. However,according to previous section, this film also exhibits rather largeopen pores (EPA method) and surface cavities (FEG-SEM), as wellas quite important roughness (AFM). Thus, enhanced wettabilityof a S4-60 film can still be partially influenced by morphology ef-fects. In contrast, and despite some previously mentioned ambigu-ities between the different methods, EPA, FEG-SEM, and AFMcharacterizations show that, when increasing the silica content inS1 composite films, the size or presence of open pores and surfacecavities is considerably reduced, and RMS roughness varies veryweakly. In the same time, Fig. 13 shows that the water contact anglesignificantly decreases when increasing the silica content in aged S1composite films. Though in that case, we can obviously no longercomment on a super-hydrophilic behaviour of aged films, it seemsthat these latter observations alleviate an exclusive influence ofmorphology features on the wettability behaviours of compositefilms. In other words, the whole data presented in Fig. 13 providefurther support on the possible influence of TiO2–SiO2 granularinterfaces interactions yielding enhanced super-hydrophilicity per-sistence in our composite films.
Deprotoned TiO�x and/or protoned SiOþx unities can be formedwithin TiO2–SiO2 composites, which would arise from TiO2–SiO2
interactions at granular interfaces. In particular, the strong cata-lytic power of TiO2–SiO2 composites would originate from suchunities [5–15]. For instance, among several models proposed to ex-plain such a catalytic power, Tanabe et al. have claimed that, for abinary system composed of SiO2 (4-fold coordination of Si4+) andTiO2 regions (6-fold coordination of Ti4+), which corresponds tothe chemico-structural state of our composite films, two situationsshould be considered [10]. When silicon can enter the TiO2 latticeas a minor component, because Si4+ cations retain their 4-foldcoordination, SiOþ4=3
4 units are formed. Lewis acidity is thus as-sumed to appear owing to an excess of localized positive charge.When titanium can enter the SiO2 network as a minor component,because Ti4+ cations retain their 6-fold coordination, TiO�2
6 units
0
5
10
15
20
25
30
35
0 10 20 30 40 50
Wat
er c
onta
ct a
ngle
(°)
Aging time (day)
Fig. 11. Evolution of the water contact angle with aging time for S1-60 (5), S2-60(4), S3-60 (.) and S4-60 (N) composite films, and for a pure S1-100 silica film (s).
0
10
20
30
40
50
60
Wat
er c
onta
ct a
ngle
afte
r 8
wee
ks (
°)
Si/(Si+Ti) in the solution (mol%)
0 20 40 60 80 100
Fig. 12. Water contact angle, measured after eight weeks aging under atmosphereconditions, as a function of Si percentage in the solution, for composite filmsderived from S1 (5), S2 (4), S3 (.) and S4 (N) silica solutions.
0
5
10
15
20
25
30
35
0 10 20 30 40 50 60Wat
er c
onta
ct a
ngle
afte
r 8
wee
ks (
°)
Total porosity (vol%)
a
c
b
SiO2
Fig. 13. Water contact angle, measured after eight weeks aging under atmosphereconditions, as a function of total volume porosity, for composite films with (a) 20,(b) 40 and (c) 60 mol% of silica and for a pure silica film.
3372 M. Houmard et al. / Surface Science 602 (2008) 3364–3374

Author's personal copy
are formed. Bronsted acidity is thus assumed to appear becausethese units may be compensated by two protons to keep the elec-tric neutrality. The enhanced surface acidity developed in thismodel, or alternative models proposed by other authors, can inturn explain the catalytic activity of TiO2–SiO2 composites. We be-lieve that this acidity is not necessarily involved in the surfaceproperties of our composite films. However, XPS studies detailedin Section 3.1 show that TiO2–SiO2 interfacial charge interactionsoccur in our films, even at the film surface in contact with liquidwater. Formation of deprotoned or protoned unities at the film sur-face, according to aforementioned models, may in turn induce amolecular or dissociative water adsorption at the surface ofTiO2–SiO2 composite films, which would promote enhanced wetta-bility properties leading to a natural and persistent super-hydro-philicity. Accordingly, we never observed any super-hydrophilicity in TiO2–SiO2 films deposited from mixtures of aMS TiO2 polymeric sol and S1 sol, whatever the TiO2–SiO2 compo-sition [3]. In these experimental conditions, FTIR studies haveshown that, for a silica content of 20 mol% or more, mixed filmsdo not undergo any TiO2–SiO2 phase separation, and behave asglassy films where titanium is intimately diluted at molecular scalewithin a silica matrix. In other words, no TiO2–SiO2 granular inter-face is formed in such films. Consequently, absence of any super-hydrophilicity in glassy films seems to support the assumptionthat TiO2–SiO2 granular interface interactions participate, at leastpartially, to the natural super-hydrophilicity of composite filmsstudied in the present work. In order to tentatively reinforce thisassumption, we have studied, in Fig. 14, variations of the watercontact angle measured on composite films, after eight weeksaging, as a function of the Si2p shifts deduced from XPS spectradeconvolutions, as deduced from Fig. 5. For a fixed TiO2–SiO2 com-position, the Si2p (negative) shift increases when the surface hydro-philic character of aged films increases. This observation inparticular suggests that a possible optimal interfacial charge ef-fect, induced by a maximisation of the amount of Ti–O–Si bondsat granular interfaces, promotes the best super-hydrophilicitypersistence in a S4-60 film. However, a comparison between thedifferent TiO2–SiO2 compositions shows that the best wettabilityperformances observed for this film are not related to the greatestSi2p energy shifts, since less hydrophilic Sx-20 films exhibit great-er Si2p shifts. As explained in Section 3.1, the Si2p peak shift de-creases when increasing the silica amount, owing to adiminution of the polarised Si atom fraction in more developedSiO2 chains surrounding TiO2 particles. Thus, XPS characteriza-tions cannot yield a perfect description of interfacial charge ef-
fects, and then cannot allow concluding exhaustively on theinfluence of these effects on the natural and persistent super-hydrophilicity of TiO2–SiO2 composite films. In order to progressin that comprehension, specific characterization methods have,therefore, to be implemented in the future to better assess theinfluence of local charge effects at granular interfaces and therespective influence of such effects and morphology effects onthe super-hydrophilicity persistence of TiO2–SiO2 compositefilms. We cannot either exclude that, when granular interface ef-fects are principally involved in the super-hydrophilicity of ourfilms, these effects can be enhanced by a water impregnationwithin pores of our films, which would promote a greater contactsurface between charged units and water, and then a greateradsorption efficiency. In that case, the film thickness can probablyinfluence super-hydrophilic properties of our films. This aspectshould be studied in order to understand if, additionally to thesurface properties, bulk properties of our films also affect theirsuper-hydrophilic behaviour.
4. Conclusions
TiO2–SiO2 composite thin films, deposited via a sol–gel route,have been studied with respect to their morphological, physico-chemical, and wettability properties. Such composite films exhibitan unexpected natural super-hydrophilicity that persists for amore or less prolonged period of time in the absence of UV light.Depending on experimental conditions, it is shown that super-hydrophilicity can persist up to 8 weeks or more in natural agingconditions. While natural carbon contamination is globally respon-sible of the loss in surface hydrophilicity, it cannot explain varia-tions observed with respect to precursor sol formulations andrelated morphological and physico-chemical film properties. Natu-ral and persistent super-hydrophilicity properties of TiO2–SiO2
composite films have been discussed with respect to their morpho-logical properties and charge effects at TiO2–SiO2 granular inter-faces. While morphological properties, i.e., surface roughness andporosity, may influence wettability measurements, such propertiescannot intrinsically depict the super-hydrophilicity of compositefilms, which reinforces assumption of a possible charge effect in-duced by Ti–O–Si bonds at TiO2–SiO2 granular interfaces. However,while XPS measurements give evidence of such interfacial effects,they do not allow a clear conclusion between the respectiveinfluences of morphology and TiO2–SiO2 granular interface effectson the super-hydrophilicity of TiO2–SiO2 composite films. Furthercharacterization methods allowing to more specifically put inevidence the influence of charge effects at granular interfaceshave thus to be implemented in the future. Further studies onTiO2–SiO2 composite films have a real interest, since such filmsallow considering applications to surfaces with enhancedcleanability.
References
[1] R. Wang, N. Sakai, A. Fujishima, T. Watanabe, K. Hashimoto, J. Phys. Chem. B103 (1999) 2188.
[2] N. Sakai, A. Fujishima, T. Watanabe, K. Hashimoto, J. Phys. Chem. B 105 (2001)3023.
[3] S. Permpoon, G. Berthomé, B. Baroux, J.C. Joud, M. Langlet, J. Mater. Sci. 41 (22)(2006) 7650.
[4] M. Houmard, D. Riassetto, F. Roussel, A. Bourgeois, G. Berthomé, J.C. Joud, M.Langlet, Appl. Surf. Sci. 254 (2007) 1405.
[5] K. Guan, Surf. Coat. Technol. 191 (2005) 155.[6] X. Fu, L.A. Clark, Q. Yang, M.A. Anderson, Environ. Sci. Technol. 30 (1996)
647.[7] M.M. Mohamed, T.M. Salama, T. Yamaguchi, Colloids Surf. 207 (2002) 25.[8] C.U.I. Odenbrand, S.L.T. Anderson, L.A.H. Anderson, J.G.M. Brandin, G. Busca, J.
Catal. 125 (1990) 541.[9] X. Gao, I.E. Wachs, Catal. Today 51 (1999) 233.
0
5
10
15
20
25
30
35
-1.5 -1 -0.5 0Wat
er c
onta
ct a
ngle
afte
r 8
wee
ks (
°)
Shift Si2p
(eV)
a
b
c
SiO2
Fig. 14. Water contact angle, measured after 8 weeks aging under atmosphereconditions, as a function of Si2p shift deduced from XPS measurements, forcomposite films with (a) 20, (b) 40 and (c) 60 mol% of silica and for a pure silica film.
M. Houmard et al. / Surface Science 602 (2008) 3364–3374 3373

Author's personal copy
[10] K. Tanabe, T. Sumiyoshi, K. Shibata, T. Kiyoura, K. Kitagawa, Bull. Chem. Soc.Jpn. 47 (1974) 1064.
[11] C.I. Contescu, J.A. Schwarz, in: K.L. Mittal (Ed.), Acid–Base Interactions, vol. 2,2000, p. 245.
[12] M. Itoh, H. Hattori, K. Tanabe, J. Catal. 35 (1974) 225.[13] J.R. Sohn, H.J. Jang, J. Catal. 132 (1991) 563.[14] T. Kataoka, J.A. Dumesic, J. Catal. 112 (1988) 66.[15] Z. Liu, J. Tabora, R.J. Davis, J. Catal. 149 (1994) 117.[16] S. Permpoon, M. Houmard, D. Riassetto, L. Rapenne, G. Berthomé, B. Baroux, J.C.
Joud, M. Langlet, Thin Solid Films 516 (2008) 957.[17] M. Langlet, M. Burgos, C. Coutier, C. Jimenez, C. Morant, M. Manso, J. Sol–Gel
Sci. Technol. 22 (2001) 139.[18] M. Langlet, A. Kim, M. Audier, C. Guillard, J.M. Hermann, J. Mater. Sci. 38 (2003)
3945.[19] C. Boissière, D. Grosso, S. Lepoutre, L. Nicole, A. Brunet-Bruneau, C. Sanchez,
Langmuir 21 (2005) 12362.[20] M. Born, E. Wolf, Principle of Optics, Pergamon, New York, 1975.[21] D.E. Aspnes, Thin Solid Films 89 (1982) 249.
[22] H. Yamashita, S. Kawasaki, Y. Ichihashi, M. Harada, M. Takeushi, M.Anpo, G. Stewart, M.A. Fox, C. Louis, M. Che, J. Phys. Chem. B 102(1998) 5870.
[23] Y.L. Lin, T.J. Wang, Y. Jin, Powder Technol. 123 (2002) 194.[24] B. Gallas, A. Brunet-Bruneau, S. Fisson, G. Vuye, J. Rivory, J. Appl. Phys. 92 (4)
(2002) 1922.[25] A. Barranco, F. Yubero, J.A. Mejias, J.P. Espinos, A.R. Gonzalez-Elipe, Surf. Sci.
482–485 (2001) 680.[26] G. Lassaletta, A. Fernandez, J.P. Espinos, A.R. Gonzalez-Elipe, J. Phys. Chem. 99
(1995) 1484.[27] J.A. Meijas, V.M. Jimenez, G. Lassaletta, A. Fernandez, J.P. Espinos, A.R.
Gonzalez-Elipe, J. Phys. Chem. 100 (1996) 16255.[28] R.N. Wenzel, Ind. Eng. Chem. 28 (1936) 988.[29] R.E. Johnson, R.H. Dettre, Adv. Chem. Ser. 43 (1964) 112.[30] P.G. de Gennes, F. Brochard-Wyart, D. Quéré, Gouttes, Bulles, Perles et Ondes,
Belin, Collection Echelles, Paris, 2002.[31] T. Young, Philos. Trans. Soc. London 95 (1805) 65.[32] J. Bico, C. Tordeux, D. Quéré, Europhys. Lett. 55 (2001) 214.
3374 M. Houmard et al. / Surface Science 602 (2008) 3364–3374


