Embed Size (px)
Citation preview
Accepted Manuscript
Title: Mesoporous SiO2-TiO2 nanocomposite for pH Sensing
Author: Shumaila Islam Noriah Bidin Saira Riaz Rosly A.Rahman Shahzad Naseem
PII: S0925-4005(15)00854-0DOI: http://dx.doi.org/doi:10.1016/j.snb.2015.06.095Reference: SNB 18672
To appear in: Sensors and Actuators B
Received date: 7-4-2015Revised date: 4-6-2015Accepted date: 14-6-2015
Please cite this article as: S. Islam, N. Bidin, S. Riaz, R.A. Rahman, S. Naseem,Mesoporous SiO2-TiO2 nanocomposite for pH Sensing, Sensors and Actuators B:Chemical (2015), http://dx.doi.org/10.1016/j.snb.2015.06.095
This is a PDF file of an unedited manuscript that has been accepted for publication.As a service to our customers we are providing this early version of the manuscript.The manuscript will undergo copyediting, typesetting, and review of the resulting proofbefore it is published in its final form. Please note that during the production processerrors may be discovered which could affect the content, and all legal disclaimers thatapply to the journal pertain.

Page 1 of 30
Accep
ted
Man
uscr
ipt
1
Mesoporous SiO2-TiO2 nanocomposite for pH Sensing
Shumaila Islam1), Noriah Bidin1)*, Saira Riaz2), Rosly A. Rahman1), Shahzad Naseem2) (1)Laser Centre, Ibnu Sina Institute for Scientific and Industrial Research, Universiti Teknologi
Malaysia, Skudai, Johor 81310 Malaysia
e-mail: [email protected], [email protected], [email protected] (2)Centre of Excellence in solid State Physics, University of the Punjab, Lahore, Pakistan.
e-mail: [email protected], [email protected]
ABSTRACT
Thermally stable mesoporous silica-titania nanocomposite matrix was obtained via sol-gel
method. The samples prior and after heat treatment were characterized by analytical instrumental
techniques like Field Emission Scanning Electron Microscope (FE-SEM), Energy Dispersive X-
Ray Spectroscopy (EDX), Atomic Force Microscopy (AFM), X-ray Diffraction (XRD), Thermal
Gravimetric Analysis (TGA), surface area, porosity measurements and UV-Vis Spectroscopy.
The FE-SEM and AFM micrographs suggest that the indicator molecules are homogeneously
diffused into matrix pores of the silica-titania network. The matrix exhibits regular morphology
with large pores without any cracks. Energy Dispersive X-Ray Spectroscopy (EDX) analysis
verified the stoichiometric formation of encapsulated silica-titania nanocomposite matrix
whereas calculated average crystallite size 3.82 nm was obtained by XRD. N2 adsorption
isotherms explain the mesoporous nature of the silica-titania nanocomposite matrix with high
surface area value of 401 m2/g with a pore size of 3.3 nm and pore volume of 0.33 cm3/g. UV-
Vis spectroscopic determinations revealed that the prepared nanomatrix shows good sensitivity
between pH range of 3-5 for acidic medium within 6.9 seconds and pH 12 for basic medium
within 1.03 seconds; it is indicative that pH sensor is more responsive towards strong basis. It
can be deduced that the sensing species are probably better encapsulated in the matrix and show
faster response time. The fabricated pH sensor was found to have a six months age stability and
high reproducibility in terms of absorption and colour stability with response time. A reversible
response over a range of pH values between 3 and 12 were obtained. The encapsulated pH
indicator silica-titania nanocomposite matrix after 2hr heating at 150°C shows a great potential
Page 2 of 30
Accep
ted
Man
uscr
ipt
2
to be used as pH sensor with good material stability, reproducibility/repeatability, reversibility,
fast response and long life time behavior.
Keywords: Sol-gel method; Mesoporous nanocomposite; Encapsulated indicators; pH sensing
1. Introduction:
Organic–inorganic encapsulated indicators fabricated from silica based porous materials are now
of interest for investigations in many fields, especially antireflection coatings, catalyst, and
sensing purposes [1, 2]. The thermally stable inorganic network combines with organic
components to possess the stable chemical behavior in the sensing media [3]. In the inorganic
matrix, the presence of the heteroatoms can broaden the potentials of interesting characteristics.
The chosen materials for inorganic matrix are silica and titania. Mostly, silica-titania composite
compared with pure titania has good mechanical strength, high thermal stability and improved
dispersibility in solvents [4]. A number of publications also report the potential applications of
silica-titania inorganic composite as a sensor, waveguide, catalyst and support for some chemical
reactions by different fabrication and measuring techniques [5-15]. The most advantageous
approach to synthesize the composite material is the sol-gel method [16, 17]. One of the benefits
of the sol–gel method is to allow formation of the porous network and leads to the incorporation
of organic species in the inorganic matrices without degradation [5]. These sol-gel based
nanocomposite matrices are porous in nature and are encapsulated with co-indicators that are
used for pH sensing [18, 19]. Thus, the pH dyes are integrated into the porous sol-gel structure
during the fabrication process, before deposition of the sol-gel film onto a solid substrate with
spin coating. The reactions occurring in the sol-gel matrix between encapsulated reagents and the
analyte in solution induce a local change in pH, which results in a color change of the dye-loaded
layer. The porosity (i.e., pore volume, pore size, and surface area) of nanocomposites depends on
the structure and size of particles formed by hydrolysis and condensation reactions. The colloidal
species in the sol lead to the aggregation of these particles and develop the porous gel
microstructures [20]. This study primarily deals with the synthesis and characterization of
encapsulated pH sensing indicators such as phenolphthalein (C20H14O4), phenol red (C19H14O5S),
bromophenol blue (C19H10Br4O5S) and cresol red (C21H17NaO5S) in silica-titania nanocomposite
by the sol-gel process. The additive surfactant Cetyl Trimethyl Ammonium Bromide (CTAB)
was used as structure-directing agent that leads to the textural modification and porosity of

Page 3 of 30
Accep
ted
Man
uscr
ipt
3
nanocomposite network after the heat treatment at 150 °C for 2 hrs. Furthermore, in this study,
the relationships between processing condition, microstructure of porous materials and sensing
properties were systematically investigated. Additionally, the sensing mechanism was discussed
based on their physical properties such as surface area, pore size, and mesopore volume. This
presented work proceeds in the development/modification of encapsulated indicators silica-
titania matrix for new and efficient applications for sensing at much lower temperature as
compared to other conventional melting techniques. It is worth mentioning here that this is the
lowest temperature ever reported for the synthesis of encapsulated co-indicators silica-titania
nanocomposite matrix without any chelating agent or organic binder, broadening the pH range
for long lasting and reliable sensing.
2. Experimental
2.1. Synthesis of the Sols
In this multi-step synthesis process, the sol A (SiO2) was prepared by optimizing 2.5 ml of
tetraethylorthosilicate, TEOS [98% Aldrich] that was mixed with 15ml ethanol (EtOH) as it
contained mixture of water (H2O) and nitric acid (HNO3) [65% Merck]. The whole mixture was
stirred for 2hr at 70 ºC. The molar ratios were TEOS: EtOH: H2O: HNO3~0. 5:3.0:3.0:0.3. The
pH of the solution was kept below 1.5 to maintain the viscosity. The sol B (TiO2) was obtained
in two steps. In the first step, 5ml of titanium (IV) isopropoxide [97% Aldrich] was mixed into
10ml isopropanol (Grade GC, 99.7%). In the second step, 10ml propanol was added to the
mixture of water and HNO3. The molar ratio for tetraisopropylorthotitanate: propanol: H2O:
HNO3 of final sol was 1.0:4.0:1.0:0.5 respectively. The solution was stirred for 2hr at 100 ºC to
get a stable sol. The final product was a mild yellow gelatinous. To prepare encapsulated
indicators stable matrix, the two sols A and B were mixed in 1:1 volume ratio of silica to titania
sol. 2ml of 0.5M concentration of co-indicators mixture namely phenolphthalein (C20H14O4),
phenol red (C19H14O5S), bromophenol blue (C19H10Br4O5S) and cresol red (C21H17NaO5S) and
1ml of 0.5M concentration of CTAB solution were mixed into a solution of two sols. This
mixture was stirred and heated at 80 ºC for 1 hr to ensure the proper combination of the
constituents. After mixing, the sol turned reddish in color. Then the mixed sol was left for
several days for appropriate aging cycles to increase the viscosity of the solution and removal of
volatile components at room temperature. For uniform and adhesive coatings, the glass slides

Page 4 of 30
Accep
ted
Man
uscr
ipt
4
were thoroughly cleaned with acetone for 15 minutes and propanol for 10 minutes in an
ultrasonic bath in separate runs to remove any adsorbed gases or contaminants and then dried at
room temperature [20]. The prepared sol was deposited on cleaned glass substrates by spin
coating at a rate 3,000 rpm for 30 s. The coating was done at room temperature. The process was
repeated three times to obtain a uniform film at the same coating conditions. Solvent
evaporation, accompanied by further condensation reactions, resulted in deposition of a solid thin
film on the substrate pieces. The coated films were then annealed at 150 °C for 2 hrs in order to
produce a tough, inert and highly adhesive coating. The overall outline of synthesis and coating
is shown in Fig.1.
Fig. 1. Overall outline of the synthesis and coating
3. Characterization:
A field emission scanning electron microscope (FEI Nova NanoSEM 450) was used to study the
morphology of silica-titania nanocomposite structures and the EDX spectrum (Oxford Silicon
Drift Detector SDD) was used to know the percentage of elements present in the sample. For
surface topography analysis were made using Atomic Force Microscopy (AFM) equipment SPI
3800 N. X-ray diffraction data were obtained from Shimadzu XD3A equipment, using CuKα
radiation source. The thermal stability was obtained by TGA Mettler Toledo-brand Tga/sdta 851.
The surface areas of the nanocomposite material were determined from the BET (Brunauer,
Emmett and Teller) multipoint method and the pore size distribution was obtained using the BJH
(Barret, Joyner and Halenda) method. For the calculation of the surface areas, the BET method
was used to elaborate N2 adsorption-desorption isotherms. Moreover, the calculations of surface
areas and micropore volumes were employed from the α-plot method. Pore volumes were
obtained from the adsorbed amounts of N2 at P/Po = 0.98 desorption curve, supposing the
presence of N2 (density = 0.807 gcm-3) in the pores under these conditions. Then, BJH (Barret,
Joyner and Halenda) method was used to determine the pore size distribution for silica-titania
hybrid matrix. For sensitivity and absorption analysis of sol, the calculations were taken using a
Perkin Elmer Lambda 25 spectrometer over 250-900 nm range.
4. Results and Discussion:
4.1. Morphology Analysis:

Page 5 of 30
Accep
ted
Man
uscr
ipt
5
The FE-SEM micrographs suggest that the indicator molecules are homogeneously diffused into
matrix pores of the silica-titania network as shown in Fig. 2(a, c). The matrix exhibits regular
morphology with large pores without any cracks. While, the porosity decreases with heat
treatment due to diffusion of indicator species. This suggests that the temperature leads to more
homogeneous surface with a smaller crystallite size and enlarged exposed surface of the
encapsulated indicators [22]. These micrographs also indicate that the crystallinity increases with
the heat treatment that would be expected as a result of phase change [23].
Fig. 2 FESEM micrographs of silica-titania encapsulated indicators matrix (a) as-synthesized (b)
after heat treatment 150 °C for 2 hrs (c, d) corresponding EDX spectra respectively. AFM
micrographs of silica-titania encapsulated indicators matrix (e) as-synthesized (f) after heat
treatment 150 °C for 2 hrs
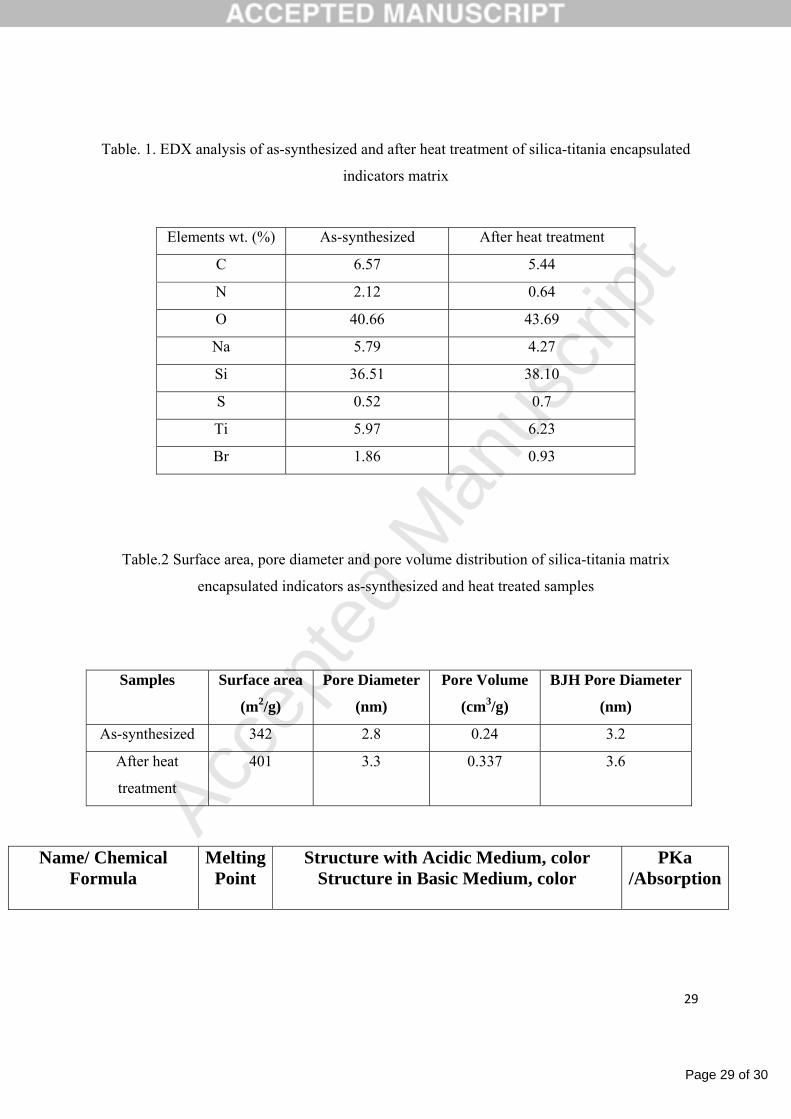
Table. 1. EDX analysis of as-synthesized and after heat treatment of silica-titania encapsulated
indicators matrix
Energy dispersive X-ray analysis was used to determine the elemental composition and to check
that the indicators have been incorporated into the silica-titania lattices. Fig 2 (c, d) shows the
EDX spectra obtained for silica-titania encapsulated pH sensing indicator dyes as-synthesized
and with heat treatments respectively. EDX analysis reveals that indicators are successfully
incorporated into the host matrix and shows the presence of N, S, Br, Na, which are elements of
indicators and shows variations after heat treatment. The values of elements are summarized in
Table.1. The variation in Si and Ti values increases after heat treatment owing to the growth of
particles. The amount of carbon incorporated into the matrix lattice is 5.44 % after heat treatment
that is a significant constituent of indicators and surfactant. Thus, encapsulation of indicators
within the matrix is successfully carried out. In order to investigate the silica-titania
nanoparticles’ surface modifications with encapsulation of indicators and heating, the samples
were evaluated by Atomic Force Microscopy (AFM). The morphological features of the
encapsulated pH indicators within silica-titania matrix thin film on the glass substrate were
examined over 5x5µm2 area. The topographies of samples are represented in terms of the
average roughness and root mean square roughness. The average roughness represents the 3-D
uniformity of the samples. A uniform distribution of grains can be observed in the as-synthesized
sample [Fig. 2(e)] with Ra= 2.15 nm and RMS= 6.33nm which shows relatively smooth surface.
Page 6 of 30
Accep
ted
Man
uscr
ipt
6
The dark regions can be assigned to the immobilized indicator molecules entrapped in the porous
voids of silica-titania matrix. The organic components fill the pores between the inorganic oxide
chains when integrated into the inorganic network. Thus, the film shows the appearance of
clusters, which are enormously small and closely packed [24]. The cluster structures are
impermeable to moisture and at a low temperature homogeneous and dense nanofilm was
obtained [25]. Furthermore, the higher homogeneity with low roughness values indicates good
encapsulation and strong interaction of indicators within the silica-titania network. Fig. 2 (f)
shows more regular surface after heat treatment for 2hr and observed large cavities with values
of Ra = 3.52 nm and RMC = 5.83 nm. The surface becomes rougher, and the broadening of the
roughness increases due to nucleation of the particles at temperature 150 °C for 2hr. The
particles grew in size and finally agglomerated. This is also consistent with the results reported in
the documented literature [26]. The increase of the particle size was also observed in XRD
section 4.2, calculated by Scherer formula. So, it can be suggested that roughness level
throughout the sample plays a significant role in sensing application.
4.2. Structural Analysis:
An XRD spectra of encapsulated indicators silica-titania nanocomposite matrix shows several
peaks of titania and silica throughout the samples as-synthesized and after heat treatment as
shown in Fig.3. In as-synthesized sample, (110) and (021) planes corresponding to orthorhombic
titania (JCPDS 23-1446) appeared. Under these conditions, less intense planes (200), (211) and
(213) belong to metastable anatase phase of titania (JCPDS 21-1276). Riaz et al. (2014) reported
that the sol synthesis and annealing conditions have a strong impact on crystallinity and phase
stability of specimen [27, 28]. Upon annealing the peak intensities corresponding to titania and
its phase (anatase) increases. Annealing strengthens the phases that were already present in the
as-synthesized sample. A low intense rutile phase peak with (211) plane indicating the
improvement in crystallinity. Rutile is the most thermodynamically stable form at all
temperatures and therefore most interesting for many optical applications. However, interestingly
the anatase metastable phase grows preferentially at lower temperatures and is suitable for film
formation on thermally sensitive substrates. [29]. Therefore, from the findings, it can be said that
annealing plays a vital role in phase variation with strength and crystalline growth of titanium
phases. Furthermore, a low intensity plane (002) corresponding to the silica phase (JCPDS 15-

Page 7 of 30
Accep
ted
Man
uscr
ipt
7
26) was also observed. So, the study shows that silica network incorporates the titania particles.
Furthermore, weak and broad diffraction patterns are attributed to less porosity due to the dyes
moieties, which extends into the pores of composite network, indicative of a lower crystalline
nature of films with short range mesostructured order. Additionally, it is inferred from XRD
results that mesostructure is prevalent in dye immobilized silica-titania films [30]. However,
crystallite size of encapsulated indicators silica-titania matrix as synthesized and after 2hr
heating at 150°C was calculated using Scherer formula given in (1)
D =kλ/βcosθ (1)
where k is the shape factor taken as 0.9, λ is the wavelength, β is full width at half maximum and
θ is the diffraction angle. Average crystallite size in as synthesized sample was calculated to be
3.07 nm, whereas larger crystallite sizes 3.82 nm were observed in the case of heat treated
sample. The crystallite size of thin films is extremely sensitive to the concentration of sol.
According to LaMer theory [31] in a homogenous solution, the particle formation depends on
nucleation process which leads to the coalescence of the particles from dissolved species; this
results in growth of nanoparticles to form larger particles [28, 32]. Thus, relatively larger
crystallite size was observed after heat treatment.
Fig. 3. XRD pattern of silica-titania encapsulated indicators (a) as-synthesized (b) after 2hr
heating at 150°C
4.3. Thermal Gravimetric Analysis:
The TGA (Thermal Gravimetric Analysis) and DTA (Differential Thermal Analysis) curves for
encapsulated indicators silica-titania matrix as-synthesized and heat treated sample in the 50−
600 °C temperature range are shown in Fig. 4 (a, b). The thermographs of both samples exhibit
almost a similar behavior. The as-synthesized sample followed two steps of mass weight loss.
The first step undergoing thermal degradation process, which starts at 60 °C with a weight loss
of 11.64 % and extending up to 160 ºC, is related to desorption of adsorbed water. In the second
step, the decomposition and expulsion of adsorbed organic fraction takes place in the range of
200 ºC- 550 ºC. These results reveal that sample was not fully dried and some physically bonded

Page 8 of 30
Accep
ted
Man
uscr
ipt
8
water was present in micropores and at the surface walls of composite, which caused a
subsequent weight loss of the 7.67 % at this temperature range [33]. This behavior relates to the
pyrolysis process of organic dyes, decomposition of surfactant (CTAB) [33], and follows the
escape of the physically bound water molecules from the silica-titania intermediate. Moreover, it
also indicates that the OH groups on the silica network are condensing to form Si–O–Si bridges
resulting in the weight loss. It has been previously reported that the weight loss at temperatures
lower than 270 °C in composites is due to the removal of physically absorbed water molecules
[34-37]. While, in the case of heat treated sample, the first regime corresponds to removal of
solvent residues and adsorbed water. The mass weight loss is 12.96%, which starts at lower
temperatures around 50 °C and is complete around 180 °C. The second regime corresponds to
thermal decomposition of dye in consonance with the melting point of dye followed by water
removal from framework hydroxyls [30, 37] and weight loss is 9.52% in the temperature range
of 200-550°C. The melting points of indicator dyes are summarized in Table.3 (section 4.5). The
weight loss in annealed sample is 1.85% higher than as-synthesized sample, that is indicative of
calcination of residual organics and development of titania phases. In both cases, as-synthesized
and annealed, the weight loss is not high, presumably because of good degree of polymerization
for silica-titania network formation and encapsulation of dyes within the network. Furthermore,
to pin−out the temperature corresponding to weight loss, the first order mathematical derivative
operation DTA was applied on both curves. The peak of the first derivative indicates the point of
greatest rate of change on the weight loss curve, this is also known as the inflection point. In
DTA, the loss of solvents and the combustion of organic material correspond to the peaks that
appear around 231 °C and shows that the material is endothermic in nature. These results reveal
that the sample was not fully dried and some physically bonded water was present in micropores
and at the surface walls of silica-titania crystals, which caused a subsequent loss of the mass at
the lowest temperatures. Furthermore, this indicates that after weight loss the indicators dyes
interact with the silica-titania mixed molecules more efficiently and leads to enhancement of the
sensing process. There is no significant change in weight beyond 300 °C implying that the silica
structure is fully developed, and the titania is transformed to the anatase and rutile phase.
Moreover, the effect of crystallization of matrix with small particle size is also considered.
However, it is seen that the materials do not show a significant weight loss after 400°C which is

Page 9 of 30
Accep
ted
Man
uscr
ipt
9
indicative of the thermally stable encapsulated dyes silica-titania matrix at the mentioned
temperature.
Fig.4. Weight (%) versus temperature (°C) and [dW/dT] (a) Silica-titania encapsulated indicators
as-synthesized (b) Silica-titania encapsulated indicators after 2hrs heat treatment at 150 °C
4.4. Surface area and pore size distribution characterization:
Mesoporous as-synthesized encapsulated indicators nanocomposite matrix has specific surface
area, pore diameter, and pore volume. This confirms that the nanocomposite structures are
preserved by drying at room temperature. However, after heat treatment at 150 °C for 2 hrs, it
has larger pore diameters, high pore volume and high surface area values which is advantageous
for sensing and catalytic applications. Table. 2 shows the values corresponding to surface area,
pore diameter, and pore volume. Both samples show a pronounced peak in the mesoporous
region 0-20 nm, as shown in Fig. 5.
Table.2 Surface area, pore diameter and pore volume distribution of silica-titania matrix
encapsulated indicators as-synthesized and heat treated samples
Fig.5. pore size distribution curves obtained by BJH (a) As-synthesized (b) after heat treatment
Fig.6. N2 Adsorption isotherms of (a) As-synthesized (b) after heat treatment
The adsorption-desorption isotherms of as-synthesized and annealed one are provided in Fig. 6.
The presence of a hysteresis loop indicates type IV behavior, particularly of mesoporous nature
and the hysteresis H2 type associated with ink-bottle pores is due to capillary condensation in the
pores of the matrix [38]. The samples have maximum area under the hysteresis loop indicating
that it has the maximum uniform pore size distribution in the mesopore region. The adsorption
isotherms of the annealed sample lie below indicating a lower pore volume, but have a similar
pattern as that observed in as-synthesized sample.
4.5. Chemical Analysis:
Basically, pH indicators are weak acids or base which is used in titrations to control the amount
of a chemical reaction in analytical experiments. When pH indicators are added into the solution,
they could bind hydrogen ion (H+) or hydroxide ions (OH-) and from changes in the way of when

Page 10 of 30
Accep
ted
Man
uscr
ipt
10
hydrogen ions are attached or detached from the electrons that are confined in a molecule
resulting in variations in color changes [39]. Usually, the indicator causes changes in colour of
the solution depending on the pH which can be observed visually. In this study, for the sensing
purpose of the broadening range, mixture of co-immobilized dyes namely
phenolphthalein (C20H14O4), phenol red (C19H14O5S), bromophenol blue (C19H10Br4O5S) and
cresol red (C21H17NaO5S) were selected. This mixture of indicators has spectral similarity in
absorption, emission and effective behavior towards the ionic strength. These dyes have valuable
properties because of their wide range from near UV to the near-IR regions of the spectrum [18,
19]. The characteristics of indicator dyes are summarized in Table. 3. For color determination,
from visual observations it can be observed that the co-indicators show yellowish-green color in
acidic solution that changes into blue color by increasing the pH values; this refers to Fig. 7(a).
In contrast, the silica-titania mixed sol with entrapped co-indicators exhibits several colours i.e.
bright yellow color at lower pH values, but when the pH level is increased, the color
progressively changes into light green and light purple to dark purple as observed in Fig. 7(b).
The colour change of the sol was fast within seconds when immersed in pH solutions. This is a
significant improvement over previous work reported in the literature and the stated response
times were in the order of 20-100 minutes [40]. Moreover, the variations in color in different pH
solutions are due to hydroxyl ions that freely penetrate into the matrix and react with indicators.
Fig. 7. Colour variation corresponding to different pH ranges 3-12 (a) Mixture of indicators (b)
encapsulated indicators within silica-titania matrix
Table.3. Characteristics/Properties of Indicator dyes
Every indicator exists in two forms: acid form and base form which corresponds to the two
absorption bands respectively. These bands are due to π-π* and n–π* transitions [36]. The
absorption spectrum of the free indicators before exposing to pH effect was low at 425 nm as
shown in Fig. 8. However, after exposing with pHs, there are two distinct transitions that can be
seen in Fig. 8; one, absorption band was observed at 593 nm corresponding to higher pHs with
maximum absorption for the mixture of free indicators in ethanol solution. Whereas, an
absorption band was observed at 300 nm corresponding to lower pHs with minimum absorption.

Page 11 of 30
Accep
ted
Man
uscr
ipt
11
The absorption spectra of the free indicators at different pH values were shown in Fig. 8. These
transitions were due to the changes in colours with the presence of two isosbestic points at 395
nm and 480 nm. This provides evidence for the presence of two equilibriums, the first
equilibrium at pH 3–7 is between acid and neutral forms of indicators and the second equilibrium
at pH 7–12 is between neutral and base forms. The pKa (acid dissociation constant) value of free
co-indicators mixture was calculated from the relationship between pH and absorbance and its
calculated value is 3.75 at the wavelength of 593 nm by UV-Vis spectroscopic method, which
can be seen in Fig. 8 [Inset (b)].
Fig.8. Absorption spectra of co-indicators solution at different pH values 3-12. Inset (a) is
showing the color variations in different pH solutions. Inset (b) pKa value of co-indicator
solution at 593nm for pH 3-12.
Fig.9. Absorption spectra of encapsulated indicators silica-titania matrix sol at different pH
values 3-13. Inset (a) is the variations in colors in different pH values 3-12 and inset (b) pKa
value of corresponding to absorption at pH 3-12.
The silica-titania matrix in the presence of surfactant has maximum absorption at lower
wavelengths. While absorption values decreases after the addition of indicators as shown in Fig.
9. When the encapsulated indicators-CTAB were treated with pH 3-12 solutions, the absorption
bands around 280-350 nm and 500-650 nm can be clearly observed in Fig. 9. These bands
correspond to different pH values with two indicating transitions. The first transition at pH 2–7
was due to the change of yellow color (acid form) to green color (neutral form) and the second
transition at pH 8–12 was due to the change of green color (neutral form) to purple color (base
form). In the presence of CTAB, the hydrophobic non-charged indicator molecules are
transferred to anionic hydrophilic species and formation of ion pairs between the CTAB cationic
surfactant and the anionic species of indicators. There is change of pKa to more basic in the
presence of cationic surfactant CTAB. Furthermore, the maximum absorption observed at lower
pH values is also indicated in color observations. However, when the sol is treated with pH 9, the
absorption band occurs at 430 nm without significant changes of absorbance with the presence of
an isosbestic point at 490 nm. This provides evidence for the presence of equilibrium, Pka found

Page 12 of 30
Accep
ted
Man
uscr
ipt
12
to be 9.3 is probably that in basic medium, the anions are perhaps involved in weak Vander
Walls interactions with silica-titania species. The variation of absorbance with pH of solution is
shown in Fig. 9 [Inset (b)]. This corresponds to the pH value at half the maximum absorbance
and favored with the presence of indicators anions. A larger pKa value has a smaller degree of
dissociation at any given pH. So, the encapsulation process has resulted in a pKa dye shift and
broadening in the dye pH range. Furthermore, the shifting of absorption bands towards higher
and lower energy values probably correspond to a change of the acidic form to basic form of
indicators [41]. It can be observed that sensitivity is good between pH 3-5 for acids and for bases
pH 11-12. To investigate the time response of fabricated sensor, a graph is plotted between
response time and absorption of the encapsulated co-indicator silica-titania matrix as shown in
Fig. 10. Fast response was observed for the fabricated sensor sol in basic medium at minimum
absorption. However, at maximum absorption, the response time of the sensor sol was quite low
in acidic medium. The time response recorded for pH 12 is 1.03 seconds and for pH 3 is 6.9
seconds.
Fig. 10 Time versus absorption of encapsulated co-indicator silica-titania matrix within different
pH ranges 3-12
4.6. Stability, reproducibility and reversibility of fabricated Sensor:
To investigate the stability of encapsulated indicators silica-titania nanocomposite matrix, the sol
was examined after a period of six months. After six months, the absorbance spectrum of the
film was the same with fast response time. The colour of the sol also has not changed. The result
is shown in Fig. 11. This may prove that the encapsulation of indicators within the network of
silica-titania nanocomposite matrix is fully stable after a period of six months. In addition, for
repeatability and reproducibility, three cycle absorption measurements against pHs 3-12 were
conducted. The colour variations were also recorded for these measurements. The cycles were
repeated every 2 hrs from the previous one to check the intraweek reproducibility. Fig. 12 shows
that the absorbance after each measurement does not show any remarkable changes; it is also
evident from color bar strips. These results indicated that the fabricated sensor has long life and
can be reproducible/repeatable.

Page 13 of 30
Accep
ted
Man
uscr
ipt
13
Fig. 11. Absorbance spectra of encapsulated indicator silica-titania matrix sol at pH 3-12 verses
time. Inset down strip showing the colour response to each pH value 3-12
Fig. 12. Absorbance spectra of encapsulated indicator silica-titania matrix sol at pH 3-12 verses
pHs. Inset down strip showing the colour response to each pH value 3-12
Two pH values 3 and 12 were used to check the extent of reversibility of silica-titania
encapsulated indicators matrix in terms of color change. Fig. 13 shows the changes of colours,
forward and backward. The response time was around 2 seconds in both ways. So, the study
shows that the prepared encapsulated matrix acts as fast reversible sensors.
Fig. 13 Reversibility of sol sensor at pH ranges 3 and 12 in terms of colour changes
5. Conclusion:
Encapsulated indicator silica-titania nanocomposite matrix was obtained via the sol-gel method.
The microscopic analysis indicates after heat treatment at 150 °C for 2hrs, that the particles are
uniformly distributed without any cracks/defects. It can also be observed that the
interconnectivity of indicators with matrix has a significant role in the increased stability and
sensitivity of the present sensor. EDX analysis substantiated the stoichiometric formation of
encapsulated silica-titania nanocomposite matrix. XRD results showed average crystallite size
3.82 nm in case of heat treated sample. Thermally stable matrix presents mainly mesoporous
nature with high surface area 401 m2/g, a pore size of 3.3 nm and pore volume of 0.33 cm3/g.
The highly porous nature makes silica-titania network to excellent host for sensing molecules
and it shows anion exchange properties that allow the encapsulation of pH sensing dyes.
Therefore, the sensing species straightforwardly diffuse towards the sensing centres. The
experimental findings reveal that thermally stable nanosensor allowed good indicator’s
interaction with silica-titania host matrix and improved signal sensitivity due to the good
incorporation between surfactant, indicators and host matrix species. Furthermore, UV-Vis

Page 14 of 30
Accep
ted
Man
uscr
ipt
14
spectroscopy determination revealed that the prepared nanomatrices shows good sensitivity
between pH ranges of 3-5 for acidic medium within 6.9 seconds and pH 12 for basic medium
within 1.03 seconds. The calculated dynamic pH value is 9.3 and is indicative that pH sensor is
more responsive towards strong basis. So, it can be concluded that the fabricated mesoporous
silica-titania nanocomposite matrix is an excellent material for binding organic compounds for
optical pH sensing and has potential for usage in industrial and scientific research field due to its
stability, reproducibility/repeatability, reversibility, fast response and long life time behavior.
Acknowledgments:
The authors would like to acknowledge the Malaysian Ministry of Education and Universiti
Teknologi Malaysia through RMC for the financial support of this project.
References:
[1] D. A. Nivens, Y. Zhang, S. M. Angel, A fiber-optic pH sensor prepared using a base-
catalyzed organo-silica sol-gel, Analytica Chimica Acta. 376 (1998) 235-245.
[2] G. Beltran-Perez, F. Lopez-Huerta, S. Munoz-Aguirre, J. Castillo-Mixcoatl, R. Palomino-
Merino, R. Lozada-Morales, O. Portillo-Moreno, Fabrication and characterization of an optical
fiber pH sensor using sol–gel deposited TiO2 film doped with organic dyes, Sensors and
Actuators B: Chemical, 120 (2006) 74-78.
[3] F. Hoffmann, M. Cornelius, J. Morell, M. Froba, Silica-based mesoporous organic-inorganic
hybrid materials. Angewandte Chemie, 45 (2006) 3216-3251.
[4] A. Hilonga, J. Kim, P. B. Sarawade, H. T. Kim, Titania–silica composites with less
aggregated particles, Powder Technology. 196 (2009 ) 286-291.
[5] E. Pabon, J. Retuert, R. Quijada, Synthesis of mixed silica-titania by the sol–gel method
using polyethylenimine: porosity and catalytic properties, Journal of Porous Materials, 14 (2) (
2007) 151-158.
[6] D. J. Taylor, Laser processing of sol-gel coatings, Journal of Non-Crystalline Solids, 147–
148 (1992) 457–462.
[7] H. Yanagi, T. Hishiki, T. Tobitani, A. Otomo, S. Mashiko, Thin film lasing from a dye-doped
silica/titania composite, Chemical Physics Letters. 292 (3) (1998) 332-338.

Page 15 of 30
Accep
ted
Man
uscr
ipt
15
[8] S. G. Dastidar, P. Bharath, A. Roy, Rayleigh like scattering from silica–titania core-shell
particles and their application in protection against harmful ultraviolet rays, Bulletin Material
Science. 34(2) (2011)199–206.
[9] G. Zu, J. Shen, W. Wang, L. Zou, Y. Lian, Z. Zhang, Silica-titania composite aerogel
photocatalysts by chemical liquid deposition of titania onto nanoporous silica scaffolds. ACS
Applied Mater Interfaces. 7(9) (2015) 5400-9.
[10] K. Guin, S. K. Nayak, T. K. Rout, N. Bandyopadhyay, D. K. Sengupta, Corrosion behavior
of nanohybrid titania–silica composite coating on phosphated steel sheet, Journal of Coatings
Technology and Research, 9 (1) (2012) 97–106.
[11] Z. Haider, Y. B. Munajat, R. Kamarulzaman, N. Shahami, Comparison of single pulse and
double simultaneous pulse laser induced breakdown spectroscopy, Analytical Letters, 48 (2015)
308–317.
[12] Z. Li, B. Hou, Y. Xu, D. Wu, Y. Sun, Hydrothermal synthesis, characterization, and
photocatalytic performance of silica-modified titanium dioxide nanoparticles, Journal of Colloid
and Interface Science. 288 (2005) 149–154.
[13] M. H. Razali, C. A. Ruslimie, W. M. Khairul, Modification and performances of TiO2
photocatalyst towards degradation of paraquat dichloride, Journal of Sustainability Science and
Management. 8 (2) (2013) 244-253.
[14] A. Perro, S. Reculusa, E. Bourgeat-Lami, E. Duguet, S. Ravaine, Synthesis of hybrid
colloidal particles: From snowman-like to raspberry-like morphologies, Colloids and Surfaces A:
Physicochem. Eng. Aspects. 284 (2006) 78–83.
[15] N. Bidin, S. N. A. Razak, Crystallization of poly-silicon film by different annealing
techniques, IEEE Journal. 978-1-4577 (2011) 0069-11.
[16] B. H. Zhijie Li, Y. Xu, D. Wu, Y. Sun,, W. Hu, F. Deng, Comparative study of sol–gel-
hydrothermal and sol–gel synthesis of titania–silica composite nanoparticles, Journal of Solid
State Chemistry. 178 (2005) 1395-1405.

Page 16 of 30
Accep
ted
Man
uscr
ipt
16
[17] Y. M. Kwon, Preparation and characterization of sol-gel derived titania-silica thin films,
San Jose State University, 1996.
[18] S. Islam, R. A. Rahman, Z. Othaman, S. Riaz, S. Naseem, Synthesis and characterization of
hybrid matrix with encapsulated organic sensing dyes for pH sensing application. Journal of
Industrial and Engineering Chemistry 20 (2014) 4408–4414.
[19] S. Islam, R. A. Rahman, Z. Othaman, S. Riaz, S. Naseem, Synthesis and characterization of
multilayered Sol–Gel based plastic-clad fiber optic pH sensor, Journal of Industrial and
Engineering Chemistry, 23 (2015) 140–144.
[20] C. J. Brinker, R. Sehgal, S. L. Hietala, R. Deshpande, D. M. Smith, D. Loy, C. S. Ashley,
Sol-Gel strategies for controlled porosity inorganic materials, Journal of Membrane Science, 94
(1994) 85-102.
[21] S. Islam, R. Rahman, Z. Othaman, S. Riaz, M.A. Saeed, S. Naseem, Preparation and
characterization of crack-free sol–gel based SiO2–TiO2 hybrid nanoparticle film, Journal of Sol-
Gel Science and Technology. 68 (2013) 162-168.
[22] I. M. El-Nahhal, S. M. Zourab, N. M. El-Ashgar, Encapsulation of phenolphthalein pH-
indicator into a sol-gel matrix, Journal of Dispersion Science and Technology. 22 (2001) 583-
590.
[23] S. M. Melpolder, A. W. West, C. L. Barnes, T. N. Blanton, Phase transformations in TiO2
/SiO2 sol-gel films as a function of composition and heat-treatment. Journal of Material Science.
26 (1991) 3585-3592.
[24]. S. Ohkoshi, Y. Tsunobuchi, T. Matsuda, K. Hashimoto, A. Namai, F. Hakoe, H. Tokoro,
Synthesis of a metal oxide with a room-temperature photoreversible phase transition. Nature
Chemistry. 2 (2010) 539-545.
[25]. D. Shuxi, W. Yanqiang, S. Toshio, D. Zuliang, S. Hideki, A. Masahiko, Preparation of
highly crystalline TiO2 nanostructures by acid-assisted hydrothermal treatment of hexagonal-
structured nanocrystalline titania/cetyltrimethyammonium bromide nano skeleton, Nanoscale
Research Letters, 5 (2010) 1829.
[26]. C. Gopinathan, M. Kavitha, P. Pandi, Optical properties of (AR) multilayer thin film for
solar cell application. I. OSR Journal of Applied Chemical Material, 4(4) (2013) 01.

Page 17 of 30
Accep
ted
Man
uscr
ipt
17
[27] S. M. H. Shah, S. Riaz, A. Akbar, S. Atiq, S. Naseem, Effect of solvents on the
ferromagnetic behavior of undoped BiFeO3 prepared by sol-gel, IEEE Transactions on
Magnetics, 50 (8) (2014) 2200904.
[28] S. Riaz, R. Ashraf, A. Akbar, S. Naseem, free growth of iron oxide nanostructures by sol-
gel spin coating technique-structural and magnetic properties, IEEE Transactions On Magnetics,
50(8) ( 2014 ) 2301805 .
[29] L. H. Michael, S. E. Alexandrov, New approaches to titania and silica CVD, The
Electrochemical Society Interface, 2001.
[30] S. S. Chauhan, R. V. Jasra, A. L. Sharma, Structural, Optical, and pH-stimulus response
properties of cresol red immobilized nanocomposite silica films derived by a sol−gel process
employing different synthetic routes, Industrial & Engineering Chemistry Research, 53 (49)
(2014) 18863–18872.
[32] Aseya Akbar, Saira Riaz, Mahwish Bashir, and Shahzad Naseem, Effect of Fe3+/Fe2+ ratio
on superparamagnetic behavior of spin coated iron oxide thin films, IEEE Transactions On
Magnetics, 50 ( 8) (2014) 2200804.
[33] Y. Shizhuo, B. R. Paul, T. S. Y. Francis, Fiber Optic Sensors. CRC Press, (2008).
[34]. M. I. B. Bernardi, E. J. H. Leea, P. N. Lisboa-Filhoa, E. R. Leitea, E. Longoa, J. A. Varela,
TiO2 thin film growth using the MOCVD method. Materials Research, 4 (2001) 223-226.
[35]. X. Wang, G. Wu, B. Zhou, J. Shen, Optical constants of crystallized TiO2 coatings
prepared by sol-gel process. Materials, 6 (7) (2013) 2819-2830.
[36]. I. El Nahhal, S. Zourab, F. Kodeh, F. Babonneau, W. Hegazy, Sol–Gel encapsulation of
cresol red in presence of surfactants. Journal of Sol-Gel Science and Technology, 62 (2) (2012)
117-125.
[37] S. Islam, S. Riaz, R. A. Rahman, S. Naseem, Z. Othaman, Structural and dielectric
properties of boron-doped and un-doped mullite thin films, Journal of Sol-Gel Science and
Technology, 74 (2015) 368–377.

Page 18 of 30
Accep
ted
Man
uscr
ipt
18
[38] S. M. Abdel-Azim, A. K. Aboul-Gheit, S. M. Ahmed, D. S. El-Desouki, M. S. A. Abdel-
Mottaleb, Preparation and application of mesoporous nanotitania photocatalysts using different
templates and pH media, International Journal of Photoenergy, 2014 (2014) 11.
[39] I. A. Qudaih, Thin film of optical pH sensors using spin coating in chemistry. 2010, Al-
Azhar University of Gaza, Palestine.
[40] R. Makote, M. M. Collinson, Organically modified silicate films for stable pH sensors,
Analytica Chimica Acta. 394 (1999) 195-200.
[41] F. R. Zaggout, N. M. El-Ashgar, S. M. Zourab, I. M. El-Nahhal, H. Motaweh,
Encapsulation of methyl orange pH-indicator into a sol-gel matrix, Materials Letters. 59 (2005)
2928-2931.
Prof. Dr. Noriah Bidin is currently working as director and full Professor in Laser Centre, Ibnu Sina Institute for Scientific and Industrial Research, Universiti Teknologi Malaysia. She obtained her PhD degree from Universiti Teknologi Malaysia in 1995. She has more than 100 publications with 50 impact factor. Her research interests include nanomaterials and their applications in chemical sensors, Bio-medical and lasers.
Prof. Dr. Roslay Abdul Rahman is full Professor in Laser Centre, Ibnu Sina Institute for Scientific and Industrial Research, Universiti Teknologi Malaysia. He obtained his PhD degree from Universiti Teknologi Malaysia in 1995. He has many publications in reputed scientific journals. His research interests include chemical sensors, and photonic devices.

Page 19 of 30
Accep
ted
Man
uscr
ipt
19
Prof. Dr. Shahzad Naseem is currently working as director and full Professor in Centre of Excellence in Solid State Physics, University of the Punjab, Lahore Pakistan. He obtained his PhD degree from University of Northumbria at Newcastle, UK in 1985 and Post-Doc from University of Cambridge, UK in 1996. He has got many awards like Gold Medal for Outstanding Achievements, awarded by Pakistan Academy of Sciences, in 2013. Post-Doctoral Award of Association of Common wealth Universities, in 1996. Quaid-e-Azam Scholarship, Ministry of Education, Govt. of Pakistan, 1983-85. Gold Medal for standing 1st on Merit in M.Sc. (Physics), B.Z. University Multan, in 1981. He has more than 450 publications including 259 Journal Papers with 228.9 Impact Factor and 247 Conference Proceedings. He worked on PV Devices for space use and also put forward theory of working of these devices which was debated world over in the scientific community for many years to come. He started M.Phil. in Microelectronic Engineering & Semiconductor Physics for the first time in Pakistan. He has also introduced MS Nanotechnology for the first time in Pakistan. So far, he has supervised 173 research theses in the fields of PV, LCD, Microelectronics, Spintronics etc.
Dr. Saira Riaz is currently working as associate professor in Centre of Excellence in Solid State Physics, University of the Punjab, Lahore Pakistan. She obtained her Ph.D. from Solid State Physics, University of the Punjab in 2008 and Post‐doc from Department of Electronics, University of York, Heslington, York, UK in 2008. She got many awards like 1st position in District Okara in S.S.C. Examination. President Scholarship holder in S.S.C. & F.Sc. 1st position in M.Phil. Solid State Physics. Training Program Scholarship from HEC, Pakistan in 2006. International Research Support Initiative (IRSI) Scholarship from HEC, from Pakistan, in 2006. Post‐doc Fellowship, NCNST, Pakistan, in 2008. She has more than 200 publications including 150 Journal Papers with 100 Impact Factor and Conference Proceedings. She worked on electronic devices. So far, she has supervised 100 research theses in the fields of PV, Spintronics, nano-materials etc.
Dr. Shumaila Islam received a PhD- from Laser Centre, Ibnu Sina Institute for Scientific and Industrial Research, Universiti Teknologi Malaysia in 2015. She has many publications. Her research interests include nanomaterials and their applications in opto-electronic devices.

Page 20 of 30
Accep
ted
Man
uscr
ipt
20
Fig. 1. Overall outline of the synthesis and coating

Page 21 of 30
Accep
ted
Man
uscr
ipt
21
(e) (f)
(a)
(b)
(c)
(d)

Page 22 of 30
Accep
ted
Man
uscr
ipt
22
Fig. 2 FESEM micrographs of silica-titania encapsulated indicators matrix (a) as-
synthesized (b) after heat treatment 150 °C for 2 hrs (c, d) corresponding EDX spectra
respectively. AFM micrographs of silica-titania encapsulated indicators matrix (e) as-synthesized
(f) after heat treatment 150 °C for 2 hrs
Fig. 3. XRD pattern of silica-titania encapsulated indicators (a) as-synthesized (b) after 2hr
heating at 150°C
(a) (b)

Page 23 of 30
Accep
ted
Man
uscr
ipt
23
Fig.4. Weight (%) versus temperature (°C) and [dW/dT] (a) Silica-titania encapsulated indicators
as-synthesized (b) Silica-titania encapsulated indicators after 2hrs heat treatment at 150 °C
Fig.5. pore size distribution curves obtained by BJH (a) As-synthesized (b) after heat
treatment

Page 24 of 30
Accep
ted
Man
uscr
ipt
24
Fig.6. N2 Adsorption isotherms of (a) As-synthesized (b) after heat treatment
Fig. 7. Colour variation corresponding to different pH ranges 3-12 (a) Mixture of indicators (b)
encapsulated indicators within silica-titania matrix
(a)
(b)
3 4 5 6 7 8 9 10 11 12

Page 25 of 30
Accep
ted
Man
uscr
ipt
25
Fig.8. Absorption spectra of co-indicators solution at different pH values 3-12. Inset (a) is
showing the color variations in different pH solutions. Inset (b) pKa value of co-indicator
solution at 593nm for pH 3-12.
(a)
(b)

Page 26 of 30
Accep
ted
Man
uscr
ipt
26
Fig.9. Absorption spectra of encapsulated indicators silica-titania matrix sol at different
pH values 3-13. Inset (a) is the variations in colors in different pH values 3-12 and inset (b) pKa
value of corresponding to absorption at pH 3-12.
(a)
(b)

Page 27 of 30
Accep
ted
Man
uscr
ipt
27
Fig. 10 Time versus absorption of encapsulated co-indicator silica-titania matrix within
different pH ranges 3-12
Fig. 11. Absorbance spectra of encapsulated indicator silica-titania matrix sol at pH 3-12
verses time. Inset down strip showing the colour response to each pH value 3-12

Page 28 of 30
Accep
ted
Man
uscr
ipt
28
Fig. 12. Absorbance spectra of encapsulated indicator silica-titania matrix sol at pH 3-12
verses pHs. Inset down strip showing the colour response to each pH value 3-12
Fig. 13 Reversibility of sol sensor at pH ranges 3 and 12 in terms of colour changes
Page 29 of 30
Accep
ted
Man
uscr
ipt
29
Table. 1. EDX analysis of as-synthesized and after heat treatment of silica-titania encapsulated
indicators matrix
Table.2 Surface area, pore diameter and pore volume distribution of silica-titania matrix
encapsulated indicators as-synthesized and heat treated samples
Name/ Chemical Formula
Melting Point
Structure with Acidic Medium, color Structure in Basic Medium, color
PKa /Absorption
Elements wt. (%) As-synthesized After heat treatment
C 6.57 5.44
N 2.12 0.64
O 40.66 43.69
Na 5.79 4.27
Si 36.51 38.10
S 0.52 0.7
Ti 5.97 6.23
Br 1.86 0.93
Samples
Surface area
(m2/g)
Pore Diameter
(nm)
Pore Volume
(cm3/g)
BJH Pore Diameter
(nm)
As-synthesized 342 2.8 0.24 3.2
After heat
treatment
401 3.3 0.337 3.6

Page 30 of 30
Accep
ted
Man
uscr
ipt
30
PhenolpthaleinC20H14O4
260 °C
0−8.2, Colorless 8.2−12.0, Fuchsia
9.6/
λmax= 552 nm (1st) and
374 nm (2nd)
Phenol Red C19H14O5S
300 °C
6.8, Yellow 8.2, Fuchsia
8.0 /
λmax = 430 - 435 nm (1st)
and 557 -560 nm (2nd)
Bromophenol blue C19H10Br4O5S
279 °C
3.0, Yellow 4.6, Purple
4.1/
λmax = 430 nm in its yellow
acidic form to 600 nm in
its blue basic form
[128].
Cresol red C21H17NaO5S
250 °C
7.2, Yellow 8.8, Purple
8.2/ λmax = 570
nm (1st) and 367 nm (2nd)


