Embed Size (px)
Citation preview

BioMed CentralBMC Genomics
ss
Open AcceResearch articleERK1 and ERK2 MAPK are key regulators of distinct gene sets in zebrafish embryogenesisSF Gabby Krens*, Maximiliano Corredor-Adámez, Shuning He, B Ewa Snaar-Jagalska and Herman P Spaink*Address: Institute of Biology, Leiden University, Wassenaarseweg 64, 2333 AL Leiden, The Netherlands
Email: SF Gabby Krens* - [email protected]; Maximiliano Corredor-Adámez - [email protected]; Shuning He - [email protected]; B Ewa Snaar-Jagalska - [email protected]; Herman P Spaink* - [email protected]
* Corresponding authors
AbstractBackground: The MAPK signaling proteins are involved in many eukaryotic cellular processes andsignaling networks. However, specific functions of most of these proteins in vertebratedevelopment remain elusive because of potential redundancies. For instance, the upstreamactivation pathways for ERK1 and ERK2 are highly similar, and also many of their knowndownstream targets are common. In contrast, mice and zebrafish studies indicate distinct roles forboth ERKs in cellular proliferation, oncogenic transformation and development. A majorbottleneck for further studies is that relatively little is known of in vivo downstream signaling specificfor these kinases.
Results: Microarray based gene expression profiling of ERK1 and ERK2 knockdown zebrafishembryos at various stages of early embryogenesis resulted in specific gene expression signature setsthat showed pronounced differences in gene ontology analyses. In order to predict functions ofthese genes, zebrafish specific in silico signaling pathways involved in early embryogenesis wereconstructed using the GenMAPP program. The obtained transcriptome signatures were analyzedin the BMP, FGF, Nodal and Wnt pathways. Predicted downstream effects of ERK1 and ERK2knockdown treatments on key pathways responsible for mesendoderm development wereconfirmed by whole mount in situ hybridization experiments.
Conclusion: The gene ontology analyses showed that ERK1 and ERK2 target common and distinctgene sets, confirming the difference in knockdown phenotypes and diverse roles for these kinasesduring embryogenesis. For ERK1 we identified specific genes involved in dorsal-ventral patterningand subsequent embryonic cell migration. For ERK2 we identified genes involved in cell-migration,mesendoderm differentiation and patterning.
The specific function of ERK2 in the initiation, maintenance and patterning of mesoderm and endoderm formation was biologically confirmed.
Published: 28 April 2008
BMC Genomics 2008, 9:196 doi:10.1186/1471-2164-9-196
Received: 20 December 2007Accepted: 28 April 2008
This article is available from: http://www.biomedcentral.com/1471-2164/9/196
© 2008 Krens et al; licensee BioMed Central Ltd. This is an Open Access article distributed under the terms of the Creative Commons Attribution License (http://creativecommons.org/licenses/by/2.0), which permits unrestricted use, distribution, and reproduction in any medium, provided the original work is properly cited.
Page 1 of 21(page number not for citation purposes)

BMC Genomics 2008, 9:196 http://www.biomedcentral.com/1471-2164/9/196
BackgroundERK1 and ERK2 (Extra-cellular signal Regulated proteinKinases) are most likely the best studied members of themitogen activated protein kinase (MAPK) proteins.Despite much effort and their biological and medicalimportance, still relatively few in vivo downstream targetsof these kinases have been identified conclusively, espe-cially when considering the numerous cellular events andsignaling networks they are involved in [1]. Most of thetarget proteins and downstream genes have been identi-fied by in vitro studies using cell culture systems. Specificroles for both ERKs are described for cellular proliferation,as mouse embryos fibroblasts (MEF) isolated from erk1-/-mice grew faster than wild type cells. The tumorgenicity oftransplanted NIH 3T3 cells stably expressing an oncogenicform of Ras in nude mice was largely inhibited by co-transfection of ERK1, but not by ERK2 or p38 [2]. In dis-eases, ERK1 and ERK2 can display distinct cellular func-tions, as has been shown for the formation of cancer [3].The upstream activators MEK1 and MEK2 have also beenshown to play a role in human diseases such as Cardio-Facio-Cutaneous (CFC) syndrome [4]. In addition, diver-gent roles for ERK1 and ERK2 were already shown by thedifferent effect of the knockout studies performed in micesince erk1-/- mice are viable and fertile [5], while erk2-/-mice die in utero before embryonic day (E) 8.5 [6].
To study and compare the developmental roles of ERK1and ERK2 we used specific morpholino antisense oligonu-cleotides (MO), to block translation of ERK1 and ERK2.We previously showed that saturated knockdown condi-tions of ERK2 led to severe phenotype, as ERK2MO mor-phants did not go into epiboly, whereas ERK1MOmorphants still developed further and entered gastrula-tion stages. In addition, immuno-histochemical studiesshowed that ERK phosphorylation was completely abol-ished in the blastula margin of ERK2 morphants, indicat-ing that ERK2 is the active ERK MAPK in the margin andessential for epiboly initiation and further progression ofthe developmental program (Krens et al., manuscript inpreparation). Possibly ERK2 also functions in mesendo-dermal differentiation processes in the blastula margin, asFGF is known to activate the canonical MAPK pathway ina Ras dependent manner (reviewed by Gotoh and Bot-tcher [7,8]). The severe phenotype of ERK2 morphantsindicate that ERK2 has a more dominant role than ERK1during early developmental processes, as also suggestedby the mice knockout phenotypes.
Here we aim to further determine specific downstreamgene targets of ERK1 and ERK2 during vertebrate develop-ment, by performing expression profiling analysis using amicroarray approach. We compared the expression pro-files of ERK1 and ERK2 knockdown embryos, using spe-cific morpholino antisense oligonucleotides (MO), which
specifically block the translation of a gene of interest intoa functional protein [9]. Recently developed software pro-grams and web-based analysis tools, e.g. Rosetta Resolver,GenMAPP and GeneTOOLS eGOn were used for theprocessing and comparisons of large expression datasetsand biological interpretation of the data and to facilitatethe prediction of interconnections between developmen-tal signaling pathways that were tested by biologicalassays (qPCR and in situ hybridizations).
Analysis of the obtained data revealed that ERK1MO andERK2MO knockdown affect signature sets of common tar-get genes, as well as signature sets of specific genes. Sur-prisingly, we also identified gene sets in which theexpression patterns were anti-correlated. Several signaturemarker genes identified in this study were confirmed byquantitative real time PCR and in situ hybridization. Weperformed signaling pathway analysis on the obtainedERK1 and ERK2 transcriptome signatures, using the Gen-MAPP software program [10,11] for the analysis of impor-tant signaling cascades during early vertebratedevelopment. These include BMP, FGF, Nodal and Wntsignaling pathways [12]. For ERK1 knockdown we identi-fied a connection with genes involved in dorsal-ventralpatterning and subsequent embryonic cell migration. ForERK2 knockdown we identified a connection with genesinvolved in mesoderm and endoderm initiation, differen-tiation and patterning. Many of these genes also play arole in morphogenic cell migration processes during laterstages of development. The outcomes of the predictionsfor ERK2 knockdown on developmental signaling wereconfirmed by in situ hybridization experiments indicatingthat ERK2 controls mesoderm and endoderm initiation,maintenance and patterning.
ResultsDistinct gene expression signature sets of ERK1 and ERK2 knockdown embryosA morpholino knockdown approach was used to blocktranslation of either ERK1 or ERK2 by injection of 0.4 mM(= 3.4 ng/embryo) morpholinos (MO) targeting ERK1(ERK1MO) or ERK2 (ERK2MO). The knockdownembryos, also referred to as morphants, showed severephenotypes after depletion of ERK2. These embryos didnot enter epiboly at 4.5 hpf and the blastula cellsremained on top of the yolk, preventing further develop-ment of the embryo (Fig. 1C). In addition, ERK2 knock-down induces disorganization of the margin. (Fig. 1F).Wild type embryos reached 30% epiboly at this time (Fig.1A,D) [13]. In contrast, ERK1 morphants did not showany obvious phenotypes at this point yet and had enteredepiboly (Fig. 1B,E). However, ERK1 morphants did showstrong phenotypes at later stages in embryogenesis (man-uscript in preparation and additional file 2).
Page 2 of 21(page number not for citation purposes)

BMC Genomics 2008, 9:196 http://www.biomedcentral.com/1471-2164/9/196
The specificity of ERK1 and ERK2 knockdown phenotypeswas rescued by co-injection of synthetic mRNA (data notshown, manuscript in preparation), western blot analysis(Fig. 1J) and immuno-localization in wildtype, ERK1MOand ERK2MO injected embryos at 4.5 hpf (Fig. 1G–I)using a phospho-specific ERK antibody (dpERK). ERK1morphants (Fig. 1H) show similar levels of dpERK stain-ing at the dorsal margin compared to wild type embryos(Fig. 1G), but the dpERK signal in ERK1 morphants isreduced at the ventral half of the margin. ERK2MOinjected embryos hardly show any dpERK staining and theactive ERK signal is depleted from the marginal ring inthese embryos (Fig. 1I). Quantification of a western blotanalysis of zebrafish wild type, ERK1MO and ERK2MO
injected embryos, probes with a global ERK antibody(Santa Cruz Biotechnology), recognizes both zebrafishERK1 (45.7 kD) and ERK2 (43.3 kD) protein clearlyshows the specific knockdown of either ERK1 or ERK2 bythe corresponding morpholino (Fig. 1J).
Addition of different MEK specific inhibitors (U0126 orPD98059, Cell Signaling technologies), did not result inthe same phenotypes as obtained by the ERK2MO medi-ated knockdown. The inhibiting effects of these drugswere confirmed by Western blot analysis, but apparentlythese effects were not efficient enough to block epiboly(data not shown). Because it is not possible to address thespecific functions of either ERK1 or ERK2 using these
Phenotype and Function analysis of morpholino mediated knockdown of ERK1 and ERK2Figure 1Phenotype and Function analysis of morpholino mediated knockdown of ERK1 and ERK2. Differential interference contrast (DIC) microscopy of 4.5 h old embryos using a 10× objective (A,B,C,) or an enlargement of the margin, using a 40× objective (D,E,F) Wild type (Wt) and ERK1 morphants are at approximately 30% epiboly stage and undergo epiboly, whereas ERK2 morphants do not initiate epiboly. Localization of active ERK (dpERK) was detected by immuno-localization in wild type, ERK1MO and ERK2MO injected embryos at 4.5 hpf (G-I) by phospho-specific ERK antibody. The level of dpERK was lower in ERK1 morphants compared to wild type embryos, whereas ERK2 morphants hardly showed any active ERK staining, (A-C); lat-eral view, animal pole to top, (G-I); animal pole view, dorsal to right. The bar graphs in (J) represent the quantification of a western blot analysis of zebrafish wild type, ERK1MO and ERK2MO injected embryos, probes with a global ERK1 antibody (Santacruz). This antibody recognizes both zebrafish ERK1 (45.7 kD) and ERK2 (43.3 kD) protein. The bars represent the max-imum pixel-intensity measured in duplo and clearly show the specific knockdown of either ERK1 or ERK2 by the correspond-ing morpholino.
Page 3 of 21(page number not for citation purposes)

BMC Genomics 2008, 9:196 http://www.biomedcentral.com/1471-2164/9/196
chemical inhibitors, we did not proceed with these exper-iments.
These data prove the functionality of the morpholino-mediated knockdown of either ERK1 or ERK2. In addi-tion, the severe phenotype of ERK2 morphants indicatedefects in crucial early developmental processes and mostlikely affects the expression levels of a larger number ofgenes than knockdown of ERK1.
Distinct ERK-knockdown gene expression profiles in timeTo identify specific gene pools affected by the knockdownof ERK1 or ERK2, and to identify possible downstreamtargets, microarray based transcriptome analysis was per-formed using Agilent zebrafish microarrays. As a controlfor aspecific morpholino effects, a standard control mor-pholino (GeneTools Philomath, OR, USA) was injected inthe same concentration. This did not result in any pheno-types during zebrafish development. The RNA from thesestandard control MO injected embryos was used as a ref-erence to compare the transcriptomes of both ERK1MOand ERK2MO injected embryos. We annotated the Agilent22K-zebrafish microarray chip by BLAST searches with alloligonucleotide sequences in the zebrafish genome. Fromthe complete number of 21495 oligonucleotides from theAgilent 22K zebrafish chip, 16675 oligonucleotides wereassigned a Unigene ID (build #105). The phenotypiceffect of ERK2 depletion was observed at 30% epibolyindicating an altered gene expression profile at earlierstages. Therefore we analyzed the gene-expression profileof ERK2 morphants at more time points than ERK1 mor-phants (Fig. 2A,B). We obtained gene expression profilesfor ERK1 morphants at 4.5 hpf and 8 hpf, and for ERK2morphants at 3.5 hpf, 4.5 hpf, 6 hpf and 8 hpf (equivalentto oblong-stage, 30% epiboly, shield-stage and 80% epi-boly time points), as shown in figure 2C and 2D.
Comparison of the gene expression profiles of ERK1 andERK2 morphants at various stages showed a largernumber of Unigene identifiers with significant changes (p< 10-5) in ERK2 compare to ERK1 morphants in time, asillustrated in a Venn-diagram (Fig. 2A and 2B). TheseVenn diagrams also show that 207 genes are affected inexpression at both 30% and 80% epiboly in ERK1 mor-phants, whereas in the ERK2 morphants time-series, wefind 186 genes to be significantly changed in expression inall time points. At 30% and 80% epiboly the numbers ofgenes with an altered expression was larger and with ahigher fold of change for ERK2 than for ERK1 morphants(Fig. 2C and 2D). This is in agreement with the phenotypeof ERK2 knockdown embryos that indicates a more prom-inent role for ERK2 in early development (Fig. 1). Theeffect of ERK1 knockdown becomes more pronounced at80% epiboly (Fig. 2A,C). This indicates that ERK1 may
become relatively more important at later developmentalstages.
Comparing the effect of ERK1 and ERK2 knockdown, wefound distinct gene expression signature sets duringembryonic development. (Fig. 2E,F and 2G). In additionto commonly affected genes (Fig. 2G, target gene pool C),we found distinct genes that were specifically regulated byeither knockdown of ERK1 (Fig. 2G, target gene pool A);198 vs. 281 up-regulated, 109 vs. 345 down-regulated at30 or 80% epiboly respectively) or knockdown of ERK2(Fig. 2G, target gene pool B); 1311 vs. 1228 up-regulated,934 vs. 786 down-regulated), or genes which were regu-lated in an anti-correlated manner: 32 genes (30% epi-boly) or 106 genes (8 hpf, equivalent to 80% epiboly timepoint) were up-regulated by knockdown of ERK1 whereasthey were down-regulated by knockdown of ERK2 (Fig.2G, target gene pool D1; anti-correlated gene-pool 1) and16 genes (30% epiboly) or 204 genes (8 hpf, equivalent to80% epiboly time point) were down-regulated by knock-down of ERK1 whereas they were up-regulated by knock-down of ERK2 (Fig. 2G, target gene pool D2; anti-correlated gene-pool 2). These results confirm that ERK1and ERK2 MAPK are key regulators of distinct gene signa-ture sets during embryonic development. This is sup-ported even when comparing multiple gene expressionprofiles from different developmental time-points (Fig.2).
Because we observed a strong activated ERK signal in themargin at the onset of epiboly, we compared the expres-sion levels of a selection of genes that are described to beexpressed in the margin at the onset of epiboly in time. Todo so, a gene-expression trend-line of the selected margingenes for ERK1 and ERK2 morphants was constructed(Fig. 3A,B). Most of the selected genes did not give a sig-nificant difference in time upon ERK1 knockdown, sug-gesting different developmental functions for ERK1,whereas in ERK2 morphants the expression levels of mostof the selected 'margin'-genes was affected. A commontrend in the expression-levels of the selected genes wasobserved upon ERK2 depletion, as most genes showedstabilization in their expression levels between 30% epi-boly and shield stage, and even recovery between 6 to 8hpf. Despite this, the presumptive blastula cells remainedon top of ERK2 morphants. This indicates that theobtained gene expression profiles of later stages of ERK2morphants (6hpf and 8hpf) are the results of a prolongedepiboly arrest, most likely due to multiple secondarydevelopmental defects (Fig. 2 and 3). To analyze possibleapoptotic effects in the ERK2 morphants, we also madesimilar trend lines with a selection of genes that are asso-ciated with apoptotic responses (Fig. 3C,D). The apop-totic responses by the ERK1MO treatment are minimaland also ERK2MO injected embryos do not show obvious
Page 4 of 21(page number not for citation purposes)

BMC Genomics 2008, 9:196 http://www.biomedcentral.com/1471-2164/9/196
responses in the earlier stages (3.5–6hpf). However, theapoptosis responsive genes casp8 and casp3 revealed anincreased expression at 8hpf in ERK2 morphants. Thesecombined results were the rational for limiting the furthercomparisons of the effects of ERK1 and ERK2 knockdownat 30% epiboly.
The identified gene-sets of correlated and anti-correlatedregulated genes by knockdown of either ERK1 or ERK2 at30% epiboly are listed and annotated [see Additional file1, tables 1 and 4]. To identify the ERK1MO and ERK2MOspecific genes, we focused on the genes that were most sig-nificantly affected. Therefore we used the following crite-
Comparison of the ERK1 and ERK2 knockdown gene expression profiles in timeFigure 2Comparison of the ERK1 and ERK2 knockdown gene expression profiles in time. (A,B) Venn diagrams showing the gene expression profiles in time for ERK1 and ERK2 knockdown respectively. (C,D): graphs representing the number of genes that showed changes in expression, as well as their fold of change (greater than 1, 2, 4, 8, and 16 fold changes) upon knockdown of ERK1 (C; 4.5 and 8hpf) or ERK2 (D; 3.5, 4.5, 6 and 8hpf) at (p < 10-5). Knockdown of ERK2 affects the expression of more genes, and with a higher fold of changes than knockdown of ERK1, but increased in time for both conditions. (E,F); Venn diagrams, comparing ERK1 versus ERK2 expres-sion profiles at 30% epiboly and 80% epiboly respectively. The signatures of ERK1 and ERK2 morphants are split in up- and down-regu-lated genes in the graphs (C,D) and Venn diagrams (E,F). By doing so, the Venn diagrams also shows the numbers of specifically up and down regulated genes, common up and down regulated genes, and two anti-correlated gene pools (up-regulated in ERK1MO down-regu-lated in ERK2MO and down-regulated in ERK1MO up-regulated in ERK2MO); yellow = up-regulated by ERK1MO (ratio > 1), blue = down-regulated by ERK1MO (ratio <1), red = up-regulated by ERK2MO (ratio > 1), green = down-regulated by ERK2MO (ratio <1). (G) A model for the downstream ERK1 and ERK2 signaling pathway, showing distinct functions for ERK1 and ERK2 in gene regulation. Panels (A) represents ERK1 specific genes, (B) ERK2 specific genes, (C) common genes, and D1 and D2, are representing two different anti-cor-related gene pools as sub-populations of the common gene pool C.
Page 5 of 21(page number not for citation purposes)

BMC Genomics 2008, 9:196 http://www.biomedcentral.com/1471-2164/9/196
ria: the absolute fold change must be at least 1.5 in eachindependent replicate and the common p-value providedby the error-model taking into account all hybridizationsmust be smaller than 10-5. The genes that were only foundin either ERK1MO or ERK2MO gene-pools were manuallyannotated and assigned gene designations [see Additionalfile 1, tables 5 and 6].
Quantitative real time PCR analyses confirm the different ERK1- and ERK2- knockdown gene expression profilesTo confirm the results of the microarrays experiments,quantitative reverse transcriptase PCR analysis was per-formed on seven regulated genes at 4.5 hpf (30% epiboly)that were chosen as hallmarks of the differences between
the ERK1 and ERK2 morphant expression profiles. Theexpression levels were tested on the same RNA samples asused for the microarray analysis for cdh2 (cadherin 2, neu-ronal, NM_131081), mycn (v-myc, myelocytomatosisviral related oncogene, neuroblastoma derived,NM_212614), erm (ets related protein erm, NM_131205),cfos (FBJ murine osteosarcoma viral oncogene homolog,NM_205569), mos (moloney murine sarcoma viral onco-gene homolog, NM_205580), snai1a (snail homolog 1aDrosophila, NM_131066) and vegf (vascular endothelialgrowth factor A, NM_131408) (Fig. 4). β-actin was takenas reference to determine the relative expression levels ofthe selected genes in ERK1MO, ERK2MO and standardcontrol MO injected embryos. The obtained qPCR data
Trend lines of the expression levels of 'margin genes' in ERK1 and ERK2 morphants, during early developmental stagesFigure 3Trend lines of the expression levels of 'margin genes' in ERK1 and ERK2 morphants, during early developmental stages. (A,B) The relative expression (log ratio) of a number of a number of genes, selected for their described expression in the margin at the onset of epiboly, is plotted over different developmental stages in ERK1 and ERK2 morphants. The expression levels of the selected genes hardly changes in time in ERK1 morphants, whereas in ERK2 morphants the trend of the selected genes reveals a possible showed stabi-lization in their expression and possible subsequent recovery in time. Dotted line indicates the limits of the expression levels for the selected margin-genes in ERK1 morphants. (C,D) Trend lines for genes involved in apoptosis. Only in ERK2 morphants an increase in apoptotic genes (casp3 and casp8) was observed. Overlapping time-points are indicated in bold (30% and 80% epiboly).
tp53
bax
boka
casp2
casp3
caspb
casp6l1
casp8
foxa3
sox32
ndr1
gsc
spry4
axin2
fgf8a
foxa2
her5
wnt11
sp5ldact2
lft2lft1
her11
dact1
fgf17b
ntlsnai1atbx6tbx16tbx24
Rel
ativ
e ex
pre
ssio
n
(lo
g r
atio
)R
elat
ive
exp
ress
ion
(l
og
rat
io)
Oblong(3.5 hpf)
30% epiboly( 4.5 hpf)
Shield(6 hpf)
80% epiboly(8 hpf)
30% epiboly( 4.5 hpf)
80% epiboly(8 hpf)
-1
-0.5
0.5
1
1.5
-1.5
-1
-0.5
0
0.5
1
1.5ERK1MO
‘margin’ genesERK2MO
‘margin’ genes
ERK1MO pro-apoptotic genes
ERK2MO pro-apoptotic genes
Oblong(3.5 hpf)
30% epiboly( 4.5 hpf)
Shield(6 hpf)
80% epiboly(8 hpf)
30% epiboly( 4.5 hpf)
80% epiboly(8 hpf)
-1
-0.5
0.5
1
1.5
A B
C D
-1.5
-1
-0.5
0
0.5
1
1.5
Page 6 of 21(page number not for citation purposes)
BMC Genomics 2008, 9:196 http://www.biomedcentral.com/1471-2164/9/196
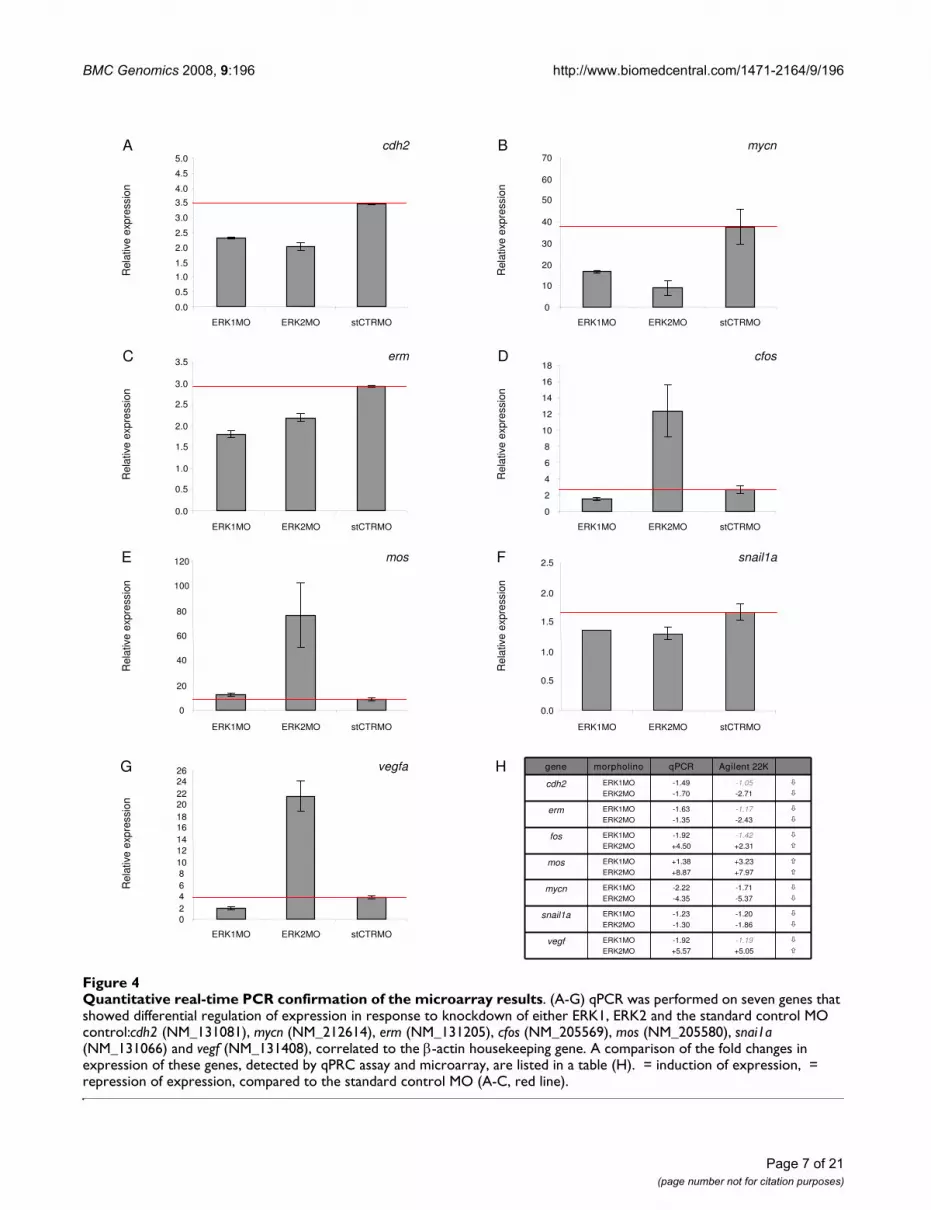
Quantitative real-time PCR confirmation of the microarray resultsFigure 4Quantitative real-time PCR confirmation of the microarray results. (A-G) qPCR was performed on seven genes that showed differential regulation of expression in response to knockdown of either ERK1, ERK2 and the standard control MO control:cdh2 (NM_131081), mycn (NM_212614), erm (NM_131205), cfos (NM_205569), mos (NM_205580), snai1a (NM_131066) and vegf (NM_131408), correlated to the β-actin housekeeping gene. A comparison of the fold changes in expression of these genes, detected by qPRC assay and microarray, are listed in a table (H). = induction of expression, = repression of expression, compared to the standard control MO (A-C, red line).
gene morpholino qPCR Agilent 22K
cdh2 ERK1MO
ERK2MO
-1.49
-1.70
-1.05
-2.71
erm ERK1MO
ERK2MO
-1.63
-1.35
-1.17
-2.43
fos ERK1MO
ERK2MO
-1.92
+4.50
-1.42
+2.31
mos ERK1MO
ERK2MO
+1.38
+8.87
+3.23
+7.97
mycn ERK1MO
ERK2MO
-2.22
-4.35
-1.71
-5.37
snail1a ERK1MO
ERK2MO
-1.23
-1.30
-1.20
-1.86
vegf ERK1MO
ERK2MO
-1.92
+5.57
-1.19
+5.05
cdh2
erm cfos
snail1a
mycn
mos
vegfa
02468101214161820222426
Rel
ativ
e ex
pres
sion
ERK1MO ERK2MO stCTRMO
0
20
40
60
80
100
120
ERK1MO ERK2MO stCTRMO
0.0
0.5
1.0
1.5
2.0
2.5
3.0
3.5
ERK1MO ERK2MO stCTRMO
0.0
0.5
1.0
1.5
2.0
2.5
3.0
3.5
4.0
4.5
5.0
ERK1MO ERK2MO stCTRMO
0
10
20
30
40
50
60
70
ERK1MO ERK2MO stCTRMO
0.0
0.5
1.0
1.5
2.0
2.5
ERK1MO ERK2MO stCTRMO
0
2
4
6
8
10
12
14
16
18
ERK1MO ERK2MO stCTRMO
Rel
ativ
e ex
pres
sion
Rel
ativ
e ex
pres
sion
Rel
ativ
e ex
pres
sion
Rel
ativ
e ex
pres
sion
Rel
ativ
e ex
pres
sion
Rel
ativ
e ex
pres
sion
A B
C D
E F
G H
Page 7 of 21(page number not for citation purposes)

BMC Genomics 2008, 9:196 http://www.biomedcentral.com/1471-2164/9/196
show that the expression levels of cdh2, mycn, erm andsnai1a are down-regulated in both ERK1MO andERK2MO conditions, compared to standard control MO(Fig. 4A,B,C and 4F), whereas the expression level of mosis up-regulated in both ERK1MO and ERK2MO. The anal-ysis of cfos and vegf confirmed the anti-correlated regula-tion comparing ERK1 and ERK2 knockdown to standardcontrol MO conditions. Both genes are down-regulated byknockdown of ERK1 and up-regulated by knockdown ofERK2, compared to the expression-level of fos and vegf instandard control MO treated embryos (Fig. 4D,G).
In summary, the qPCR data confirmed the change inexpression levels of the selected genes as observed bymicroarray analysis for all genes tested, thereby confirm-ing the unique gene expression profiles for ERK1MO andERK2MO mediated knockdown in early zebrafish devel-opment at 4.5 hpf (30% epiboly).
Gene Ontology (GO) analysisThe gene expression signatures of the ERK1 and ERK2morphants were used to perform gene ontology (GO)analysis. This provides an unbiased biological geneenrichment analysis based on biological properties (GO-terms) assigned per gene. Gene ontologies describe geneproducts in terms of their associated biological processes(GO:0008150), cellular components (GO:0005575) andmolecular functions (GO:0003674) in a species-inde-pendent manner. The results of this analysis showed a sig-nificant relative over- or under-representation of thenumber of Unigene IDs in ERK1 versus ERK2 morphantswithin the GO categories (Fig. 5). For ERK1 and ERK2knockdown signature sets we obtained remarkable differ-ences in the significantly enriched categories in the high-est analyzed GO-level (level 4): for instance 5 vs. 14enriched GO-terms are associated with Biological proc-esses (Fig. 5A), 3 vs. 15 enriched GO terms are associatedwith cellular components (Fig. 5B) and 3 vs. 7 enrichedGO terms are associated with Molecular functions (Fig.5C), respectively.
Comparing the ERK1 and ERK2 knockdown signature setsvarious particular differences in over- or under-repre-sented GO-terms were found. For example, both the GO-terms cell cycle (GO:0007049) and apoptosis(GO:0006915) are significantly enriched upon ERK2knockdown. However, looking at the gene-lists in moredetail inhibitory factors of apoptosis are mostly down-reg-ulated, whereas positive regulators of cell cycle were up-regulated, indicating that apoptosis was not induced bythe depletion of ERK2 at 30% epiboly (also see Fig. 2D)confirming our earlier conclusion from the time series.Cell adhesion (GO:0007155) and the cellular componentGO terms 'tight junction' and 'cell junctions' are only sig-nificantly under-represented in the signature set of ERK2
morphants. Regulation of cell adhesion and the organiza-tion of tight- and cell-junctions are crucial for cell migra-tion processes. Specifically for ERK1 knockdown asignificantly enrichment of the 'translator regulator activ-ity' (GO:0030528) GO-cluster was found. In contrast, therelative enrichment of this GO term in ERK2 morphantsshowed an under-representation. A significant overrepre-sentation of the GO term biosynthesis in ERK1 mor-phants correlates with these observations.
The GO-enrichment analysis showed that the number ofgenes within the GO-cluster 'development'(GO:0007275) were significantly under-represented forboth ERK1 (19 genes) and ERK2 (136 genes) morphants.From the 19 development-related genes whose expressionwas affected by ERK1 knockdown, 12 genes (63%) werenot found in the ERK2 knockdown signature set. This sup-ports the notion that ERK1 and ERK2 may have distinctfunctions during embryogenesis by affecting the gene-expression of common and distinct genes sets during ver-tebrate development.
GenMAPP Pathways for zebrafishTo further analyze putative down stream targets of ERK1and ERK2 involved in early development, we focused onessential signaling pathways that are involved in earlyembryonic differentiation and patterning; Nodal, FGF,Wnt and BMP-signaling pathways (Fig. 11) [12]. For ourstudy, we used the signaling pathway analyzing softwareprogram, GenMAPP (Gene Microarray Pathway Profiler)[10,11]. This program is designed for viewing and analyz-ing gene expression data in the context of biological path-ways and allows microarray-mediated gene expressionsignature sets to be displayed on biological (signaling)pathways [10]. In contrast for human and mouse geneexpression data-sets, where most signaling pathways areavailable for this program, there are no GenMAPP path-ways based on zebrafish literature available yet for analyz-ing our gene expression datasets. Therefore, we firstgenerated the in silico GenMAPP pathways for thezebrafish Nodal, FGF, (canonical) Wnt and BMP signalingpathways (Fig. 6, 7, 8, 9). This provides a valuable tool forthe research community that makes use of zebrafish. Theconstruction of these GenMAPP signaling pathways isbased on what is specifically described in literature forzebrafish development, supported by the describedknowledge for other vertebrate signaling processes andcanonical signaling models, found on the Science's STKEConnections Map Database [14]. Although it is clear thatthe Nodal, FGF, Wnt and BMP pathways are all intercon-nected, resulting in a complex signaling network, we per-formed a pathway-based analysis focusing on separatesignaling pathways since the ways these signaling path-ways exactly interconnect on a molecular scale is hardlyunderstood yet.
Page 8 of 21(page number not for citation purposes)

BMC Genomics 2008, 9:196 http://www.biomedcentral.com/1471-2164/9/196
Page 9 of 21(page number not for citation purposes)
Statistical comparison of the Gene-Ontology distribution within the gene expression profiles, in ERK1 versus ERK2 knock-down embryosFigure 5Statistical comparison of the Gene-Ontology distribution within the gene expression profiles, in ERK1 versus ERK2 knockdown embryos. (A) Biological process (GO:0008150), (B) Cellular component (GO:0005575) and (C) Molecu-lar function (GO:0003674). ERK1MO and ERK2MO were compared to the whole 22K Agilent chip, based on the Unigene-ID identifiers. The graph depicts the relative fold of enrichment (x-axis) of the statistically selected GO-clusters (y-axis), within the ERK1 and ERK2 knockdown gene-pools. ERK1MO in gray, ERK2MO in black (* = P < 0.05, ** = P < 0.01). Values greater than 1 were considered over-represented, values less than1 are considered as under-represented.

BMC Genomics 2008, 9:196 http://www.biomedcentral.com/1471-2164/9/196
Pathway Analysis of ERK1MO and ERK2MO mediated knockdown expression profilesThe Unigene ID linked ERK1MO and ERK2MO signaturesets that were used for GeneMAPP analysis were not lim-ited by fold change but instead we used all genes that hada combined p-value for changed expression, compared tothe standard control morpholino treated embryos,smaller than 10-5. As previously mentioned, the numberof genes that showed a changed expression in ERK2MOcompared to ERK1MO injected embryos was far larger.Therefore, as expected, more genes with changed expres-sion levels were found in the in silico GenMAPPs signalingpathways for ERK2MO, than for ERK1MO.
Knockdown of ERK1 did show only one gene (smurf1)with a significantly changed expression level within ourBMP signaling GenMAPP (Fig. 9). However, more geneswere affected in FGF signaling: fgf17b (-1.37 fold) theMAPKKK mos, (+3.448 fold), transcription factor cmyc (-1.71 fold) and srf (serum response factor, -1.39 fold)showed significant changes in expression. In the nodalpathway, the Nodal antagonist lft1/antivin1 (+2.55 fold)and the EGF-CFC co-receptor oep (one eyed pinhead, -1.53 fold) were the only components found to be affectedin ERK1 morphants. Furthermore, the ventrally expressedWnt8-mediated organizer inhibitory gene vent [15] wasdown-regulated (-1.46 fold, Fig. 8). Other genes involvedin Wnt-signaling affected by ERK1 knockdown were dab2(disabled homolog 2, +1.47 fold), ck2b (casein kinase IIbeta subunit, -1.24 fold) and ppp2r5e1 (Protein phos-phatase 2A, regulatory B subunit, B56, +1.30 fold). Thesegenes are also considered to be involved in early embry-onic pattering pathways. Two genes involved in regulatinggastrulation cell migration, one-eyed pinhead (oep) andquattro [16,17], were altered in expression.
The effect of depletion of ERK2 was far more severe inmost of the analyzed signaling processes (Fig. 6,7,8,9).Key components of the FGF-pathway (fgf8, fgfr4 frs2, bRaf,aRaf and mek1l) and downstream target genes (erm, eve1,pea, mkp3, spry2, ntl, spt/tbx16 and tbx6) were down-regu-lated, indicating a block of the FGF-ERK pathway by ERK2knockdown (Fig. 7). Expression of some of these (meso-derm) target genes is initiated by Nodal. The Nodal-geneslike boz/dharma, squint/ndr1 and smad2 are up-regulated,whereas inhibiting genes lefty1 (lft1, -6 fold) and the ven-tral genes vox (-1.9 fold) and ved (-4 fold) are down-regu-lated in ERK2 morphants (Fig. 6). Other nodal signalingmediator genes that are down-regulated are oep (-4 fold),p300 (-2.03 fold), foxh1/sur (schmalspur, -2 fold) and thenegative regulator of TGFβ signaling TGIF (-2 fold). Thenodal-mediated endoderm gene sox32/casanova,expressed in the margin, was down-regulated (-6 fold),and also the downstream target-gene axial/foxA2 (-2 and-4 fold). Interestingly, squint/ndr1 also functions as a pos-
itive regulation of fibroblast growth factor receptor signal-ing pathway [18].
The Wnt ligand Wnt11 and receptors (frz7a, 7b, 8a, 9 and10) and the central mediator β-catenin1 were down-regu-lated in ERK2 morphants, suggesting a severe inhibitoryeffect or even complete block of these pathways at thislevel (Fig. 8). This inhibition of the Wnt pathway is alsosupported by the up-regulation of axin2/conductin, a scaf-fold protein from the β-catenin destruction complex,responsible for the degradation of beta-catenin [19].Down-regulation of the putative Wnt-target genes vox,vent, but also otx2, sp5, and lim1 further supportimpaired Wnt-signaling. However, ERK2 knockdown alsoled to the down-regulation of the inhibitors dkk1 andsfrp1, and up-regulation of the intracellular Wnt-signalingcomponents fxd8c, dab2, β-catenin2 and tcf1.
The effect of ERK2 knockdown on BMP signaling is alsocomplex, as bmp4 is up-regulated whereas bmp1a/tolloidand bmp6 are down-regulated (Fig. 9). This opposingeffect is also found in the BMP antagonists, as chordin(chd) and the ventrally expressed membrane bound bmp-inhibitor bambi were down-regulated, whereas a differentBMP antagonist gremlin is up-regulated. Adding to thiscomplexity is the fact that the agonist twisted gastrulation(twsg1a) is up-regulated. The results clearly show that thatdorsal-ventral patterning and also mesoderm patterning isseverely affected but it is difficult to speculate about thedownstream effects of all these changes of expression inthe BMP pathway.
Biological confirmation of Pathway Analysis based predictionTo confirm predicted effects of the GenMAPP pathwayanalysis experimentally and to add information on thelocalization of expression, we performed whole mount insitu hybridization on ERK1 and ERK2 morphants at 30%epiboly with marker genes regulated by Nodal, BMP, Wntand FGF (Fig. 6, 7, 8, 9 and Fig. 11). Different componentsof the Wnt-β-catenin pathway showed lower expressionlevels in ERK2 morphants. We showed that goosecoid (gsc)[20], a downstream marker gene for the Wnt pathway atearly developmental stages (Fig. 10A–C) is not expressedin the ERK2 morphants. Knockdown of ERK1 did lead toa significant effect on the expression of gsc, but afterknockdown of ERK2 no expression of gsc was detected bywhole mount in situ hybridization. This confirms thatcanonical Wnt signaling was severely affected in ERK2morphants, preventing subsequent expression of the Wnt-target gene gsc.
The lefty 1 (lft1, antivin1) gene is a member of the TGF-beta super-family that regulates left-right axis formationduring embryogenesis via antagonistic activity against
Page 10 of 21(page number not for citation purposes)

BMC Genomics 2008, 9:196 http://www.biomedcentral.com/1471-2164/9/196
nodal, another TGF-beta super-family member. Expres-sion starts at blastula stage, immediately after initiation ofzygotic transcription, and is localized in the whole blast-ula margin at late blastula – 30% epiboly stage [21].Whole mount in situ hybridization with lefty1 probe (Fig.10D–F) at 30% epiboly shows a possible increase of lefty1expression in ERK1 morphants (Fig. 10E), but thedecrease of expression in ERK2 morphants (Fig. 10F) wasclearly visible. As lefty1 is both an antagonists of Nodalsignaling as well as a Nodal responsive gene, an increaseof lft1 expression could mean that the signaling is suffi-cient and must be inhibited (ERK1MO), like in a wild typesituation. A decrease in expression would mean that
Nodal signaling not yet sufficient. Expression of meso-derm-genes in the margin indicates that (nodal mediated)mesoderm initiation took place in ERK2 morphants, how-ever at a much reduced level (Fig. 10O,R).
In zebrafish, vox and vent interact with bozozok (boz),which is the earliest expressed dorsal-specific gene, andstudies of boz embryos and the effects of ectopic bozexpression indicate that it functions at the top of a hierar-chy. Vox and vent are proposed to be repressors of bozexpression since ectopic vox and vent eliminated theappearance of boz to establish the dorsal organize [15].The expression signatures from the ERK1 and ERK2 mor-
Analysis of Nodal signaling processes in ERK1MO and ERK2MO gene expression profilesFigure 6Analysis of Nodal signaling processes in ERK1MO and ERK2MO gene expression profiles. The Nodal signaling pathways has been overlaid with gene-expression colour criterion and ratios of gene-expression from the program GenMAPP: yellow = up-regulated by ERK1MO (ratio > 1), blue = down-regulated by ERK1MO (ratio <1), red = up-regulated by ERK2MO (ratio > 1), green = down-regulated by ERK2MO (ratio <1), gray = gene is not present on the Agilent zebrafish 22k microar-rays or in the GenMAPP database, white = not significantly changed. The genes that were affected in their expression in both ERK1 and ERK2 morphants show multicolored gene-boxes with the expression ratios for both conditions depicted on the right of the gene; the ration for ERK1 knockdown at the top and ERK2 knockdown below. At the right side of the figure a list of responsive target-genes is listed for the Nodal signaling pathway. The bottom right of the figure shows a small representa-tion of the predicted Nodal signaling activity (dark gray) in the wild type embryos, based on the potential range of signals and the expression patterns and range of antagonists adopted from Schier and Talbot (2005), late blastula stage, lateral view, dorsal to right and animal pole to top.
Page 11 of 21(page number not for citation purposes)

BMC Genomics 2008, 9:196 http://www.biomedcentral.com/1471-2164/9/196
phants revealed that vox expression was not significantlychanged in ERK1 morphants, but was down-regulated inERK2 morphants., whereas for vent -expression thisseemed to be opposite, as its expression was down-regu-lated in ERK1 morphants, but not significantly changed inERK2 morphants (Fig. 6). The expression patterns of thesegenes revealed a possible reduction of vox expression inERK1 morphants, which was more obvious on the puta-tive dorsal side of the embryo where a clear cap wasobserved. The expression of vent was also reduced in ERK1morphants and did not extend as far dorsally (K) com-pared to wild type embryos (J), indicating a mild dorsali-zation of ERK1 morphants. In ERK2 morphants, vox
expression seemed to be reduced to a greater extend at theventral side, but in the rest of the blastula the reduction ofvox expression was not as significant and expression ofvent was only detected at the ventral side of the blastulamargin (L). In support of these finding, the expression ofboz was found also to be up-regulated (+1.4 fold) in ERK2morphants. Combined, these findings confirm thatknockdown of ERK2 leads to impaired Wnt-mediated voxand vent expression which is reported to be involved inmesoderm patterning and maintenance.
The zebrafish ntl gene is, like the tbx6 gene, a member ofthe Brachyury-related T-box family of genes. Notail (ntl/
Analysis of FGF signaling processes in ERK1MO and ERK2MO gene expression profilesFigure 7Analysis of FGF signaling processes in ERK1MO and ERK2MO gene expression profiles. The FGF signaling path-ways has been overlaid with gene-expression colour criterion and ratios of gene-expression from the program GenMAPP: yel-low = up-regulated by ERK1MO (ratio > 1), blue = down-regulated by ERK1MO (ratio <1), red = up-regulated by ERK2MO (ratio > 1), green = down-regulated by ERK2MO (ratio <1), gray = gene is not present on the Agilent zebrafish 22k microar-rays or in the GenMAPP database, white = not significantly changed. The genes that were affected in their expression in both ERK1 and ERK2 morphants show multicolored gene-boxes with the expression ratios for both conditions depicted on the right of the gene; the ration for ERK1 knockdown at the top and ERK2 knockdown below. At the right side of the figure a list of responsive target-genes is listed for the FGF signaling pathway. The bottom right of the figure shows a small representation of the predicted FGF signaling activity (dark gray) in the wild type embryos, based on the potential range of signals and the expression patterns and range of antagonists adopted from Schier and Talbot (2005), late blastula stage, lateral view, dorsal to right and animal pole to top.
Page 12 of 21(page number not for citation purposes)

BMC Genomics 2008, 9:196 http://www.biomedcentral.com/1471-2164/9/196
brachyury) is involved in mesoderm development, asdescribed in the legend to figure 11. At 30% epiboly ntl isexpressed in the blastula margin [22]. This expression issynergistically regulated by FGF and Nodal signaling path-ways [23,24]. Both of these pathways show a negative reg-ulation in the ERK2 morphants, as shown by theGenMAPP analysis (Fig. 6, 7, 8, 9). The negative effect onthese pathways and the array-data itself suggested a down-regulation of the ntl-gene upon ERK2 knockdown, andwas confirmed by whole mount in situ experiments (Fig.10M–O). The ntl gene expression in ERK1 morphants wascomparable to expression in wild type embryos, but ntlexpression was decreased in ERK2 morphants. Strikingly,
expression of ntl was not constant in the marginal ring, asstronger expression was detected in the putative dorsalside of the ERK2 morphants.
Tbx6 is exclusively expressed in the ventral mesendodermand its expression is linked to ventral mesoderm specifica-tion [25]. In ERK1 morphants the in situ hybridizationexperiment showed that tbx6 expression was not extendedas far dorsally as in wild type embryos, as tbx6 expressionat the putative dorsal side of these embryos was severelyreduced (Fig. 10P,Q). In ERK2 morphants, tbx6 expres-sion was greatly reduced and was only detected at the ven-tral margin (Fig. 10R). In ERK2 morphants tbx6-
Analysis of Wnt signaling processes in ERK1MO and ERK2MO gene expression profilesFigure 8Analysis of Wnt signaling processes in ERK1MO and ERK2MO gene expression profiles. The Wnt signaling path-ways has been overlaid with gene-expression colour criterion and ratios of gene-expression from the program GenMAPP: yel-low = up-regulated by ERK1MO (ratio > 1), blue = down-regulated by ERK1MO (ratio <1), red = up-regulated by ERK2MO (ratio > 1), green = down-regulated by ERK2MO (ratio <1), gray = gene is not present on the Agilent zebrafish 22k microar-rays or in the GenMAPP database, white = not significantly changed. The genes that were affected in their expression in both ERK1 and ERK2 morphants show multicolored gene-boxes with the expression ratios for both conditions depicted on the right of the gene; the ration for ERK1 knockdown at the top and ERK2 knockdown below. At the right side of the figure a list of responsive target-genes is listed for the Wnt signaling pathway. The bottom right of the figure shows a small representation of the predicted Wnt signaling activity (dark gray) in the wild type embryos, based on the potential range of signals and the expression patterns and range of antagonists adopted from Schier and Talbot (2005), late blastula stage, lateral view, dorsal to right and animal pole to top.
Page 13 of 21(page number not for citation purposes)

BMC Genomics 2008, 9:196 http://www.biomedcentral.com/1471-2164/9/196
expression an even more severe reduction of tbx6 expres-sion was down-regulated (-2.3 fold).
The obtained results by whole mount in situ hybridiza-tion using gsc, lft, vox, vent, ntl and tbx6, confirm or sup-port the predictions made by the GenMAPP analysis, asthe changes in their expression levels are in agreementwith the predictions obtained by the signaling pathwayanalysis of the microarray data.
DiscussionSpecific functions of most proteins in vertebrate develop-ment remain elusive because of potential redundancies.In this manuscript we present a case study that indicatesthat the combination of micro-array analysis and targetedknockdown of essential embryonic genes in zebrafish canprovide new insights in the specific targets of key regula-tors of development. For this study we have chosen themitogen activated protein kinase members ERK1 andERK2 because they are involved in virtually all eukaryoticcellular processes and signaling networks but still little isknown of their specific functions in development. The
Analysis of BMP signaling processes in ERK1MO and ERK2MO gene expression profilesFigure 9Analysis of BMP signaling processes in ERK1MO and ERK2MO gene expression profiles. The BMP signaling path-ways has been overlaid with gene-expression colour criterion and ratios of gene-expression from the program GenMAPP: yel-low = up-regulated by ERK1MO (ratio > 1), blue = down-regulated by ERK1MO (ratio <1), red = up-regulated by ERK2MO (ratio > 1), green = down-regulated by ERK2MO (ratio <1), gray = gene is not present on the Agilent zebrafish 22k microar-rays or in the GenMAPP database, white = not significantly changed. The genes that were affected in their expression in both ERK1 and ERK2 morphants show multicolored gene-boxes with the expression ratios for both conditions depicted on the right of the gene; the ration for ERK1 knockdown at the top and ERK2 knockdown below. At the right side of the figure a list of responsive target-genes is listed for the BMP signaling pathway. The bottom right of the figure shows a small representation of the predicted BMP signaling activity (dark gray) in the wild type embryos, based on the potential range of signals and the expression patterns and range of antagonists adopted from Schier and Talbot (2005), late blastula stage, lateral view, dorsal to right and animal pole to top.
Page 14 of 21(page number not for citation purposes)

BMC Genomics 2008, 9:196 http://www.biomedcentral.com/1471-2164/9/196
proteins show high amino acids identity and have redun-dancy potential; however this does not exclude specifictarget genes.
These archetypal signaling proteins are good examples forshowing the power of this approach since the upstreamactivation pathways for ERK1 and ERK2 are highly simi-lar, and many of their known downstream targets arecommon. In contrast to this, mice and zebrafish studiesindicate distinct roles for both ERKs in cellular prolifera-tion, oncogenic transformation and development. Amajor bottleneck for further studies is that relatively few invivo downstream targets of these kinases and upstreamactivators such as MEK1 and MEK2 have been identifiedconclusively. Our manuscript uses microarray technologyand bioinformatics to document the functional differ-ences between the ERK1 and ERK2 proteins at the tran-scriptome level at different time points during zebrafishdevelopment. The obtained data is projected on a modelof our current knowledge of several developmental signal-ing pathways. This gives new mechanistic insights in howERK signaling is functioning and integrates with otherknown effectors of vertebrate embryogenesis.
ERK1 and ERK2 target distinct genes during early zebrafish developmentComparison of the gene expression profiles of the ERK1and ERK2 morphants during early embryogenesis, withstandard control MO injected embryos as a shared refer-ence, showed specific gene expression profiles. Distinctgene expression signatures were obtained for ERK1 andERK2 knockdown embryos, proving that both ERK1 andERK2 target specific gene pools during zebrafish embryo-genesis (Fig. 2). The gene expression profiles of ERK1 andERK2 knockdown embryos showed sets of genes that werecommonly regulated, but also genes that was regulated inan anti-correlated manner, involved in cell cycle, prolifer-ation, cell differentiation, metabolism, cytoskeletondynamics, signal transduction, migration and transcrip-tion. This observation is in line with the notion that ERK1and ERK2 may have specific downstream targets, as pro-posed in a model by Alison Lloyd [3], mainly based on thework of Vantaggiato et al. [2], where they show that co-transfection of either erk1 or erk2 with an oncogenic formof Ras, has different effects on proliferation and Ras-induced transformation. In addition to this, erk1-/- miceare viable and fertile [5], whereas disruption of erk2 isembryonic lethal due to defects in placenta formation,trophectoderm and mesoderm differentiation [6,26].Activation of the upstream signaling of ERK have alsoshown a role for this pathway in diseases such as cardio-faciocutaneous syndrome and carcinogenesis. Further-more a developmental role of MEKs was shown: mek2knockout mice are phenotypically normal, whereas mek1knockout mice die at embryonic day (E) 10.5 due to
Effects of ERK1 and ERK2 knockdown affect developmental signaling pathways confirmed by whole mount in situ hybridi-zationFigure 10Effects of ERK1 and ERK2 knockdown affect develop-mental signaling pathways confirmed by whole mount in situ hybridization. The zebrafish embryos were injected with 3.4 ng ERK1MO (B,E,H,K,N,Q) or ERK2MO (C,F,I,L,O,R) and in situ expression patterns, were compared to wild type embryos (A,D,G,J,M,P). The embryos were fixed at 4.5hpf, processed for whole mount in situ hybridization, and imaged (animal pole view, dorsal to right). A,B,C: goose-coid (gsc, presumptive shield/dorsal organizer); D,E,F: lft1/antivin, (blastula margin); G,H,I: vox (expressed in blastula, but the dorsal most region); J,H,L vent (ventral blastula margin); M,N,O, notail (ntl, blastula margin); P,Q,R,: tbx6 (margin)
Page 15 of 21(page number not for citation purposes)

BMC Genomics 2008, 9:196 http://www.biomedcentral.com/1471-2164/9/196
abnormal development and insufficient vascularizationof the placenta [27,28]. Studies in mouse ES cells showedthat ERK2 disruption does not interfere with proliferationof undifferentiated ES cells [29]. Although erk1-/- micepresent normal mesoderm differentiation, they do showdefective adipocyte formation [30]. The exact mecha-nisms for ERK signaling in adipocyte development, likelyvia the adipocyte-specific transcription factor peroxisomeproliferator-activated receptor (PPAR)γ, is still underdebate [29,31,32]. The significant over-representation ofthe GO-terms 'metabolism', 'biosynthesis' and 'macro-molecule biosynthesis' (Fig. 5) may indicate that also inzebrafish adipocyte-development is ERK1 dependentwhich would be in line with our suggestion, that role forERK1 becomes more dominant at later developmentalstages (Fig. 2). However, further studies at even later (lar-val) stages of development need to be performed to con-firm this hypothesis.
The higher number of genes affected by the knockdown ofERK2 is in agreement with the severe phenotype of ERK2knockdown embryos (Fig. 1 and Fig. 2). In order to under-stand the severe effects of ERK1/2 knockdown, we have toconsider the results in the context of the known signalingpathways that govern developmental programs as prolif-eration, cell migration and differentiation processes.Therefore we first generated in silico signaling pathway, foranalysis of important signaling pathways involved in earlyvertebrate development and performed analysis on theERK1 and ERK2 transcriptome signatures using the Gen-MAPP software program. These include the Nodal, FGF,Wnt and BMP signaling pathways.
ERK1 and ERK2 are involved in different developmental processesFor biological interpretation of the obtained expressionprofiles, analysis of gene ontology (GO) was used to indi-cate processes that are likely to be affected. Different geneontology clusters showed a relative enrichment in ERK1versus ERK2 knockdown gene expression signatures. Sincethe annotation of the zebrafish genome is the limiting fac-tor in assigning biological functions we have focused ongene ontologies that are relatively well known and havefurther supported the analyses by manual annotation ofour signature sets. This led for instance to the observationthat the Biological GO-clusters "development" was signif-icant under-represented for both ERK1 and ERK2 knock-down. More detailed analysis was performed using thesignaling-pathway based GenMAPP gene map annotatorand pathway profiler program. By performing completegene expression profiles (p < 10-5) without a fold-changecut-off in pathway analyses, we address both primary andsecondary effects related to ERK knockdown from a mor-phogenetic perspective. Our observations led us to pro-pose a model for distinct effects of ERK1 and ERK2
knockdown in developmental signaling processes, byeffecting common as well as distinct genes (Fig. 2G). Earlyembryo developmental processes include mesoderm for-mation, endoderm formation dorsal-ventral pattering,anterior-posterior patterning and gastrulation move-ments. To establish a mesodermal zone, next to the dor-sal-ventral patterning, also induction processes occur atthe animal – vegetal axis. Complex signaling processes areused by the embryo to induce mesoderm, as nicelyreviewed by Kimelman (Nature reviews 2006) [33]. Basedon literature data it is possible to interpret the observedgene-expression profiles and analyze the knockdowneffects in the context of known signaling pathways under-lying these processes (Fig. 6, 7, 8, 9 and Fig. 11).
Stringent knockdown conditions, as applied in this array-based study, showed that in ERK1 morphants the ven-trally expressed patterning gene vent was down-regulated,but also the BMP inhibitory gene smurf1 was up-regulated,possibly responsible for inhibition of BMP signaling onthe ventral side (Fig. 11B,D). This may lead to a dorsaliza-tion of ERK1 knockdown embryos. Surviving ERK1 mor-phants showed a tailless phenotype at 24 and 48 hpf [seeAdditional file 2]. This supports a block of bmp-signaling,as tail formation is combinatory regulated by BMP andFGF signaling since mutant embryos for bmp2b fail toform tails [34] and embryos with impaired FGF-signalingshow tailless phenotypes. In addition, it is important tonote that also genes involved in regulating gastrulationcell migration were altered in expression (oep and quattro)[16,35].
ERK2 signaling is essential for the maintenance of the mesendodermal cell fatesIn ERK2 morphants no active MAPK was detected at themargin at 4,5hpf (data not show) suggesting that Ras-Raf-MEK-ERK dependent FGF signaling and subsequentdownstream signaling was blocked. FGF signaling acts asa competence factor for cells to respond to Nodal medi-ated mesoderm induction. As our data show that ERK2morphants are severely impaired in both FGF and Wntsignaling it is likely that mesoderm progenitor cells in themargin are affected in the maintenance of the mesoder-mal cell fates (Fig. 11 panel E). However, it has beenreported that Nodal and FGF pathways interact through apositive regulatory loop and synergize to maintain meso-dermal cell populations [36], in addition FGF signalingnegatively regulates Nodal-dependent endoderm induc-tion in zebrafish [37]. This would suggest that Nodal-mediated initiation of mesoderm differentiation is stillpresent, but the maintenance of the mesoderm, mediatedby FGF and Wnt, is affected.
Drosophila, FGF-dependent ERK activation was shown tobe required for proper mesoderm dispersal [38-40]. In
Page 16 of 21(page number not for citation purposes)

BMC Genomics 2008, 9:196 http://www.biomedcentral.com/1471-2164/9/196
Page 17 of 21(page number not for citation purposes)
ERK1 and ERK2 knockdown differently affect signals involved in patterning of the early embryoFigure 11ERK1 and ERK2 knockdown differently affect signals involved in patterning of the early embryo. (A-D): Schematic represen-tation of the effects of ERK1 and ERK2 knockdown on the activities of Nodal, FGF, Wnt and BMP signaling pathways in late blastula embryos. (E): effect of ERK2 knockdown (ERK2MO) on early embryonic mesendoderm differentiation. The representation of predicted signaling activity in the wild type embryos is based on the potential range of signals, the expression patterns and range of antagonists, adopted from Schier and Talbot (2005). The combined signaling activities from these pathways are responsible for the differentiation and fate-map of the late blastula/early gastrula stage of the zebrafish embryo (E, late blastula stage, lateral view, dorsal to right, animal pole to top). In the zebrafish embryo, dorsal ventral patterning starts as early as the 128-cell stages by accumulation of β-catenenin at the nuclei of the dorsal cells, rapidly followed by the expression of goosecoid (A). Soon after mid-blastula transition, β-catenin also activates the expression of a number of zygotic genes, including chordin, bozozok and squint (A and D), and FGF signals (C). These genes act to inhibit the action of ventralizing factors or induce mesoderm and endoderm cell fates at the dorsal side. Subsequently, the expression of these genes quickly spreads over the complete margin (E). To establish a mesodermal zone, induction processes occur at the animal – vegetal axis. Complex signaling processes are used by the embryo to induce mesoderm. In a over-simplified manner, it can be said that Nodal (D) signaling is involved in initiation of mesoderm formation, FGFs (C) and Wnt (A) are involved in maintaining the mesoderm state and BMPs (B) are involved in further patterning of the mesoderm [33]. Knockdown of ERK1 (ERK1MO) resulted in an increased expression of the BMP-inhibiting protein smurf1/wwp1 and the ventrally expresses gene vent (A). In addition also the mesoderm marker tbx6 showed a reduced dorsal expansion of its expression domain (Fig. 7K). Combined, this indicates a reduction of ventral signaling, possibly leading to a mild dorsalization of ERK1 knockdown embryos. ERK2 knockdown (ERK2MO) promotes Nodal signaling by repressing the expression of Nodal inhibitors (vox, vent, ved and lft1) (D). Furthermore, it perturbs FGF signaling (repression of fgf8 and components of the RAS-ERK pathway and down regulation of its target genes) and Wnt signaling (repressed expression of frizzled receptors and key components of the Wnt pathway). In addition, perturbed BMP signaling results in incorrect patterning of the mesoderm (B). In summary, this shows that mesendoderm differentiation is still initiated by Nodal signaling (D), but mesendoderm maintenance by FGF and Wnt signaling is defected. This results in reduced expression of mesoderm (ntl, tbx6 and spt) and endoderm (gata5, sox32) marker genes (B, C and E), showing that ERK2 is essential for mesendoderm differentiation (E).
FGF
A
E
B
C D
fgf3,8,17b,24spry2,4, sef, mkp3
ventvoxved
axial, cyc, lft1bozsqt
nodalERK1
ERK2ERK2
ERK2MesodermEndodermYSL
Animal
Ventral Dorsal
Vegetal
maintenance
patterning maintenance
initiation
ERK2
Wnt ERK2
gsc
wnt5,8,11frz7,8,9,10
-cat
enin
2β
-cat
enin
2β
ventvoxved
BMP
ERK1
ERK2
ERK2
bmp2bbmp4bmp1a
chdnogfst
smurf1/WWP1
ntl, tbx6, sptgata5, sox32

BMC Genomics 2008, 9:196 http://www.biomedcentral.com/1471-2164/9/196
Xenopus, ERK2 was shown to be required for mesodermdifferentiation [41]. Mouse erk2-/- embryos also fail toform mesoderm at E6.5 and E7.5 based on histologicalcriteria, but erk2-/- embryonic stem cells were still capableof forming mesoderm. However, treatment of these EScells with the MAPK inhibitor PD184352 decreased totalERK activity in these cells and expression of the mesodermmarker brachyury/ntl (essential for posterior mesodermand axis formation) [26]. Our gene expression profilingshows that ERK2 plays a role in mesoderm developmentbased on additional mesoderm markers (e.g. spt/tbx16,tbx6), but importantly also by addressing the upstreamsignaling mechanisms involved in mesoderm initiationand maintenance. It should be noted that ERK-activationis not only mediated by FGF signaling, but also influencedby other growth factors (PDGF, VEGF), G-protein coupledreceptor signaling and hormone- and Ca2+ signaling path-ways. A nice example that demonstrates the complexity ofinterconnections, redundancy and crosstalk between thedifferent pathways is the work of Poulain et al, (2006)showing that combinatorial Nodal, FGF and BMP signal-ing regulates endoderm formation in zebrafish. Theseauthors also reported that activation of FGF-signaling orinjection of constitutive active (rat) ERK2 lead to phos-phorylation of SOX32 and repression of the endodermmarker sox17. However, in our study, ERK2 morphantsshowed a reduced expression of the upstream Nodalresponsive genes gata5, sox32 and sox17. These genes arenormally expressed in presumptive endoderm progenitorcells in the margin at 4,5 hpf [42]. This suggests thatdepletion of ERK2 also affects endoderm differentiation(Fig. 11). Follow-up experiments, using different times ofdevelopment in combination with chromatin immuno-precipitation (chIP-chip) methodology will be needed tofurther understand the crucial function of ERK2 in mesen-doderm development and determine specific target genes.
ConclusionOur analysis of the gene expression microarray datarevealed that ERK1 and ERK2 knockdown affected a set ofcommon, as well as specific downstream genes. Interest-ingly, we also discovered a set of genes with anti-corre-lated expression. The gene ontology analyses show thatERK1 and ERK2 have specific roles in embryogenesis andtarget distinct gene sets involved in vertebrate develop-ment, confirming the embryonic knockdown phenotypes.These gene sets are large and considering the early embry-onic time points of analyses, most likely include manydirect transcriptional targets at least at the oblong stage. Atlater stages we expect to have identified also several sec-ondary effects that are due to phenotypic changes. The sig-naling pathway analysis on the ERK1 and ERK2transcriptome signatures using the GenMAPP softwareprogram for analysis of BMP, FGF, Nodal and Wnt signal-ing pathways indicated distinct roles for these MAP
kinases. For ERK1 knockdown we identified a connectionwith genes involved in dorsal-ventral patterning and sub-sequent embryonic cell migration. For ERK2 knockdownwe identified a connection with genes involved in meso-derm and endoderm initiation, differentiation and pat-terning. The outcome of the predictions for ERK2knockdown on developmental signaling were confirmedby the observed effects on mesoderm and endoderm pat-terning and subsequent whole mount in situ hybridiza-tion experiments. Our results demonstrate the strength ofgene expression profiling of morpholino knockdownembryos in combination with versatile bioinformaticstools in order to show common functions as well as dis-tinct functions for highly related signaling proteins suchas ERK1 and ERK2.
MethodsZebrafish Morpholino knockdown experimentsZebrafish embryos were injected at the one-cell stage with1 nl of the solubilized compounds in 1× Danieau's buffer[58 mM NaCl, 0.7 mM KCl, 0.4 mM MgSO4, 0.6 mMCa(NO3)2, 5.0 mM HEPES; pH 7.6] containing 1% Phe-nol red solution (Sigma). Definition of stages was accord-ing to Kimmel et al. At 1K-stage (3hpf), embryos with ared animal pole were selected as positive-injectedembryos.
To block translation of the ERK1 or ERK2 protein, 0.4 mM(3.4 ng) morpholinos (MOs) were injected per embryo.MOs were targeted against the 5'-UTR of the respectivemRNAs (GeneTools Philomath, OR, USA): ERK1-MO, 5'-TCTGTCCGCAAATCGTCGCCTTCGC; ERK2-MO, 5'-CACCCAAAAGCACCAGG AAAAGCTC. As a control, thestandard control morpholino standard control MO 5'-CCTCTTACCTCAGTTACAATTTATA was used at the sameconcentration. Injected embryos were kept at 28°C untildesired stages, until sacrifice.
RNA isolation from zebrafish embryosThe zebrafish embryos were homogenized in liquid nitro-gen and total RNA was extracted using Trizol reagent (Inv-itrogen) according to the manufacturer's instructions. Toremove genomic DNA, RNA samples were incubated at37°C for 15 min with 10 units of DNaseI (Roche). TheRNA samples were purified using the RNeasy kit (Qiagen)according to the RNA Cleanup protocol. Total RNA con-centrations were determined spectrophotometricallyusing a Nanodrop ND-1000 (Isogen Life science). Opticaldensity A260/A280 ratios of all samples ranged from 1.8–1.9, indicating high purity.
Experimental design, Labeling and Hybridization of Agilent 22K-microarraysA total of 19 Agilent 22K-microarray hybridizations wereperformed for this gene expression profiling study of
Page 18 of 21(page number not for citation purposes)

BMC Genomics 2008, 9:196 http://www.biomedcentral.com/1471-2164/9/196
ERK1 versus ERK2 knockdown during development. Aminimum of 2 independent biological replicates wereanalyzed for each biological sample In the case of ERK1 at80% epiboly and ERK2 at 30%- and 80% epiboly, addi-tional technical replicate were hybridized for each biolog-ical replicate, including dye swaps. For each biologicalsample, a number of 70–100 morpholino injectedembryos were collected. The RNA from standard controlMO injected embryos was labeled with Cy3 and those ofERK1MO and ERK2MO injected embryos were labeledwith Cy5, using the Agilent Low RNA input linear ampli-fication kit. Hybridization and scanning were performedaccording to standard Agilent protocol by Service XS (Lei-den, the Netherlands).
Data analysis of Agilent 22K-microarraysFeature Extraction also performed by Service XS using Agi-lent FE 8.5 software. Our data has successfully completedthe curration protocol by MIAMExpress in the EBI publicArray-express database [43]. Subsequent analysis was per-formed using the default settings implemented in RosettaResolver v 7.0 for an error modeling-based normalization.For the analysis and detailed annotation shown in theVenn diagrams and bar-graphs, the combine p-value pergene had to be 10e-5. For the annotated tables we focusedon the genes that were most significantly affected. For thatselection we used the following criteria: the absolute foldchange should be at least 1.5 in each independent repli-cate; and the p-value provided by the error-model takinginto account all hybridizations combined must be smallerthan 10-5 to compensate for multiple testing false posi-tives.
For Gene Ontology analysis, the Unigene ID-linked geneexpression signature sets of the ERK1 and ERK2 mor-phants were uploaded into the GeneTools eGOn V2.0web-based gene ontology analysis software (explore GeneOntology, database build #97) [44]. These signature setscomprised 575 Unigene IDs in the case of ERK1 mor-phants and 2987 Unigene IDs in the case of ERK2 mor-phants were compared to the complete set of 21485Unigene IDs linked probes from the Agilent 22K zebrafishmicroarray chip (Biological Process; 6036 Unigene IDs,Molecular Function; 6322 Unigene IDs and CellularComponent; 5606 Unigene IDs). We determined the sig-nificantly over- or under represented Gene Ontology clus-ters in the ERK1MO and ERK2MO Unigene ID linkedsignature sets (p-value < 0.05 or 0.02). The number ofGO-terms was reduced by excluding GO clusters withhigh similarity in representative genes. To ensure statisti-cal relevance, also the GO-clusters that contained lessthan 10 Unigene IDs were also removed. The relative foldof gene-enrichment within the ERK1- and ERK2-mor-phant signature sets was calculated for the selected GO-terms.
For the tables used for GeneMAPP analysis we took a lessstringent approach not limiting the number of genes byfold change, therefore using all genes that had a combinedp-value smaller than 10-5. In this approach we focus ontranscriptional effects that can be linked to the phenotypicchanges as a result of pathway blocking by ERK knock-down.
cDNA synthesis and Quantitative PCRcDNA synthesis was performed using a TGradient Ther-mocycler 96 (Whatman Biometra) according to the man-ufacturer's instructions. RNA samples were identical tothose used for microarray hybridization. Reactions wereperformed in a 20 μl mixture of 150 ng RNA, 4 μl of 5×iScript Reaction mix (Bio-Rad) and 1 μl of iScript ReverseTranscriptase (Bio-Rad). The reaction mixtures were incu-bated at 25°C for 5 min, 42°C for 30 min, and 85°C for5 min.
Quantitative real-time PCR was performed using theChromo4 Four-color Real-time PCR detection system(Bio-Rad laboratories, Hercules, CA) according to themanufacturers' instructions. Gene-specific primers forquantitative real-time PCR were designed, using BeaconDesigner software, to generate single gene-specific ampli-cons of 75–150 nucleotides. Reactions were performed ina 25 μl volume comprised of 1 μl cDNA, 12.5 μl of 2× iQSYBR Green Supermix (Bio-Rad) and 10 pmol of eachprimer. Cycling parameters were 94°C for 3 min to acti-vate the polymerase, followed by 40 cycles of 94°C for 15sec and 59°C for 45 sec. Fluorescence measurements weretaken at the end of each cycle. Melting curve analysis wasperformed to verify that no primer dimers were amplified.All reactions were done in duplicate or triplicate and thethreshold cycle CT values were plotted against the base 10log of the amount of cDNA by using Opticon Monitor 3.1(Bio-Rad) according to the manufacturer's instructions.For evaluation of PCR efficiencies of all primers sets stand-ard curves were generated using serial diluted cDNA sam-ples (dilution factors of 1, 5, 25, 125 and 625) and stronglinear correlations between the CT values and the log ofinput cDNA amount were obtained, indicating correla-tion coefficiencies ranging from 98% to 101%. Data werenormalized using the Genex macro provided by Bio-Rad.
The expression level were tested for cdh2 (NM_131081),mycn (NM_212614), erm (NM_131205), cfos(NM_205569), mos (NM_205580), snai1a (NM_131066)and vegf (NM_131408) on the same RNA samples usedfor the array analysis: 0.4 mM (= 3.4 ng/embryo)ERK1MO, ERK2MO and standard control MO injectedembryos, collected at 30% epiboly. α-actin was taken asreference and it showed unchanged expression levelbetween standard control MO injected and ERK1MO orERK2MO injected embryos. Sequences of forward and
Page 19 of 21(page number not for citation purposes)

BMC Genomics 2008, 9:196 http://www.biomedcentral.com/1471-2164/9/196
reverse primers were 5'-CGAGCAGGAGATGGGAACC-3'and 5'-CAACGGAAACGCTCATTGC-3' for β-actin (acces-sion no. AF057040).
Cdh2; qP1fw 5'-ACAAGAAGCAGAAGTGTGTGAGC-3'and qP2rv AGCGTAGGGTCCAGCGTTG-3',
Mycn; qP1fw 5'-GAGGATGATGAGGAAGATGATGAAG-3',qP2rv 5'-CCTGCCTGAGAGTTGGAGAC-3',
erm; qP3fw, 5'-TCCACCAACTCTCAATCAAACAGG-3' andqP4rv 5'-AGATGGGCTTCTCCGTCATACC-3',
cfos; (NM_205569) qP1Fw 5'-TGACCT-GGAGCCGCTTTGC-3' and qP2rv 5'-GGTAGGTGAACAT-GAAGGAAGACG-3',
mos; (NM_205580) qP1fw 5'-CCCTCACCAATCCCCGT-CAC-3' and qP2rv 5'-GAGCCTGTGTGCGACTTTACC-3',
snai1a; qP3fw 5'-TCCTGCCCACACTGTAACCG-3' andqP4rv 5'-GCGACTAAAGGTGCGAGAGC-3',
vegf; qP1fw 5'-GCGGCTCTCCTCCATCTG-3' and qP2rv5'-ACATCCATGAAGGGAATCACATC-3'.
Whole mount in situ hybridizationEmbryos were fixed overnight in 4% paraformaldehyde inPBS at 4°C and in situ hybridization was performed asdescribed previously [45] using described probes for gsc,lft1/antivin, vox, vent, ntl and tbx6.
Authors' contributionsGK Was involved in all experiments, experimental designand bioinformatics analyses. He co-drafted the manu-script, made revisions critically for important intellectualcontent and submitted the data to the Miamexpress data-base. MC uploaded data in the Rosetta Resolver databaseand assisted in bioinformatics analyses. SH carried out thelabeling reactions for micro-array analyses and performedQ-PCR experiments. ES-J performed the western blot anal-yses, co-drafted the manuscript, made revisions criticallyfor important intellectual content and participated indesign and coordination. HS co-drafted the manuscript,made revisions critically for important intellectual con-tent and gave final approval for the final version to bepublished and participated in design and coordination.
Additional material
AcknowledgementsWe gratefully acknowledge Zoltan Hegedus for the help with the annota-tion of the complete 22K Agilent zebrafish microarray chips. We thank Carl Philipp Heisenberg for providing us with probe constructs, Professor David Kimelman for providing the vox and vent probe constructs and Eric Schmidt from the Robert Ho-lab., for providing the tbx6-probe construct In addi-tion, we thank Annemarie Meijer and Enrique Salas-Vidal for stimulating dis-cussions. This work was financially supported by the European Commission 6th Framework Program (LSHG-CT-2003-503496, ZF-MODELS).
References1. Johnson GL, Dohlman HG, Graves LM: MAPK kinase kinases
(MKKKs) as a target class for small-molecule inhibition tomodulate signaling networks and gene expression. CurrentOpinion in Chemical Biology 2005, 9:325-331.
2. Vantaggiato C, Formentini I, Bondanza A, Bonini C, Naldini L, Bram-billa R: ERK1 and ERK2 mitogen-activated protein kinasesaffect Ras-dependent cell signaling differentially. Journal of Biol-ogy 2006, 5:14.1-14.15 [http://jbiol.com/content/5/5/14].
3. Lloyd A: Distinct functions for ERKs? Journal of Biology 2006, 5:13.4. Scholl FA, Dumesic PA, Barragan DI, Harada K, Bissonauth V, Char-
ron J, Khavari PA: Mek1/2 MAPK Kinases Are Essential forMammalian Development, Homeostasis, and Raf-InducedHyperplasia. Developmental Cell 2007, 12:615-629.
5. Pagès G, Guérin S, Grall D, Bonino F, Smith A, Anjuere F, AubergerP, Pouysségur J: Defective Thymocyte Maturation in p44 MAPKinase (Erk 1) Knockout Mice. Science 1999, 286:1374-1377.
Additional file 1Additional data is submitted as tables S1 to S6 consists of the ERK1 and ERK2 knockdown commonly and anti-correlated regulated probes (table S1 to S4), containing the assigned gene designations (Unigene, accession number and sequence name), the fold of the changed expression and p-value (smaller than 10-5 to compensate for multiple testing false positives) for these genes. The tables S5 and S6 contain genes selected by a stringent selected that were only found in either ERK1MO or ERK2MO gene-pools were manually annotated and assigned gene designations as listed in. Table S1 – Anti-correlated regulated genes1: ERK1MO up-regulated, ERK2MO down-regulated. Table S2 – Anti-correlated regulated genes2: ERK1MO down-regulated, ERK2MO up-regulated. Table S3 – Commonly down-regulated genes by ERK1or ERK2 knockdown at 30% epiboly. Table S4 – Commonly up-regulated genes by ERK1or ERK2 knockdown at 30% epiboly. Table S5 – ERK1 knockdown specific genes at 30% epiboly, filtered by a 1.5 fold up- or down- regulation per experiment and a common P-value of 10-5 . Table S6 – ERK2 knockdown specific genes at 30% epiboly, filtered by a 1.5 fold up- or down- regulation per experiment and a common P-value of 10-5
Click here for file[http://www.biomedcentral.com/content/supplementary/1471-2164-9-196-S1.doc]
Additional file 2ERK1 knockdown phenotype at 24 and 48hpf. Images show represent-ative examples of surviving ERK1 morpholino injected embryos with a tail-less phenotype at 24 and 48hpf.Click here for file[http://www.biomedcentral.com/content/supplementary/1471-2164-9-196-S2.pdf]
Page 20 of 21(page number not for citation purposes)
BMC Genomics 2008, 9:196 http://www.biomedcentral.com/1471-2164/9/196
Publish with BioMed Central and every scientist can read your work free of charge
"BioMed Central will be the most significant development for disseminating the results of biomedical research in our lifetime."
Sir Paul Nurse, Cancer Research UK
Your research papers will be:
available free of charge to the entire biomedical community
peer reviewed and published immediately upon acceptance
cited in PubMed and archived on PubMed Central
yours — you keep the copyright
Submit your manuscript here:http://www.biomedcentral.com/info/publishing_adv.asp
BioMedcentral
6. Saba-El-Leil MK, Vella FDJ, Vernay B, Voisin L, Chen L, Labrecque N,Ang SL, Meloche S: An essential function of the mitogen-acti-vated protein kinase Erk2 in mouse trophoblast develop-ment 4. Embo Reports 2003, 4:964-968.
7. Gotoh Y, Nishida E: Signals for mesoderm induction. Roles offibroblast growth factor (FGF)/mitogen-activated proteinkinase (MAPK) pathway. Biochimica et Biophysica Acta (BBA) -Reviews on Cancer 1996, 1288:F1-F7.
8. Bottcher RT, Niehrs C: Fibroblast Growth Factor Signalingduring Early Vertebrate Development. Endocr Rev 2005,26:63-77.
9. Nasevicius A, Ekker SC: Effective targeted gene /`knockdown/'in zebrafish. Nat Genet 2000, 26:216-220.
10. Dahlquist KD, Salomonis N, Vranizan K, Lawlor SC, Conklin BR:GenMAPP, a new tool for viewing and analyzing microarraydata on biological pathways 1. Nature Genetics 2002, 31:19-20.
11. GenMAPP 2008 [http://www.genmapp.org/].12. Schier A.F. TWS: Molecular genetics of axis formation in
zebrafish. Annu Rev Genet 2005, 39:561-613 [http://arjournals.annualreviews.org/doi/abs/10.1146/annurev.genet.37.110801.143752].
13. Kimmel CB, Ballard WW, Kimmel SR, Ullmann B, Schilling TF: Stagesof Embryonic-Development of the Zebrafish 1. DevelopmentalDynamics 1995, 203:253-310.
14. Science's STKE Connections Map Database 2008 [http://stke.sciencemag.org/cm/].
15. Melby AE, Beach C, Mullins M, Kimelman D: Patterning the EarlyZebrafish by the Opposing Actions of bozozok and vox/vent.Developmental Biology 2000, 224:275-285.
16. Daggett DF, Boyd CA, Gautier P, Bryson-Richardson RJ, Thisse C,Thisse B, Amacher SL, Currie PD: Developmentally RestrictedActin-Regulatory Molecules Control Morphogenetic CellMovements in the Zebrafish Gastrula. Current Biology 2004,14:1632-1638.
17. Warga RM, Kane DA: One-eyed pinhead regulates cell motilityindependent of Squint/Cyclops signaling. Developmental Biology2003, 261:391-411.
18. Maegawa S, Varga M, Weinberg ES: FGF signaling is required for{beta}-catenin-mediated induction of the zebrafish organ-izer. Development 2006, 133:3265-3276.
19. Behrens J, Jerchow BA, rtele M, Grimm J, Asbrand C, Wirtz R, hl M,Wedlich D, Birchmeier W: Functional Interaction of an AxinHomolog, Conductin, with {beta}-Catenin, APC, and GSK3.Science 1998, 280:596-599.
20. Stachel SE, Grunwald DJ, Myers PZ: Lithium perturbation andgoosecoid expression identify a dorsal specification pathwayin the pregastrula zebrafish. Development 1993, 117:1261-1274.
21. Thisse C, Thisse B: Antivin, a novel and divergent member ofthe TGFbeta superfamily, negatively regulates mesoderminduction. Development 1999, 126:229-240.
22. Schulte-Merker S, Ho RK, Herrmann BG, Nusslein-Volhard C: Theprotein product of the zebrafish homologue of the mouse Tgene is expressed in nuclei of the germ ring and the noto-chord of the early embryo. Development 1992, 116:1021-1032.
23. Draper BW, Stock DW, Kimmel CB: Zebrafish fgf24 functionswith fgf8 to promote posterior mesodermal development.Development 2003, 130:4639-4654.
24. Griffin KJP, Kimelman D: Interplay between FGF, one-eyed pin-head, and T-box transcription factors during zebrafish poste-rior development. Developmental Biology 2003, 264:456-466.
25. Hug B, Walter V, Grunwald DJ: tbx6,aBrachyury-Related GeneExpressed by Ventral Mesendodermal Precursors in theZebrafish Embryo. Developmental Biology 1997, 183:61-73.
26. Yao Y, Li W, Wu J, Germann UA, Su MSS, Kuida K, Boucher DM:Extracellular signal-regulated kinase 2 is necessary for mes-oderm differentiation. PNAS 2003, 100:12759-12764.
27. Belanger LF, Roy S, Tremblay M, Brott B, Steff AM, Mourad W, HugoP, Erikson R, Charron J: Mek2 Is Dispensable for Mouse Growthand Development. Mol Cell Biol 2003, 23:4778-4787.
28. Bissonauth V, Roy S, Gravel M, Guillemette S, Charron J: Require-ment for Map2k1 (Mek1) in extra-embryonic ectoderm dur-ing placentogenesis. Development 2006, 133:3429-3440.
29. Binetruy B, Heasley L, Bost F, Caron L, Aouadi M: Concise Review:Regulation of Embryonic Stem Cell Lineage Commitmentby Mitogen-Activated Protein Kinases. Stem Cells 2007,25:1090-1095.
30. Bost F, Aouadi M, Caron L, Binetruy B: The role of MAPKs in adi-pocyte differentiation and obesity. Biochimie 2005, 87:51-56.
31. Hu E, Kim JB, Sarraf P, Bruce M, Spiegelman : Inhibition of Adipo-genesis Through MAP Kinase-Mediated Phosphorylation ofPPARgamma. Science 1996, 274:2100-2103.
32. Camp HS, Tafuri SR: Regulation of Peroxisome Proliferator-activated Receptor gamma Activity by Mitogen-activatedProtein Kinase. Journal of Biological Chemistry 1997,272:10811-10816.
33. Kimelman D: Mesoderm induction: from caps to chips 1.Nature Reviews Genetics 2006, 7:360-372.
34. Agathon A, Thisse C, Thisse B: The molecular nature of thezebrafish tail organizer. Nature 2003, 424:448-452.
35. Hammerschmidt M, Pelegri F, Mullins MC, Kane DA, Brand M,vanEeden FJM, FurutaniSeiki M, Granato M, Haffter P, Heisenberg CP,Jiang YJ, Kelsh RN, Odenthal J, Warga RM, NussleinVolhard C: Muta-tions affecting morphogenesis during gastrulation and tailformation in the zebrafish, Danio rerio 2. Development 1996,123:143-151.
36. Mathieu J, Griffin K, Herbomel P, Dickmeis T, Strahle U, Kimelman D,Rosa FM, Peyrieras N: Nodal and Fgf pathways interact througha positive regulatory loop and synergize to maintain meso-dermal cell populations. Development 2004, 131:629-641.
37. Mizoguchi T, Izawa T, Kuroiwa A, Kikuchi Y: Fgf signaling nega-tively regulates Nodal-dependent endoderm induction inzebrafish 1. Developmental Biology 2006, 300:612-622.
38. Gabay L, Seger R, Shilo BZ: MAP kinase in situ activation atlasduring Drosophila embryogenesis. Development 1997,124:3535-3541.
39. Gryzik T, Muller HAJ: FGF8-like1 and FGF8-like2 encode puta-tive ligands of the FGF receptor Htl for mesoderm migra-tion and are required in the Drosophila gastrula 2. CurrentBiology 2004, 14:659-667.
40. Stathopoulos A, Tam B, Ronshaugen M, Frasch M, Levine M: pyra-mus and thisbe: FGF genes that pattern the mesoderm ofDrosophila embryos. Genes and Development 2004, 18:687-699.
41. Gotoh Y, Masuyama N, Suzuki A, Ueno N, Nishida E: Involvementof the Map Kinase Cascade in Xenopus Mesoderm Induction1. Embo Journal 1995, 14:2491-2498.
42. Aoki TO, David NB, Minchiotti G, Saint-Etienne L, Dickmeis T, Per-sico GM, Strahle U, Mourrain P, Rosa FM: Molecular integrationof casanova in the Nodal signalling pathway controllingendoderm formation. Development 2002, 129:275-286.
43. MIAMExpress, EBI public Array-express database 2008[http://www.ebi.ac.uk/arrayexpress/].
44. Beisvag V, Junge F, Bergum H, Jolsum L, Lydersen S, Gunther CC,Ramampiaro H, Langaas M, Sandvik A, Laegreid A: GeneTools -application for functional annotation and statistical hypothe-sis testing. BMC Bioinformatics 2006, 7:470.
45. Thisse C, Thisse B, Schilling TF, Postlethwait JH: Structure of thezebrafish snail1 gene and its expression in wild-type, spade-tail and no tail mutant embryos. Development 1993,119:1203-1215.
Page 21 of 21(page number not for citation purposes)


