Embed Size (px)
Citation preview

ptena and ptenb Genes Play Distinct Roles in ZebrafishEmbryogenesis
Jessica A. Croushore1,#, Brian Blasiole1,#, Ryan C. Riddle2, Christine Thisse4, BernardThisse4, Victor A. Canfield1, Gavin P. Robertson1, Keith Cheng3, and Robert Levenson1,*
1Department of Pharmacology, Penn State University College of Medicine, Hershey, PA 170332Division of Musculoskeletal Sciences, Department of Orthopaedics and Rehabilitation, PennState University College of Medicine, Hershey, PA 170333Pathology and Jake Gittlen Cancer Research Institute, Penn State University College ofMedicine, Hershey, PA 170334Institute de Genetique et de Biologie Moleculaire et Cellulaire, CNRS/INSERM/ULP, CU deStrasbourg, Strasbourg, France
AbstractPTEN is a tumor suppressor gene associated with multiple tumor types. PTEN function is essentialfor early embryonic development and is involved in the regulation of cell size, number, andsurvival. By dephosphorylating PIP3, PTEN normally acts to inhibit the PI3-Kinase/AKTpathway. Here we have identified two zebrafish orthologs, ptena and ptenb, of the singlemammalian PTEN gene and analyzed the role of these genes in zebrafish development. ptenatranscripts were expressed throughout the embryo at early somitogenesis. By 24 hpf, expressionwas predominant in the central nervous system, axial vasculature, retina, branchial arches, ear,lateral line primordium, and pectoral fin bud. ptenb was also ubiquitously expressed early insomitogenesis, but transcripts became more restricted to the somites and central nervous system asdevelopment progressed. By 48 hpf, ptena and ptenb were expressed predominantly in the centralnervous system, branchial arches, pectoral fins, and eye. Antisense morpholinos were used toknock down translation of ptena and ptenb mRNA in zebrafish embryos. Knockdown of eitherpten gene caused increased levels of phosphorylated Akt in morphant embryos, indicating thatPtena and Ptenb each possess PIP3 lipid phosphatase activity. ptena morphants had irregularitiesin notochord shape (73%), vasculogenesis (83%), head shape (72%), and inner ear development(59%). The most noticeable defects in ptenb morphants were upward hooked tails (73%), domedheads (83%), and reduced yolk extensions (90%). These results indicate that ptena and ptenbencode functional enzymes and that each pten gene plays a distinct role during zebrafishembryogenesis.
KeywordsZebrafish; PTEN; mRNA expression; development; morpholino knockdown
*Corresponding Author, Department of Pharmacology, H078, Hershey, PA 17033, Tel. (717) 531-4545, Fax: (717) 531-5013, Email:[email protected].#These authors contributed equally to this workWEBSITE REFERENCEShttp://www.ensembl.org/; Zebrafish Sequencing Grouphttp://zfin.org/cgi-bin/webdriver?MIval=aa-pubview2.apg&OID=ZDB-PUB-010810-1; Thisse, B., Pflumio, S., Fürthauer, M.,Loppin, B., Heyer, V., Degrave, A., Woehl, R., Lux, A., Steffan, T., Charbonnier, X.Q. and Thisse, C. Expression of the zebrafishgenome during embryogenesis.
NIH Public AccessAuthor ManuscriptDev Dyn. Author manuscript; available in PMC 2008 December 29.
Published in final edited form as:Dev Dyn. 2005 December ; 234(4): 911–921. doi:10.1002/dvdy.20576.
NIH
-PA Author Manuscript
NIH
-PA Author Manuscript
NIH
-PA Author Manuscript

INTRODUCTIONPTEN (phosphatase and tensin homolog deleted on chromosome 10) is a tumor suppressorgene that is mutated in a number of human cancers including glioblastoma, advancedprostate cancer, breast cancer, endometrial carcinoma, and melanoma (Li and Sun, 1997; Liet al., 1997; Steck et al., 1997; Podsypanina et al., 1999; Birck et al., 2000; Zhou et al.,2002). Mutations in the PTEN gene are also responsible for the tumor predispositionsyndromes Cowden disease (Liaw et al., 1997), Bannayan-Zonana (Marsh et al., 1997), andLhermitte-Duclose disease (Zhou et al., 2003). PTEN has been shown to have protein andlipid phosphatase activity in vitro, although only the lipid phosphatase activity has beendemonstrated in vivo (Maehama and Dixon, 1998). PTEN acts as a negative regulator of thePI3-Kinase/AKT pathway via its ability to dephosphorylate phosphatidylinositol-3,4,5-triphosphate (PIP3). The PI3-Kinase/AKT pathway is involved in regulating cell growth,motility, and survival (Thompson and Thompson, 2004). Mutations or deletions of PTENlead to overactivation of the PI3-Kinase/AKT pathway which contributes to tumorigenesis(Wu et al., 1998; Stahl et al., 2003).
PTEN also plays an essential role in early animal development, although the precisefunction of PTEN in embryogenesis remains enigmatic. Homozygous knockouts of Pten inmice have been found to cause embryonic lethality, although the mutant phenotypes differedbetween various studies (Di Cristofano et al., 1998; Suzuki et al., 1998; Podsypanina et al.,1999). Since Pten is normally expressed ubiquitously during early murine development,embryonic lethality in Pten null mice has been interpreted to result from abnormaldevelopment of multiple organs and tissues (Stiles et al., 2004). Tissue-specific knockout ofPten in mice suggests a possible role for PTEN in the regulation of cell size and growth(Kishimoto et al., 2003). PTEN has also been shown to be essential for Drosophiladevelopment as dPTEN null mutants die at early larval stages (Goberdhan et al., 1999;Huang et al., 1999; Gao et al., 2000). PTEN appears to regulate the size of cells and organsas well as cell survival in Drosophila development. These properties of PTEN have beenattributed to PTEN regulation of the PI3-Kinase/AKT pathway (Goberdhan et al., 1999).
To analyze the role of PTEN in vertebrate development, we took advantage of the powerfulreverse genetic tools available in zebrafish. Antisense morpholino (MO) gene knockdownprovides a means to produce hypomorphs for any gene in the zebrafish genome (Naseviciusand Ekker, 2000). Graded knockdowns with MOs in zebrafish make it possible to study thedevelopmental function of essential genes ex utero, which is extremely difficult in mice. Forexample, homozygous looptail (Ltap) mutants (Kibar et al., 2001) or knockouts of VEGF(Ferrara et al., 1996) in mice result in embryonic lethality. Alternatively, MO knockdown ofthe Ltap ortholog strabismus/Van Gogh (Park and Moon, 2002) or VEGF (Nasevicius et al.,2000) in zebrafish provided further insight into the developmental function of these genes.
We have identified two paralogous PTEN genes in zebrafish, ptena and ptenb. These genesexhibit distinct but overlapping expression patterns early in embryogenesis. By 48 hpf, bothgenes show similar expression in the CNS, branchial arches, pectoral fin, and eye. ptena andptenb appear to function as PIP3 lipid phosphatases based on their ability to decreasephosphorylation of Akt. Knockdown of ptena caused irregularities in notochord and headshape, vasculogenesis, and ear development, while knockdown of ptenb caused hooked tails,domed heads, and reduced yolk extensions. Since morpholino knockdown of ptena andptenb mRNA translation in zebrafish produced unique phenotypes, it is likely that these twohighly related genes play distinct roles in the developing zebrafish embryo.
Croushore et al. Page 2
Dev Dyn. Author manuscript; available in PMC 2008 December 29.
NIH
-PA Author Manuscript
NIH
-PA Author Manuscript
NIH
-PA Author Manuscript

RESULTSIdentification and Characterization of Zebrafish pten Genes
Zebrafish pten genes were identified by BLAST searches of the zebrafish EST database.These searches revealed two distinct classes of cDNAs, one class encoding ptena and theother ptenb. Primers were designed to amplify full-length pten ORFs using RT-PCR.Sequencing of the initial amplification products revealed the presence of two splice variantsof the ptena and ptenb genes. The short splice variants were found to contain the sameintron/exon organization as the mammalian PTEN gene (Fig. 1). The long splice variant ofboth ptena and ptenb contained a 69 base pair (bp) insertion corresponding to the boundaryof the 6th and 7th exons of the mammalian PTEN gene (GenBank accession no.AH005966). The inserted 69 bp exon was found in zebrafish genomic DNA, and in the RT-PCR products amplified from embryonic and adult zebrafish mRNA. The additional exonfound in the zebrafish ptena and ptenb genes is also present in the pten genes of Fugu,Tetraodon, and medaka (not shown), but not in chicken, human, or other tetrapod PTENgenes.
The complete ORFs for the ptena long and short splice variants encode polypeptides of 454and 431 amino acids. The complete ORFs for the ptenb splice variants encode polypeptides422 and 399 amino acids in length. An amino acid sequence alignment of the zebrafishPtena, Ptenb, and human PTEN polypeptides is shown in Fig. 1. Zebrafish Ptena and Ptenbpolypeptides exhibit 88% and 86% identity, respectively, with human PTEN. Thephosphatase motif (amino acids 123–130 of human PTEN) shows complete identity betweenthe human and zebrafish PTEN polypeptides. The region of greatest divergence, includingthe alternatively spliced region of Ptena and Ptenb and a 32 amino acid insertion found inPtena, occurs within the C2 domain, a region proposed to have a potential role in membranelocalization (Lee et al., 1999).
BLAST searches of the zebrafish genome assembly (Version 4) available from the ZebrafishSequencing Group indicate that the zebrafish ptena gene is located on linkage group (LG)17 (Zv4_scaffold1476.4), and the ptenb gene maps to LG 12 (GenBank accession nos.AL731788.8 and BX548001.4). These linkage groups have significant synteny with humanchromosome 10, the location of the human PTEN gene (Woods et al., 2000). These resultssuggest that the zebrafish ptena and ptenb genes most likely arose as a result of the genome-wide duplication that occurred in teleost fish (Amores et al., 1998; Postlethwait et al., 1998).
Expression of ptena and ptenb Genes in Zebrafish EmbryosWe used an RT-PCR approach to analyze stage-specific expression of the zebrafish ptensplice variants. Primers specific for ptena were found to amplify both the long and shortptena splice variants from all stages of embryonic development tested (6 hpf-72 hpf) as wellas the adult (Fig. 2A). Similarly, long and short splice variants of ptenb were also detected atequivalent developmental stages (Fig. 3A). It should be noted that the RT-PCR approachused was not quantitative, and therefore the relative abundance of reaction products may notaccurately reflect ptena and ptenb mRNA levels in vivo.
Whole-mount in situ hybridization was used to analyze the expression patterns of ptena andptenb during zebrafish embryogenesis. As shown in Fig. 2B–C, ptena mRNA was broadlyexpressed throughout the embryo at early and mid-somitogenesis. At 24 hpf, transcripts ofptena were more abundant in the CNS, axial vasculature, retina, branchial arches andpectoral fin bud (Fig 2 D–F). In the CNS, ptena was expressed predominantly in thetelencephlon and the spinal cord (with the exception of the floor plate). Additionalexpression of ptena in the wall of the aorta and in the lateral line primordium was observedin transverse sections of 24 hpf embryos (Fig. 2H). Between 24 hpf and 48 hpf, low levels of
Croushore et al. Page 3
Dev Dyn. Author manuscript; available in PMC 2008 December 29.
NIH
-PA Author Manuscript
NIH
-PA Author Manuscript
NIH
-PA Author Manuscript

ptena expression were detected in the otic vesicle (Fig. 2E, G). From 48 hpf through 5 dpf,robust ptena expression was detected in the eye, CNS, branchial arches, endoderm, andpectoral fin buds (Fig. 2I–K).
From early somitogenesis through 24 hpf, low levels of ptenb mRNA were detectedthroughout the embryo with higher levels present in the caudal somites (Fig. 3B–H). At the10-somite stage, expression of ptenb was restricted to the posterior and lateral compartmentsof the somites, which are destined to become fast muscle fibers (Fig. 3D–E). At the 18-somite stage, ptenb expression became restricted to the ventral portion of the somites, whiletranscripts of ptenb were detectable in neurons of the spinal cord and the cranial ganglia,particularly those in the trigeminal placode (Fig. 3F–H). At 24 hpf, ptenb expression wasobserved in the spinal cord, the brain, and in the ventral portion of the somites (Fig. 3I–J). Inbrain, ptenb transcripts were particularly abundant in nuclei of the diencephalon,telencephalon, and tegmentum (Fig. 3J). Between 48 hpf and 5 dpf, ptenb transcripts weremost abundant in the central nervous system, branchial arches, pectoral fin, and eye (Fig.3L–M). In contrast to ptena, there was no apparent enrichment of ptenb transcripts in the 36hpf otic vesicle (Fig. 3K).
Antisense Morpholino Knockdown of ptena and ptenb ExpressionWe have utilized antisense morpholinos (MOs) to analyze the role of the ptena and ptenbgenes in zebrafish development. Two independent non-overlapping antisense MOs weredesigned to target the 5’UTR of each pten gene. One of each pair of MOs was used in an invitro translation assay (Blasiole et al., 2005) to confirm the specificity of the MOs for theirrespective target sequences. The ptena MO (ptena-MO1) decreased the translation of ptenamRNA by 83% compared to ptena mRNA translated in the absence of MO (Fig. 4A).Translation of ptena mRNA was not inhibited by a ptenb MO (ptenb-MO1) or an MOtargeted to the zebrafish Na,K-ATPase α1a.1 subunit (atp1a1a.1-MO). Compared to the invitro translation of ptenb mRNA in the absence of MO, translation of ptenb mRNA wasreduced 90% by ptenb-MO1, but was not decreased in the presence of either ptena-MO1 orthe non-specific atp1a1a.1-MO (Fig. 4B). These results strongly suggest that the ptena andptenb MOs specifically block translation of their target mRNA sequences.
We examined the effect of ptena-MO1 and ptenb-MO1 on zebrafish embryogenesis. At 15hpf, high doses of ptena-MO1 (4 ng/embryo) produced extensive tissue disorganization,necrosis, and death of all injected embryos (n=273; data not shown). At a dose of 1 ng ofptena-MO1, >90% of injected embryos survived to 4 dpf (n=250). At 24 hpf, a variety ofdevelopmental defects were observed in ptena morphants (Fig. 5, Fig 6, and Table 1). Themost conspicuous morphological defects observed were smaller eyes, curved tails, and ashortened body axis. As outlined in Table 1, microscopic examination of ptena morphants(n=100) revealed defects in notocord shape (73%), ear morphology (59%), head shape(72%), and intersegmental blood flow (83%). By 4 dpf, the heads of ptena morphants failedto properly straighten, and a high percentage (>60%) of morphants displayed cardiac edema(Fig. 4P).
A prominent defect in ptena morphants (73%) was the appearance of an irregularly shaped(wavy) notocord (Fig. 5F). To analyze whether the notochord defect might be caused byalterations in the surrounding tissue, we examined the expression of myoD in the adjacentsomites. As shown in Fig 5, G-J, expression of myoD in wild type embryos and ptenamorphants appeared very similar, suggesting that the defect in notochord morphology wasnot due to disorganization of the surrounding somites. At a dose of 2 ng of ptenA-MO1,>75% of injected embryos survived through 4 dpf (n=250). We observed a lack ofintersegmental blood flow in 83% of these ptena morphants. Analysis of ptena morphantswith a VE-cadherin riboprobe, a marker of vascular endothelial tissue (Larson et al., 2004)
Croushore et al. Page 4
Dev Dyn. Author manuscript; available in PMC 2008 December 29.
NIH
-PA Author Manuscript
NIH
-PA Author Manuscript
NIH
-PA Author Manuscript

revealed that the intersegmental vessels were irregularly formed and did not follow the well-defined chevron shape characteristic of intersegmental vessels seen in wild type embryos(Fig. 5K–N). In addition, some of the intersegmental vessels in the morphants did not appearto completely traverse the trunk or form connections with the dorsal longitudinalanastomotic vessel (Fig. 5N). These results suggest that ptena may play a role in vasculardevelopment.
Knockdown of the ptena gene produced a noticeable effect on ear development in zebrafishembryos. At 24 hpf, wild type otic vesicles contained two characteristic rounded otoliths(Fig. 6A). In contrast, ptena morphants exhibited globular-shaped otoliths (Fig. 6B), and/ora single otolith (Fig. 6C, D). At 48 hpf, 59% (n=100) of ptena morphants contained only oneotolith (Fig. 6F). By 4 dpf, ptena morphants containing a single otolith failed to generate asecond otolith (100%; n = 59). In addition, 22% of ptena morphants containing one otolithalso exhibited a defect in semicircular canal formation (Fig. 6H, J). Aberrant semicircularcanal morphologies included failure of the epithelial pillars to fuse (Fig 6H), as well as thepresence of disorganized epithelial cell masses in the ear (Fig. 6J). Using whole-mount insitu hybridization, we analyzed expression of a number of ear markers involved in earpatterning (pax2a, otx1), otolith formation (starmaker), and semicircular canal development(dfna5, ncs-1a). We did not observe differences in mRNA expression between ptenamorphants and wild type controls for any of the markers analyzed (Fig. 6K–T), suggestingthat the inner ear defects caused by ptena-MO1 are not due to abnormal patterning of theotic vesicle or disrupted expression of genes involved in otolith formation or semicircularcanal development.
To confirm the role of ptena in zebrafish development, we analyzed the effects of a secondnon-overlapping morpholino (ptena-MO2; 1.5 ng) on zebrafish embryogenesis. At 24 hpf,ptena-MO2 phenocopied the otolith and notochord defects in 45% and 46% of injectedembryos (n=58), respectively. At 48 hpf, defects in intersegmental blood flow and headshape were observed in 47% and 35% (n=43) of injected embryos, respectively. None of theptena-MO2 morphants exhibited defects in semicircular canal formation by 4dpf. Theseresults are consistent with the view that in zebrafish, ptena plays an essential role in avariety of developmental processes including head and notochord formation as well as earand vascular system development.
We next analyzed the effect of knocking down translation of ptenb mRNA in zebrafishembryos using the ptenb MOs. High doses of ptenb-MO1 (8 ng) or ptenb-MO2 (8 ng)severely affected embryogenesis, such that all tissues were extremely disorganized, the bodyaxis was shortened, and all embryos died within 36 hpf (n=157; data not shown). At a doseof 4 ng of ptenb-MO1, 72% of ptenb morphants were viable at 48 hpf. At this stage, theprincipal defects we observed in ptenb morphants (n=100) were an upward hooked tail thatoccurred in 73% of the embryos, a domed head that occurred in 83% of the embryos, and areduction in the yolk extension that occurred in 90% of the embryos (Fig. 7 and Table 1).Compared to ptena morphants, <20% exhibited defects in the shape of the notochord, andonly 28% lacked intersegmental blood flow. By 24 hpf, >95% of ptenb morphantsdeveloped normal otoliths. Microinjection of ptenb-MO2 at a dose of 6 ng phenocopied thecurved tail defect only. Taken together, these results suggest that ptena and ptenb playdistinct roles in zebrafish development.
Biological Activity of Ptena and PtenbPTEN lipid phosphatase activity has previously been shown to negatively regulatephosphorylation of Akt by virtue of its ability to dephosphorylate PIP3 (Maehama andDixon, 1998). Because knockdown of ptena and ptenb expression gave distinctdevelopmental phenotypes, we asked whether the PIP3 lipid phosphatase activity of PTEN
Croushore et al. Page 5
Dev Dyn. Author manuscript; available in PMC 2008 December 29.
NIH
-PA Author Manuscript
NIH
-PA Author Manuscript
NIH
-PA Author Manuscript

was conserved in the Ptena and Ptenb enzymes of zebrafish. To do this, we compared thelevel of activated (phosphorylated) Akt (pAkt) in lysates prepared from wild type zebrafishand ptena and ptenb morphant embryos. Expression of Ptena and Ptenb was knocked downusing the ptena-MO1 and ptenb-MO1 morpholinos, and lysates were prepared from wildtype and morphant embryos at 48 hpf. Western blot analysis was then used to compare therelative amount of pAkt to total Akt (tAkt) in whole fish lysates. As shown in Fig. 8, MOknockdown of Ptena expression produced a significant increase in the relative amount ofpAkt compared to uninjected control embryos. A similar effect on pAkt levels was alsoobserved in lysates prepared from ptenb morphants (Fig 8). These results indicate thatzebrafish Ptena and Ptenb both exhibit PIP3 lipid phosphatase activity and function tonegatively regulate the PI3-Kinase/AKT pathway.
DISCUSSIONStudies of mouse knockouts and Drosophila mutants indicate that the PTEN tumorsuppressor gene plays an essential role in early development. However, since homozygousnull mutations in mice cause embryonic lethality, it has been difficult to gain a betterunderstanding of the precise developmental function of PTEN in vertebrates. Here we havestudied PTEN function using zebrafish as a model vertebrate developmental organism.Zebrafish offer many advantages for studying complex developmental processes. Inparticular, MO-based antisense knockdowns offer the possibility of creating hypomorphs ofspecific genes. Thus intermediate phenotypes may become manifest without the embryoniclethality associated with null mutations in species such as mouse. In zebrafish, we identifiedtwo paralogous pten genes, ptena and ptenb, that exhibit unique but overlapping expressionpatterns through development. Each gene encodes an enzyme that appears to negativelyregulate Akt phosphorylation and is required for embryogenesis. However, our observationthat knockdowns of ptena and ptenb expression produce distinct morphant phenotypessuggests that these two pten genes have different functional roles in zebrafish development.
Gene mapping data show that the zebrafish ptena and ptenb genes map to LGs 17 and12,respectively, while the human PTEN gene has been localized to chromosome 10 (Li et al.,1997). Both LG17 and LG 12 contain multiple orthologs of human genes located onchromosome 10 (Woods et al., 2000). The fact that these linkage groups share significantsynteny with human chromosome 10 is consistent with the view that these are duplicatechromosome segments. Our studies indicate that both Ptena and Ptenb negatively regulatethe PI3-Kinase/AKT pathway via their lipid phosphatase activity, and that each enzyme isrequired to support embryogenesis. However, it is of interest that knockdown of each ptengene produces a distinct morphant phenotype. This result suggests that the two genes are notable to compensate for one another in early embryogenesis. The duplication-degeneration-complementation model has been proposed to account for the retention of duplicated genesin the genome (Force et al., 1999). This model proposes that retention of duplicated genes inthe genome is accompanied by changes in localization or function such that the duplicatestogether retain the original functions of the single ancestral gene. It will now be ofconsiderable interest to determine whether the two zebrafish pten genes together perform thefunction of the single mammalian PTEN gene, or whether either of these duplicates haveevolved new functional properties. This question can be addressed using morpholino-basedknockdown coupled with mRNA rescue approaches that are now possible in zebrafish.
Mammals contain a single functional PTEN gene, and to date no splice variants of this genehave been identified. Both pten genes in zebrafish exhibit alternative splicing, with short andlong transcripts of ptena and ptenb expressed throughout embryogenesis and in adult fish.The presence of the alternatively spliced exon in both fish genes indicates that it predates theduplication in the teleost lineage. However, available data are insufficient to determine
Croushore et al. Page 6
Dev Dyn. Author manuscript; available in PMC 2008 December 29.
NIH
-PA Author Manuscript
NIH
-PA Author Manuscript
NIH
-PA Author Manuscript

whether this exon was present in an ancestral vertebrate and lost in the tetrapod lineage, orwhether it arose in the teleost lineage. The long splice variant of each zebrafish Ptenpolypeptide contains a 23 amino acid insertion within one of the three loops that form theputative membrane association region of the pten C2 domain (Lee et al., 1999). The locationof the insertion suggests the possibility that the zebrafish pten splice variants may exhibitdifferences in membrane targeting, binding, or function.
The expression patterns of the zebrafish pten genes during embryonic development closelyresemble those of the orthologous mammalian genes. In zebrafish, ptena and ptenb areexpressed ubiquitously during early somitogenesis. At the 18-somite stage, ptenb showsstrong expression in the cranial ganglia and brain nuclei. As development proceeds, ptenaand ptenb genes are predominantly expressed in the central nervous system. In early mousedevelopment, Pten expression is not spatially restricted at E7 (Luukko et al., 1999), whereasby E15, Pten transcripts are abundant in the central and peripheral nervous system(especially in the spinal cord and peripheral nerve ganglia). During embryogenesis, themouse and human PTEN genes are expressed in the vasculature, lung, kidney, thymus,thyroid gland, skin, and gastrointestinal tract (Luukko et al., 1999; Gimm et al., 2000). Inzebrafish, we detected expression of pten genes in the axial vasculature (ptena), endoderm(ptena), and branchial arches (ptena and ptenb). Although expression of pten genes wasdetected in ear (ptena), somites (ptenb) and eye (ptena and ptenb) of zebrafish embryos, it isnot yet clear whether PTEN genes are expressed in these tissues during mouse or humanembryogenesis.
Knockdown of ptena mRNA translation resulted in a number of morphological phenotypesincluding defects in the formation of intersegmental blood vessels. Previous studies havedemonstrated that VEGF (vascular endothelial growth factor) signals through the Aktpathway to regulate vasculogenesis and angiogenesis in zebrafish (Chan et al., 2002). Ourdata indicates that knockdown of ptena causes an increase in the levels of pAkt, and thatelevated pAkt levels may lead to abnormal vasculogenesis in zebrafish. Our results thusprovide the first indication that ptena may play a role in vascular development. ptenamorphants also exhibited defects in notochord morphology. It is possible that the defect innotochord shape may arise early in development when ptena is ubiquitously expressed. It isof further interest that knockdown of ptena also produced a defect in otolith formation.Rather than the two rounded otoliths characteristic of 48 hpf wild type embryos, ptenamorphants had abnormal numbers and/or morphology of otoliths. To our knowledge, a rolefor PTEN in ear development has not been previously reported. It will clearly be of interestto determine whether ptena regulation of the Akt pathway may serve to mediate aspects ofinner ear morphogenesis.
Studies of mouse Pten knockouts and Drosophila PTEN mutants have shown that duringdevelopment, PTEN plays a role in regulating cell and organ size as well as cell proliferation(Kishimoto et al., 2003; Goberdhan et al., 1999; Huang et al., 1999; Gao et al., 2000). Wedid not observe gross increase in organ size in either ptena or ptenb morphants. While it ispossible that pten knockdown may have caused changes in cell size, detailed histologicalanalysis will be required to resolve this issue. We did observe that both ptena and ptenbmorphants had heads that were abnormally shaped compared to wild type embryos. Thisdomed appearance could possibly reflect an increase in cell number or cell size within thebrain. Results from neuron-specific knockouts of Pten in mice showed that altering Ptenexpression caused an increase in neuron size leading to an overall increase in brain size(Kishimoto et al., 2003). It will be of interest to determine if similar changes in cell sizecontribute to the domed head phenotype observed in pten morphant zebrafish.
Croushore et al. Page 7
Dev Dyn. Author manuscript; available in PMC 2008 December 29.
NIH
-PA Author Manuscript
NIH
-PA Author Manuscript
NIH
-PA Author Manuscript

In summary, we have identified two pten genes in zebrafish that have overlappingexpression patterns. Using MO knockdown we showed that ptena and ptenb play distinctroles in embryonic development of zebrafish, while both have the ability to anatagonize thePI3-Kinase/AKT pathway. It will be important to determine whether the developmentalroles of ptena and ptenb are solely dependent on the PI3-Kinase/AKT pathway. In addition,it will be interesting to see whether the additional exon in the long spice variants ofzebrafish pten genes affects their function.
EXPERIMENTAL PROCEDURESIdentification and Characterization of Zebrafish pten Genes
A BLAST search of the GenBank EST database revealed numerous zebrafish cDNAs with ahigh degree of similarity to mammalian PTEN. Assembly of overlapping sequences (ESTsfm55g11, fv35h02, faa38e03) yielded a full-length composite sequence corresponding toptena. Two additional non-overlapping ESTs (fy71d09, fl55h02) encoded the 5' and 3' endsof a distinct pten gene (ptenb). PCR primer pairs were used to amplify the full-length ptenaand ptenb cDNAs; ptena forward primer: 5’- GCTGTCATGGCAATGAC -3’, ptena reverseprimer: 5’- TCAGACTTTTGTAATCTGTGCG -3’, ptenb forward primer: 5’-GACTCCTGTCACAGCCATGGCTGCG -3’, ptenb reverse primer: 5’-CTTCCCATAAAAATATTTCAAC -3’. BLAST searches of the zebrafish genomeassembly (Version 4) available from the Zebrafish Sequencing Group(http://www.ensembl.org/) were used to assign linkage groups.
mRNA Expression AnalysisFor RT-PCR, zebrafish embryos at various stages of development and ~ 6 month old adultswere collected and homogenized in TRIzol Reagent (Invitrogen; Carlsbad, CA). Total RNAwas extracted according to the method of Chomczynski and Sacchi (1987), anddevelopmental stage-specific RNA (0.5 µg) was used as template to generate single strandedcDNA using the SuperScript First Strand Synthesis kit (Invitrogen). PCR was carried outwith REDTaq DNA polymerase (Sigma; St. Louis, MO) using a RoboCycler GradientTemperature Cycler (Stratagene; La Jolla, CA) and primers that flank the alternativelyspliced exons of ptena (forward primer 5’-CCAGCCAGCGCAGGTATGTGTA-3’ andreverse primer 5’- GCGGCTGAGGAAACTCGAAGATC-3’) and ptenb (forward primer5’-GCTACCTTCTGAGGAATAAGCTGG-3’ and reverse primer 5’-CTTGATGTCCCCACACACAGGC-3’). PCR products were analyzed by electrophoresison a 1.5% agarose gel. The PCR products from each primer pair were verified by DNAsequencing.
Whole-mount in situ hybridization analysis was performed as described by Thisse et al.(1999;http://zfin.org/cgi-bin/webdriver?MIval=aa-pubview2.apg&OID=ZDB-PUB-010810-1).The following antisense probes were utilized to characterize pten expression: ptena(GenBank accession no. AY398669, nucleotides 1–1371); ptenb (GenBank accession no.AY398670, nucleotides 1–1302). Additional antisense RNA probes include dfna5 (Busch-Nentwich et al., 2004), myoD (Weinberg et al., 1996), otx1 (from E. Weinberg), ncs-1a(Blasiole et al., 2005) and starmaker (Sollner et al., 2003), VE-cadherin (cdh5) (Larson etal., 2004).
Antisense Morpholino KnockdownsAntisense morpholino oligonucleotides (MOs) (Gene Tools LLC; Philomath, OR) weredesigned to target the 5’UTR of each zebrafish pten gene. ptena-MO1 (5’-CCTCGCTCACCCTTGACTGTGTATG-3’); ptena-MO2 (5’-
Croushore et al. Page 8
Dev Dyn. Author manuscript; available in PMC 2008 December 29.
NIH
-PA Author Manuscript
NIH
-PA Author Manuscript
NIH
-PA Author Manuscript

CAGTTTTATTCCGGTTTATTGTCAG-3’); ptenb-MO1(5’-CTTTCGGACGGTC-GGTCGTCTTTA-3’); ptenb-MO2 (5’-GGCTGTGACAGGAGTCTTTAGGGTT-3’). TheMOs were resuspended in 1x Danieau buffer (58 mM NaCl, 0.7 mM KCl, 0.4 mM MgSO4,0.6 mM Ca(NO3)2, 5 mM HEPES, pH 7.6) and microinjected into the yolk of single cellembryos.
The specificity of the pten MOs was tested using an in vitro translation assay as previouslydescribed (Blasiole et al., 2005). All experiments were performed with the short splice formsof the pten genes. ptena (GenBank accession no. AY398668) and ptenb (GenBank accessionno. AY398671) cDNAs were subcloned into pBluescript II KS+ (Stratagene). Capped ptenaand ptenb mRNAs were synthesized using the mMESSAGE mMACHINE (Ambion)transcription kit, and 0.5 µg of mRNA was used to program the synthesis of [35S]-labeledproteins using an in vitro rabbit reticulocyte lysate translation kit (Ambion) under conditionsdescribed by the manufacturer. The translation of mRNA was tested in the presence of 4 µgof antisense MOs (ptena-MO1 and ptenb-MO1). An antisense MO targeted against thezebrafish Na,K-ATPase α1a.1 gene (atp1a1a.1) (5’-GCCTTCTCCTCGTCCCATTTTGCTG-3) (Shu et al., 2003) was used as a non-specificcontrol. The entire reaction mixture (20 µl) of each in vitro translation assay was separatedby SDS-PAGE. The gels were dried, exposed to X-ray film, and the relative intensity of thebands quantitated by laser densitometry (Molecular Dynamics; Sunnyvale, CA) andanalyzed using the Quantity One software package (PDI, Inc.; Huntington Station, NY).
Phosphorylated Akt AssayPten activity was assayed in wild type and morphant embryos as follows. Wild typeembryos, ptena morphants (injected with 6 ng ptena-MO1), and ptenb morphants (injectedwith 6 ng ptenb-MO1) were collected at 48 hpf and homogenized in lysis buffer (Blasiole etal., 2005). Thirty embryos were collected in each group. Lysates were incubated at 4°C forone hour, then centrifuged at 10,000 rpm for 10 minutes at 4°C. Supernatants werenormalized for total protein content, fractionated by SDS-PAGE (50 µg protein/lane), thentransferred to a nitrocellulose filter. Immunoblots were probed with a rabbit anti-human Aktantibody (1:1000 dilution; Cell Signalling; Beverly, MA). Blots were stripped and reprobedwith a rabbit anti-human phospho-Akt (Ser 473) antibody (1:1000 dilution, Cell Signalling).Peroxidase-conjugated secondary antibodies were from Jackson ImmunoResearch (WestGrove, PA). Immunoreactivity was visualized by enhanced chemiluminescence (ECL) usingan ECL Plus kit (Amersham Pharmacia; Piscataway, NJ). Immunoblots were quantitated bylaser densitometry (Molecular Dynamics) and analyzed using the Quantity One softwarepackage (PDI, Inc.). Statistical analyses of the data were performed using an unpaired one-tailed Student’s t-test.
AcknowledgmentsThis work was supported by grants from the NIH (RL, KC, CT and BT).
REFERENCESAmores A, Force A, Yan YL, Joly L, Amemiya C, Fritz A, Ho RK, Langeland J, Prince V, Wang YL,
Westerfield M, Ekker M, Postlethwait JH. Zebrafish hox clusters and vertebrate genome evolution.Science. 1998; 282:1711–1714. [PubMed: 9831563]
Birck A, Ahrenkiel V, Zeuthen J, Hou-Jensen K, Guldberg P. Mutation and allelic loss of the PTEN/MMAC1 gene in primary and metastatic melanoma biopsies. J Invest Dermatol. 2000; 114:277–280. [PubMed: 10651986]
Croushore et al. Page 9
Dev Dyn. Author manuscript; available in PMC 2008 December 29.
NIH
-PA Author Manuscript
NIH
-PA Author Manuscript
NIH
-PA Author Manuscript

Blasiole B, Kabbani N, Boehmler W, Thisse B, Thisse C, Canfield V, Levenson R. Neuronal calciumsensor-1 gene ncs-1a is essential for semicircular canal formation in zebrafish inner ear. JNeurobiol. 2005; 64:285–297. [PubMed: 15898063]
Busch-Nentwich E, Sollner C, Roehl H, Nicolson T. The deafness gene dfna5 is crucial for ugdhexpression and HA production in the developing ear in zebrafish. Development. 2004; 131:943–951. [PubMed: 14736743]
Chan J, Bayliss PE, Wood JM, Roberts TM. Dissection of angiogenic signaling in zebrafish using achemical genetic approach. Cancer Cell. 2002; 1:257–267. [PubMed: 12086862]
Di Cristofano A, Pesce B, Cordon-Cardo C, Pandolfi PP. Pten is essential for embryonic developmentand tumour suppression. Nat Genet. 1998; 19:348–355. [PubMed: 9697695]
Ferrara N, Carver-Moore K, Chen H, Dowd M, Lu L, O'Shea KS, Powell-Braxton L, Hillan KJ, MooreMW. Heterozygous embryonic lethality induced by targeted inactivation of the VEGF gene. Nature.1996; 380:439–442. [PubMed: 8602242]
Force A, Lynch M, Pickett FB, Amores A, Yan YL, Postlethwait J. Preservation of duplicate genes bycomplementary, degenerative mutations. Genetics. 1999; 151:1531–1545. [PubMed: 10101175]
Gao X, Neufeld TP, Pan D. Drosophila PTEN regulates cell growth and proliferation through PI3K-dependent and -independent pathways. Dev Biol. 2000; 221:404–418. [PubMed: 10790335]
Gimm O, Attie-Bitach T, Lees JA, Vekemans M, Eng C. Expression of the PTEN tumour suppressorprotein during human development. Hum Mol Genet. 2000; 9:1633–1639. [PubMed: 10861290]
Goberdhan DC, Paricio N, Goodman EC, Mlodzik M, Wilson C. Drosophila tumor suppressor PTENcontrols cell size and number by antagonizing the Chico/PI3-kinase signaling pathway. GenesDev. 1999; 13:3244–3258. [PubMed: 10617573]
Huang H, Potter CJ, Tao W, Li DM, Brogiolo W, Hafen E, Sun H, Xu T. PTEN affects cell size, cellproliferation and apoptosis during Drosophila eye development. Development. 1999; 126:5365–5372. [PubMed: 10556061]
Kibar Z, Vogan KJ, Groulx N, Justice MJ, Underhill DA, Gros P. Ltap, a mammalian homolog ofDrosophila Strabismus/Van Gogh, is altered in the mouse neural tube mutant Loop-tail. Nat Genet.2001; 28:251–255. [PubMed: 11431695]
Kishimoto H, Hamada K, Saunders M, Backman S, Sasaki T, Nakano T, Mak TW, Suzuki A.Physiological functions of Pten in mouse tissues. Cell Struct Funct. 2003; 28:11–12. [PubMed:12655146]
Larson JD, Wadman SA, Chen E, Kerley L, Clark KJ, Eide M, Lippert S, Nasevicius A, Ekker SC,Hackett PB, Essner JJ. Expression of VE-cadherin in zebrafish embryos: a new tool to evaluatevascular development. Dev Dyn. 2004; 231:204–213. [PubMed: 15305301]
Lee JO, Yang H, Georgescu MM, Di Cristofano A, Maehama T, Shi Y, Dixon JE, Pandolfi P,Pavletich NP. Crystal structure of the PTEN tumor suppressor: implications for itsphosphoinositide phosphatase activity and membrane association. Cell. 1999; 99:323–334.[PubMed: 10555148]
Li DM, Sun H. TEP1, encoded by a candidate tumor suppressor locus, is a novel protein tyrosinephosphatase regulated by transforming growth factor beta. Cancer Res. 1997; 57:2124–2129.[PubMed: 9187108]
Li J, Yen C, Liaw D, Podsypanina K, Bose S, Wang SI, Puc J, Miliaresis C, Rodgers L, McCombie R,Bigner SH, Giovanella BC, Ittmann M, Tycko B, Hibshoosh H, Wigler MH, Parsons R. PTEN, aputative protein tyrosine phosphatase gene mutated in human brain, breastand prostate cancer.Science. 1997; 275:1943–1947. [PubMed: 9072974]
Liaw D, Marsh DJ, Li J, Dahia PL, Wang SI, Zheng Z, Bose S, Call KM, Tsou HC, Peacocke M, EngC, Parsons R. Germline mutations of the PTEN gene in Cowden disease, an inherited breast andthyroid cancer syndrome. Nat Genet. 1997; 16:64–67. [PubMed: 9140396]
Luukko K, Ylikorkala A, Tiainen M, Makela TP. Expression of LKB1 and PTEN tumor suppressorgenes during mouse embryonic development. Mech Dev. 1999; 83:187–190. [PubMed: 10381580]
Maehama T, Dixon JE. The tumor suppressor, PTEN/MMAC1, dephosphorylates the lipid secondmessenger, phosphatidylinositol 3,4,5-trisphosphate. J Biol Chem. 1998; 273:13375–13378.[PubMed: 9593664]
Croushore et al. Page 10
Dev Dyn. Author manuscript; available in PMC 2008 December 29.
NIH
-PA Author Manuscript
NIH
-PA Author Manuscript
NIH
-PA Author Manuscript

Marsh DJ, Dahia PL, Zheng Z, Liaw D, Parsons R, Gorlin RJ, Eng C. Germline mutations in PTENare present in Bannayan-Zonana syndrome. Nat Genet. 1997; 16:333–334. [PubMed: 9241266]
Nasevicius A, Ekker SC. Effective targeted gene 'knockdown' in zebrafish. Nat Genet. 2000; 26:216–220. [PubMed: 11017081]
Nasevicius A, Larson J, Ekker SC. Distinct requirements for zebrafish angiogenesis revealed by aVEGF-A morphant. Yeast. 2000; 17:294–301. [PubMed: 11119306]
Park M, Moon RT. The planar cell-polarity gene stbm regulates cell behaviour and cell fate invertebrate embryos. Nat Cell Biol. 2002; 4:20–25. [PubMed: 11780127]
Podsypanina K, Ellenson LH, Nemes A, Gu J, Tamura M, Yamada KM, Cordon-Cardo C, Catoretti G,Fisher PE, Parsons R. Mutation of Pten/Mmac1 in mice causes neoplasia in multiple organsystems. Proc Natl Acad Sci U S A. 1999; 96:1563–1568. [PubMed: 9990064]
Postlethwait JH, Yan YL, Gates MA, Horne S, Amores A, Brownlie A, Donovan A, Egan ES, ForceA, Gong Z, Goutel C, Fritz A, Kelsh R, Knapik E, Liao E, Paw B, Ransom D, Singer A, ThomsonM, Abduljabbar TS, Yelick P, Beier D, Joly JS, Larhammar D, Rosa F, et al. Vertebrate genomeevolution and the zebrafish gene map. Nat Genet. 1998; 18:345–349. [PubMed: 9537416]
Shu X, Cheng K, Patel N, Chen F, Joseph E, Tsai HJ, Chen JN. Na,K-ATPase is essential forembryonic heart development in the zebrafish. Development. 2003; 130:6165–6173. [PubMed:14602677]
Sollner C, Burghammer M, Busch-Nentwich E, Berger J, Schwarz H, Riekel C, Nicolson T. Control ofcrystal size and lattice formation by starmaker in otolith biomineralization. Science. 2003;302:282–286. [PubMed: 14551434]
Stahl JM, Cheung M, Sharma A, Trivedi NR, Shanmugam S, Robertson GP. Loss of PTEN promotestumor development in malignant melanoma. Cancer Res. 2003; 63:2881–2890. [PubMed:12782594]
Steck PA, Pershouse MA, Jasser SA, Yung WK, Lin H, Ligon AH, Langford LA, Baumgard ML,Hattier T, Davis T, Frye C, Hu R, Swedlund B, Teng DH, Tavtigian SV. Identification of acandidate tumour suppressor gene, MMAC1, at chromosome 10q23.3 that is mutated in multipleadvanced cancers. Nat Genet. 1997; 15:356–362. [PubMed: 9090379]
Stiles B, Groszer M, Wang S, Jiao J, Wu H. PTENless means more. Dev Biol. 2004; 273:175–184.[PubMed: 15328005]
Suzuki A, de la Pompa JL, Stambolic V, Elia AJ, Sasaki T, del Barco Barrantes I, Ho A, Wakeham A,Itie A, Khoo W, Fukumoto M, Mak TW. High cancer susceptibility and embryonic lethalityassociated with mutation of the PTEN tumor suppressor gene in mice. Curr Biol. 1998; 8:1169–1178. [PubMed: 9799734]
Thompson JE, Thompson CB. Putting the rap on Akt. J Clin Oncol. 2004; 22:4217–4226. [PubMed:15483033]
Weinberg ES, Allende ML, Kelly CS, Abdelhamid A, Murakami T, Andermann P, Doerre OG,Grunwald DJ, Riggleman B. Developmental regulation of zebrafish MyoD in wild-type, no tailand spadetail embryos. Development. 1996; 122:271–280. [PubMed: 8565839]
Woods IG, Kelly PD, Chu F, Ngo-Hazelett P, Yan YL, Huang H, Postlethwait JH, Talbot WS. Acomparative map of the zebrafish genome. Genome Res. 2000; 10:1903–1914. [PubMed:11116086]
Wu X, Senechal K, Neshat MS, Whang YE, Sawyers CL. The PTEN/MMAC1 tumor suppressorphosphatase functions as a negative regulator of the phosphoinositide 3-kinase/Akt pathway. ProcNatl Acad Sci U S A. 1998; 95:15587–15591. [PubMed: 9861013]
Zhou XP, Kuismanen S, Nystrom-Lahti M, Peltomaki P, Eng C. Distinct PTEN mutational spectra inhereditary non-polyposis colon cancer syndrome-related endometrial carcinomas compared tosporadic microsatellite unstable tumors. Hum Mol Genet. 2002; 11:445–450. [PubMed: 11854177]
Zhou XP, Marsh DJ, Morrison CD, Chaudhury AR, Maxwell M, Reifenberger G, Eng C. Germlineinactivation of PTEN and dysregulation of the phosphoinositol-3-kinase/Akt pathway causehuman Lhermitte-Duclos disease in adults. Am J Hum Genet. 2003; 73:1191–1198. [PubMed:14566704]
Croushore et al. Page 11
Dev Dyn. Author manuscript; available in PMC 2008 December 29.
NIH
-PA Author Manuscript
NIH
-PA Author Manuscript
NIH
-PA Author Manuscript

Figure 1.Comparison of human PTEN and zebrafish Pten polypeptides. Human (hPTEN) andzebrafish (zfPtena and zfPtenb) polypeptides were aligned using CLUSTALW. Identicalamino acids are highlighted in black, and conserved amino acids are highlighted in gray.Amino acids are numbered to the right of each line. Arrowheads indicate the location ofintrons and are flanked by the corresponding exon numbers. The asterisk indicates the extraexon found in the deduced zebrafish amino acid sequence. The region encompassing the C2domain is underlined.
Croushore et al. Page 12
Dev Dyn. Author manuscript; available in PMC 2008 December 29.
NIH
-PA Author Manuscript
NIH
-PA Author Manuscript
NIH
-PA Author Manuscript

Figure 2.Expression of zebrafish ptena mRNA during embryogenesis. Expression of ptena wasanalyzed by RT-PCR and whole-mount in situ hybridization. (A) Expression of ptena splicevariants during zebrafish development determined by RT-PCR. Bands of 305 bp and 236 bprepresent fragments of the long and short splice variants, respectively. (B–K) Expression ofptena determined by whole-mount in situ hybridization. (B) Early somitogenesis, lateralview. (C) Mid-somitogenesis, lateral view. (D) 24 hpf, lateral view. (E) 24 hpf, lateral viewof head. (F) 24 hpf, lateral view of tail. (G) 36 hpf, lateral view of otic vesicle. (H) 24 hpf,transverse section of trunk. (I) 48 hpf, lateral view. (J) 48 hpf, transverse section of trunk.(K) 5 dpf, lateral view. A, aorta wall; AV, axial vasculature; BA, branchial arches; END,endoderm; FP, floor plate; LLP, lateral line primordium; NC, notochord; OV, otic vesicle;PF, pectoral fin; R, retina; SC, spinal cord; TEL, telencephalon.
Croushore et al. Page 13
Dev Dyn. Author manuscript; available in PMC 2008 December 29.
NIH
-PA Author Manuscript
NIH
-PA Author Manuscript
NIH
-PA Author Manuscript

Figure 3.Expression of zebrafish ptenb mRNA during embryogenesis. Expression of ptenb wasanalyzed by RT-PCR and whole-mount in situ hybridization. (A) Expression of ptenb splicevariants during zebrafish development determined by RT-PCR. Bands of 298 bp and 229 bprepresent fragments of the long and short splice variants, respectively. (B–K) Expression ofptenb determined by whole-mount in situ hybridization. (B) Early somitogenesis, lateralview. (C–H) Mid-somitogenesis. (C) 10-somite stage, lateral view. (D) 10-somite stage,dorsal view of somites obtained with differential interference contrast microscopy. (E) 10-somite stage, transverse section. (F) 18-somite stage, lateral view. (G) 18-somite stage,dorsal view of tail. (H) 18-somite stage, dorsal view of head. (I) 24 hpf, lateral view. (J) 24hpf, lateral view of head. (K) 36 hpf, lateral view of otic vesicle. (L) 48 hpf, lateral view.(M) 5 dpf, lateral view. AC, adaxial cells; BA, branchial arches; CG, cranial ganglia; D,
Croushore et al. Page 14
Dev Dyn. Author manuscript; available in PMC 2008 December 29.
NIH
-PA Author Manuscript
NIH
-PA Author Manuscript
NIH
-PA Author Manuscript

diencephalon; EPI, epiphysis; E, eye; NC, notochord; OV, otic vesicle; PF, pectoral fin; S,somite; SC, spinal cord; TEL, telencephalon; TEG, tegmentum..
Croushore et al. Page 15
Dev Dyn. Author manuscript; available in PMC 2008 December 29.
NIH
-PA Author Manuscript
NIH
-PA Author Manuscript
NIH
-PA Author Manuscript

Figure 4.Specificity of pten antisense morpholinos. ptena and ptenb mRNAs were separatelytranslated in vitro in the presence or absence of ptena or ptenb MOs (ptena-MO1 or ptenb-MO1), respectively. An MO targeted to the Na,K-ATPase α1a.1 subunit (atp1a1a.1-MO)was used as a non-specific control. (A) In vitro translation of ptena. (B) In vitro translationof ptenb. [35S]-labeled proteins were separated on an SDS-containing 10% polyacrylramidegel. The gel was dried and exposed to X-ray film. The ~60 kDa bands corresponding toPtena and Ptenb polypeptides are shown at the bottom of each panel. Quantitation of bandsby laser densitometry is shown at the top of each panel. Bars indicate the levels of [35S]-
Croushore et al. Page 16
Dev Dyn. Author manuscript; available in PMC 2008 December 29.
NIH
-PA Author Manuscript
NIH
-PA Author Manuscript
NIH
-PA Author Manuscript

labeled Ptena or Ptenb in the presence of MOs compared to levels of [35S]-labeled Ptena orPtenb in the absence of MOs.
Croushore et al. Page 17
Dev Dyn. Author manuscript; available in PMC 2008 December 29.
NIH
-PA Author Manuscript
NIH
-PA Author Manuscript
NIH
-PA Author Manuscript
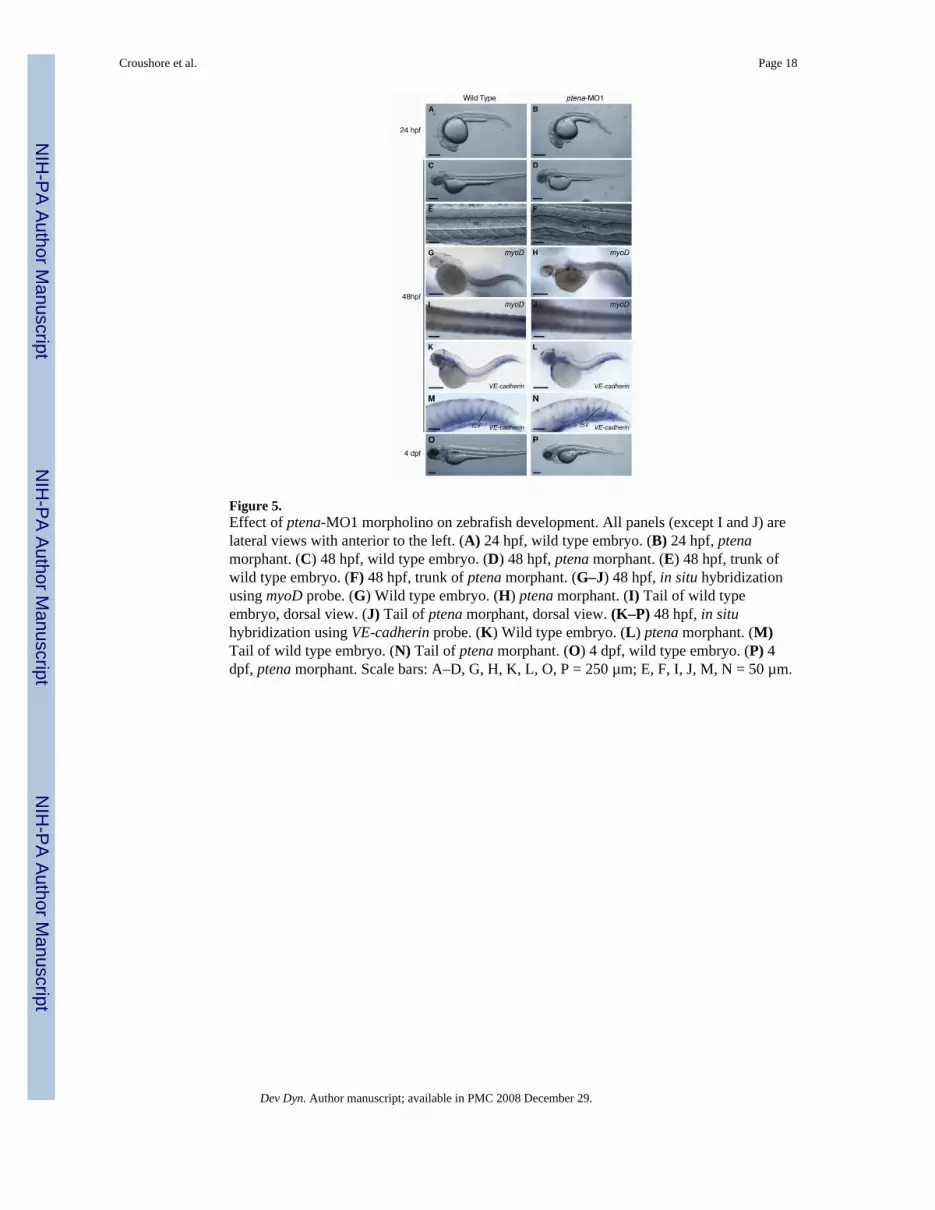
Figure 5.Effect of ptena-MO1 morpholino on zebrafish development. All panels (except I and J) arelateral views with anterior to the left. (A) 24 hpf, wild type embryo. (B) 24 hpf, ptenamorphant. (C) 48 hpf, wild type embryo. (D) 48 hpf, ptena morphant. (E) 48 hpf, trunk ofwild type embryo. (F) 48 hpf, trunk of ptena morphant. (G–J) 48 hpf, in situ hybridizationusing myoD probe. (G) Wild type embryo. (H) ptena morphant. (I) Tail of wild typeembryo, dorsal view. (J) Tail of ptena morphant, dorsal view. (K–P) 48 hpf, in situhybridization using VE-cadherin probe. (K) Wild type embryo. (L) ptena morphant. (M)Tail of wild type embryo. (N) Tail of ptena morphant. (O) 4 dpf, wild type embryo. (P) 4dpf, ptena morphant. Scale bars: A–D, G, H, K, L, O, P = 250 µm; E, F, I, J, M, N = 50 µm.
Croushore et al. Page 18
Dev Dyn. Author manuscript; available in PMC 2008 December 29.
NIH
-PA Author Manuscript
NIH
-PA Author Manuscript
NIH
-PA Author Manuscript
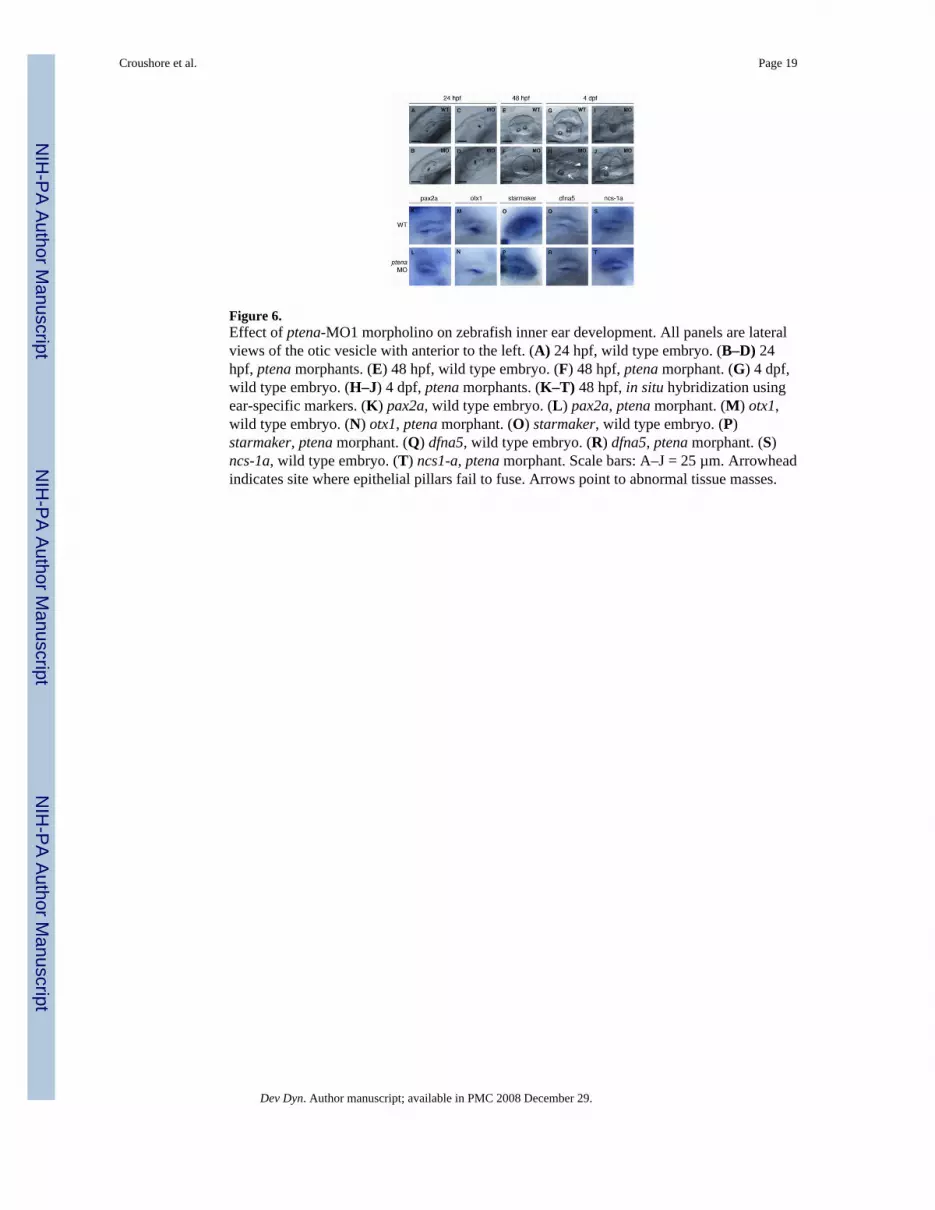
Figure 6.Effect of ptena-MO1 morpholino on zebrafish inner ear development. All panels are lateralviews of the otic vesicle with anterior to the left. (A) 24 hpf, wild type embryo. (B–D) 24hpf, ptena morphants. (E) 48 hpf, wild type embryo. (F) 48 hpf, ptena morphant. (G) 4 dpf,wild type embryo. (H–J) 4 dpf, ptena morphants. (K–T) 48 hpf, in situ hybridization usingear-specific markers. (K) pax2a, wild type embryo. (L) pax2a, ptena morphant. (M) otx1,wild type embryo. (N) otx1, ptena morphant. (O) starmaker, wild type embryo. (P)starmaker, ptena morphant. (Q) dfna5, wild type embryo. (R) dfna5, ptena morphant. (S)ncs-1a, wild type embryo. (T) ncs1-a, ptena morphant. Scale bars: A–J = 25 µm. Arrowheadindicates site where epithelial pillars fail to fuse. Arrows point to abnormal tissue masses.
Croushore et al. Page 19
Dev Dyn. Author manuscript; available in PMC 2008 December 29.
NIH
-PA Author Manuscript
NIH
-PA Author Manuscript
NIH
-PA Author Manuscript

Figure 7.Effect of ptenb-MO1 morpholino on zebrafish development. All panels are lateral views of48 hpf embryos with anterior to the left. (A) Wild type embryo. (B) ptenb morphant. (C)Tail of wild type embryo. (D) Tail of ptenb morphant. Scale bars = 250 µm.
Croushore et al. Page 20
Dev Dyn. Author manuscript; available in PMC 2008 December 29.
NIH
-PA Author Manuscript
NIH
-PA Author Manuscript
NIH
-PA Author Manuscript

Figure 8.Lipid phosphatase activity of zebrafish pten genes. Lysates were prepared from wild typeembryos as well as ptena and ptenb morphants at 48 hpf (30 embryos/group). Proteins wereseparated by SDS-PAGE and transferred to a nitrocellulose filter. Blots were probed with ananti-Akt antibody, stripped, and reprobed with an anti-phospho-Akt (pAkt) antibody. (A)Western blot. (B) Quantitation of bands by laser densitometry. The bars for ptena (n=6separate experiments) and ptenb (n=4 separate experiments) represent the relative ratio ofpAkt to total Akt (tAkt) compared to wild type embryos. The error bars represent thestandard error of the mean. The asterisk indicates a statistically significant increase in theratio of pAkt to tAkt (p<.05) as calculated by an unpaired Students t-test.
Croushore et al. Page 21
Dev Dyn. Author manuscript; available in PMC 2008 December 29.
NIH
-PA Author Manuscript
NIH
-PA Author Manuscript
NIH
-PA Author Manuscript

NIH
-PA Author Manuscript
NIH
-PA Author Manuscript
NIH
-PA Author Manuscript
Croushore et al. Page 22
Table 1
Occurrence of morphant phenotypes at 48 hpf.
wildtype ptena morphants (ptena-MO1) ptenb morphants (ptenb-MO1)
Abnormal Otoliths 0 59 5
Domed Head 0 72 83
Hooked Tail 0 0 73
Wavy Notochord 0 73 19
Lacking Axial Blood flow 0 19 22
Lacking Intersegmental Blood Flow 7 83 28
Reduced Yolk Extension 0 0 90
Total Number of Fish Assayed 100 100 100
Dev Dyn. Author manuscript; available in PMC 2008 December 29.


