Embed Size (px)
Citation preview

Altered neuronal gene expression in brain regions differentially affectedby Alzheimer’s disease: a reference data set
Winnie S. Liang,1,7 Travis Dunckley,1,7 Thomas G. Beach,2,7 Andrew Grover,2,7 Diego Mastroeni,2,7
Keri Ramsey,1 Richard J. Caselli,3,7 Walter A. Kukull,4 Daniel McKeel,5 John C. Morris,5
Christine M. Hulette,6 Donald Schmechel,6 Eric M. Reiman,1,7,8 Joseph Rogers,2,7
and Dietrich A. Stephan1,7
1Neurogenomics Division, Translational Genomics Research Institute, Phoenix, 2Sun Health Research Institute, Sun City,and 3Department of Neurology, Mayo Clinic, Scottsdale, Arizona; 4National Alzheimer’s Coordinating Center, Seattle,Washington; 5Washington University Alzheimer’s Disease Research Center, St. Louis, Missouri; 6Duke University Alzheimer’sDisease Research Center, Durham, North Carolina; and 7Arizona Alzheimer’s Disease Consortium and 8Banner Alzheimer’sInstitute, Phoenix, Arizona
Submitted 12 October 2007; accepted in final form 8 February 2008
Liang WS, Dunckley T, Beach TG, Grover A, Mastroeni D,Ramsey K, Caselli RJ, Kukull WA, McKeel D, Morris JC,Hulette CM, Schmechel D, Reiman EM, Rogers J, Stephan DA.Altered neuronal gene expression in brain regions differentiallyaffected by Alzheimer’s disease: a reference data set. PhysiolGenomics 33: 240 –256, 2008. First published February 12, 2008;doi:10.1152/physiolgenomics.00242.2007.—Alzheimer’s Disease (AD)is the most widespread form of dementia during the later stages of life.If improved therapeutics are not developed, the prevalence of AD willdrastically increase in the coming years as the world’s populationages. By identifying differences in neuronal gene expression profilesbetween healthy elderly persons and individuals diagnosed with AD,we may be able to better understand the molecular mechanisms thatdrive AD pathogenesis, including the formation of amyloid plaquesand neurofibrillary tangles. In this study, we expression profiledhistopathologically normal cortical neurons collected with laser cap-ture microdissection (LCM) from six anatomically and functionallydiscrete postmortem brain regions in 34 AD-afflicted individuals,using Affymetrix Human Genome U133 Plus 2.0 microarrays. Theseregions include the entorhinal cortex, hippocampus, middle temporalgyrus, posterior cingulate cortex, superior frontal gyrus, and primaryvisual cortex. This study is predicated on previous parallel research onthe postmortem brains of the same six regions in 14 healthy elderlyindividuals, for which LCM neurons were similarly processed forexpression analysis. We identified significant regional differen-tial expression in AD brains compared with control brains includingexpression changes of genes previously implicated in AD pathogen-esis, particularly with regard to tangle and plaque formation. Pinpoint-ing the expression of factors that may play a role in AD pathogenesisprovides a foundation for future identification of new targets forimproved AD therapeutics. We provide this carefully phenotyped,laser capture microdissected intraindividual brain region expressiondata set to the community as a public resource.
expression profiling; neuron; Affymetrix microarrays; laser capturemicrodissection
ALZHEIMER’S DISEASE (AD) is currently the most common causeof cognitive impairment in the elderly. Today, it is estimatedthat �5.1 million Americans have AD, and, based on thedemographics of aging, this number is expected to grow each
year. Furthermore, additional estimates project that by 205011.3 to 16 million individuals will be affected by this devas-tating disease (48). Developing proper treatment that can delayAD onset by even 5 years may halve the number of affectedindividuals after 50 years (15).
At a cellular level, AD is characterized by several histopatho-logical markers including extracellular �-amyloid plaques, neu-rofibrillary tangles (NFTs) within neurons (136), and the loss ofsynaptic connections manifested as brain atrophy. Because thesemarkers can only be evaluated in the postmortem brain, manyphysicians have turned to clinical analyses and neuroimagingto diagnose “probable AD” (101, 108). Available imaging tech-niques include positron emission tomography (PET), which mea-sures the cerebral glucose metabolic rate in the brain to identifypatterns of reduced glucose use characteristic of AD (31, 94,109, 120–122), as well as magnetic resonance imaging (MRI),which allows for identification of brain atrophy correlated withAD (49, 67, 94, 101, 122).
Ongoing research continues to provide clues into AD patho-genesis, but it is necessary to also obtain a global view ofneuronal processes to establish a complete picture of AD.Powerful techniques that may be used to address this issue arelaser capture microdissection (LCM) and gene expression pro-filing analysis. LCM allows us to select specific cells of interestfor analysis in order to maintain a high level of tissue homo-geneity. Selected cells can then be utilized for gene expressionprofiling, which allows the simultaneous monitoring of thesteady-state expression of all characterized human genes on oli-gonucleotide arrays so that we can visualize the entire cellularenvironment across separate samples. Previous work has alsoshown that this methodology of using LCM and expressionprofiling is a powerful approach for identifying dysregulation ofgene expression in tangle-bearing and non-tangle-bearing neu-rons in neurologically healthy and AD-affected brains (35).
To understand the gene dysregulation driving the develop-ment and pathogenesis of AD, the baseline gene expressionacross six different regions of postmortem brains of neurolog-ically normal elderly individuals has already been defined, so acomparative reference to identify changes in gene expression iscurrently available (74). Areas were selected on the basis ofprevious research that showed that different areas of the braindisplay characteristic differences in AD-affected individuals,and also to provide overarching coverage of the different
Article published online before print. See web site for date of publication(http://physiolgenomics.physiology.org).
Address for reprint requests and other correspondence: D. A. Stephan,Translational Genomics Research Institute, 445 North Fifth St., Phoenix, AZ85004 (e-mail: [email protected]).
Physiol Genomics 33: 240–256, 2008.First published February 12, 2008; doi:10.1152/physiolgenomics.00242.2007.
1094-8341/08 $8.00 Copyright © 2008 the American Physiological Society240

functional zones of the human brain. For this study, we focusedour analysis on healthy non-tangle-bearing neurons to supporta direct comparison with healthy non-tangle-bearing neuronsfrom neurologically healthy elderly individuals of the controlcohort. This focus will be useful for gaining insight intomolecular and functional mechanisms that may play a role inAD pathogenesis or that may be enacting neuroprotectivepathways to prevent toxicity in healthy neurons.
MATERIALS AND METHODS
Tissue collection. Brain samples were collected at three Alzhei-mer’s Disease Centers (Washington University, Duke University, andSun Health Research Institute) from clinically classified late-onsetAD-afflicted individuals (15 men and 18 women) with a mean age atdeath of 79.9 � 6.9 yr. Individuals were matched as closely aspossible for mean age of death, mean educational level, and propor-tion of persons with underrepresented racial backgrounds. Subjects inthis group had a Braak stage ranging from III to VI (14) with aConsortium to Establish a Registry for Alzheimer’s Disease(CERAD) neuritic plaque density of moderate or frequent (86).Neuropathological data and available Mini Mental State Examination(MMSE) data for each individual are listed in the supplementalmaterial in the online version of this article.1 Samples were collected[mean postmortem interval (PMI) of 2.5 h] from six brain regions thatare either histopathologically or metabolically relevant to AD: ento-rhinal cortex [EC; Brodmann area (BA) 28 and 34], superior frontalgyrus (SFG; BA 10 and 11), hippocampus (HIP), primary visualcortex (VCX; BA 17), middle temporal gyrus (MTG; BA 21 and 37),and posterior cingulate cortex (PC; BA 23 and 31). After dissection,samples were frozen, sectioned (8 �m), and fixed on glass slides.
Brain sections were stained with a combination of Thioflavin-S(Sigma, Dallas, TX) and 1% neutral red (Fisher Scientific, Chicago,IL), and pyramidal neurons were identified by their characteristic size,shape, and location within the region of interest, while tangles wereidentified by the bright green fluorescence of Thioflavin-S staining. InEC, the large stellate neurons lacking Thioflavin-S staining werecollected from layer II and pyramidal cells lacking Thioflavin-Sstaining were collected from CA1 of HIP. The CA1 region wasselected for study because this area is the earliest and most heavilyaffected region in HIP in terms of tangle formation and this region hasalready been expression profiled in neurologically healthy elderlyindividuals. In all other regions, cortical layer III pyramidal neuronslacking Thioflavin-S staining were collected (for all collected neurons,cell bodies were extracted). Layer III pyramidal neurons and layer IIstellate neurons in EC were selected because these layer III neuronsare selectively vulnerable to tangle formation and layer II stellateneurons are among the first neurons to be affected by tangle formation(layer V pyramidal neurons are also vulnerable but are less numerousand more difficult for array analysis). Furthermore, layer III pyramidalneurons are the major corticocortical projection neurons and are thusresponsible for much of the communication between cortical regionsand therefore involved in higher mental functions. For each individ-ual, approximately 500 histopathologically normal pyramidal neuronswere collected from EC, HIP, MTG, PC, SFG, and VCX with LCMand the Arcturus Veritas Automated Laser Capture MicrodissectionSystem (Mountain View, CA). Cells were collected onto ArcturusCapSure Macro LCM Caps and extracted according to the manufac-turer’s protocol. Total RNA was isolated from the cell lysate with theArcturus PicoPure RNA Isolation Kit with DNase I treatment usingQiagen’s RNase-free DNase Set (Valencia, CA). The same classes ofneurons from each of the six regions were similarly collected fromhealthy elderly control subjects (74).
Expression profiling. Expression profiling was performed as pre-viously described (74). Isolated total RNA from each sample of �500neurons was double-round amplified, cleaned, and biotin labeled withAffymetrix’s GeneChip Two-Cycle Target Labeling kit (Santa Clara,CA) with a T7 promoter and Ambion’s MEGAscript T7 High YieldTranscription kit (Austin, TX) per the manufacturer’s protocol. Am-plified and labeled cRNA was quantitated on a spectrophotometer andrun on a 1% Tris-acetate-EDTA (TAE) gel to check for an evenlydistributed range of transcript sizes. Twenty micrograms of cRNAwas fragmented to �35–200 bp by alkaline treatment (200 mMTris-acetate, pH 8.2, 500 mM KOAc, 150 mM MgOAc) and run on a1% TAE gel to verify fragmentation. Separate hybridization cocktailswere made with 15 �g of fragmented cRNA from each sample perAffymetrix’s protocol.
Microarray analysis. Two hundred microliters of each cocktail wasseparately hybridized to an Affymetrix Human Genome U133 Plus2.0 Array for 16 h at 45°C in a Hybridization Oven 640. The AffymetrixHuman Genome Arrays measure the expression of �47,000 tran-scripts and variants, including 38,500 characterized human genes.Hybridization cocktails for nine EC samples (normal neurons fromAD brains) previously collected following the same profiling meth-odology used in this project (35) were reanalyzed on the AffymetrixHuman Genome U133 Plus 2.0 Array, and a tenth EC sample was alsoseparately processed for this sample group. Arrays were washed onAffymetrix’s upgraded GeneChip Fluidics Station 450 with a primarystreptavidin phycoerythrin (SAPE) stain, subsequent biotinylated an-tibody stain, and secondary SAPE stain. Arrays were scanned onAffymetrix’s GeneChip Scanner 3000 7G with AutoLoader. Scannedimages obtained by Affymetrix GeneChip Operating Software(GCOS) v1.2 were used to extract raw signal intensity values perprobe set on the array and calculate detection calls (absent, marginal,or present). Assignment of detection calls was based on probe pairintensities for which one probe was a perfect match of the referencesequence and the other was a mismatch probe for which the thirteenthbase (of the 25 oligonucleotide reference sequence) was changed. Allraw chip data were scaled in GCOS to 150 to normalize signalintensities for interarray comparisons. Reports generated by GCOSwere reviewed for quality control: we looked for at least 20% presentcalls, a maximum 3�-to-5� GAPDH ratio of 30, and a scaling factorunder 10. Twenty arrays that failed to pass these standards were notincluded in further analyses.
Pyramidal cell quality control. To ensure neuronal cell purity in thesamples, expression of glial fibrillary acidic protein (GFAP), anastrocyte cell marker, was evaluated. Samples that had GFAP expres-sion �1 SD from the mean were removed from statistical analyses.
Statistical analysis. Data for samples from neurologically healthyelderly controls were generated in a previous study (74). Microarraydata files of the normal samples are available on the Gene ExpressionOmnibus (GEO) site at http://www.ncbi.nlm.nih.gov/geo/query/acc.cgi? acc�GSE5281 (project accession no. GSE5281). Overallregional analyses consisted of 13 control subjects and 10 AD cases forEC, 13 control subjects and 10 AD cases for HIP, 12 control subjectsand 16 AD cases for MTG, 13 control subjects and 9 AD cases for PC,11 control subjects and 23 AD cases for SFG, and 12 control subjectsand 19 AD cases for VCX.
Direct comparisons between brains of neurologically healthy andAD-afflicted brains were performed in all brain regions to analyzeexpression differences. For each analysis, genes that did not demon-strate at least �10% present calls for each region-specific comparisonwere removed with Genespring GX 7.3 Expression Analysis software(Agilent Technologies, Palo Alto, CA). A two-tailed unpaired t-test,assuming unequal variances [with multiple testing corrections usingthe Benjamini and Hochberg false discovery rate (FDR)], was appliedto each comparison in Excel to locate genes that were statisticallysignificant in differentiating expression between the two regions ofhealthy and AD brains: for each analysis genes that had a maximumP value of 0.01 were collected, and those genes whose average AD1 The online version of this article contains supplemental material.
241NEURONAL GENE EXPRESSION IN AD BRAINS
Physiol Genomics • VOL 33 • www.physiolgenomics.org

signal and average control signal were both below a threshold of 150were removed. On the basis of this analysis, 4,030 genes fell throughfrom the EC analysis, 5,315 genes from the HIP analysis, 7,687 fromthe MTG analysis, 4,886 from the PC analysis, 1,178 from the SFGanalysis, and 2,058 from the VCX analysis. Because of the size ofthese gene lists and in order to evaluate the relevance of expressionchanges, statistically significant factors (P � 0.01, corrected) thathave been previously implicated or suggested as having a role in ADwere considered (see Fig. 7). Genes from each of the regional listswere also input into GeneGo for pathway analysis.
To consider regional susceptibilities to pathologies, EC and HIPgenes were compared, MTG and PC genes were compared, and SFGand VCX genes were compared. Overlapping genes were analyzed byusing the MetaCore pathway analysis software v4.0.0 (GeneGo,Encinitas, CA) to identify top processes in each comparison. Allprocesses for these comparisons are posted in the supplementalmaterial in the online version of this article.
From these regional lists, to generate heat maps approximately thetop 40 genes that showed the highest fold changes between AD andnormal brains were identified. Fold change values were calculated bycalculating the ratio between the average scaled expression signal (forall samples) for a gene from the AD sample region and the averagescaled expression signal for the same gene from the normal samples.For EC, a minimum (increased or decreased) fold change of 9.5, forHIP a 5.8-fold change, for MTG an 8.2-fold change, for PC a 5.8-foldchange, for SFG a 5.0-fold change, and for VCX a 2.4-fold changewas applied. Heat maps for each brain region were created withGeneCluster v2.0, with no gene or sample clustering applied (111).
RT-PCR validation of neuron-specific candidate genes. Total RNAwas isolated from cortical gray matter from unprofiled MTG (controlsubjects n � 9, AD cases n � 6) and PC (control subjects n � 8, ADcases n � 8) frozen tissue with the RNAspin Mini kit (GE 25-0500-71) and the manufacturer’s protocol, modified by increasing the initial
volume of buffer RA1 to 500 �l to prevent subsequent columnblockage. RNA quality was assessed on an Agilent 2100 Bioanalyzerwith RNA Nano chips (Agilent 5067-1511). RIN numbers of 6.5(range 6.5–8.9) and above were considered sufficient for this analysis.cDNA was generated with the Superscript First Strand Synthesis kit(Invitrogen 12371-019) using 1 �g of total RNA in a 40-�l reaction.Quantitative RT-PCR (qRT-PCR) was performed with Taqman primer/probe sets (Applied Biosystems) to amplify the following neuron-specificgene transcripts: Synaptophysin (SYP, Hs00300531_m1), Synaptoporin(SYNPR, Hs00376149_m1), MAP2 (Hs00258900_m1), MAP1B(Hs00195485_m1), M1 Cholinergic Receptor (CHRM1, Hs00265195_m1),and AMPA1 Receptor (GRIA1, Hs00181348_m1), with �-Gluconuridase(GUSB, 4333767F) as a normalization control. GUSB was selectedfor two reasons: it was the only available control gene transcript thatdid not show significant expression changes between AD and controlin the microarray analysis and has also been successfully employedfor this purpose previously (4, 64). qRT-PCR reactions were per-formed in 30-�l reactions with Taqman Gene Expression Master Mix(Applied Biosystems 4369016) according to the manufacturer’s pro-tocol on a Bio-Rad iCycler IQ qPCR system. Threshold values werecalculated with the maximum curvature approach. Threshold cycle(Ct) values were used to calculate fold changes with the 2Ct method(77). Significance of observed changes was assessed with the Studentt-test.
Data posting. MIAME-compliant microarray data files are locatedon the GEO site (project accession no. GSE5281). Fold change andP value data for each of the six regions are available in the supple-mental material in the online version of this article. Posted lists showregion-specific P values and fold changes and also expression signalsfor genes that have at least �10% present calls across regional sampleswith a maximum P value of 0.01 with multiple testing correctionsapplied (no fold change thresholds have been applied on these lists).
Fig. 1. Heat map of differentially expressed genes in the entorhinal cortex (EC). A heat map for EC was created to display those statistically significant (P �0.01 with multiple testing corrections applied) genes with the greatest region-specific fold changes. Normalized expression signals are represented on a log scalefor which colder colors correspond to lower levels of expression and warmer colors correspond to higher levels of expression. Heat maps were generated withGenecluster 2. AD, Alzheimer’s disease.
242 NEURONAL GENE EXPRESSION IN AD BRAINS
Physiol Genomics • VOL 33 • www.physiolgenomics.org
RESULTS AND DISCUSSION
Brain regions evaluated in this study were selected based onglobal functional coverage of the human brain and region-specific susceptibilities to AD pathogenesis. These six regionsincluded EC, HIP, MTG, PC, SFG, and VCX. Functional areasare represented with regions from the limbic (HIP), paralimbic(EC and PC), heteromodal (SFG and some portions of MTG),unimodal (MTG), and primary sensory (VCX) zones (87).Each of the six regions has also been shown previously todisplay characteristic pathological and metabolic differences inthe brains of individuals afflicted with AD. EC and HIP areareas that have been found to be susceptible to early NFTformation (8, 10, 13, 29, 33, 41, 43, 53), MTG and PC havebeen found to show metabolic changes relative to AD brains(6, 57, 89, 90, 121) and elevated susceptibilities to amyloidplaque formation (14, 91, 131), SFG has been found to showmetabolic changes relative to normal aging (2, 24, 56, 78, 92),and VCX has been found to be relatively spared from any formof age-related or disease-related neurodegeneration (88). Anal-ysis based on these common regional susceptibilities is de-scribed in MATERIALS AND METHODS, and analysis results areprovided in the supplemental material. Because of the largesize of statistically significant genes demonstrating differentialexpression in each of the regional analyses, we focused ondiscussion of factors that have been previously implicated as
having a role in AD, particularly with regard to characteristictangle and plaque pathologies. While this analytical approachfocuses in on a subset of genes, the entire expression data sethas been made available to scientists to serve as a resource forfuture research.
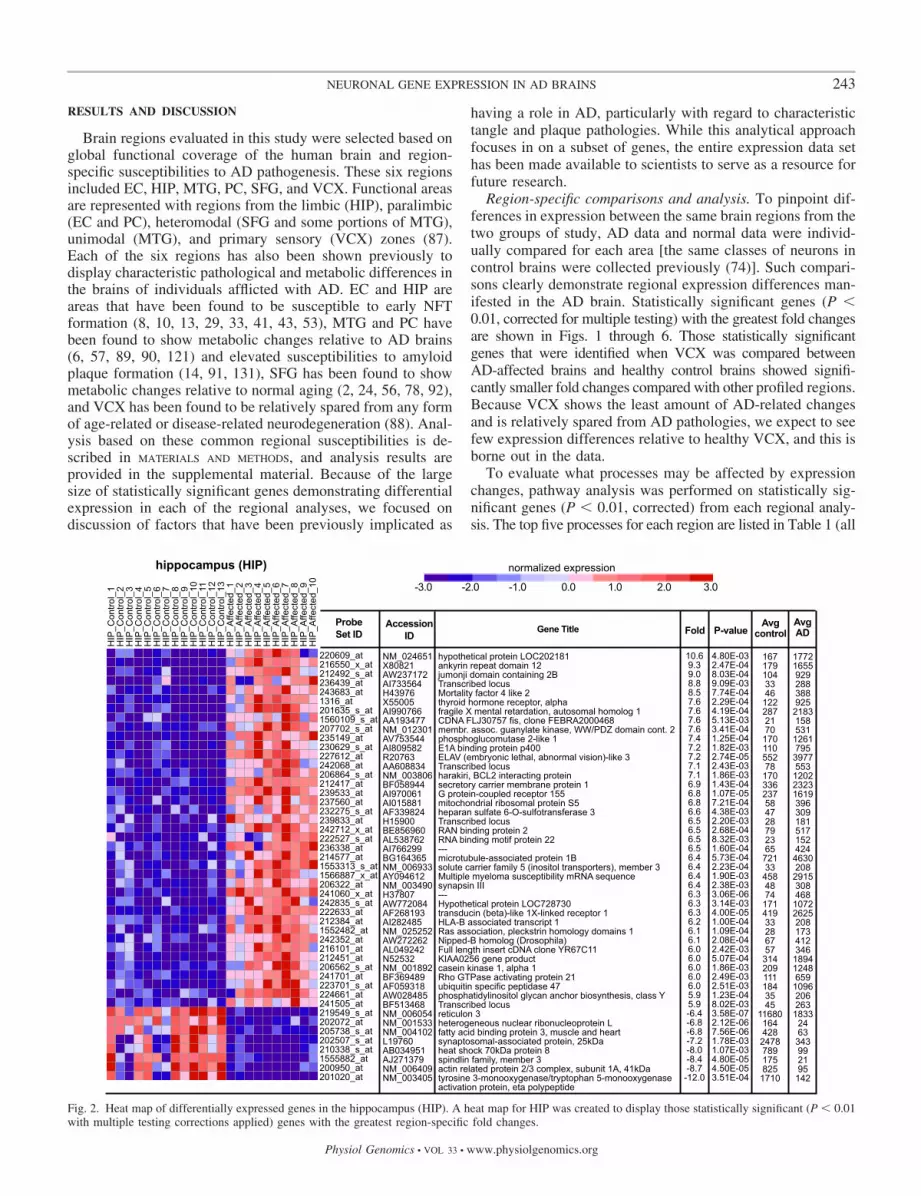
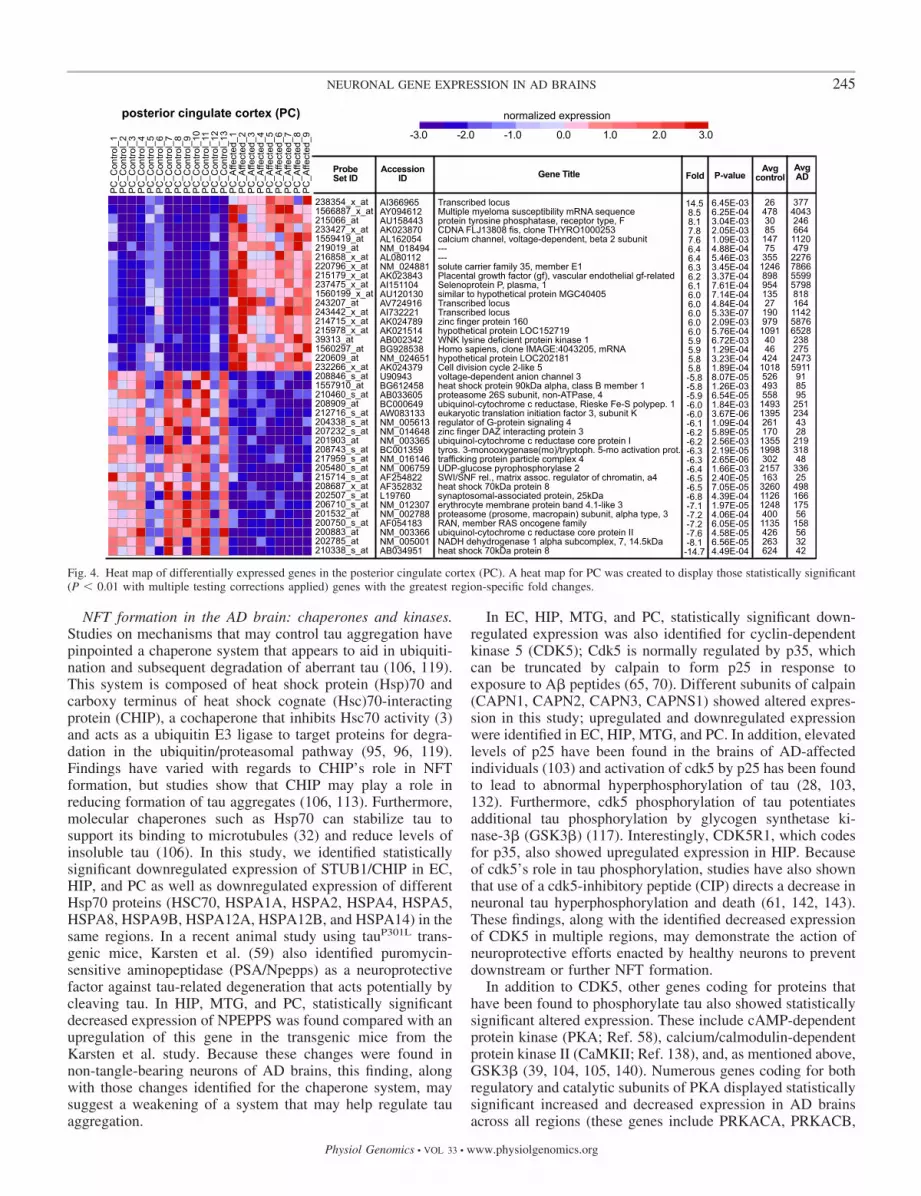
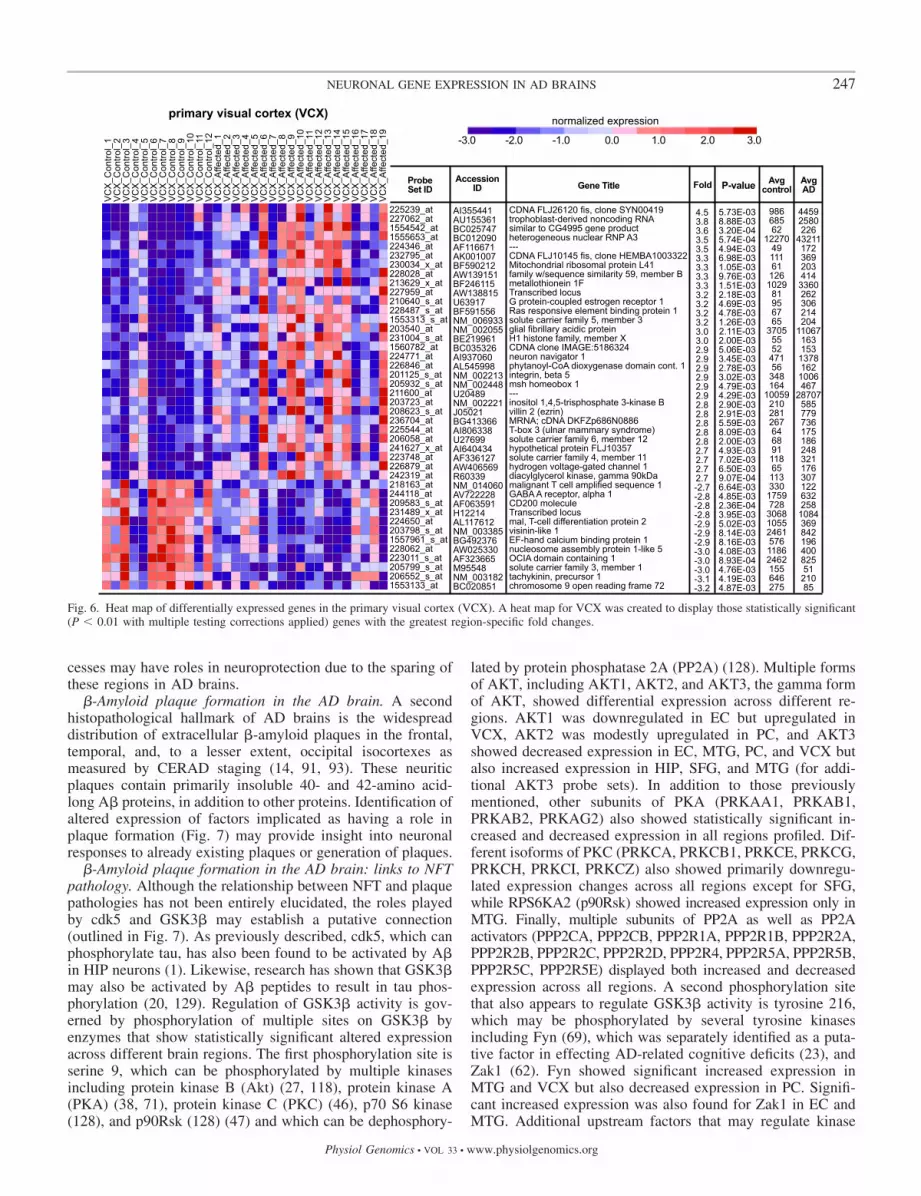
Region-specific comparisons and analysis. To pinpoint dif-ferences in expression between the same brain regions from thetwo groups of study, AD data and normal data were individ-ually compared for each area [the same classes of neurons incontrol brains were collected previously (74)]. Such compari-sons clearly demonstrate regional expression differences man-ifested in the AD brain. Statistically significant genes (P �0.01, corrected for multiple testing) with the greatest fold changesare shown in Figs. 1 through 6. Those statistically significantgenes that were identified when VCX was compared betweenAD-affected brains and healthy control brains showed signifi-cantly smaller fold changes compared with other profiled regions.Because VCX shows the least amount of AD-related changesand is relatively spared from AD pathologies, we expect to seefew expression differences relative to healthy VCX, and this isborne out in the data.
To evaluate what processes may be affected by expressionchanges, pathway analysis was performed on statistically sig-nificant genes (P � 0.01, corrected) from each regional analy-sis. The top five processes for each region are listed in Table 1 (all
Fig. 2. Heat map of differentially expressed genes in the hippocampus (HIP). A heat map for HIP was created to display those statistically significant (P � 0.01with multiple testing corrections applied) genes with the greatest region-specific fold changes.
243NEURONAL GENE EXPRESSION IN AD BRAINS
Physiol Genomics • VOL 33 • www.physiolgenomics.org

processes are listed in the supplemental material). In general,potentially affected mechanisms across all regions includecellular physiological processes, transport, metabolism, andcellular localization. In SFG, a region demonstrating metabolicdeficits with regard to aging, a number of unique processes fellthrough—these processes include biopolymer/protein modifi-cation, regulation of neurotransmitter secretion, and regulationof phosphorylation. Similar to other regions, top processes inVCX also include cell physiological process, cellular localiza-tion, and cellular transport; this overlap suggests that theseprocesses may be key in determining whether a region isneuroprotected and is able to stave off disease pathologies.
NFT formation in the AD brain. One of the major patholog-ical markers of AD is the presence of intracellular NFTs in thepostmortem brain. In the earlier stages of AD NFTs, which areprimarily comprised of hyperphosphorylated tau organized intopaired helical fragments (PHFs), are found in EC and HIP(Braak stages I–IV), but with the progression of AD NFTdistribution spreads to the association neocortex and primarycortical areas (Braak stages V and VI) (14). Because non-tangle-bearing cortical neurons were evaluated, differentialgene expressions identified in AD-affected brains may provideclues about events that precede NFT formation or potentialneuroprotective pathways enacted to inhibit such aggregations.A summary of the results is shown in Fig. 7, which provides anoverview of statistically significant genes (P � 0.01) that showaltered expression and may have roles in NFT pathways.
Under normal healthy conditions, tau proteins bind andstabilize microtubules, which serve major functions in celldivision and intracellular transport and also provide struc-tural intracellular support. Aberrant hyperphosphorylationof tau leads to the dissociation of tau from microtubules toaggregate into NFTs and results in subsequent breakdown ofmicrotubules. Statistically significant differential expressionwas identified for numerous proteins involved in the NFTformation pathway. First and foremost, altered expressionwas found for microtubule-associated protein tau (MAPT):MAPT showed decreased expression in EC, HIP, MTG, andPC. Such changes in MAPT expression suggest a change inneuronal demand for tau; decreased expression may indicatecellular attempts to inhibit formation of NFTs by loweringavailability of tau. Across these same regions, predomi-nantly decreased expression was also identified for isoformsof the alpha and beta tubulin proteins (TUBA1, TUBA2,TUBA3, TUBA6, TUBB, TUBB2, TUBB3, and TUBB4,TUBB6), which normally associate into heterodimers toserve as the building blocks of microtubules. Again, suchdownregulated differential expression may insinuate low-ered neuronal demand for tubulin heterodimers, potentiallydue to their increased availability resulting from microtu-bule breakdown. These findings may demonstrate neuronalresponses to potential toxicity or events that lie upstream ofeventual NFT formation.
Fig. 3. Heat map of differentially expressed genes in the middle temporal gyrus (MTG). A heat map for MTG was created to display those statistically significant(P � 0.01 with multiple testing corrections applied) genes with the greatest region-specific fold changes.
244 NEURONAL GENE EXPRESSION IN AD BRAINS
Physiol Genomics • VOL 33 • www.physiolgenomics.org
NFT formation in the AD brain: chaperones and kinases.Studies on mechanisms that may control tau aggregation havepinpointed a chaperone system that appears to aid in ubiquiti-nation and subsequent degradation of aberrant tau (106, 119).This system is composed of heat shock protein (Hsp)70 andcarboxy terminus of heat shock cognate (Hsc)70-interactingprotein (CHIP), a cochaperone that inhibits Hsc70 activity (3)and acts as a ubiquitin E3 ligase to target proteins for degra-dation in the ubiquitin/proteasomal pathway (95, 96, 119).Findings have varied with regards to CHIP’s role in NFTformation, but studies show that CHIP may play a role inreducing formation of tau aggregates (106, 113). Furthermore,molecular chaperones such as Hsp70 can stabilize tau tosupport its binding to microtubules (32) and reduce levels ofinsoluble tau (106). In this study, we identified statisticallysignificant downregulated expression of STUB1/CHIP in EC,HIP, and PC as well as downregulated expression of differentHsp70 proteins (HSC70, HSPA1A, HSPA2, HSPA4, HSPA5,HSPA8, HSPA9B, HSPA12A, HSPA12B, and HSPA14) in thesame regions. In a recent animal study using tauP301L trans-genic mice, Karsten et al. (59) also identified puromycin-sensitive aminopeptidase (PSA/Npepps) as a neuroprotectivefactor against tau-related degeneration that acts potentially bycleaving tau. In HIP, MTG, and PC, statistically significantdecreased expression of NPEPPS was found compared with anupregulation of this gene in the transgenic mice from theKarsten et al. study. Because these changes were found innon-tangle-bearing neurons of AD brains, this finding, alongwith those changes identified for the chaperone system, maysuggest a weakening of a system that may help regulate tauaggregation.
In EC, HIP, MTG, and PC, statistically significant down-regulated expression was also identified for cyclin-dependentkinase 5 (CDK5); Cdk5 is normally regulated by p35, whichcan be truncated by calpain to form p25 in response toexposure to A� peptides (65, 70). Different subunits of calpain(CAPN1, CAPN2, CAPN3, CAPNS1) showed altered expres-sion in this study; upregulated and downregulated expressionwere identified in EC, HIP, MTG, and PC. In addition, elevatedlevels of p25 have been found in the brains of AD-affectedindividuals (103) and activation of cdk5 by p25 has been foundto lead to abnormal hyperphosphorylation of tau (28, 103,132). Furthermore, cdk5 phosphorylation of tau potentiatesadditional tau phosphorylation by glycogen synthetase ki-nase-3� (GSK3�) (117). Interestingly, CDK5R1, which codesfor p35, also showed upregulated expression in HIP. Becauseof cdk5’s role in tau phosphorylation, studies have also shownthat use of a cdk5-inhibitory peptide (CIP) directs a decrease inneuronal tau hyperphosphorylation and death (61, 142, 143).These findings, along with the identified decreased expressionof CDK5 in multiple regions, may demonstrate the action ofneuroprotective efforts enacted by healthy neurons to preventdownstream or further NFT formation.
In addition to CDK5, other genes coding for proteins thathave been found to phosphorylate tau also showed statisticallysignificant altered expression. These include cAMP-dependentprotein kinase (PKA; Ref. 58), calcium/calmodulin-dependentprotein kinase II (CaMKII; Ref. 138), and, as mentioned above,GSK3� (39, 104, 105, 140). Numerous genes coding for bothregulatory and catalytic subunits of PKA displayed statisticallysignificant increased and decreased expression in AD brainsacross all regions (these genes include PRKACA, PRKACB,
Fig. 4. Heat map of differentially expressed genes in the posterior cingulate cortex (PC). A heat map for PC was created to display those statistically significant(P � 0.01 with multiple testing corrections applied) genes with the greatest region-specific fold changes.
245NEURONAL GENE EXPRESSION IN AD BRAINS
Physiol Genomics • VOL 33 • www.physiolgenomics.org

PRKAR1A, PRKAR1B, PRKAR2A, and PRKAR2B). In ad-dition to the action of cdk5, initial phosphorylation of tau byPKA also promotes downstream tau phosphorylation byGSK3� to outline a potential pathway for NFT formationthrough tau hyperphosphorylation (75, 76). Multiple genescoding for different CaMKII subunits also displayed statisti-cally significant upregulated and downregulated expressionacross all regions (these genes include CAMK2A, CAMK2B,CAMK2D, and CAMK2G). CaMKII has also specifically beenfound to be associated with PHFs in AD brains (138). Al-though the altered expression identified in AD brains for bothPKA and CaMKII shows expression changes in differentdirections, the statistical significance of the differences pro-vides evidence of neuronal changes specific to the AD brain.Finally, decreased expression of GSK3� was identified in HIP(which had an alternate probe demonstrating increased expres-sion), MTG, and PC. Past research has identified increasedlevels of GSK3� in the tissue of AD brains as well as itsassociation with NFTs in AD brains (54, 104, 105, 140).Again, GSK3� activity has also been found to be associatedwith tau hyperphosphorylation (5, 40, 44) through potentialregulation by cdk5 (107). Thus its decreased expression in thisstudy’s analysis suggests that the healthy profiled neurons maybe diverting pathogenic NFT formation pathways at a locallevel.
NFT formation in the AD brain: regional susceptibilities. Onthe basis of increased susceptibilities to tangle formation in ECand HIP, genes from both regional analyses were also sepa-rately considered apart from the other regions profiled (a subsetof Fig. 7 focusing on NFT formation with regard to tangle-susceptible regions is located in the supplemental material):922 genes demonstrating statistically significant expressionchanges in both regional comparisons of AD cases vs. controlsubjects (EC and HIP) were identified. To pinpoint processesthat may play a role in the pathological susceptibilities of thesetwo regions, gene ontology analysis was performed. The top 10processes from this analysis are shown in supplemental Fig.S1. Particularly interesting processes include synaptic trans-mission and synaptic vesicle transport, which suggest that thereare dramatic synaptic changes in AD brains in EC and HIP andglycolysis because AD has been suggested to be related toenergy metabolic deficits (31, 94, 109, 120–122). For thosegenes that only demonstrated significant expression changes inboth EC and HIP and did not demonstrate such changes inmore pathologically spared regions (SFG and VCX), the top 10processes specific to EC and HIP are also shown in supple-mental Fig. S1. Also shown are SFG- and VCX-specificprocesses, which include mechanisms involved in cell migra-tion, morphogenesis, organization, and biogenesis—these pro-
Fig. 5. Heat map of differentially expressed genes in the superior frontal gyrus (SFG). A heat map for SFG was created to display those statistically significant(P � 0.01 with multiple testing corrections applied) genes with the greatest region-specific fold changes.
246 NEURONAL GENE EXPRESSION IN AD BRAINS
Physiol Genomics • VOL 33 • www.physiolgenomics.org
cesses may have roles in neuroprotection due to the sparing ofthese regions in AD brains.
�-Amyloid plaque formation in the AD brain. A secondhistopathological hallmark of AD brains is the widespreaddistribution of extracellular �-amyloid plaques in the frontal,temporal, and, to a lesser extent, occipital isocortexes asmeasured by CERAD staging (14, 91, 93). These neuriticplaques contain primarily insoluble 40- and 42-amino acid-long A� proteins, in addition to other proteins. Identification ofaltered expression of factors implicated as having a role inplaque formation (Fig. 7) may provide insight into neuronalresponses to already existing plaques or generation of plaques.
�-Amyloid plaque formation in the AD brain: links to NFTpathology. Although the relationship between NFT and plaquepathologies has not been entirely elucidated, the roles playedby cdk5 and GSK3� may establish a putative connection(outlined in Fig. 7). As previously described, cdk5, which canphosphorylate tau, has also been found to be activated by A�in HIP neurons (1). Likewise, research has shown that GSK3�may also be activated by A� peptides to result in tau phos-phorylation (20, 129). Regulation of GSK3� activity is gov-erned by phosphorylation of multiple sites on GSK3� byenzymes that show statistically significant altered expressionacross different brain regions. The first phosphorylation site isserine 9, which can be phosphorylated by multiple kinasesincluding protein kinase B (Akt) (27, 118), protein kinase A(PKA) (38, 71), protein kinase C (PKC) (46), p70 S6 kinase(128), and p90Rsk (128) (47) and which can be dephosphory-
lated by protein phosphatase 2A (PP2A) (128). Multiple formsof AKT, including AKT1, AKT2, and AKT3, the gamma formof AKT, showed differential expression across different re-gions. AKT1 was downregulated in EC but upregulated inVCX, AKT2 was modestly upregulated in PC, and AKT3showed decreased expression in EC, MTG, PC, and VCX butalso increased expression in HIP, SFG, and MTG (for addi-tional AKT3 probe sets). In addition to those previouslymentioned, other subunits of PKA (PRKAA1, PRKAB1,PRKAB2, PRKAG2) also showed statistically significant in-creased and decreased expression in all regions profiled. Dif-ferent isoforms of PKC (PRKCA, PRKCB1, PRKCE, PRKCG,PRKCH, PRKCI, PRKCZ) also showed primarily downregu-lated expression changes across all regions except for SFG,while RPS6KA2 (p90Rsk) showed increased expression only inMTG. Finally, multiple subunits of PP2A as well as PP2Aactivators (PPP2CA, PPP2CB, PPP2R1A, PPP2R1B, PPP2R2A,PPP2R2B, PPP2R2C, PPP2R2D, PPP2R4, PPP2R5A, PPP2R5B,PPP2R5C, PPP2R5E) displayed both increased and decreasedexpression across all regions. A second phosphorylation sitethat also appears to regulate GSK3� activity is tyrosine 216,which may be phosphorylated by several tyrosine kinasesincluding Fyn (69), which was separately identified as a puta-tive factor in effecting AD-related cognitive deficits (23), andZak1 (62). Fyn showed significant increased expression inMTG and VCX but also decreased expression in PC. Signifi-cant increased expression was also found for Zak1 in EC andMTG. Additional upstream factors that may regulate kinase
Fig. 6. Heat map of differentially expressed genes in the primary visual cortex (VCX). A heat map for VCX was created to display those statistically significant(P � 0.01 with multiple testing corrections applied) genes with the greatest region-specific fold changes.
247NEURONAL GENE EXPRESSION IN AD BRAINS
Physiol Genomics • VOL 33 • www.physiolgenomics.org

activity and resulting GSK3� phosphorylation at serine 9include apoptosis (133), oxidative stress (11, 22, 84), andsignaling by Wnt (25), insulin (27), and epidermal growthfactor (Egf) (36, 114). A number of receptors that have roles inthese signaling pathways also displayed statistically significantaltered expression. Increased expression across EC, MTG, andVCX was identified for multiple “frizzled” genes (FZD4,FZD7, and FZD8), which encode receptors for Wnt proteins,while downregulated expression of FZD3 was identified in PC.Furthermore, numerous Wnt-encoding genes (WNT2B,WNT3, WNT6, and WNT10B) showed both upregulated anddownregulated expression in EC, HIP, and MTG. Substantialincreased expression in EC, MTG, SFG, and VCX was alsoidentified for Egf receptor (EGFR). With regard to phosphor-ylation regulation by apoptotic pathways, a number of relatedfactors also showed altered expression. Genes from the caspase(cysteine-aspartic acid protease) family also showed statisticallysignificant increased expression: CASP3 showed a modest in-crease specific to PC, while CASP7 showed an increase specific toMTG and VCX.
GSK3� activity appears to also be regulated by the phos-phoinositide 3-kinase (PI3K)/Akt cell survival pathway. Thisregulation begins with activation of the PI3K/Akt pathwaywhen PI3K helps to promote phosphorylation of Akt at mul-tiple sites (18). Phosphorylation of Akt activates it so that it can
phosphorylate multiple targets including GSK3� at its serine 9residue to inactivate GSK3� (27, 60). Additional studies havefound that inhibition of both PRKC (protein kinase C) andPI3K allows for GSK3� activation and subsequent tau phos-phorylation (72, 139). In this study, regulatory and catalyticsubunits of PIK3 showed upregulated and downregulated ex-pression across all regions profiled (PIK3C2A, PIK3C2B,PIK3CB, PIK3CD, PIK3R1, PIK3R2, PIK3R3, and PIK3R4).Such changes in expression suggest that there may be differ-ential regulation of GSK3� specific to different areas of thebrain to potentially influence downstream NFT and plaqueformation.
�-Amyloid plaque formation in the AD brain: amyloid pre-cursor protein pathways. Well-established factors implicatedin plaque generation that displayed significant altered expres-sion in AD brains include amyloid precursor protein (APP),beta secretase 1 (BACE1), components of the gamma secretasecomplex including presenilin 1 (PSEN1), presenilin enhancer 2homolog (Caenorhabditis elegans) (PEN2), transmembraneemp24-like trafficking protein 10 (yeast) (TMP21/TMED10),and anterior pharynx defective 1 homolog A (C. elegans)(APH1A). APP, which is processed by beta secretase and thegamma secretase complex to yield insoluble A� peptides,demonstrated marked increased expression in HIP, MTG, PC,and VCX. Interestingly, BACE1, which encodes a transmem-brane aspartyl protease, displayed decreased expression acrossEC, HIP, and MTG, while its homolog BACE2 displayedsignificant increased expression in EC, MTG, PC, and VCX.Although BACE2 function is still unclear, studies show thatBACE1 is correlated with increased processing of APP at thebeta site and resulting A� generation, while BACE2 is not(127). However, BACE2 overexpression reduced A� produc-tion (127), so that its increased expression in this study mayrepresent efforts to prevent further A� generation and plaqueformation. PSEN1 showed mild increased expression in MTGand modest decreased expression in HIP, and in PC multiplePSEN1 probes displayed expression changes in both direc-tions. Finally, PEN2 showed decreased expression in EC andPC, TMP21 showed both increased expression in HIP, MTG,and PC (which also had additional probes showing decreasedexpression), and APH1A displayed increased expression inHIP and MTG.
These factors all play a role in influencing the enzymaticactivity of the gamma secretase complex. Mutations in PSEN1have been confirmed to be associated with the early-onset, orfamilial, form of AD (along with PSEN2 and APP) and havebeen found to lead to generation of the 42-amino acid-long A�peptide to result in amyloid plaque formation (9, 19, 68, 137).More importantly, the majority of familial AD cases arecorrelated with mutations in PSEN1 (123). Studies that haveevaluated inhibitors against the active site of PSEN1 and thathave found a decrease in the amount of insoluble A� peptidesin response to PSEN1 inhibition provide evidence of thecatalytic role of PSEN1 as a part of the gamma secretasecomplex (37, 73, 116). Furthermore, any deficiencies ofPSEN1 inhibit APP processing and A� secretion from neurons(30, 100). Because of the histopathological analysis of amyloidplaques in the postmortem brains of AD patients evaluated inthis study, the modest PSEN1 expression increase that has beenidentified in MTG and PC correlates with APP processing andA� transport into the extracellular space for formation of
Table 1. Top processes in each regional comparison
BrainRegion Process
No. of Genesfrom Input List
Total No.of Genes
EC Cellular physiological process 1,459 6,652EC Transport 400 1,513EC Cellular process 1,615 7,676EC Transmission of nerve impulse 143 435EC Synaptic transmission 130 390HIP Cellular physiological process 1,838 6,652HIP Intracellular transport 240 531HIP Establishment of cellular localization 244 549HIP Cellular localization 244 558HIP Metabolism 1,314 4,511MTG Cellular physiological process 2,458 6,652MTG Cell organization and biogenesis 714 1,571MTG Intracellular transport 282 531MTG Establishment of cellular localization 289 549MTG Cellular localization 291 558PC Cellular physiological process 1,744 6,652PC Macromolecule metabolism 798 2,652PC Protein metabolism 604 1,909PC Intracellular transport 213 531PC Establishment of cellular localization 218 549SFG Biopolymer modification 97 1,007SFG Protein modification 93 966SFG Neurotransmitter secretion 17 85SFG Regulation of neurotransmitter levels 21 121SFG Regulation of phosphorylation 16 79VCX Cellular physiological process 815 6,652VCX Cell organization and biogenesis 246 1,571VCX Cellular localization 109 558VCX Establishment of cellular localization 107 549VCX Intracellular transport 104 531
The top 5 processes for each regional GeneGo analysis are listed. Thenumber of genes from each regional analysis input into GeneGo that falls in thespecific process is shown. The total number of genes in the specified processis also shown. EC, entorhinal cortex; HIP, hippocampus; MTG, middletemporal gyrus; PC, posterior cingulate cortex; SFG, superior frontal gyrus;VCX primary visual cortex.
248 NEURONAL GENE EXPRESSION IN AD BRAINS
Physiol Genomics • VOL 33 • www.physiolgenomics.org

amyloid plaques. PEN2 has also been found to be essential fornormal functioning of the gamma secretase complex (42, 124).Interestingly, PEN2, along with the APH1 and nicastrin pro-teins, was implicated for increasing levels of A� (85). Thus thedecreased PEN2 expression found in this study may demon-strate neuroprotective efforts to hinder the growth of A� levelsin late stages of the AD brain. However, APH1A showedstatistically significant increased expression in HIP and MTG,parallel to an increase in PSEN1 expression in MTG. APH1A,also shown to be required for proper gamma secretase func-tioning (42), is also found to regulate and be regulated byPEN2, PSEN1, and nicastrin, another component of gammasecretases (66, 80). Finally, the most recently discoveredelement required for gamma secretase functioning is TMP21
(21), a protein that has normal functions in vesicle traffick-ing (7). Along with the identification of TMP21 as a com-ponent of the gamma secretase complex, the same studyfound that overexpression of TMP21 did not affect the levelof gamma secretase components and also did not affect thegeneration of A�. However, suppression of TMP21 with shortinterfering RNA (siRNA) resulted in an increase in the generationof insoluble A� peptides (21). In light of this finding, the primar-ily upregulated expression of TMP21 seen in this study suggeststhat this alteration may not influence A� levels.
�-Amyloid plaque formation in the AD brain: additionalfactors. Additional potential amyloid plaque-related factorsthat displayed statistically significant altered expression in thisstudy include apolipoprotein E (APOE), �2-macroglobulin
Fig. 7. AD pathogenesis: relationships in neurofibrillary tangle (NFT) and plaque formation. This figure shows a summary of the relationships of factors encodedby statistically significant genes (� � 0.01, corrected) and which displayed altered expression across profiled regions. Factors shown were selected (throughliterature searches) based on previous research implicating/showing a role of respective factors in pathways surrounding formation of tangle and plaquepathologies. The statistically significant genes shown in this figure were only identified in EC, HIP, MTG, and PC analyses. Increased and decreased expressionare identified with up and down arrows, respectively. Arrows with 2 heads indicate that multiple probes, isoforms, or subunits demonstrating different directionsin expression changes were identified (separate fold changes for all factors are located in the supplemental material for this article). Each brain region isrepresented with a color code. For those factors that are encoded by multiple subunits (e.g., multiple genes), an average of the fold changes was calculated toevaluate the expression change. UBE, ubiquitin factors (ubiquitin-activating and -conjugating enzymes, ubiquitin ligases); PSM, proteasomal subunits; PHF,paired helical fragment.
249NEURONAL GENE EXPRESSION IN AD BRAINS
Physiol Genomics • VOL 33 • www.physiolgenomics.org

(A2M), lipoprotein-related receptor protein (LRP), Golgi-as-sociated, gamma adaptin ear containing, ARF binding protein1 (GGA1), protein (peptidylprolyl cis/trans isomerase) NIMA-interacting 1 (PIN1), sortilin-related receptor 1 (SORL1), andperoxiredoxin II (PRDX2). APOE, whose e4 allele is associ-ated with late-onset AD (26, 115, 125, 130) and whose proteinhas been found to localize to amyloid plaques (98), showedincreased expression in MTG and decreased expression in PC.Normally, apoE acts as a cholesterol transporter by binding tolow-density lipoprotein (LDL) receptors (16, 17, 82, 83) tosupport lipoprotein degradation (81). One study (55) correlatedapoE with reduced cleavage by gamma secretase to lower A�levels. In light of this finding, the increased expression iden-tified in this study may represent efforts to reduce A� levels.A2M, a protease inhibitor, showed increased expression onlyin MTG, while different isoforms of LRP, an endocytosisreceptor for which A2M is a ligand, showed increased expres-sion in EC (LRP4), HIP (LRP3/12), MTG (LRP1B/4/6/10), PC(LRP3), SFG (LRP4), and VCX (LRP1/3) and also decreasedexpression in EC (LRP10/16) and SFG (LRP12). Past researchhas found that A2M binds the A� peptide (34, 52) and alsolocalizes to amyloid plaques along with LRP (110). Of partic-ular interest is A2M’s ability to bind and direct A� towarddegradation via the clearance receptor activity of LRP (99),which also binds ApoE-containing lipoproteins (51) and endo-cytoses normally secreted APP (63). Thus simultaneous in-crease in expression of both A2M and LRP in MTG suggeststhat there may be increased activity utilizing a potential A�clearance mechanism in this region.
GGA1, a coat protein involved in mediating protein traffick-ing through the trans-Golgi network (TGN), displayed markedincreased expression in PC. GGA1, which also appears toinfluence intracellular transport of BACE1 (134), may influ-ence processing of APP through such protein trafficking (135).Furthermore, overexpression of GGA1 has been found to leadto decreased levels of BACE1-directed APP cleavage (135), sothat the increased expression identified in this study maydemonstrate neuronal efforts to inhibit A� generation.
PIN1, a peptidyl-prolyl isomerase recently found to bind tauat the phosphorylated threonine 231 residue and to play a role
in AD pathogenesis (79), displayed statistically significantincreased expression in PC along with decreased expression inEC and HIP to parallel a separate study reporting downregu-lated Pin1 expression in the AD-affected HIP (126). Pin1,which catalyzes transformation of serine/threonine-proline res-idues between cis and trans conformations, appears to influ-ence APP processing possibly by binding to APP’s threonine668-proline motif and changing the conformation of the intra-cellular domain of APP (102). Because Pin1 knockouts exhibitelevated A� secretion (102), the decreased expression identi-fied in this study may suggest that the global expressionanalysis evaluated in EC and HIP of the profiled AD brainsmay portray an already instigated pathogenic pathway thatcontributes to extracellular amyloid plaque formation but hasnot manifested in NFT formation.
SORL1 displayed widespread decreased expression in HIP,MTG, and PC. SORL1, which was recently identified forhaving a genetic association with AD (112), has been found todemonstrate decreased levels in AD brains and limited correl-ative increases in A� generation (12, 97, 144). Interestingly,SORL1 appears to directly bind APP to mediate its sorting intorecycling pathways (112). Thus its statistically significantdownregulated expression identified in multiple regions of ADbrains provides evidence of regional differences with regard toprotein recycling, or sorting, in AD pathogenesis.
Primarily decreased expression (P � 0.01, corrected) ofPRDX2 in EC, HIP, MTG, PC, and SFG was also found. Yaoet al. (141) found increased levels of Prdx2 in AD affectedbrains with an A� and amyloid binding alcohol dehydrogenase(ABAD) transgenic mouse. Yao et al. suggest that this increaseis neuroprotective from toxicity resulting from A� peptides.Because the postmortem brains evaluated in this study are allCERAD staged at moderate/frequent levels of plaques (tosuggest elevated levels of A� in the brains), these findingsshow that the nontangle-bearing neurons profiled may have lostor are lacking protection from A� and may thus be at an earliertime point in neurodegeneration before tangle formation.
�-Amyloid plaque formation in the AD brain: regionalsusceptibilities. Because of increased susceptibilities to plaqueformation in MTG and PC, genes from both regional analyses
Table 2. RT-PCR validation of selected genes
RT-PCR Data
Array Data
Probe Set ID Gene Name
Normalized Fold
P Value Fold Corrected P ValueControl (n � 9) AD (n � 6)
MTG213200_at SYP 1.00 2.33 3.93E-02 4.43 1.99E-04230303_at SYNPR 1.00 2.13 1.01E-01 1.82 2.24E-02231783_at CHRM1 1.00 2.27 5.47E-02 3.90 9.03E-04209793_at GRIA1 1.00 1.96 5.44E-02 2.57 2.86E-06210015_s_at MAP2 1.00 2.33 2.58E-02 2.22 1.12E-02212233_at MAP1B 1.00 2.13 2.94E-02 4.27 2.21E-07
PC213200_at SYP 1.00 1.54 6.17E-02 1.26 1.33E�00230303_at SYNPR 1.00 1.30 2.66E-01 2.33 2.36E-02231783_at CHRM1 1.00 1.61 3.73E-02 2.67 7.90E-04209793_at GRIA1 1.00 1.33 1.35E-01 1.87 1.80E-05225540_at MAP2 1.00 1.56 6.32E-02 1.13 1.06E�00226084_at MAP1B 1.00 1.22 4.32E-01 1.53 4.03E-02
Normalized fold changes for RT-PCR validation data in MTG and PC of unprofiled control subjects and AD cases are shown; n � 9 (control) and 6 (AD)for MTG and 8 (control) and 8 (AD) for PC. The respective microarray data are also shown for each gene.
250 NEURONAL GENE EXPRESSION IN AD BRAINS
Physiol Genomics • VOL 33 • www.physiolgenomics.org

of AD cases vs. control subjects were considered (parallel tothe EC/HIP analyses, a subset of Fig. 7 focusing on plaqueformation with regard to plaque susceptible regions is alsolocated in the supplemental material): 2,586 genes demonstrat-ing statistically significant expression changes in both regionalcomparisons were found. To understand what pathways mayplay a role in the pathological susceptibilities of these tworegions, gene ontology analysis was performed with GeneGoMetaCore. The top 10 processes from GeneGo MetaCoreanalysis are shown in supplemental Fig. S1. Processes includemicrotubule-based processes and movement, axon cargo trans-port, and transport, all of which may be potentially related totangle formation, or specifically protection from this pathol-ogy. For those genes that only demonstrated significant expres-sion changes in both MTG and PC and did not show suchchanges in more pathologically spared regions (SFG andVCX), the top 10 processes specific to MTG and PC are alsoshown in supplemental Fig. S1 (along with SFG- and VCX-specific processes).
Additional AD-relevant pathways. In evaluating the path-ways surrounding protein aggregates that characterize AD, it isalso important to consider the ubiquitin-proteasomal pathway,which serves as the major mechanism for disposal of proteins.The ubiquitin-proteasomal pathway involves the action of threeenzymes, ubiquitin-activating enzyme (E1), ubiquitin-conju-gating enzyme (E2), and ubiquitin ligase (E3), which co-valently marks and directs a protein to the proteasome fordegradation. Across all profiled regions, widespread alteredexpression was identified for numerous proteasomal subunits(including PSMA1–7; PSMB1–7, 10; PSMC1–6; PSMD1, 4,6–14; PSME1,3, 4; PSMF1) as well as ubiquitin [ubiquitin B(UBB) and ubiquitin C (UBC)], an ubiquitin-activating en-zyme (UBE1DC1), ubiquitin-conjugating enzymes (UBE2A,2B, 2D1, 2D2, 2D3, 2E1, 2E2, 2G1, 2H, 2I, 2J1, 2L3, 2L6, 2N,2Q, 2R2, 2V1, 2V2), ubiquitin ligases (UBE3A, 3B, 3C), andubiquitin-specific peptidases (USP1, 2, 4, 6–12, 14, 16, 19, 22,25, 30–34, 36–38, 40, 42, 46–48, 53, 54). Additional ubiquitin-related factors that displayed differential expression includeubiquilin 1 (UBQLN1) and ubiquitin hydrolase (UCHL1).UBQLN1, which showed decreased expression in MTG and PC,has been found to mediate APP trafficking as well as secretion ofthe A� peptide (50). UCHL1, which also showed significantdecreased expression in HIP, MTG, PC, and SFG, appears toplay a role in protection against damaging of synaptic functionsas a result of A� toxicity (45).
Finally, because SFG and VCX are areas shown to beaffected in later stages of the disease or are more pathologicallyspared, pathway analysis was also performed on genes thatshowed statistically significant changes in both regional anal-yses (the top 10 processes are shown in supplemental Fig. S1).Because of the disease characteristics of SFG and VCX, thesparing of these regions may be associated with a number ofthe top processes including changes in cell organization, bio-genesis, morphogenesis, and intracellular signaling cascades.
RT-PCR validation of selected genes. We performed RT-PCR on additional unprofiled fresh frozen brain sections (healthyelderly control subjects as well as pathologically confirmed ADcases) to validate gene expression changes. Genes for validationwere selected based on established relevance to AD as wellas demonstration of statistically significant expressionchanges in regions for which tissue was available. Expres-
sion of synaptophysin (SYP), synaptoporin (SYNPR), mi-crotubule-associated protein 2 (MAP2), microtubule-associatedprotein 1B (MAP1B), M1 cholinergic receptor (CHRM1), andGRIA1 (AMPA1 receptor) was evaluated in MTG and PC[using GUSB (�-gluconuridase) as a normalization control].Results from RT-PCR analysis are shown in Table 2 andFig. 8.
Data from the MTG demonstrated downregulation of all sixselected genes in AD brains to parallel the expression changes(P � 0.05, corrected) identified from microarray analysis.RT-PCR results also achieved significance for SYP (P �3.93E-02), CHRM1 (P � 5.47E-02), GRIA1 (P � 5.44E-02),MAP2 (P � 2.58E-02), and MAP1B (P � 2.94E-02), whileSYNPR demonstrated a trend toward significance (P � 1.01E-01). In PC, while significant downregulated expressionchanges (P � 0.05, corrected) were only identified with mi-croarrays for SYNPR, CHRM1, GRIA1, and MAP1B, RT-PCR validation also demonstrated significant parallel changesfor CHRM1 (P � 3.73E-02) and MAP2 (P � 6.32E-02).
Fig. 8. RT-PCR validation of selected genes. RT-PCR was used to indepen-dently validate unprofiled control subjects and AD cases in MTG (control: n �9, AD cases: n � 6) and PC (control: n � 8, AD cases: n � 8). Genes forvalidation were selected based on relevance to AD pathophysiology anddemonstration of significant expression changes from array analysis. Normal-ized folds are shown on the y-axis, and genes are listed on the x-axis.Quantitative results are listed in Table 2.
251NEURONAL GENE EXPRESSION IN AD BRAINS
Physiol Genomics • VOL 33 • www.physiolgenomics.org

Furthermore, while RT-PCR showed nonsignificant changesfor SYNPR, GRIA1, and MAP1B, these genes showed down-regulated expression in the array data comparing AD brains tocontrol brains. Overall, these RT-PCR data provide indepen-dent validation of expression changes identified through arrayanalysis of six AD relevant genes in MTG and PC.
Summary. In this study, we present an expression profilereference detailing levels of steady-state expression of allhuman genes and transcripts in six discrete regions of the ADbrain. Along with the identification of altered expression offactors previously implicated in AD pathogenesis includingthose coded by APOE, BACE1, STUB1 (CHIP), FYN, GGA1,and SORL1, we have also pinpointed statistically significantgenes that demonstrate the greatest expression changes in eachregion and that have roles in pathways surrounding formationof the characteristic pathological markers of AD. Such differ-ences indicate that there are unique regional activities in ADbrains and demonstrate that neurodegenerative mechanismsand/or neuroprotective efforts may be enacted at differentlevels and through different avenues within each region. Fur-thermore, expression changes identified across the differen-tially susceptible regions may represent different time pointsduring neurodegeneration. While future downstream functionalstudies will be needed to elucidate the roles of these factors,this expression reference will serve as an important resourcefor future research aimed at delineating AD pathogenesis anddeveloping improved therapeutics to treat this devastatingdisease. Finally, we provide to the research community ourexpression data from carefully phenotyped, low-PMI, intrain-dividual regional neurons as a public resource.
ACKNOWLEDGMENTS
We thank Dr. Roger Higdon (National Alzheimer’s Coordinating Center)for help in acquiring samples, Elizabeth Salomon (Translational Genomics) forhelp with GEO data posting, Lucia Sue (Sun Health Research Institute) forhelp with collecting neuropathological data, and Nick Lehmans (TranslationalGenomics) for help with supplemental data posting. We also thank theNational Institute on Aging’s Alzheimer’s Disease Centers program and theNational Alzheimer’s Coordinating Center for help in obtaining samples foranalysis.
GRANTS
This project was funded by grants from the State of Arizona and the NIHNeuroscience Microarray Consortium, the National Institute on Aging(NIA) (Grants K01-AG-024079 to T. Dunckley, 1-RO1-AG-023193 toD. A. Stephan, AG-O7367 to J. Rogers, P30-AG-19610 to E. M. Reiman,P50-AG-05681 to J. C. Morris, P01-AG-03991 to J. C. Morris, andAG-05128 for the Duke University Alzheimer’s Disease Center), theNational Alzheimer’s Coordinating Center (U01AG016976), and the Ari-zona Alzheimer’s Research Center (to E. M. Reiman) under a collaborativeagreement from NIA.
REFERENCES
1. Alvarez A, Toro R, Caceres A, Maccioni RB. Inhibition of tauphosphorylating protein kinase cdk5 prevents beta-amyloid-induced neu-ronal death. FEBS Lett 459: 421–426, 1999.
2. Angelie E, Bonmartin A, Boudraa A, Gonnaud PM, Mallet JJ,Sappey-Marinier D. Regional differences and metabolic changes innormal aging of the human brain: proton MR spectroscopic imagingstudy. AJNR Am J Neuroradiol 22: 119–127, 2001.
3. Ballinger CA, Connell P, Wu Y, Hu Z, Thompson LJ, Yin LY,Patterson C. Identification of CHIP, a novel tetratricopeptide repeat-containing protein that interacts with heat shock proteins and negativelyregulates chaperone functions. Mol Cell Biol 19: 4535–4545, 1999.
4. Barrachina M, Castano E, Ferrer I. TaqMan PCR assay in the controlof RNA normalization in human post-mortem brain tissue. NeurochemInt 49: 276–284, 2006.
5. Bhat RV, Budd Haeberlein SL, Avila J. Glycogen synthase kinase 3:a drug target for CNS therapies. J Neurochem 89: 1313–1317, 2004.
6. Blesa R, Mohr E, Miletich RS, Hildebrand K, Sampson M, ChaseTN. Cerebral metabolic changes in Alzheimer’s disease: neurobehavioralpatterns. Dementia 7: 239–245, 1996.
7. Blum R, Feick P, Puype M, Vandekerckhove J, Klengel R, Nastainc-zyk W, Schulz I. Tmp21 and p24A, two type I proteins enriched inpancreatic microsomal membranes, are members of a protein familyinvolved in vesicular trafficking. J Biol Chem 271: 17183–17189, 1996.
8. Bobinski M, de Leon MJ, Convit A, De Santi S, Wegiel J, TarshishCY, Saint Louis LA, Wisniewski HM. MRI of entorhinal cortex in mildAlzheimer’s disease. Lancet 353: 38–40, 1999.
9. Borchelt DR, Thinakaran G, Eckman CB, Lee MK, Davenport F,Ratovitsky T, Prada CM, Kim G, Seekins S, Yager D, Slunt HH,Wang R, Seeger M, Levey AI, Gandy SE, Copeland NG, Jenkins NA,Price DL, Younkin SG, Sisodia SS. Familial Alzheimer’s disease-linked presenilin 1 variants elevate A�1–42/1–40 ratio in vitro and invivo. Neuron 17: 1005–1013, 1996.
10. Bouras C, Hof PR, Giannakopoulos P, Michel JP, Morrison JH.Regional distribution of neurofibrillary tangles and senile plaques in thecerebral cortex of elderly patients: a quantitative evaluation of a one-yearautopsy population from a geriatric hospital. Cereb Cortex 4: 138–150,1994.
11. Bowerman B. Cell biology. Oxidative stress and cancer: a beta-cateninconvergence. Science 308: 1119–1120, 2005.
12. Bowser R, Smith MA. Cell cycle proteins in Alzheimer’s disease: plentyof wheels but no cycle. J Alzheimers Dis 4: 249–254, 2002.
13. Braak H, Braak E. The human entorhinal cortex: normal morphologyand lamina-specific pathology in various diseases. Neurosci Res 15:6–31, 1992.
14. Braak H, Braak E. Neuropathological stageing of Alzheimer-relatedchanges. Acta Neuropathol (Berl) 82: 239–259, 1991.
15. Brookmeyer R, Gray S, Kawas C. Projections of Alzheimer’s diseasein the United States and the public health impact of delaying diseaseonset. Am J Public Health 88: 1337–1342, 1998.
16. Brown MS, Goldstein JL. Lipoprotein receptors in the liver. Controlsignals for plasma cholesterol traffic. J Clin Invest 72: 743–747, 1983.
17. Brown MS, Goldstein JL. A receptor-mediated pathway for cholesterolhomeostasis. Science 232: 34–47, 1986.
18. Brunet A, Datta SR, Greenberg ME. Transcription-dependent and-independent control of neuronal survival by the PI3K-Akt signalingpathway. Curr Opin Neurobiol 11: 297–305, 2001.
19. Campion D, Flaman JM, Brice A, Hannequin D, Dubois B, Martin C,Moreau V, Charbonnier F, Didierjean O, Tardieu S, Penet C, PuelM, Pasquier F, Le Doze F, Bellis G, Calenda A, Heilig R, MartinezM, Mallet J, Bellis M, Clerget-Darpoux F, Agid Y, Frebourg T.Mutations of the presenilin I gene in families with early-onset Alzhei-mer’s disease. Hum Mol Genet 4: 2373–2377, 1995.
20. Cedazo-Minguez A, Popescu BO, Blanco-Millan JM, Akterin S, PeiJJ, Winblad B, Cowburn RF. Apolipoprotein E and beta-amyloid(1–42) regulation of glycogen synthase kinase-3beta. J Neurochem 87:1152–1164, 2003.
21. Chen F, Hasegawa H, Schmitt-Ulms G, Kawarai T, Bohm C, Katay-ama T, Gu Y, Sanjo N, Glista M, Rogaeva E, Wakutani Y, Pardossi-Piquard R, Ruan X, Tandon A, Checler F, Marambaud P, Hansen K,Westaway D, St George-Hyslop P, Fraser P. TMP21 is a presenilincomplex component that modulates gamma-secretase but not epsilon-secretase activity. Nature 440: 1208–1212, 2006.
22. Chen GJ, Xu J, Lahousse SA, Caggiano NL, de la Monte SM.Transient hypoxia causes Alzheimer-type molecular and biochemicalabnormalities in cortical neurons: potential strategies for neuroprotection.J Alzheimers Dis 5: 209–228, 2003.
23. Chin J, Palop JJ, Puolivali J, Massaro C, Bien-Ly N, Gerstein H,Scearce-Levie K, Masliah E, Mucke L. Fyn kinase induces synapticand cognitive impairments in a transgenic mouse model of Alzheimer’sdisease. J Neurosci 25: 9694–9703, 2005.
24. Convit A, Wolf OT, de Leon MJ, Patalinjug M, Kandil E, Caraos C,Scherer A, Saint Louis LA, Cancro R. Volumetric analysis of thepre-frontal regions: findings in aging and schizophrenia. Psychiatry Res107: 61–73, 2001.
25. Cook D, Fry MJ, Hughes K, Sumathipala R, Woodgett JR, Dale TC.Wingless inactivates glycogen synthase kinase-3 via an intracellularsignalling pathway which involves a protein kinase C. EMBO J 15:4526–4536, 1996.
252 NEURONAL GENE EXPRESSION IN AD BRAINS
Physiol Genomics • VOL 33 • www.physiolgenomics.org

26. Corder EH, Saunders AM, Strittmatter WJ, Schmechel DE, GaskellPC, Small GW, Roses AD, Haines JL, Pericak-Vance MA. Gene doseof apolipoprotein E type 4 allele and the risk of Alzheimer’s disease inlate onset families. Science 261: 921–923, 1993.
27. Cross DA, Alessi DR, Cohen P, Andjelkovich M, Hemmings BA.Inhibition of glycogen synthase kinase-3 by insulin mediated by proteinkinase B. Nature 378: 785–789, 1995.
28. Cruz JC, Tseng HC, Goldman JA, Shih H, Tsai LH. Aberrant Cdk5activation by p25 triggers pathological events leading to neurodegenera-tion and neurofibrillary tangles. Neuron 40: 471–483, 2003.
29. de Leon MJ, George AE, Stylopoulos LA, Smith G, Miller DC. Earlymarker for Alzheimer’s disease: the atrophic hippocampus. Lancet 2:672–673, 1989.
30. De Strooper B, Saftig P, Craessaerts K, Vanderstichele H, Guhde G,Annaert W, Von Figura K, Van Leuven F. Deficiency of presenilin-1inhibits the normal cleavage of amyloid precursor protein. Nature 391:387–390, 1998.
31. Desgranges B, Baron JC, de la Sayette V, Petit-Taboue MC, BenaliK, Landeau B, Lechevalier B, Eustache F. The neural substrates ofmemory systems impairment in Alzheimer’s disease. A PET study ofresting brain glucose utilization. Brain 121: 611–631, 1998.
32. Dou F, Netzer WJ, Tanemura K, Li F, Hartl FU, Takashima A,Gouras GK, Greengard P, Xu H. Chaperones increase association oftau protein with microtubules. Proc Natl Acad Sci USA 100: 721–726,2003.
33. Du AT, Schuff N, Zhu XP, Jagust WJ, Miller BL, Reed BR, KramerJH, Mungas D, Yaffe K, Chui HC, Weiner MW. Atrophy rates ofentorhinal cortex in AD and normal aging. Neurology 60: 481–486,2003.
34. Du Y, Ni B, Glinn M, Dodel RC, Bales KR, Zhang Z, Hyslop PA,Paul SM. �2-Macroglobulin as a beta-amyloid peptide-binding plasmaprotein. J Neurochem 69: 299–305, 1997.
35. Dunckley T, Beach TG, Ramsey KE, Grover A, Mastroeni D, WalkerDG, LaFleur BJ, Coon KD, Brown KM, Caselli R, Kukull W, HigdonR, McKeel D, Morris JC, Hulette C, Schmechel D, Reiman EM,Rogers J, Stephan DA. Gene expression correlates of neurofibrillarytangles in Alzheimer’s disease. Neurobiol Aging 27: 1359–1371, 2006.
36. Eldar-Finkelman H, Seger R, Vandenheede JR, Krebs EG. Inactiva-tion of glycogen synthase kinase-3 by epidermal growth factor is medi-ated by mitogen-activated protein kinase/p90 ribosomal protein S6 ki-nase signaling pathway in NIH/3T3 cells. J Biol Chem 270: 987–990,1995.
37. Esler WP, Kimberly WT, Ostaszewski BL, Diehl TS, Moore CL, TsaiJY, Rahmati T, Xia W, Selkoe DJ, Wolfe MS. Transition-state ana-logue inhibitors of gamma-secretase bind directly to presenilin-1. NatCell Biol 2: 428–434, 2000.
38. Fang X, Yu SX, Lu Y, Bast RC Jr, Woodgett JR, Mills GB.Phosphorylation and inactivation of glycogen synthase kinase 3 byprotein kinase A. Proc Natl Acad Sci USA 97: 11960–11965, 2000.
39. Ferrer I, Blanco R, Carmona M. Differential expression of active,phosphorylation-dependent MAP kinases, MAPK/ERK, SAPK/JNK andp38, and specific transcription factor substrates following quinolinic acidexcitotoxicity in the rat. Brain Res Mol Brain Res 94: 48–58, 2001.
40. Ferrer I, Gomez-Isla T, Puig B, Freixes M, Ribe E, Dalfo E, Avila J.Current advances on different kinases involved in tau phosphorylation,and implications in Alzheimer’s disease and tauopathies. Curr AlzheimerRes 2: 3–18, 2005.
41. Fox NC, Warrington EK, Stevens JM, Rossor MN. Atrophy of thehippocampal formation in early familial Alzheimer’s disease. A longi-tudinal MRI study of at-risk members of a family with an amyloidprecursor protein 717Val-Gly mutation. Ann NY Acad Sci 777: 226–232,1996.
42. Francis R, McGrath G, Zhang J, Ruddy DA, Sym M, Apfeld J, NicollM, Maxwell M, Hai B, Ellis MC, Parks AL, Xu W, Li J, Gurney M,Myers RL, Himes CS, Hiebsch R, Ruble C, Nye JS, Curtis D. aph-1and pen-2 are required for Notch pathway signaling, gamma-secretasecleavage of betaAPP, and presenilin protein accumulation. Dev Cell 3:85–97, 2002.
43. Frisoni GB, Laakso MP, Beltramello A, Geroldi C, Bianchetti A,Soininen H, Trabucchi M. Hippocampal and entorhinal cortex atrophyin frontotemporal dementia and Alzheimer’s disease. Neurology 52:91–100, 1999.
44. Fuentealba RA, Farias G, Scheu J, Bronfman M, Marzolo MP,Inestrosa NC. Signal transduction during amyloid-beta-peptide neuro-
toxicity: role in Alzheimer disease. Brain Res Brain Res Rev 47: 275–289, 2004.
45. Gong B, Cao Z, Zheng P, Vitolo OV, Liu S, Staniszewski A, Mool-man D, Zhang H, Shelanski M, Arancio O. Ubiquitin hydrolaseUch-L1 rescues beta-amyloid-induced decreases in synaptic function andcontextual memory. Cell 126: 775–788, 2006.
46. Goode N, Hughes K, Woodgett JR, Parker PJ. Differential regulationof glycogen synthase kinase-3 beta by protein kinase C isotypes. J BiolChem 267: 16878–16882, 1992.
47. Grimes CA, Jope RS. The multifaceted roles of glycogen synthasekinase 3beta in cellular signaling. Prog Neurobiol 65: 391–426, 2001.
48. Hebert LE, Scherr PA, Bienias JL, Bennett DA, Evans DA. Alzhei-mer disease in the US population: prevalence estimates using the 2000census. Arch Neurol 60: 1119–1122, 2003.
49. Hentschel F, Kreis M, Damian M, Krumm B, Frolich L. The clinicalutility of structural neuroimaging with MRI for diagnosis and differentialdiagnosis of dementia: a memory clinic study. Int J Geriatr Psychiatry20: 645–650, 2005.
50. Hiltunen M, Lu A, Thomas AV, Romano DM, Kim M, Jones PB, XieZ, Kounnas MZ, Wagner SL, Berezovska O, Hyman BT, Tesco G,Bertram L, Tanzi RE. Ubiquilin 1 modulates amyloid precursor proteintrafficking and Abeta secretion. J Biol Chem 281: 32240–32253, 2006.
51. Holtzman DM, Pitas RE, Kilbridge J, Nathan B, Mahley RW, Bu G,Schwartz AL. Low density lipoprotein receptor-related protein mediatesapolipoprotein E-dependent neurite outgrowth in a central nervous sys-tem-derived neuronal cell line. Proc Natl Acad Sci USA 92: 9480–9484,1995.
52. Hughes SR, Khorkova O, Goyal S, Knaeblein J, Heroux J, RiedelNG, Sahasrabudhe S. Alpha2-macroglobulin associates with beta-amy-loid peptide and prevents fibril formation. Proc Natl Acad Sci USA 95:3275–3280, 1998.
53. Hyman BT, Van Hoesen GW, Damasio AR, Barnes CL. Alzheimer’sdisease: cell-specific pathology isolates the hippocampal formation. Sci-ence 225: 1168–1170, 1984.
54. Imahori K, Uchida T. Physiology and pathology of tau protein kinasesin relation to Alzheimer’s disease. J Biochem (Tokyo) 121: 179–188,1997.
55. Irizarry MC, Deng A, Lleo A, Berezovska O, Von Arnim CA,Martin-Rehrmann M, Manelli A, LaDu MJ, Hyman BT, RebeckGW. Apolipoprotein E modulates gamma-secretase cleavage of theamyloid precursor protein. J Neurochem 90: 1132–1143, 2004.
56. Ivancevic V, Alavi A, Souder E, Mozley PD, Gur RE, Benard F,Munz DL. Regional cerebral glucose metabolism in healthy volunteersdetermined by fluordeoxyglucose positron emission tomography: appear-ance and variance in the transaxial, coronal, and sagittal planes. Clin NuclMed 25: 596–602, 2000.
57. Jack CR Jr, Petersen RC, Xu Y, O’Brien PC, Smith GE, Ivnik RJ,Tangalos EG, Kokmen E. Rate of medial temporal lobe atrophy intypical aging and Alzheimer’s disease. Neurology 51: 993–999, 1998.
58. Jicha GA, Weaver C, Lane E, Vianna C, Kress Y, Rockwood J,Davies P. cAMP-dependent protein kinase phosphorylations on tau inAlzheimer’s disease. J Neurosci 19: 7486–7494, 1999.
59. Karsten SL, Sang TK, Gehman LT, Chatterjee S, Liu J, LawlessGM, Sengupta S, Berry RW, Pomakian J, Oh HS, Schulz C, Hui KS,Wiedau-Pazos M, Vinters HV, Binder LI, Geschwind DH, JacksonGR. A genomic screen for modifiers of tauopathy identifies puromycin-sensitive aminopeptidase as an inhibitor of tau-induced neurodegenera-tion. Neuron 51: 549–560, 2006.
60. Kaytor MD, Orr HT. The GSK3 beta signaling cascade and neurode-generative disease. Curr Opin Neurobiol 12: 275–278, 2002.
61. Kesavapany S, Li BS, Amin N, Zheng YL, Grant P, Pant HC.Neuronal cyclin-dependent kinase 5: role in nervous system function andits specific inhibition by the Cdk5 inhibitory peptide. Biochim BiophysActa 1697: 143–153, 2004.
62. Kim L, Liu J, Kimmel AR. The novel tyrosine kinase ZAK1 activatesGSK3 to direct cell fate specification. Cell 99: 399–408, 1999.
63. Kounnas MZ, Moir RD, Rebeck GW, Bush AI, Argraves WS, TanziRE, Hyman BT, Strickland DK. LDL receptor-related protein, a mul-tifunctional ApoE receptor, binds secreted beta-amyloid precursor pro-tein and mediates its degradation. Cell 82: 331–340, 1995.
64. Kuwano R, Miyashita A, Arai H, Asada T, Imagawa M, Shoji M,Higuchi S, Urakami K, Kakita A, Takahashi H, Tsukie T, Toyabe S,Akazawa K, Kanazawa I, Ihara Y. Dynamin-binding protein gene on
253NEURONAL GENE EXPRESSION IN AD BRAINS
Physiol Genomics • VOL 33 • www.physiolgenomics.org

chromosome 10q is associated with late-onset Alzheimer’s disease. HumMol Genet 15: 2170–2182, 2006.
65. Lee MS, Kwon YT, Li M, Peng J, Friedlander RM, Tsai LH.Neurotoxicity induces cleavage of p35 to p25 by calpain. Nature 405:360–364, 2000.
66. Lee SF, Shah S, Li H, Yu C, Han W, Yu G. Mammalian APH-1interacts with presenilin and nicastrin and is required for intramembraneproteolysis of amyloid-beta precursor protein and Notch. J Biol Chem277: 45013–45019, 2002.
67. Lehericy S, Marjanska M, Mesrob L, Sarazin M, Kinkingnehun S.Magnetic resonance imaging of Alzheimer’s disease. Eur Radiol 17:347–362, 2006.
68. Lemere CA, Lopera F, Kosik KS, Lendon CL, Ossa J, Saido TC,Yamaguchi H, Ruiz A, Martinez A, Madrigal L, Hincapie L, ArangoJC, Anthony DC, Koo EH, Goate AM, Selkoe DJ, Arango JC. TheE280A presenilin 1 Alzheimer mutation produces increased Abeta42deposition and severe cerebellar pathology. Nat Med 2: 1146–1150,1996.
69. Lesort M, Jope RS, Johnson GV. Insulin transiently increases tauphosphorylation: involvement of glycogen synthase kinase-3beta andFyn tyrosine kinase. J Neurochem 72: 576–584, 1999.
70. Li G, Faibushevich A, Turunen BJ, Yoon SO, Georg G, MichaelisML, Dobrowsky RT. Stabilization of the cyclin-dependent kinase 5activator, p35, by paclitaxel decreases beta-amyloid toxicity in corticalneurons. J Neurochem 84: 347–362, 2003.
71. Li M, Wang X, Meintzer MK, Laessig T, Birnbaum MJ, HeidenreichKA. Cyclic AMP promotes neuronal survival by phosphorylation ofglycogen synthase kinase 3beta. Mol Cell Biol 20: 9356–9363, 2000.
72. Li X, Lu F, Tian Q, Yang Y, Wang Q, Wang JZ. Activation ofglycogen synthase kinase-3 induces Alzheimer-like tau hyperphosphory-lation in rat hippocampus slices in culture. J Neural Transm 113: 93–102,2006.
73. Li YM, Xu M, Lai MT, Huang Q, Castro JL, DiMuzio-Mower J,Harrison T, Lellis C, Nadin A, Neduvelil JG, Register RB, SardanaMK, Shearman MS, Smith AL, Shi XP, Yin KC, Shafer JA, GardellSJ. Photoactivated gamma-secretase inhibitors directed to the active sitecovalently label presenilin 1. Nature 405: 689–694, 2000.
74. Liang WS, Dunckley T, Beach TG, Grover A, Mastroeni D, WalkerDG, Caselli RJ, Kukull WA, McKeel D, Morris JC, Hulette C,Schmechel D, Alexander GE, Reiman EM, Rogers J, Stephan DA.Gene expression profiles in anatomically and functionally distinct regionsof the normal aged human brain. Physiol Genomics 28: 311–322, 2007.
75. Liu F, Liang Z, Shi J, Yin D, El-Akkad E, Grundke-Iqbal I, Iqbal K,Gong CX. PKA modulates GSK-3beta- and cdk5-catalyzed phosphory-lation of tau in site- and kinase-specific manners. FEBS Lett 580:6269–6274, 2006.
76. Liu SJ, Zhang JY, Li HL, Fang ZY, Wang Q, Deng HM, Gong CX,Grundke-Iqbal I, Iqbal K, Wang JZ. Tau becomes a more favorablesubstrate for GSK-3 when it is prephosphorylated by PKA in rat brain.J Biol Chem 279: 50078–50088, 2004.
77. Livak KJ, Schmittgen TD. Analysis of relative gene expression datausing real-time quantitative PCR and the 2CTmethod. Methods 25:402–408, 2001.
78. Loessner A, Alavi A, Lewandrowski KU, Mozley D, Souder E, GurRE. Regional cerebral function determined by FDG-PET in healthyvolunteers: normal patterns and changes with age. J Nucl Med 36:1141–1149, 1995.
79. Lu PJ, Wulf G, Zhou XZ, Davies P, Lu KP. The prolyl isomerase Pin1restores the function of Alzheimer-associated phosphorylated tau protein.Nature 399: 784–788, 1999.
80. Luo WJ, Wang H, Li H, Kim BS, Shah S, Lee HJ, Thinakaran G,Kim TW, Yu G, Xu H. PEN-2 and APH-1 coordinately regulateproteolytic processing of presenilin 1. J Biol Chem 278: 7850–7854,2003.
81. Mahley RW. Apolipoprotein E: cholesterol transport protein with ex-panding role in cell biology. Science 240: 622–630, 1988.
82. Mahley RW, Innerarity TL. Lipoprotein receptors and cholesterolhomeostasis. Biochim Biophys Acta 737: 197–222, 1983.
83. Mahley RW, Innerarity TL, Rall SC Jr, Weisgraber KH. Plasmalipoproteins: apolipoprotein structure and function. J Lipid Res 25:1277–1294, 1984.
84. Maiese K, Chong ZZ. Insights into oxidative stress and potential noveltherapeutic targets for Alzheimer disease. Restor Neurol Neurosci 22:87–104, 2004.
85. Marlow L, Canet RM, Haugabook SJ, Hardy JA, Lahiri DK, Sam-bamurti K. APH1, PEN2, and Nicastrin increase Abeta levels andgamma-secretase activity. Biochem Biophys Res Commun 305: 502–509,2003.
86. McKhann G, Drachman D, Folstein M, Katzman R, Price D, StadlanEM. Clinical diagnosis of Alzheimer’s disease: report of the NINCDS-ADRDA Work Group under the auspices of Department of Health andHuman Services Task Force on Alzheimer’s Disease. Neurology 34:939–944, 1984.
87. Mesulam M. Behavioral Neuroanatomy. In: Principles of Behavioraland Cognitive Neurology. Cary, NC: Oxford Univ. Press, 2000, p. 1–120.
88. Metsaars WP, Hauw JJ, van Welsem ME, Duyckaerts C. A gradingsystem of Alzheimer disease lesions in neocortical areas. NeurobiolAging 24: 563–572, 2003.
89. Mielke R, Herholz K, Grond M, Kessler J, Heiss WD. Clinicaldeterioration in probable Alzheimer’s disease correlates with progressivemetabolic impairment of association areas. Dementia 5: 36–41, 1994.
90. Mielke R, Kessler J, Szelies B, Herholz K, Wienhard K, Heiss WD.Normal and pathological aging—findings of positron-emission-tomogra-phy. J Neural Transm 105: 821–837, 1998.
91. Mirra SS, Heyman A, McKeel D, Sumi SM, Crain BJ, Brownlee LM,Vogel FS, Hughes JP, van Belle G, Berg L. The Consortium toEstablish a Registry for Alzheimer’s Disease (CERAD). II. Standardiza-tion of the neuropathologic assessment of Alzheimer’s disease. Neurol-ogy 41: 479–486, 1991.
92. Moeller JR, Ishikawa T, Dhawan V, Spetsieris P, Mandel F, Alex-ander GE, Grady C, Pietrini P, Eidelberg D. The metabolic topogra-phy of normal aging. J Cereb Blood Flow Metab 16: 385–398, 1996.
93. Morris JC, Heyman A, Mohs RC, Hughes JP, van Belle G, Fillen-baum G, Mellits ED, Clark C. The Consortium to Establish a Registryfor Alzheimer’s Disease (CERAD). I. Clinical and neuropsychologicalassessment of Alzheimer’s disease. Neurology 39: 1159–1165, 1989.
94. Mosconi L, De Santi S, Rusinek H, Convit A, de Leon MJ. Magneticresonance and PET studies in the early diagnosis of Alzheimer’s disease.Expert Rev Neurother 4: 831–849, 2004.
95. Murata S, Chiba T, Tanaka K. CHIP: a quality-control E3 ligasecollaborating with molecular chaperones. Int J Biochem Cell Biol 35:572–578, 2003.
96. Murata S, Minami Y, Minami M, Chiba T, Tanaka K. CHIP is achaperone-dependent E3 ligase that ubiquitylates unfolded protein.EMBO Rep 2: 1133–1138, 2001.
97. Nagy Z. The last neuronal division: a unifying hypothesis for thepathogenesis of Alzheimer’s disease. J Cell Mol Med 9: 531–541, 2005.
98. Namba Y, Tomonaga M, Kawasaki H, Otomo E, Ikeda K. Apoli-poprotein E immunoreactivity in cerebral amyloid deposits and neurofi-brillary tangles in Alzheimer’s disease and kuru plaque amyloid inCreutzfeldt-Jakob disease. Brain Res 541: 163–166, 1991.
99. Narita M, Holtzman DM, Schwartz AL, Bu G. Alpha2-macroglobulincomplexes with and mediates the endocytosis of beta-amyloid peptide viacell surface low-density lipoprotein receptor-related protein. J Neuro-chem 69: 1904–1911, 1997.
100. Naruse S, Thinakaran G, Luo JJ, Kusiak JW, Tomita T, Iwatsubo T,Qian X, Ginty DD, Price DL, Borchelt DR, Wong PC, Sisodia SS.Effects of PS1 deficiency on membrane protein trafficking in neurons.Neuron 21: 1213–1221, 1998.
101. O’Brien JT, Desmond P, Ames D, Schweitzer I, Chiu E, Tress B.Temporal lobe magnetic resonance imaging can differentiate Alzhei-mer’s disease from normal ageing, depression, vascular dementia andother causes of cognitive impairment. Psychol Med 27: 1267–1275,1997.
102. Pastorino L, Sun A, Lu PJ, Zhou XZ, Balastik M, Finn G, Wulf G,Lim J, Li SH, Li X, Xia W, Nicholson LK, Lu KP. The prolylisomerase Pin1 regulates amyloid precursor protein processing and amy-loid-beta production. Nature 440: 528–534, 2006.
103. Patrick GN, Zukerberg L, Nikolic M, de la Monte S, Dikkes P, TsaiLH. Conversion of p35 to p25 deregulates Cdk5 activity and promotesneurodegeneration. Nature 402: 615–622, 1999.
104. Pei JJ, Braak E, Braak H, Grundke-Iqbal I, Iqbal K, Winblad B,Cowburn RF. Distribution of active glycogen synthase kinase 3beta(GSK-3beta) in brains staged for Alzheimer disease neurofibrillarychanges. J Neuropathol Exp Neurol 58: 1010–1019, 1999.
105. Pei JJ, Tanaka T, Tung YC, Braak E, Iqbal K, Grundke-Iqbal I.Distribution, levels, and activity of glycogen synthase kinase-3 in theAlzheimer disease brain. J Neuropathol Exp Neurol 56: 70–78, 1997.
254 NEURONAL GENE EXPRESSION IN AD BRAINS
Physiol Genomics • VOL 33 • www.physiolgenomics.org

106. Petrucelli L, Dickson D, Kehoe K, Taylor J, Snyder H, Grover A, DeLucia M, McGowan E, Lewis J, Prihar G, Kim J, Dillmann WH,Browne SE, Hall A, Voellmy R, Tsuboi Y, Dawson TM, Wolozin B,Hardy J, Hutton M. CHIP and Hsp70 regulate tau ubiquitination,degradation and aggregation. Hum Mol Genet 13: 703–714, 2004.
107. Plattner F, Angelo M, Giese KP. The roles of cyclin-dependent kinase5 and glycogen synthase kinase 3 in tau hyperphosphorylation. J BiolChem 281: 25457–25465, 2006.
108. Ramani A, Jensen JH, Helpern JA. Quantitative MR imaging inAlzheimer disease. Radiology 241: 26–44, 2006.
109. Rapoport SI. Positron emission tomography in Alzheimer’s disease inrelation to disease pathogenesis: a critical review. Cerebrovasc BrainMetab Rev 3: 297–335, 1991.
110. Rebeck GW, Harr SD, Strickland DK, Hyman BT. Multiple, diversesenile plaque-associated proteins are ligands of an apolipoprotein Ereceptor, the alpha 2-macroglobulin receptor/low-density-lipoprotein re-ceptor-related protein. Ann Neurol 37: 211–217, 1995.
111. Reich M, Ohm K, Angelo M, Tamayo P, Mesirov JP. GeneCluster 2.0:an advanced toolset for bioarray analysis. Bioinformatics 20: 1797–1798,2004.
112. Rogaeva E, Meng Y, Lee JH, Gu Y, Kawarai T, Zou F, Katayama T,Baldwin CT, Cheng R, Hasegawa H, Chen F, Shibata N, Lunetta KL,Pardossi-Piquard R, Bohm C, Wakutani Y, Cupples LA, CuencoKT, Green RC, Pinessi L, Rainero I, Sorbi S, Bruni A, Duara R,Friedland RP, Inzelberg R, Hampe W, Bujo H, Song YQ, AndersenOM, Willnow TE, Graff-Radford N, Petersen RC, Dickson D, DerSD, Fraser PE, Schmitt-Ulms G, Younkin S, Mayeux R, Farrer LA,St George-Hyslop P. The neuronal sortilin-related receptor SORL1 isgenetically associated with Alzheimer disease. Nat Genet 39: 168–177,2007.
113. Sahara N, Murayama M, Mizoroki T, Urushitani M, Imai Y, Taka-hashi R, Murata S, Tanaka K, Takashima A. In vivo evidence ofCHIP up-regulation attenuating tau aggregation. J Neurochem 94: 1254–1263, 2005.
114. Saito Y, Vandenheede JR, Cohen P. The mechanism by which epider-mal growth factor inhibits glycogen synthase kinase 3 in A431 cells.Biochem J 303: 27–31, 1994.
115. Saunders AM, Strittmatter WJ, Schmechel D, George-Hyslop PH,Pericak-Vance MA, Joo SH, Rosi BL, Gusella JF, Crapper-Ma-cLachlan DR, Alberts MJ. Association of apolipoprotein E alleleepsilon 4 with late-onset familial and sporadic Alzheimer’s disease.Neurology 43: 1467–1472, 1993.
116. Seiffert D, Bradley JD, Rominger CM, Rominger DH, Yang F,Meredith JE Jr, Wang Q, Roach AH, Thompson LA, Spitz SM,Higaki JN, Prakash SR, Combs AP, Copeland RA, Arneric SP,Hartig PR, Robertson DW, Cordell B, Stern AM, Olson RE, ZaczekR. Presenilin-1 and -2 are molecular targets for gamma-secretase inhib-itors. J Biol Chem 275: 34086–34091, 2000.
117. Sengupta A, Wu Q, Grundke-Iqbal I, Iqbal K, Singh TJ. Potentiationof GSK-3-catalyzed Alzheimer-like phosphorylation of human tau bycdk5. Mol Cell Biochem 167: 99–105, 1997.
118. Shaw M, Cohen P, Alessi DR. Further evidence that the inhibition ofglycogen synthase kinase-3beta by IGF-1 is mediated by PDK1/PKB-induced phosphorylation of Ser-9 and not by dephosphorylation ofTyr-216. FEBS Lett 416: 307–311, 1997.
119. Shimura H, Schwartz D, Gygi SP, Kosik KS. CHIP-Hsc70 complexubiquitinates phosphorylated tau and enhances cell survival. J Biol Chem279: 4869–4876, 2004.
120. Silverman DH, Small GW, Chang CY, Lu CS, Kung De Aburto MA,Chen W, Czernin J, Rapoport SI, Pietrini P, Alexander GE, Scha-piro MB, Jagust WJ, Hoffman JM, Welsh-Bohmer KA, Alavi A,Clark CM, Salmon E, de Leon MJ, Mielke R, Cummings JL, KowellAP, Gambhir SS, Hoh CK, Phelps ME. Positron emission tomographyin evaluation of dementia: regional brain metabolism and long-termoutcome. JAMA 286: 2120–2127, 2001.
121. Small GW, Ercoli LM, Silverman DH, Huang SC, Komo S, Bookhei-mer SY, Lavretsky H, Miller K, Siddarth P, Rasgon NL, MazziottaJC, Saxena S, Wu HM, Mega MS, Cummings JL, Saunders AM,Pericak-Vance MA, Roses AD, Barrio JR, Phelps ME. Cerebralmetabolic and cognitive decline in persons at genetic risk for Alzheimer’sdisease. Proc Natl Acad Sci USA 97: 6037–6042, 2000.
122. Small GW, Kepe V, Barrio JR. Seeing is believing: neuroimaging addsto our understanding of cerebral pathology. Curr Opin Psychiatry 19:564–569, 2006.
123. Steiner H, Haass C. Intramembrane proteolysis by presenilins. Nat RevMol Cell Biol 1: 217–224, 2000.
124. Steiner H, Winkler E, Edbauer D, Prokop S, Basset G, Yamasaki A,Kostka M, Haass C. PEN-2 is an integral component of the gamma-secretase complex required for coordinated expression of presenilin andnicastrin. J Biol Chem 277: 39062–39065, 2002.
125. Strittmatter WJ, Saunders AM, Schmechel D, Pericak-Vance M,Enghild J, Salvesen GS, Roses AD. Apolipoprotein E: high-aviditybinding to beta-amyloid and increased frequency of type 4 allele inlate-onset familial Alzheimer disease. Proc Natl Acad Sci USA 90:1977–1981, 1993.
126. Sultana R, Boyd-Kimball D, Poon HF, Cai J, Pierce WM, KleinJB, Markesbery WR, Zhou XZ, Lu KP, Butterfield DA. Oxidativemodification and down-regulation of Pin1 in Alzheimer’s diseasehippocampus: a redox proteomics analysis. Neurobiol Aging 27:918 –925, 2006.
127. Sun X, Wang Y, Qing H, Christensen MA, Liu Y, Zhou W, Tong Y,Xiao C, Huang Y, Zhang S, Liu X, Song W. Distinct transcriptionalregulation and function of the human BACE2 and BACE1 genes. FASEBJ 19: 739–749, 2005.
128. Sutherland C, Leighton IA, Cohen P. Inactivation of glycogen syn-thase kinase-3 beta by phosphorylation: new kinase connections ininsulin and growth-factor signalling. Biochem J 296: 15–19, 1993.
129. Takashima A, Honda T, Yasutake K, Michel G, Murayama O,Murayama M, Ishiguro K, Yamaguchi H. Activation of tau proteinkinase I/glycogen synthase kinase-3beta by amyloid beta peptide (25–35)enhances phosphorylation of tau in hippocampal neurons. Neurosci Res31: 317–323, 1998.
130. Tang MX, Stern Y, Marder K, Bell K, Gurland B, Lantigua R,Andrews H, Feng L, Tycko B, Mayeux R. The APOE-epsilon4 alleleand the risk of Alzheimer disease among African Americans, whites, andHispanics. JAMA 279: 751–755, 1998.
131. Thal DR, Rub U, Orantes M, Braak H. Phases of A beta-deposition inthe human brain and its relevance for the development of AD. Neurology58: 1791–1800, 2002.
132. Town T, Zolton J, Shaffner R, Schnell B, Crescentini R, Wu Y, ZengJ, DelleDonne A, Obregon D, Tan J, Mullan M. p35/Cdk5 pathwaymediates soluble amyloid-beta peptide-induced tau phosphorylation invitro. J Neurosci Res 69: 362–372, 2002.
133. Tsujio I, Tanaka T, Kudo T, Nishikawa T, Shinozaki K, Grundke-Iqbal I, Iqbal K, Takeda M. Inactivation of glycogen synthase kinase-3by protein kinase C delta: implications for regulation of tau phosphory-lation. FEBS Lett 469: 111–117, 2000.
134. Wahle T, Prager K, Raffler N, Haass C, Famulok M, Walter J. GGAproteins regulate retrograde transport of BACE1 from endosomes to thetrans-Golgi network. Mol Cell Neurosci 29: 453–461, 2005.
135. Wahle T, Thal DR, Sastre M, Rentmeister A, Bogdanovic N, Famu-lok M, Heneka MT, Walter J. GGA1 is expressed in the human brainand affects the generation of amyloid beta-peptide. J Neurosci 26:12838–12846, 2006.
136. Working Group. Consensus recommendations for the postmortem di-agnosis of Alzheimer’s disease. The National Institute on Aging, andReagan Institute Working Group on Diagnostic Criteria for the Neuro-pathological Assessment of Alzheimer’s Disease. Neurobiol Aging 18:S1–S2, 1997.
137. Xia W, Zhang J, Kholodenko D, Citron M, Podlisny MB, Teplow DB,Haass C, Seubert P, Koo EH, Selkoe DJ. Enhanced production andoligomerization of the 42-residue amyloid beta-protein by Chinese ham-ster ovary cells stably expressing mutant presenilins. J Biol Chem 272:7977–7982, 1997.
138. Xiao J, Perry G, Troncoso J, Monteiro MJ. Alpha-calcium-calmodu-lin-dependent kinase II is associated with paired helical filaments ofAlzheimer’s disease. J Neuropathol Exp Neurol 55: 954–963, 1996.
139. Xu GG, Deng YQ, Liu SJ, Li HL, Wang JZ. Prolonged Alzheimer-liketau hyperphosphorylation induced by simultaneous inhibition of phos-phoinositol-3 kinase and protein kinase C in N2a cells. Acta BiochimBiophys Sin (Shanghai) 37: 349–354, 2005.
140. Yamaguchi H, Ishiguro K, Uchida T, Takashima A, Lemere CA,Imahori K. Preferential labeling of Alzheimer neurofibrillary tangleswith antisera for tau protein kinase (TPK) I/glycogen synthase kinase-3beta and cyclin-dependent kinase 5, a component of TPK II. ActaNeuropathol (Berl) 92: 232–241, 1996.
141. Yao J, Taylor M, Davey F, Ren Y, Aiton J, Coote P, Fang F, Chen JX,Yan SD, Gunn-Moore FJ. Interaction of amyloid binding alcohol dehy-
255NEURONAL GENE EXPRESSION IN AD BRAINS
Physiol Genomics • VOL 33 • www.physiolgenomics.org

drogenase/Abeta mediates up-regulation of peroxiredoxin II in the brains ofAlzheimer’s disease patients and a transgenic Alzheimer’s disease mousemodel. Mol Cell Neurosci 35: 377–382, 2007.
142. Zheng YL, Kesavapany S, Gravell M, Hamilton RS, Schubert M,Amin N, Albers W, Grant P, Pant HC. A Cdk5 inhibitory peptide reduces tauhyperphosphorylation and apoptosis in neurons. EMBO J 24: 209–220, 2005.
143. Zheng YL, Li BS, Amin ND, Albers W, Pant HC. A peptide derivedfrom cyclin-dependent kinase activator (p35) specifically inhibits Cdk5activity and phosphorylation of tau protein in transfected cells. EurJ Biochem 269: 4427–4434, 2002.
144. Zhu X, Raina AK, Perry G, Smith MA. Alzheimer’s disease: thetwo-hit hypothesis. Lancet Neurol 3: 219–226, 2004.
256 NEURONAL GENE EXPRESSION IN AD BRAINS
Physiol Genomics • VOL 33 • www.physiolgenomics.org


