Embed Size (px)
Citation preview
UNIVERSITÉ DU QUÉBEC À MONTRÉAL
ÉTUDE FONCTIONNELLE DE L'APOLIPOPROTÉINE D HUMAINE
EN SITUATIONS DE STRESS
THÈSE
PRÉSENTÉE
COMME EXIGENCE PARTIELLE
DU DOCTORAT EN BIOLOGIE
PAR
SONIA DO CARMO
JANVIER 2009
UNIVERSITÉ DU QUÉBEC À MONTRÉAL Service des bibliothèques
Avertissement
La diffusion de cette thèse se fait dans le respect des droits de son auteur, qui a signé le formulaire Autorisation de reproduire et de diffuser un travail de recherche de cycles supérieurs (SDU-522 - Rév.01-2006). Cette autorisation stipule que «conformément à l'article 11 du Règlement no 8 des études de cycles supérieurs, [l'auteur] concède à l'Université du Québec à Montréal une licence non exclusive d'utilisation et de publication de la totalité ou d'une partie importante de [son] travail de recherche pour des fins pédagogiques et non commerciales. Plus précisément, [l'auteur] autorise l'Université du Québec à Montréal à reproduire, diffuser, prêter, distribuer ou vendre des copies de [son] travail de recherche à des fins non commerciales sur quelque support que ce soit, y compris l'Internet. Cette licence et cette autorisation n'entraînent pas une renonciation de [la] part [de l'auteur] à [ses] droits moraux ni à [ses] droits de propriété intellectuelle. Sauf entente contraire, [l'auteur] conserve la liberté de diffuser et de commercialiser ou non ce travail dont [il] possède un exemplaire.»
REMERCIEMENTS
J'aimerais d'abord remercier le Dr Éric Rassart qui m'a accueillie dans son
laboratoire pendant toutes ces années, pour sa confiance et son appui. Il m'a aidée à
développer mon esprit scientifique et m'a conseillée à chacune des étapes de mon
doctorat tout en me laissant une grande liberté. Je tiens aussi à remercier tous mes
collègues de travail pour leur amitié, leurs conseils et leurs encouragements. Ils m'ont
aidée à traverser les beaux moments comme les déceptions de la vie de doctorante. Je
tiens à remercier tout spécialement ceux qui ont travaillé avec moi sur le projet
apoD: Louis-Charles Levros avec qui j'ai eu le plaisir de collaborer, Wafa Najyb
avec qui j'ai eu de grandes discussions et Azade Kashani qui m'a offert sa confiance.
Je tiens aussi à remercier les nombreux chercheurs du département des sciences
biologiques et leurs équipes qui ont contribué via leurs idées et l'accès à leur matériel
à la réalisation de ce projet. Je pense plus spécialement à Julie Lafond, Catherine
Mounier, Fathey Sarhan, Benoît Barbeau, Louise Brissette et François Dragon.
J'ai eu également la chance d'avoir d'excellents collaborateurs. Je remercie
Diego Sanchez et Maria D. Ganfornina qui m'ont accueillie dans leur laboratoire
comme dans leur vie privée. Ils m'ont aidée dans mes recherches, m'ont fait
découvrir leur beau coin d'Espagne et sont devenus des amis proches. Je remercie
aussi Pierre Talbot et Hélène Jacomy avec qui ça a été un réel plaisir de travailler. Je
remercie finalement Julie Lafond et Maude Éthier-Chiasson qui m'ont fait découvrir
l'apoD dans un tout nouveau contexte, la grossesse.
Je remercie aussi très fort mes parents, Maria Eugénia Dias et Manuel
Antonio Carmo pour leur amour, leur présence dans les bons comme dans les
mauvais moments, pour leurs conseils, pour leur soutien, ainsi que pour la confiance
qu'ils me portent. Sans vous, rien n'aurait été possible. Un gros merci à mes amis qui
sont restés à mes côtés et qui m'ont écoutée et encouragée alors qu'ils ne

III
comprenaient que très peu mes histoires de cellules et de souris. J'aimerais finalement
remercier Jean-Benoît Charron avec qui je partage non seulement ma vie mais aussi
ma passion de la science. Merci pour ton amour, pour tout ton soutien dans les
moments difficiles, pour ta patience, pour ton aide, et pour ta présence tout
simplement.
TABLE DES MATIÈRES
LISTE DES TABLEAUX Xlll
LISTE DES FIGURES xv
LISTE DES ABRÉVIATIONS
RÉSUMÉ GÉNÉRAL XXII
XVIII
CHAPITRE 1
État des connaissances 1
1.1 Introduction
1.2 Propriétés de l'apoD
1.2.1 Structure du gène et de la protéine
1.2.2 Distribution tissulaire 2
1.2.3 Ligands 5
1.3 Modulation de l'apoD et fonctions associées 6
1.3.1 Croissance et différenciation cellulaire 6
1.3.2 Métabolisme 7
1.3.3 Développement 10
1.3.4 Protection contre Je stress Il
1.3.5 Cancer 12
1.3.6 Système nerveux 14
1.3.6.1 Modèles neurodégénératifs du système périphérique 14
1.3.6.2 Système nerveux central 15
PROBLÉMATIQUE ET OBJECTIFS 23
v
CHAPITRE II
Modulation of apolipoprotein D expression and translocation under specifie stress conditions 25
Avant-propos 26
2.1 Résumé 27
2.2 Abstract 28
2.3 Introduction 29
2.4 Materials and methods 33
2.4.1 Cell culture 33
2.4.2 Stress induction 33
2.4.3 RNA extraction and northern blot analysis 34
2.4.4 TUNEL assay 35
2.4.5 MTS/PMS viability test 35
2.4.6 BrdU incorporation 35
2.4.7 Beta-galactosidase staining of senescent œlls 36
2.4.8 Construction and transfection of apoDh - GFP fusion protein expression vectors 36
2.4.9 Immunocytochemistry and cytochemistry 36
2.4.10 Human apoD promoter-Iuciferase constructs and mutagenesis 37
2.4.11 Luciferase and ~-Galactosidase assays 38
2.4.12 Extraction of total and nuclear proteins 38
2.4.13 Immunoblotting 39
2.4.14 Statistical analysis 40
2.5 Results 41
2.5.1 ApoD expression in response to cellular stress 41
2.5.2 ApoD expression under oxidative stress correlates with decreased œil proliferation 42
2.5.3 ApoD expression is associated with pro-inflammatory stimuli 43
2.5.4 ApoD expression is associated with specific elements in the promoter 44
VI
2.5.5 ApoD protein localization is altered by serum starvation and LPS treatment 46
2.5.6 Exogenous apoD enters cells and affects cellular status 48
2.5.7 Nuclear apoD is derived from secreted protein 49
2.6 Discussion 51
2.7 Acknowledgments 57
2.8 Figure legends 59
CHAPITRE III
Human apolipoprotein D overexpression in transgenic mice induces insulin resistance and alters lipid metabolism 72
Avant-propos 73
3.1 Résumé 74
3.2 Abstract 75
3.3 Introduction 76
3.4 Materia1s and methods 79
3.4.1 AnimaIs 79
3.4.2 Generation ofH-apoD transgenic mice 79
3.4.3 Southern blot ana1ysis 80
3.4.4 RNA extraction, northern blot analysis and semi-quantitative RT-PCR 80
3.4.5Immunoblotting 81
3.4.6 Blood analysis 81
3.4.7 Competitive ELISA 82
3.4.8 Liver lipid content 82
3.4.9 TBARS assay 83
3.4.10 Histology 83
3.4.11 Intraperitonea1 glucose and insulin tolerance tests 83
3.4.12 In vivo hepatic VLDL-trigJyceride production 84
3.4.13 Statistical analysis 84
VII
3.5 Results 85
3.5.1 Generation of H-apoD transgenic mice 85
3.5.2 Expression of human apoD in H-apoD Tg mice 85
3.5.3 H-apoD overexpression has an effect on morphometric, serum and hematological parameters 87
3.5.4 H-apoD Tg mice show glucose intolerance and insulin resistance 88
3.5.5 H-apoD Tg mice develop hepatic steatosis 88
3.5.6 Mechanisms of insulin resistance and steatosis 89
3.6 Discussion 91
3.7 Acknowledgments 96
3.8 Figure legends 101
CHAPITRE IV
Apolipoprotein D is involved in the mechanisms regulating protection [rom oxidative stress 111
Avant-propos 112
4.1 Résumé 114
4.2 Abstract 115
4.3 Introduction 116
4.4 Results and discussion 117
4.4.1 ApoD alters locomotor activity and learning abilities in young adult animais 117
4.4.2 Resistance to experimentally induced oxidative stress is undermined in the absence of ApoD and increased by the over-expression of human ApoD 119
4.4.3 ApoD expression is induced in the brain upon experimental oxidative stress 120
4.4.4 ApoD controls the levels of brain lipid peroxidation under normal conditions 121
4.4.5 ApoD is able to prevent the lipid peroxidation increase upon oxidative insult 123
Vlll
4.4.6 Lipocalins as part of the oxidative stress response system 124
4.4.7 Functional significance of ApoD: its influence on normal and pathological nervous system decline upon aging 126
4.S Experimental procedures 127
4.S.1 Animais 127
4.S.2 Targeted disruption of the mouse ApoD gene 127
4.S.3 Generation of human ApoD transgenic mouse 128
4.S.4 RNA extraction and northern blot analysis 128
4.S.S Protein extraction and western blot analysis 129
4.S.6 Behavioral analyses 129
4.S.7 Oxidative stress toxicity by paraquat 131
4.S.8 Lipid and protein oxidation assays 132
4.S.8.1 TBARS assay 132
4.S.8.2 Protein carbonylation-ELISA assay 132
4.6 Acknowledgements 133
4.7 Figure legends 134
4.8 Supplementary online material 141
4.8.1 Supplementary results 141
4.8.1.1 General features of ApoD-KO and HApoD-Tg mice 141
4.8.1.2 Compensation by other lipoca1ins 141
4.8.1.3 Nervous system cellular architecture in ApoD-KO mice 141
4.8.1.4 Behavioral tests 142
4.8.2 Supplementary figure 1egends 143
CHAPITRE V
Neuroprotective effect of Apolipoprotein D against human coronavirus OC43-induced encephalitis in mice 148
Avant-propos 149
S.l Résumé lS1
IX
5.2 Abstract 152
5.3 Introduction 153
5.4 Materials and methods 155
5.4.1 Mice 155
5.4.2 Virus and inoculations 155
5.4.3 Survival curves 156
5.4.4 Infectious virus assays 156
5.4.5 RNA extraction and Northern blot analysis 156
5.4.6 Protein extraction and Western blot ana1ysis 157
5.4.7 Immunohistochemistry 157
5.4.8 Flow cytometry 158
5.4.9 Total PLA2 activity 158
5.4.10 Cytokine quantification 159
5.4.11 Statistical analyses 159
5.5 Results 160
5.5.1 Clinical status of mice following HCoV-OC43 infection 160
5.5.2 ApoD is induced in the CNS of HCoV-OC43- infected mice 160
5.5.3 ApoD induction correlates with virus load and astrocytic and microglial activation 161
5.5.4 Transgenic mice expressing H-apoD are more resistant to acute encephalitis 161
5.5.5 H-apoD increases infection-induced CNS glial activation 162
5.5.6 Phospholipase A2 activity during infection 163
5.5.7 H-apoD reduces T-cell infiltration into the CNS 164
5.5.8 H-apoD reduces inflammatory cytokine and chemokine production 164
5.6 Discussion 166
5.7 Acknowledgments 171
5.8 Figure legends 173
5.9 Supplemental material 181
x
CHAPITRE VI
Conclusions et perspectives 183
6.1 Conclusions générales 183
6.2 Perspectives 188
6.2.1 Implication dans les processus cellulaires 188
6.2.1.1 L'apoO comme modulateur cellulaire 188
6.2.1.2 Identification de son récepteur et de ses interacteurs protéiques 189
6.2.1.3 Fonction nucléaire 191
6.2.2 Études métaboliques 194
6.2.2.1 Métabolisme du glucose et des lipides 194
6.2.2.2 Métabolisme en conditions adipogéniques 197
6.2.2.3 Contrôle neuronal du métabolisme 198
6.2.2.4 Inversion du phénotype 199
6.2.3 Mécanismes de protection 200
6.2.3.1 Interaction avec la membrane cellulaire 200
6.2.3.2 Propriétés anti-oxydantes 202
6.2.3.3 Propriétés anti-inflammatoires 204
6.2.3.4 Activation de la glie 206
6.2.3.5 Transport de facteurs nutritifs et régulateurs 208
6.2.4 Études comportementales 210
ANNEXE 1
Autre contribution-section d'un chapitre de livre
Apolipoprotein D 211
A 1.1 Résumé 212
A 1.2 Abstract 213
A 1.3 Introduction 214
Xl
A lA Modulation of apoD levels 214
A lA.l Cellular growth and differentiation 214
A1A.2 Metabolic studies and energy homeostasis 215
A 1A.3 Development 216
A lA A Cancer 217
A lA.5 Nervous system 219
A lA.5.l Peripheral nervous system 219
A 1.4.5.2 Central nervous system 219
A 1.5 Conclusion 223
ANNEXE II
Autre contribution-article en préparation
Modulation of Apolipoprotein D in pregnancy and association with pre-pregnancy body mass index and gestational weight gain 224
Avant-propos 225
A2.l Résumé 227
A2.2 Abstract 228
A2.3 Introduction 229
A2A Materials and methods 232
A2A.l Population 232
A2A.2 Population classification 232
A2A.3 Blood and tissue samples 233
A2AA Plasma biochemistry 233
A2A.5 RNA isolation and quantitative Real-Time PCR (qRT-PCR) 234
A2A.6 Statistical analyses 235
A2.5 Results 236
A2.5.l Population characteristics 236
A2.5.2 Plasma ApoD levels decrease during pregnancy 236
A2.5.3 Influence of prepregnancy BMI and GWG on plasma
XII
ApoD levels 237
A2.SA Association between plasma ApoD levels and pregnancy parameters 237
A2.S.S ApoD and cholesterol 240
A2.S.6 ApoD transcription in placenta 241
A2.S.7 Postpartum plasma ApoD levels 241
A2.6 Discussion 242
A2.7 Figure legends 255
ANNEXE III
Résultats supplémentaires non-publiés
Survie des souris Thy-l/ApoD et NSE/ApoD 259
A3.1 Résultats 260
A3.2 Légende des figures 261
ANNEXE IV
Résultats supplémentaires non-publiés
Caractérisation des souris NFLIApoD 263
A4.1 Résultats 264
A4.2 Légende des figures 269
ANNEXE V
Résultats supplémentaires non-publiés
Réponse des souris ApoD-KO à l'infection par HCoV-OC43 275
AS.l Résultats 276
AS.2 Légende des figures 277
RÉFÉRENCES 279
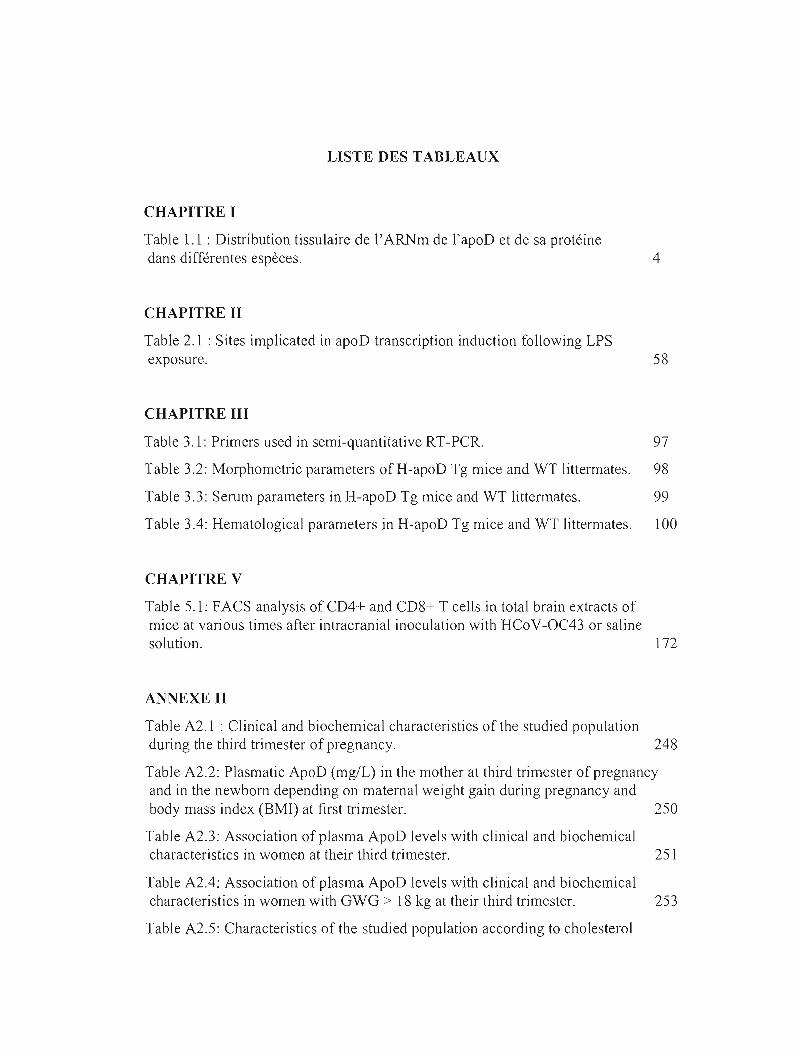
LISTE DES TABLEAUX
CHAPITRE 1
Table 1.1 : Distribution tissulaire de l'ARNm de l'apoD et de sa protéine dans différentes espèces. 4
CHAPITRE II
Table 2.1 : Sites implicated in apoD transcription induction following LPS exposure. 58
CHAPITRE III
Table 3.1: Primers used in semi-quantitative RT-PCR. 97
Table 3.2: Morphometric parameters of H-apoD Tg mice and WT littermates. 98
Table 3.3: Serum parameters in H-apoD Tg mice and WT littermates. 99
Table 3.4: Hematological parameters in H-apoD Tg mice and WT littermates. 100
CHAPITRE V
Table 5.1: FACS analysis of CD4+ and CD8+ T cells in total brain extracts of mice at various times after intracranial inoculation with HCoV-OC43 or saline solution. 172
ANNEXE II
Table A2.1 : Clinical and biochemical characteristics of the studied population during the third trimester of pregnancy. 248
Table A2.2: Plasmatic ApoD (mg/L) in the mother at third trirnester of pregnancy and in the newborn depending on maternai weight gain during pregnancy and body mass index (BMI) at first trimester. 250
Table A2.3: Association of plasma ApoD levels with clinical and biochemical characteristics in women at their third trimester. 251
Table A2.4: Association of plasma ApoD levels with clinical and biochemical characteristics in women with GWG > 18 kg at their third trimester. 253
Table A2.5: Characteristics of the studied population according to cholesterol
XlV
levels during third trimester and association with plasma ApoD levels. 254
ANNEXE IV
Table A4.1 : Paramètres morphométriques des souris NFL/ApoD. 266
Table A4.2 : Paramètres sanguins des souris NFL/ApoD. 267
Table A4.3 : Paramètres hématologiques des souris NFL/ApoD. 268
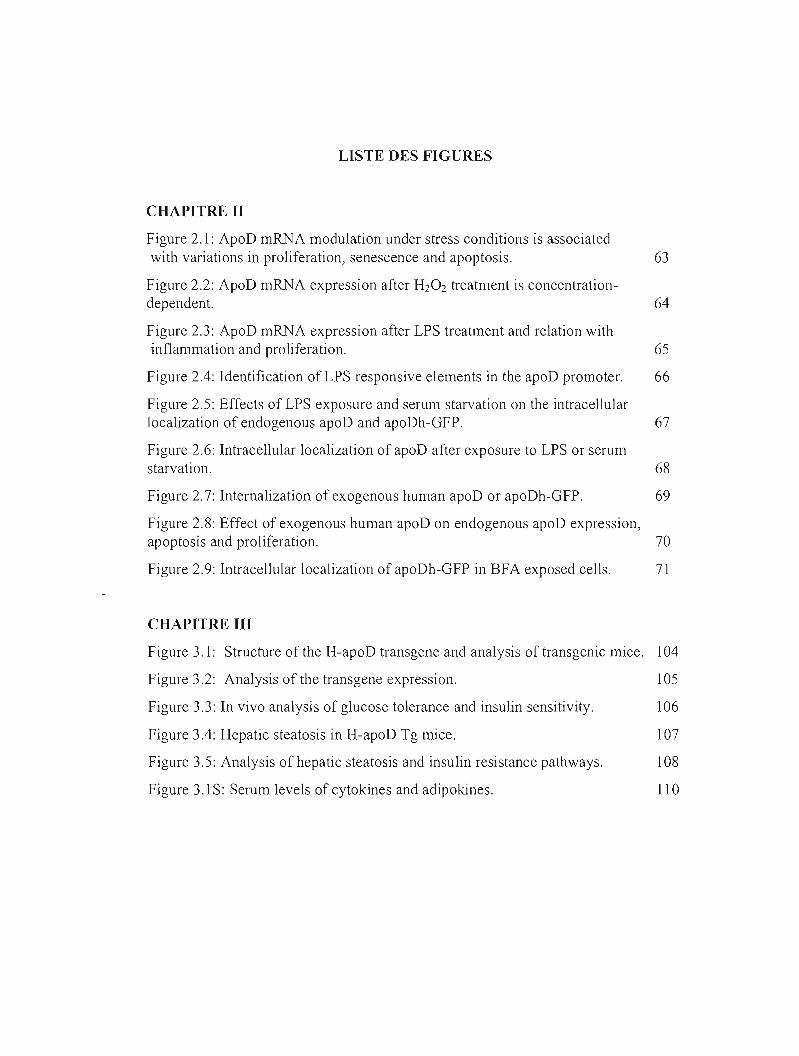
LISTE DES FIGURES
CHAPITRE II
Figure 2.1: ApoD mRNA modulation under stress conditions is associated with variations in proliferation, senescence and apoptosis. 63
Figure 2.2: ApoD mRNA expression after H20 2 treatment is concentration-
Figure 2.3: ApoD mRJ\JA expression after LPS treatment and relation with
dependent. 64
inflammation and proliferation. 65
Figure 2.5: Effects of LPS exposure and serum starvation on the intracellular
Figure 2.6: Intracellular localization of apoD after exposure to LPS or serum
Figure 2.8: Effect of exogenous human apoD on endogenous apoD expression,
Figure 2.4: Identification of LPS responsive elements in the apoD promoter. 66
localization of endogenous apoD and apoDh-GFP. 67
starvation. 68
Figure 2.7: Internalization of exogenous human apoD or apoDh-GFP. 69
apoptosis and proliferation. 70
Figure 2.9: Intracellular localization ofapoDh-GFP in BFA exposed cells. 71
CHAPITRE III
Figure 3.1: Structure of the H-apoD transgene and analysis oftransgenic mice. 104
Figure 3.2: Analysis of the transgene expression. 105
Figure 3.3: In vivo analysis of glucose tolerance and insulin sensitivity. 106
Figure 3.4: Hepatic steatosis in H-apoD Tg mice. 107
Figure 3.5: Analysis of hepatic steatosis and insu1in resistance pathways. 108
Figure 3.1S: Serum 1evels of cytokines and adipokines. 110
XVI
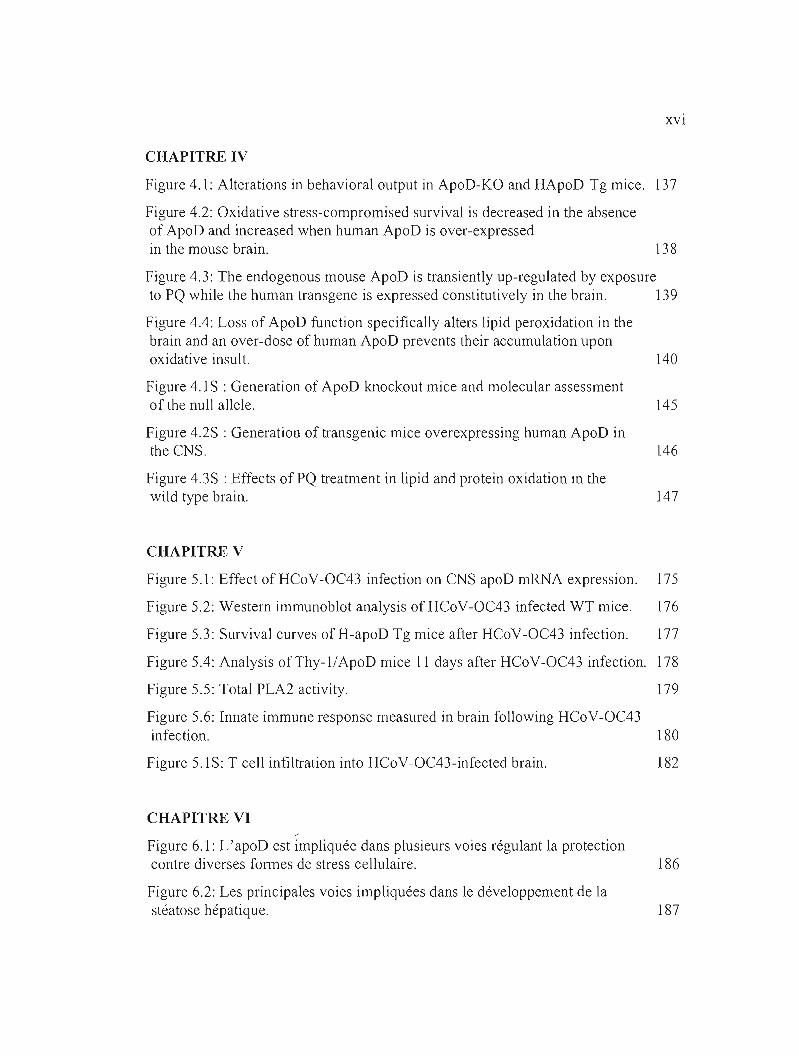
CHAPITRE IY
Figure 4.1: Alterations in behavioral output in ApoD-KO and HApoD-Tg mice. 137
Figure 4.2: Oxidative stress-compromised survival is decreased in the absence of ApoD and increased when human ApoD is over-expressed in the mouse brain. 138
Figure 4.3: The endogenous mouse ApoD is transiently up-regulated by exposure to PQ while the human transgene is expressed constitutively in the brain. 139
Figure 4.4: Loss of ApoD function specifically alters lipid peroxidation in the brain and an over-dose of human ApoD prevents their accumulation upon oxidative insult. 140
Figure 4.1 S : Generation of ApoD knockout mice and molecular assessment of the null allele. 145
Figure 4.2S : Generation of transgenic mice overexpressing human ApoD in the CNS. 146
Figure 4.3S : Effects of PQ treatment in lipid and protein oxidation in the wild type brain. 147
CHAPITRE Y
Figure 5.1: Effect of HCoV-OC43 infection on CNS apoD mRNA expression. 175
Figure 5.2: Western immunoblot analysis of HCoV-OC43 infected WT mice. 176
Figure 5.3: Survival curves of H-apoD Tg mice after HCoV -OC43 infection. 177
Figure 5.4: Analysis of Thy-l/ApoD mice 11 days after HCoV-OC43 infection. 178
Figure 5.5: Total PLA2 activity. 179
Figure 5.6: Innate immune response measured in brain following HCoV-OC43 infection. 180
Figure 5.1S: T cell infiltration into HCoV-OC43-infected brain. 182
CHAPITRE YI /
Figure 6.1: L'apoD est impliquée dans plusieurs voies régulant la protection contre diverses formes de stress cellulaire. 186
Figure 6.2: Les principales voies impliquées dans le développement de la stéatose hépatique. 187
XVll
ANNEXE II
Figure A2.1: Plasmatic ApoD levels during pregnancy. 256
Figure A2.2: Expression of apoD mRNA in placenta according to the pre-pregnancy BMI and gestational WG. 257
Figure A2.3: The effect of breast- and bottle-feeding on plasmatic ApoD levels. 258
ANNEXE III
Figure A3.1: Courbes de survie Kaplan-Meier des souris H-apoD Tg. 262
ANNEXE IV
Figure A4.1: Structure et expression du transgène NFLIApoD. 271
Figure A4.2: Courbes de survie Kaplan-Meier des souris NFLIApoD. 272
Figure A4.3: Analyse in vivo de la tolérance au glucose et de la sensibilité à l'insuline. 273
Figure A4.4: Stéatose hépatique chez les souris NFLIApoD. 274
ANNEXE V
Figure A5.1: Analyse du cerveau de souris ApoD-KO suite à l'infection par HCoV-OC43. 278
AA
ABTS
ADN
ADNc
AP
ApoD
ApoE
APRE
ARNm
AtTIL
BBB
bFGF
BMI
BrdU
BSA
C/EBP
CETP
CNS
COX
CSF
DMEM
DPI
DPN
EDTA
ELISA
ERE
LISTE DES ABRÉVIATIüNS
acide arachidonique
2,2'-azino-bis(3-ethylbenzthiazoline-6-sulphonic acid)
acide désoxyribonucléique
acide désoxyribonucléique complémentaire
activating protein
apolipoprotéine D
apolipoprotéine E
acute phase responsive element
acide ribonucléique messager
Arabidopsis thaliana temperature-induced lipocalin
blood-brain barrier
basic fibroblast growth factor
body mass index
5-bromo-2-deoxyuridine
bovine serum albumin
CCAAT/ enhancer binding protein
cholesteryl ester transfer protein
central nervous system
cycloxygenase
cerebrospinal fluid
Dulbecco's modified Eagle's medium
days post-infection
days post-natal
acide éthylène-diamine-tétraacétique
enzyme-linked immunosorbent assay
estrogen response element
XIX
ERK 112 extracellular signal-regulated kinase-1I2
FAS fatty acid synthase
FlTC fiuorescein isothiocyanate
FSE fat response element
GAPDH glyceraldehyde 3-phosphate dehydrogenase
GCOFP-24 gross cystic disease protein-24 kDa
GFAP glial fibrillary acidic protein
GFP green fluorescent protein
GLaz glial Lazarillo
GLUT glucose transporter
GMCSF granulocyte-macrophage colony-stimulating factor
GRE glucocorticoid response element
GST glutathione S-transferase
GWG gestationla weight gain
H-apoO human apoO, apoO humaine
HCoV-OC43 human coronavirus OC43
HOL high density lipoprotein
HPLC high performance liquid chromatography
HPRT hypoxanthine-guanine phosphoribosyltransferase
HRP horseradish peroxidase
HSV-1 herpes simplex virus
lC intra-cérébral
IFNy interféron gamma
IL interleukine
!PGTT intraperitoneal glucose tolerance test
IRS insulin receptor substrate
ITT insulin tolerance test
KO knock-out
LCAT lécithine cholestérol acyltransférase
xx
LDL low density lipoprotein
LFABP liver fatty acid-binding protein
LPS lipopolysaccharide
LXR liver X receptor
M-apoD mouse apoD, apoD murine
MCP-l monocyte chemoattractant protein 1
MEM minimum essential medium
MMP matrix metalloproteinase
MOPS acide 3-(N-Morpholino)propanesulfonique
MRE metal response element
MTS/PMS 3-(4,5-dimethylthiazol-2-y1)-5-(3-carboxymethoxyphenyl)-2-(4
sulfophenyl)-2H-tetrazolium/ phenazine methosulfate
NF-kB nuclear factor kappa B
NFL neurofilament light chain
NFT neurofibrillary tangles
NLS nuclear localization signal
NMDA N-méthyl-D-aspartate
NPC Niemarm-Pick de type C
NPY/AGRP neuropeptide Y/Agouti related peptide
NSE neuron specifie enolase
PBS phosphate buffered saline
PCR polymerase chain reaction
PDGF platelet derived growth factor
PE phycoerythrin
PKC protein kinase C
PLA2 phospholipase A2
POMC/CART pro-opiomelanocortinJ cocaine- and amphetamine-regulated transcript
PPAR peroxisome proliferator-activated receptor
PQ paraquat
XXI
PRE
PVOF
RAR
ROS
SOR
SOS-PAGE
SNC
SNP
SREBP
STAT
STRE
TBARS
Tg
TGF~
TNFa
TRE
TUNEL
UV
VLOL
VSMC
WT
progesterone response element
polyvinylidene difluoride
retinoic acid receptor
reactive oxygen species
sterol dependent repressor
sodium dodecyl sulfate-polyacrylamide gel electrophoresis
système nerveux central
système nerveux périphérique
sterol regulatory element binding proteins
signal transducers and activators of transcription
stress response element
thiobarbituric acid reactive substances
transgénique
transforming growth factor beta
tumor necrosis factor alpha
thyroid-hormone response element
terminal deoxynucleotidyl transferase biotin-dUTP nick end labeling
ultra-violet
very low density lipoprotein
vascular smooth muscle ce1ls
wild-type
RÉSUMÉ GÉNÉRAL
L'apolipoprotéine D (apoD) est une glycoprotéine sécrétée dont l'expression est modulée dans une multitude de situations incluant les cancers de différents tissus, les désordres métaboliques et les maladies neurodégénératives. Bien que la liste des conditions présentant une augmentation de l'apoD s'allonge chaque jour, les facteurs provoquant le déclenchement de son expression, de même que la fonction de celle-ci, restent inconnus. Les travaux présentés dans cette thèse ont permis de jeter un peu de lumière sur ces deux aspects. Dans un premier temps, ces travaux ont permis de déterminer que l' apoD est une protéine de stress spécifique et que son expression est déclenchée par des stress ayant une forte composante oxydante ou inflammatoire. Cependant, alors que l'expression de l'apoD en réponse au stress oxydatif est associée à un arrêt de croissance, en condition inflammatoire, elle est accompagnée d'une stimulation de la prolifération. De plus, ces stress modifient non seulement le niveau d'expression, mais aussi la localisation intracellulaire de l'apoD. L'apoD, qui est normalement sécrétée, est réinternalisée et s'accumule dans le cytoplasme et le noyau. L'entrée de l'apoD dans la cellule influence, de plus, la prolifération cellulaire. Ces travaux ont ensuite permis de mieux cerner le rôle de cette modulation de l'apoD en situations de stress chez l'animal. Pour cela, nous avons soumis des souris surexprimant l'apoD humaine dans leur système nerveux ou n'exprimant pas l'apoD à des conditions neurodégénératives. Nous avons ainsi établi que l'apoD serait impliquée dans les mécanismes régulant la protection contre diverses atteintes neurodégénératives, incluant le stress oxydatif et l'inflammation, favorisant donc la survie suite à ces atteintes. Ainsi, l'apoD joue un rôle dans la fonction neuronale basale tel que déterminé grâce à des tests comportementaux. De plus, l'apoD limite la peroxydation lipidique lors de l'exposition au paraquat, un générateur de stress oxydatif. De façon similaire, l' apoD contrôle la production de cytokines et de phospholipase A2, réduit l'infiltration de cellules T et induit l'activation gliale en réponse à l'infection par le coronavirus humain OC43, un modèle d'inflammation aiguë. Par ailleurs, la surexpression de l'apoD humaine chez la souris favorise l'accumulation de lipides dans le foie et les muscles, favorisant ainsi le développement de la résistance à l'insuline accompagnant souvent le vieillissement physiologique. Cette accumulation de lipides a été associée à une stimulation de gènes impliqués dans la synthèse d'acides gras. Les travaux présentés dans cette thèse contribuent donc à établir l'apoD comme un facteur bénéfique favorisant la survie suite à une atteinte cellulaire. Ils suggèrent aussi l'importance de contrôler les niveaux physiologiques de l'apoD afin de maintenir l'homéostasie métabolique.
Mots-clés: apolipoprotéine D, arrêt de croissance, inflammation, lipocaline, résistance à l'insuline, stress oxydatif.
CHAPITRE 1
État des connaissances
1.1 Introduction
L'apolipoprotéine 0 (apoO) est une glycoprotéine de 29 kDa d'abord trouvée
associée aux lipoprotéines de haute densité (HOL) dans le plasma humain. C'est une
apolipoprotéine atypique qui, selon les caractéristiques de sa struchJre primaire,
appartient à la famille des lipocalines. Les lipocalines sont une famille de petites
protéines conservées au cours de l'évolution et impliquées dans plusieurs processus
physiologiques. Ces protéines ont en commun une struchJre tertiaire en forme de
barillet ~ leur permettant de lier et de transporter des petites molécules hydrophobes.
Parmi les ligands connus de l'apoO, on retrouve entre autres l'acide arachidonique,
les stéroïdes, la bilirubine et le cholestérol.
1.2 Propriétés de l'apoD
1.2.1 Structure du gène et de la protéine
L'analyse du promoteur humain de l'apoO a révélé la présence de plusieurs
éléments potentiels de régulation. Parmi ceux-ci, on retrouve des éléments de réponse
aux hormones stéroïdes, aux acides gras, au sérum et à la phase aiguë (Do Carmo et
aI. 2002, Lambert et aI. 1993). La diversité de ces éléments de régulation reflète la
complexité de la régulation de l'expression de l'apoO humaine. Par ailleurs, la région
codante du gène de l'apoO contient 3 régions consensus et un modèle d'exons
commun à tous les membres des lipocalines (Provost et aI. 1990). Le gène humain est
divisé en 5 exons et les 815 pb d'ARNm sont distribués sur plus de 12 kpb de
génome. Le premier exon est non-codant. L'AONc prédit une protéine mahJre de 169
2
acides aminés précédée d'un peptide signal de 20 acides aminés (Drayna et al. 1987).
L'apoD a une structure tertiaire en forme de barillet ~ ouvert à son sommet et fermé à
sa base, typique des lipocalines (Peitsch et Boguski 1990). Cette structure lui permet
de transporter de petites molécules hydrophobes. Trois des 4 boucles de l'extrémité
ouverte du barillet exposent des chaînes hydrophobes, ce qui est inhabituel chez une
lipocaline. Cette particularité est sans doute responsable de l'insertion de l'apoD dans
la phase lipidique des HDL. Cette région comporte aussi une cystéine libre qui peut
stabiliser l'association de l'apoD aux HDL via la formation de ponts disulfure avec
d'autres molécules présentes dans les HDL comme l'apoA-II (Eichinger et al. 2007,
Yang et al. 1994).
1.2.2 Distribution tissulaire
Jusqu'à présent, l'apoD a été caractérisée chez cinq espèces mammifères et
détectée chez le singe, le cochon et le poulet. La vaste distribution de l'expression de
l'apoD reflète probablement son importance et son rôle de protéine
multifonctionnelle. De plus, la découverte du gène de l'apoD aviaire, de même que
des analyses phylogénétiques et la présence de séquences similaires à l'apoD chez les
poissons et les céphalocordés suggèrent son importance évolutive dans la lignée des
cordés (Ganfornina et al. 2005). De proches homologues ont également été trouvés
dans la membrane externe de la bactérie Escherichia coli (Bishop et al. 1995), chez la
drosophile (Sanchez et al. 2006, Walker et al. 2006), la chenille Hyphantria cunea
(Kim et al. 2005), l'amphioxus (Wang et al. 2007) et chez les plantes (Frenette
Charron et al. 2002)
Chez l'humain, l'apoD est faiblement exprimée dans te foie et l'intestin qui
sont les sites majeurs de synthèse des autres apolipoprotéines. Elle est, par contre,
hautement exprimée dans les glandes surrénales, les reins, le pancréas, le placenta, la
3
rate, les poumons, les ovaires, les testicules, le cerveau et les nerfs périphériques
(Borghini et al. 1995, Orayna et al. 1986, Rassart et al. non publié). Chez le singe
(Smith et al. 1990), le lapin (Provost et al. 1990a, Provost et al. 1991 b) et le cobaye
(Provost et al. 1995), la distribution de l'apoO est similaire à celle retrouvée chez
l'humain (Orayna et al. 1986). Cependant, chez la souris (Cofer et Ross 1996, Séguin
et al. 1995, Yoshida et al. 1996) et le rat (Boy les et al. 1990b), la distribution
tissulaire de l'ARNm de l'apoO est différente avec une expression largement
restreinte au système nerveux central (SNC) où elle est observée dans la moelle
épinière, le cervelet et le cerveau (Table 1.1). Cependant, des analyses
immunohistochimiques ont démontré la présence de cellules contenant des niveaux
substantiels d'apoO dans pratiquement tous les organes (Boyles et al. 1990b). L'apoO
aviaire est quant à elle préférentiellement associée aux lipoprotéines plasmatiques,
mais est aussi présente dans l'oocyte en croissance rapide. Il a donc été suggéré
qu'elle joue un rôle dans le transport et/ou la mobilisation des lipides et des
molécules régulatrices durant l'embryogenèse chez les espèces ovipares (Vieira et al.
1995, Yao et Vieira 2002).
4
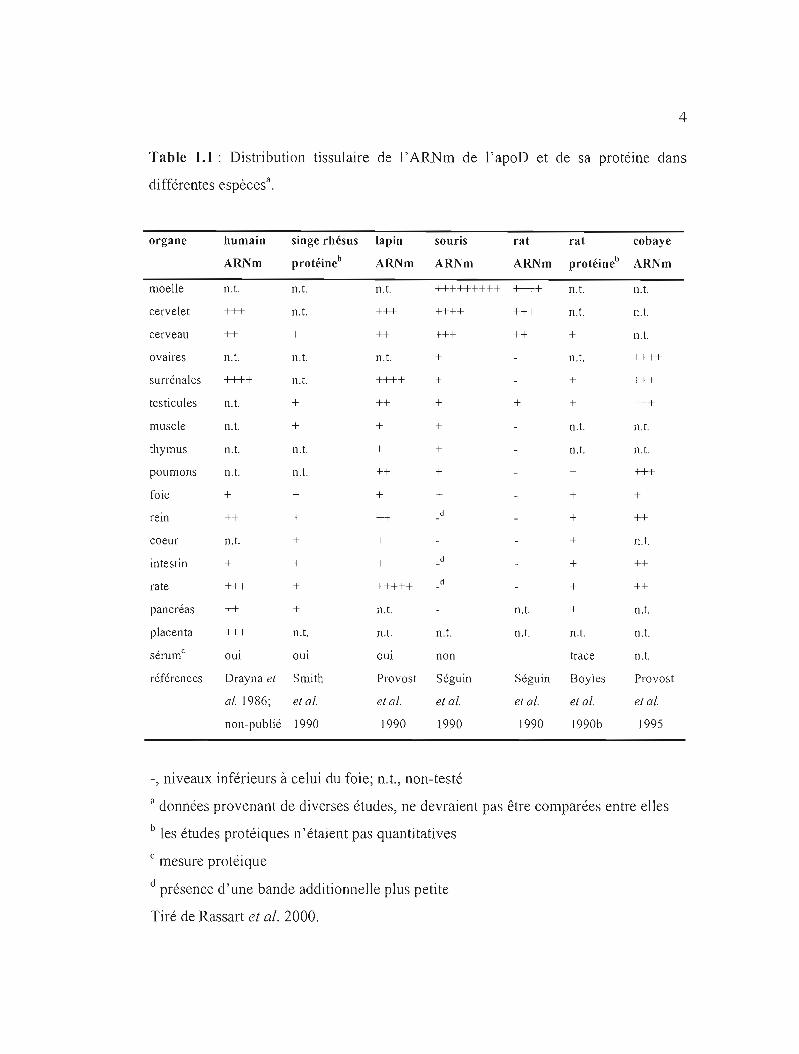
Table 1.1 : Distribution tissulaire de l'ARNm de l'apoD et de sa protéine dans
différentes espècesa.
organe humain singe rhésus lapin souris rat rat cobaye
ARl'lm protéineb ARNm ARNm ARNm protéineb ARNm
moelle n.t. n.t. n.t. +++++++++ ++++ n.t. n.t.
cervelet +++ n.t. +++ ++++ +++ n.t. n.t.
cerveau ++ + ++ +++ ++ + n.t.
ovaires n.t. n.t. n.t. + n.t. ++++
surrénales ++++ n.t. ++++ + + +++
testicules n.t. + ++ + + + +++
muscle n.t. + + + n.t. n.t.
thymus n.t. n.t. + + n.t. n.t.
poumons n.t. n.t. ++ + + +++
foie + + + + + +
rem ++ + ++ + ++
coeur n.t. + + + n.t.
intestin + + + d + ++
rate +++ + +++++ + ++
pancréas ++ + n.t. n.t. + n.t.
placenta +++ n.t. n.t. n.t. n.t. n.t. n.t. • csel1.lm oui oui oui non trace n.t.
références Drayna el Smith Provost Séguin Séguin Boyles Provost
al. 1986; el al. el al. el al. el al. el al. et al.
non-publié 1990 1990 1990 1990 1990b 1995
-, niveaux inférieurs à celui du foie; n.t., non-testé
a données provenant de diverses études, ne devraient pas être comparées entre elles
b les études protéiques n'étaient pas quantitatives
mesure protéique
d présence d'une bande additionnelle plus petite
Tiré de Rassart et al. 2000.
C
5
1.2.3 Ligands
Lorsque identifiée comme la composante majeure (30 mg/ml) des fluides
kystiques mammaires, l'apoD (GCDFP-24) a d'abord été caractérisée par sa capacité
à lier la progestérone (Ka de 2.5 x 10⁶ molll) et la prégnénolone (Ka de 1.32 x 10⁶
molli), avec une très forte affinité (Balbin et al. 1990, Lea 1988, Pearlman et al.
1973). Le Ka relatif de l' apoD pour diverses classes de stéroïdes est: prégnénolone >
progestérone> pregnanolone > pregnandione > androgènes> oestrogènes (Dilley et
al. 1990, Simard et al. 1991).
De plus, à cause de son association avec la LCAT (lécithine cholestérol
acyltransférase), le cholestérol et ses esters ont longtemps été considérés comme les
principaux ligands de l'apoD (Drayna et al. 1986). Ainsi, l'apoD pourrait être
impliquée dans le transfert des esters de cholestérol aux lipoprotéines accepteuses
(Fielding et Fielding 1980, Francone et al. 1989) et dans le transport réverse du
cholestérol des tissus périphériques vers le foie pour son catabolisme (Kostner et al.
1988, Spreyer et al. 1990). La modélisation moléculaire suggère toutefois que les
composés dérivés de 1'hème, comme la bili11lbine, sont des ligands plus probables
que les dérivés du cholestérol (Peitsch et Boguski 1990). Il a en effet été confirmé
que l'affinité des HDL pour la bilirubine résulte de la liaison de celle-ci à l'apoD avec
un ratio bilirubine:apoD de 0.8: 1 (Goessling et Zucker 2000). Néanmoins, l'acide
arachidonique est le ligand présentant la plus haute affinité pour l'apoD (Ka de 1.6 x
108 molli). Ceci suggère un rôle pour l'apoD dans la mobilisation de l'acide
arachidonique, et donc dans la synthèse des prostaglandines. L'apoD pourrait
également transporter l'acide arachidonique prévenant ainsi sa conversion en esters
de cholestérol (Morais Cabral et al. 1995). La composante odorante des sécrétions
axillaires, l'acide E-3-méthyl-2-héxénoïque (E-3M2H), est aussi transportée à la
surface de la peau liée à l'apoD (Zeng et al. 1996). Il est possible que le ligand
associé à l'apoD varie dépendamment des conditions ou du site d'expression lui
6
permettant ainsi d'exercer différentes fonctions. De plus, des études détaillées de
liaison par ti tration de fluorescence effectuées sur des préparations d' apoD
biochimiquement homogènes ont révélé que l'apoD peut discriminer des composés
très semblables (Vogt et Skerra 2001).
1.3 Modulation de l'apoD et fonctions associées
La régulation de l'expression de l'apoD est très complexe et plusieurs auteurs
ont démontré l'importance de facteurs biologiques dans la modulation de cette
protéine.
1.3.1 Croissance et différenciation cellulaire
Il semble exister une relation inverse entre l'expression de l'apoD et la
prolifération cellulaire. Par exemple, des études sur des cultures cellulaires primaires
et immortalisées ont montré que l'arrêt de croissance provoqué par déprivation de
sérum, confluence ou sénescence, induit l'expression de l'apoD (Do Carmo et al.
2002, Provost et al. 1991a). Au niveau du promoteur, les éléments responsables de
cette induction ont été identifiés comme étant les SRE (serum response elements) et
un APP (alternating purine-pyrimidine stretch) (Do Carmo et al. 2002). De façon
similaire, dans des lignées cellulaires de cancer du sein ou de la prostate, la sécrétion
de l'apoD est inhibée par les oestrogènes, stimulée par les androgènes et est
inversement corrélée avec la prolifération cellulaire (Simard et al. 1990, Simard et al.
1991, Simard et al. 1992). De plus, l'exposition de cellules de cancer du sein à
l'interleukin-la diminue la prolifération cellulaire basale de même que celle induite
par l'exposition aux oestrogènes. Parallèlement, elle stimule l'expression basale
d'apoD et celle induite par les androgènes et les glucocorticoïdes (Blais et al. 1994).
Tous ces effets peuvent être contrecarrés par l'ajout d'interleukine-6 aux cellules
(Blais et al. 1995). Finalement, l'apoD supprime de façon sélective la réponse
7
proliférative des cellules musculaires vasculaires aux facteurs de croissance par un
mécanisme relié à la translocation nucléaire de ERKl/2 (Sarjeant el al. 2003).
Cependant, l'expression de l'apoD peut également être reliée à la période de
différenciation qui suit un aITêt prolifératif. En effet, l'addition d'acide rétinoïque
(Lopez-Boado el al. 1994) ou de 1,25-dihydroxyvitamine D3 (Lopez-Boado el al.
1997), deux substances bien connues pour leurs propriétés différenciatives, peuvent
induire l'expression d'apoD dans des cellules de cancer mammaire. Ultérieurement, il
a été démontré que l'induction d'apoD est médiée par les récepteurs nucléaires à
l'acide rétinoïque (RAR) menant à une inhibition significative de la prolifération
cellulaire. Ainsi, l'apoD pourrait être un marqueur biochimique de différenciation et
d'arrêt de prolifération médiés par RAR dans les cellules cancéreuses (Lopez-Boado
el al. 1996).
Ces études suggèrent donc que l'expression de l'apoD pourrait être modulée
directement ou indirectement par des changements dans la prolifération ou la
différenciation cellulaires. Il existe également des preuves in vivo d'une telle
corrélation. Ainsi, dans la prostate, l'apoD est principalement présente dans les
cellules glandulaires épithéliales. Cette localisation peut être associée à l'état non
prolifératif ou différentié de ces cellules (Aspinall el al. 1995). Cependant, la relation
entre la sécrétion de l'apoD et la prolifération cellulaire semble complexe et peut ne
pas être respectée dans toutes les situations.
1.3.2 Métabolisme
L'apoD est également impliquée dans plusieurs aspects du métabolisme
lipidique. Des polymorphismes dans le gène de l'apoD affectent le niveau de lipides
dans le plasma (Desai el al. 2002) et peuvent être utilisés comme marqueurs
génétiques pour l'obésité, l'hyperinsulinémie et le diabète non-insu lino-dépendant ou
8
diabète de type 2 (Baker et al. 1994, Vijayaraghavan et al. 1994). De plus, l'apoD
pourrait participer dans le transfert de lipides et le transport inverse du cholestérol en
liant directement le cholestérol (Patel et al. 1997) ou via la formation de complexes
avec l' apoA-I, la LCAT (leci thin-cholesterol acy1transferase) et le CETP (cholestery1
ester transfer protein) dans les fractions de HDL (Spreyer et a1.1990, Steyrer et
Kostner 1988). L'apoD a aussi été documentée comme un gène répondant au LXR
(liver X receptor) (Hummasti et al. 2004) et pourrait jouer un rôle important dans
l'équilibre entre la lipogenèse et la lipolyse dans les adipocytes (Bujalska et al. 2006,
Zhang et al. 2007) en transportant des ligands pour LXR ou PPAR ou en participant
au transport inverse du cholestérol dépendant de LXR (Hummasti et al. 2004).
À cause de sa capacité à lier l'acide arachidonique, l'apoD contribuerait aussi
au métabolisme des phospholipides membranaires en stabilisant le niveau d'acide
arachidonique dans les membranes cellulaires (Thomas et al. 2003d, Yao et al. 2005).
Conformément à ceci, le cerveau de souris déficientes en apoD (apoD-KO) présente
une composition en gras différente. Ainsi, leur cerveau a un plus petit ratio
cholestéroVphospholipides totaux, mais une plus grande concentration d'acide
docosahexaénoïque, d'acide linoléïque et de certains acides gras saturés
comparativement aux souris de type sauvage (Thomas et al. 2007). L'implication
dans la redistribution de lipides après des lésions nerveuses périphériques a également
été suggérée (Boy1es et al. 1990a).
Elle jouerait également un rôle dans le contrôle de l'homéostasie énergétique.
Dans l'hypothalamus, l'apoD interagit spécifiquement avec la portion cytoplasmique
de la forme longue du récepteur de la leptine Ob-Rb reconnu pour son implication
dans le contrôle de la satiété et de la prise de poids. De plus, le niveau
hypothalamique de l'ARNm de l'apoD est stimulé par le contenu en gras de
l'alimentation et est fortement et positivement corrélé avec la masse adipeuse
corporelle et les niveaux circulants de leptine. Cette corrélation avec l'adiposité
9
corporelle est cependant perdue chez les souns obèses ob-/ob- et db-/db-, qUI
possèdent des niveaux réduits d'apoD lorsque comparées avec les souris de type
sauvage. Ceci suggère que l'apoD hypothalamique est impliquée dans les voies de
signalisation du récepteur Ob-Rb de la leptine qui contrôle l'accumulation de gras
lors d'une diète riche en gras (Liu et al. 2001).
Il n'est donc pas surprenant qu'une modu'lation de l'apoD soit trouvée dans
des conditions présentant un défaut du métabolisme lipidique ou dans des conditions
menant à l'accumulation de lipides, Parmi celles-ci, on retrouve la maladie de
Tangier ou déficit familial en HDL (Alaupovic et al. 1981), le déficit familial en
LCAT (Albers et al. 1985), les mutations dans le gène de l'apoA-I (Deeb et al. 1991),
le diabète de type 2 (Hansen et al. 2004), l'alcoolisme (Lewohl et al. 2000, Saito et
al. 2002) et les modèles animaux de la maladie de Niemann-Pick de type C (Yoshida
et al. 1996). L'association de l' apoD avec ces maladies peut être directement reliée à
l'accumulation de lipides. Elle peut également être reliée à des phénomènes entourant
l'accumulation de lipides tels que l'activation des voies inflammatoires et pro
angiogéniques (Hummasti et al. 2004) qui modifient le métabolisme de l'acide
arachidonique, le stress oxydatif ou la réponse à l'insuline. En effet, dans toutes ces
maladies, on constate une résistance à l'insuline.
Des études ont démontré que la résistance à l'insuline est un prédicteur
puissant de plusieurs maladies incluant l'accident vasculaire cérébral, le diabète de
type 2, les maladies cardiovasculaires, l'hypertension et même le cancer (Facchini et
al. 2001). La résistance à l'insuline est une diminution de l'effet biologique de
l'insuline au niveau des tissus cibles tels que le muscle et le tissu adipeux. Elle résulte
de défauts au niveau des récepteurs spécifiques à l'insuline ou des voies de
signalisation intracellulaires répondant à l'insuline. Ces défauts inhibent la
translocation des vésicules contenant le transporteur spécifique au glucose Glut-4
vers la surface cellulaire et donc l'entrée de glucose dans la cellule et son utilisation
la
subséquente dans les voies produisant de l'énergie. Ceci provoque une accumulation
de glucose dans le sang au lieu de son absorption par les cellules. Comme le taux de
glucose sanguin reste élevé, le pancréas continue à produire de plus en plus
d'insuline, ce qui provoque une hyperinsulinémie, laquelle peut entraîner des
conséquences graves sur la santé. Lorsque le pancréas n'est plus en mesure de
produire la quantité d'insuline nécessaire pour contrôler le niveau de glucose sanguin,
il y a apparition de diabète de type 2 non-insulinodépendant (Petersen et Shulman
2006).
1.3.3 Développement
L'apoD est également modulée durant la gestation et le développement fœtal,
avec des niveaux d'expression plus bas chez le fœtus que chez l'adulte (Provost et al.
1995). L'apoD est surexprimée dans l'endomètre humain dans la fenêtre de
réceptivité utérine à l'implantation embryonnaire qui recouvre les jours 20-24 du
cycle menstruel (Kao et al. 2002) et est hautement exprimée dans le placenta (Drayna
et al. 1986). Son expression est augmentée dans les trompes de Fallope et les ovaires
de cobayes gestantes versus les non-gestantes (Provost et al. 1995) mais est diminuée
dans la glande mammaire allaitante (Cofer et Ross 1996). Cependant, on retrouve de
l'apoD dans le lait et le colustrum humains (Palmer et al. 2006). Chez la souris,
l'apoD est sélectivement modulée du jour E9 à la naissance dans le mésenchyme et le
neuroépithelium (Sanchez et al. 2002). Dans le cerveau de rat, durant le
développement et durant la période néonatale précoce, l'induction de l'expression du
gène de l'apoD est reliée à la maturation et coïncide avec la période de myélination
active et la synaptogenèse (Gng et al. 1999).
L'apoD est également présente dans le vitellus de l'ovocyte en croIssance
rapide. D'abord associée au transport et la mobilisation des lipides durant
l'embryogenèse chez les espèces ovipares (Vieira et al. 1995), il est plus probable
11
qu'elle transporte des molécules régulatrices telles que la vitamine A et les hormones
thyroïdes (Yao et Vieira 2002). Chez le fœtus de poulet, l'apoD est exprimée dans les
dérivés de l'ectoderme tels que les follicules de plumes et le système nerveux.
Cependant, bien que retrouvée dans les neurones et la glie, l'apoD n'a pas été
retrouvée dans les péricytes ni dans les méninges en développement tel que décrit
chez la souris. 11 a été suggéré que l'ancêtre commun des oiseaux et des mammifères
exprimait l'apoD à la fois dans les dérivés mesenchymateux et neuroectodermiques.
Cette distribution a possiblement changé lors de la séparation évolutive entre les
oiseaux et les mammifères, restreignant l'expression de l'apoD de poulet aux dérivés
neuroectodermiques. (Ganfornina et al. 2005).
1.3.4 Protection contre le stress
L'homologue de l'apoO chez la drosophile GLaz (Glial Lazarillo) a été
démontré comme augmentant la résistance au stress. Son absence réduit la résistance
au stress oxydatif et au manque de nourriture et diminue la durée de vie. Elle
provoque aussi une réduction des lipides ce qui cause une diminution de la masse
corporelle et affecte le comportement. Ces effets ont été corrélés avec une
augmentation de la mort ,neuronale et de la quantité de lipides peroxydés (Sanchez et
al. 2006). L'effet inverse a été observé chez la drosophile surexprimant GLaz ou
l'apoD humaine avec une augmentation de la résistance au stress oxydatif et de la
longévité (Muffat et al. 2008, Walker et al. 2006).
L'homologue de l'apoO chez la plante, AtTIL, démontre un rôle semblable.
Les plantes déficientes en AtTIL sont très sensibles aux conditions oxydantes comme
les variations de température ou le traitement au paraquat. Dans le même ordre
d'idées, des plantes cultivées à la noirceur meurent peu de temps après leur transfert à
la lumière. La complémentation de ces plantes avec l' ADNc de AtTIL rétablit le
phénotype normal. De plus, la surexpression de AtTIL augmente la tolérance au
12
stress causé par le gel, la lumière, le traitement au paraquat et retarde le dévelopement
normal de la plante notamment en perturbant les mécanismes de floraison et de
sénescence. La différence de réponse des plantes en fonction de l'expression de
AtTIL est expliquée par la modification de gènes impliqués dans la balance
énergétique et la réponse au stress oxydatif tel que révélé par des analyses par micro
puces à ADN (Charron et al. 2008).
1.3.5 Cancer
Une modulation de l'apoO est présente dans plusieurs cancers. L'apoD est
surexprimée dans les carcinomes du sein, des ovaires, de l'endomètre, de la prostate,
de la rétine, de la peau, du pancréas, et du système nerveux central. Par contre, elle
est réprimée dans les oncocytomes thyroïdiens (Baris et al. 2004) et le cancer
colorectal (Ogawa et al. 2005). Il a été proposé que l'apoD soit un gène suppresseur
de tumeurs. Ainsi, dans les carcinomes des cellules squameuses de l'oesophage, le
gène de l'apoD est inactivé par méthylation et a été identifié comme un candidat de la
suppression tumorale. L'ajout d'apoD à des cellules en culture a aussi démontré sa
puissante activité suppresseur de croissance (Yamashita et al. 2002). Le rôle
suppresseur de tumeur de l'apoD a également été démontré dans le cancer du sein. Ce
rôle provient de la capacité de l'apoD à interagir avec et à inhiber 1'ostéopontine, un
gène important dans la formation de tumeurs et de métastases (Jin et al. 2006).
Cependant, la relation entre le degré de différenciation tumorale et
l'expression de l'apoD reste ambiguë. Ainsi, dans les cancers du sein, du foie et du
système nerveux central, la haute expression de l'apoD est principalement corrélée
avec des carcinomes hautement différenciés non-invasifs, non-métastatiques et est
associée à une diminution des chances de réapparition du cancer et une meilleure
survie. De la même façon, l'expression de l'apoD est diminuée dans le cancer
colorectal et cette diminution est associée à un stade tumoral avancé et métastatique
13
et un mauvais pronostic (Ogawa el al. 2005). La présence d'apoD dans ces tumeurs
peut donc être une conséquence de l'arrêt de croissance cellulaire due à la
différenciation (Diez-Itza el al. 1994, Hunter el al. 2002, Lamelas el al. 2000, Porter
el al. 2003, Serra Diaz el al. 1999). Un contrôle est également exercé au niveau de la
transcription, indépendamment ou non de l'arrêt de croissance. Ainsi, le gène de
l'apoD est faiblement méthylé dans les tumeurs bien différenciées comparativement
aux tumeurs peu différenciées (Utsunomiya el al. 2005).
Par ailleurs, une présence élevée d'apoD est associée à des cancers invasifs de
la prostate (Ashida el al. 2004, Aspinall el al. L995, Hall el al. 2004, Zhang el al.
1998), de la peau et du pancréas et peut donc être un facteur pronostique d'évolution
défavorable (Iacobuzio-Donahue el al. 2002b, Miranda el al. 2003, Ryu el al. 200 L,
West el al. 2004). Dans d'autres cancers tels que les carcinomes de l'ovaire et de
l'endomètre et les rétinoblastomes, il n 'y a pas de relation significative entre
l'immunocoloration de l'apoD et l'âge, le stade ni le degré histologique de la tumeur
(Alvarez el al. 2004, Rojo el al. 200 l, Vazquez el al. 2000). Ceci suggère l'activation
de voies de signalisation différentes de celles qui sont impliquées dans la progression
de la carcinogénèse. Ainsi, suite à la transformation maligne dans ces types de
cancers, la relation inverse entre l'apoD et la prolifération cellulaire semble perdue,
favorisant l'augmentation simultanée de l'expression de l'apoD et de la croissance
tumorale. 11 reste cependant à déterminer si ceci est relié à une augmentation du taux
de prolifération cellulaire ou à la diminution de la mort cellulaire (Hall el al. 2004).
De plus, l'activité protéase de l'apoD (Kesner el al. 1988), son implication dans la
mobilité cellulaire en réponse à des facteurs de croissance (Leung el al. 2004) et son
association avec la progression vers un stade tumoral plus différencié suggèrent un
rôle pour l'apoD dans la capacité invasive d'une tumeur et pourrait expliquer
pourquoI les cellules cancéreuses exprimant l'apoD pourraient avoir un
comportement plus agressif (Alvarez el al. 2003). Il reste cependant à déterminer si
14
l'expression de l' apoD est une cause ou une conséquence de ces transformations
cellulaires.
Cependant, il Y a également des contradictions dans le même type de cancer.
D'autres études portant sur le cancer du sein et de la prostate démontrent que
l'expression de cette protéine n'est pas significativement associée au degré de
différenciation tumorale mais montre une relation avec la survie du patient
(Rodriguez el al. 2000, Selim el al. 2001). La modulation de l'apoO dans les cancers
dépend également de l'échantillon analysé. Par exemple, dans le sein et la prostate, la
protéine sécrétée est présente à la fois dans les fluides issus de tumeurs bénignes et
malignes. Ainsi, les niveaux d'apoD ne sont pas significativement corrélés avec la
présence de ·cancer (Alexander el al. 2004, Clements el al. 1999). L'utilité de cette
protéine comme facteur pronostique est donc incertaine, mais il a été proposé qu'elle
pourrait être utile dans le choix et le suivi des thérapies hormonales utilisées pour
prévenir ou traiter le cancer du sein (Hall el al. 1996, Harding el al. 2000, Weber
Chappuis et al. 1996). En particulier, des différences dans l'expression de l'apoD
entre les cancers mammaires mâles et femelles, le demier ayant un plus grand niveau
d'expression de l' apoO et de meilleures chances de rémission, ouvre la voie à des
thérapies hormonales plus sélectives qui ne devraient pas seulement tenir compte de
l'état des récepteurs d'oestrogènes mais aussi d'androgènes (Serra el al. 2000).
1.3.6 Système nerveux
1.3.6.1 Modèles neurodégénératifs du système périphérique
Chez le rat et la souris, l'apoD est normalement produite par les astrocytes et
les oligodendrocytes dans le système nerveux central et par les cellules du
neurilemme ou fibroblastiques (telles que les cellules de Schwann) dans le système
nerveux périphérique (Boyles et al. 1990a, Pate1 el al. 1995). Puisque le tissu nerveux
15
périphérique est capable de synthèse locale de quelques apolipoprotéines comme
l'apoD et l'apoE, il est probable qu'il possède son propre système de lipoprotéines
servant de véhicule pour le mouvement lipidique entre les cellules et pour le maintien
de 1'homéostasie du cholestérol (Borghini et al. 1995). Ce système de transport
lipidique serait plus actif dans les nerfs périphériques endommagés dans lesquels une
quantité massive de lipides est libérée lors de la dégradation de la myéline, stockée
puis réutilisée durant la régénération. Ainsi, seules de petites quantités d' ARN m
d'apoD sont détectées dans le nerf mature de rat. Ces niveaux augmentent
modérément dans des nerfs tranchés dont la régénération est rendl,le impossible par la
ligature de ces nerfs. Par contre, dans des nerfs écrasés en régénération, les niveaux
d'ARNm et de protéine de l'apoD augmentent transitoirement de 40- et de 500-fois
respectivement au moment où les axones du cal proximal croissent dans le segment
nerveux distal (Boyles et al. 1990a, Spreyer et al. 1990). Une augmentation d'apoD a
aussi été constatée dans les nerfs sciatiques en régénération de deux autres espèces, le
lapin et le singe marmouset (Boyles et al. 1990a). L'augmentation de l'apoD dans les
sites en régénération après une lésion par écrasement du nerf sciatique suggère que
l'apoD ait un rôle dans la régénération des nerfs périphériques et peut-être dans le
maintien et la réparation du système nerveux (Bayles et al. 1990b). Ainsi, l'apoD
pourrait prévenir l'accumulation locale de molécules toxiques, comme la bilirubine,
produites par les nerfs endommagés. Elle pourrait également participer au trafic de
lipides nécessaire à la régénération nerveuse, soit le transport de lipides de l'axone
endommagé vers les cellules de Schwann et les macrophages puis, durant la phase de
régénération, l'apport de lipides à partir de ces cellules vers les membranes
nouvellement synthétisées.
1.3.6.2 Système nerveux central
Chez l'humain, dans des conditions normales, l'apoD est présente
principalement dans le cytosol et dans la membrane externe de l'enveloppe nucléaire
16
des cellules gliales de la matière blanche. Dans la matière grise, l'apoD est présente
dans quelques neurones dispersés et dans les astrocytes protoplasmiques. L'apoD est
également associée au cytosol des cellules périvasculaires et le lysosome des
péricytes dans les parois des vaisseaux sanguins suggérant un rôle de l'apoD dans le
transport de stérols et de petites molécules hydrophobes de, ou vers, les vaisseaux
sanguins du néocortex (Hu et al. 2001, Navarro et al. 1998, Navarro et al. 2004).
L'utilisation d'une approche de criblage différentiel a également permis d'identifier
l'apoD comme un gène spécifique à la myéline et aux oligodendrocytes pouvant jouer
un rôle dans la synthèse et dans la formation de feuillets de myéline dans la moelle
épinière de rat (Schaeren-Wiemers et al. 1995).
L'apoD peut être impliquée dans l'estérification du cholestérol ou d'autres
stéroïdes par son association avec la LCAT (lécithine-cholestérol acétyltransférase)
que l'on sait présente dans le système nerveux central (SNC). (Demeester et al.
2000). Deux ligands putatifs de l'apoD, la progestérone et la prégnénolone, sont
synthétisés par les astrocytes et les oligodendrocytes dans le SNC, types cellulaires
exprimant aussi l'apoD (Patel et al. 1995). La prégnénolone s'accumule aussi sous
forme de sulfate de prégnénolone dans le cerveau et les nerfs sciatiques d'humain et
de rat (Hu et al. 1987). L'apoD pourrait donc jouer un rôle dans le transport local de
ces hormones et participer aux processus de réinnervation. Les récepteurs stéroïdes
modulent la formation et le contrôle de la connectivité synaptique. Plus
spécifiquement, des récepteurs à l'oestrogène et à la progestérone sont trouvés dans
l 'hippocampe et leur expression est induite par les oestrogènes. Puisque les
oestrogènes modulent l'expression de l'apoD dans certaines situations et que l'apoD
lie probablement la progestérone, il pourrait y avoir interaction entre ces différents
éléments (McEwen 1994).
Chez l'humain, l'augmentation de la protéine et de l'ARNm d'apoD dans le
cortex cérébral âgé est probablement due à l'augmentation du nombre d'astrocytes
17
réactifs et totaux (Belloir et al. 2001, dei Valle et al. 2003, Kalman et al. 2000). Les
dépôts d'apoD apparaissent d'abord en position périnuc1éaire puis s'étendent à
l'ensemble du cytoplasme et aux processus cellulaires alors que la coloration d'apoD
s'intensifie (dei Valle et al. 2003). Une telle relation entre l'expression de l'apoD et
l'activation de la microglie est aussi rapportée chez les souris déficientes en cystatine
B, un modèle animal de la maladie de Unverricht-Lundborg qui est caractérisée par
une dysfonction neurologique progressive et par des crises épileptiques (Lieuallen et
al. 2001). De la même façon, alors qu'une augmentation de l'apoD est un phénomène
normal dans le cerveau vieillissant, des super-augmentations telles que constatées
dans les souris PDAPP âgées peut représenter une réponse gliale compensatoire à
l'accumulation de bêta-amyloïde. Les souris PDAPP, un modèle de la maladie
d'Alzheimer, expriment une forme mutée de la protéine précurseur d'amyloïde
humain sous le contrôle du promoteur du facteur de croissance dérivé des plaquettes
(PDGF). Ces souris présentent les dépôts de bêta-amyloïde caractéristiques de la
maladie d'Alzheimer (Thomas et al. 200Ic).
Plusieurs des polymorphismes d'apoD trouvés peuvent moduler le risque de
développer la maladie d'Alzheimer dans certains groupes ethniques (Desai et al.
2003, Helisalmi et al. 2004). L'augmentation de l'apoD, dans la maladie
d'Alzheimer, est corrélée avec le stade Braak de dégénération (Glockner et Ohm
2003), mais est indépendant des concentrations protéiques d'apoE (Terrisse et al.
1998). De plus, l'induction de l'apoD est corrélée avec le génotype d'apoE dans
l 'hippocampe et le liquide céphalorachidien (Terrisse et al. 1998, Glockner et Ohm
2003), mais pas dans le cortex préfrontal (Thomas et al. 2003e). Cette association
différentielle avec le génotype d'apoE peut être expliquée par la progression de la
maladie. Le cortex entorhinal et temporal de même que l'hippocampe sont les
premières régions à accumuler les enchevêtrements neurofibrillaires (NFT) (Belloir et
al. 2001, Kalman et al. 2000), alors que les lésions du cortex préfrontal, une région de
grand intérêt puisque impliquée dans les fonctions cognitives, ne sont observées que
18
tard dans la maladie (Thomas et al. 2003e). Ainsi, au début de la maladie,
l'augmentation de l'apoD en présence d'un allèle E4 est interprétée comme un
mécanisme compensatoire et pourrait indiquer une ré innervation en cours plutôt que
des dommages ou la mort cellulaire. Cependant, cette corrélation est perdue dans la
progression de la maladie où l'expression de l' apoD serait sous le contrôle de
mécanismes différents (Belloir et al. 2001, Kalman et al. 2000, Thomas et al. 2003e).
Il a été observé que l'augmentation d'apoD correspond au nombre d'enchevêtrements
fibrillaires mais pas avec celui de plaques séniles (Glockner et Ohm 2003). De plus,
alors que l'apoE est toujours localisée au coeur de la plaque amyloïde, l'apoD se situe
préférentiellement autour et près de l'amyloïde (Navarro, et al. 2003). Plus
récemment, l'apoD a été trouvée associée à un sous-groupe particulier de plaques
amyloïdes. Dans ces plaques, les cellules immunoréactives pour l'apoD ont été
identifiées comme étant de la microglie (Desai et al. 2005). La colocalisation de
l'apoD et des enchevêtrements neurofibrillaires dans le même neurone est rare et il a
été proposé que l'apoD soit présente dans les neurones en situation de stress avant
l'accumulation de NFT et que lorsque les NFT se forment, la transcription de l'apoD
est déjà altérée (Belloir et al. 2001).
Chez les patients atteints de schizophrénie, la concentration plasmatique
d'apoD décroît significativement. Ceci est en accord avec de récentes hypothèses qui
associent la schizophrénie avec des problèmes au niveau de la signalisation et du
métabolisme des lipides. Cependant, chez les patients schizophrènes et bipolaires, les
niveaux d'apoD sont significativement et sélectivement augmentés selon la région
cérébrale permettant ainsi de distinguer entre les deux maladies (Thomas et al.
2003b). L'augmentation de l'apoD dans les régions cérébrales impliquées dans
chacune de ces pathologies suggère une réponse compensatoire localisée que les
traitements neuroleptiques peuvent augmenter (Thomas et al. 2001 b). En effet, des
niveaux élevés d'apoD ont été trouvés dans le cerveau post-mortem et le plasma de
patients schizophrènes de même que dans les cerveaux de rats suite au traitement
19
chronique avec des antipsychotiques atypiques dont la clozapine (Thomas et al.
200la, Khan et al. 2003, Thomas et al. 2003c). Cette augmentation était encore plus
marquée chez les patients chroniques traités avec la clozapine comparativement à des
patients contrôles et à des patients à leur premier épisode psychotique (Mahadik et al.
2002). L'augmentation d'apoD telle qu'induite par les médicaments neuroleptiques
peut donc être bénéfique aux patients psychiatriques. Des études dans des cultures de
cellules suggèrent que l'apoD lie et stabilise les niveaux d'acide arachidonique aux
phospholipides de la membrane des globules rouges. Des déficiences en acide
arachidonique, un ligand préférentiel de l' apoD, ont été constatées chez les patients
atteints de schizophrénie (Thomas et al. 2003d, Yao et al. 2005).
Une modulation de l'apoD est aussi présente dans d'autres désordres de
l'homéostasie des lipides. La maladie de Niemann-Pick de type C (NPC) est une
maladie génétique impliquant des anomalies de transport intracellulaire du
cholestérol, aboutissant à une accumulation de cholestérol non estérifié dans les
compartiments endosomal tardif et Iysosomal. La souris NPC, un modèle d'étude de
cette maladie, présente des anomalies au niveau du métabolisme de l'apoD. Ses
niveaux plasmatiques d'apoD sont augmentés de 6 fois et des niveaux élevés d'apoO
sont également constatés dans le cerveau, le tissu adipeux, le cœur, le thymus et dans
les astrocytes en culture (Suresh et al. 1998, Yoshida et al. 1996). Plus
spécifiquement, des cellules fortement immunomarquées en apoD sont retrouvées
dans les régions cérébrales précédemment identifiées comme démontrant les
changements neurodégénératifs les plus importants (Ong et al. 1999, Ong et al.
2002). Or, l'apoD est un transporteur de cholestérol. Le cholestérol est important pour
la synthèse, l'assemblage et le maintien de la myéline. L'altération de son
métabolisme est associée à la dégénérescence neurofibrillaire dans les maladies
d'Alzheimer et de Niemann-Pick de type C (Ohm et al. 2003). Ainsi, la séquestration
de l'apoD pourrait expliquer à la fois la déficience en myéline et les défauts de
transport du cholestérol caractérisant cette dernière. L'apoD semble donc impliquée
20
dans la neurodégénescence sélective observée dans cette maladie génétique (Kolodny
2000, Suresh et al. 1998).
Chez les souris déficientes en apoE, une perte de connexions synaptiques a été
observée durant la réinnervation comparativement aux contrôles (Masliah et al.
1995). Puisque l'apoE semble essentielle dans les processus de réinnervation dans le
SNC, l'induction de l'apoD chez les souris déficientes en apoE (Terrisse et al. 1999)
représenterait un mécanisme compensatoire ou un indicateur de neuropathologie.
L'apoD est également augmentée dans le fluide céphalorachidien de patients
atteints de: la méningo-encéphalite, l'accident vasculaire cérébral, la maladie des
neurones moteurs, la démence (Terrisse et al. 1998), la maladie de Niemann-Pick
(Suresh et al. 1998), la polyneuropathie démyélinisante inflammatoire chronique, le
syndrome de Guillain-Barré, la sclérose en plaques (Reindl et al. 2001), la
xanthomatose cérébrotendineuse (Salen et al. 1987) et l'hydrocéphalie à pression
normale idiopathique (Li et al. 2006). L'apoD a également été proposée comme gène
candidat pour le glaucome (Tomarev et al. 2003). Plus récemment, l'apoD a été
trouvée augmentée dans le cerveau de patients atteints de la maladie de Parkinson et
cette augmentation a été associée à une augmentation de la production d'apoD par les
cellules gliales (Ordofiez et al. 2006). Elle augmente également dans le cortex
préfrontal de gens atteints d'alcoolisme ou de tabagisme chroniques (Flatscher-Bader
et Wilce 2006).
Par ailleurs, la transcription de l'apoD est induite dans le système nerveux de
souns suite à l'infection virale avec les virus HSV-l (Kang et al. 2003), de
l'encéphalite japonaise, rabies, sindbis (Saha et Rangarajan 2003) et scrapie (Dandoy
Dron et al. 1998). 11 a été proposé que l'augmentation de l'expression de cette
protéine soit corrélée avec la synthèse accrue de d'autres molécules de transport et
avec la réponse au stress observée pendant la maladie.
21
Tel que dit précédemment, l'apoD est normalement produite par les astrocytes
et les oligodendrocytes. Cependant, suite à une atteinte cérébrale aiguë chez les
rongeurs, son expression est augmentée dans les astrocytes et est aussi retrouvée dans
les neurones. C'est le cas par exemple, dans l'hippocampe de rat suite à l'injection
d'acide kainique (Montpied et al. 1999, Ong et al. 1997) ou à la lésion du cortex
entorhinal (TelTisse et al. 1999). L'induction de l'apoD a également été notée dans le
cortex et l 'hippocampe de rat du côté ipsilatéral suite à un traumatisme crânien (Franz
et al. 1999). Les traitements chroniques avec le MK-801, un antagoniste non
compétitif du récepteur au glutamate NMDA, induisent aussi une induction de l'apoD
et des défauts d'apprentissage chroniques chez le rat, tel que déterminé par la piscine
de Morris (O'Donnell et al. 2003).
Il semblerait que l'expression de l'apoD est reliée à des évènements distincts
dans les cellules gliales et neuronales. L'activation astrocytaire est une réponse
globale observée après une lésion cérébrale. La récupération du tissu nerveux après
une lésion est probablement en partie le résultat de l'équilibre entre les effets négatifs
de l'astroglie réactive sur la croissance axonale et les propriétés bénéfiques des
substances relâchées par cette astroglie réactive, tels que les stéroïdes sexuels, qui
peuvent promouvoir la survie neuronale (Garcia-Segura et al. 1999). Les stéroïdes
sexuels produits par les astrocytes sont potentiellement responsables de
l'augmentation locale de l'ARNm d'apoD et de sa protéine soit en activant
directement l'expression du gène ou indirectement, en causant un arrêt de croissance
des astrocytes. La protéine, telle que produite par les astrocytes peut participer aux
effets bénéfiques des stéroïdes, en les redistribuant aux neurones. La production
d'apoD par les neurones, par contre, peut être une tentative désespérée de récupérer
des facteurs essentiels à la survie comme les stéroïdes ou les facteurs de croissance et
de se débarrasser de molécules toxiques. Ceci est corroboré par des études suggérant
que l' apoD est exprimée dans les neurones destinés à mourir (Franz et al. 1999, Ong
22
et al. 1997). Par contre, d'autres études démontrent qu'une expression accrue de
l'apoD n'est pas toujours associée à la mort neuronale. Par exemple, l'induction du
gène de l'apoD a été constatée dans des neurones en maturation du SNC qui avaient
des caractéristiques de cellules viables plutôt qu'apoptotiques ou nécrotiques (Gng et
al. 1999). De la même façon, dans un modèle expérimental d'accident vasculaire
cérébral, la protéine mais pas l'ARNm de l'apoD était augmentée dans les neurones
pyramidaux mourants indiquant la redistribution des lipides. L'apoD a de plus été
localisée dans les zones de cicatrisation et d'élongation neuronale entourant les
régions touchées suggérant un rôle actif dans la réparation (Rickhag et al. 2006).
Par ailleurs, le stress oxydatif jouerait un rôle dans la neurodégénération aiguë
et chronique dans plusieurs désordres du SNe. Par exemple, les radicaux libres
d'oxygène et les oxydes nitriques peuvent conduire à la dégénérescence neuronale
suite à l'ischémie cérébrale aiguë et aux traumatismes crâniens in vivo (Chan et al.
1995). Puisque l'apoD lie la bilirubine et d'autres molécules reliées à l'hème, elle
peut faire partie du système de défense antioxydant dans lequel la conversion de
l'hème en biliverdine puis en bilirubine sert à protéger la cellule d'un dommage
oxydatif après une lésion (Peitsch et Boguski, 1990). Donc, l'induction de l'apoD
peut être important pour la protection neuronale suite à une maladie du SNC (Alvarez
et al. 2003).
Ainsi, malgré la quantité d'études portant sur l'apoD, peu de choses sont
connues à propos de ses fonctions physiologiques. Il est possible qu'à cause de ses
propriétés multi-ligand, l'apoD agisse via différentes voies dans chacun des organes
ou tissus dans lesquels son expression a été rapportée. Son implication dans les
processus cellulaires et pathologiques souligne l'importance de la compréhension des
mécanismes moléculaires contrôlant son expression afin de l'utiliser comme
biomarqueur de pathologies et même, si possible, en tant qu'agent modulateur ou
thérapeutique.
PROBLÉMATIQUE ET OBJECTIFS
Il est clair que l'apoD a une fonction importante dans l'organisme,
particulièrement dans le système nerveux, durant le développement et la vie adulte.
Elle est exprimée en conditions normales et surexprimée lors de lésions ou de
pathologies tissulaires incluant les neuropathologies, les désordres métaboliques et le
cancer. L'apoD peut donc faire partie intégrante des mécanismes entourant le
développement de ces conditions pathologiques. Son expression peut, par ailleurs,
être associée à une tentative de rémission par l'arrêt des dommages cellulaires et/ou la
réparation des sites endommagés. Cependant, puisque les situations déclenchant son
expression sont très hétérogènes, il a été proposé que la surexpression de l'apoD lors
de pathologies reflète une réponse non-spécifique à un grand nombre de stimuli
différents. L'augmentation de l'expression de cette protéine serait ainsi corrélée avec
la synthèse accrue de d'autres molécules de transport et avec la réponse au stress
observée pendant la maladie. Le rôle de l'apoD dans les pathologies en général et
dans les situations neurodégénératives en particulier, qu'il soit direct ou indirect, reste
donc à définir.
Afin d'élucider quelques aspects de la fonction de l'apoD, nous nous sommes
fixés deux objectifs. Notre premier objectif était de déterminer ce qui provoque
l'expression de l'apoD. Contrairement à ce qui a été suggéré, nous croyons que
l'augmentation de l'expression de l'apoD lors de pathologies est reliée à un ou des
déclencheurs spécifiques. Nous avons donc soumis des cultures de cellules à divers
types de stress cellulaire et déterminé si ces stress avaient une influence sur l'apoD au
niveau de son ARNm, de sa protéine et de sa localisation cellulaire. Nous avons aussi
corrélé l'expression de l'apoD lors des stress avec des marqueurs de statut cellulaire
comme la prolifération, l'apoptose et la sénescence.
24
Il s'agissait par la suite de déterminer si l'augmentation de l'expression de
l'apoD est bénéfique ou non. En s'appuyant sur les résultats obtenus chez la
drosophile, nous avons formulé l'hypothèse que l'apoD favorise une meilleure survie
en réponse à des situations de stress cellulaire. Nous avons choisi de tester cette
hypothèse dans un contexte neurodégénératif. Pour cela, nous avons utilisé des souris
qui sont déficientes en apoD (ApoD-KO) ou qui surexpriment l'apoD humaine dans
les neurones (H-apoD-Tg), le type cellulaire le plus affecté lors de maladies
neurodégénératives. Nous avons opté pour la surexpression de l'apoD humaine afin
de la différencier de l'apoD endogène de souris. Nous avons donc dans un premier
temps caractérisé ces souris. Puis nous avons soumis ces souris à des traitements
neurodégénératifs. Ces traitements ont été sélectionnés suite aux résultats obtenus lors
du premier objectif. Nous avons utilisé l'injection de paraquat, un inducteur de stress
oxydatif et l'infection avec le coronavirus humain OC43, un modèle d'inflammation
aiguë du système nerveux. Il s'agissait donc de déterminer si les divers génotypes de
souris survivaient de façon différente face à ces traitements et de corroborer ces
différences dans la survie avec des paramètres biochimiques et moléculaires à l'aide
de marqueurs d'inflammation et de stress oxydatif.
NOTE: Dans un souci d'économie, les références de chacun des chapitres
apparaissent seulement dans la section intégrée des références à la fin de la thèse.
CHAPITRE II
Modulation of apolipoprotein D expression and translocation under specific
stress conditions
Sonia Do Carmo, Louis-Charles Levros Jr, Eric Rassart
2007
Biochimica et Biophysica Acta (BBA)-Molecular Cell Research 1773: 954-969
26
Avant-propos
La compréhension des mécanismes impliqués dans le déclenchement de
l'expression de l'apoD lors de pathologies nous fournira sans doute des éléments de
réponse quant à sa fonction. Cet article a pour objectif de comprendre ce qui
provoque l'expression de l'apoD lors de situations de stress cellulaire. Nous nous
sommes donc intéressés à l'incidence de divers stress cellulaires sur la transcription,
la traduction et la localisation de l'apoD ainsi qu'à la corrélation entre l'expression de
l'apoD et des paramètres cellulaires comme la prolifération et l' apoptose. Ces travaux
ont été faits sur des fibroblastes NIH/3T3. Ce sont des cellules faciles à manipuler et
il a déjà été démontré que l'induction d'apoD dans ces cellules est semblable à celle
observée dans d'autres types cellulaires tels que les cellules épithéliales et gliales.
J'ai été impliquée dans toutes les facettes des travaux associés à cet article.
J'ai d'abord élaboré le design expérimental. Puis j'ai effectué les travaux en
laboratoire. J'ai ainsi analysé l'expression de l' ARNm de l' apoD sui te à l'application
de divers stress sur des cultures de cellules et l'effet de ces stress sur des paramètres
cellulaires comme la prolifération, l'apoptose et la sénescence. J'ai également
déterminé, par délétion séquentielle de diverses sections du promoteur, la région du
promoteur de l'apoD responsable de la réponse à l'application de lipopolysaccharide.
J'ai aussi fait les études de localisation et de trafic de l'apoD lors de situations de
stress cellulaire. J'ai finalement rédigé le manuscript et conçu les figures. Louis
Charles Levros a construit, par mutagénèse dirigée, les mutants qui ont servi à mieux
cerner et confirmer les éléments du promoteur impliqués dans la réponse au
lipopolysaccharide.
27
2.1 Résumé
L'apolipoprotéine D (apoD) est une lipocaline d'abord trouvée associée aux lipoprotéines de haute densité dans le plasma humain. L'expression de l'apoD est induite dans plusieurs situations pathologiques ou de stress cellulaire incluant l'arrêt de croissance suggérant qu'elle puisse agir comme une protéine de stress nonspécifique. L'étude d'un large éventail de stress cellulaires a démontré que ceux qui causent un arrêt de croissance prononcé tel le peroxyde d'hydrogène et les rayons ultraviolets augmentent l'expression de l'apoD. Par ailleurs, le lipopolysaccharide (LPS), un agoniste pro-inflammatoire, a démontré un effet dose et temps dépendant sur l'expression de l'apoD qui est corrélé avec une augmentation de la prolifération. Au niveau du promoteur, les éléments NF-kB, AP-l et APRE-3 ont été identifiés comme impliqués dans la réponse au LPS. La colocalisation de la protéine de fusion apoDh-GFP avec des marqueurs spécifiques à l'ADN et à l'appareil de Golgi, l'immunohistochimie de la protéine endogène et le fractionnement cellulaire ont montré que la déprivation de sérum et le traitement au LPS causent un déplacement de la localisation de l'apoD. En conditions normales, l'apoD est majoritairement périnucléaire, mais elle s'accumule dans le cytoplasme et le noyau lors de conditions de stress. Puisque l'apoD nucléaire semble être dérivé de la protéine sécrétée, elle pourrait agir comme un transporteur de ligand extracellulaire ou comme un régulateur transcriptionnel selon sa localisation. Ce rôle de l'apoD à l'intérieur de la cellule ne dépend pas uniquement de l'apoD endogène, mais peut être fourni par de l'apoD exogène entrant dans la cellule.
Mots-clés: apolipoprotéine D, arrêt de croissance, inflammation, lipocaline, lipopolysaccharide, stress cellulaire, translocation nucléaire.
28
2.2 Abstract
Apolipoprotein D is a lipocalin, primarily associated with high-density lipoproteins in human plasma. Its expression is induced in several pathological and stressful conditions including growth arrest suggesting that it could act as a nonspecific stress protein. A survey of cellular stresses shows those causing an extended growth arrest, as hydrogen peroxide and UV light increase apoD expression. Alternatively, lipopolysaccharide (LPS), a pro-inflammatory agonist showed a timeand dose-dependent effect on apoD expression that correlates with an increase in proliferation. At the promoter level, NF-kB, AP-l and APRE-3 proved to be the elements implicated in the LPS response. Colocalization of apoDh-GFP fusion constructs with DNA and Golgi markers, immunocytochemistry of the endogenous protein and cell fractionation showed that both serum starvation and LPS treatment caused a displacement of apoD localization. In normal conditions, apoD is mainly perinuclear but it accumulates in cytoplasm and nucleus under these stress conditions. Since nuclear apoD appears derived from the secreted protein, it may act as an extracellular ligand transporter as weil as a transcriptional regulator depending on its location. This role of apoD inside the cel! is not only dependent of endogenous apoD but may also be provided by exogenous apoD entering the cell.
Keywords: apolipoprotein D, growth arrest, inflammation, lipocalin, lipopolysaccharide, cellular stress, nuclear translocation.
29
2.3 Introduction
Apolipoprotein D (apoD) is a member of the lipocalin superfamily that is
found associated with high-density lipoproteins in the plasma of humans and other
species (Albers et al. 1981, Ayrault-Jarrier et al. 1963, Bojanovski et al. 1980,
Provost et al. 1990, Rassart et al. 2000, Weech et al. 1986). Unlike most of the other
plasma apolipoproteins whose expression is limited to the liver and/or the intestine,
apoD, a 29 kDa glycoprotein, is expressed in almost ail tissues that have been tested
(Cofer and Ross 1996, Drayna et al. 1986, Provost et al. 1990,1991,1995, Séguin et
al. 1995, Smith et al. 1990, Vieira et al. 1995) both during adulthood and during
embryonic or postnatal development (Ganfornina et al. 2005, Sanchez et al. 2002).
Although apoD has been shown to bind a number of small hydrophobie molecules,
the physiological ligands of apoD have yet to be definitively identified, and it has
been proposed that apoD may have multiple tissue-specifie, physiologicalligands and
functions (Milne et al. 1993, Peitsch and Boguski 1990, Provost et al. 1991).
In cultured cells, apoD expression is modulated in response to various stimuli.
It can be enhanced by growth arrest and senescence (Do Carmo et al. 2002, Provost et
al. 1991) or by other factors such as steroids (Simard et al. 1991, 1992, Sugimoto et
al. 1994), interleukin-1 a (Blais et al. 1994), 1,25-dihydroxyvitamin D3 (Lopez
Boado et al. 1994), retinoic acid (Lopez-Boado et al. 1994, 1996), or 25
hydroxycholesterol (Patel et al. 1995). The promoter region of the human apoD gene
contains several regulatory elements including serum response elements (SRE) and
an alternating purine-pyrimidine stretch implicated in the response to growth arrest
(Do Carmo et al. 2002). It also contains acute phase, estrogens, progesterone,
glucocorticoids, fat, thyroid- hormone, metal and stress response elements (APRE,
ERE, PRE, GRE, FSE, TRE, MRE, STRE), sterol dependent repressor (SDR),
activation proteins 1 and 2 (AP-1, AP-2), and nuclear factor kappa B (NF-kB)
binding sites (Do Carmo et al. 2002). There seems to be a significant biological role
30
for a tight physiological regulation of apoD, and an altered apoD expression has been
reported in several pathological conditions.
ApoD is expressed at high levels in the normal central and peripheral nervous
systems of various species (Boyles et al. 1990b, Drayna et al. 1986, Provost et al.
1990, 1991, Séguin et al. 1995, Smith et al. 1990). ApoD levels are further increased
in human neuropathologies such as Alzheimer's disease, stroke, meningoencephalitis,
motor neuron disease, dementia (Terrise et al. 1998), Niemann-Pick (Suresh et al.
1998), schizophrenia (Mahadik et al. 2002, Thomas et al. 2001 b), Parkinson disease
(Ordofiez et al. 2006) and multiple sclerosis (Reindl et al. 2001). ApoD is also
increased in several animal models of brain injury (Boyles et al. 1990a, Franz et al.
1999, Montpied et al. 1999, Ong et al. 1997, Spreyer et al. 1990, Terrisse et al.
1999). In non-neurological pathologies, apoD protein accumulates in atherosclerotic
plaques (Sarjeant et al. 2003), in the cyst fluid from women with breast gross cystic
disease (Balbin et al. 1990, Diez-Itza et al. 1994), in various cancers and in metabolic
diseases such as non-insulin dependent diabetes mellitus type II, obesity, and
syndrome X (for review, see Van Dijk et al. 2006).
Other than the increase of apoD expressIOn, these conditions share the
presence of inflammation, oxidative stress and apoptosis. Inflammation is a
physiological response to tissue injury, trauma, or infection and consists of a systemic
reaction to fight further tissue damage, destroy infective organisms and activate repair
processes. Chronic inflammation is associated with certain metabolic diseases and
cancers. There is also an inflammatory component in Alzheimer's disease, multiple
sclerosis, schizophrenia, traumatic brain injury and other neuropathologies
(Giovannoni and Baker 2003). The long-term administration of nonsteroidal anti
inflammatory drugs (NSAIDs) or cycloxygenase (COX) inhibitors appears to reduce
the incidence, or delay the onset, of Alzheimer's disease (Zandi et al. 2002). Both
naproxen and ibuprofen (2 NSAIDs) inhibit the aggregation of ~-amyloid peptides to
31
senile plaques ex VIVO (Agdeppa et al. 2003). AIso, apoE may play an isoform
specifie role in mediating the systemic and brain inflammatory responses. ApoE4 has
been associated with the early onset of Alzheimer's disease and poor prognosis in
other disorders such as multiple sclerosis (Schmidt et al. 2002, Strittmatter and Roses
1996). ApoD levels in CSF and hippocampus increased as a function of inheritance of
the apoE4 allele (Terrisse et al. 1998). Mice expressing the apoE4 allele and injected
with LPS have significantly greater systemic and brain elevations of the pro
inflammatory cytokines TNFa and IL-6 as compared with their apoE3 counterparts
(Lynch et al. 2001). Furthermore, oxidative modification of lipids occurs during
inflammatory processes and leads to the formation and accumulation of biologically
active lipid oxidation products that induce specifie cellular reactions such as
apoptosis. Moreover, oxidative stress has long been associated with the neuronal cell
death in sorne neurodegenerative conditions. It is still unclear whether oxidative
stress is the initiating event or a downstream consequence of the neurodegenerative
process in Alzheimer's disease and multiple sclerosis, two degenerative diseases
presenting apoD overexpression. The oxidant and antioxidant defense system may
also be dysfunctional in schizophrenia and bipolar disorders, which also show apoD
induction (Thomas et al. 2001b). Finally, oxidative stress resulting from an imbalance
between pro-oxidants and anti-oxidants seems to play an important role in human
breast carcinogenesis (Khanzode et al. 2004). Apoptosis has also been reported in
situations showing apoD induction as kainate excitotoxicity, enthorinal cortex
lesiOllliing and traumatic brain injury (Franz et al. 1999, Montpied et al. 1999,
Terrisse et al. 1999).
The heterogeneity of situations triggering apoD expressIOn, although
informative about the importance of apoD, leaves us in the dark about the primary
event responsible for its induction. Thus, any stress situation may initiate apoD
expression and it has been suggested that apoD is a nonspecific response to different
stimuli and may be part of an antioxidant defense system (Alvarez et al. 2003).
32
The aim of this study is to deterrnine which cellular stresses affect apoD
expression and their effect on ceU viability, apoptosis and senescence. The incidence
of sorne of these stresses on apoD protein synthesis and localization is further
exarnined. The responsive elernents at the prornoter level are also explored. Our
results show that only those stresses causing an extended growth arrest increase apoD
expression. Interestingly, lipopolysaccharide (LPS), a pro-inflarnrnatory agonist in
fibroblasts showed a time- and dose-dependent effect on apoD expression that
correlates with an increase in proliferation. At the prornoter level, NF-kB, AP-l and
APRE-3 proved to be the responsive elernents. LPS exposure and growth arrest also
induce a translocation of apoD to the nucleus.
33
2.4 Materials and methods
2.4.1 Cell culture
Ali cells were obtained from ATCC, Rockville, MD and maintained in
DMEM (Invitrogen) supplemented with 10% calf serum (NlH/3T3), in MEM
(Invitrogen) supplemented with 10% fetal calf serum (HepG2, HeLa and 293), in
RPMI (Invitrogen) supplemented with 10% feta1 calf serum (U373MG and U87). AlI
ce Ils were also supplemented with penicillin G (100 units/ml) and streptomycin (l00
flg/ml), maintained at 37°C in a 5% C02 humidified atmosphere and were fed every 2
days with fresh medium. For the analysis of gene expression in sparsely growing
cultures (normal condition), cells were maintained in medium supplemented with
10% calf serum and harvested at 50% of confluence. For analysis of growth arrest,
cells were incubated in 0.2% serum when they reached 80% of confluence. Medium
was changed after 24 h and cells were harvested after 4 days.
2.4.2 Stress induction
Cells were plated at 50 % confluency, allowed to recover 24 h then stressors
were applied as follows. Two heat and two cold shocks, one of high and another of
low intensity, were used. Cel1s were incubated at 42°C for 5 h (low heat) or at 45°C
for 20 min (high heat). Cel1s were also exposed to 32°C for 4 h (low cold) or to 4°C
(high cold) for 20 min. Cel1s were always maintained in a humidified atmosphere
containing 5% CO2 except for the 4°C condition were culture plates were tightly
wrapped with paraftlm and refrigerated for 20 min. Cells were al10wed to recover for
6 h at 37°C before analysis. For hypo-osmotic shocl<, cel1 medium was reduced to
60% normosmotic strength by addition of sterile deionized water. Cells were exposed
to this hypo-osmotic condition during 2h at 37°C then washed with PBS and replaced
in normosmotic medium for 6h before harvest. For hyper-osmotic conditions, cells
34
were maintained for 4 days in regular growth medium supplemented with ISO mM
NaCI before analysis and the medium was changed every day. Metal stress was
caused by addition of metal salts ta cel1s (100 /lM ZnCh, 100 /lM CaCh, 50 /lM
MnCh, 100 /lM MgCh, 50 /lM Alk (S04h 50 /lM LiCI) for 4 h at 37°C. After this
treatment, ce1ls were washed and were a110wed ta recover in fresh growth medium for
4 h at 37°C. Oxidative stress was induced by, unless otherwise indicated, addition of
100 /lM or 300 /lM H20 2 (Sigma-Aldrich) ta the cel1s for 2 h at 37°C and cel1s were
let ta recover for 48 h after growth medium was replaced. Rose Bengal stress was
produced by irradiating media containing 1 /lM Rose Bengal with a 500 W lamp from
a fixed distance of 66 cm for 15 min. Ta induce apoptosis, ce1ls were incubated for 16
h at 37°C with 5 or 10 /lM of camptothecin (CPT, Sigma-Aldrich) or for 8h with 0.1
/lM staurosporine (Sigma-Aldrich) in serum free DMEM. For UV irradiation,
medium and plate lids were removed and ceUs were irradiated with a Phillips®
Sterilamp (256 nm, ISW) with a source-to-target distance of 70 cm. Then, ceUs were
incubated for an additional 16 h at 37°C. For LPS treatment, cel1s were exposed ta
medium containing 2, 5, or 10 /lg/ml of LPS (Sigma-Aldrich) for 4 days or as
indicated. Medium was refreshed every day. Alternatively, ceUs were also exposed ta
lOng/mI or 100 ng/ml of bFGF or a combination of LPS 5 /lg/ml, diclofenac 200 /lM
and bFGF (Sigma-Aldrich).
2.4.3 RNA extraction and northern blot analysis
For each condition, ceUs were washed in PBS, directly Iysed in the culture
dish by adding TRIZOL Reagent (Invitrogen) as recommended by the supplier and
kept at -80°C until a11 samples were co11ected. For n011hern blots, 20 /lg of total RNA
was denatured in formaldehyde/formamide and migrated in 1.5 % agarose gel
containing MOPS (20mM) and fonnaldehyde (17%). Nucleic acids were transferred
ta Osmonics Nylon Transfer Membranes (Fisher Scientific) and UV-fixed for 3 min.
The membranes were hybridized with [a-32P] dCTP-Iabeled apoD, hsp70, caveolin-l
35
or GAPOH cONAs, exposed to Biorad Imaging screen K and revealed with a
PhosphorImager (Biorad Molecular Imager FX) and Quantity One software (Biorad).
For each value, the optical density measured for each gene tested was divided by that
of the GAPOH mRNA. The ratio obtained from sparse cultures was given an
arbitrary value of one.
2.4.4 TUNEL assay
Apoptosis was monitored by TUNEL reaction using the ln situ cell detection
kit, fluorescein labeled (Roche, Mannheim, Germany) according to the manufacturer
instructions. Cells were plated on 4 well-Sonic Seal Slides (Nunc, VWR) at 50%
confluency, allowed to recover 24h then subjected to stress conditions as described
above. Results are expressed as percentage of fluorescent apoptotic cells.
2.4.5 MTS/PMS viability test
Cell viability was measured using the CellTiter 96 AQueous Non-Radioactive
Cell Proliferation Assay (Promega) according to the manufacturer instructions. Cells
were plated as above and the results are expressed as percentage of proliferative cells.
2.4.6 BrdU incorporation
The proliferation assay was performed using colorimetrie BrdU labeling and
detection kit 1 aecording to the manufacturer's protocol (Roche, Mannheim,
Germany). Results are expressed as BrdU incorporating eells relative to that of
growing unstressed cells.
36
2.4.7 Beta-galactosidase staining of senescent celis
The ~-galactosidase activity at pH 6.0, a known characteristic of senescent
cells, was used to measure senescence. Cells were plated as above and the results are
expressed as percentage of ~-galactosidase expressing cells.
2.4.8 Construction and transfection of apoDh - GFP fusion protein expression
vectors
The human apoD coding sequence, including the signal peptide, was cloned in
frame In pEGFP-N 1 and pEGFP-CI vectors (BD Biosciences Clontech). The
construct was transfected in NIH/3T3 ceUs with Qiagen's Polyfect transfection
reagent as recommended by the supplier. Twenty-four h<:Jurs later, cells were rinsed
twice with phosphate-buffered saline and culture medium was changed for medium
containing 10% serum supplemented with 5Jlg/ml of LPS or low-serum medium
(containing 0.2% serum) or normal medium containing 10% serum.
2.4.9 Immunocytochemistry and cytochemistry
Cells were fixed with 4% paraformaldehyde 0, 3 or 6 days after stress
induction and stained with propidium iodide (Sigma-Aldrich) or bodipy ceramide TR
(Invitrogen). Ali fluorescent imaging was done at 40 X magnification using confocal
microscopy. For control, cells were transfected with pEGFP-N 1 vector alone. For
immunofluorescence staining, NIH/3T3 or U373MG cells were grown on Labtek
chamber slides (Fisher Scientific), subjected to stress conditions as above and fixed
with 4% paraformaldehyde for 10 min at room temperature. After five washes with
PBS, fixed cells were incubated in blocking and permeabilization solution (3% serum
from the host animal of the secondary antibody and 0.2% Triton X-IOO in PBS) for 1
37
h. CeUs were sequentiaUy incubated with primary antibody (polyclonal anti-mouse
apoD raised against the bacteriaUy expressed GST-fused mature mouse apoD, 1:50,
Car02 polyclonal anti-human apoD raised against human apoD purified from
mammary cyst fluid, 1:50, or 289 monoclonal anti-human apoD, 1:200 (Terrisse et
al. 1998) and then corresponding fluorophore-labeled secondary antibodies (Cy3- and
FITC-labeled anti-rabbit IgG (Cedarlane laboratories limited), 1: 100, for anti-human
apoD and anti-mouse apoD polyclonal antibodies respectively and FlTC-labeled anti
mouse IgG (Cedarlane laboratories limited), 1:200, for anti-human apoD monoclonal
antibody) for 1 h, respectively. CeUs were washed five times with PBS and then
mounted with Slowfade Gold Antifade (Molecular Probes) before imaging. For
inhibition of prote in secretion by brefeldin A treatment, apoDh-GFP transfected ceUs
were grown on chamber slides and subjected to stress conditions during 4 days. CeUs
were then treated with or without brefeldin A (5 ).lg/ml) (Sigma-Aldrich) for 1 h and
fixed 24 h later for confocal microscopy.
2.4.10 Human apoD promoter-Iuciferase constructs and mutagenesis
Heterologous luciferase (LUC) reporter gene constructs containing different
portions of the human apoD gene promoter were made by classic methods as
previously described (Do Carmo et al. 2002). The APRE-3, the two NF-kB and the
AP-l elements present in region -816 to -471 were mutated by oligonucleotide
directed PCR mutagenesis (Table 2.1). For that purpose, PCR-amplified -816/-471
portion of the apoD promoter was cloned in the correct orientation upstream of
position -179 upstream of the luciferase reporter gene in the pXP2 expression vector.
Eight complementary mutated primers and two primers from the vector were used in
two-step PCR (Table 2.1). Multiple mutants were constructed by the same technique
using sequential mutagenesis. AU of the luciferase reporter constructs were sequenced
to confilm their integrity. Each construct was co-transfected in NIH/3T3 ceUs with a
38
~-galactosidase expression vector with Polyfect reagent. After transfection, the cells
were maintained in either LPS containing (5 ).lg/ml) or LPS-free medium. The
luciferase activity was analysed after 4 days, and the results were normalized for the
B-galactosidase activity.
2.4.11 Luciferase and B-Galactosidase assays
Cells were washed with phosphate-buffered saline before adding 100 ).lI of
Tris-HCl, 0.25 M, pH 7.8. Cells were then scraped with a cell lifter, transferred into
microcentrifuge tubes, Iysed by three cycles of freeze-thawing and the Iysates were
stored at -20 oC as described previously (Do Carmo et al. 2002). Luciferase assays
were performed with a Wallac 1404 luminometer using the conditions and buffers
recommended by the Luciferase assay system (Promega). B-Galactosidase assays
were done as follows: each sample (30 ).lI) was adjusted to a final concentration of 1
mM MgCIz, 45 mM B-mercaptoethanol, 0.88 mg/ml o-phenyl-B-D
galactopyranoside, and 0.1 M sodium phosphate (pH 7.5) and incubated at 37 oC for
30 min. Reactions were stopped by the addition of Na2C03 to a final concentration of
625 mM, and the optical density was read at 420 nm. The results were standardized
by calculating promoter activity relative to that of the co-transfected internai control
plasmid pRSYBGAL. Each value is the average of at least three independent
experiments performed in triplicate.
2.4.12 Extraction of total and nuclear proteins
For total protein extraction, 2.5 x 10⁵ cells were Iysed in 10 ).lllysis buffer (50
mM Tris-HCl, pH 7.3, ISO mM NaCl, 5 mM EDTA, 0.2% Triton X-IOO, and 10%
CompleteTM protease inhibitors (Roche, Indianapolis, IN)). After 30-min incubation
at 4 oC, Iysates were sonicated and cleared by 10 min of centrifugation at 20,000 g at
39
4 oC. For nuclear protein extraction, cells were washed twice with PBS and Iysed in a
solution containing 10 mM Tris, pH 7.4, 10 mM NaCI, 3 mM MgCb, 0.1 mM EOTA,
1 mM phenylmethylsulfonyl fluoride and 0.5% Nonidet PAO. Nuclei were pelleted
by centrifugation at 2,000 x g for 2 min and washed once in the same buffer to
remove residual cytoplasmic proteins. After removal of cytoplasmic proteins, cel1
nuclei were Iysed at 37°C for 3 to 5 min in a hyperosmolar neutral-pH solution with
0.5 M NaCI, 50 mM MgCI2, 2 mM CaCI2, 10 mM Tris buffer, 100 U ofONase I/ml,
and 10% CompleteTM protease inhibitors. The protein concentration was determined
spectrophotometrically at 590 nrn using the Bio-Rad protein assay reagents (Bio-Rad
Laboratories). Ali extracts were stored at -70°C.
2.4.13 Immunoblotting
Protein extracts (1 0 ~g) were heated for 10 min at 70°C before being loaded
onto a 12% SOS- polyacrylamide gel. A prestained size marker (Biorad prestained
SOS-PAGE standard, low range) was included in each run. The gel was subjected to
electrophoresis for 1 h at 40 mA and then transferred by electroblotting to a
polyvinylidene difluoride (PVOF, Millipore) membrane for 45 min at 300 mA.
Membranes were blocked for 1 h at room temperature with blocking buffer (PBS
containing 0.2% Tween 20 and 5% skim milk powder) and incubated for 1 h at room
temperature with 1: 1000 anti-human apoO (Caro2 polyclonal antibody), 1: 1000 anti
GFP (Chemicon) or 1:4000 anti-GAPDH (Calbiochem) or overnight at 4°C with
1: 1000 anti-mouse apoO polyclonal antibody in blocking buffer. Subsequently, the
blots were incubated under gentie agitation at room temperature with a secondary
horseradish peroxidase conjugated anti-rabbit antibody (GE Healthcare) diluted
1:5000 in blocking buffer. The blots were developed using the enhanced
chemiluminescence method (Amersham-Pharmacia) with X-ray film.
40
2.4.14 Statistical analysis
Statistical significance of the apoD mRNA expression, apoptosis, cell viability
and senescence levels in cells subjected to different stress in comparison with normal
conditions was evaluated using an unpaired Student's t-test or a one-way ANOVA.
Statistical differences between the different constructs used for the identification of
LPS responsive elements in the apoD promoter were assessed by ANOVA.
Differences identified by ANOVA were pinpointed by the Turkey-Kramer multiple
comparison test.
41
2.5 Results
2.5.1 ApoD expression in response to cellular stress
Previous studies have shown that apoD mRNA is induced in cell cultures
under specifie conditions (for review, see Rassart et al. 2000, van Dijk et al. 2006)
and that its expression could be part of an antioxidant defense system (Alvarez et al.
2003). Tatil, the plant apoD homo log is upregulated in response to temperature and
water stress (Frenette Charron et al. 2002). However, in mammalian cells, no data are
available regarding temperature or osmolarity stress. Also, no direct evidence of a
relation between apoD and apoptosis, oxidative stress or inflammation has been
reported. To analyze this aspect, we measured apoD mRNA expression in murine
NIH/3T3 fibroblasts exposed to various stresses (Fig. 2.1 A). Our team previously
used these cel1s since they express apoD in a fashion similar to glial, epithelial and
primary fibroblasts (Do Carmo et al. 2002). Endogenous apoD mRNA expression
was very low in growing cel1s and in cells exposed to heat and cold shocks of high
(Hs 45°C, Cs 4°C) or low (Hs 42°C, Cs 32°C) intensity. ApoD mRNA expression
was also very low in cells grown in hypo- or hyper-osmotic conditions. Since the
apoD promoter contains one putative metal responsive element (Do Carmo et al.
2002), a combination of metals was tested. However, no change in apoD mRNA
levels was detected. For these conditions, longer exposures and recovery times were
also tested and no further increase of apoD expression was observed. ln contrast,
H20 2 and UV light induced apoD transcripts accumulation in a dose-dependent
manner (Fig. 2.lA). This was also observed with Rose Bengal another inducer of
oxidative stress (data not shown). Lipopolysaccharide (LPS) also induces a dose
dependent response. Finally, camptothecin, an apoptosis inducer, had no effect on
apoD mRNA expression. As expected, hsp70 is increased in the temperature,
osmotic, metal, UV and H202 treatments revealing that the stress applied were
effective. However, hsp70 is not activated by LPS. For comparison, serum starved
42
ceUs were included and they show a substantial apoD mRNA increase as previously
reported (Do Carmo et al. 2002) (Fig. 2.1 A).
It is interesting to note that, with the exception of LPS, those conditions that
cause an apoD transcript accumulation also decrease cell proliferation (Fig. 2.1 B). In
fact, growing cells and cells exposed to temperature or osmotic shocks, metals or low
concentrations of H202 (lOO).lM) maintain a proliferative rate above 58% and a low
level of apoD mRNA expression. At higher H20 2 concentration or long UV exposure,
the results may suggest a relation between apoD transcript accumulation and
apoptosis. However, no apoD mRNA induction was observed under treatments with
various concentrations and time exposures of camptothecin, (Fig. 2.1 A). Moreover,
senescence, which is observed at high H20 2 concentration (300).lM), has already been
reported for its ability to induce apoD expression (Provost et al. 1991 a). Finally, the
conditions presenting the best induction, LPS exposure and serum starvation, both
have apoptosis levels comparable (4% to 6% in LPS) or only slightly superior (12%
in serum starvation) to those seen in growing cells (6%). Thus, our results clearly
indicate that the important inducer of apoD mRNA accumulation is cellular growth
arrest rather than apoptosis (Fig. 2.1 B).
2.5.2 ApoD expression under oxidative stress correlates with decreased cell
proliferation
To further assess the contribution of oxidative stress in the apoD mRNA
expression observed in figure 2.1A, NIH/3T3 cell cultures were exposed to increasing
concentrations of H202. ApoD transcripts accumulate from 100 ).lM to 300 ).lM in a
dose-dependent manner (Fig. 2.2A). This apoD increase correlates weil with a
decrease in cell viability rather than an increased apoptotic rate (Fig. 2.2B). Indeed,
no apoD accumulation is detected in low H20 2 concentrations already documented as
being mitogenic (5 ).lM to 30 ).lM) (Davies 1999) nor in the highly apoptotic 500 ).lM
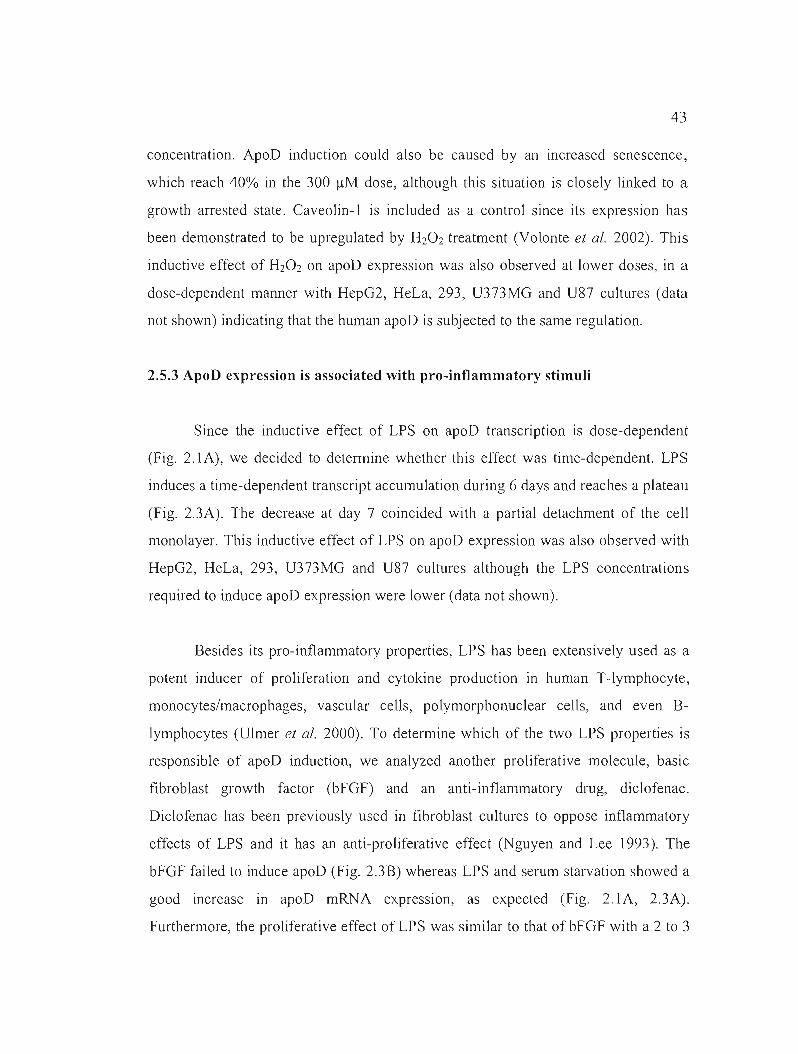
43
concentration. ApoD induction could also be caused by an increased senescence,
which reach 40% in the 300 /lM dose, although this situation is closely linked to a
growth arrested state. Caveolin-l is included as a control since its expression has
been demonstrated to be upregulated by H20 2 treatment (Volonte et al. 2002). This
inductive effect of H20 2 on apoD expression was also observed at lower doses, in a
dose-dependent manner with HepG2, HeLa, 293, U373MG and U87 cultures (data
not shown) indicating that the human apoD is subjected to the same regulation.
2.5.3 ApoD expression is associated with pro-inflammatory stimuli
Since the inductive effect of LPS on apoD transcription is dose-dependent
(Fig. 2.1A), we decided to determine whether this effect was time-dependent. LPS
induces a time-dependent transcript accumulation during 6 days and reaches a plateau
(Fig. 2.3A). The decrease at day 7 coincided with a partial detachment of the cell
mono layer. This inductive effect of LPS on apoD expression was also observed with
HepG2, HeLa, 293, U373MG and U87 cultures although the LPS concentrations
required to induce apoD expression were lower (data not shown).
Besides its pro-inflammatory properties, LPS has been extensively used as a
potent inducer of proliferation and cytokine production in human T-lymphocyte,
monocytes/macrophages, vascular cells, polymorphonuclear cells, and even B
lymphocytes (Ulmer et al. 2000). To determine which of the two LPS properties is
responsible of apoD induction, we analyzed another proliferative molecule, basic
fibroblast growth factor (bFGF) and an anti-inflammatory drug, diclofenac.
Diclofenac has been previously used in fibroblast cultures to oppose inflammatory
effects of LPS and it has an anti-proliferative effect (Nguyen and Lee 1993). The
bFGF failed to induce apoD (Fig. 2.3B) whereas LPS and serum starvation showed a
good increase in apoD mRNA expression, as expected (Fig. 2.1A, 2.3A).
Furthermore, the proliferative effect of LPS was similar to that of bFGF with a 2 to 3
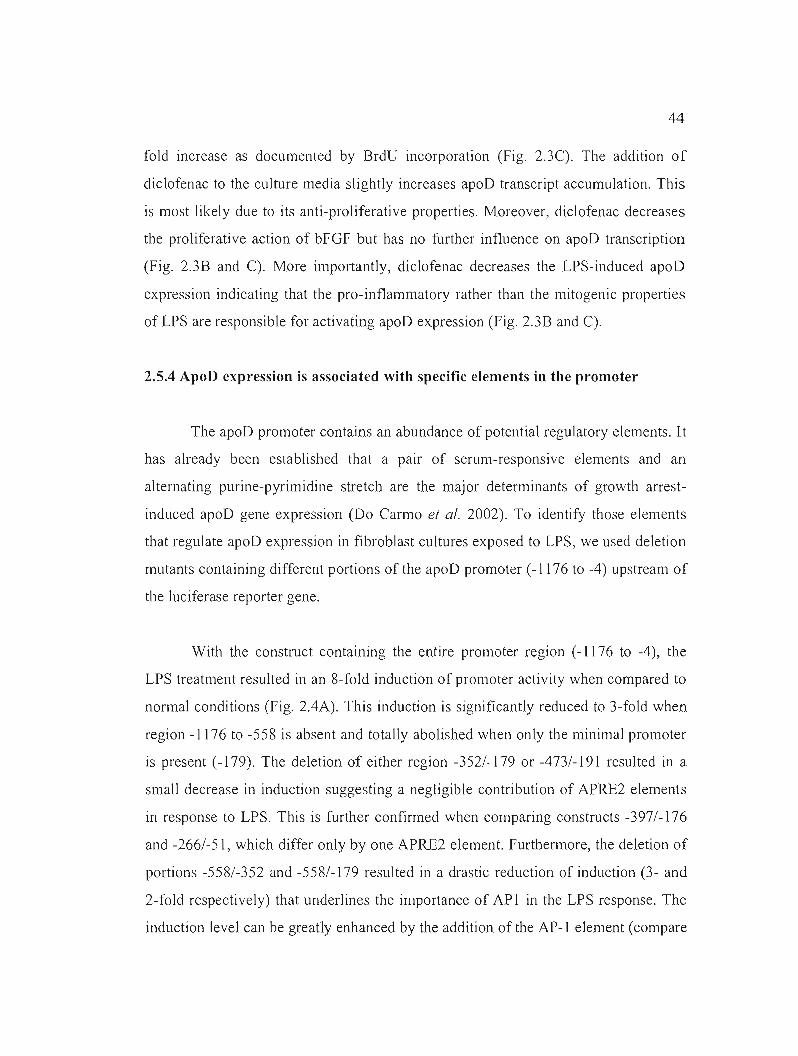
44
fold increase as documented by BrdU incorporation (Fig. 2.3C). The addition of
diclofenac to the culture media slightly increases apoD transcript accumulation. This
is most likely due to its anti-proliferative properties. Moreover, diclofenac decreases
the proliferative action of bFGF but has no further influence on apoD transcription
(Fig. 2.3B and C). More importantly, diclofenac decreases the LPS-induced apoD
expression indicating that the pro-inflammatory rather than the mitogenic properties
of LPS are responsible for activating apoD expression (Fig. 2.3B and C).
2.5.4 ApoD expression is associated with specifie elements in the promoter
The apoD promoter contains an abundance of potential regulatory elements. It
has already been established that a pair of semm-responsive elements and an
alternating purine-pyrimidine stretch are the major determinants of growth arrest
induced apoD gene expression (Do Carmo et al. 2002). To identify those elements
that regulate apoD expression in fibroblast cultures exposed to LPS, we used deletion
mutants containing different portions of the apoD promoter (-1176 to -4) upstream of
the luciferase reporter gene.
With the constmct containing the entire promoter region (-1176 to -4), the
LPS treatment resulted in an 8-fo1d induction of promoter activity when compared to
normal conditions (Fig. 2.4A). This induction is significantly reduced to 3-fold when
region -1176 to -558 is absent and totally abolished when only the minimal promoter
is present (-179). The deletion of either region -352/-179 or -473/-191 resulted in a
smalt decrease in induction suggesting a negligible contribution of APRE2 elements
in response to LPS. This is further confirmed when comparing constmcts -397/-176
and -266/-51, which differ only by one APRE2 element. Furthermore, the deletion of
portions -558/-352 and -558/-179 resulted in a drastic reduction of induction (3- and
2-fold respectively) that underlines the importance of API in the LPS response. The
induction level can be greatly enhanced by the addition of the AP-l element (compare
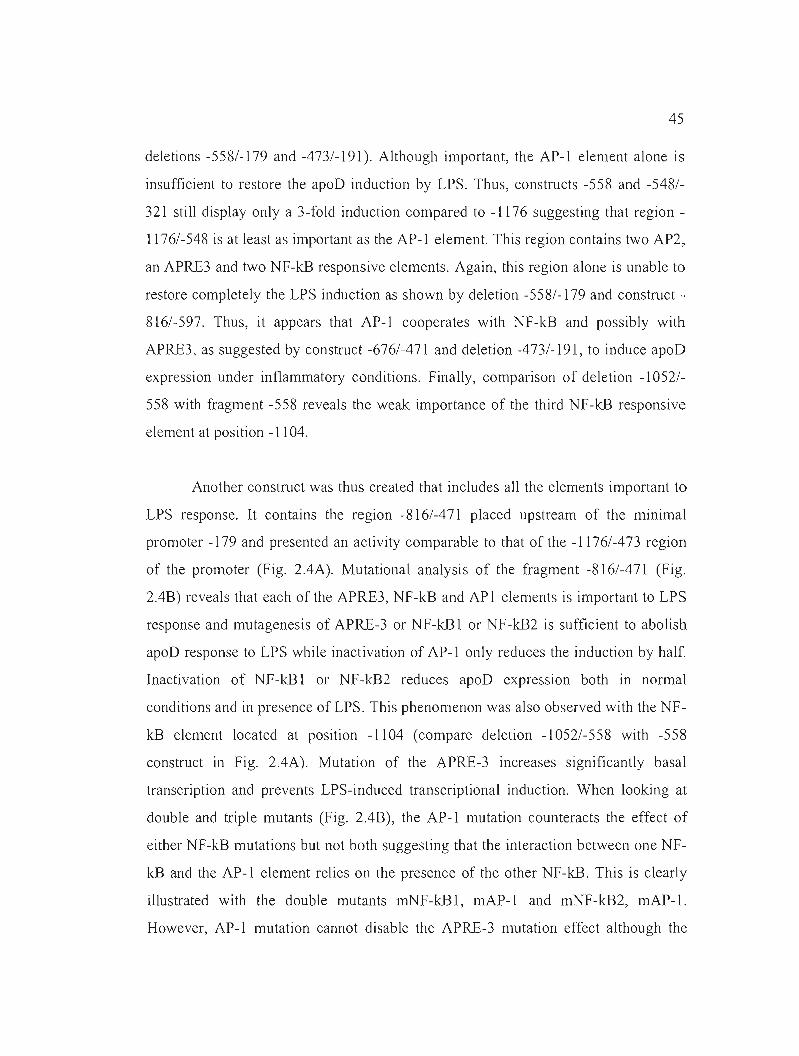
45
deletions -558/-179 and -473/-191). Although important, the AP-I element alone is
insufficient to restore the apoD induction by LPS. Thus, constructs -558 and -548/
321 still display only a 3-fold induction compared to -1176 suggesting that region
1176/-548 is at least as important as the AP-I element. This region contains two AP2,
an APRE3 and two NF-kB responsive elements. Again, this region alone is unable to
restore completely the LPS induction as shown by deletion -558/-179 and construct
816/-597. Thus, it appears that AP-l cooperates with NF-kB and possibly with
APRE3, as suggested by construct -676/-471 and deletion -473/-191, to induce apoD
expression under inflammatory conditions. FinaUy, comparison of deletion -1052/
558 with fragment -558 reveals the weak importance of the third NF-kB responsive
element at position -1104.
Another construct was thus created that includes aU the elements important to
LPS response. It contains the region -816/-471 placed upstream of the minimal
promoter -179 and presented an activity comparable to that of the -1176/-473 region
of the promoter (Fig. 2.4A). Mutational analysis of the fragment -816/-471 (Fig.
2.4B) reveals that each of the APRE3, NF-kB and AP 1 elements is important to LPS
response and mutagenesis of APRE-3 or NF-kBl or NF-kB2 is sufficient to abolish
apoD response to LPS while inactivation of AP-l only reduces the induction by half.
Inactivation of NF-kB 1 or NF-kB2 reduces apoD expression both in normal
conditions and in presence of LPS. This phenomenon was also observed with the NF
kB element located at position -1104 (compare deletion -1052/-558 with -558
construct in Fig. 2.4A). Mutation of the APRE-3 increases significantly basal
transcription and prevents LPS-induced transcriptional induction. When looking at
double and triple mutants (Fig. 2.48), the AP-I mutation counteracts the effect of
either NF-kB mutations but not bath suggesting that the interaction between one NF
kB and the AP-l element relies on the presence of the other NF-kB. This is clearly
iUustrated with the double mutants mNF-kBl, mAP-I and mNF-kB2, mAP-1.
However, AP-l mutation cannot disable the APRE-3 mutation effect although the
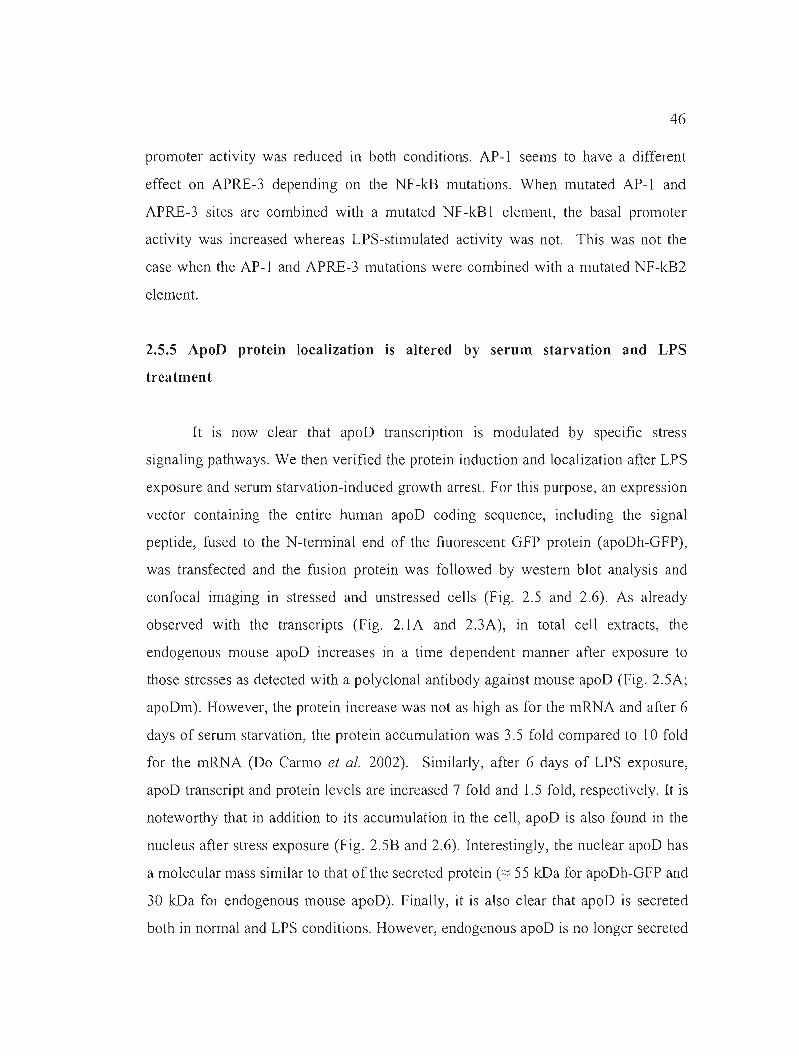
46
promoter activity was reduced in both conditions. AP-I seems to have a different
effect on APRE-3 depending on the NF-kB mutations. When mutated AP-I and
APRE-3 sites are combined with a mutated NF-kB 1 element, the basal promoter
activity was increased whereas LPS-stimulated activity was not. This was not the
case when the AP-I and APRE-3 mutations were combined with a mutated NF-kB2
element.
2.5.5 ApoD protein localization is altered by serum starvation and LPS
treatment
lt is now clear that apoD transcription IS modulated by specifie stress
signaling pathways. We then verified the protein induction and localization after LPS
exposure and serum starvation-induced growth arrest. For this purpose, an expression
vector containing the entire human apoD coding sequence, including the signal
peptide, fused to the N-terminal end of the fluorescent OFP protein (apoDh-OFP),
was transfected and the fusion protein was foUowed by western blot analysis and
confocal imaging in stressed and unstressed ceUs (Fig. 2.5 and 2.6). As already
observed with the transcripts (Fig. 2.1 A and 2.3A), in total cell extracts, the
endogenous mouse apoD increases in a time dependent manner after exposure to
those stresses as detected with a polyclonal antibody against mouse apoD (Fig. 2.5A;
apoDm). However, the protein increase was not as high as for the mRNA and after 6
days of serum starvation, the protein accumulation was 3.5 fold compared to 10 fold
for the mRNA (Do Carmo et al. 2002). Similarly, after 6 days of LPS exposure,
apoD transcript and protein levels are increased 7 fold and 1.5 fold, respectively. It is
noteworthy that in addition to its accumulation in the cell, apoD is also found in the
nucleus after stress exposure (Fig. 2.5B and 2.6). Interestingly, the nuclear apoD has
a molecular mass similar to that of the secreted protein (;::: 55 kDa for apoDh-OFP and
30 kDa for endogenous mouse apoD). Finally, it is also clear that apoD is secreted
both in normal and LPS conditions. However, endogenous apoD is no longer secreted
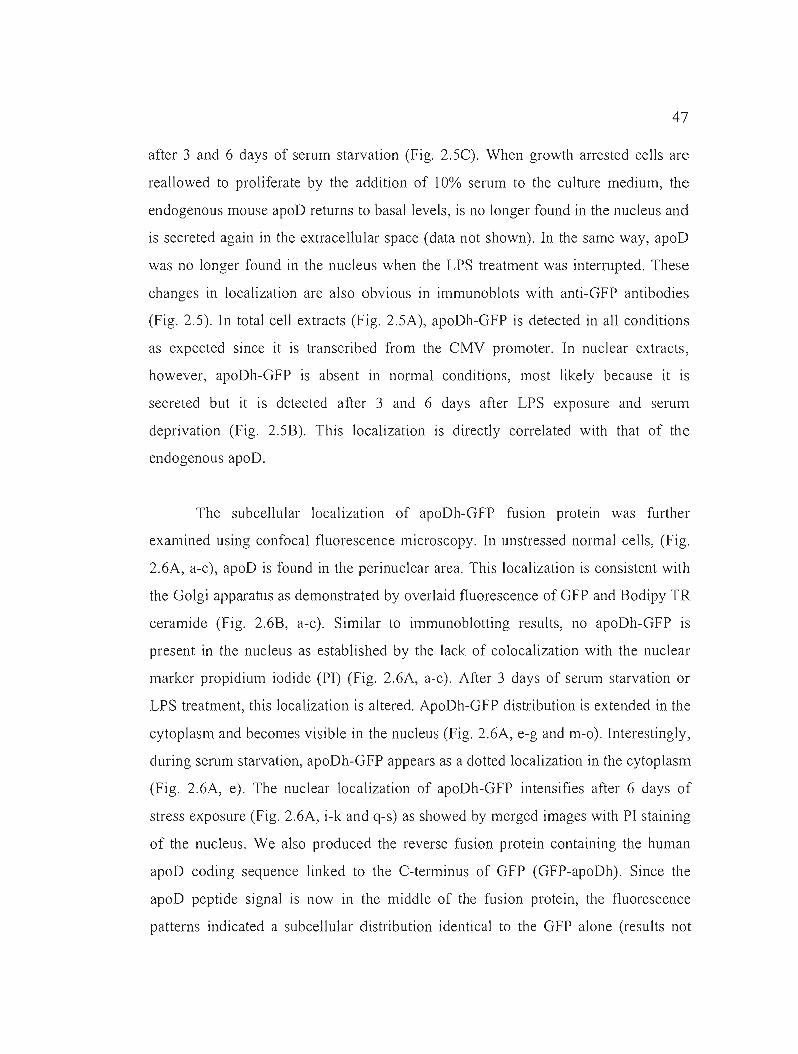
47
after 3 and 6 days of serum starvation (Fig. 2.5C). When growth arrested cells are
reallowed to proliferate by the addition of 10% serum to the culture medium, the
endogenous mouse apoD returns to basal levels, is no longer found in the nucleus and
is secreted again in the extracellular space (data not shown). In the same way, apoD
was no longer found in the nucleus when the LPS treatment was interrupted. These
changes in localization are also obvious in immunoblots with anti-GFP antibodies
(Fig. 2.5). In total cell extracts (Fig. 2.5A), apoDh-GFP is detected in ail conditions
as expected since it is transcribed from the CMV promoter. In nuclear extracts,
however, apoDh-GFP is absent in normal conditions, most likely because it is
secreted but it is detected after 3 and 6 days after LPS exposure and serum
deprivation (Fig. 2.5B). This localization is directly correlated with that of the
endogenous apoD.
The subcellular localization of apoDh-GFP fusion protein was further
examined using confocal fluorescence microscopy. In unstressed normal cells, (Fig.
2.6A, a-c), apoD is found in the perinuclear area. This localization is consistent with
the Golgi apparatus as demonstrated by overlaid fluorescence of GFP and Bodipy TR
ceramide (Fig. 2.6B, a-c). Similar to immunoblotting results, no apoDh-GFP is
present in the nucleus as established by the lack of colocalization with the nuclear
marker propidium iodide (PI) (Fig. 2.6A, a-c). After 3 days of serum starvation or
LPS treatment, this localization is altered. ApoDh-GFP distribution is extended in the
cytoplasm and becomes visible in the nucleus (Fig. 2.6A, e-g and m-o). Interestingly,
during serum starvation, apoDh-GFP appears as a dotted localization in the cytoplasm
(Fig. 2.6A, e). The nuclear localization of apoDh-GFP intensifies after 6 days of
stress exposure (Fig. 2.6A, i-k and q-s) as showed by merged images with PI staining
of the nucleus. We also produced the reverse fusion protein containing the human
apoD coding sequence linked ta the C-terminus of GFP (GFP-apoDh). Since the
apoD peptide signal is now in the middle of the fusion prote in, the fluorescence
patterns indicated a subcellular distribution identical to the GFP alone (results not
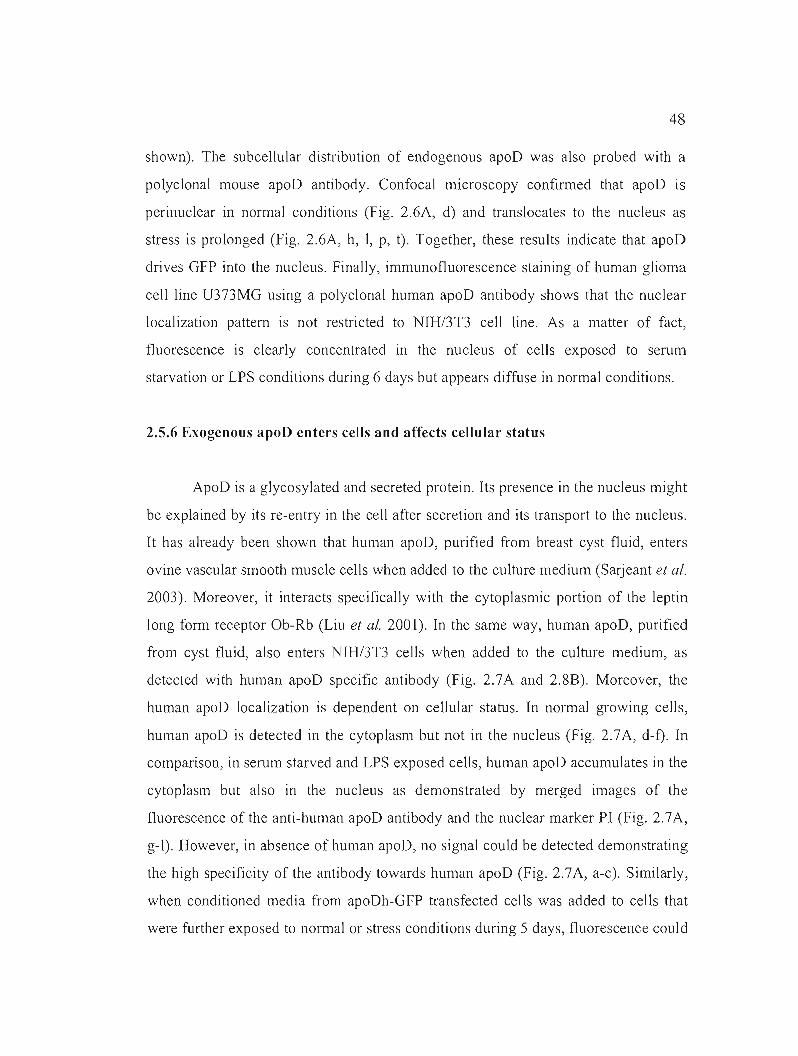
48
shown). The subcellular distribution of endogenous apoD was also probed with a
polyclonal mouse apoD antibody. Confocal microscopy confirmed that apoD is
perinuclear in normal conditions (Fig. 2.6A, d) and translocates to the nucleus as
stress is prolonged (Fig. 2.6A, h, l, p, t). Together, these results indicate that apoD
drives GFP into the nucleus. FinaUy, immunofluorescence staining of human glioma
cell line U373MG using a polyclonal human apoD antibody shows that the nuclear
localization pattern is not restricted to NIH/3T3 cell hne. As a matter of fact,
fluorescence is c1early concentrated in the nucleus of cells exposed to serum
starvation or LPS conditions during 6 days but appears diffuse in normal conditions.
2.5.6 Exogenous apoD enters cells and affects cellular status
ApoD is a glycosylated and secreted protein. Its presence in the nucleus might
be explained by its re-entry in the cell after secretion and its transport to the nucleus.
It has already been shown that human apoD, purified from breast cyst fluid, enters
ovine vascular smooth muscle ceUs when added to the culture medium (Sarjeant et al.
2003). Moreover, it interacts specificaUy with the cytoplasmic portion of the leptin
long form receptor Ob-Rb (Liu et al. 2001). In the same way, human apoD, purified
from cyst fluid, also enters NIW3T3 ceUs when added to the culture medium, as
detected with human apoD specific antibody (Fig. 2.7A and 2.8B). Moreover, the
human apoD localization is dependent on cellular status. In normal growing ceUs,
human apoD is detected in the cytoplasm but not in the nucleus (Fig. 2.7A, d-t). In
comparison, in serum starved and LPS exposed ceUs, human apoD accumulates in the
cytoplasm but also in the nucleus as demonstrated by merged images of the
fluorescence of the anti-human apoD antibody and the nuclear marker PI (Fig. 2.7A,
g-I). However, in absence of human apoD, no signal cou Id be detected demonstrating
the high specificity of the antibody towards human apoD (Fig. 2.7A, a-c). Similarly,
when conditioned media from apoDh-GFP transfected ceUs was added to ceUs that
were further exposed to normal or stress conditions during 5 days, fluorescence could
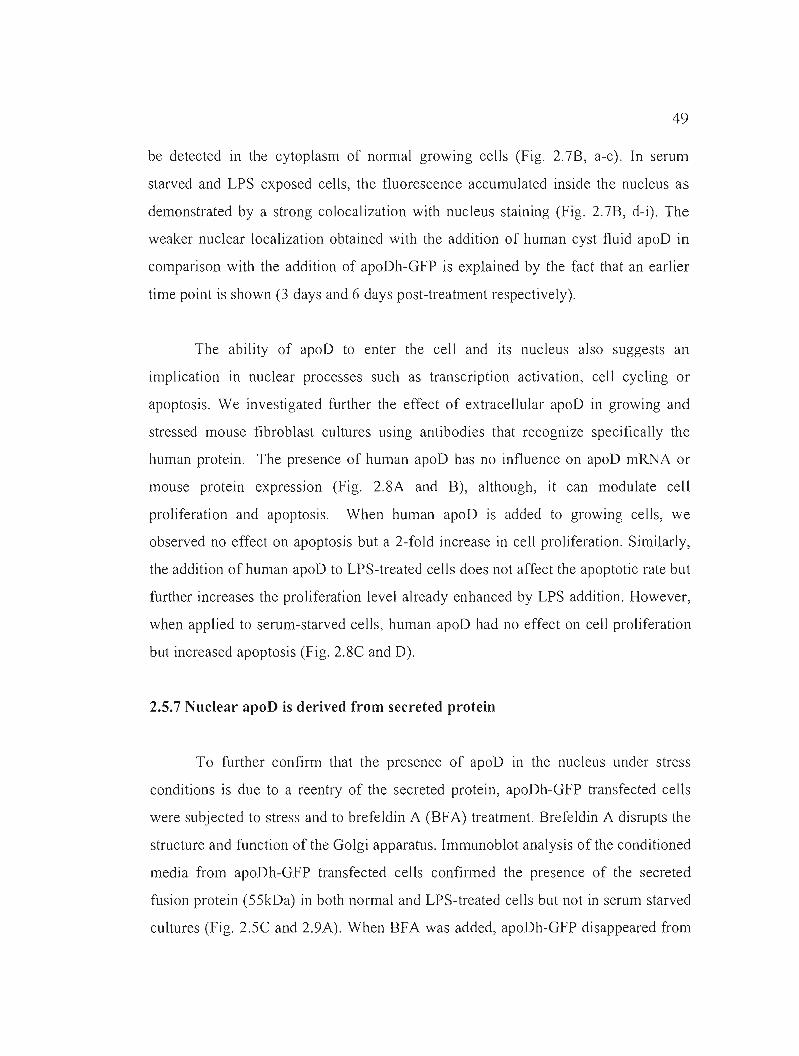
49
be detected in the cytoplasm of normal growing cel!s (Fig. 2.7B, a-c). In serum
starved and LPS exposed cel!s, the fluorescence accumulated inside the nucleus as
demonstrated by a strong colocalization with nucleus staining (Fig. 2.7B, d-i). The
weaker nuclear localization obtained with the addition of human cyst fluid apoD in
comparison with the addition of apoDh-GFP is explained by the fact that an earlier
time point is shown (3 days and 6 days post-treatment respectively).
The ability of apoD to enter the cell and its nucleus also suggests an
implication in nuclear processes such as transcription activation, cell cycling or
apoptosis. We investigated further the effect of extracellular apoD in growing and
stressed mouse fibroblast cultures using antibodies that recognize specifically the
human protein. The presence of human apoD has no influence on apoD mRNA or
mouse protein expression (Fig. 2.SA and B), although, it can modulate cel!
proliferation and apoptosis. When human apoD is added to growing cells, we
observed no effect on apoptosis but a 2-fold increase in cel! proliferation. Similarly,
the addition of human apoD to LPS-treated cells does not affect the apoptotic rate but
further increases the proliferation level already enhanced by LPS addition. However,
when applied to serum-starved cells, human apoD had no effect on cell proliferation
but increased apoptosis (Fig. 2.8C and 0).
2.5.7 Nuclear apoD is derived from secreted protein
To further confirm that the presence of apoD in the nucleus under stress
conditions is due to a reentry of the secreted protein, apoDh-GFP transfected cells
were subjected to stress and to brefeldin A (BFA) treatment. Brefeldin A disrupts the
structure and function of the Golgi apparatus. Immunoblot analysis of the conditioned
media from apoDh-GFP transfected cells confirmed the presence of the secreted
fusion protein (55kDa) in both normal and LPS-treated cells but not in serum starved
cultures (Fig. 2.5C and 2.9A). When BFA was added, apoDh-GFP disappeared from
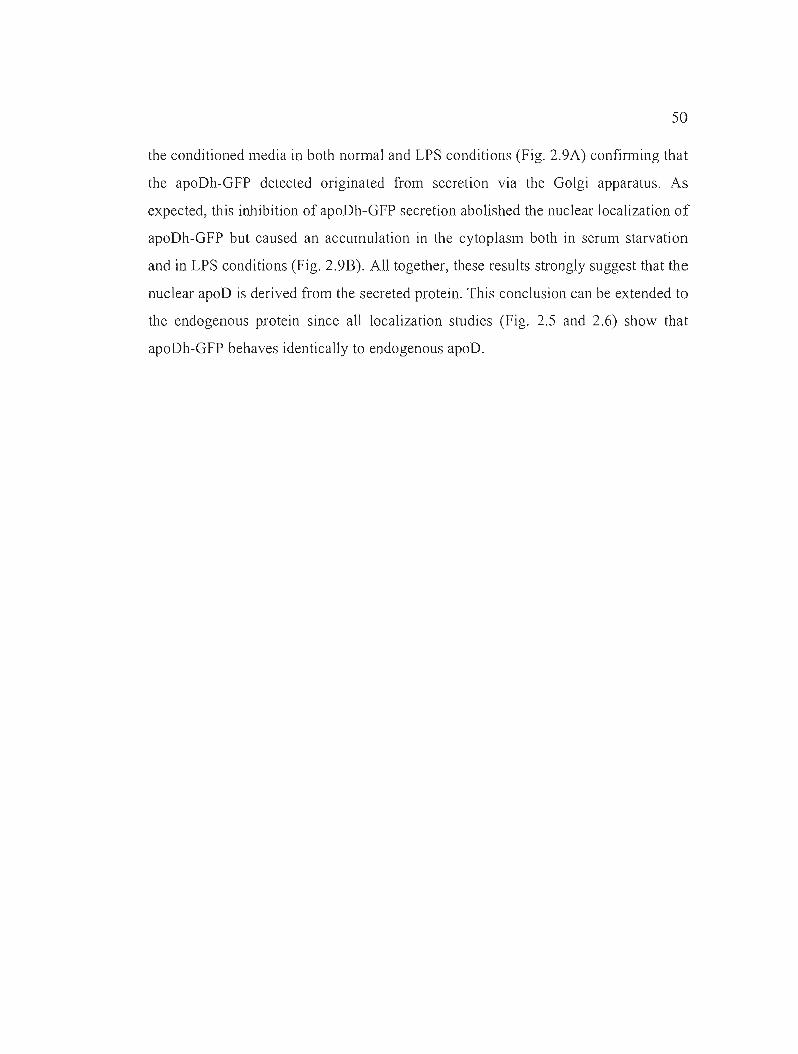
50
the conditioned media in both normal and LPS conditions (Fig. 2.9A) confirming that
the apoDh-GFP detected originated from secretion via the Golgi apparatus. As
expected, this inhibition of apoDh-GFP secretion abolished the nuclear localization of
apoDh-GFP but caused an accumulation in the cytoplasm both in serum starvation
and in LPS conditions (Fig. 2.9B). Ali together, these results strongly suggest that the
nuclear apoD is derived from the secreted protein. This conclusion can be extended ta
the endogenous protein since ail localization studies (Fig. 2.5 and 2.6) show that
apoDh-GFP behaves identically to endogenous apoD.
51
2.6 Discussion
In this study, we demonstrate that sorne but not ail stress conditions activate
apoD expression. Temperature, osmotic pressure, metal exposition and pro-apoptotic
agents such as camptothecin did not affect apoD transcription. However, classical
inducers of oxidative stress, H202, Rose Bengal and UV light did induce apoD
mRNA accumulation in a dose-dependent manner. This response was very closely
associated with a decrease in cell proliferation and viability as demonstrated with
increasing concentrations of H20 2 . Indeed, induced apoD expression was observed
specifically at those H20 2 concentrations that caused growth arrest. This strongly
suggests that the capacity of sorne specifie stresses to trigger apoD expression is more
related to their capacity to activate growth arrest pathways. The relation between
apoD and growth arrest is weil established. When analyzed in cell cultures, apoD
induction seems always inversely correlated to cell proliferation (Blais et al. 1994,
Do Carmo et al. 2002, Lopez-Boado et al. 1994, 1996, Patel et al. 1995, Provost et al.
1991a, Simard et al. 1991,1992, Sugimoto et al. 1994).
This study is also the first to our knowledge that establishes a relation between
apoD expression and inflammation. Indeed, the only stress that increased apoD
without inhibiting cel! proliferation was LPS. This molecule, derived from the outer
membrane of Gram-negative bacteria, is weil documented as being both a mitogen
and a pro-inflammatory agonist in several cel! types participating to inflammatory
responses, including fibroblasts (Smith et al. 2001, Tardif et al. 2004, Warner et al.
2004). It is also capable to induce oxidative stress through the activation of NADPH
oxidase and antioxidant enzymes. In spite of this, we believe that apoD expression is
related to inflammatory pathways because of the capacity of diclofenac to reverse the
LPS-associated induction. Our results a1so show that the LPS function on the apoD
expression is mediated at the promoter level, through the APRE-3, NF-kB and AP-l
binding sites. AP-1 and NF-kB are wel! documented as regulators of numerous genes
52
involved in immune and inflammatory responses (Lee et al. 2003). ln different cell
and promoter contexts, AP-l binds DNA as lun/Jun homodimers or lun/Fos
heterodimers and alters gene expression in response to growth factors, cytokines,
oxidative stress, and phorbol esters (Kushner et al. 2000). Less information is
available concerning acute-phase responsive elements (APRE) having a consensus
sequence similar to the one present on the apoD promoter. Sorne studies reported that
APREs have an important role during inflammation and infection and to bind IL-l a
(Brasier et al. 1990), IFN-y (Strh10w et al. 1993), IL-6 (Yuan et al. 1994) and NF
kB l isoforms (Jamaludin et al. 2000). The APRE could also bind C/EBP~, which is
mobilized upon LPS administration in mice. C/EBP~ is an important regulator of
genes involved in immune and inflammatory responses and has been shown to bind
the IL-6 gene promoter as wel1 as several other acute-phase and cytokine genes (Hu
et al. 2004). This pathway is not yet fully understood but al10ws the production of
prostaglandin E2 (Uematsu et al. 2002), a member of the pro-inflammatory
eicosanoids family. lnterestingly, arachidonic acid, the preferential ligand for apoD,
is the dominant substrate for eicosanoid synthesis (Calder 2005). ln addition to
CIEBP~, the APRE could also bind STAT3 (Song et al. 2004), which is known to
play important roles in cell differentiation, proliferation, survival, and angiogenesis
promotion.
The accumulation of apoD under growth arrest and in presence of LPS is also
observed at the protein level. However, the protein accumulation is more modest than
that of the mRNA. Our results c1early show for the first time that apoD subcellular
localization undergoes modifications upon stress exposure: it is mainly secreted and
found perinuclear in the Golgi apparatus under basal conditions but accumulates in
the cytoplasm and the nucleus in stress conditions. Perinuclear localization of apoD
has been reported in oligodendrocyte precursor-like cells and astrocytes of mouse
brain of NiemalU1-Pick type C disease model (Ong et al. 2002) and in vascular
53
smooth muscle cells (VSMC) aftel' wounding (Leung et al. 2004). The accumulation
of apoD in the cytoplasm and its translocation to the nucleus when growth arrest or
pro-inflammatory stimuli are applied was supported by several independent
experimental approaches. This included colocalization of apoDh-GFP fusion
constructs with DNA and Golgi markers, immunocytochemistry of the endogenous
protein, and cell fractionation. Thus, immunoblotting of apoDh-GFP transfected cells
confirms that, upon serum starvation and LPS treatment, there is an accumulation of
apoD both in the cell and in the nucleus. No detectable secretion in the extracellular
space was obtained in growth-arrested cells although easily detectable in the
extracellular space upon LPS treatment. The experiment presented the advantage that
we could follow the endogenous mouse apoD and the exogenous human apoD linked
to GFP. Interestingly, both the mouse and human apoD behave similarly, suggesting a
common response pattern upon stress exposure including similar pathways for
nuclear transport.
Nuclear apoD may have several possible sources. It is unlikely that apoD
enters the nucleus by passive diffusion since the fusion protein used in our study was
generated by fusing EGFP to the C-terminus of the entire coding region of human
apoD. The molecular mass of the resulting fusion protein is ::::: 55 lilla and therefore, it
cannot enter the nucleus by diffusion. Furthermore, apoD does not contain any
common putative nuclear localization signal (NLS) that could direct its translocation
to the nucleus. Still, the binding of apoD to a transmembrane receptor or a protein
containing a NLS cannot be excluded. Retrograde trafficking from ER to the nucleus
is a more plausible mechanism of translocating the intracellular apoD from cytoplasm
to the nuclear compartment. It has been suggested that misfolded proteins that would
classically undergo degradation in the ER can be back-translocated from the ER to
the cytoplasm. However, if misfolding occurs, it is not the consequence of the
overexpression of the apoDh-GFP since a similar localization of endogenous apoD
was found in cells transfected or not with the apoDh-GFP construct. Misfolding could
54
then be associated with the stress itself. ln spite of this, we provided evidences that
nuclear apoD originates from the extracellular compartment. lndeed, as a
glycoprotein harboring a peptide signal, apoD should be entirely secreted. lts
presence within cells exposed to specific stress suggests a protein re-uptake, most
likely by an endocytosis-dependent pathway, and transport to the nucleus. This is in
agreement with several observations: (1) the apoD present in the nucleus has a
molecular mass similar to that of the secreted protein; this would not be the case if
apoD had bypassed the Golgi and ER glycosylation (2) apoDh-GFP is secreted as
weil as localized in the nucleus; (3) when untransfected stressed cells (LPS exposed
or serum starved) are exposed to conditioned media containing apoDh-GFP, the
fusion protein is translocated to the nucleus; (4) inhibition of protein secretion by
BFA abolishes the nUclear presence of apoDh-GFP, whereas it increases its
cytoplasmic content. Thus, apoD nuclear localization is dependent on the functional
Golgi apparatus; (5) human apoD, purifled from cyst fluid, is internalized in normal
and stressed cells but translocation to the nucleus is observed only after stress; (6)
finally, there is accumulating evidence that secreted proteins are present in the
nucleus under specifie circumstances. The fact that apoD is found in the nucleus of
serum starved cells although we could not detect its presence in the media may
appear as a contradiction but we cannot rule out that very low levels of apoD are
secreted and immediately reabsorbed under these conditions. lndeed, the media was
only concentrated twice before analysis.
Eventhough, apoD is translocated differentially in normal and stress
conditions, its possible function in the cells remains to be determined. The data
obtained by confocal imaging and immunoblotting of apoDh-GFP transfected cells
and cells exposed to exogenous human apoD suggest that, in normal growing cells,
apoD is modified in the Golgi apparatus and secreted before reinternalization in the
cytoplasm, possibly transporting one of its ligand. The exposition of cells to
exogenous apoD followed by its internalization results in an increased proliferation
55
and points to an interaction of apoD or its ligand or both with early targets of
proliferative signais. The function of apoD in the nucleus during stress is less clear.
lts accumulation in the nucleus of both serum starved and LPS treated cells raised the
possibility that it may regulate gene expression directly or indirectly. In particular, it
suggests a role for apoD in the balance between apoptosis and cell proliferation. This
balance might be dependent of the interaction of apoD or its ligand or both with ceU
cycle regulators that affect both the proliferative and non-proliferative processes.
Consequently, the addition of exogenous apoD has a strong incidence on cellular
proliferation in LPS treated cells but apoptosis is observed when added to growth
arrested cells. Both mitogenic and growth arrest conflicting signais are known to
initiate apoptosis as this could be the case in growth arrested ceUs treated with
purified apoD. Yet, exogenous apoD does not influence endogenous apoD protein or
mRNA expression, excluding the possibility of self-regulation.
Inflammation, oxidative stress and apoptosis are part of many if not ail the
pathological situations where apoD is found increased. Chronic inflammation is
associated with certain metabolic diseases such as non-insulin dependent diabetes
mellitus type II and metabolic syndrome X (for review, see Rassart et al. 2000, Van
Dijk et al. 2006) There is also an emerging consensus of the inflammatory and/or
oxidative stress hypothesis of Alzheimer's disease, multiple sclerosis, schizophrenia,
bipolar disorder, traumatic brain injury and other neuropathologies (Dakhale et al.
2004, Giovannoni and Baker 2003, Thomas et al. 2001 b). Moreover, apoptosis was
reported in situations showing apoD overexpression (Lieuallen et al. 2001, Montpied
et al. 1999, Thomas et al. 2003c). Thus, it might be difficult to distinguish the
incidence of each of these pathways on apoD induction since most of them are
intimately linked. However, the present study suggests that those conditions
responsible for apoD expression are more related to an antiproliferative and
inflammatory signais than to oxidation and apoptosis. It remains to be determined
whether apoD accumulation in inflammation is protective or detrimental. ApoD could
56
be part of the protective component of a mild inflammation, particularly at the
neuronal level. It could also trap inflammatory mediators. ln particular, apoD could
trap arachidonic acid, which is released from the cellular membrane after
inflammatory stimuli, and prevent its subsequent conversion in pro-inflammatory
eicosanoids.
ln conclusion, apoD induction is specifie to ong01l1g cellular stress. Only
pathological ancl/or stressful situations tested here having an inflammatory or growth
arrest component have the capacity to increase apoD expression. We have provided
sorne lines of evidence indicating that these stresses induce a displacement of apoD
localization and that the nuclear apoD is derived from the secreted protein. ApoD
binds several quite different molecules. Within the ceIl, apoD could have many
functions such as the transport of specifie molecules to the various compartments and
evacuation of toxic metabolites. lt couId also play a role in the modulation of signal
transduction pathways and in the regulation of nuclear processes such as transcription
activation, cell cycling and apoptosis. More studies are needed to identify potential
target genes of apoD and to elucidate the molecular events that trigger its cell entry
and nuclear translocation.
57
2.7 Acknowledgments
We thank Ross Milne, Diego Sanchez and Maria Dolores Ganfornina for helpful
discussions. The anti-mouse antibody was raised by Olivier Guinard in our labo We
gratefully acknowledge support from the Canadian Institutes for Health Research
(Grant MOP-15677). SDC was supported by FRSQ and NSERC studentships.
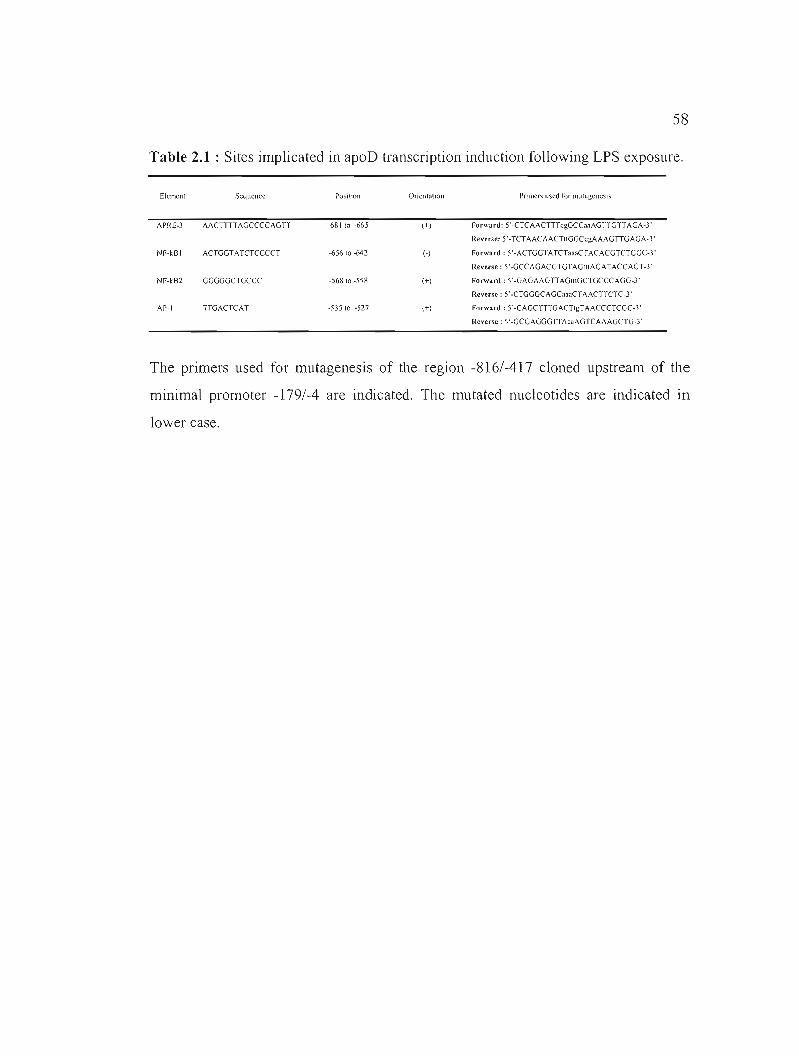
58
Table 2.1 Sites implicated in apoD transcription induction following LPS exposure.
Elemellt Sequence Position Oricnl<J1ion Primer:;. uscd for nHllagcllcsl~
APRE·3 AACTITIAGCCCCAGTI -681 10 -665 (+) Fo","ard: 5'-CTCAACTTTcgGCCaaAGTIGTIAGA·3'
Re,'me: 5'-TCTAACAACTIlGGCcgAAAGTIGAGA·3'
NF-kBI ACTGGTATCTCCCCT -65610 -642 (-) Forward: 5'-ACTGGTATCTaaaCTACACGTCTGGC·3'
Reverse: 5'-GCCAGACGTGTAGIlIAGATACCAGT·3'
NF-kB2 GGGGGCTGCCC -56810 -558 (+) Forward: 5'-GAGAAGTIAGIIlGCTGCCCAGG·3'
Reverse: 5 '·CTGGGCAGCaaaCTAACTICTC·3·
AP·) TIGACTCAT -535 10 -527 (+) Forward: 5'-CAGCTTTGACTlgTAACCCTCGC·3'
Re"me: 5'-GCGAGGGTIAc.1AGTCAAAGCTG·3'
The pnmers used for mutagenesis of the regIOn -816/-417 cloned upstream of the
minimal promoter -179/-4 are indicated. The mutated nucleotides are indicated ID
lower case.
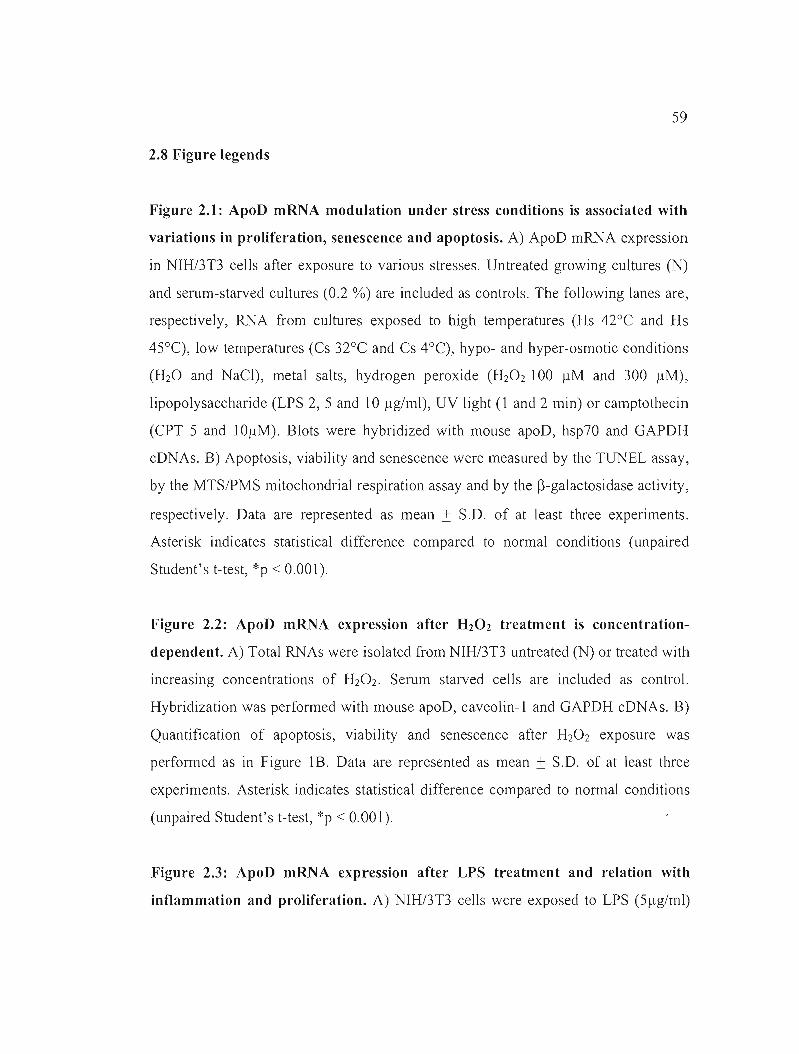
59
2.8 Figure legends
Figure 2.1: ApoD mRNA modulation under stress conditions is associated with
variations in proliferation, senescence and apoptosis. A) ApoD mRNA expression
in NIH/3T3 cells after exposure to various stresses. Untreated growing cultures (N)
and serum-starved cultures (0.2 %) are included as controls. The following lanes are,
respectively, RNA from cultures exposed to high temperatures (Hs 42°C and Hs
45°C), low temperatures (Cs 32°C and Cs 4°C), hypo- and hyper-osmotic conditions
(H20 and NaCI), metal salts, hydrogen peroxide (H20 2 100 IlM and 300 ~lM),
lipopolysaccharide (LPS 2,5 and 10 Ilg/ml), UV light (1 and 2 min) or camptothecin
(CPT 5 and lOIlM). Blots were hybridized with mouse apoD, hsp70 and GAPDH
cDNAs. B) Apoptosis, viability and senescence were measured by the TUNEL assay,
by the MTS/PMS mitochondrial respiration assay and by the ~-galactosidase activity,
respectively. Data are represented as mean ± S.D. of at least three experiments.
Asterisk indicates statistical difference compared to normal conditions (unpaired
Student's t-test, *p < 0.001).
Figure 2.2: ApoD mRNA expression after H 20 2 treatment is concentration
dependent. A) Total RNAs were isolated from NIH/3T3 untreated (N) or treated with
increasing concentrations of H20 2 . Serum starved cells are inc1uded as control.
Hybridization was performed with mouse apoD, caveolin-1 and GAPDH cDNAs. B)
Quantification of apoptosis, viability and senescence after H20 2 exposure was
performed as in Figure lB. Data are represented as mean ± S.D. of at least three
experiments. Asterisk indicates statistical difference compared to normal conditions
(unpaired Student's t-test, *p < 0.001).
Figure 2.3: ApoD mRNA expression after LPS treatment and relation with
inflammation and proliferation. A) NIH/3T3 cells were exposed to LPS (5Ilg/ml)
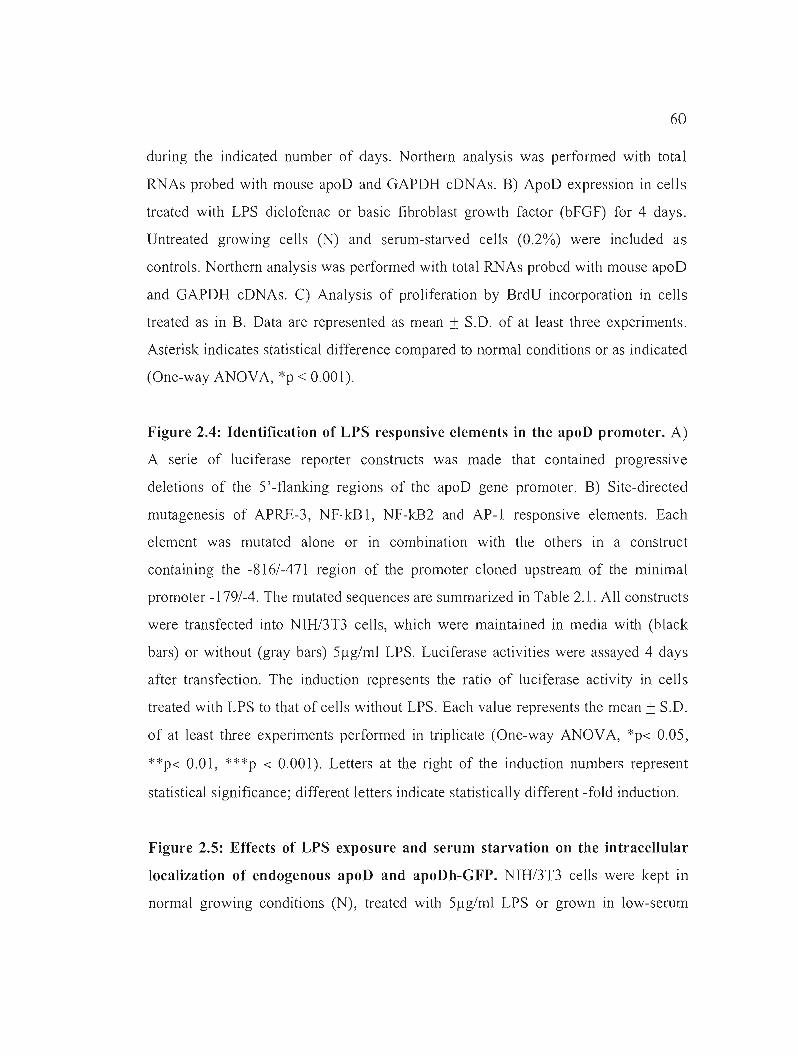
60
during the indicated number of days. Northern analysis was performed with total
RNAs probed with mouse apoD and GAPDH cDNAs. B) ApoD expression in cells
treated with LPS diclofenac or basic fibroblast growth factor (bFGF) for 4 days.
Untreated growing cells (N) and serum-starved cells (0.2%) were included as
controls. Northern analysis was performed with total RNAs probed with mouse apoD
and GAPDH cDNAs. C) Analysis of proliferation by BrdU incorporation in cells
treated as in B. Data are represented as mean ± S.D. of at least three experiments.
Asterisk indicates statistical difference compared to normal conditions or as indicated
(One-way ANOVA, *p < 0.001).
Figure 2.4: Identification of LPS responsive elements in the apoD promoter. A)
A serie of luciferase reporter constructs was made that contained progressive
deletions of the 5'-flanking regions of the apoD gene promoter. B) Site-directed
mutagenesis of APRE-3, NF-kB l, NF-kB2 and AP-l responsive elements. Each
element was mutated alone or in combination with the others in a construct
containing the -816/-471 region of the promoter cloned upstream of the minimal
promoter -179/-4. The mutated sequences are summarized in Table 2.1. Ail constructs
were transfected into NIH/3T3 cells, which were maintained in media with (black
bars) or without (gray bars) 5flg/ml LPS. Luciferase activities were assayed 4 days
after transfection. The induction represents the ratio of luciferase activity in cells
treated with LPS to that of cells without LPS. Each value represents the mean ±S.D.
of at least three experiments performed in triplicate (One-way ANOVA, *p< 0.05,
**p< 0.01, ***p < 0.001). Letters at the right of the induction numbers represent
statistical significance; different letters indicate statistically different -fold induction.
Figure 2.5: Effects of LPS exposure and serum starvation on the intracellular
localization of endogenous apoD and apoDh-GFP. NIH/3T3 cells were kept in
normal growing conditions (N), treated with 5flg/ml LPS or grown in low-serum
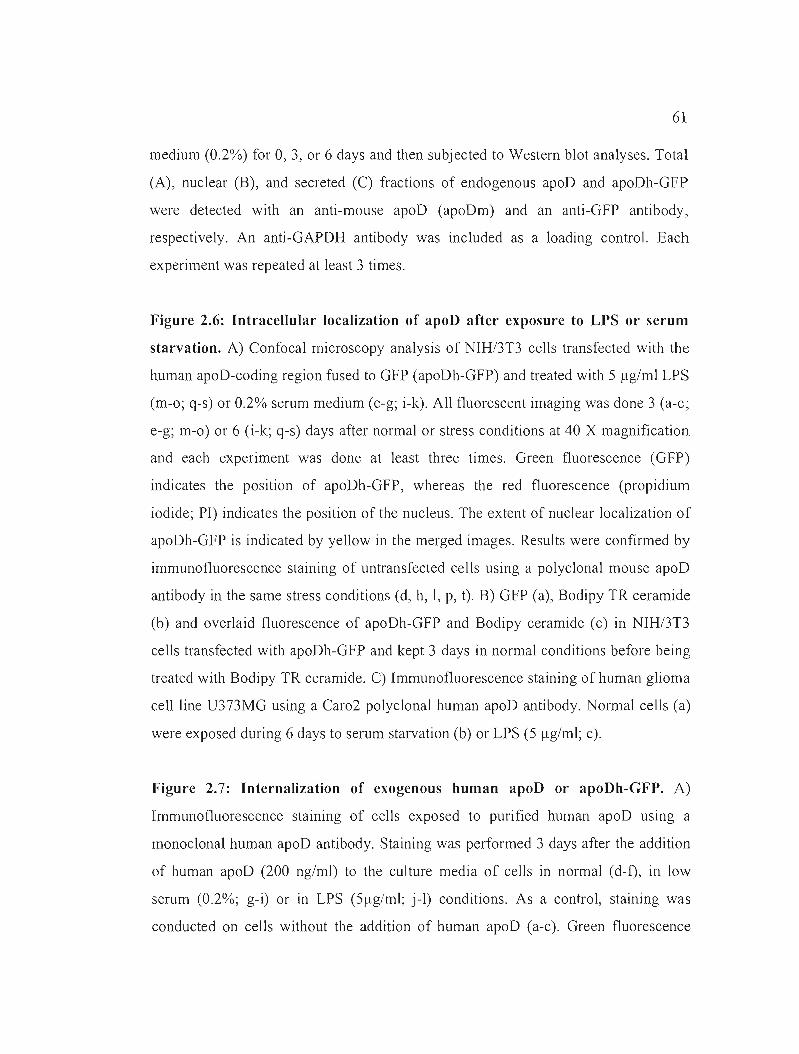
61
medium (0.2%) for 0, 3, or 6 days and then subjected to Western blot analyses. Total
(A), nuclear (B), and secreted (C) fractions of endogenous apoD and apoDI1-GFP
were detected with an anti-mouse apoD (apoDm) and an anti-GFP antibody,
respectively. An anti-GAPDH antibody was included as a loading control. Bach
experiment was repeated at least 3 times.
Figure 2.6: Intracellular localization of apoD after exposure to LPS or serum
starvation. A) Confocal microscopy analysis of NIH/3T3 cells transfected with the
human apoD-coding region fused to GFP (apoDh-GFP) and treated with 5 ).lg/ml LPS
(m-o; q-s) or 0.2% serum medium (e-g; i-k). AU fluorescent imaging was done 3 (a-c;
e-g; m-o) or 6 (i-k; q-s) days after normal or stress conditions at 40 X magnification
and each experiment was done at least tbree times. Green fluorescence (GFP)
indicates the position of apoDh-GFP, whereas the red fluorescence (propidium
iodide; Pl) indicates the position of the nucleus. The extent of nuclear localization of
apoDh-GFP is indicated by yeUow in the merged images. Results were confirmed by
immunofluorescence staining of untransfected cells using a polyclonal mouse apoD
antibody in the same stress conditions (d, h, 1, p, t). B) GFP (a), Bodipy TR ceramide
(b) and overlaid fluorescence of apoDh-GFP and Bodipy ceramide (c) in NIH/3T3
cells transfected with apoDh-GFP and kept 3 days in normal conditions before being
treated with Bodipy TR ceramide. C) Immunofluorescence staining of human glioma
ceU line U373MG using a Caro2 polyclonal human apoD antibody. Normal ceUs (a)
were exposed during 6 days to serum starvation (b) or LPS (5 ).lg/ml; c).
Figure 2.7: Internalization of exogenous human apoD or apoDh-GFP. A)
Immunofluorescence staining of cells exposed to purified human apoD using a
monoclonal human apoD antibody. Staining was performed 3 days after the addition
of human apoD (200 ng/ml) to the culture media of ceUs in normal (d-f), in low
serum (0.2%; g-i) or in LPS (5).lglml; j-I) conditions. As a control, staining was
conducted on ceUs without the addition of human apoD (a-c). Green fluorescence
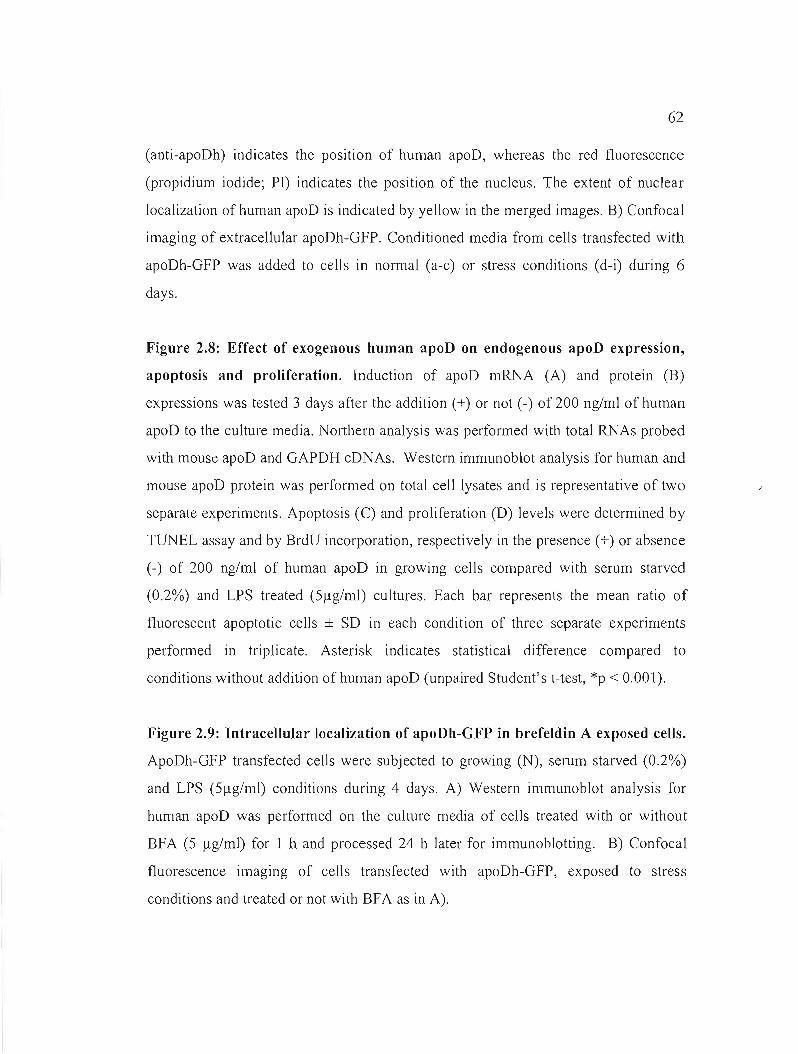
62
(anti-apoDh) indicates the position of human apoD, whereas the red fluorescence
(propidium iodide; PI) indicates the position of the nucleus. The extent of nuclear
localization of human apoD is indicated by yeUow in the merged images. B) Confocal
imaging of extracellular apoDh-GFP. Conditioned media from ceUs transfected with
apoDh-GFP was added to cells in normal (a-c) or stress conditions (d-i) during 6
days.
Figure 2.8: Effect of exogenous human apoD on endogenous apoD expression,
apoptosis and proliferation. Induction of apoD mRNA (A) and protein (B)
expressions was tested 3 days after the addition (+) or not (-) of200 ng/ml ofhuman
apoD to the culture media. Northern analysis was performed with total RNAs probed
with mouse apoD and GAPDH cDNAs. Western immunoblot analysis for human and
mouse apoD protein was performed on total ceIl Iysates and is representative of two
separate experiments. Apoptosis (C) and proliferation (D) levels were determined by
TUNEL assay and by BrdU incorporation, respectively in the presence (+) or absence
(-) of 200 ng/ml of human apoD in growing ceUs compared with serum starved
(0.2%) and LPS treated (5Ilg/ml) cultures. Each bar represents the mean ratio of
fluorescent apoptotic ceUs ± SD in each condition of three separate experiments
performed in triplicate. Asterisk indicates statistical difference compared to
conditions without addition of human apoD (unpaired Student's t-test, *p < 0.001).
Figure 2.9: Intracellular localization of apoDh-GFP in brefeldin A exposed cells.
ApoDh-GFP transfected ceUs were subjected to growing (N), serum starved (0.2%)
and LPS (5Ilg/ml) conditions during 4 days. A) Western immunoblot analysis for
human apoD was performed on the culture media of ceIls treated with or without
BFA (5 Ilg/ml) for 1 h and processed 24 h later for immunoblotting. B) Confocai
fluorescence imaging of ceUs transfected with apoDh-GFP, exposed to stress
conditions and treated or not with BFA as in A).
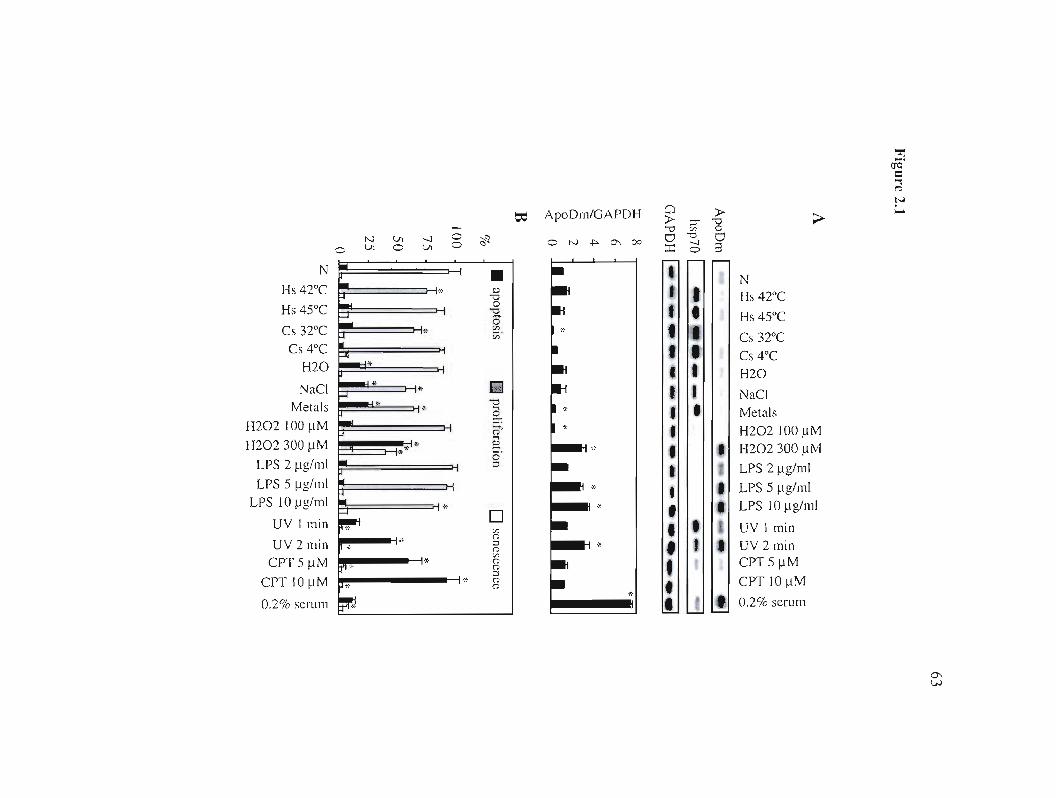
~
rIê' c: ~
~
N 00; ApoDm/GAPDH »» ::r v ~ '"V '.ri C
1-.) VI -...J 0 Cl -0 Cl 0 VI C IJI 0 :r: 23 3 t;;o •
~ C N .po ::l'\ ::x>
N
Hs 42°C ' v 1 lis 42°C i'
• N
Hs 45°C ~
v 0
Hs 45°Cr::.. ë 'j)Cs 32°C ~ *" 'j) Cs 32°C
Cs 4°C -'1_.,.
~ t.>
'."•, • •• 1 Cs 4°C
H20 H20 1.....-.*
NaCl t3;::r 1 '.:1 NaCl-- ... ~.
....,Metals i. v Metals2
~ •H202 100 /lM "
1-1202 1(0)lM~ . "
t H202 300 f..1M '* .,.. g
.:~.,. :, !. H202300 ).lMë' LPS 2 /lg/ml L.. ::l
' LPS 2/lg/ml..LPS 5 /lg/ml :.(. LPS 5 /lg/ml :. • l'LPS 10 /lg/ml .,' .. LPS 10 )lg/ml=-r 1 UV J min ~
() ,1 UV 1 min
D • • )'j)
• . •...: ::l ..UV 2 min -'/.. () 1 uv 2 min :r-
i'·x· c:CPT 5 f..1M :t'l.,.- () CPT 5 IJM ::l ()
'fCPT 10 ~lM .;.:. +:.
() CPT 10 /lM ~:.
0.2% serum ~ • • 0.2% serum
0\ VJ
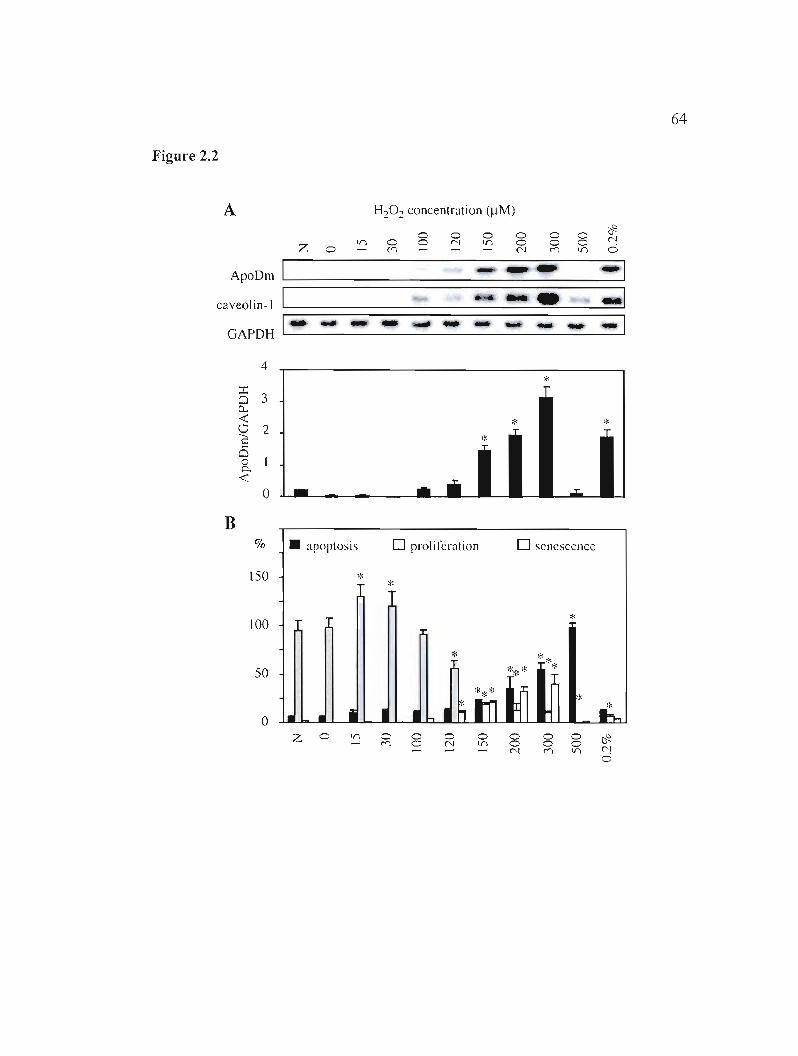
64
Figure 2.2
A o o o o o
c o 0l trl o oz 0 r. ("'1 r.
ApoDm --1 caveolin-l
, .. - ..... -1GAPDH
4
~ 3 0... «Q E
2 :;: *
a g « ... .. o -
B % • apoplosis D proliferation D senescence
150 *
100 *
50
o z c c o o o 0
c trl o o 0 0l r. Ir,
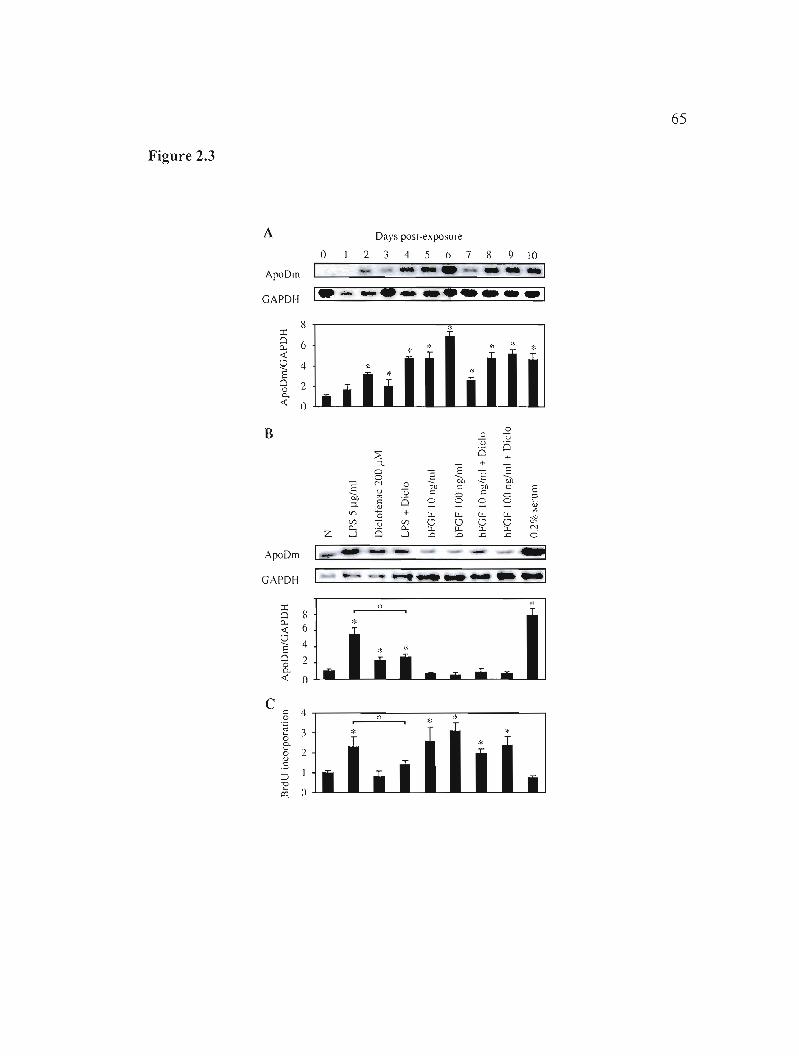
65
Figure 2.3
A Days posl-exposure
0 2 :> 4 5 6 7 8 9 10
ApoDm 1 --. --.. 11- .... GAPDH ---"---"-1
:c ~
Ci ~~: ~ 6 8 :;':
<t * * V E 4 '" Ci 0 2 Co « 0
0B ~-:.J ëiCS2 +
='- + :::> -2 01,
.:::: <=0
0
~
.:::: '?nriu ;0 ~J
~ U :::> co :J CO :::> CO c::::. '" 6 ;;& .r.
..on +0 u.."- "- "V; ,~ <J<Ü Vl G 0 '-' ü N0.. 0.. u.. CL CL"'z ..J 6 ..J .J::, .0 .c .c cO
ApoDm lï!J -.............. ..GAPDH .~ ..1
:):c * Ci li ::L. :\:
« 6 v
4l= :!= * 5 28<t 0
~ l ::: :(:
c
4!:Cllill'"§o " * ~ * o 2 u .S :J J
~ ()
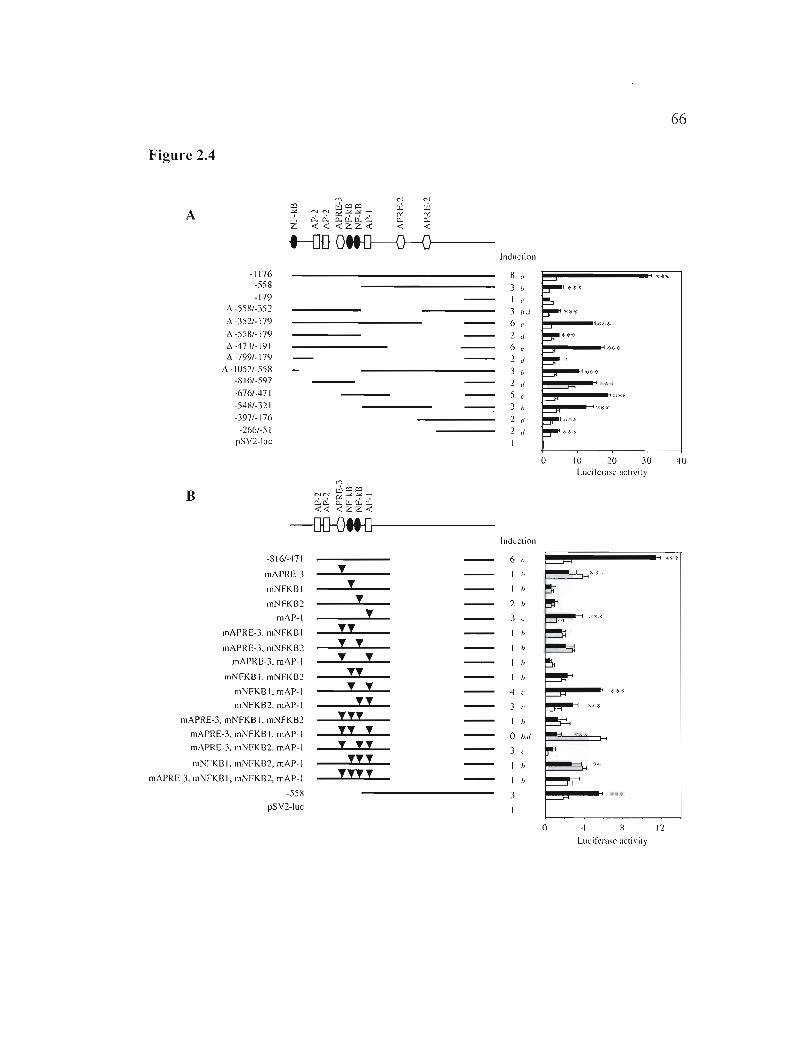
66
Figure 2.4
A ::::l -'" "
Z
'7' Cl Ol N N ~.:.é~-c:.. c:.. a..!l.Ii.~<{ « <Czz<{
('1
tL; c< "«
('1
W <>: c. «
IndtlClion
-1176 -558 -179
6 -55S/·~52
~\ -1:;2/-179
6-55S/·179 6-47)/-191 6 -799/-l79
'" -1052/-558 ·R 1(\/-597
·676/-471 -:;4X/-J21 -397/-176
-2(,6/-51 pSV2-luc
S a
3 /,
1 c
~ f,.tI
6 c
2 "(, " 2 d
3 /,
2 ":; ('
] " 2 " 2 1 "
~... t>!:,,:.!=
~,...--,:,,"
0 :102010 L.ucircra:-:I.' llClivilY
40
B
Induclion
-816/-471
OlAPRE-~
mNFKBI
mNFKB2
mAP·l
mAPRE·], mNFK 131
mt\PRE·3.mNFKB2
mAI'RE·J. mAP·J
mNrKlll. mNrKIl2
mNFK13 1. mAP·1
mNFKB2. mA!'·!
mAPRE·J, mNFKI:lI. mNFKI:l2
mA PRE·). mNFKl3l. mAP·1
m:\PRE·3. Il1NFK132. OlAP·1
mNFKBJ. mNFK132, mAP·)
mAPRE·J. mNFKBI, Il1NFKB2, mAP·1
·55R pSV2·llIC
I I
I I
II I I I I II I I II
YYY YI y Y YY
YII IYII
6 " 1 {,
1 " 2 (,
~
1 /,
J /,
1 l,
1 l,
4 c
) c
1 b
0 h.l!
) c
1 /,
1 b
J
1
•••
0 12
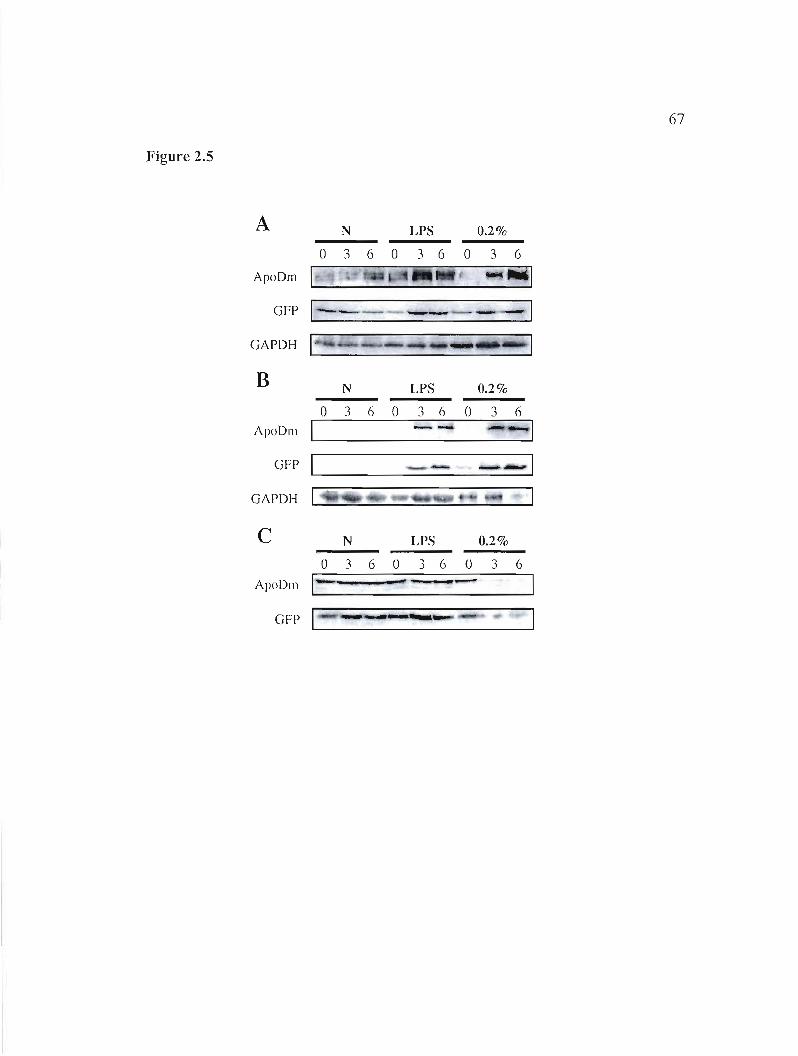
67
Figure 2.5
A N LPS 0.2%
0 3 6 0 3 6 0 3 6
ApoDm 1 -1 GFP 1---------1
GAPDH 11
B N LPS 0.2%
0 3 6 0 3 6 0 3 6 ApoDm 1 1
GFP 1 ---1 GAPDH 1 1
c N LPS 0.2% .,
0 ,) 6 0 3 6 0 3 6
ApoDIll 1- .. =----._---GFP 1
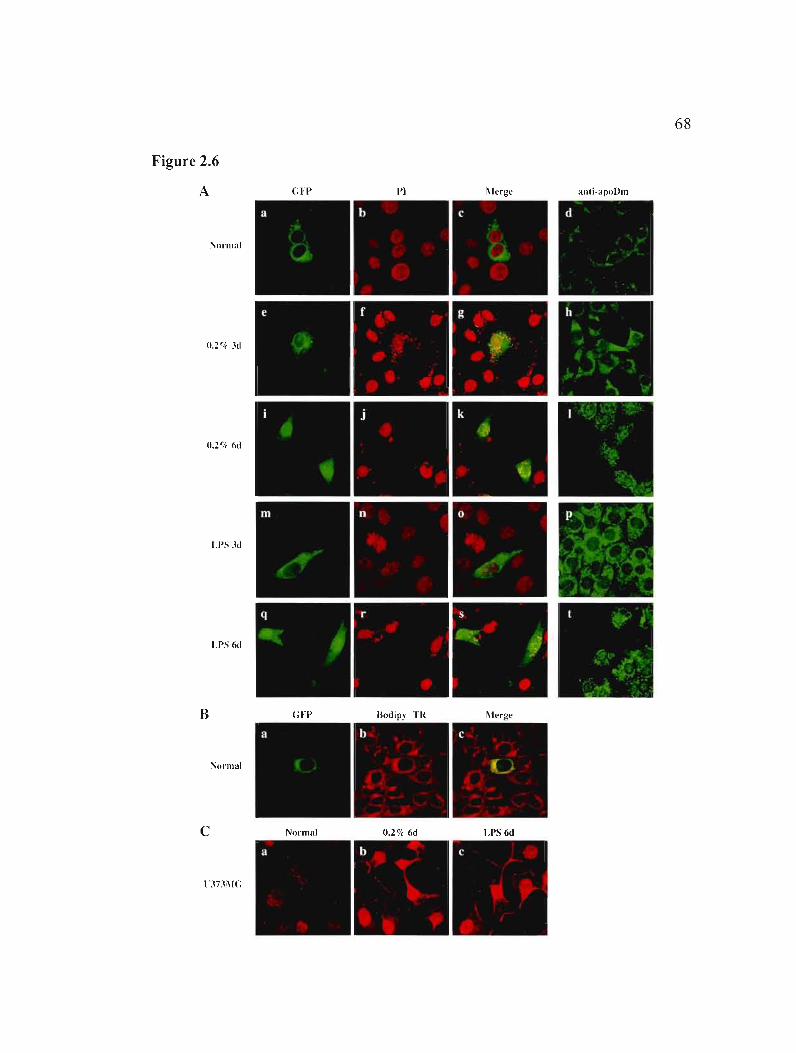
68
Figure 2.6
A
\nrmal
a
GFI'
h
1'1
c
l\Jcrgc
d
allli-apnDm
(1.2';' .Id
e f g
}F
h
lU'!, (id
i j k ~.
'1';.,
1
I.I'S .Id
m n 0 p
LPS 6d
(1 r s
.' ~,.,., , ",'
1
fi Ilodipy TI{ l\'lerge
\ormal
c Normal 0.20/, (id I.rs 6d
l'J7Ji\IC
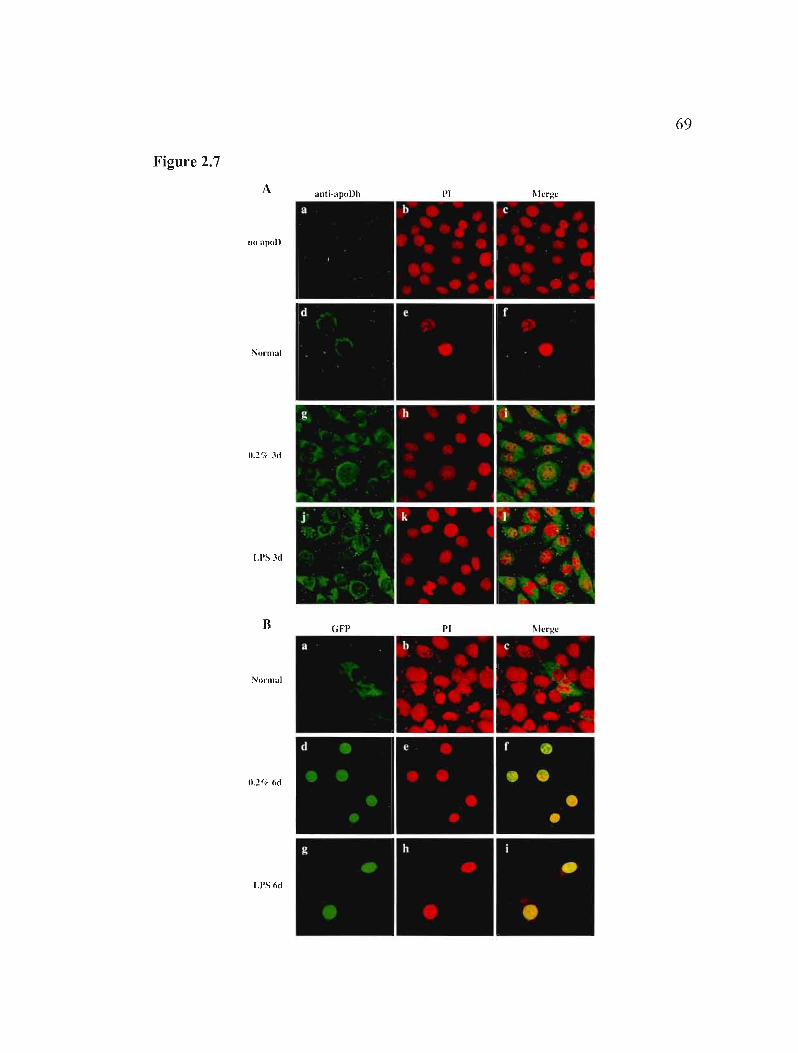
69
Figure 2.7
A anli-apoUh 1'1
IlU .[lUU
Normal
Il.2 'Ir .'lI
U'S 3d
Il Grl' PI I\ler!!e
Nur",al
I.I'S 6d
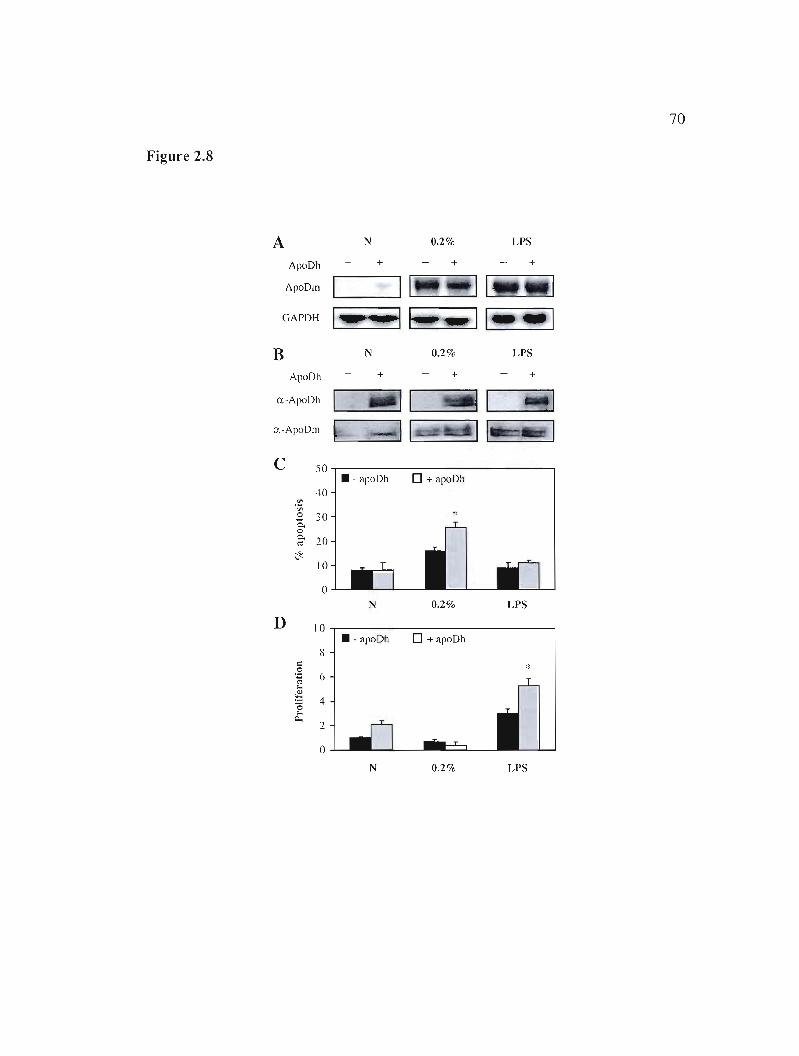
70
Figure 2.8
A ;'II 0.2% LPS
ApoDh + + +
i\poDm 11 Il 1 1
GAPDH I~~ ~.. II~"I N 0.2% LPSB
ApoDh + + +
a-ApoDh .11
D.-ApoDm ~ 1
c 50 • - apoDh 0+ apoDh
40 .\!? :Il
*.2 30 go;- 20
* 10
0 N 0.2% I.PS
D 10 • - apoDh 0+ apoDh
li :::.s: :::
6ro.. ~
4"0.. Q.,
"2
0
N 0.20/0 LI'S
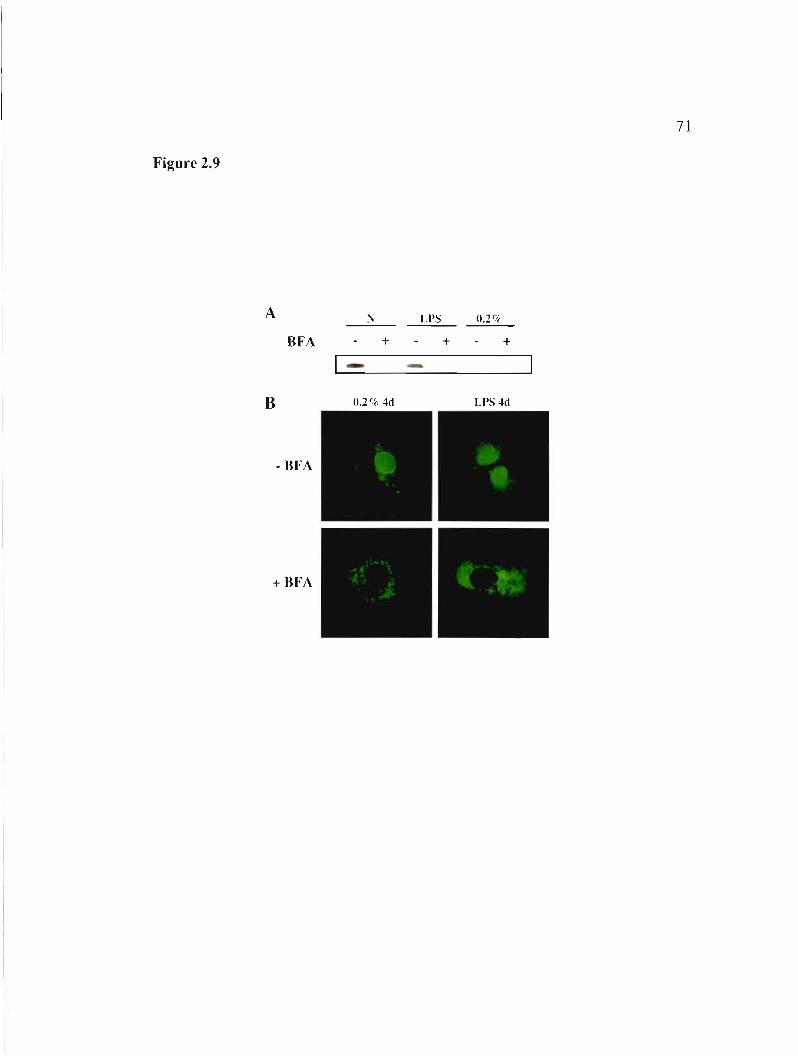
71
Figure 2.9
A LPS (U'i(
BFA + + +
-B n.2% 4e1 LPS 4e1
- BFA
+ BFA
CHAPITRE III
Human apolipoprotein D overexpression in transgenic mice induces insulin
resistance and alters lipid metabolism
Sonia Do Carmo, David Fournier, Catherine Mounier, Eric Rassart
2009
American Journal of Physiology-Endocrinology and Metabolism
Sous presse
73
Avant-propos
Nous avons démontré en chapitre Il que l'expression de l'apoD était
déclenchée en réponse à des stress spécifiques. Cependant, la fonction de cette
modulation de l'expression de l'apoD reste inconnue. Nous avons émis comme
hypothèse que l'apoD favorise une meilleure survie en réponse à des situations de
stress cellulaire. Étant donné l'importance de l' apoD dans le développement du
sytème nerveux et sa modulation dans la plupart des maladies neurodégénératives
dont certaines ont été étudiées dans notre laboratoire, nous avons choisi de tester cette
hypothèse dans un contexte neurodégénératif. Pour cela, nous avons d'abord généré
les souris H-apoD-Tg qui surexpriment l'apoD humaine dans les neurones, le type
cellulaire le plus affecté lors de maladies neurodégénératives. Nous avons opté pour
la surexpression de l' apoD humaine afin de la différencier de l' apoD endogène de
souris. Cependant, avant de soumettre ces souris à des traitements neurodégénératifs,
il était important de caractériser ces souris. Ces souris ne présentent pas de
différences morphologiques majeures au niveau du cerveau. Cependant, elles ont des
différences au niveau comportemental tel que présenté dans le chapitre IV suggérant
que l'apoD joue un rôle dans la fonction neuronale. De façon intéressante, nous avons
constaté que l'expression de l'apoD humaine ne se limitait pas au système nerveux.
Nous avons donc exploré l'influence de l'apoD humaine sur la composition cellulaire
et la biochimie sanguines de même que sur divers paramètres morphométriques et
tissulaires.
David Fournier a construit les transgènes et généré les souris transgéniques. Il
a aussi monté les colonies de souris transgéniques. J'ai ensuite repris le projet et j'ai
caractérisé les souris. J'ai donc été impliquée dans toutes les facettes de ce travail.
J'ai élaboré le design expérimental et fait la totalité du travail pratique. J'ai également
rédigé le manuscrit.
74
3.1 Résumé
L'apolipoprotéine D, une lipocaline largement exprimée, a la capacité de transporter de petites molécules hydrophobes. Même s'il a été proposé que l'apoD puisse avoir plusieurs fonctions et ligands et ce de façon tissu-spécifique, ceux-ci n'ont pas encore été clairement identifiés. Afin d'élucider quelques-unes de ces fonctions, nous avons généré des souris transgéniques surexprimant l'apoD humaine (H-apoD) sous le contrôle de promoteurs spécifiques aux neurones. Chez les souris Thy-l/ApoD et NSE/ApoD, l'expression de H-apoD est forte dans le système nerveux bien que détectée aussi faiblement dans les tissus périphériques comme le foie et les cellules sanguines. Ces souris démontrent des défauts métaboliques non entièrement anticipés. Ainsi, bien qu'elles ne soient pas obèses et qu'elles aient un niveau normal de lipides en circulation, les souris Thy-l/ApoD et NSE/ApoD sont intolérantes au glucose, résistantes à l'insuline et elles développent une stéatose hépatique. Cette stéatose et la résistance à l'insuline qui lui est associée sont corrélées avec des déficiences dans les voies signalétiques de l'insuline et dans la lipogenèse hépatique. Cependant, elles ne sont pas fortement corrélées à la présence d'inflammation. Par ailleurs, l'altération de la réponse à l'insuline n'est pas causée par une diminution de la leptine circulante ni par une modulation des niveaux d'adiponectine ou de résistine. Ces résultats suggèrent que des variations des niveaux et/ou des sites d'expression de l'apoD influencent les métabolismes des lipides et du glucose, consolidant ainsi l'apoD comme une cible pour les maladies reliées à la résistance à l'insuline.
Mots-clés: résistance à l'insuline, métabol isme lipidique, stéatose hépatique, inflammation, longévité.
75
3.2 Abstract
Apolipoprotein D (apoD), a widely expressed lipocalin, has the capacity to transport small hydrophobie molecules. Although it has been proposed that apoD may have multiple tissue-specifie, physiological ligands and functions, these have yet to be identified. To gain insight in sorne of its functions, we generated transgenic mice overexpressing human apoD (H-apoD) under the control of neuron-specifie promoters. In Thy-l!ApoD and NSE/ApoD mice, expression of H-apoD was strong in the nervous system although weakly detected in peripheral organs such as the liver and blood cells. These mice displayed not entirely anticipated metabolic defects. Although they are not obese and have normal lipid concentration in circulation, Thyl!ApoD and NSE/ApoD mice are glucose intolerant, insulin resistant and develop hepatic steatosis. The steatosis and its associated insulin resistance are correlated with impairments in insulin signaling and hepatic lipogenesis. However, they are not strongly related with inflammation. This impaired insulin response is not caused by a decrease in circulating leptin or a modulation of adiponectin and resistin levels. These results suggest that variations in the levels and/or sites of apoD expression influence the lipid and glucose metabolism, consolidating apoD as a target for insu lin resistance related disorders.
Keywords: insulin resistance, lipid metabolism, hepatic steatosis, inflammation, longevity.
76
3.3 Introduction
Apolipoprotein 0 (apoD) is a member of the lipocalin superfamily of small
hydrophobie molecule transporters. ApoD was first detected in 1963, in association
with plasma lipoproteins (Ayrault-Jarrier et al. 1963b). Since then, apoD was related
with many physiological and pathological conditions and several potential ligands
were identified: arachidonic acid (AA), progesterone, pregnenolone, bilirubin,
cholesterol and E-3-methyl-2-hexenoic acid (reviewed in Rassart et al. 2000).
ApoD is widely expressed in vertebrates both du ring development and
adulthood. In humans, it is poorly expressed in liver and intestines, the major sites of
synthesis of other apolipoproteins. It is mainly expressed in the adrenal glands,
kidneys, pancreas, placenta, spleen, lungs, ovaries, testes, brain, peripheral nerves and
cerebrospinal fluid (Drayna et al. 1986). ln mouse, apoD is mostly expressed in the
central nervous system (CNS) (Séguin et al. 1995), mainly in glia but also in nemons.
lt is also found at high levels in adipose tissue and at lower levels in other tissues
(Cofel' and Ross 1996, Yoshida et al. 1996). Therefore, it has been proposed that
apoD may have multiple tissue-specifie, physiological ligands and functions (Rassart
et al. 2000, van Dijk et al. 2006).
Both the apoD transcript and/or protein are altered in a broad range of
conditions. Those include cellular growth, differentiation and stress response (Provost
et al. 1991a, Lopez-Boado et al. 1994, Do Carmo et al. 2002, 2007), different types
of cancer (van Dijk et al. 2006) and several neurological disorders such as
Alzheimer' disease, stroke (Terrisse et al. 1998), schizophrenia (Thomas et al.
2001b), Parkinson's disease (Ordofiez et al. 2006) and animal models of nervous
system pathology (Boyles et al. 1990a, Terrisse et al. 1999). ApoD is also involved in
diverse aspects of lipid metabolism. ApoD gene polymorphisms affect plasma lipid
levels (Desai et al. 2002) and can be used as a genetic marker for obesity,
77
hyperinsulinemia and non-insulin-dependent diabetes mellitus (Baker et al. 1994,
Vijayaraghavan et al. 1994). Furthermore, apoD may participate in lipid transfer and
reverse cholesterol transport by directly binding cholesterol (Patel et al. 1997) or by
its association with apoA-l, lecithin-cholesterol acyltransferase (LCAT) and
cholesteryl ester transfer protein (CETP) in high-density lipoprotein (HDL) fractions
(Steyrer and Kotner 1988). Because of its capacity to bind AA, apoD contributes to
membrane phospholipid metabolism by stabilizing AA levels in cellular membranes
(Thomas et al. 2003d). An involvement in lipid redistribution after peripheral nerve
injury was also suggested (Boyles et al. 1990a). Moreover, apoD was documented as
a liver X receptor (LXR) responsive gene (Hummasti et al. 2004) and couId play an
important role in the modulation of the lipogenesis/lipolysis balance in adipocytes by
transporting ligands for LXR or ppAR or participating in LXR-dependent reverse
cholesterol transport (Hummasti et al. 2004). Finally, apoD plays a role in the control
of food intake and body weight by interacting specifically with the cytoplasmic
portion of the long form of the leptin receptor Ob-Rb (Liu et al. 2001). Therefore, it is
not surprising to find apoD modulation in conditions presenting a deregulation of
lipid metabolism such as Tangier disease (Alaupovic et al. 1981), familial LCAT
deficiency (Albers et al. 1985), mutations in the apoA-1 gene (Deeb et al. 1991) or in
conditions leading to lipid accumulation as type 2 diabetes (Hitman et al. 1992) and
mouse models of Niemann-Pick disease type C (Yoshida et al. 1996).
Abnormal lipid metabolisrn contributes to several neurodegenerative
disorders, including Alzheimer's and Parkinson's diseases. The involvement of apoD
in both lipid metabolism and neurological disorders suggest a central role in
neurodegeneration and/or repalL Still, the precise role of apoD remains
undetermined. Recent reports indicate a protective effect as it counteracts aging and
oxidative stress (Ganfornina et al. 2008, Sanchez et al. 2006, Walker et al. 2006). ln
an attempt to reveal sorne aspects of the apoD function, we generated mice
overexpressing human apoD (H-apoD) in the CNS. We chose to overexpress H-apoD
78
because it allows its discrimination from the endogenous apoD. During the
characterization process, we observed that H-apoD overexpression affects the
metabolism of glucose and lipids of these mice in a promoter's strength depending
manner and also expression pattern. These defects correlate with impaired insulin
signaling and hepatic lipogenesis. However, they do not correlate with increased
inflammation or altered adipokine signaling. It therefore appears that a slight
modulation of apoD expression in specifie tissues could alter the glucose and lipid
metabolisms.
79
3.4 Materials and methods
3.4.1 AnimaIs
Ali the experimental procedures were approved by the Animal Care and Use
Committee of Université du Québec à Montréal. Animais were housed at 24 ± 1°C in
a 12 h light/dark cycle and fed a standard rodent chow ad libitum (Charles River
rodent chow #5075, St-Hubert, QC) with free access to water. Experiments were
carried out with 11-13 month old male animais, unless otherwise noted. Blood
samples were collected for hematology and serum analysis. Tissues were collected,
frozen in dry ice, and kept at -SO°e. Sections of tissues were also frozen in HistoPrep
Frozen Tissue Embedding medium (Fisher Scientific, Ottawa, ON) or fixed in 4%
paraformaldehyde and embedded in paraffin for histological analysis.
3.4.2 Generation of H-apoD transgenic mice
The plasmid ApoD/BGH/pBSSK generated in our lab and compnsmg the
human apoD coding sequence fol1owed by the bovine growth hormone (BGH)
polyadenylation signal in pBluescript II SK (Stratagene-VWR, Ville Mont-Royal,
QC) was used for the transgene construction. Briefly, for the Thy-l/ApoD construct,
the promoter, the first exon, the first intron and the 5' non-coding region of the
second exon of the human Thy-l gene (~3.5 kb) (generous gift from 1. Silver, New
York University Medical Center) were c10ned upstream of the apoD coding sequence
in plasmid ApoD/BGH/pBSSK (Ganfornina et al. 200S). The NSE/ApoD construct
was generated similarly with the 5' non-coding region of the rat neuron-specific
enolase (NSE) gene (~ 1.S kb) (generous gift from G. Sutc1iffe, Scripps Research
Institute, La Jolla). Each transgene fragment was excised from its plasmid by
digestion and prepared for microinjection by agarose gel electrophoresis and
extraction with QIAEX II Gel extraction kit (Qiagen, Mississauga, ON).
80
Microinjection into the pronuclei of fertilized C57BL/6 x CBA zygotes was
performed by standard procedures at the McGill transgenic facility (Montreal, QC).
Transgenic animais were identified by PCR and Southem blot analysis of genomic
DNA isolated from 3 weeks-old mouse tail biopsies. Ali mice were backcrossed inta
C57BL/6 genetic background for at least 8 generations to ensure phenotype stability.
Genotyping was performed by PCR using an apoD-specific primer (5' CCC AAT
CCT CCG GTG CAG GAG AA 3') and a BGH-specific primer (5' GAA GGC ACA
GTC GAG GCT GAT CAG 3 '), producing a 0.6 kb fragment in transgenic mice (Fig.
3.1C).
3.4.3 Southern blot analysis
BamHI-digested genomic DNA was separated on a 0.8% agarose/TAE gel,
denatured, transferred to Osmonics Nylon Transfer Membrane (Fisher Scientific,
Ottawa, ON) and UV-fixed for 3 min. The membranes were hybridized with [a
32P]dCTP-labeled probe corresponding to each transgene, exposed to Biorad
Imaging screen K and revealed with a PhosphorImager (Biorad Molecular Imager
FX). Copy standards are prepared by mixing non-transgenic tail DNA with a known
amount of transgene DNA.
3.4.4 RNA extraction, northern blot analysis and semi-quantitative RT-PCR
Extraction of total RNA was performed with the Trizol reagent (Invitrogen,
Burlington, ON). Total RNA (lO)lg) was separated on 1.5% (wt/vol) agarose
formaldehyde gels and blotted to a nylon membrane. The membranes were
hybridized with [a-32P]dCTP-Iabeled human ApoD, mouse apoE or mouse GAPDH
cDNAs as described above. Total RNA was also reverse transcribed using Ornniscript
RT kit (Qiagen) and amplified with human apoD, PPARa, PPARy, FAS, LFABP,
SREBP-lc or HPRT specifie primers (Table 3.1). A control amplification of reverse
81
transcription reaction without the addition of reverse transcriptase was used to ensure
that there was no DNA contamination.
3.4.5 Immunoblotting
Tissues were homogenized in Iysis buffer (50 mM Tris-HCI pH 7.3, ISO mM
NaCl, 5 mM EDTA, 0.2% Triton X-IOO, and 10% Complete protease inhibitors
(Roche, Mississauga, ON)). After 30 min. of incubation at 4°C, lysates were
sonicated and cleared by centrifugation. The prote in concentration was determined
using a protein assay reagent (Bio-Rad Laboratories, Mississauga, ON). Ali extracts
were stored at -80°C. For each sample, 10 )..tg ofprotein were loaded and separated on
a 12% SDS-polyacrylamide gel. The proteins were then transferred to PYDF
membranes blocked with 10% milk and incubated with the primary antibodies:
human apoD mouse monoclonal antibody (2B9), 1: 100000; GAPDH rabbit
polyclonal antibody (Calbiochem, La Jolla, CA), 1:4000; phospho-Akt (Ser473)
rabbit polyclonal antibody (Cel1 signaling-NEB, Pickering, Ontario), 1: 1000, Akt
rabbit polyclonal antibody (Cell signaling), 1: 1000. These primary antibodies were
then detected with appropriate HRP-conjugated secondary antibodies and visualized
by chemiluminescence (Amersham ECL, GE-Healthcare, Baie d'Urfé, QC) and X
ray film.
3.4.6 Blood analysis
Blood hematology and serum biochemistry were carried out by the Diagnostic
and research support service of McGill University Animal Resources Center
(Montreal, QC). Levels of cytokines and adipokines in serum were determined by
SearchLight technology at the SearchLight Sample Testing Service of Pierce
Biotechnology (Wobum, MA). Free fatty acids (FFA) levels were measured using a
colorimetrie kit (MBL International, Woburn, MA).
82
3.4.7 Competitive ELISA
Human apoD in plasma was quantified by ELISA using the human apoD
monoclonal antibody 2B9 as previously described (Terrisse et al. 1998). Brief1y,
microtiter plates were coated with antigen (1 Ilg apoD/ml) in 5 mM glycin buffer (pH
9.2) and incubated overnight at 4°C. The wells were washed with PBS-Tween 0.25%
and saturated with PBS-BSA 1% for 1 h. A mixture that was previously incubated
overnight and containing diluted plasma and 2B9 antibody in PBS-BSA 1% then
replaced the saturation solution. After 2 h of incubation, wells were washed. Bound
2B9 antibody was detected by peroxidase labeled anti-mouse IgG (KPL,
Gaithersburg, MD) and revealed with ABTS substrate (KPL). Optical density was
measured at 410 nm. Ali quantifications were performed in triplicate with 10
mice/genotype.
3.4.8 Liver lipid content
Fresh tissues were weighed in a precision balance, eut in small pieces and
dried in glass vials placed in beU jar with dessicant under vacuum for 24 h. Tissues
were then re-weighed to calculate dry tissue weight. Neutral lipids were extracted
from tissues with diethyl ether for 24 h (2 extractions with 10 ml). Tissues were dried
again for 24 h and re-weighed to obtain the fat-free dry weight. Total lipid content
was calculated as: (dry tissue weight- fat-free dry tissue weight) x lOO/dry tissue
weight. Total cholesterol (cholesterol and cholesteryl ester) and triglycerides were
quantified using colorimetrie kits according to the manufacturer's instructions
(Biovision Cedarlane, Burlington, ON).
83
3.4.9 TBARS assay
The extent of oxidation in transgenic tissues was determined by the
thiobarbituric acid reactive substance (TBARS) assay. Liver tissue was homogenized
in cold PBS IX (3 /lI PBS per mg of tissue) in presence of 5 mM butylated
hydroxytoluene. A 12 /lI aliquot of tissue extract was incubated with 390 /lI of 0.2 M
glycine-HCL, pH 3.6 and 250 /lI of fresh TBA reagent (0.5% TBA, 0.5% SOS).
Samples were incubated 15 min at 90°C and cooled on ice prior to a triplicate reading
of the absorbance at 532 nm. Values were normalized by the lipid content of each
sample.
3.4.10 Histology
The paraformaldehyde-fixed liver tissue was processed and embedded in
paraffin and 5 /lm-thick paraffin sections were stained with hematoxylin and eosin for
histological analysis. To visualize lipids, frozen sections (1°/lm thick) were stained
with 0.5% Oil RedO in propylene glycol.
3.4.11 Intraperitoneal glucose and insulin tolerance tests (IPCTT and ITT)
For the glucose tolerance test, mice fasted overnight (12-15 h) were injected
intraperitoneally with O-glucose (2 g/kg body weight). For the insu lin tolerance test,
mice were fasted for 5h before intraperitoneal injection of human regular insulin
Humulin R (Elli Lilly Canada Inc., St-Laurent, QC) (1.5 U/kg body weight). Their
body weights before and after fasting were recorded to the nearest gram unit. Blood
samples were collected from the saphen vein 0, 15, 30, 45, 60, 90, and 120 min after
the injections. Blood glucose and serum insulin levels were measured with the Accu
Chek Advantage Glucose Monitor and test strips (Roche) and the rat/mouse insulin
ELISA kit (Linco/Millipore, MA), respectively. The area under the glucose curve in
84
the IPGTT was calculated by the trapezoid rule from the glucose measurements.
Glucose levels in the ITT were expressed as percentages of initial blood glucose
concentrations. The mice were allowed to recover for 2 weeks between experiments.
3.4.12 In vivo hepatic VLDL-triglyceride production
VLDL secretion was measured in 10 hours-fasted animais (1 year old).
Control and H-apoD Tg mice were injected via the tail vein with 12% (v/v) Triton
WR1339 (Tyloxapol; Sigma-Aldrich, Oakville, ON; 5 ml/kg body weight) diluted in
PBS. Blood samples were taken before (t 0) and 30, 60 and 90 min after Triton
injection. Triglyceride content was measured as described above. The secretion rate
was calculated from the slope of the individuallines and expressed as ~lmol/kg/h.
3.4.13 Statistical analysis
Results are expressed as mean ± SE. Statistical analysis was perfonned with
Prism 5 software (GraphPad, San Diego, CA). The statistical significance from
control values was detennined by Student's t-test. Values were considered to be
significant at p<0.05.
8S
3.5 Results
3.5.1 Generation of H-apoD transgenic mice
We generated and used two transgenic mouse lines overexpressing H-apoD in
neurons under the control of the Thy-l (Ganfornina et al. 2008) or the NSE promoters
(Fig. 3.lA). We chose to overexpress the H-apoD because it allows its discrimination
from the endogenous apoD and because the two proteins are highly homologous and
are believed to achieve the same function both in humans and mice. For each
transgene, three independent mouse lines that had integrated and were able to
transmit the transgene were generated and analyzed. However, since the behavioral,
molecular, biochemical and general health characterization demonstrated similar
phenotypes, only one line for each transgene was included in this study (Thy
1/ApoD-555; NSEIApoD-182-4). The presence and the number of integrations of the
transgene fragment and its transmission through the germline was first verified by
Southern blot analysis. Thy-1/ApoD and NSEIApoD integrated 8 and 12 copies of the
corresponding transgene, respectively, as determined by densitometric comparison
with copy standards (Fig. 3.lB). Subsequently, H-apoD transgenic (H-apoD Tg) mice
were identified by PCR genotyping. Only those mice where the apoD and BGH
primers amplified a 0.6 kb band were considered transgenic (Fig. 3.1 C).
3.5.2 Expression of human apoD in H-apoD Tg mice
The expression of each transgene was then analyzed in different tissues. By
northern blot analysis, H-apoD was found expressed mainly in the nervous system, as
expected (Fig. 3.2A). Immunoblotting on total brain extracts confirmed the presence
of H-apoD protein in these tissues (Fig. 3.2B). As anticipated, in Thy-1/ApoD mice,
H-apoD expression is stronger and is expressed in ail brain regions (Gordon et al.
1987). The weaker expression in NSE/ApoD mice (Fig. 3.2B) is explained by the
86
strong expression of this gene in the grey but not in the white matter of the brain
(Forss-Peter et al. 1990). H-apoD protein was also weakly detected in the liver with a
slightly stronger signal in Thy-l/ApoD mice (Fig. 3.2B) but was undetectable in
adipose tissue (data not shown). H-apoD protein was also detected in circulation in
the plasma (Thy-l/ApoD: 5.35 ± 0.93 flg/ml, NSE/ApoD: 4.69 ± 0.71 flg/ml, as
measured by ELISA.
Because of its greater sensitivity, semi-quantitative RT-PCR was also used ta
analyze the transgene expression. Using H-apoD and internai control HPRT specifie
primers, we could determine that, in the Thy-l/apoD mice, H-apoD is expressed in ail
the central nervous system regions tested but at lower levels in spinal cord and in
midbrain (Fig. 3.2C). H-apoD expression was also detected in thymus, heart and liver
and to a lower extent in ovalies, testis, eyes and blood cells. In NSE/ApoD, H-apoD
was detectable in ail the nervous system except in the olfactive bulb witb a st ronger
expression in hippocampus, cerebeUum and spinal cord. It was also detected in blood
cells, muscle, liver and spleen (Fig. 3.2C). H-apoD expression was not observed in
white adipose tissue from inguinal and mesenteric fat pads (data not shown). These
expression patterns are in fuU agreement with the promoters used on the transgenes.
Even though Thy-l and NSE promoters were chosen to drive apoD expression into
neurons, they are also expressed by other tissues. Thus, human Thy-1 expression was
also reported in fibroblasts, myofibroblasts, endothelial ceUs, smooth muscle ceUs,
renal glomerular mesangial ceUs, NK ceUs and a subset of CD34+ ceUs in the bone
marrow, blood and thymus (Craig et al. 1993, McKenzie et Fabre 1981, Saalbach et
al. 1998). In the same way, a NSE expression was already reported in blood and
marrow leucocytes (Pechumer et al. 1993). NSE expression in the skeletal muscle
was unexpected and could be imputed on nerve fascicles running throughout the
muscle (Busacchi et al. 1999).
87
3.5.3 H-apoD overexpression has an effect on morphometrIc, serum and
hematological parameters
The two transgenic lines develop and breed normally. They have external
phenotype and food and water consumption similar to wild-type (WT) mice at a11
ages (data not shown). However, sorne phenotypic differences appeared with aging.
One-year-old Thy-l/ApoD and NSE/ApoD mice presented a liver significantly larger
than WT mice (30% and 21 % respectively). This modification did not significantly
affect the total body weight (Table 3.2). It is noteworthy that these transgenic mice
express H-apoD in the liver (Fig. 3.2C). Serum parameters of non-fasting mice did
reflect sorne of these differences (Table 3.3). Thus, NSEIApoD mice presented
increased ALT (alanine aminotransferase) and AST (aspartate aminotransferase)
levels which are indicative of liver congestion or damage. These increases were not
observed in Thy-liApoD mice which also present a larger liver (Table 3.2). However,
the later showed a slight although not significant increase in alkaline phosphatase
which also reflects liver function. In addition, Thy-l/ApoD and NSEIApoD mice
showed elevated serum insu lin suggesting insu lin resistance. Of note, 3-months-old
H-apoD Tg mice did not show hyperinsulinemia (data not shown). Moreover, the
hyperinsulinemia was connected with feeding as H-apoD Tg mice displayed normal
basal fasting insulin levels (Fig. 3.3C) but developed fed hyperinsulinemia (Table
3.3). Furthermore, NSEIApoD mice presented high creatinine levels often seen in
kidney dysfunction or muscle degeneration (Table 3.3). It is noteworthy that
NSE/ApoD mice express the transgene in muscle (Fig. 3.2C). ln spite of that,
circulating cholesterol, HDL, triglycerides and free fatty acids levels remained
unaffected (Table 3.3). Also of note, adipocyte diameter in inguinal fat was similar in
the two transgenics and WT mice (data not shown). Blood cell populations were also
affected by the H-apoD overexpression in transgenic mice (Table 3.4). H-apoD Tg
and especially NSE/ApoD mice presented an elevated leukocyte number (WBC,
white bJood cells) caused by increased neutrophil and lymphocyte concentrations. In
88
NSEIApoD mice, the raised WBC count was also associated with an increased
monocyte count. Thy-l/ApoD and NSEIApoD mice also had an augmented platelet
count.
3.5.4 H-apoD Tg mice show glucose intolerance and insu lin resistance
The increased fed plasmatic insulin levels in H-apoD Tg mice (Table 3.3) can
be related to abnormal glucose homeostasis and we examined this by lPGTT (Fig.
3.3). After intraperitoneal glucose injection to fasting mice, the serum glucose raised
significantly in Thy-l/ApoD mice and to a lesser extent in NSEIApoD mice,
compared to WT littermates. The hyperglycemia was sustained up to 120 min in Thy
l/ApoD but was no longer observed at 90 min in NSE/ApoD mice (Fig. 3.3A). The
integrated net rise in glucose levels above the fasting levels, calculated as the area
under the LPGTT curve (Fig. 3.3 B), further demonstrated the glucose intolerance in
H-apoD Tg mice. These two transgenic lines also showed increased insulin levels
during IPGTT at 30 min after glucose administration (Fig. 3.3C). The increased
insulin levels of these two transgenic lines during IPGTT (Fig. 3.3C) suggest that
glucose intolerance must be due to the resistance of tissues to the insulin action. The
presence of insulin resistance in Thy-l/ApoD and, less importantly, in NSEIApoD
mice was confirmed by the reduced decline of blood glucose after the administration
of insulin in ITT (Fig. 3.30).
3.5.5 H-apoD Tg mice develop hepatic steatosis
Since Thy-l/ApoD and NSE/ApoD mice exhibited hepatomegaly (Table 3.2)
and altered levels of indicators of hepatic function (Table 3.3), liver histology was
examined. As shown by hematoxylin-eosin and Oil RedO staining, Thy-l/ApoD and
NSEIApoD livers showed severe steatosis (Fig. 3.4B-C, E-F). The steatosis was
further confirmed by the quantification of the liver lipid content (Fig. 3.4G). This
89
steatosis corresponded to an increase in triglycerides but not in total cholesterol levels
(Fig. 3.41-J). However, the lipid peroxidation levels, measured as thiobarbituric acid
reactive substances, were similar in WT and H-apoD Tg mice, when normalized by
the total lipid content (Fig. 3.4H). Lipid accumulation in muscle was also examined.
A mild muscle steatosis appeared in Thy-I/ApoD, and NSE/ApoD mice (data not
shown).
3.5.6 Mechanisms of insulin resistance and steatosis
To investigate the mechanisms underlying lipid accumulation impaired
glucose tolerance and insulin sensitivity in H-apoD Tg mice, we examined the effect
of H-apoD overexpression on lipid metabolism and insulin signaling components in
the liver of mice fed ad libitum. Akt is a key molecule downstream of PB-kinase,
which mediates the metabolic activity of insulin. Both Thy-l/ApoD and NSEIApoD
mice exhibited a 40% decrease in Akt phosphorylation at Ser473 in liver (Fig. 3.5A).
Ali tissues were collected in the early morning, which may explain the high pAkt
levels. Hepatic steatosis can be caused by a decrease in lipid secretion.
Apolipoprotein E (apoE) deficiency was already associated with the development of
hepatic steatosis because of impairment in very low density lipoprotein (VLDL)
triglyceride secretion (Mensenkamp et al. 2001). Only NSE/ApoD mice showed
differences in this process with a 30% decrease of apoE transcription (Fig. 3.5C). The
rate of plasma triglyceride accumulation in fasting mice after intravenous injection of
Triton WR1339 was also measured. The VLDL-triglyceride secretion rate, calculated
from the slope of each individuallines, was not statistically different (Fig. 3.51).
Mice with hepatic steatosis also exhibited significantly increased expression
of liver-specific fatty acid binding prote in (LFABP), fatty acid synthase (FAS),
peroxisome proliferator-activated receptor gamma (PPARy) and sterol regulatory
element binding protein-1 c (SREBP-1 c), providing evidence that lipogenesis is
90
stimulated in these mice (Fig. 3.5D-G). Peroxisome proliferator-activated receptor
alpha (PPARa), which is involved in the lipid beta oxidation pathway, was also
stimulated in these mice (Fig. 3.5H). Muscle tissue also plays an important raie in
glucose metabolism and thus, the Akt phosphorylation at Ser473 was also tested in
this tissue. As in the liver, phosphorylation of Akt was inhibited by 60% in Thy
l/ApoD and by 40% in NSE/ApoD mice (Fig. 3.5B).
High serum levels of cytokines and adipokines were previously reported in
insulin resistance and steatosis and the modulation of leukocyte counts in H-apoD Tg
mice could have predict an immune response. Interestingly, H-apoD Tg mice
displayed similar or even decreased levels of most of the cytokines tested compared
with WT mice (Fig. 3.1S). The circulating levels of the adipokines leptin, adiponectin
and resistin were also measured. Only leptin showed variations in its levels with a 2
fold increase in NSE/ApoD mice (Fig. 3.IS).
91
3.6 Discussion
Since its isolation from HDL particles in 1976 (McConathy and Alaupovic
1976), apoD was reported associated with many processes. However, the precise
physiological function(s) of this protein still remains unclear. Sorne beneficial roles
were assigned to apoD. ApoD is thought to be involved in the regeneration and
reinnervation processes after nervous tissue injury (Boy les el al. 1990a, Ong el al.
1999, Rickhag el al. 2006, Terrisse el al. 1999). ln addition, apoD has been described
as a marker of differentiation and good prognosis in cancer (Diez-ltza el al. 1994). lt
also plays a protective role in stress situations (Ganfornina el al. 2008, Sanchez el al.
2006, Walker el al. 2006). Paradoxically, apoD was also associated with neuronal
death (Franz el al. 1999), oxidative stress (Alvarez el al. 2003) and tumor progression
(Ryu el al. 2001).
ln order to gain insight into sorne aspects of the apoD function, we generated
two transgenic mice lines overexpressing H-apoD. Here, we demonstrate that
overexpression of H-apoD driven by neuronal promoters in mice results in an
interesting, although not entirely anticipated alteration of the glucose/insulin
metabolism. More precisely, the presence of H-apoD amplifies the insulin resistance
that occurs with aging, as 3 months-old mice have similar insu lin levels
independently of genotype. This was first suggested by elevated insulin plasma
concentration in non-fasting one-year-old mice and explored by IPGTT and lTT. The
results show that, although H-apoD Tg mice are not obese and present normal food
intake and normal Iipid levels in circulation, they develop glucose intolerance and
insulin resistance with aging. This insu lin resistance is associated with lipid
accumulation in the liver, where it causes hepatomegaly, as evidenced by histology
and abnormal liver function parameters in serum. A strong connection between lipid
accumulation in liver and insulin resistance was already reported (Kraegen el al.
2001).
92
The slight H-apoD expressIOn In the liver might contribute to fat,
predominantly triglycerides, accumulation and insulin resistance. Being a secreted
protein, and expressed namely by blood ce Ils, H-apoD was found circulating in the
plasma and thus, it could also account for lipid accumulation in the liver.
Accumulation of lipids in the liver is generally multifactorial.
One possible mechanism is the trapping of arachidonic acid, a well-known
apoD ligand, or other fatty acids by H-apoD, therefore creating an imbalance favoring
fat accumulation versus its elimination by the liver. In addition, given that
polyunsaturated fatty acids can inhibit SREBP-l c expression (Yoshikawa el al.
2002), the trapping of fatty acids by H-apoD couId support the activation of SREBP
l c expression induced by insulin resistance and thus favor lipid accumulation in the
liver. Another potential source of lipid accumulation is an increase in the hepatic lipid
uptake, but this seems unlikely as the circulating free fatty acids, triglycerides,
cholesterol and HDL levels are similar in ail mice. Still, we cannot rule out an
increased transport of lipids towards the liver by the circulating H-apoD because of
the potential apoD participation in lipid transfer and reverse cholesterol transport
(Patel el al. 1997, Steyrer el al. 1988). A defect in lipid oxidation can also be
involved in lipid accumulation. However, since the levels of PPARu, known ta
control the expression of many genes involved in lipid oxidation, are increased in
Thy-llApoD and NSEIApoD mice, probably as a compensatory mechanism, it seems
unlikely that defective lipid oxidation is the cause of liver steatosis. Moreover, lipid
accumulation can result from decreased removal of lipids from the liver. ApoE is
essential for VLDL-triglyceride synthesis and secretion, a main pathway of lipid
elimination in the liver and apoE deficiency promotes the development of hepatic
steatosis (Mesenkamp el al. 2001). The decreased apoE expression in NSEIApoD
mice suggested that an impaired lipid secretion might account for liver steatosis in
these mice. However, this possibility was ruled out, as the VLDL-triglyceride
secretion rate after Triton WR1339 administration was similar in H-ApoD Tg and
93
WT mice. Together with the fact that the decrease in apoE transcription was absent in
Thy-l/ApoD mice, this suggests that the apoE modulation unlikely results from H
apoD overexpression but could be related to another lipid-associated event and is then
of low pathologie importance. More likely, the mechanism for hepatic steatosis
development resides in an enhanced de novo lipogenesis by hepatocytes as LFABP,
FAS, SREBP-l c and PPARy transcripts are overexpressed. Given that Thy-llApoD
mice showed the strongest H-apoD expression in brain as weil as the strongest insulin
resistance, and given that, although weak, the H-apoD levels in the liver of these mice
were superior to the ones in NSEIApoD mice, we expected these mice to have a
greater hepatic steatosis. The surprisingly similar levels of fat accumulation in the
liver of both lines of H-apoD Tg mice suggests that the apoD effect on lipid
accumulation is subjected to a tight regulation. Still, the connection between H-apoD
expressIOn ln the liver and liver steatosis is not clear and requires further
examination.
The nature of the connection between steatosis and insulin resistance remains
unclear. The accumulation of lipid metabolites such as ceramides, diacylglycerol or
long chain acyl-CoA, inside skeletal muscle and liver, results in the downregulation
of insulin signaling and therefore in insu lin resistance (Schinner et al. 2005).
Phosphorylation on serine 473 of Akt, a key event of the insulin-signaling pathway, is
decreased in liver and in muscles of NSE/ApoD and Thy-l/ApoD mice. This
confirms the involvement of impaired insulin signaling in apoD-induced insulin
resistance. Counteracting mechanisms may explain the lower insulin resistance of
NSEIApoD mice. These mice show insulin-signaling (pAkt) impairment both in liver
and muscles. However, as these processes would predict a strong insulin resistance,
they may be tempered by the increased circulating lep tin, which promotes lipid
oxidation.
94
Several studies also suggest a link between oxidative stress and insulin
resistance. Indeed, intracellular accumulation of fatty acid metabolites contributes to
the production of reactive oxygen species (ROS). ROS contribute to hepatic insu lin
resistance through the activation of PKCs (Schinner et al. 2005). They also attack
polyunsaturated fatty acids and initiate lipid peroxidation. However, although H
apoD Tg mice featured hepatic steatosis, their Iipid peroxidation levels were not
increased. This suggests on one hand, that oxidati ve stress is not the cause of insulin
resistance and on the other, that H-apoD prevents the oxidative stress caused by lipid
accumulation. ApoD was already reported to play a protective role in oxidative stress
situations (Ganfornina et al. 2008, Sanchez et al. 2006, Walker et al. 2006).
ln addition, insu lin resistance in humans is associated with chronic low-grade
inflammation (Pacifico et al. 2006, Tilg et al. 2008). Whether inflammation causes
insulin resistance or is an epiphenomenon of fat accumulation is still unknown. ln this
perspecti ve, increased leukocyte counts in Thy-IIApoD and NSEIApoD mice
predicted higher serum cytokines levels. The absence of upregulation of most of the
cytokines tested would be in agreement with previous studies suggesting that apoD
may have anti-inflammatory properties as its expression is upregulated in response to
inflammatory stimuli (Blais et al. 1994, Do Carmo et al. 2007, 2008). However, the
presence of inflammation cannot be completely excluded.
It is also noteworthy that H-apoD is primarily expressed in neurons and that
H-apoD levels are directly correlated with the incidence of insulin resistance, as Thy
1/ApoD mice are more insulin resistant than NSEIApoD mice. H-apoD couId
interfere directly with leptin or insulin receptors in the arcuate (ARC), paraventricular
(PVH) and other hypothalamic nuclei. ApoD is involved in the leptin receptor signal
transduction pathway that controls appetite and body fat accumulation. lt interacts
specifically with the cytoplasmic portion of the long form of the leptin receptor, Ob
Rb. In hypothalamus, apoD transcription is stimulated by dietary fat and correlates
95
positively with adipose tissue mass and circulating leptin levels. However, this
positive association is lost in mice carrying a mutant leptin or Ob-Rb gene, in which
levels of hypothalamic apoD mRNA are reduced compared to those of WT mice (Liu
et al. 2001). H-apoD overexpression in the ARC or PVH couId cause a partial
desensibilization of the leptin receptor leading to a leptin resistance and further to an
insulin resistance. However, as H-apoD Tg mice do not show increased weight gain
or hyperphagia, a downregulation of the leptin pathway seems unlikely. Still, the
presence of H-apoD in neurons could interfere with the central regulation of insu lin
sensitivity.
Apart from lipid accumulation, H-apoD Tg mlce display other insu lin
resistance-associated features such as abnormal hematological parameters. Therefore,
in H-apoD Tg mice, insulin resistance is associated with abnormal leukocyte and
platelet concentration in blood. Hematological abnormalities are often associated with
insulin resistance in humans and an increased leukocyte count, particularly T cells,
was associated with the progression of atherasclerosis (Tanigawa et al. 2004). lt was
also reported that human platelets have insulin receptors that participate in the
regulation of platelet function. Insulin resistance, and its associated hyperinsulinemia,
promotes platelet activation, thus increasing the risk of cardiovascular disease.
In conclusion, these results pinpoint to the importance of a complex regulation
of apoD levels and sites of expression, which may influence apoD function and its
impact on glucose and lipid metabolism. Consequently, these results bring new
evidence for apoD as a potential target for glucose and lipid metabolism related
disorders. However, the molecular basis for the apoD raie in steatosis and insulin
resistance, as weil as its contribution to other components of the metabolism control
such as energy expenditure and response to high-fat diet have yet to be defined.
96
3.7 Acknowledgments
We are thankful to Diego Sanchez, Maria O. Ganfornina and Louise Brissette
for helpful discussions. We thank Marie Trudel for advises with the transgenic mice.
This work was supported by a Canadian Institutes for Health Research Grant (MOP
15677). OF was supported by FCAR and NSERC studentships. SOC was supported
by FRSQ, NSERC and UQAM studentships.
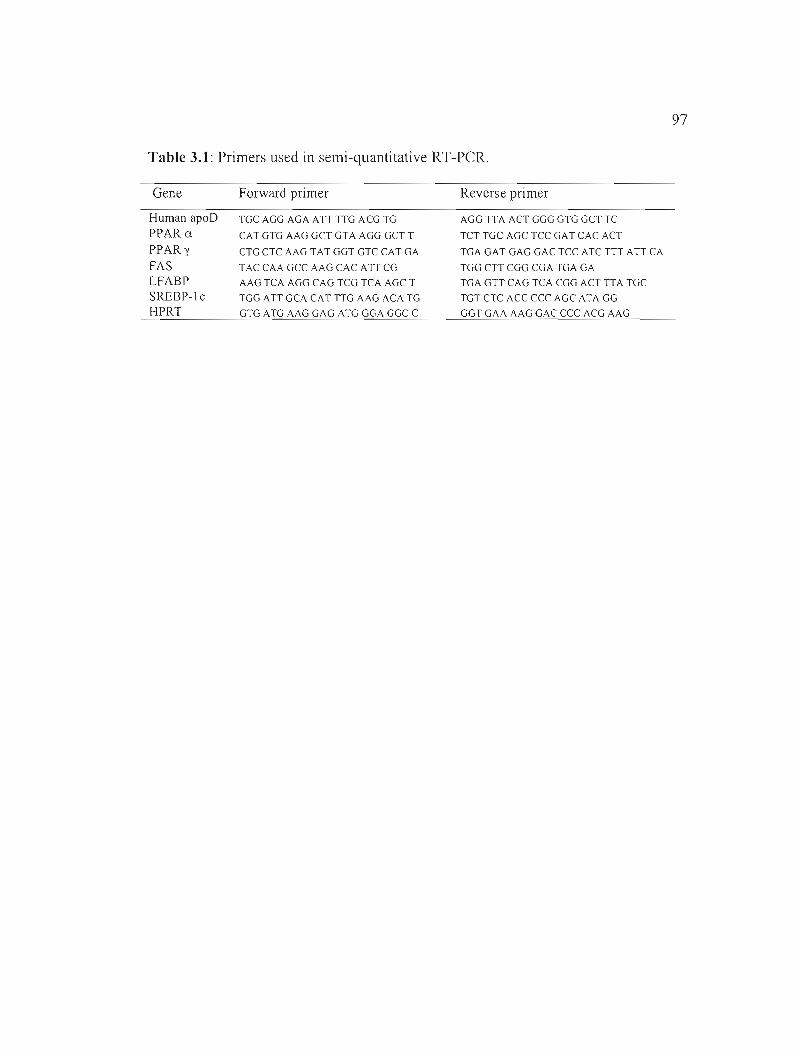
97
Table 3.1: Primers used in semi-quantitative RT-PCR.
Gene
Human apoD PPARa PPARy FAS LFABP SREBP-lc HPRT
Forward primer
TGC AGG AGA ATT TTG A CG TG
CAT GTG AAG GCT GTA AGG GCT T
CTG CTC AAG TAT GGT GTC CAT GA
TAC CAA GCC AAG CAC ATTCG
AAG TCA AGG CAG TCG TCA AGC T
TGG ATT GCA CAT TTG AAG ACA TG
GTG ATG AAG GAG ATG GGA GGC C
Reverse primer
AGG TTA ACT GGG GTG GCT TC
TCT TGC AGC TCC GAT CAC ACT
TGA GAT GAG GAC TCC ATC TTT ATT CA
TGG CTT CGG CGA TGA GA
TGA GTT CAG TCA CGG ACT TTA TGC
TGT CTC ACC CCC AGC ATA GG
GGTGAAAAGGACCCCACGAAG
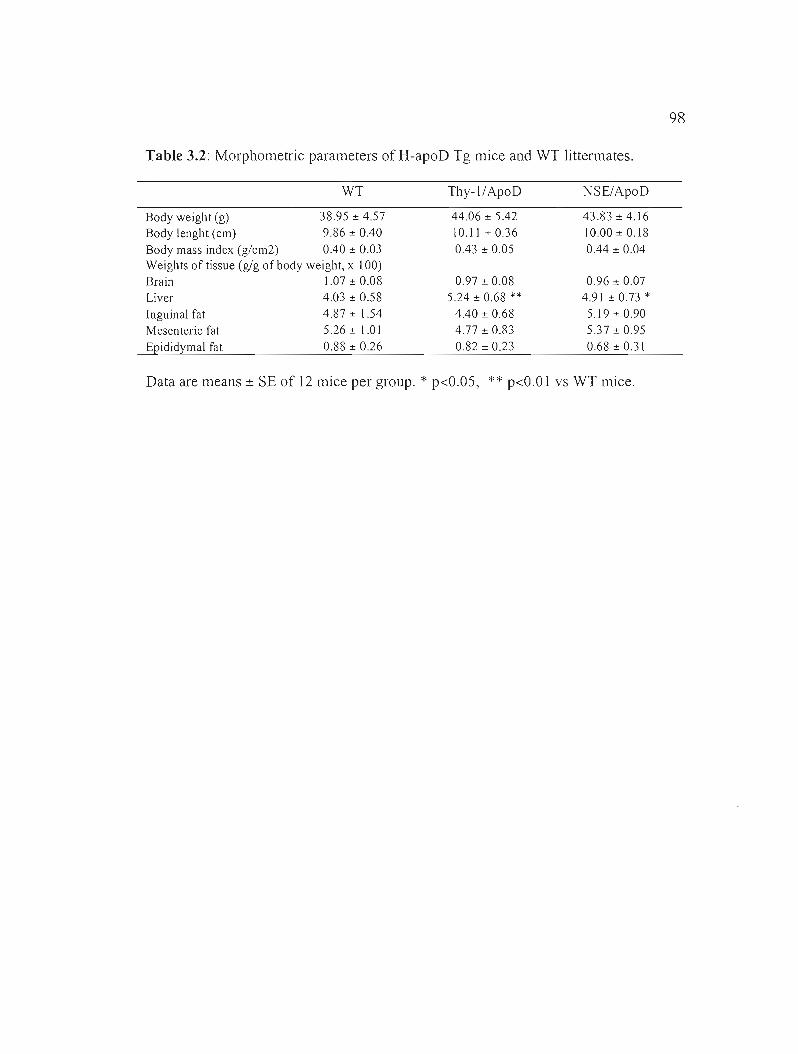
98
Table 3.2: Morphometric parameters of H-apoD Tg mice and WT littermates.
WT Thy-I/ApoD NSE/ApoD
Body weight (g) 38.95 ± 4.57 44.06 ± 5.42 43.83 ± 4.16 Body lenght (cm) 9.86 ± 0.40 10.11 ±0.36 10.00 ± 0.18
Body mass index (g/cm2) 0.40 ± 0.03 0.43 ± 0.05 0.44 ± 0.04 Weights of tissue (g/g ofbody weight, x 100) Brain 1.07 ± 0.08 0.97 ± 0.08 0.96 ± 0.07 Liver 4.03 ± 0.58 5.24 ± 0.68 ** 4.91 ± 0.73 * Inguinal fat 4.87 ± 1.54 4.40 ± 0.68 5.19 ± 0.90 Mesenteric fat 5.26 ± 1.01 4.77 ± 0.83 5.37 ± 0.95 Epididymal fat 0.88 ± 0.26 0.82 ± 0.23 0.68 ± 0.31
Data are means ± SE of 12 mice per group. * p<O.OS, ** p<O.OI vs WT mice.
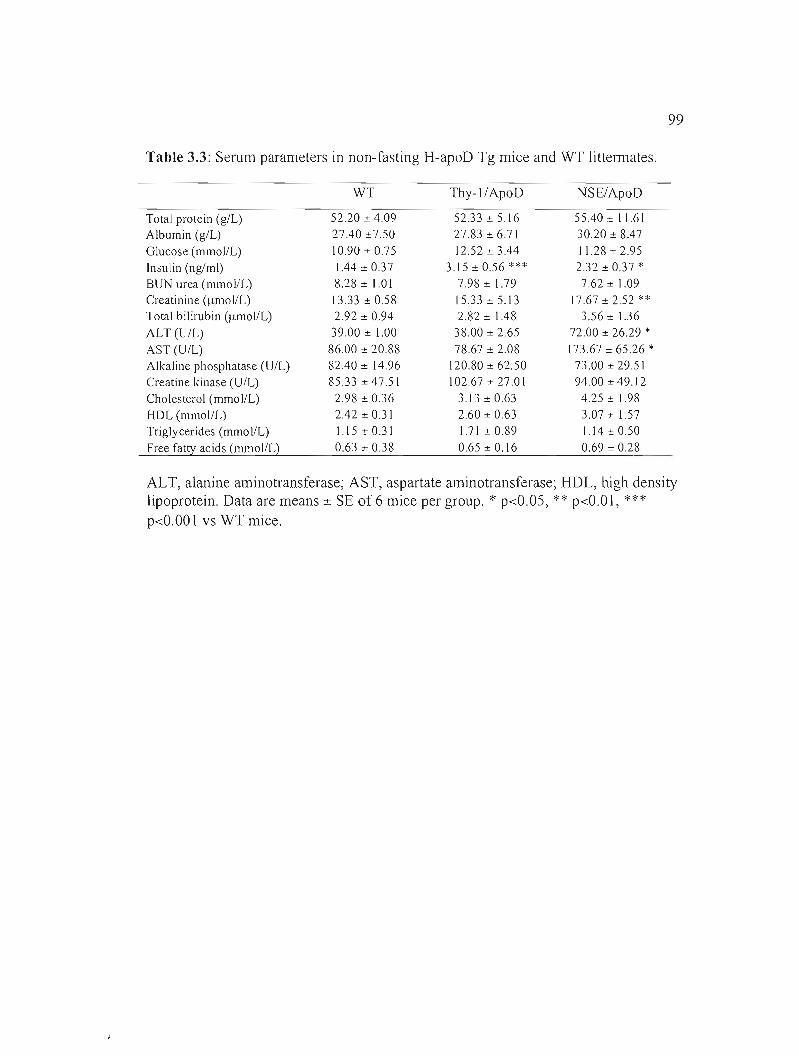
99
Table 3.3: Serum parameters in non-fasting H-apoD Tg mice and WT littermates.
WT Thy-I/ApoD NSE/ApoD
Total protein (g/L) 52.20 ± 4.09 52.33±5.16 55.40 ± 11.61
Albumin (g/L) 27.40 ±7.50 27.83 ± 6.71 30.20 ± 8.47
Glucose (mmoIlL) 10.90 ± 0.75 12.52 ± 3.44 11.28 ± 2.95
Insulin (ng/ml) 1.44±0.37 3.15 ± 0.56 *** 2.32 ± 0.37 * BUN urea (mmol/L) 8.28 ± \.01 7.98 ± 1.79 7.62 ± 1.09 Creatinine (~lmol/L) 13.33 ± 0.58 15.33 ± 5.13 17.67 ± 2.52 ** Total bilirubin (~mol/L) 2.92 ± 0.94 2.82 ± 1.48 3.56 ± 1.36 ALT (U/L) 3900 ± 1.00 38.00 ± 2.65 72.00 ± 26.29 * AST (UlL) 86.00 ± 20.88 78.67 ± 2.08 l73.67 ± 65.26 * Alkaline phosphatase (U/L) 82.40 ± 14.96 120.80 ± 62.50 73.00 ± 29.51 Creatine kinase (U/L) 85.33 ± 47.5l 102.67 ± 27.0l 94.00 ± 49. J 2
Cholesterol (mmol/L) 2.98 ± 0.36 3.l3±0.63 4.25 ± 1.98
HDL (mmol/L) 2.42 ± 0.31 2.60 ± 0.63 3.07 ± 1.57 Triglycerides (mmol/L) 1.15 ± 0.31 1.71 ± 0.89 1.14±0.50
Free fatty acids (mmol/L) 0.63 ± 0.38 0.65±0.16 0.69 ± 0.28
ALT, alanine aminotransferase; AST, aspartate aminotransferase; HDL, high density lipoprotein. Data are means ± SE of 6 mice per group. * p<O.05, ** p<O.Ol, *** p<O.OOl vs WT mice.
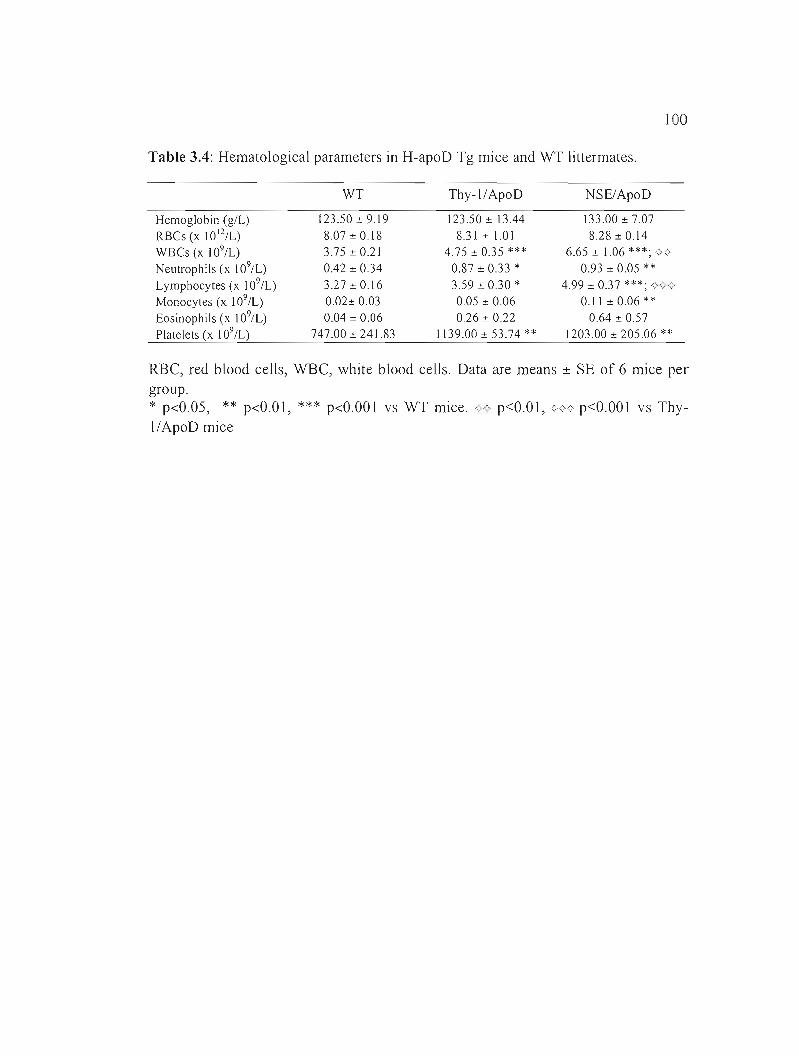
100
Table 3.4: Hemato1ogical parameters in H-apoD Tg mice and WT littermates.
WT Thy-I/ApoD NSE/ApoD
Hemoglobin (g/L) 123.50 ± 9.19 123.50± 13.44 133.00 ± 7.07 RBCs (x 1012/L) 8.07 ± 0.18 8.31 ± 1.01 8.28 ± 0.14 WBCs(x 109/L ) 3.75 ± 0.21 4.75 ± 0.35 *** 6.65 ± 1.06 ***;<>,> Neutrophils (x 109/L) 0.42 ± 0.34 0.87 ± 0.33 * 0.93 ± 0.05 ** Lymphocytes (x 109/L) 3.27±0.16 3.59 ± 0.30 * 4.99 ± 0.37 ***; .ç<;.<;
Monocytes (x 109/L) 0.02± 0.03 0.05 ± 0.06 0.11 ±0.06** Eosinophils (x 109/L) 0.04 ± 0.06 0.26 ± 0.22 0.64 ± 0.57 Platelets (x 109IL) 747.00 ± 241.83 1139.00 ± 53.74 ** 1203.00 ± 205.06 **
RBC, red b100d cells, WBC, white blood cells. Data are means ± SE of 6 mice per group. * p<O.OS, ** p<O.O 1, *** p<O.OO l vs WT mice. <)-A p<O.O 1, <><><> p<O.OO 1 vs Thyl/ApoD mice
101
3.8 Figure legends
Figure 3.1: Structure of the H-apoD transgene and analysis of transgenic mice.
A) The promoterlenhancer region (open box) of the Thy-l or Neuron Specifie
Enolase (NSE) genes were fused to the H-apoD coding sequence (black) followed by
the bovine growth hormone (BGH) polyadenylation signal (grey). B: BamHI, H:
HindIII, K: Kpnl, RI: EcoRI, SIX: SalI/XhoI, X: XbaI. The transgenes were excised
by digestion with EcoRI/XhoI (Thy-l/ApoD; 4,5 Kbp) or EcoRI/Kpnl (NSE/ApoD; 3
Kbp). B) Southern analysis of transgenic mice. BamHI-digested genomic DNA (la
~g) was analyzed using the corresponding transgene as a probe. Copy standards (left)
corresponding to 1 (l c) or 10 (1 Oe) copies of the transgenes are used to estimate the
transgene copy number. C: Representative PCR genotyping of the mice. A band (0.6
kbp) is amplified with H-apoD and BGH primers in the two transgenic, but not in WT
mlce.
Figure 3.2: Analysis of the transgene expression. A) Northern blot analysis of total
RNA with a H-apoD specific probe. Equal loading was determined by subsequent
hybridization with a GAPDH probe. H-apoD is mainly expressed in the CNS. B)
Immunoblot showing H-apoD protein expression in the transgenic brains and livers.
An anti-GAPDH polyclonal antibody was used for normalization. C) Semi
quantitative RT-PCR analysis of different tissues with H-apoD specific primers.
HPRT amplification was used as an internai control. Medulla: medulla oblongata.
Muscle: skeletal muscle. Results are representative of three separate experiments.
Figure 3.3: In vivo analysis of glucose tolerance and insulin sensitivity. A) Blood
glucose levels during the intraperitoneal glucose tolerance test (lPGTT),
demonstrating the hyperglycemic response to the load in Thy-l/ApoD and
NSE/ApoD transgenic mice (2 g/kg body weight on 12-15h fasting animaIs). B) Net
glucose release above basal levels quantified by the integration of the area under the
102
curve during 1PGTT. C) 1nsulin concentration at 0 and 30 min during 1PGTT showing
hyperinsulinemia in Thy-l/ApoD and NSE/ApoD transgenic mice. 0) Glucose levels
during an intraperitoneal insulin tolerance test (lTT; 1.5 U/kg body weight on Sh
fasting animais) showing insulin resistance in Thy-l/ApoD and NSEIApoD
transgenic mice. Data are expressed as percentage of initial blood concentration.
Values are means ± SE of 6 mice per group. * p<O.OS, ** p<O.OI, *** p<O.OOI of
Thy/ApoD vs WT mice. # p<O.OS, ## p<O.OI, ### p<O.OOI of NSE/ApoD vs WT
mlce.
Figure 3.4: Hepatic steatosis in H-apoD Tg mice. A-C) Hematoxylin-eosin stained
liver paraffin sections. D-F) Oil RedO staining of cryosected liver. Photomicrographs
show normal histology in WT mice (A, 0) and strong lipid accumulation in Thy
l/ApoD (B, E) and NSE/ApoD (C, F). Original magnification, x 100; n=6. Hepatic
total lipid content (G), lipid peroxidation (H), total cholesterol (1) and triglycerides (1)
levels in transgenic and WT mice. Values are means ± SE of 6 mice per group. *** p<O.OO 1 vs WT mice.
Figure 3.5: Analysis of hepatic steatosis and insulin resistance pathways. Total
liver (A) or muscle (B) extracts from non- fasting animais were subjected ta
immunoblot analysis with anti-Ser473-phospho-specific Akt antibody and anti-Aktl
antibody. Graphs were normalized by Aktl levels. C) Northern blot analysis of apoE
expression in liver tissues of H-apoD Tg and WT mice. ApoE expression was
normalized by GAPDH levels. Steatosis is associated with enhanced LFABP (0),
FAS (E), PPARy (F), SREBP-lc (G) and PPARa (H) transcription in Thy-l/ApoD
and NSE/ApoD mice as explored by semi-quantitative RT-PCR. Gene levels were
normalized by HPRT expression. For each graph, the H-apoD Tg values were
normalized by the WT values, which was given an arbitrary value of one. A-H)
Values are means ± SE of 6 mice per group. * p<O.OS, ** p<O.OI, *** p<O.OOI vs
WT mice. 1) Plasma triglyceride production rates were measured in fasting H-apoD

103
Tg and WT mice after Triton WRI339 injection. Data represent mean triglyceride
concentrations (in mM) ± SE, n = 5 per group. The VLDL-triglyceride secretion rate,
calculated from the slope of each individual line, was not statistically different (WT:
53,04 ± 5,69; Thy-l/ApoD: 39,0 ± 2,47; NSE/ApoD: 45,0 ± 4,64 /lmol/kg/h).
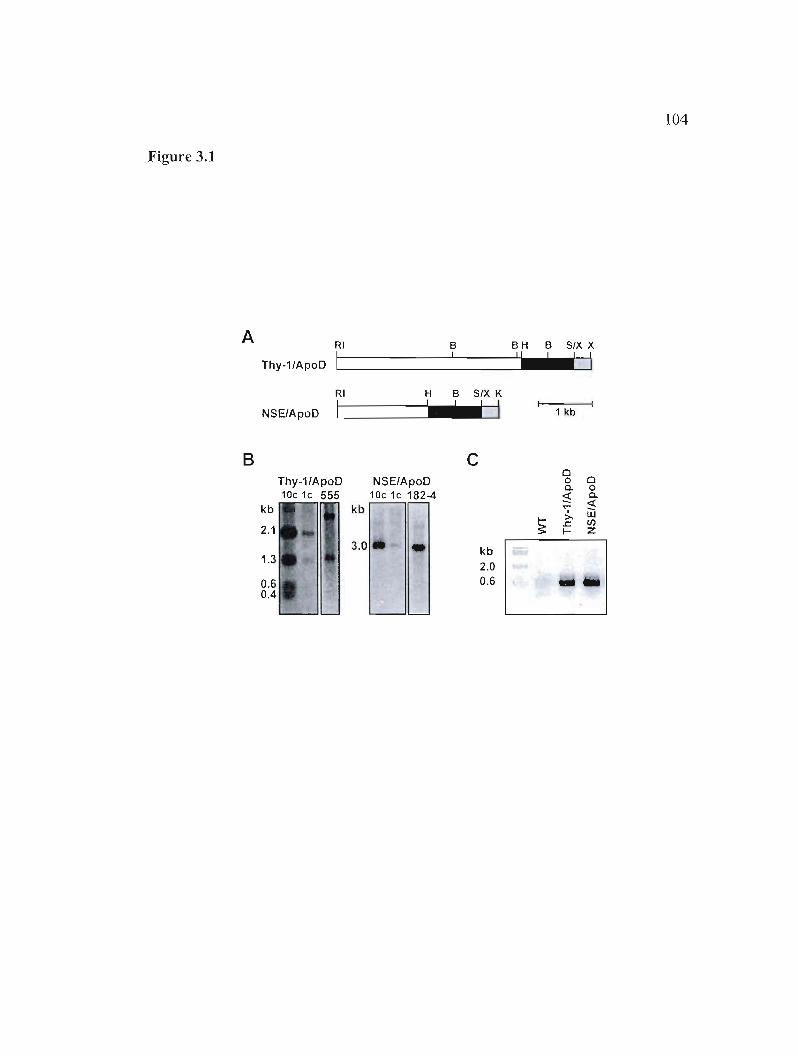
104
Figure 3.1
A RI B BH B SIX X 1 I~Thy-1/ApoD 1
RI H B SIX K
NSE/ApoD 1 -..tj 1 kb
B c Thy-lIApoD 10c 1c 555
kb
2.1
kb
NSE/ApoD 10c 1c 182-4
o o a. ~ .,.>.
or: ~
0 0 a.« li]Cf) z
1.3 • kb 2.0
0.6 0.6 ... iIIt 0.4
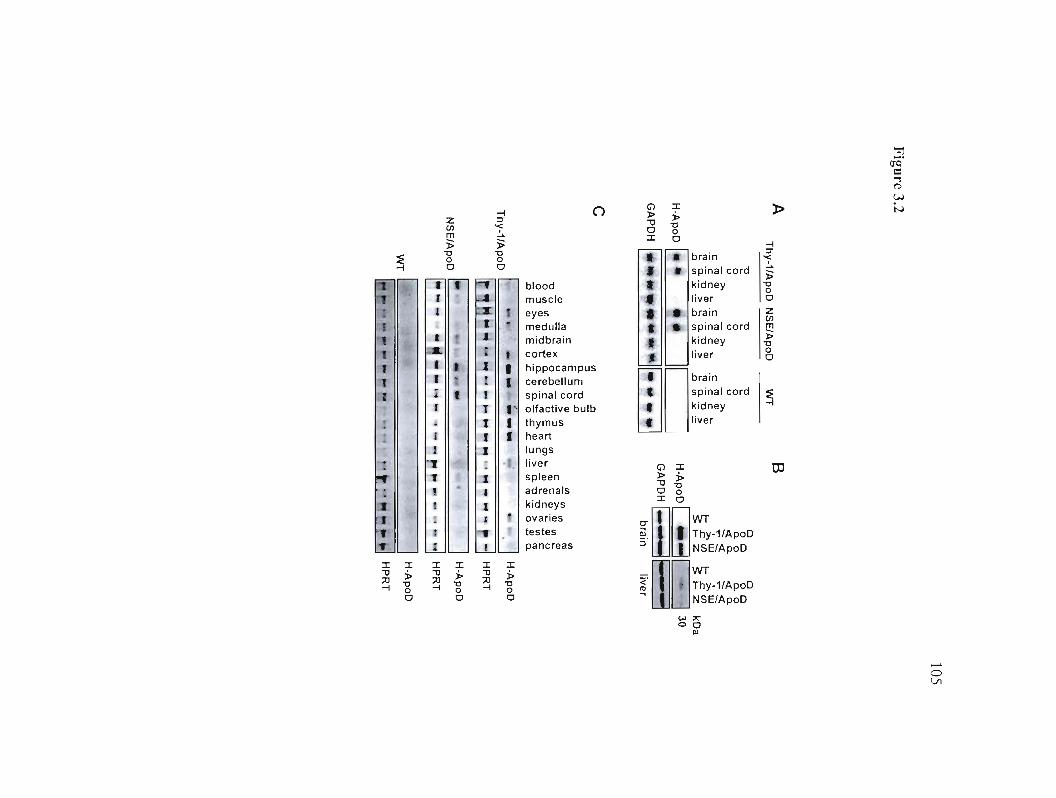
"'='l ~.
='"'l ~
CM
~
& 1
.., 1, 1 1
~
Z Cf)
m l> '0 0 0
1 •1 1
• · ..& 1 •1 · i •1 _0,
-i ::T
'"'f ...... l> '0 0 0 .,
~ r 1 . J ; , 1 •r, 1
T l' 1 1
()
blood muscle eyes medulla midbrain cortex hippocampus cerebellum spinal cord olfactive bulb thymus
Q :J: ~ :i>"U '00 0 :J: 0:l brain
• spinal cord kidney liverel brain
• spinal cord kidney liver
~L--J
WDb";'~C' spinal cord ~. kidney • liver
l>
-i :r
'1. l> '0 0 0
z U> m l> '0 0 0
I~
N
1 1 1 heart
. ~
, . . '1 il,
1 ".., '1, t ft. :
1 . -:1
• 1 ~ ... .
lungs Iiver spleen ad renaIs kidneys ovaries testes
Q :J: ~ . "U ~
o -gl 0
~m@WT~, • Thy-1/ApoO
lJJ
... i r pancreas ~ N5E/ApoO
:J: "U ;lJ -i
:J::i> '0 0
:J: "U ;lJ -i
:J: :i> '0 0
:J: "U ;lJ -i
:J: :i> '0 o ~ rno :-1IAPOD
o o o N5E/ApoO
<..> ~
00 III
o Vl
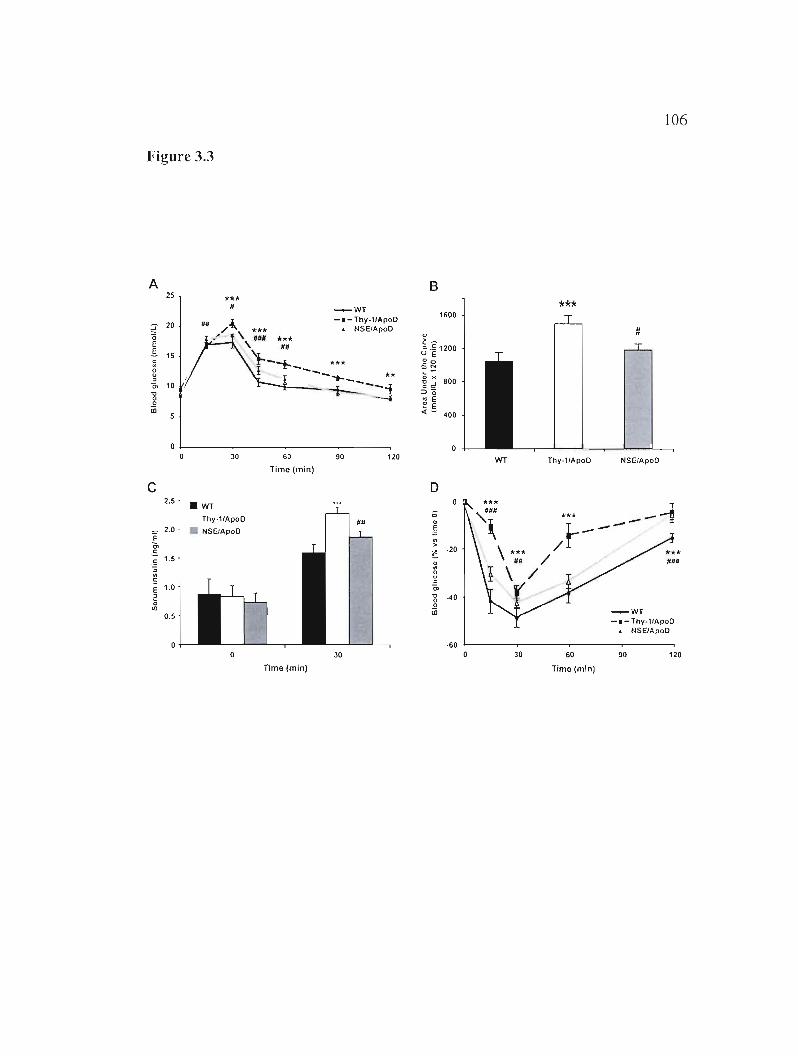
106
Figure 3.3
A B
~ "0 E .s ~ 0 g 0>
"8 0
iD
25
20
15
10
~** R _WT
lf.II /"
-.-Thy-lIApoD
*** . NSEIApoD ' \ ### ~**. \
M#
).--j.. *** l - **............ ""'1-_ ......
-r--.--'1 --i
1600
" ~-G-~ 1200
"0ZN
" .'g~ 800 =>"0 .. E e E «- 400
*** #
30 60 90 120 WT Thy-lIApoD NSE/ApoD Time (min)
C 2.5 .WT
D ***
Ë 0..:. .S
~ s
2.0
1.5
•
Thy.llApoD
NSEJApoD It#
ë
" g '">
ê " '" e ~
-20 \ ***
#M
/ /
*** -- --~/r--E 1.0 0> 2 " 1Il
0.5
'0 0 0 iD
-l0
_WT -. - Thy-lIApoD. NSEJApoD
-60 0 30 30 60 90 120
Time (min) Timo (min)
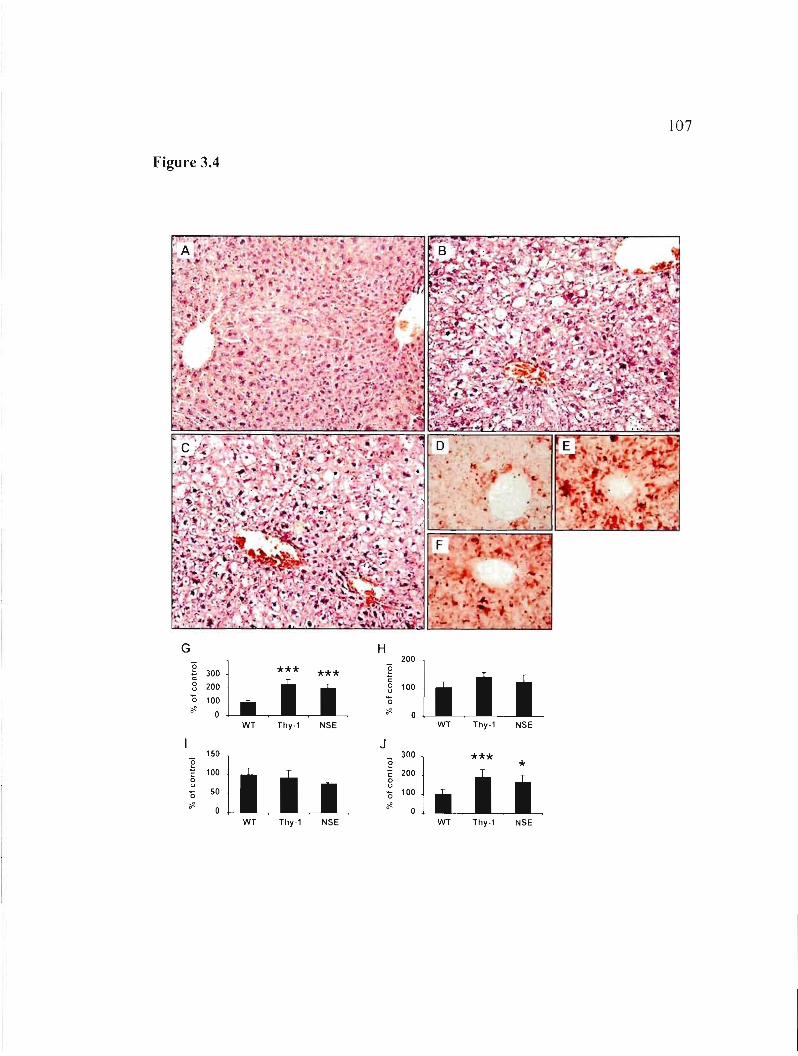
\07
Figure 3.4
G H 200 e 300c:
0 200u
*** *** e c: 0 u 100
a 100 a <t 0 <t 0
WT Thy-l NSE WT Thy-l NSE
J 150 300 *** e
c: 0 u a <t
100
50 Lt~u~ e ë 0 u a <t
1 * 200
.LLl100 , 0 l
WT Thy-l NSE WT Thy-l NSE
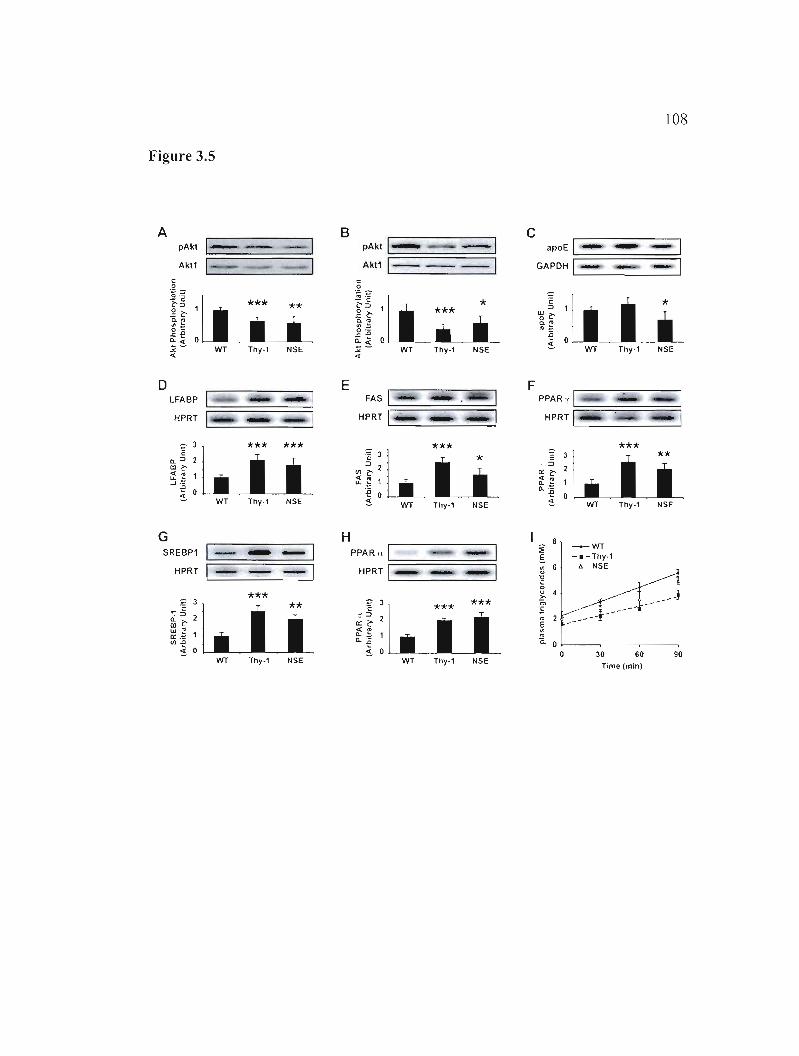
--
-------
108
Figure 3.5
A B c pAkt PAktl_ -1 apoE 1
===== Akt1 AkI11-- -- -1 GAPDH 1_-_-__- _
:ltti :lLliWT Tlly·' NSE VYT Tlly·1 Nse
o E F LFABP FAS 1- PPAR., 1
===== HPRT HPRTIHPRT IL...- --'-'-'-'_'-'-_
f 3l.li*** ****** 0-:> 2 al ~
gJl.ti**** <Il ~ 2
~ ~ 1 ~ ~..J:Ë 1
.. 0 ~ 0 ~l.ti- WT Tlly.1 NSE ~ VYT Tlly.' NSE WT Thy.1 NSE
G H i ~VYT
SREBP1 PPAR" 1 - 1 f -. - Thy.1
HPRT -HPRT 1_ '" 6 .. NSE-1 :g'"
*** ~ 4
'c: ~ 2 E 2c:g 1 g ::;>'Ui
..
ii ëi ~ 0
:>
~l.il f
~ 0 JO~ 0 60 90 VYT Tlly.1 NSE WT Tlly-' NSE
Time(mln)
109
3.9 Supplemental material
Figure 3.1S : Serum levels of cytokines and adipokines in transgenic and WT
mice. Interleukin-1a, interleukin-6 and -10, TNFa, IFNy, TGF~, leptin, adiponectin
and resistin concentrations were tested by Searchlight arrays. Values are means ± SE
of 6 mice pel' group. * p<0.05, ** p<O.Ol vs WT mice.
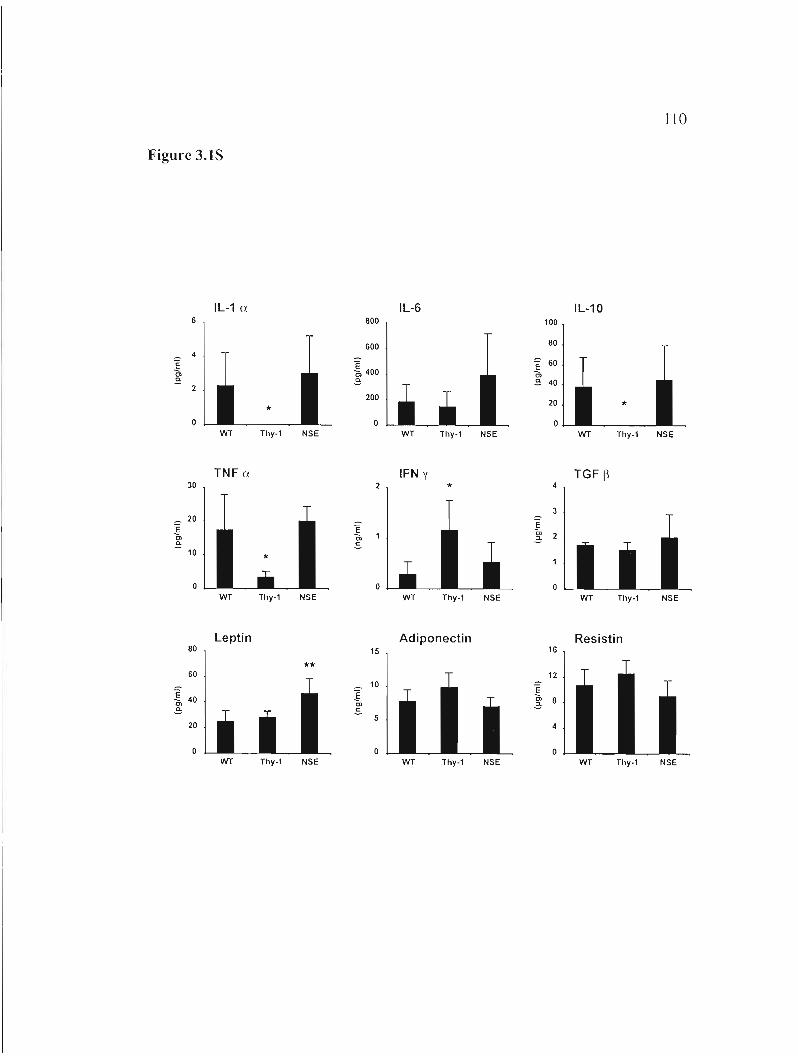
110
Figure 3.18
IL-1 0. IL-6 IL-10 6 800 100
600 80 4
Ë en E;
2
~ 400 E;
=E 60 m E; 40
200 20
0 0 WT Thy-l NSE WT Thy-l NSE WT Thy-l NSE
TNF Cl IFN Y TGF ~ 30 *
3
=E en E;
20
10
:g Cl .s
Ë en ~
0 0 WT Thy-l NSE WT Thy·l NSE WT Thy.l NSE
80 Leptin
15 Adiponectin
16 Resistin
** 60 12
Ë en 40 :ê Cl
10 =E m 8 ~ E; .s
5 20
0 0 WT Thy-l NSE WT Thy-l NSE WT Thy.l NSE
CHAPITRE IV
Apolipoprotein D is involved in the mechanisms regulating protection from
oxidative stress
Maria D. Ganfornina*, Sonia Do Carmo*, Jose M. Lora, Sonia Torres
Schumann, Marci Vogel, Maria Allhorn, Constancio Gonzalez, Michael J.
Bastiani, Eric Rassart, Diego Sanchez
2008
Aging Cell 7: 506-515
*Ces auteurs ont contribué de façon équivalente à ce travail.
112
Avant-propos
L'étude in vitro présentée en chapitre II nous a permis de déterminer que
l'induction de l'apoD lors de pathologies est sans doute initiée par un événement
spécifique. Le stress oxydatif est l'une des conditions capables d'induire l'expression
de l'apoD. De plus, le stress oxydatif est intimement lié à la plupart des
neuropathologies présentant une induction de l'apoD. Afin de comprendre pourquoi
l'apoD est induite dans certaines pathologies, nous avons donc décidé d'étudier, dans
un premier temps, l'importance de l'apoO en situation normale et dans un contexte
neurodégénératif induit par un produit oxydant, le paraquat. Pour ce faire, nous avons
injecté du paraquat de façon intrapéritonéale à des souris n'exprimant pas (ApoD
KO) ou surexprimant l'apoD humaine dans leurs neurones sous le contrôle du
promoteur du gène Thy-l humain (HApoD-Tg). Nous avons ainsi examiné
l'influence de l'apoO sur la survie des souris et sur la peroxydation lipidique suite à
l'administration de paraquat. Puis nous avons étudié l'influence du paraquat sur
l'induction de l'apoO.
L'herbicide paraquat (dichlorure de 1,1'-diméthyl-4,4'-bipyridinium) a été
établi comme facteur de risque potentiel pour le développement de la maladie de
Parkinson, l'une des neuropathologies présentant une augmentation de l'apoD. Le
lien entre le paraquat et la maladie de Parkinson est basé à la fois sur les études
épidémiologiques qui lient le parkinsonisme et l'exposition à cet agent et sur la
similarité de sa structure chimique avec le MPTP (l-methyl-4-phenyl-l,2,3,6
tetrahydropyridine). Il a été démontré que les utilisateurs du substitut d'héroïne
MPTP développaient la maladie de Parkinson. Le paraquat génère un stress oxydatif
par la production de radicaux d'oxygène libres. Ces radicaux superoxydes réagissent
avec les lipides membranaires insaturés, tuant ainsi les neurones dopaminergiques par
apoptose. La voie des JNK (c-jun-N-terminal kinase) serait impliquée dans cette mort
113
par apoptose (Peng et al. 2004). Bien qu'il n'existe pas d'études liant le paraquat et
l'expression de l'apoD, il a été largement utilisé comme modèle neurodégénératif.
J'ai contribué à toutes les facettes de cette étude. J'ai participé à l'élaboration
du design expérimental, au travail pratique et à l'élaboration des figures et du
manuscrit. Plus particulièrement, j'ai fait le travail concernant les souris
transgéniques surexprimant l'apoD humaine. J'ai donc étudié leur comportement en
situations normales puis j'ai déterminé leur survie et leur niveau de peroxydation
lipidique suite à l'injection de différentes doses de paraquat. J'ai également fait le
travail (northerns) concernant l'induction de l'apoD suite à l'administration de
paraquat. Maria D. Ganfornina et Diego Sanchez ont été les initiateurs de cette étude
et ont fait toutes les expériences sur les souris ApoD-KO dans les locaux de
Constancio Gonzalez. Jose M. Lora, Sonia Torres-Schumann, Marci Vogel et Maria
Allhorn ont été impliqués dans la création et la caractérisation des souris ApoD-KO
dans le laboratoire de Michael 1. Bastiani.
114
4.1 Résumé
Plusieurs pathologies du système nerveux sont assoclees avec une augmentation des niveaux de l'Apolipoprotéine 0 (ApoD), une lipocaline également exprimée durant le développement normal et le vieillissement. Un homologue du gène de l' ApoD chez la drosophile, Glial Lazaril1o, régule la résistance au stress et la neurodégénérescence du cerveau âgé. Nous étudions ici pour la première fois le potentiel protecteur de l'ApoD chez un organisme modèle vertébré. La perte fonctionnelle de l' ApoD chez la souris augmente la sensibilité au stress oxydatif et le niveau de peroxydation lipidique dans le cerveau et altère les capacités locomotrices et d'apprentissage. La surexpression de l'ApoD humaine dans le cerveau de souris produit les effets inverses, augmentant la survie et prévenant l'accumulation de lipides peroxydés après le traitement oxydant. Ces observations, conjointement avec l'augmentation de la transcription de l'ApoD dans le cerveau après une lésion oxydative, identifient l' ApoD comme une protéine de phase aiguë ayant une fonction protectrice et donc bénéfique médiée par le contrôle des lipides peroxydés.
Mots-clés: apprentissage, comportement locomoteur, lipocaline, paraquat, peroxydation lipidique, stress oxydatif.
115
4.2 Abstract
Many nervous system pathologies are associated with increased levels of Apolipoprotein D (ApoD), a lipocalin also expressed during normal development and aging. An ApoD homologous gene in Drosophila, Glial Lazarillo, regulates resistance to stress, and neurodegeneration in the aging brain. Here we study for the first time the protecting potential of ApoD in a vertebrate model organism. Loss of mouse ApoD function increases the sensitivity to oxidative stress and the levels of brain lipid peroxidation, and impairs locomotor and learning abilities. Human ApoD overexpression in the mouse brain produces opposite effects, increasing survival and preventing the raise of brain lipid peroxides after oxidant treatment. These observations, together with its transcriptional up-regulation in the brain upon oxidative insult, identify ApoD as an acute response protein with a protective and therefore beneficial function mediated by the control of peroxidated lipids.
Keywords: learning, locomotor ability, Iipocalin, paraquat, Iipid peroxidation, oxidative stress.
116
4.3 Introduction
Apolipoprotein D (ApoD) is a Lipocalin, an ancient family of small proteins
engaged in a diverse array of physiological processes, whose general molecular
function is binding and transporting hydrophobic ligands. ApoD is known to bind
arachidonic acid, progesterone, retinol, cholesterol and other lipophilic ligands.
Elevations in its expression level have been associated with a number of pathological
and tissue damage conditions including neurodegenerative diseases. Its levels
increase as wel1 during physiological aging (see Rassart et al. 2000; van Dijk et al.
2006 for review). Although the correlation between those states and increased gene
expression is consistent, the causal link with ApoD function is still unclear. Whether
ApoD is one of the factors contributing to the degenerative or aging processes, or its
function is part of a defense mechanism providing protection to cells must be solved.
Our previous work on an ApoD homologue in insects, the Drosophila Glial Lazarillo
(GLaz), shows that it regulates longevity, resistance to stress, locomotor behavior,
and degeneration in brain and other tissues upon aging (Sanchez et al. 2006; see also
Walker et al. 2006). We therefore undertook a genetic analysis of the ApoD function
in a vertebrate model organism by generating knockout and transgenic over
expressmg mlce.
117
4.4 Results and discussion
An ApoD knockout mouse (ApoD-KO) was generated by standard
homologous recombination techniques. We replaced the wild-type ApoD gene with a
copy interrupted by the insertion of the neomycin resistance gene (Neo) in the
opposite direction to ApoD transcription (Fig. 4.1 SA), which rendered a
transcriptional null mutant (Fig. 4.1 S B-D) without deleting any genomic fragment
potentially containing regulatory regions. We also generated transgenic mice over
expressing the human orthologue of ApoD (HApoD) under the control of the
neuronal human Thy-I promoter (HApoD-Tg line; Fig. 4.2S A), thus expressing
HApoO in neurons in ail regions of the nervous system (Fig. 4.2S B-E). General
features of ApoD-KO and HApoD-Tg mice are described in Supporting Information
available on!ine.
Both ApoD-KO and HApoD-Tg mice are viable and breed normally. Three
independent lines were obtained for the Thy-I transgenic, but a single !ine was used
in this work due to their similar phenotypes based on general health, and biochemical
and molecular characterization (Do Carmo and Rassart, unpublished observations).
No apparent genotypic differences were observed during development when
comparing sibling ApoD-KO and WT mice (see Supporting Online Information). We
therefore turn to study ApoD function during adulthood, both in normal conditions,
and when exposing the organism to oxidative stress situations mimicking the many
pathological situations in which ApoD is up-regulated.
4.4.1 ApoD alters locomotor activity and learning abilities in young adult
animais
Open field analysis revealed a significant decrease in horizontal and vertical
locomotor activity in ApoD-KO mice (25% and 36% mean reduction in horizontal
118
and vertical activity respectively; Fig. 4.1 A, left and right panels), while no
differences were observed in anxiety related parameters (relative time spent in the
center vs. periphery of the open field arena; Fig. 4.1A central panel). On the other
hand, over-expression of human ApoD causes an increase in vertical activity (number
of rearings, Fig. 4.1B, left panel), white differences in horizontal activity were not
significant (Fig. 4.1B, right panel).
Visual ability, assessed by darkness preference and object recognition, was
not significantly affected. Other behavioral tests exploring pain and touch sensitivity,
gait, and muscular strength gave no significant differences between ApoD-KO mice
and their wild-type littermates. Similarly, the walking pole test exploring sensory
motor coordination gave no differences in ApoD-KO nor HApoD-Tg mice (see
Supporting Online Material).
ApoD-KO m\ce and their wild-type control perform equally weil in the
Rotarod test (also exploring sensory-motor coordination) when first tested on the
accelerated rod after a set of training sessions. However, a parameter that estimates
the ability to learn a motor task (improvement of performance over consecutive trials)
was much smaller in the ApoD-KO mice (Fig. 4.1C).
Hippocampal-dependent memory was assessed with the spatial version of the
Barnes maze. Wild-type mice showed an average learning time of 64 days, while
none of the ApoD-KO mice were able to meet the learning criteria (7 out of 8
sessions with 3 or less en"ors) for the test period of70 days (Fig. 4.1D).
Therefore, m\ce lacking ApoD expressIOn reduce their locomotor and
exploratory activity, while over-expression of HApoD in the brain renders the
animais slightly more active. In addition, ApoD-KO mice show deficits in learning
either a motor task or an orientation-based task (dependent on visual cues). Decreased
119
locomotor performance was also shown for Drosophila GLaz nul! mutants (Sanchez
et al. 2006), illustrating interesting functional conservation of these homologous
genes throughout evolution.
4.4.2 Resistance to experimentally induced oxidative stress is undermined in the
absence of ApoD and increased by the over-expression of human ApoD
The regulation of ApoD in physiological and pathological states where
reactive oxygen species (ROS) are generated (reviewed in Rassart et al. 2000), and
the higher sensitivity to oxidative stress experienced by the Drosophila GLaz mutants
(Sanchez et al. 2006) motivated us to test the overall survival of ApoD-KO and
HApoD-Tg mice exposed to an oxidative insult. Sensitivity to the ROS generator
l, l' -dimethyl-4,4' -bypiridinium (paraquat; PQ) was assayed using different
paradigms of intraperitoneal injections (see Methods in Supporting Online Material).
The ApoD null mutant mice show a higher sensitivity to PQ-induced cmonic
oxidative stress than wild-type controls (Fig. 4.2A). The survival curves show a
reduction in both the median and the maximum lifespan (26% and 56% respectively,
Fig. 4.2A) reflecting an early onset of functional decline in the ApoD-KO mice. This
effect is observed independently of the genetic background (C57BL61J or Balb/C),
indicating that the reduction observed is originated by the lack of ApoD.
These results will predict that mice over-expressing ApoD would be more
protected against the stress produced by PQ. Indeed, HApoD-Tg mice showed
improved survival upon single systemic exposures to PQ at two different
concentrations, with an increase in median survival time of 41.6 and 27.5%
respectively (Fig. 4.2B, C). Thus the human ApoD protein is able to exert a protective
role when expressed in the mouse brain. This general effect on survival might be due
to either the presence of the neuron-expressed ApoD in the systemic circulation, or to
low levels of non-neuronal ApoD expression in other tissues.
120
The protective effect of ApoD is also consistent with the results obtained in
Drosophila over-expressing the endogenous ApoD homologue GLaz (Walker et al.
2006) or the human ApoD gene (Muffat et al. personal communication). All these
results strongly suggest that the protecting role in oxidative stress-compromised
survival is a cornmon factor in al! ApoD homologues, reflecting that it is probably
part of the ancestral function of this lipocalin. Therefore, the analyses in model
organisms can be very useful to understand the human ApoD function.
4.4.3 ApoD expression is induced in the brain upon experimental oxidative stress
The up-regulation of ApoD in ROS-related pathological conditions predicts
that an experimentally produced oxidative stress would also regulate ApoD mRNA
expression in the mouse. Since ApoD is up-regulated in neurological pathologies, and
our behavioral studies in the mouse indicate that nervous system functionality is
compromised in the absence of ApoD, we assayed the transcription of ApoD in
mouse brain after a single exposure to PQ. An acute up-regulation of ApoD (1.86
fold induction) is detected 3 hours aftel' exposure, and the expression returns to
baseline by 24 hours (Fig. 4.3A).
Similar transient effects of PQ on gene transcription have been shown in lung
and kidney for several genes with antioxidant roles (Tomita et al. 2006a, 2006b). We
therefore assayed the transcription of ApoD in several tissues 3 hours after PQ
exposure, when the expression peaks in the brain. No up-regulation is produced in the
lung or the liver, while the brain tissue shows a strong ApoD induction upon PQ
treatment (Fig. 4.3B). These results suggest a specifie function of ApoD in the
response of the nervous system to oxidative injury.
121
The higher sensitivity to oxidative stress of mice lacking ApoD parallels our
results obtained in the Drosophila GLaz null mutant (Sanchez el al. 2006) and in null
mutants of the ApoD homologue in plants (Frenette-Charron el al. personal
communication) which are more sensitive to oxidative and other forms of stress. We
can therefore predict that the regulation of these lipocalin genes must also be
conserved (a transient up-regulation of GLaz also occurs in Drosophila, our
unpublished observations also confirmed by J. Muffat el al. personal
communication), and that the ApoD up-regulation m the mouse brain upon PQ
induced ROS generation is part of the normal protective response to stress.
The increased survival of the transgenic animais over-expressmg human
ApoD in the nervous system should be due to a higher and longer-lasting presence of
ApoD in the tissues. Since the human transgene is placed in a wild-type genetic
background (CS7BL61J mice), we measured the expression level of the mouse
endogenous ApoD gene in the brain of transgenic animais. Mouse ApoD transcript
levels are not affected by the presence of the human transgene either under normal
conditions or upon PQ treatment. As expected, the human transgene does not show a
response by PQ (Fig. 4.3C).
4.4.4 ApoD controls the levels of brain lipid peroxidation under normal
conditions
PQ treatment is known to generate protein and lipid peroxidation (Beai 2002).
By evaluating the oxidation state of these macromolecules in the brain, both in the
control situation and in the presence of PQ-induced oxidative stress, we should gain
insight into the biochemical actions of ApoD in the brain tissue when it is exerting the
protecting effects described above at the organism level.
122
We assayed lipid peroxidation levels upon the different paradigms used for
PQ injection. In agreement with McCormack (McCormack et al. 2005), lipid
peroxide adducts accumulate in the wild type brain over time at a relatively slow pace
(Fig. 4.3S A). As it is the case for tissues like lung, kidney and liver (Sato et al.
1992), no increase in lipid peroxidation is observed in the brain 3 hours after a single
high dose of PQ (acute PQ treatment, protocol B), while a low-dose chronic treatment
(protocol C) does produce a significant increase after two weeks. ln contrast, prote in
carbonylation, a marker of oxidative modification of proteins, is much faster,
showing a patent increase by 3 hours upon acute treatment (Fig. 4.3S B).
ln control conditions (sham injection, Fig. 4.4A) we observe that the lack of
ApoD results in increased levels of lipid peroxides in the brain, but not in the lung, in
accordance with the normal tissue distribution of ApoD. Moreover, as expected for a
lipid managing lipocalin, the effect is specific for lipids, since no alterations are seen
in prote in carbonylation. On the other hand, the amount of lipid peroxidation in the
brain ofHApoD-Tg mice is similar to the wild-type levels (Fig. 4.4C), indicating that
an excess of human ApoD cannot reduce the basal levels of oxidation products
related to normal cellular metabolic activity. As expected, lung lipid peroxidation
levels are also unchanged by the human transgene (not shown).
An increased level of lipid peroxidation under basal conditions was also
observed in the GLaz null mutant fruit flies (Sanchez et al. 2006). These results
suggest that ApoD and its homologues can condition the peroxidation state of lipids,
even in nonnal non-stress situations. The maintenance of cellular membrane integrity
can be expected to be compromised in the ApoD-KO and, since ApoD absence is
particularly noticed in the brain, it can result in neural functional alterations that we
are able to detect by behavioral tests.

123
The data by Thomas and Yao (Thomas and Yao 2007) also support the above
proposaI. They performed a brain lipid profile analysis in our ApoD-KO mice to
understand the role of ApoD in the mechanisms of antipsychotic drug action. Their
results in the control animais (without drug addition) show that ApoD-KO brains
have increased levels of sorne polyunsaturated fatty acids (dienes and hexanenes).
Since polyunsaturated fatty acids are more prone to peroxidation, the susceptibility of
membranes to peroxidation (Hulbert 2005) must be increased in the ApoD-KO
brains, and therefore membranes could be more susceptible to the effects of normal
oxidative metabolism.
4.4.5 ApoD is able to prevent the lipid peroxidation increase upon oxidative
insult
Upon oxidative insult (either acute or low-dose chronic PQ treatment) lipid
peroxidation increases (33% and 43% respectively) over the wild-type levels in the
ApoD-KO brain (Fig. 4.4B). This change can be correlated with the decrease in
survival time observed in the ApoD-KO mice upon PQ treatment. Again, no
genotype-dependent differences in protein carbonylation were observed under PQ
treatment (Fig. 4.4B), suggesting that the function of ApoD is conflOed to lipid
management. On the other hand, human ApoD over-expression abolishes the long
term accumulation of lipid peroxides after 2 weeks of PQ treatment, maintaining the
levels at control values (Fig. 4.4C). These results show that an excess of human
ApoD in the brain can counteract the exogenously-induced oxidative damage to
lipids. Therefore, we can expect that a supplement of ApoD might be beneficial for
human conditions where lipid oxidation is a key factor in the functional decline
associated to physiological aging or neural pathologies.
124
4.4.6 Lipocalins as part of the oxidative stress response system
Our data support the notion that ApoD is part of the mechanisms regulating
protection from diverse forms of stress, including oxidation. We show in this report
that ApoD specificaUy controls the levels of lipid peroxidation in an organ as
vulnerable as the brain. The structural property of ApoD shared with aU other
lipocalins is the presence of a binding pocket that can bind diverse molecules, mostly
hydrophobie (Akerstrom et al. 2006, Flower et al. 2000), therefore it is probable that
its mechanism of action involves this lipid-binding property. The control of lipid
peroxidation can be exerted directly, either a priori by preventing the oxidation of
bound lipids, or a posteriori by removing peroxidated lipids from membranes, and
therefore avoiding the positive feedback loops leading to more oxidative damage.
Alternatively, the control of lipid oxidation can be a consequence of the regulation of
lipid composition in membranes, which will determine the susceptibility of
membranes to peroxidation. Scavenging roles have been proposed for other
lipocalins. Lcn-l (tear lipocalin), expressed in secretory glands, has been shown to
bind lipid peroxidation products in vitro and is also up-regulated upon oxidative
stress in an epithelial ceU line (Lechner et al. 2001). a-l microglobulin is able to
reduce and then trap ABTS radicals by covalent binding (Akerstrom et al. 2007).
However, can our data also be compatible with a direct antioxidant activity of
ApoD?
The antioxidant defense system is currently known to comprise low molecular
mass agents (e.g. glutathione or melatonin), iron or copper sequestration proteins
(su ch as transferrin, ferritin, or albumin) and antioxidant enzymes (like superoxide
dismutase or catalase). With the data available so far, ApoD belongs to none of these
categories. While other lipocalins are weil known for their iron sequestration
properties (Flo et al. 2004, Goetz et al. 2002), binding to toxic heme (Allhorn et al.
125
2002) or antioxidant catalytic activities (Allhorn et al. 2005), neither metal
sequestration properties nor enzymatic activity have been shown for ApoD, or its
orthologues in fruitflies or plants.
The lipocalin a-l microglobulin (Akerstrom et al. 2007, AIlhorn et al. 2002,
AIlhorn et al. 2005) exerts reductase and dehydrogenase activities through a free
cysteine group located in a flexible loop. ApoD has four cysteine residues that form
two disulfide bonds at the core of the protein fold in aIl species studied so far.
However, human ApoD has an extra cysteine (Cys 116) known to bind covalently ta
Apolipoproteins A-Il and B-IOO (Blanco-Vaca et al. 1992). Whether the thiol group
of Cys 116 confers additional antioxidant properties to human ApoD remains to be
investigated. if this were the case, then this property would be human-specific. ln
order to explain the results obtained in mouse (this study), fly (Sanchez et al. 2006)
and plants (Frenette-Charron et al. personal communication), additional antioxidant
properties of ApoD that are conserved among these divergent species must be
invoked. Moreover, the fact that only lipid peroxidation, but not protein
carbonylation, is altered in the absence of ApoD argues against a direct antioxidant
activity of mouse ApoD.
The oxidative modification of membrane lipids also triggers intracellular
signaling cascades that direct the ceIl fa te after an oxidative insult. Particularly,
arachidonic acid (AA) is known to be mobilized from membranes upon oxidative
stress (Balboa and Balsinde 2006). ApoD is able to bind a variety of lipidic ligands
(Breustedt et al. 2006, Eichinger et al. 2007, Rassart et al. 2000) of which the highest
affinity is shown for AA. Data supporting the participation of ApoD in regulating the
mobilization of AA has been shown in a cel! culture system (Thomas et al. 2003d),
and both ApoD and AA are regulated in patients with schizophrenia in response to
antipsychotic drug treatment (Thomas et al. 2001 b, 2003a, 2003c). The Iipid analysis
of ApoD-KG brains upon treatment with clozapine (Thomas and Yao 2007) has
126
shown that the absence of ApoD alters the levels of AA upon drug treatment (even
though levels are not modified by the mutation in basal conditions). Thus by
modulating important signaling lipids like AA, ApoD can influence the patient's
response to different treatments.
Ali data available so far point to a common biochemical function for ApoD,
directly linked to membrane physiology, which is essential for a proper nervous
system function. By controlling the levels of lipid peroxidation ApoD could influence
parameters as important as neurotransmitter release, in tum affecting learning abilities
or locomotor activity (Vajragupta et al. 2000) throughout life. Likewise, by
performing the same biochemical function, ApoD can control the rate of brain
functional decline upon normal aging or in pathological conditions, although it is
unlikely to be the only such factor.
4.4.7 Functional significance of ApoD: its influence on normal and pathological
nervous system decline upon aging
We have shown that ApaD expression ln the mause brain is boosted by
experimental oxidative stress, mimicking what happens ln many human
neurodegenerative and psychiatrie diseases, nervous system injuries, as weil as during
normal aging. The main known effect of lacking ApoD is to become more vulnerable
to stress, while an ApaD overdose makes animais less sensitive to the same stress.
The fact that the human ApoD gene can produee effects that oppose those observed in
the ApoD-KO mouse strongly suggests a conserved function, and therefore the utility
of the mouse model to test patential therapeutic uses of ApoD. This study is the first
showing that an excess of ApaD results in seemingly beneficial effects upon
experimental oxidative stress in the mouse. Testing the effects of over-expressing
ApoD in mause models of disease should therefore become a priority.
127
4.5 Experimental procedures
4.5.1 Animals
The experimental procedures were approved by the Animal Care and Use
Committees of the University of Utah, University of Valladolid and Université du
Québec à Montréal, and were in accordance with the Guidelines for the Care and Use
of Mammals in Neuroscience and Behavioral Research (2001). Mice were maintained
in positive pressure-ventilated racks at 25±loC with a 12 h light/dark cycle, fed a
standard rodent pellet diet (Global Diet 2014; Harlan), and allowed free access ta
filtered and UV-irradiated water. Experiments were carried out with 3-5 months old
animais of mixed sexes.
4.5.2 Targeted disruption of the mouse ApoD gene
In order to silence the mouse ApoD gene we constructed a targeting vector
with the neomycin phosphotransferase (Neo) gene interrupting exon 6 of the ApoD
gene (Fig. 4.1S A). G418r-GANCs 129/SvJ ES ce Ils were transfected with the
construct and tested for the presence of the disrupted ApoD allele by BamHI
digestion of their genomic DNA followed by Southern hybridization with an external
probe comprising exon 4 (Fig. 4.IS A). Genomic DNA sequence of the region
surrounding the targeting vector confirmed the proper homologous recombination of
the positive lines injected into female mouse blastocysts at the U. of Utah
Transgenics Facility. Subsequent crosses with the chimeric mice showing germline
transformation of the targeted allele generated heterozygous ApoD+/- mice that were
further confirmed by Southern blot with a 3' probe (Fig. 4.1 S A). Standard
genotyping was performed from tait DNA and PCR with Neo and ApoD-specific
primers: ApoD-for: 5' CCA CCG GCA CCC TAC TGG ATC 3'; ApoD-rev: 5' CGG
GCA GTT CGC TTG ATC TGT 3'; and Neo-for: 5' CGA TTG TCT GTT GTG
128
CCC AGT 3'. Phenotype stability was assessed by backcrossing and outcrossing the
ApoD mutated allele into the C57BL6IJ and Balb/C genetic backgrounds
respectively. The mutant allele was selected for ten generations of crosses with the
corresponding wild type females. An additional generation was performed by
crossing mutant females with wild type males to introduce the Y chromosome of the
wild type strain.
4.5.3 Generation of human ApoD transgenic mouse
The human ApoD transgenic mouse (HApoD-Tg) carries a construct (- 4.5
kb) containing the promoter, the first exon, the first intron and the 5' non-coding
region of the second exon of the human Thy-l gene (generous gift from J. Silver,
New York University Medical Center). This fragment was fused to the human ApoD
coding sequence fol1owed by the bovine growth hormone (BGH) polyadenylation
signal (Fig. 4.2S A). The presence of the transgene was verified by PCR using an
ApoD-specific primer (5' CCC AAT CCT CCG GTG CAG GAG AA 3') and a
BGH-specific primer (5' GAA GGC ACA GTC GAG GCT GAT CAG 3'),
producing a 0.6 kb fragment (Fig. 4.2S B). The HApoD-Tg mice used in this study
were backcrossed onto C57/BL6 wild-type mice as explained above.
4.5.4 RNA extraction and northern blot analysis
Animais were euthanized by inhalation of C02/02 (2: 1). Tissues were
collected, frozen in dry ice, and kept at -SO°C until extraction of total RNA using the
Trizol reagent™ (Invitrogen). Total RNA (lO~g) was separated on 1.5% (wt/vol)
agarose-formaldehyde gels and blotted to a nylon membrane. The membranes were
hybridized with [a-32P]dCTP-labeled mouse or human ApoD, or GAPDH cDNAs,
exposed to Biorad Imaging screen K and revealed with a PhosphorImager (Biorad
Molecular Imager FX) and Quantity One software (Biorad). For each value, the
l29
optical density measured for each gene tested was divided by that of the GAPDH
mRNA.
4.5.5 Protein extraction and western blot analysis
Frozen tissues were thawed on ice and homogenized in lysis buffer (50 mM
Tris-HCl pH 7.3, 150 mM NaCl, 5 mM EDTA, 0.2% Triton X-lOO, and lO%
Complete protease inhibitors (Roche)). After 30 min of incubation at 4°C, lysates
were sonicated and cleared by centrifugation. The protein concentration was
determined using a protein assay reagent (Bio-Rad Laboratories). AIl extracts were
stored at -SO°e. For western blot analysis, protein extracts (lO)lg) were separated on a
12% SDS- polyacrylamide gel and transferred to a polyvinylidene difluoride (PYDF)
membrane. A prestained size marker (Biorad prestained SOS-PAGE standard, low
range) was included in each run. Membranes were blocked in PBS containing 0.2%
Tween-20 and 5% skim milk powder before incubation with the primary antibodies
diluted as follows: polyclonal anti-human ApoD (Car02), 1:4000; anti-GAPDH,
1:4000. Subsequently, the blots were incubated under gentle agitation at room
temperature with a HRP-conjugated secondary antibody diluted 1:5000 in blocking
buffer. The blots were developed using the enhanced chemoluminescence method
(Amersham-Pharmacia) with X-ray film.
4.5.6 Behaviora1 analyses
Open field tests in the ApaD-KO and their wild type controls were performed
by video recording in a 1m2 arena for a single session of 10 min. A total of 6 mice of
each genotype and sex were analyzed. The subsequent analysis explored horizontal
(Number of squares visited) and vertical (Number of rearings) activities, as well as
anxiety, measured as relative time spent in the central area of the arena. Horizontal

130
and vertical activity was measured in the HApoD-Tg mice and control littermates in
an open field arena measuring 30 x 44.5 cm.
A novel-object recognition test was used to assay for visual ability and short
term memory recognition. Mice habituated to the test arena are presented with two
plastic objects of different shapes. The object recognition was evaluated by the ratio
of time spent exploring the novel vs. the familiar object lO sec and 1 min after first
exposure.
Hippocampal-dependent memory was explored in six WT and six ApoD-KO
mice subjected to the spatial version of Bames maze test (Bames 1979), where the
mouse needs to leam and remember distal cues in the environment, and associate
them with the location of an escape tunnel. The mice were tested daily for 70 days,
and the number of holes searched, perseverations and time was recorded. The average
for each genotype was recorded and grouped into session blocks of 5 testing days.
Rotarod analysis was performed in a Ugo Basile (Varese, ltaly) apparatus with
acceleration from 4 to 40 rpm over 5 minutes. Each mouse was subjected to two
training sessions separated by a 15 min rest. Each session consisted of a 2 min period
of exposure to the rad rotating at minimum speed (4 rpm). After another 15 min
resting period a first test was performed, consisting of three runs with the rod
accelerating from the starting 4 rpm speed. Time of permanence in the rod was
recorded. A second test of three runs was performed 2 hours later, after the mice had
been injected intraperitoneally either with PBS or paraquat (see Protocol B below).
Other tests such as pain and touch sensitivity, gait, and muscular strength were
performed as detailed in (Crawley 2000).
131
4.5.7 Oxidative stress toxicity by 1,1'-dimethyl-4,4'-bypiridinium (paraquat)
The following protocols of doses, administration patterns and analysis have
been used:
Protocol A: Chronic paraquat (PQ) treatment. Mice were daily injected
intraperitoneally with a solution of PQ in phosphate buffered saline (PBS) at 15
mg/kg of body weight. Death occurrence was scored at least every 12 hours for the
survival analysis. Morphological analyses were perforrned on brains from mice
euthanized on day 5 of treatment (when the ApoD-KO mice survival is at the 50%
level).
Protocol B: Acute PQ treatment. A single dose of either 30 or 50 mg/kg of PQ
was injected as described above. Behavioral tests were performed just before
injection (t =0), 1.5 hours after injection, and 24 hours after injection. Mice were then
euthanized either 3 hours or 24 hours post-injection, and their brains extracted for
biochemical and immunohistochêmical analyses.
Protocol C: Low-dose, neurotoxic chronic PQ treatment. Following
Thyruchelvam et al. (Thiruchelvam et al. 2000), mice were injected twice a week, for
a total of 2 weeks, with a 15 mg/kg of PQ as described before. Animais were
euthanized 3 hours after the last injection, and their brains extracted for biochemical
and immunohistochemical analyses. We confirmed the absence of lung toxicity by
histopathological analysis looking for alterations in alveoli, respiratory ducts, and
bronchioles (results not shown).
132
4.5.8 Lipid and protein oxidation assays
4.5.8.1 TBARS assay
The concentration of thiobarbituric acid (TBA) reactive species was assayed
to monitor the level of lipid peroxidation. Brain tissue was homogenized in PBS in
the presence of an antioxidant (butylated hydroxytoluene, BHT) to prevent new lipid
peroxidation to occur during homogenization. A 121.tl aliquot of each extract was
incubated with 390f..l1 of 0.2 M glycine-HCL, pH 3.6 and 250fll of fresh TBA reagent
(0.5% TBA, 0.5% SOS). After 15 min incubation at 90°C, samples were cooled on
ice and transferred to a 96 weil microplate for triplicate readings. Absorbance was
monitored at 532 nm in a Versamax microplate reader (Molecular Devices). Values
were normalized to the protein concentration of each sample, measured with the
Micro BCA Protein Assay (Pierce).
4.5.8.2 Protein carbonylation-ELISA assay
Protein carbonylation was performed as previously reported (Buss et al.
1997). Briefly, triplicate protein samples were allowed to react with
dinitrophenylhydrazine (DNP) and then adsorbed to wells of an ELISA plate. A
biotinylated anti-DNP antibody (Molecular Probes Inc.) was used for detection of the
protein-bound DNP followed by an amplification step with streptavidin-biotinylated
horseradish peroxidase (Amersham). Color reaction was performed by supplying 0
phenylenediamine, hydrogen peroxide and citric acid in phosphate buffer.
Absorbance at 490 nm was measured in a Versamax microplate reader (Molecular
Devices). Values were normalized to the protein concentration of each sample.
133
4.6 Acknowledgements
We thank J.R. Acebes, V. Pomies and S. Thompson for technical assistance.
Polyclonal antibody anti-rat ApoD was kindly provided by Dr. S. Patel. This work
was supported by start-up grants to O.S. and M.D.G. from the "Ramon y Cajal
Program"(MEC-Spain and FEDER-FSE); the SGFRH Foundation; NIH grant
2/R011NS25387-10Al to M.J.B.; CIHR grant MOP-15677 to E.R.; FRSQ and
CRSNG studentships to S.D.C.; STINT fellowship KU2003-4308 to M.A.; OGICyT
grant BFU2004-06394 and JCyL grant VAOIIC05 to c.G.; and MEC grant
BFU2005-00522 and JCyL grant VA049A05 to M.D.G. and O.S.
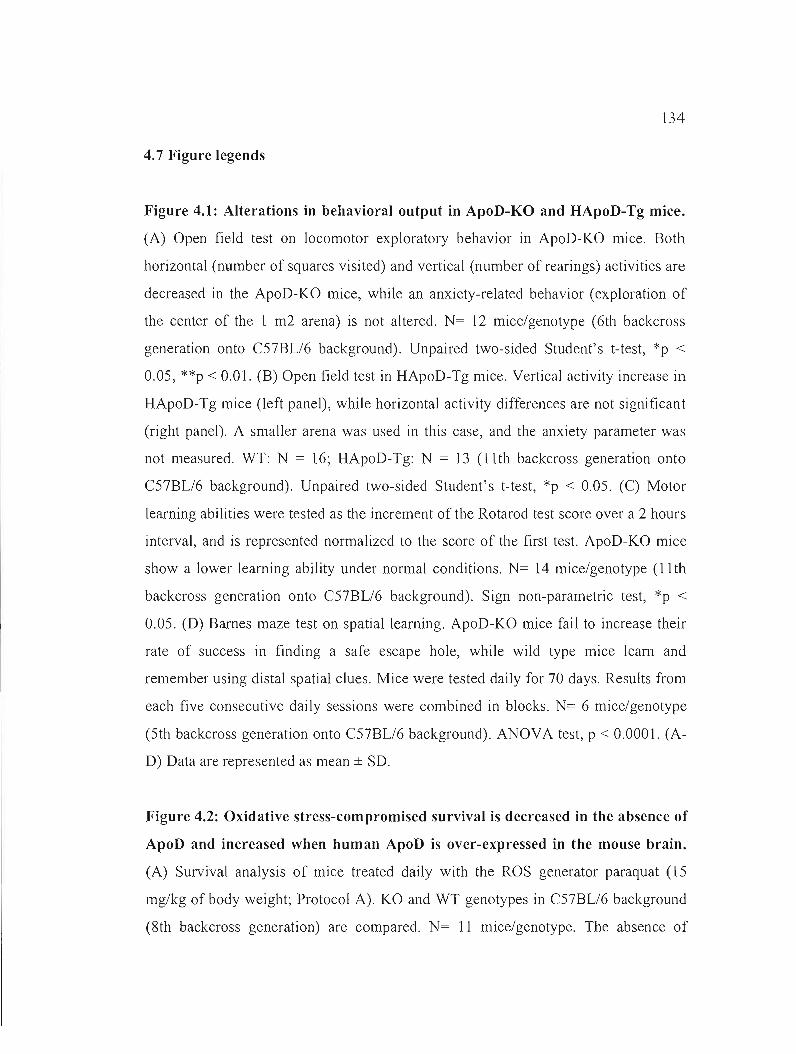
134
4.7 Figure legends
Figure 4.1: Alterations in behavioral output in ApoD-KO and HApoD-Tg mice.
(A) Open field test on locomotor exploratory behavior in ApoD-KO mice. Both
horizontal (number of squares visited) and vertical (number of rearings) activities are
decreased in the ApoD-KO mice, while an anxiety-related behavior (exploration of
the center of the 1 m2 arena) is not altered. N= 12 mice/genotype (6th backcross
generation onto CS7BLl6 background). Unpaired two-sided Student's t-test, *p <
O.OS, **p < 0.01. (B) Open field test in HApoD-Tg mice. Vertical activity increase in
HApoD-Tg mice (left panel), while horizontal activity differences are not significant
(right panel). A smaller arena was used in this case, and the anxiety parameter was
not measured. WT: N = 16; HApoD-Tg: N = 13 (llth backcross generation onto
CS7BLl6 background). Unpaired two-sided Student's t-test, *p < O.OS. (C) Motor
learning abilities were tested as the increment of the Rotarod test score over a 2 hours
interval, and is represented normalized to the score of the first test. ApoD-KO mice
show a lower leaming ability under normal conditions. N= 14 mice/genotype (llth
backcross generation onto CS7BLl6 background). Sign non-parametric test, *p <
O.OS. (D) Barnes maze test on spatial learning. ApoD-KO mice fail to increase their
rate of success in finding a safe escape hole, while wild type mice learo and
remember using distal spatial clues. Mice were tested daily for 70 days. Results from
each five consecutive daily sessions were combined in blocks. N= 6 mice/genotype
(Sth backcross generation onto CS7BLl6 background). ANOVA test, p < 0.0001. (A
D) Data are represented as mean ± SD.
Figure 4.2: Oxidative stress-compromised survival is decreased in the absence of
ApoD and increased when human ApoD is over-expressed in the mouse brain.
(A) Survival analysis of mice treated daily with the ROS generator paraquat (1S
mg/kg of body weight; Protocol A). KO and WT genotypes in CS7BLl6 background
(8th backcross generation) are compared. N= Il mice/genotype. The absence of
135
ApoD shortens the mice survival (Gehan-test, p = 0.026; Cox's F-test, p = 0.028). A
decrease of 26% in mean lifespan and 56% in maximum lifespan is observed. The
survival phenotype is stable after changing the genetic background (Balb/C, 8th
outcross generation) with 11% decrease in mean lifespan and 9% in maximum
lifespan. N= 12 mice/genotype. Gehan-test, p = 0.031; Cox's F-test, p = 0.043 (curve
not shown). (B and C) Survival analysis of WT and transgenic (HApoD-Tg) mice
treated with single PQ doses of 30 (B) or 50 (C) mg/kg of body weight (Protocol B).
Death occurrence was recorded up to 10 days. Surviving animais were sacrificed at
day 10. Data was fitted to a Gompertz function. (B) Over-expression of ApoD
increases the mice survival. WT: N = 16; HApoD-Tg: N = 13. Gehan-test, p = 0.029;
Cox's F-test, p = 0.043. (C) Over-expression of ApoD also protects mice at higher
doses of paraquat. WT: N = 12; HApoD-Tg: N = 9. Gehan-test, p = 0.045; Cox's F
test, p = 0.033. Ail transgenic mice are backcrossed on the C57Bl/6 background (lI th
generation).
Figure 4.3: The endogenous mouse ApoD is transiently up-regulated by
exposure to PQ while the hum an transgene is expressed constitutively in the
brain. (A) Northern blot analysis of mouse ApoD mRNA shows a transient increase
in response to a single injection of paraquat (30 mg/kg; Protocol B). Quantification of
mRNA expression by band densitometry. Values were normalized with the GAPDH
gene. Error bars represent SD (N=3). (B) Mouse ApoD is specifically up-regulated in
the brain upon acute PQ treatment (3 hours after a single PQ dose; 30mg/kg; Protocol
B). No induction is observed in liver or lung. The GAPDH gene was used as a
control. (C) Northern blot analysis shows a comparable expression of the mouse
ApoD endogenous mRNA in the brain of WT and HApoD-Tg mice 3 hours after a
single PQ dose (30mg/kg; Protocol B), and the absence of response to PQ of the
human transgene. The GAPDH gene was used as a control.
136
Figure 4.4: Loss of ApoD function specifically alters Iipid peroxidation in the
brain and an over-dose of human ApoD prevents their accumulation upon
oxidative insult. (A) Oxidation of proteins (Carbonyls-ELlSA assay) and Iipids
(TBARS assay) in control conditions (sham injection of PBS). Lipid peroxidation,
and not protein carbonylation, is increased in the ApoD-KO brains, while lipid
peroxidation in the lung remains unchanged. (B) Brain oxidation status assayed upon
acute (3 hours, Protocol B) or chronic (2 weeks low-dose, Protocol C) exposure ta
paraquat. ApoD-KO mouse brain show a higher level of Iipid peroxidation while
protein carbonylation levels do not change with genotype. (A and B) N= 7
mice/genotype/sex (llth backcross generation onto CS7BLl6 background). Data are
represented as mean ± SD normalized to the wild-type value. Unpaired two-sided
Student's t-test, *p < 0.05, **p < 0.01 ***p < 0.001. (C) Analysis of lipid
peroxidation two weeks after PQ treatment (30 mg/kg of body weight). Human ApoD
expression prevents the rise of oxidized lipids accumulation in the brain. WT: N = 16;
HApoD-Tg: N = 13 (llth backcross generation onto CS7BLl6 background).
Unpaired two-sided Student's t-test, ***p < 0.001. Data are represented as mean ±
SD normalized with respect to the control values (sham injection ofPBS).
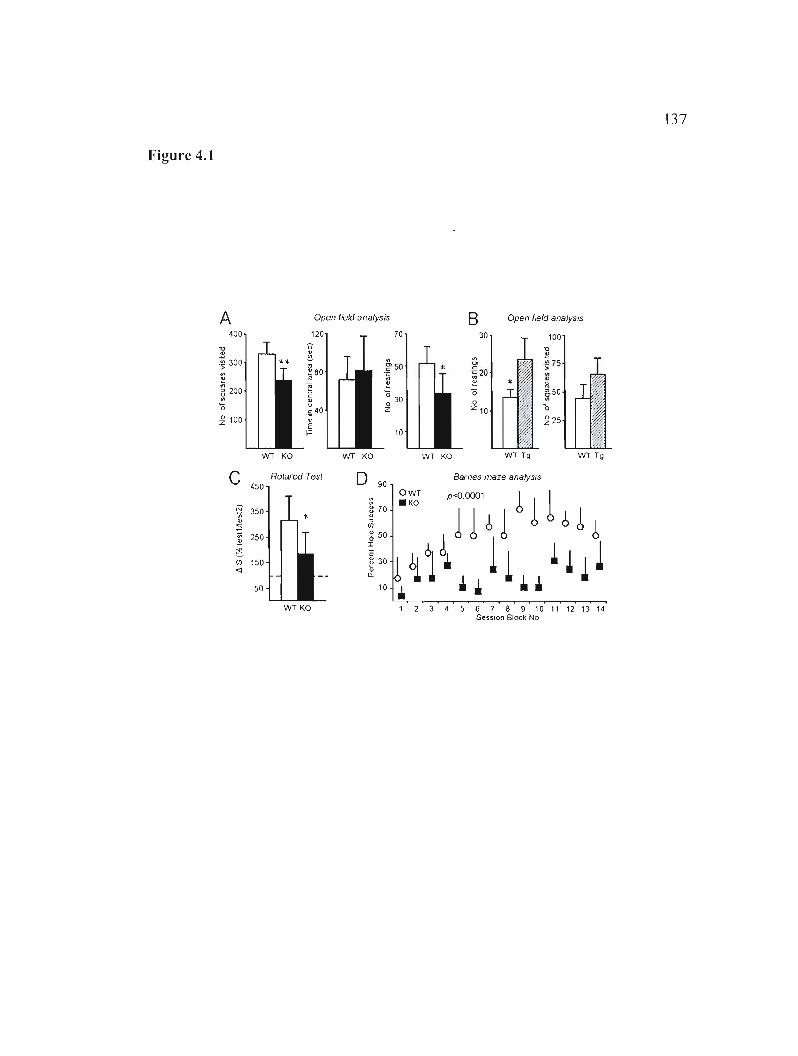
137
Figure 4.1
A Open field afl81ysis Open field ana/ys/5 B 400 120 70 30 100
"0 u
ë "0
~
.~ :300 '" !!! 75'" ~
g'SO '" >" .~ 20~80'"u ~ '" ~ a. 200 '" ~ '0 ~50.. '0 ~
'0
~
o ~ 0
.~40 z10 ~ 100
'0 '" z '0 '" ~25'" E
1= 10
wr KO wr KO WT KO
C Ro/arod Test Sames maze 8nalysiS90450 0
OWT
N 70350;;
:::"
.KO
lT~ l!ll ~ ! ~ ~ f/) 30 <l
~ '" 250 50
~~J. 11 !!!l 50 10
150
• •• *. wr KO 2 3 4 5 6 7 8 9 10 11 12 13 14
SesSion Black No
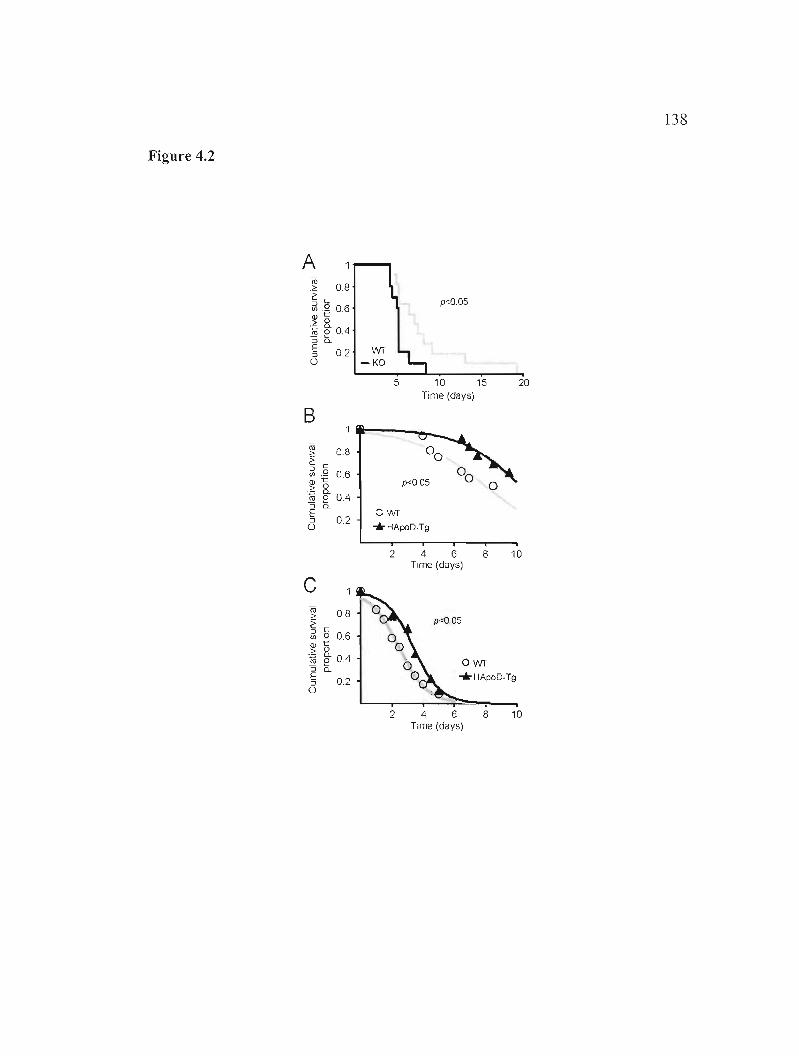
138
Figure 4.2
A lU > 0.8.:;
p<005~.§ 0.6
.~ <lit
8. 1iî 00.4 "30~ 02 ü
5 10 15 20 Time (days)
B
~ 0.8 2 c ~ ,Q 0.6
.-~6
0n; e 04 :Jog 0.2 o
2 4 G 8 10 Tlme (days)
c <Il 08> .~ c p-<0.05
~ .~ 0.6 _~ 0 ]§ g. 04 0wr ::J 0.. 1::: *HApoD-Tg::J 0.2 o
2 4 6 8 10 Tlme (days)
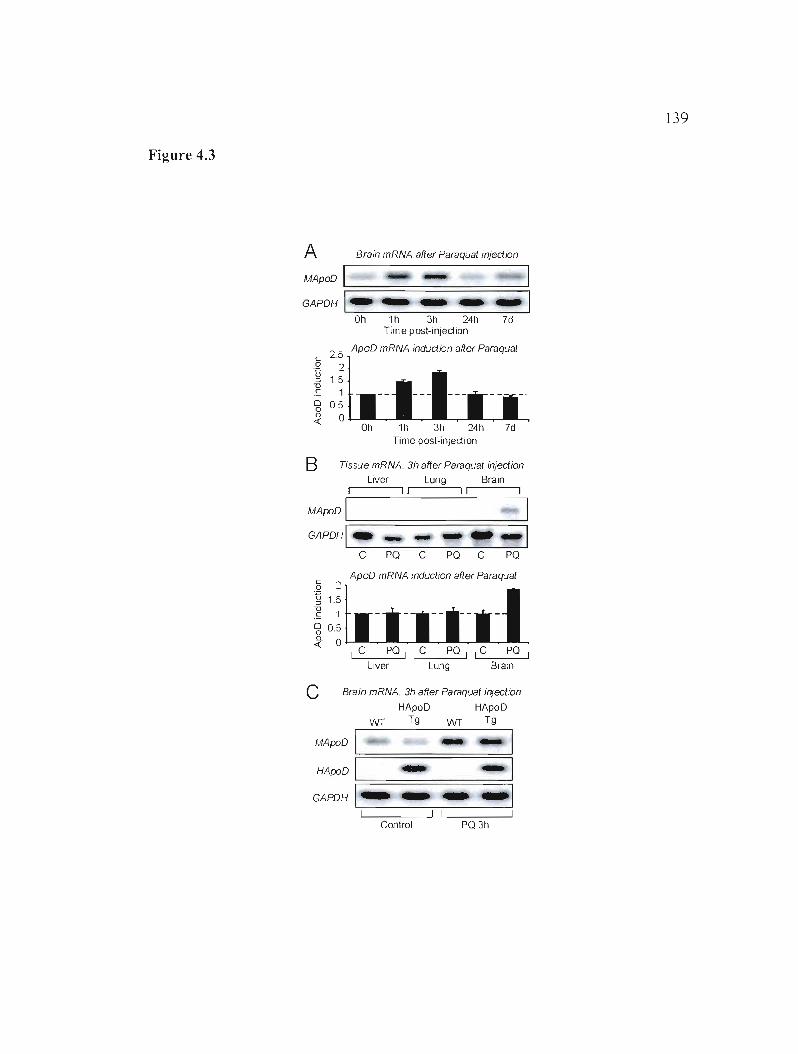
139
Figure 4.3
A Brain mRNA after Paraq:Jat injection
MApoO -GAPOH!- -- ...........
'----=0.,...h----,-,1h---3-h--=-24-h--7-d-
Time post-injection
ApoO mRNA J!1duction ailer Paraquat') _.::JC
.Q 0 :> "0 .s
2 1.5
1 0 0 0.5 Q.
~ 0 Oh 1h 3h 24h 7d
Time post-injection
B Tissue mRNA. 3h after Paraquat injection
Liver Lung Brain
ApoO mRNA induction after ParaqJat c 0 :2 Ü 1.5:> "0
1.s 0 0.50 Q.
0~ IC POIIC POIIC PO
Liver Lung Brain
C Brain mRNA. 3h after Paraq!.Jat if1jeclion
HApoD HApoO VVT Tg WT Tg
MA{X!O 1 - -- 1
HA{X!O :=1=======-==I! =====-===1
GAPOH ~ 1-;-1-----:-;------1
Control P03h
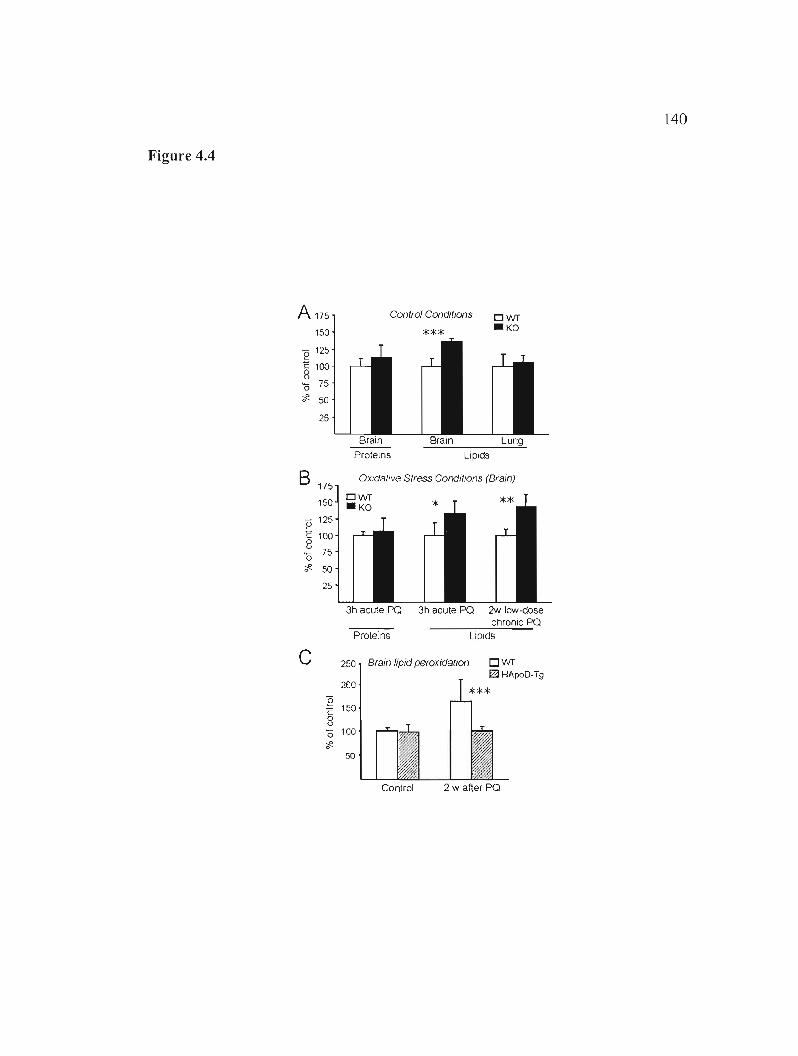
140
Figure 4.4
A 175
150
~ 125
c: 100 8 '0 75
~ 50
25
B 175
150
~ 125
c: 100 8'0 75
?f. 50
25
c ~ ë 8 '0
COlltrol Cond/lions
***
Brain Brain Lung Protelns Liplds
Oxidative Stress Conditions (Brain)
Dwr -KO
3h aorte PO 3h acute PO 'Lw law-dose chronic pa
Proleins Liprds
250 Brain/ipid peroxidalion 0 wr rn HApoD·Tg
200
*** 150
100
50
Control
141
4.8 Supplementary online material
4.8.1 Supplementary results
4.8.1.1 General features of ApoD-KO and HApoD-Tg mice
ApoD-KO mice are viable, develop, and breed normally with litters of similar
Slze. Frequency analysis of appearance of the mutated allele in litters from
heterozygous couples demonstrated a standard Mendelian inheritance (X2=O.57,
n=142, C57BL6/J background). Variables related to metabolism (size and weight,
effects of high fat diet, and serum lipid profile), as weil as to the general
cytoarchitecture of the brain, did not show signifïcant differences between genotypes
(see below). Likewise, transgenic HApoD-Tg mice live and reproduce normally.
4.8.1.2 Compensation by other lipocalins
Given the mild phenotypes of ApoD-KO mlce, we tested a functional
compensation by other lipocalins. We studied with immunoblot and
immunohistochemistry the expression of two other members of the lipocalin family
that can be found in the neural tissue: the prostaglandin D-synthase and alpha-l
microglobulin. The expressions of these Iipocalins were not altered in the ApoD-KO
brains under normal conditions (results not shown).
4.8.1.3 Nervous system cellular architecture in ApoD-KO mice
Cytoarchitecture of cortical, hippocampal and cerebellar brain regions were
explored using standard histochemistry and immunohistochemistry with neuronal
(calretinin, Tujl), astroglial (GFAP) and oligodendroglial (PLP) antibody markers.
142
No apparent differences were observed in ApoD-KO mice with respect to their wild
type siblings (results not shown).
4.8.1.4 Behavioral tests
The results of the behavioral explorations (Crawley 2000) of the sensory
domain (visual ability, pain and touch sensitivity), footprint analysis and muscular
strength (hanging wire test) are shown below. No differences are observed between
genotypes.
Novel-object recognition test (1 min after pre-test):
Ratio WT=0.65±0.03; Ratio KO=0.67±0.04 (p=0.63; t-Test)
Hot plate:
WT=9.2±2.4 sec; KO= 11.4±6.1 sec (p=O.27; t-Test)
Tai! Flick:
WT=2.6±0.9 sec; KO=2.9±1.1 sec (p=0.52; t-Test)
Mecanoception by Von Frey hairs test with 1.6, 3.98, 6.78, 14.4, 20 and 35.5 mN
hairs:
WT=0.25±O.6; 1.42±1.32;1.83±1.32; 4.17±1.99; 6.42±2.56; 8.67±1.11
KO=0.42±0.86; 1.58±1.26; 2.58± 1.38; 5.08±2.06; 7.67±1.84; 9.17± 1.34
t-Test p values: 0.6, 0.76, 0.24, 0.30, 0.2, and 0.35
Footprint analysis (stride length, overlap and width):
WT=77.29±9.49; 5.28±1.08; 18.24±2.43.
KO=77.78±5.7; 5.39±0.96; 17.51±2.76.
t-Test p values: 0.88; 0.81; 0.21.
Hanging wire:
WT=36.5±28.7 sec; KO=35.9±33 sec (p=0.97; t-Test)
143
4.8.2 Supplementary figure legends
Figure 4.1S : Generation of ApoD knockout mice and molecular assessment of
the null allele. (A) Targeted disruption of the mouse ApoO gene by insertion of the
inverted Neo gene. Schematic maps of the wi1d-type allele, targeting vector and
mutated allele. ApoO exons are shown as white boxes. BamHI restriction fragments
expected for the wild-type and mutant loci are shown with brackets. Genomic ONA
from transfected G418r-GANCs ES cells was digested with BamHl and analyzed by
Southern blot using the 5' probe (striped box). B, Barn HI. (B) PCR primers in exon 6
were used to test ApoO transcription in brains of ApoO+/+ (WT) and ApoO-/- (KO)
mice. Absence of the ApoO band in the mutant aile le proves the nul1 transcriptional
mutation. Absence of genomic ONA contamination was proved by omitting the
reverse transcriptase from the reaction mixture (RT- control lanes). An expected
genomic fragment (gONA) was amplified for comparison. Negative PCR control was
performed in the presence of an unre1ated ONA template. (C) Northern blot analysis
of total RNA from brainstems of WT and KO mice probed with a P32-labeled ApoO
cONA probe. Hybridization shows the expected 0.9 kb ApoO band in wild type
mouse and the lack of signal in the RNA from ApoO-KO mice, confirming the nul!
transcriptional allele. (0) Protein expression test by immunohistochemistry in
cryostat sections of brain regions of WT and ApoO-KO mice. Arrows point to ceUs
expressing ApoO, that appear to be (according to their shape and size)
oligodendrocytes in the corpus cal!osum, astrocytes and neurons in the brainstem, and
pericytes in the blood vessel shown.
Figure 4.2S : Generation of transgenic mice overexpressing human ApoD in the
CNS. (A) Schematic representation of HApoO transgene. It contains first a 3.5 kb of
the human Thy-l promoter/enhancer upstream of a 0.7 kb fragment representing the
human ApoO cONA fol1owed by 0.2 kb BGH consensus polyadenylation signal. It
was microinjected into the pronucleus of fertilized CBA x C57Bl/6 mouse eggs using
144
standard techniques. (B) PCR genotyping of tail DNA for identification of transgenic
mice (abbreviated hereafter as HApoD-Tg). An expected 0.6 kb band is amplified
with human ApoD and BGH primers in transgenic, but not in WT mice. Controllane
shows a PCR reaction in the presence of an unrelated DNA template. (C) Analysis of
the transgene expression in multiple tissues by northern hybridization with a P32
labeled human ApoD specific probe. Human ApoD appears to be mostly expressed in
the CNS, with a weak expression in the thymus and heart. Total RNA of WT mouse
brain is included as control. Equal loading was determined by subsequent
hybridization with a GAPDH cDNA probe. (0) Comparison of transgene expression
in various brain subregions by northern blot analysis. Ail regions, except the pons,
express good levels of the human transgene. (E) Western blot analysis of the
transgene product in the brain with a polyclonal anti-human ApoD (Caro2) antibody.
Equal loading is shown by subsequent staining with an antibody against GAPDH.
Figure 4.3S : Effects of PQ treatment in lipid and protein oxidation in the wild
type brain. (A) Lipid peroxide adducts (TBARS assay) accumulate in the wild type
brain over time at a relatively slow pace. No increase is observed 3 hours after a
single high dose of PQ (acute PQ treatment, protocol B), while a low-dose chronic
treatment (protocol C) does produce a significant increase after two weeks. (B)
Protein oxidation in brain (carbonyl groups detected by ELISA assay) occur faster
with a significant increase after 3h (acute PQ treatment, protocol B). (A and B) Data
are represented as mean ± SD normalized with respect to the control values (sham
injection of PBS).
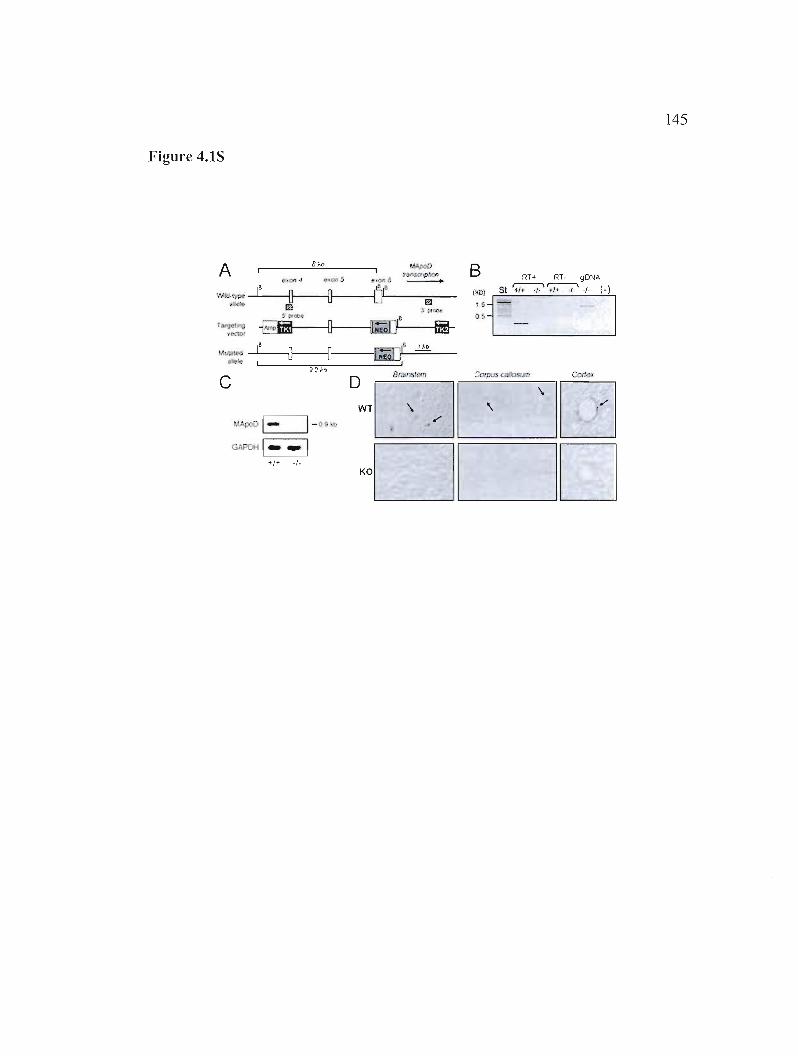
145
Figure 4.18
i "'-"poOA tI~f);C7r;JtflOl1
thon~ -'.'I,"J.l;~ ---1-1' ---1[}----{],---IÔi'-18__=-_
iI.I!.eI.!" ~ :3~ e
~ rwœ. e -{3ffi}------l}~1'-1--C'l"~~
1 ". 1 "tA"'" ---1-' ---HO---1f-----II
IWolf!
c
/.'ApoD 1_ I-o 'b
GAPDHI __ 1
+/+ -/.
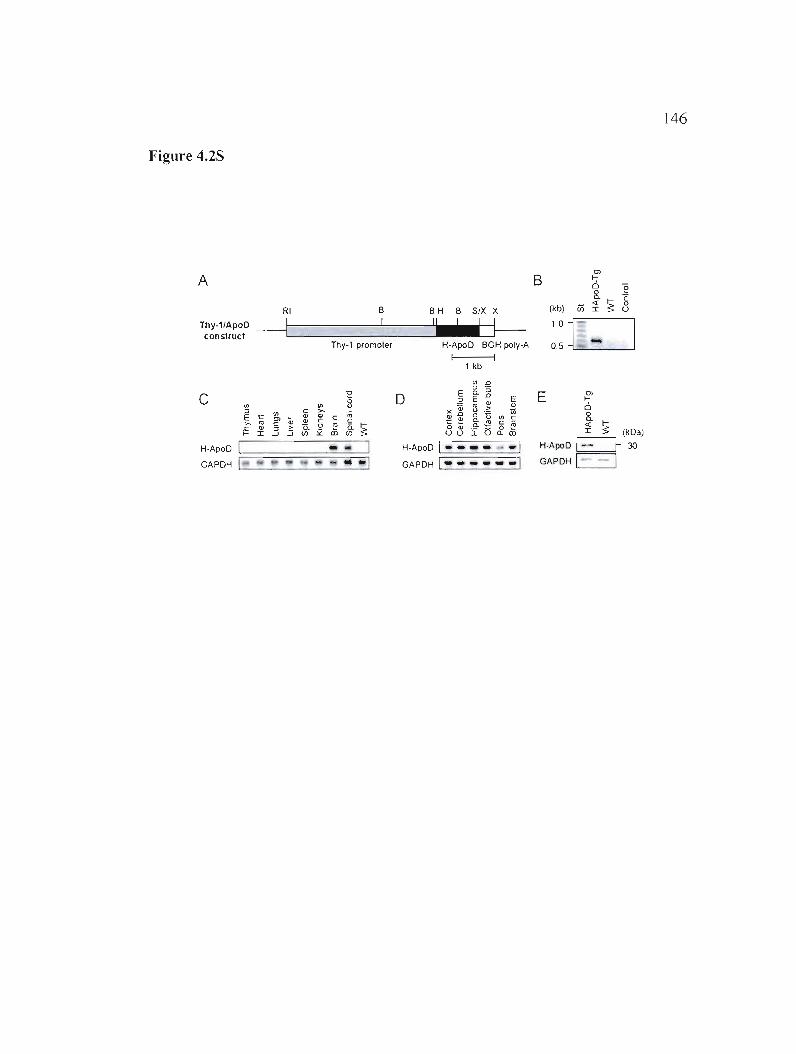
146
Figure 4.2S
l-A B al
D ë8. ë .q: 0
RI B B H B SiX X (kb) iii I ~ U
Thy.1/ApoO II--------L.! --l.I~ construct ----j ----.r-
Thy-l promoler H-ApoD BGH poly-A :: l 1 1
1 kb
<Il D
"0 E ~ "S al lc o .=1 E ~ ~ E
<Il 8 D:J V> ~ ~ rs.~ li)E t: al Qi t:~R~~s 8. >- '" § ~ .r::: '" 8~~ô&~ ~ ~ (kDa)1- I -' -'
H.ApoD~ 30H-ApoD 1 - - - - . -1H·ApoD :=======-=::..~I GAPOH '-----'----'-'---'-' ---:-:.--"-1-] GAPDH 1 - - - - -3 GAPDH~
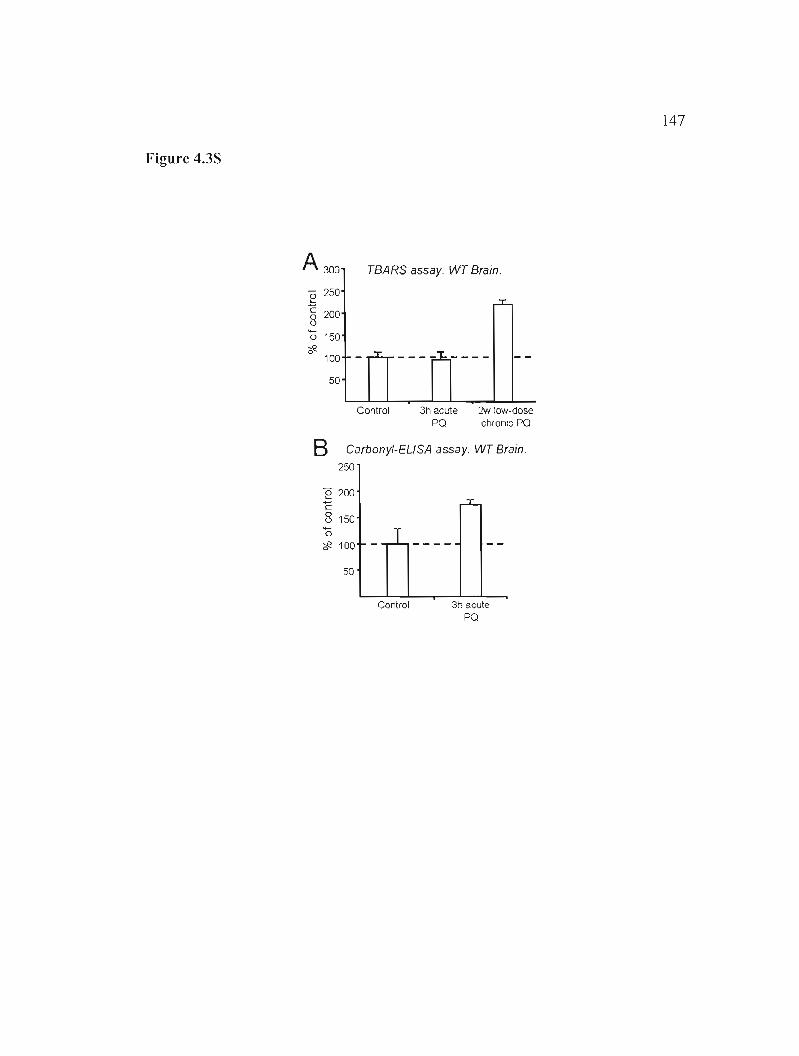
147
Figure 4.3S
A 300 TBARS assay. WT Brain.
2502 ë 0 200 ü
0 150 #.
100 ""---50
Control 3h acute 'LvI law-dose PO chronlc PO
B Carbonyl-ELISA assay. WT Brain.
250
e 200 C 8 150 ~
o #. 100
50
Control 3h acute PO
CHAPITRE V
Neuroprotective effect of Apolipoprotein D against human coronavirus OC43
induced encephalitis in mice
Sonia Do Carmo*, Hélène Jacomy*, Pierre J. Talbot, Eric Rassart
2008
Journal of Neuroscience 28 : 10330-10338
*Ces auteurs ont contribué de façon équivalente à ce travail.
149
Avant-propos
Les travaux présentés en chapitre IV nous ont démontré que l'apoO a un effet
protecteur face aux effets oxydants du paraquat. Puisque l'étude in vitro présentée en
chapitre II nous a démontré que l' apoO répondait aussi très fortement au stress
inflammatoire, nous avons voulu vérifier si la surexpression de l'apoO humaine était
également capable de contrer les effets neurodégénératifs d'un traitement déclenchant
une inflammation aiguë. Pour ce faire, nous avons injecté le coronavirus humain
OC43 (HCoV-OC43) de façon intracérébrale à des souris H-apoO-Tg. Nous avons
ainsi examiné l'influence du HCoV-OC43 sur l'expression de l'apoO. Nous avons
par la suite déterminé l'effet de l'apoO sur la survie des souris et sur différentes
composantes de l'encéphalite virale soit la réplication virale, l'activation des
astrocytes et de la microglie, l'infiltration des cellules T dans le cerveau, la
production de cytokines et de chemokines et enfin l'activité de la phospholipase A2
qui régule beaucoup de processus inflammatoires impliqués dans les dommages
neuronaux.
Les coronavirus humains sont des virus enveloppés possédant un génome à
ARN simple brin de polarité positive. Ils infectent surtout l'appareil respiratoire et
sont responsables du rhume. Ils ont de plus la capacité d'infecter, de se répliquer et de
persister dans les cellules neuronales. L'un des sérotypes de coronavirus humains,
HCoV-OC43, ressemble aux coronavirus murins. Ceux-ci sont capables de causer
une inflammation démyélinisante du SNC rappelant la sclérose en plaques (Jacomy
and Talbot 2003). Lorsque injecté de façon intracrânienne chez la souris, le HCoV
OC43 provoque une encéphalite aiguë qui tue 80% des souris CS7/b16 en environ 13
jours. Les souris restantes se remettent de l'infection. Ces dernières sont
habituellement des femelles puisque celles-ci sont plus résistantes à l'infection que
les mâles. L'infection est retrouvée partout à travers le SNC. Elle affecte les neurones
causant leur vacuolisation et dégénération. Les régions affectées présentent également
150
une réaction inflammatoire aiguë et une activation de la microglie (macrophages
cérébraux) contribuant encore plus à la dégénérescence nerveuse.
J'ai contribué à toutes les facettes de ce travail. J'ai d'abord élaboré le design
expérimental qui a ensuite été approuvé et amélioré par Hélène Jacomy. J'ai fait les
études d'expression d'apoD en réponse à HCoV-OC43. J'ai également fait tous les
immunobuvardages concernant l'expression de l'apoD, des marqueurs d'activation
gliale et de cellules T. J'ai également fait les études de FACS et d'activité de la
phospholipase A2. J'ai aussi fourni les animaux transgéniques à Hélène Jacomy qui
s'est occupée de l'injection et de la surveillance régulière des animaux injectés. Elle a
de plus prélevé les tissus utilisés dans les différentes expériences, quantifié les virus
dans le cerveau des souris suite à l'injection et homogénéisé les cerveaux pour
l'analyse des cytokines. Hélène et moi avons partagé la rédaction du manuscrit.
151
S.l Résumé
L'apolipoprotéine D (apoD) est une lipocaline surexprimée dans le système nerveux suite à une lésion ou à des pathologies comme l'Alzheimer ou le Parkinson et la sclérose en plaques. Nous avons déjà démontré que l'apoD protège contre la neuropathologie en contrôlant le niveau de lipides peroxydés. lei, nous avons exploré davantage la fonction biologique de l'apoD dans un modèle murin d'encéphalite aiguë. Nos résultats démontrent que les transcrits et la protéine de l'apoD sont augmentés pendant l'encéphalite aiguë causée par l'infection par le coronavirus humain OC43 (HCoV-OC43). La surexpression de l'apoD coïncide avec l'activation gliale et son expression revient aux niveaux de base lorsque le virus et l'activation gliale sont résorbés. Par ailleurs, la surexpression de l'apoD humaine dans les neurones des souris transgéniques Thy-l/ApoD a triplé le nombre de souris survivant à l'infection par HCoV-OC43. Ce meilleur taux de survie est corrélé à la fois avec l'augmentation de l'activation gliale, la diminution de la réponse immune innée (cytokines, chemokines) et l'infiltration de cellules T dans le cerveau. De plus, la protection semble associée à une activité de la phospholipase A2 restreinte. Ces résultats révèlent un rôle pour l'apoD dans la régulation de l'inflammation et suggèrent qu'elle protège de l'encéphalite induite par HCoV-OC43 sans doute via les voies signalétiques de la phospholipase A2.
Mots-clés: inflammation, encéphalite virale, phospholipase A2, infiltration de cellules T.
152
5.2 Abstract
Apolipoprotein 0 (apoD) is a lipocalin up-regulated in the nervous system foUowing injury or pathologies such as Alzheimer's disease, Parkinson's disease and multiple sclerosis. We previously demonstrated that apoD protects against neuropathology by controlling the level of peroxidated lipids. Here, we further investigated the biological function of apoD in a mouse model of acute encephalitis. Our results show that apoD transcript and protein are up-regulated during acute encephalitis induced by the human coronavirus OC43 (HCoV-OC43) infection. The apoD up-regulation coincides with glial activation and its expression returns ta normal levels when the virus is cleared, concomitantly to a resolved glial reactivity. In addition, the overexpression of human apoD in the neurons of Thy-l/ApoD transgenic mice results in a 3-fold increase of the number of mice surviving ta HCoV-OC43 infection. This increased survival rate is correlated with an up-regulated glial activation associated with a limited innate immune response (cytokines, chemokines) and T-ceU infiltration into infected brains. Moreover, the protection seems to be associated with a restricted phospholipase A2 activity. These data reveal a role for apoD in the regulation of inflammation and suggest that it protects from HCoV-OC43-induced encephalitis, most likely through the phospholipase A2 signaling pathways.
Keywords: inflammation, viral encephalitis, phospholipase A2, T-cell infiltration.
153
5.3 Introduction
Apolipoprotein 0 (apoO) is a lipocalin widely expressed in human tissues
including the central nervous system (CNS) where it is expressed mainly in glia but
also in neurons (Hu et al. 200 1, Provost et al. 1991, Smith et al. 1990). ApoD
expression is increased in several neuropathologies such as Alzheimer's (Terrisse et
al. 1998), Parkinson's (Ordonez et al. 2006) and Niemann-Pick's type C diseases
(Yoshida et al. 1996), meningoencephalitis (Terrisse et al. 1998) and multiple
sclerosis (Reindl et al. 2001) (reviewed in Rassart et al. 2000, van Oijk et al. 2006).
Nevertheless, the precise l'ole of apoO in the CNS remains unknown. Early studies
suggested that apoO promotes repair. Indeed, after nervous tissue injury, its
expression correlated weil with remova1 and redistribution of lipids (Boyles et al.
1990a, Terrisse et al. 1999), active myelination and axonal outgrowth (Ong et al.
1999, Rickhag et al. 2008). Moreover, apoO favors survival upon an oxidative insult
by controlling the levels of peroxidated lipids (Ganfornina et al. 2008).
ApoO has been shown to bind with high affinity to arachidonic acid (AA)
(Morais Cabral et al. 1995), an abundant component of neural membranes (Oiau et al.
2005). The liberation of AA from membrane phospholipids by phospholipases A2
(PLA2s) is an upstream regulator of many inflammatory processes inv01ved in
neuronal damage (Farooqui et al. 1997). As apoO seems to stabilize membrane
associated AA (Thomas et al. 2003d), it could restrain inflammation by limiting free
AA. ApoO was already associated with inflammation as its expression is modulated
in response to lipopolysaccharide in non-neuronal cel1s (Do Carmo et al. 2007) and in
response to interleukin-l, interleukin-6 and glucocorticoids in human breast-cancer
cel1s (Blais et al. 1994, 1995). This modulation couId be related to the presence of
specifie binding sites on the apoO promoter (Do Carmo et al. 2002, 2007).
154
Human coronaviruses (HCoV) are enveloped positive-stranded RNA viruses
that primarily infect the upper respiratory tract, leading to cornmon colds (Myint et al.
1994). Moreover, they have neuroinvasive properties in human brains (Arbour et al.
2000), and could initiate neurological disorders such as multiple sclerosis (Boucher et
al. 2007, Talbot et al. 2001, 2008). We previously characterized HCoV OC43
mediated neuropathogenesis in mice (Jacomy and Talbot 2003; Jacomy et al. 2006).
C57BL/6 mice infected by an intracerebral inoculation of HCoV OC43 developed
signs of acute encephalitis. Neurons, which are the main target of infection,
underwent vacuolation and degenerated by necrosis and apoptosis. lnfected regions
also presented microglial activation and astrogliosis, signs of a strong inflammatory
reaction.
The main objective of this study was to investigate the biological role of apoD
during acute viral encephalitis in a mouse mode!. Here we show that fol!owing
HCoV-OC43 infection, endogenous apoD is up-regulated and mice overexpressing
human apoD (H-apoD) in neurons have an increased survival rate. This increased
survival was correlated with an up-regulated inflammatory reaction associated with a
limited T-cel! infiltration into infected brains. These data revealed a role for apoD in
the regulation of inflammatory reactions in the brain and suggest that apoD protects
from HCoV-OC43 induced encephalitis, at least in part, tmough the activation of
signaling pathways involving PLA2.
155
5.4 Materials and methods
5.4.1 Mice
Human apoD transgenic mice carry a construct containing the H-apoD cDNA
fused to the bovine growth honnone (BGH) polyadenylation signal under the control
of three different neuron-specific promoters/enhancers. ln Thy-l/ApoD mice, the H
apoD expression is controlled by the promoter, the first exon, the first intron and the
5' non-coding region of the second exon of the human Thy-I gene (~ 3.5 kb) (gift
from J. Silver, New York University Medical Center). ln NSE/ApoD mice, the rat
neuron-specific enolase (NSE) promoter (~ 1.8 kb) (gift from G. Sutcliffe, Scripps
Research Institute, La Jolla) controls the H-apoD expression. Finally, in NFL/ApoD
mice, the H-apoD/BGH fragment was inserted after the promoter in the complete
human neurofilament light chain (NFL) gene (gift from J.-P. Julien, CHUL,
Université Laval). Thus, H-apoD is expressed in neuronal cells in aIl regions of the
nervous system. Ail mice were backcrossed into C57BL/6 background for at least 10
generations. Genotyping was performed on tail biopsies as already described
(Ganfornina et al. 2008). Ali the experimental procedures were approved by the
Animal Care and Use Committees of Université du Québec à Montréal and INRS
Institut Armand-Frappier.
5.4.2 Virus and inoculations
The ATCC HCoV-OC43 strain (ATCC number VR-759) was grown on the
HRT-18 cell line and virus stocks (l 065 TClO5o/ml) were kept at -80°C as previously
described (Jacomy and Talbot 2003). Mice were infected at 22 days post-natal (DPN)
with intra-cerebral (IC) inoculation of 10 ~t1 containing 10 TCID50 of HCoV-OC43.
Control mice received an intra-cerebral inoculation of 10 ).lI of cell culture medium.
156
Mice were sacrificed at different days post-infection (DPI) and brain and spinal cord
were collected.
5.4.3 Survival curves
Litters were weaned at 21 days postnatal (DPN) and separated by sex,
maintaining strain identification. The next day, ail separated litters were inoculated
with virus and during anesthesia ears were punch for identification and piece of tai 1
sectioned for genotype analysis. Then, infected mice were observed daily up to 20
DPI to monitor survival. Forty-eight transgenic Thy-liApoD mice and 45 wild-type
(WT) littermates, as weB as 32 transgenic NSE/ApoD versus 51 WT littermates and
53 transgenic NFLIApoD versus 46 WT littermates were used to establish survival
curves. Survival rate was calculated at 20 days after HCoV-OC43 inoculation.
5.4.4 Infectious virus assays
Five transgenic mice and 5 WT littermates for each'genotype were dissected
at Il DPI for infectious virus assays. Brains were homogenized to 10% (w/v) sterile
PBS, centrifuged at 4°C, 20 min at 1,000 x g, and supernatants were immediately
frozen at -80°C and stored until assayed. The extracts were processed for the presence
and quantification of infectious virus by an indirect immunocytotochemistry assay, as
previously described (Jacomy and Talbot 2003).
5.4.5 RNA extraction and Northern blot analysis
Total RNA was extracted from brain or spinal cord by homogenization in the
Trizol reagent (Invitrogen, Burlington, ON). RNA (10Ilg) was separated on 1.5%
(w/v) agarose-formaldehyde gels and blotted to a nylon membrane. The membranes
157
were hybridized with [u-32P] dCTP-Iabeled human or mouse apoD, and mouse
GAPDH cDNAs. The hybridization signal was detected with a Bio-Rad lmaging
screen K, read with a Phosphorlmager and analyzed with the QuantityOne software
(Bio-Rad Molecular Imager FX, Bio-Rad Laboratories, Mississauga, ON).
5.4.6 Protein extraction and Western blot analysis
Brain and spinal cords were homogenized in Iysis buffer (50 mM Tris-Hel pH
7.3, ISO mM NaCI, 5 mM EDTA, 0.2% (v/v) Triton X-I 00, and 10% (w/v) Complete
protease inhibitor (Roche, Laval, QC)). After 30 min of incubation at 4°C, Iysates
were sonicated and cleared by centrifugation. Protein concentration was determined
using the Bio-Rad protein assay (Bio-Rad Laboratories). Proteins (10 /-lg per sample)
were separated on a 12% (w/v) SDS-polyacrylamide gel and transferred to PVDF
membranes. Membranes were incubated with the primary antibodies: human apoD
mouse monoclonal antibody (2B9), 1: 100000; mouse apoD rabbit polyclonal
antibody, 1:500; HCoV-OC43 nucleocapsid N protein (OC43 (N)) mouse monoclonal
antibody 1: 100; GFAP rabbit polyclonal antibody (Cel1 signaling-NEB, Pickering,
ON), 1:5000; Mac-2 rat monoclonal antibody (ATCC-Cedarlane, Burlington, ON),
1: 100; CD4 rat monoclonal antibody (BD Pharmingen, Mississauga, ON), 1:500;
GAPOH mouse monoclonal antibody (Calbiochem, San Diego, CA), 1:500000.
Binding of these primary antibodies was detected with appropriate horseradish
peroxidase-conjugated secondary antibodies and visualized by chemiluminescence
(Amersham ECL, GE-Healthcare, Baie d'Urfé, QC) and X-ray film.
5.4.7 Immunohistochemistry
Seriai vibratome sections (40 !--tm) of paraformadehyde-perfused brains were
subjected to immunohistochemistry as already described (Jacomy and Talbot 2003).
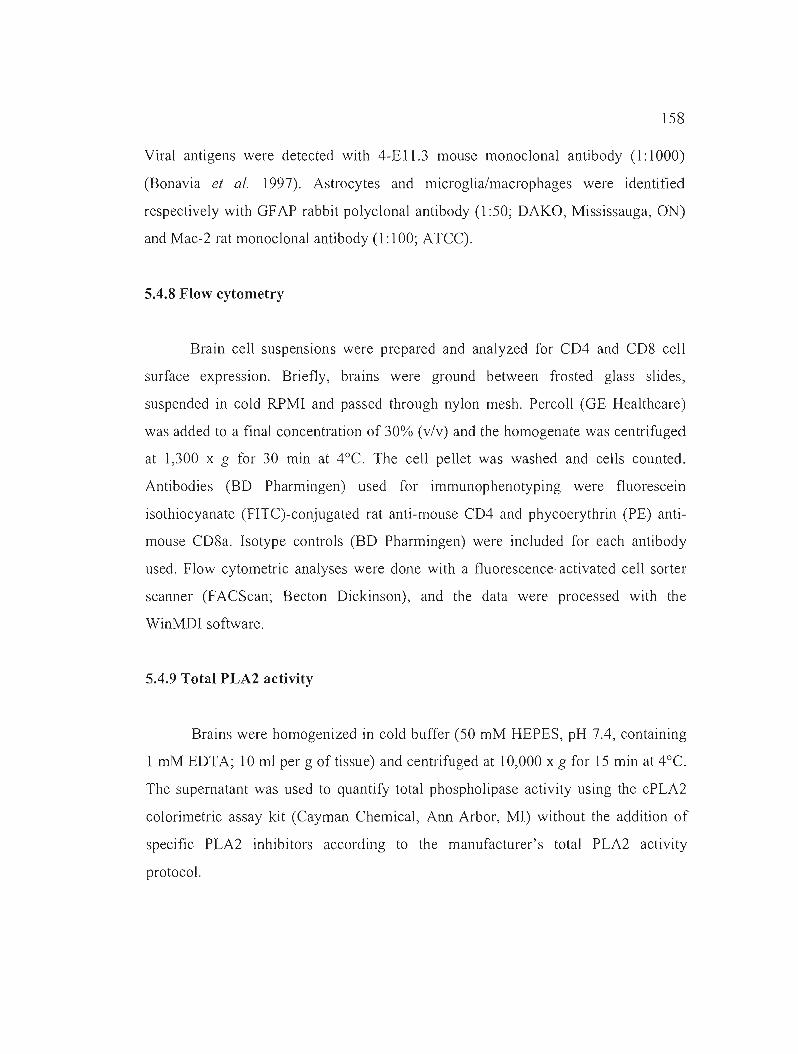
158
Viral antigens were detected with 4-E 11.3 mouse monoclonal antibody (1: 1000)
(Bonavia et al. 1997). Astrocytes and microglia/macrophages were identified
respectively with GFAP rabbit polyclonal antibody (1 :50; DAKO, Mississauga, ON)
and Mac-2 rat monoclonal antibody (1 :100; ATCC).
5.4.8 Flow cytometry
Brain cell suspensions were prepared and analyzed for CD4 and CD8 cel!
surface expression. Brief1y, brains were ground between frosted glass slides,
suspended in cold RPMI and passed through nylon mesh. PercoU (GE Healthcare)
was added to a final concentration of 30% (v/v) and the homogenate was centrifuged
at 1,300 x g for 30 min at 4°C. The ceU pellet was washed and cells counted.
Antibodies (BD Pharmingen) used for immunophenotyping were f1uorescein
isothiocyanate (FITC)-conjugated rat anti-mouse CD4 and phycoerythrin (PE) anti
mouse CD8a. lsotype controls (BD Pharmingen) were included for each antibody
used. Flow cytometric analyses were done with a f1uorescence-activated cell sorter
scanner (FACScan; Becton Dickinson), and the data were processed with the
WinMDI software.
5.4.9 Total PLA2 activity
Brains were homogenized in cold buffer (50 mM HEPES, pH 7.4, containing
1 mM EDTA; 10 ml pel' g of tissue) and centrifuged at 10,000 x g for 15 min at 4°C.
The supernatant was used to quantify total phospholipase activity using the cPLA2
colorimetrie assay kit (Cayman Chemical, Ann Arbor, MI) without the addition of
specifie PLA2 inhibitors according to the manufacturer's total PLA2 activity
protocol.
159
5.4.10 Cytokine quantification
Brains from Thy-l/ApoD and WT litterrnate mice were dissected at S and Il
DPI for cytokine assays. Brains were weighed and homogenized in 10% (w/v) sterile
PBS (pH 7.4) containing Hait protease inhibitor cocktail (Pierce-Fisher Scientific,
Ottawa, ON). Following homogenization, tissues were centrifuged at 4°C, 15 min at
1,500 x g, then supernatants were immediately collected and stored frozen at -SO°C
until assayed. The extracts were processed for the presence and quantification of
cytokines using SearchLight Chemiluminescent Protein Arrays and were performed
by the SearchLight Sample Testing Service of Pierce Biotechnology (Woburn, MA).
5.4.11 Statistical analyses
Survival rates were plotted as Kaplan-Meier survival curves and were
compared using the log-rank (Mantel-Cox) test or Student's t-test for the survival rate
at 20 DPI. One-way ANOVA was used for histogram analyses. Statistical
significance was defined as P < 0.05.
160
5.5 Results
5.5.1 Clinical status of mice following HCoV-OC43 infection
During the first week post-infection, mice ate and drank normally and did not
loose weight. Between 8 to 9 DPI, infected mice presented ruffed fur and, one day
later, showed humped back posture, as previously described (Jacomy and Talbot
2003). At around Il DPI, mice either recovered rapidly and showed no further
symptoms of encephalitis (classified as having mild signs) or they became anorexic,
inactive, dehydrated and start to die from encephalitis (classified as having severe
signs). Mice with severe signs of impairment, lethargy or eating/drinking difficulty
were immediately euthanized.
5.5.2 ApoD is induced in the CNS of HCoV-OC43- infected mice
To investigate whether HCoV-OC43 infection modulated apoD gene
transcription, infected WT mice were sacrificed at 7, 12 and 20 DPI and different
parts of the brain were processed for the detection of apoD gene expression. Results
show that apoD transcription was increased in response to HCoV-OC43 infection
(Fig. S.l). The CNS regions showing the highest apoD up-regulation were the cortical
area (cortex) and hippocampus with a S- and 6-fold increase in expression at 7 DPI,
respectively. At this time post infection, mice did not yet show pathological
symptoms of infection. ApoD expression was further increased at 12 DPI, when mice
began to present morbidity and reached 11- and 13-fold induction, respectively, when
compared to non-infected (control) mice. At 12 DPI, apoD gene expression reached
its maximum in ail CNS regions tested. Its expression was increased 2- to 3-fold in
the medulla and olfactory bulb and 6-fold in cerebellum and spinal cord. At 20 DPI,
161
apoD transcription returned to baseline levels in mice which survived the infection
(Fig. 5.1).
5.5.3 ApoD induction correlates with virus load and astrocytic and microglial
activation
ApoD protein levels were closely consistent with mRNA levels and were
highest in cortex and hippocampus. Maximal protein levels were also observed at 12
DPI in ail CNS tissues (Fig. 5.2), which corresponded to the time of acute phase of
the encephalitis. Increased apoD levels were also consistent with the presence of
HCoV-OC43. Actively replicating HCoV-OC43 could be detected at 7 DPI as weil,
as seen by the additional band above the OC43 (N) band, as previously described
(Jacomy and Talbot 2003). Delayed expression of apoD protein in the cerebellum and
spinal cord was also correlated with delayed HCoV-OC43 replication, in accordance
to virus spread and invasion of the remote areas, located far from the initial
inoculation site (Fig. 5.2). HCoV-OC43 and apoD increases were also concomitant
with astrocyte and microglia activation as detected with antibodies against the
astrocyte-speciftc marker glial fibrillary acidic protein (GFAP) and the microglia
activation marker Mac-2, respectively. Indeed, ApoD, GFAP, Mac-2 and virus levels
were c10sely regulated in ail analyzed CNS regions. At 20 DPI, in those mice that
survived the infection, HCoV-OC43 proteins disappeared totally and apoD, GFAP
and Mac-2 returned to baseline levels, confirming that mice had recovered from the
acute infection.
5.5.4 Transgenic mice expressing H-apoD are more resistant to acute
encephalitis
To investigate the role of apoD during viral encephalitis, three different
transgenic mice over-expressing H-apoD in neurons and WT littermates were
162
infected by HCoV-OC43. Survival curves were established for each transgenic mouse
group and compared to corresponding WT littennates (Fig. S.3). Survival rates were
almost three times higher in transgenic mice. Nineteen percent of the Thy-l/ApoD
mice (9 mice on 48) survived following infection while only 7% (p = 0.0112) of WT
littennates (3 mice on 4S) survived the infection (Fig. S.3A). Moreover, males were
significantly better protected by apoD overexpression even though these are more
sensitive to infection. Indeed, male Thy-l/ApoD mice had a survival rate of 21 %
compared to 7% for WT (p = 0.0041) (Fig. S.3B). Still, female Thy-I/ApoD mice
were also less susceptible than female WT mice (Thy-l/ApoD, 16%; WT, 7%; P =
0.04S8) (Fig. S.3C). However, survival rates were similar for NSE/ApoD and
NFL/ApoD as compared to WT littermates, with 84% deaths for NSE/ApoD (Fig.
S.3D) and 79% deaths for NFLIApoD (Fig. S.3E), with no apparent difference
between females and males. It is noteworthy that NSEIApoD and NFL/ApoD mice
produce respectively moderate and low levels of H-apoD in their CNS when
compared to Thy-llApoD mice, in accordance with the relative strength and
expression pattern of each promoter in neuronal ce Ils (Fig. S.3F). Interestingly, the
NSE/apoD transgenic mice presented a survival curve that was slightly shifted in
relation to time suggesting that these mice died less rapidly from infection (Fig.
S.3D).
5.5.5 H-apoD increases infection-induced CNS glial activation
Since only Thy-liApoD expression seemed to confer protection against acute
viral encephalitis, further experiments were carried out with these mice only.
Presence of the H-apoD transgene did neither affect endogenous mouse apoD mRNA
expression in response to HCoV-OC43 infection (Fig. 5AA) nor its protein levels
(Fig. SAB). Brain infectious virus titers showed no statistical difference between
Thy-l/ApoD mice and its littermates as measured at Il DPI (Fig. SAC). Accordingly,
viral nucleocapsid protein levels, in the brain and spinal cord (Fig. SAB) were also
163
similar in Thy-l/ApoD and in WT m\ce. However, astrogliosis (increased GFAP
staining) and microgliosis (increased Mac-2 staining), signs of an inflammatory
reaction, were observed following infection and were more evident in the CNS of
Thy-l/ApoD than in WT littermates. In contrast, a decreased CD4 infiltration was
evident in H-apoD over-expressing (Thy-l/ApoD) mice as compared to WT (Fig.
5.4B). Of note, in non-infected tissues, GFAP, Mac-2 and CD4 levels remained
similar in WT and Thy-l/apoD mice (data not shown). Immunohistochemistry on
brain slices revealed a quite similar increase of activated microglial cells and
astrocytes for ail genotypes. Astrogliosis and microgliosis were diffused in CNS
regions and found mainly in infected regions, as illustrated for hippocampus in figure
5.40. Mac-2 and GFAP staining were dependant upon the region observed, the
presence ofvirus in the region and the intensity of the disease, mild versus severe, in
WT and H-apoD mice.
5.5.6 Phospholipase A2 activity during infection
Total levels of PLA2 activity were measured in the brains of non-infected
m\ce (controls) to determine baseline levels in ail groups of studied mice.
Quantification revealed that baseline levels were similar in WT versus transgenic
mice (Fig. 5.5). However, following HCoV-OC43 infection, there was a 100% (2
fold) increase of PLA2 activity in WT mice. In comparison, PLA2 activity 10
infected-Thy-l/ApaD mice was also up-regulated but significantly less than 10
infected WT mice (40%; Fig. 5.5). Interestingly, NSE/ApoD and NFL/ApoD mice,
which displayed the same survival curve than WT mice after infection, have levels of
PLA2 activity comparable to WT mice. In addition, PLA2 activity levels were higher
in NFL/ApoD than in Thy-l/ApoD mice. However, PLA2 levels in NSE/ApoD were
not statistically different from those in Thy-l/ApoD mice.
164
5.5.7 H-apoD reduces T-cell infiltration into the CNS
Immunoblots already showed that CD4 was downregulated in Thy-llApoD
compared to WT mice after HCoV-OC43 infection (Fig. 5.4B). To further examine
T-cell infiltration, FACS analyses were conducted on total brain extracts from mice
dissected at 4, 6, 8 and II DPI (Table 5.1 and supplemental Fig. 5.1). In infected WT
mice, both CD4- and CD8- expressing cells entered the CNS and increased
significantly with time. At II DPI, there was a clear split between animais that will
probably have survived the infection (showing mild signs of encephalitis; II DPI
mild) and those that will most likely have died (showing severe signs of encephalitis;
II DPI-severe). T-cell infiltration correlated with the outcome of the infection, as T
cell infiltration was more prominent in II-DPI-severe than in II DPI-mi Id animais.
Accordingly, a similar modulation ofT-cell infiltration was observed in Thy-lIApoD
mice. Moreover, H-apoD (Thy-llApoD) expression in neurons significantly lowered
the T-cell infiltration after infection in mice with mild as well as severe encephalitis
as compared to WT mice (Table 5.1 and supplemental Fig. 5.1).
5.5.8 H-apoD reduces infIammatory cytokine and chemokine production
Activated microglial and astroglial cells, as well as leukocytes infiltrating the
CNS can secrete cytokines and chemokines. Therefore, we measured CNS levels of
several of these pro teins during the acute phase of viral encephalitis. At 8 and II DPI,
most of inflammatory cytokines couId be detected in infected brains, such as IL-I/3,
IL-2, IL-6, TNF-a, INF-y or GMCSF. Although IL-l/3 and TNF-a protein levels were
similar in WT and Thy-l/ApoD mice at 8 DPI, an upregulation of IL-l/3 and TNF-a
was maintained in WT as compared to Thy-l/ApoD at Il DPI. (Fig. 5.6A and B). By
contrast, IL-6 levels were downregulated in WT versus Thy-l/ApoD mice.
Interleukin-6 (IL-6) acts as both a pro-inflammatory and anti-inflammatory cytokine
165
(Stoll et al. 2000). The role of IL-6 as an anti-inflammatory cytokine role is mediated
through its inhibitory effects on IL-I and this could explain the reduction of ILl-f3 in
Thy-liApoD brain. As the matrix metalloproteinase (MMP) family members are
involved in the breakdown of extra-cellular matrix in normal physiological processes,
as weil as in disease processes, we investigated the levels of MMP. Although levels
of MMP-9 and MMP-3 were high in infected brains, no differences were seen
between genotypes (Fig. S.6C). The high levels of MMP-9 and MMP-3 could favor
the trafficking of leukocytes into infected brains. We then investigated inflammatory
chemokines that can modulate the recruitment of leukocytes into infected tissues. At
8 DPI, the monocyte chemoattractant prote in- I (MCP-l or CCL2) was detected at
similar levels in WT and Thy-liApoD mice. MCP-I stimulates monocytes to leave
the bloodstream, enter the surrounding tissue and become tissue macrophages (Calvo
et al. 1996). MCP-l facilitates the migration of T cells towards the CNS, as weil
(Biernacki et al. 2004). At Il DPI, MCP-l levels were down-regulated in Thy
lIApoD mice but remained unchanged in WT mice. At 8 DPI, T cell-attracting
((RANTES (CCL-S) and IP-IO (CXCL-I 0)) chemokine levels were quite similar for
both mouse genotypes (Fig. 5.60). At II DPI, similarly to MCP-l, levels of
RANTES showed a decrease in Thy-l/ApoD mice, probably resulting from a
reduction of T cell and macrophage infiltration, whereas high levels remained in WT
littermates. These data are consistent with the higher T-cell infiltration observed in
WT at Il DPI (Table 5.1).
166
5.6 Discussion
Host survival to viral infections mainly depends on the ability to trigger and
regulate innate and adaptive inflammatory responses, which promote clearance of
virus and cell debris, as weil as on its capacity to repair and/or replace damaged ceUs.
An up-regulation of apoD gene expression was already reported in humans with
meningoencephalitis (Terrisse et al. 1998) and in the CNS of mice infected by
encephalitis-associated viruses such as herpes simplex type-l virus (HSV-1) (Kang et
al. 2003), Sindbis virus (lohnston et al. 2001), Japanese encephalitis virus (lEV)
(Saha and Rangarajan 2003) or rabies virus (Prosniak et al. 2001). These observations
support the hypothesis that common host cell pathways are activated in the CNS by
different neurotropic and neuroinvasive viruses. Here, we report for the first time, that
apoD mRNA and protein are up-regulated after acute viral encephalitis caused by
HCoV-OC43 infection. Until now, functional up-regulation of apoD during infection
has remained unclear. We demonstrate that up-regulation of apoD in CNS seems to
confer a neuroprotective effect. Indeed, neuronal overexpression of apoD in H-apoO
transgenic mice resulted in a statistically significant 3-fold increase in the number of
mice surviving to HCoV-OC43 infection.
Neuroinflammation was already reported after infection with HCoV-OC43
(Butler et al. 2006, Jacomy and Talbot 2003, Jacomy et al. 2006). A key component
of neuroinflammation is the activation of astrocytes and microglia. Upon activation,
these cells proliferate, increase in size, change morphology and produce cytokines.
Activated microglia can also migrate to the injury site and phagocyte dead ceUs and
cellular debris (Farooqui et al. 2007). Here, we demonstrate that during acute
encephalitis, the up-regulation of endogenous apoD coincides perfectly with glial
activation and that its expression returned to normallevels after clearance of the acute
viral infection, concomitantly to a resolved glial reactivity.
167
The expression of H-apoD in neurons of Thy-llApoD mice, which we showed
to result in an increased survival rate following acute encephalitis, was associated
with an increased activation of glial cells during the acute phase of the infection. The
function of activated glia in neurological disorders is a highly controversial subject.
Chronic activation of glia is deleterious, in contrast to limited acute activation of glia,
which is generally accepted as a beneficial response favoring organism repair. Indeed,
controlled microgliosis restricts brain damage following acute brain injury probably
by removing cellular debris, neurotoxic molecules, and hence providing an
environment that promotes repair, neuron regeneration, and associated neuritic
outgrowth (Simard and Rivest 2007). Activated microglia can also serve as a source
of trophic and growth factors (Elkabes et al. 1996). Several studies also demonstrated
that astrocyte activation protects neurons by circumscribing the damaged area by the
formation of a scar, by limiting leukocyte infiltration, by promoting blood-brain
barrier (BBB) repair and by sustaining neuronal survival through nutrient
contribution and regulation of cell-to-cell communication (Bush et al. 1999, Faulkner
et al. 2004). In other respects, it was previously reported that, following HCoV-OC43
infection, non-infected cells in close proximity to infected ones exhibited signs of
apoptosis, suggesting that sorne inflammatory molecules, released by activated glial
ceUs adjacent to infected neurons are deleterious to neurons (Jacomy et al. 2006). The
fact that neuronal H-apoD expression promotes both glial activation and limited
leukocyte infiltration into CNS, as weil as increased mouse survival to infection
suggests that apoD-induced glial activation was neuroprotective against viral damage.
It has already been demonstrated that endogenous apoD expression was increased in
activated microglia cells (Gebicke-Haerter 2005) and also during inflammatory brain
disorders (Franz et al. 1999, Reindl et al. 2001, Rickhag et al. 2006).
During reactive gliosis, PLA2, an important enzyme for the production of AA
is up-regulated (Sandhya et al. 1998, Stephenson et al. 1996, Walton et al. 1997). The
ability of specifie PLA2 inhibitors to reduce neuronal damage supports an important
168
role for AA in neurodegeneration (Farooqui et al. 2004). It was already suggested that
apoD plays an important role in the regulation of AA signaling and metabolism.
ApoD could influence the availability of free AA in the ceIl , first by stabilizing it in
cell membrane, thus preventing its liberation by PLA2; or second by
binding/chelating free AA in the cytosol, thus making it unavailable for further use in
enzymatic pathways (Thomas et al. 2003d). The present study suggests another way
for apoD to control free AA concentration in cel!: by modulating PLA2 activity.
Indeed, H-apoD in Thy-l/ApoD mice prevented in part the increase of PLA2 activity
following HCoV-OC43 infection. The effect on PLA2 activity is dependent on the
levels of H-apoD expression. Indeed, NSE/ApoD and NFL/ApoD mice, which
express lower levels of H-apoD, displayed similar levels of PLA2 activity and
survival rate than WT mice following infection. The decreased PLA2 activity in Thy
I/ApoD mice is most probably related to the decreased cytokine production in these
mice, as IL-l ex, IL-l ~ and TNFex stimulate PLA2 activity (Adibhatla and Hatcher
2007).
It has already been demonstrated that, following HCoV-OC43 infection, a
large fraction of cel1s infiltrating into the CNS of the animaIs consists of CD4 and
CD8 T-cells (Butler et al. 2006). The role played by the infiltration of inflammatory
cells in HCoV-OC43 encephalitis is not weIl defined. Immunosuppression by
cyclosporin A resulted in the acceleration of the pathology onset and increased the
percentage of acute animal deaths (Jacomy and Talbot 2003). On the other hand,
HCoV-OC43 induced death is delayed in mice lacking normal Band T cell responses
(Rag -/-), even if, at the time of death, these mice had higher virus loads (Butler et al.
2006). This data illustrate the precarious balance between immune mediated viral
clearance and immunopathogenesis. Sorne chemokines are considered pro
inflammatory and can be induced during an immune response to recruit cells of the
immune system to the site of infection. Interleukin-l (IL-l) produced by
169
macrophages forms an important part of the inflammatory response of the body
against infection (O'Neill 2000). We demonstrated a maintained up-regulation of IL
I~, particularly in WT mice at II DPI. This cytokine increases the expression of
adhesion factors on endothelial cells to enable transmigration of leukocytes to sites of
infection. Peripheral lymphocyte infiltration into the CNS was previously reported ta
either protect against or exacerbate encephalitic disease in CNS infection models
(Irani and Griffin 1996, Stohlman et al. 1995). We propose that an uncontrolled
immune response may contribute to neuropathology, as seen in WT mice following
viral encephalitis. In the same way, an increased MCP-l was reported to contribute ta
virus-induced neuropatbogenesis (Nakajima et al. 200 l, Peterson et al. 1997).
RANTES, IP-IO and MCP-l have been previously characterized for their role in the
recruitment of activated T cells ta the site of infection (Babcock et al. 2003, Klein
2004, Weiss et al. 1998). These pro-inflammatory chemokines act in the development
of inflammatory response and may also induce neurological damages if their
synthesis is maintained. Indeed, IP-IO or MCP-l neutralizing antibodies were shown
to reduce pathology but not viral titers (Carr et al. 2003, Marques et al. 2006,
Nakajima et al. 2001).
In the present study, the increased survival of Thy-l/ApoD mice correlates
with a decreased number of infiltrating T-cells, associated with decreased T-cell
attracting chemokine levels (MCP-l). T-cell infiltration into CNS indicates a
compromised BBB (Streit et al. 2004) and the decreased infiltration observed in
transgenic mice suggests a role for apoD in BBB integrity. In support of this, apoD is
expressed in pericytes and perivascular cells in the brain (Hu et al. 2001) and it
contrais proliferation and migration of vascular smooth muscle cells (Leung et al.
2004, Sargeant et al. 2003,). Furthermore, another lipocalin, the neutrophil
gelatinase-associated lipocalin is produced by the choroid plexus as a component of
170
the innate immune response that protects the central nervous system from infection
(Marques et al. 2008).
On top of its influence on inflammatory reactions, apoD could also positively
affect the host survival by promoting CNS repair either by supporting myelination
(Boyles et al. 1990a, Ong et al. 1999, Terrisse et al. 1999), or by evacuating toxie
metabolites such as peroxidated lipids (Ganfomina et al. 2008) or by supplying
nutrients and neuropratective factors such as estrogens and progesterone (Ghoumari
et al. 2003, Suzuki et al. 2007).
A beneficial raie of apoD up-regulation in nervous system pathology and/or
injury has often been suggested. However, although it is indeed increased in several
neuropathologies, the link between apoD expression and neuronal processes remains
obscure. In the present study, we demonstrate for the first time that apoD does protect
from the damaging consequences of viral encephalitis, most likely by modulating
inflammatory reactions. Therefore, our results, in combination with our recent study
involving apoD in the defense mechanisms against oxidative stress (Ganfornina et al.
2008), suggests that apoD, as an acute phase protein, could restore the homeostatie
balance following injury.
171
5.7 Acknowledgments
We are thankful to Diego Sanchez and Maria D. Ganfornina for helpful
discussions. We gratefully acknowledge support from the Canadian Institutes for
Health Research (Grants MT-n03 to PJT and MOP-15677 to ER). SDC was
supported by FRSQ, NSERC and UQAM studentships.
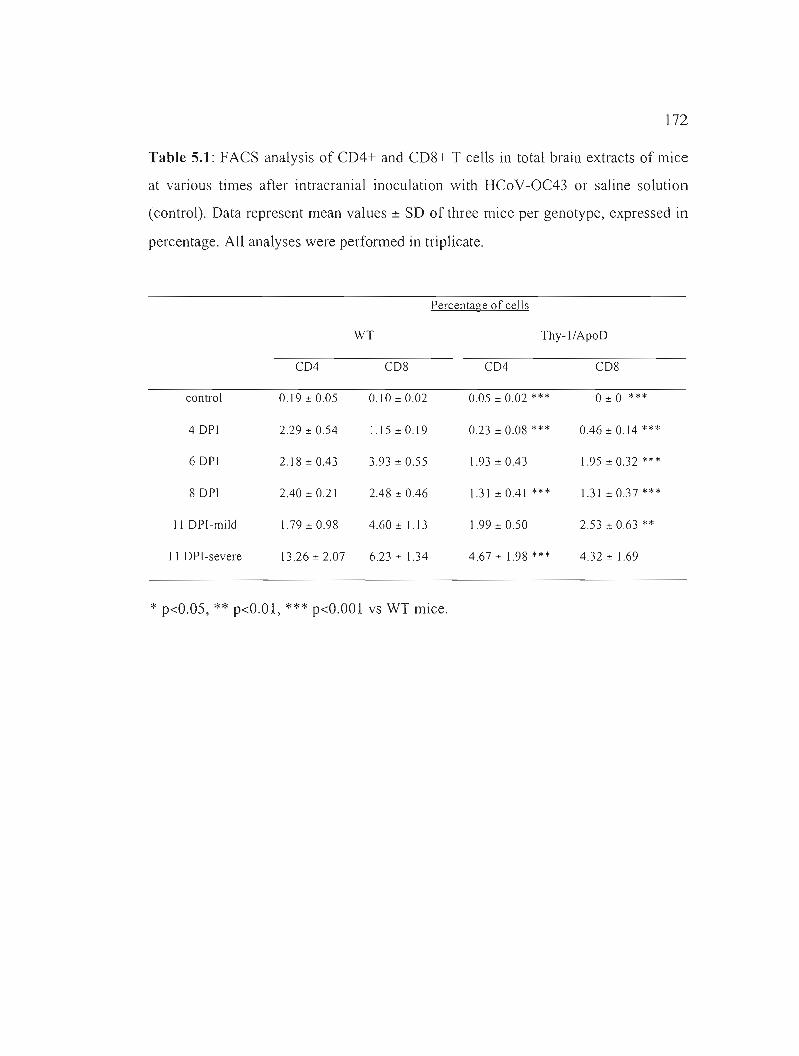
172
Table 5.1: FACS analysis of CD4+ and CD8+ T ceHs in total brain extracts of mice
at various times after intracranial inoculation with HCoV-OC43 or saline solution
(control). Data represent mean values ± SD of three mice per genotype, expressed in
percentage. AH analyses were perfonned in triplicate.
Percentage of cells
WT Thy-I/ApoD
CD4 CD8 CD4 CD8
control 0.19 :!: 0.05 0.10:!:0.02 0.05:!: 0.02 *** O:!: 0 ***
4 DPI 2.29 :!: 0.54 1.15:!: 0.19 0.23 :!: 0.08 *** 0.46 :!: 0.14 ***
6 DPI 2.18 :!: 0.43 3.93 :!: 0.55 1.93 :!: 0.43 1.95 :!: 0.32 ***
8 DPI 2.40 :!: 0.21 2.48 :!: 0.46 L31 :!:0.41 *** 1.31:!:0.37***
II DPI-mild 1.79 :!: 0.98 4.60:!: LI3 1.99 :!: 0.50 2.53 :!: 0.63 **
II DPI-severe J3.26 :!: 2.07 6.23:!: J.34 4.67:!: 1.98 *** 4.32:!: 1.69
* p<O.OS, ** p<O.Ol, *** p<O.OOl vs WT mice.
173
5.8 Figure legends
Figure 5.1: Effect of HCoV-OC43 infection on CNS apoD mRNA expression.
Endogenous apoD expression (M-apoD) was examined by Northern blot analysis in
several CNS regions of non-infected WT mice (c) and in HCoV-OC43 infected WT
mice 7, 12 and 20 days post-infection. GAPDH expression was included as an
internai control. Top: Representative autoradiograms. Bottom: Quantification of
mRNA expression by densitometry. Values were normalized by the GAPDH
expression and by the respective non-infected control which was given an arbitrary
value of 1. Values represent means ± SD (n=3, performed in triplicate). * p < 0.05, ** P < 0.0 l, *** P < 0.001 compared to the respective non-infected control. Hippoc:
hippocampus, olfac. bulb: olfactory bulb.
Figure 5.2: Western immunoblot analysis of HCoV-OC43 infected WT mice.
Endogenous apoD expression (M-apoD) was examined by immunoblot in several
CNS regions ofnon-infected control mice (c) and in HCoV-OC43 infected mice 7,12
and 20 days post-infection. HCoV-OC43 nucleocapsid N protein (OC43 (N)), GFAP,
and Mac-2 were also tested. GAPDH expression was included as an internai control.
Experiments were performed in triplicate (n=3). Hippoc: hippocampus, olfac. bulb:
olfactive bulb.
Figure 5.3: Survival curves of H-apoD Tg mice after HCoV-OC43 infection. Thy
l!ApoD mice present an increased survival as compared to WT mice. This effect is
observed in curves containing mixed sexes (A) and also when males (B) are analyzed
separately from females (C). Survival curves of NSE/ApoD (D) or NFL/ApoD (E)
mice (mixed sexes curves are presented). * p < 0.05, ** P < 0.01 compared to
corresponding WT for surviva1 rate at 20 DPI.. F) Immunoblot showing H-apoD
protein expression in transgenic brains. GAPDH was used for normalization.
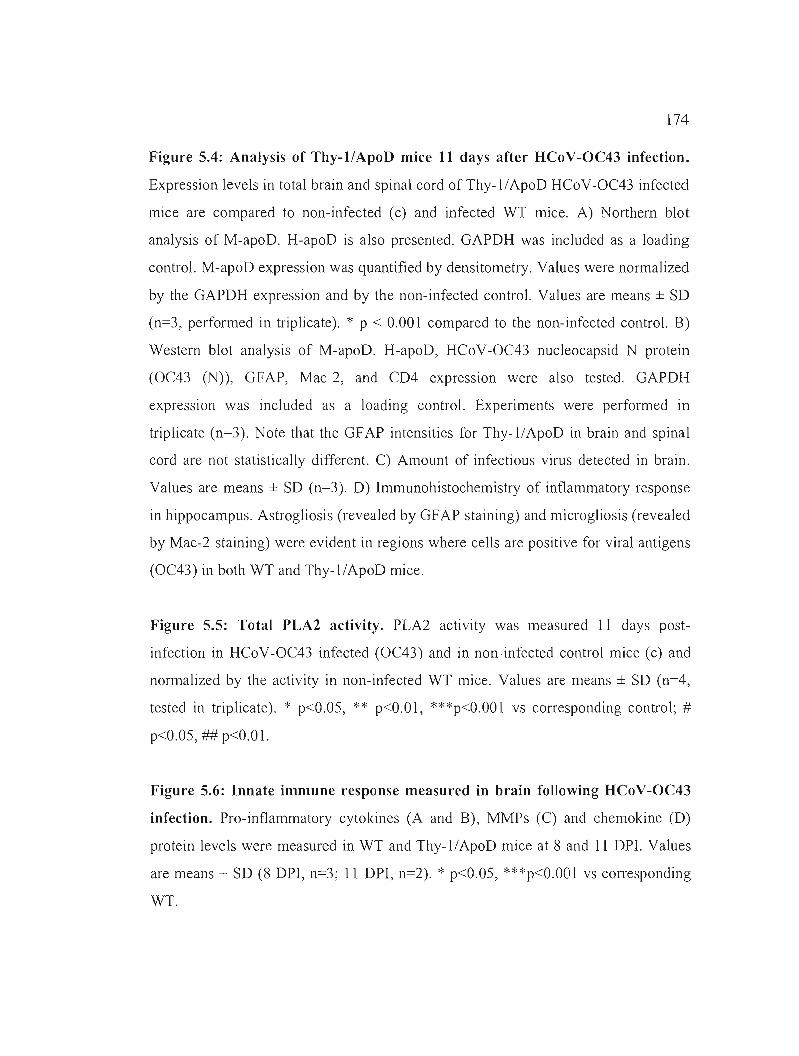
174
Figure 5.4: Analysis of Thy-l!ApoD mice 11 days aCter HCo V-OC43 infection.
Expression levels in total brain and spinal cord of Thy-l/ApoD HCoV-OC43 infected
mice are compared to non-infected (c) and infected WT mice. A) Northern blot
analysis of M-apoD. H-apoD is also presented. GAPDH was included as a loading
control. M-apoD expression was quantified by densitometry. Values were normalized
by the GAPDH expression and by the non-infected control. Values are means ± SD
(n=3, performed in triplicate). * p < 0.001 compared to the non-infected control. B)
Western blot analysis of M-apoD. H-apoD, HCoV-OC43 nucleocapsid N protein
(OC43 (N)), GFAP, Mac-2, and CD4 expression were also tested. GAPDH
expression was included as a loading control. Experiments were performed in
triplicate (n=3). Note that the GFAP intensities for Thy-l/ApoD in brain and spinal
cord are not statistically different. C) Amount of infectious virus detected in brain.
Values are means ± SD (n=3). 0) Immunohistochemistry of inflammatory response
in hippocampus. Astrogliosis (revealed by GFAP staining) and microgliosis (revealed
by Mac-2 staining) were evident in regions where cells are positive for viral antigens
(OC43) in both WT and Thy-l/ApoD mice.
Figure 5.5: Total PLA2 activity. PLA2 activity was measured 11 days post
infection in HCoV-OC43 infected (OC43) and in non-infected control mice (c) and
normalized by the activity in non-infected WT mice. Values are means ± SD (n=4,
tested in triplicate). * p<O.OS, ** p<O.OI, ***p<O.OOl vs corresponding control; #
p<O.OS, ## p<O.O 1.
Figure 5.6: Innate immune response measured in brain foUowing HCoV-OC43
infection. Pro-inflammatory cytokines (A and B), MMPs (C) and chemokine (0)
protein levels were measured in WT and Thy-l/ApoD mice at 8 and Il DPI. Values
are means ± SD (8 DPI, n=3; Il DPI, n=2). * p<O.OS, ***p<O.OO 1 vs corresponding
WT.
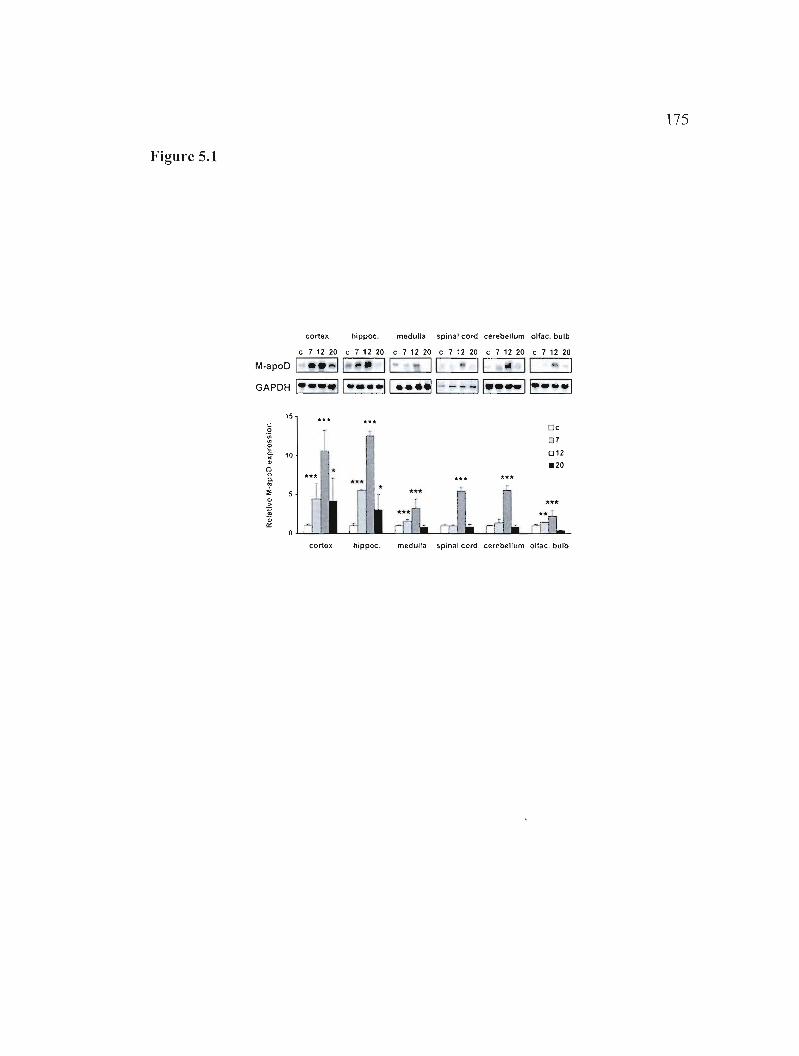
175
Figure 5.1
cortex hippoe, medulla spinal cord cere~l1um olfac. bulb
e 7 12 20 e 7 12 20 e 7 12 20 e 7 12 20 e 7 12 20 e 7 12 20
M·apoD •• -11 .... Il Il Il Il'--_-' - - -11··-IIëO···1
15
ne
D7
01210 .20
cortex hippoc. rnedulla spinal cord cerebellum olfac. bulb
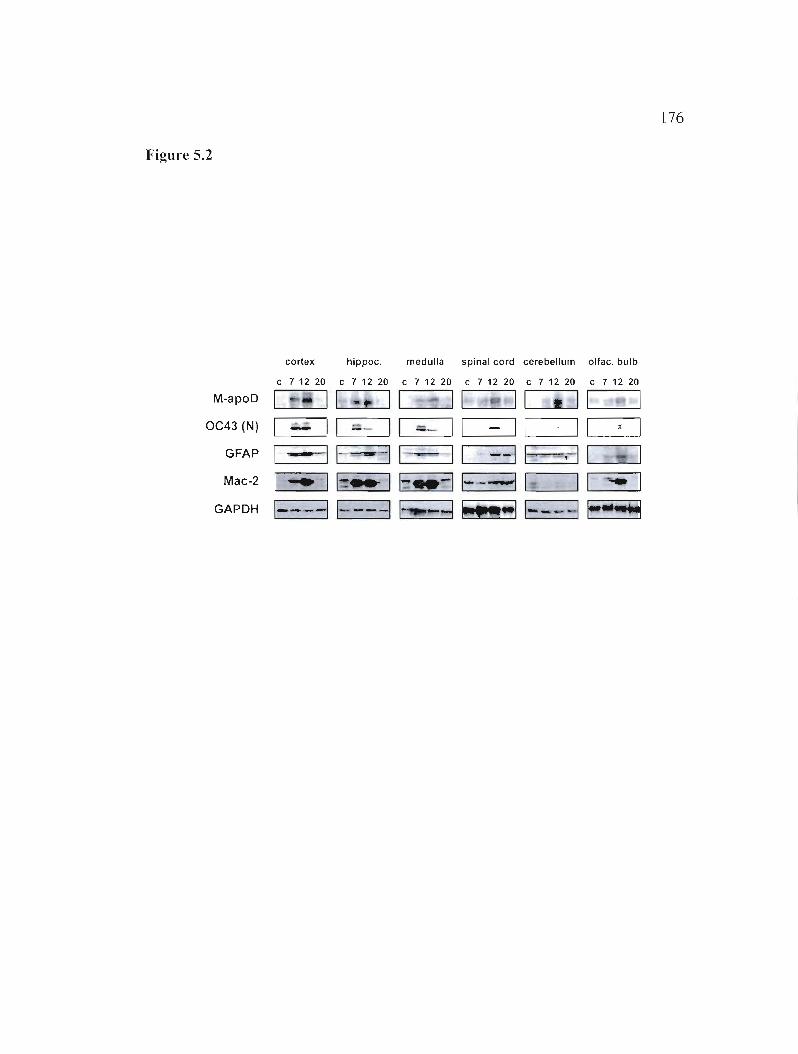
176
Figure 5.2
cortex hippoc. medulla spinal cord cerebellum ollac. bulb
c 7 12 20 c 7 12 20 c 7 12 20 c 7 12 20 c 7 12 20 c 7 12 20
M-apoD 1 Il .. ,. 11 Il 11 • Il 1 OC43 (N) 1 - Il -- 1 1 -- 1 1 - 1 1 ~ 1 1 ~ 1
GFAP 1-11-- 11 Il --II' . 11 1 Mac-2 1 .... 11-'" 11-:..-1 1- -.....-:j 1 11 .... 1
GAPDH 1----11----11 -d ~"II-- ·1 E--.J
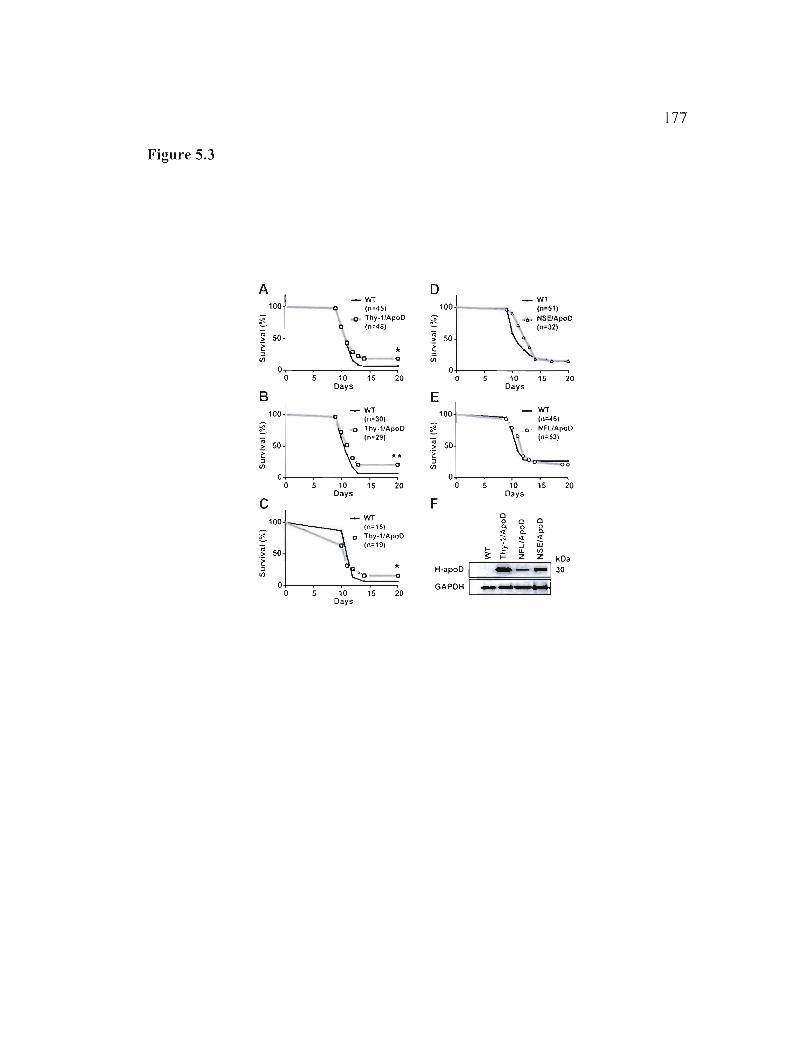
177
Figure 5.3
A -WT
100 0 (n=451
0 Thy·11ApoO ~ (n=481.. > 50 E ~ ~o-~
0 0 10 15 20
Days
B -WT100 0 (n=30)
Thy-lIApoO~ .. (n=29) > 50 ~ :J ** '0 -0(/)
0 0 10 15 20
Days
e 100J - WT
~ o. Thy·lIApoO~ '""" -;; (n=191 > 50
~ * en t::o Q
0 0 10 15 20
Days
D _WT
100 (n=51) ._ N5EJApoO
~ (n=32).. -E> 50
:J (/)
0 0 10 15 20
Days
E WT100 (n=461
~ \: NFUApoO o (n=53)
Ci > 50 ~ :J 0==00
kDa_-_1 30
(/)
0 0 5 10 15 20
Days
F Cl
.... ;::
0 a.
~ '" .<; ....
Cl 0 a. ~ ...J Il. Z
Cl 0 a. <l: W (/)
Z
H·apoD 1
GAPDH 1...-. ..1
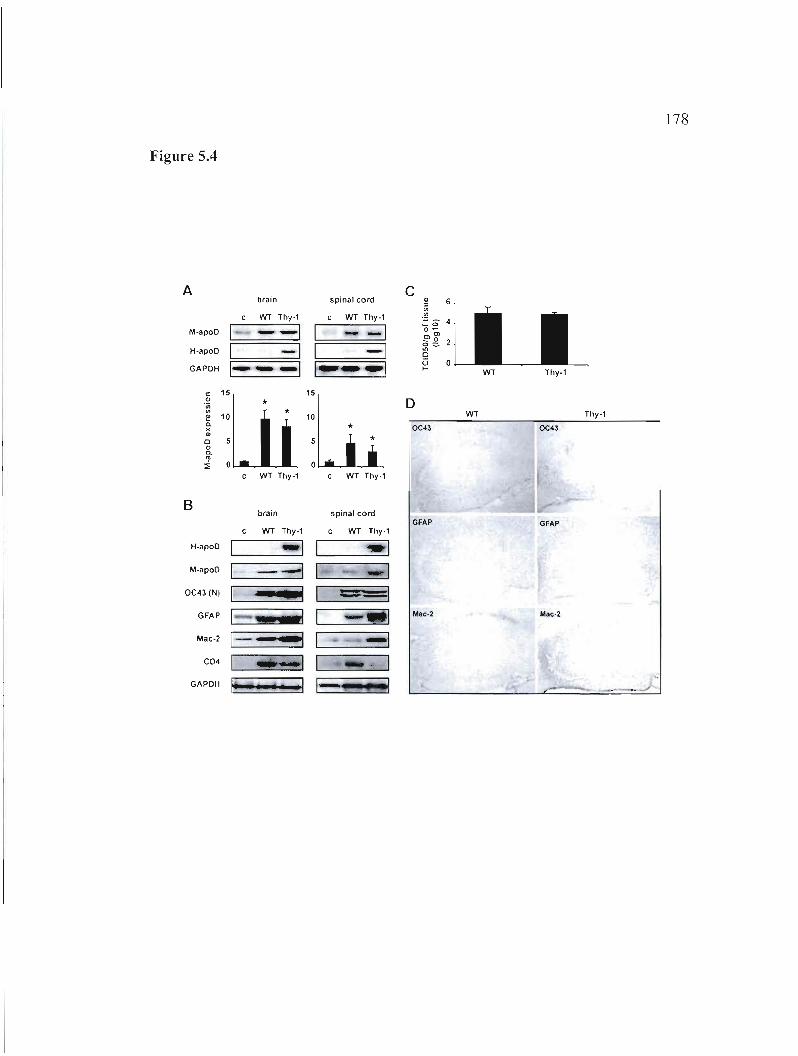
178
Figure 5.4
A braln spinal cord
C Gl
;;; 6
M-.poO 1
c WT Thy-1
--1 1
c WT Thy-1- -1 o!!! ':0 4 o~
",0>_ 0
H-.poO
GAPOH
1 -1 1 -1 1---1 I~-~I
0:::'
'" 0 ü .... 0
WT Thy-1
c: 0Ou; <Il
~ a. ><
'" 0 0 0. "w"Lu10 10
* 5 *5
D
OC43
WT
OC43
Thy-1
'1' ::;; 0 0
WT Thy-1 WT Thy-1
B brain spinal cord
GFAP GFAP c WT Thy-1 c WT Thy-1
H-apoO 1 --1 1 --1
M-.poO 1 --1 1 1
OC43 (NI 1 - S 1 1 ==_1
GFAP 1 .... 1 1 - 1
Mac~2 M"c-2
M.c-2 1 --1 1 -1
C04 1 .. •..·1 1 1
GAPOH 1· dl I-~r -1 ../
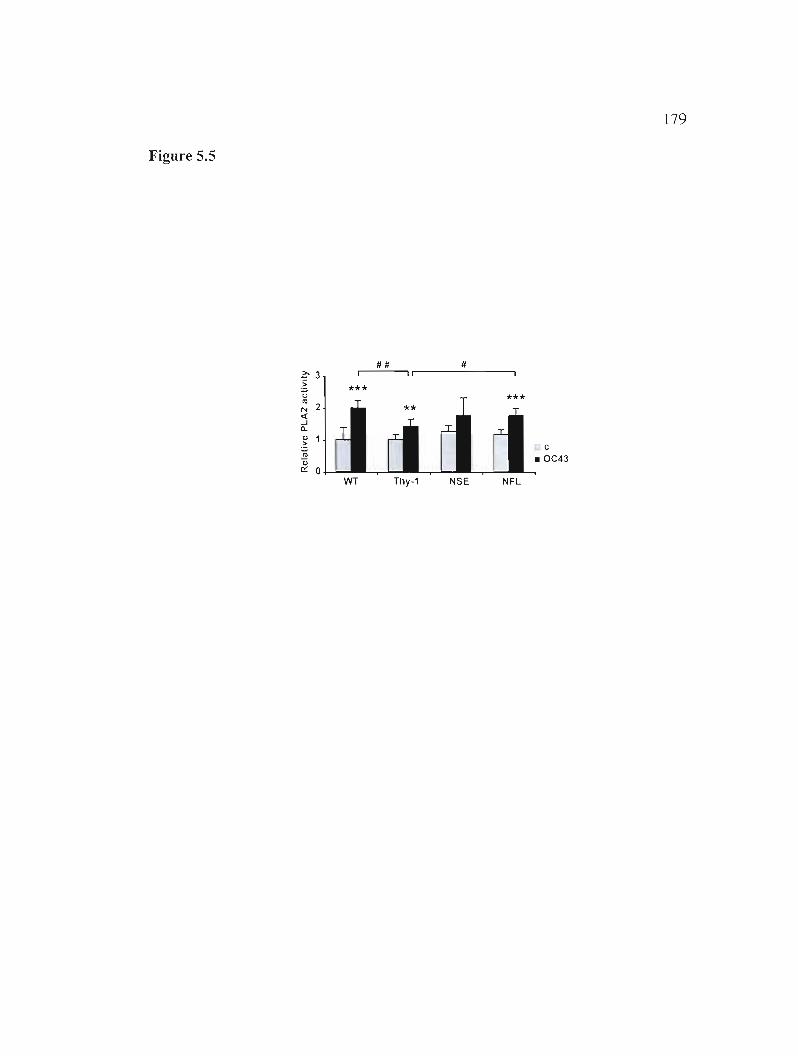
179
Figure 5.5
#11 Il ~ 3 li
:~ u *** <Il
'" 2 <t --l 0~
.~ <Il
Qi Cl: 0
WT Thy-1 NSE NFL
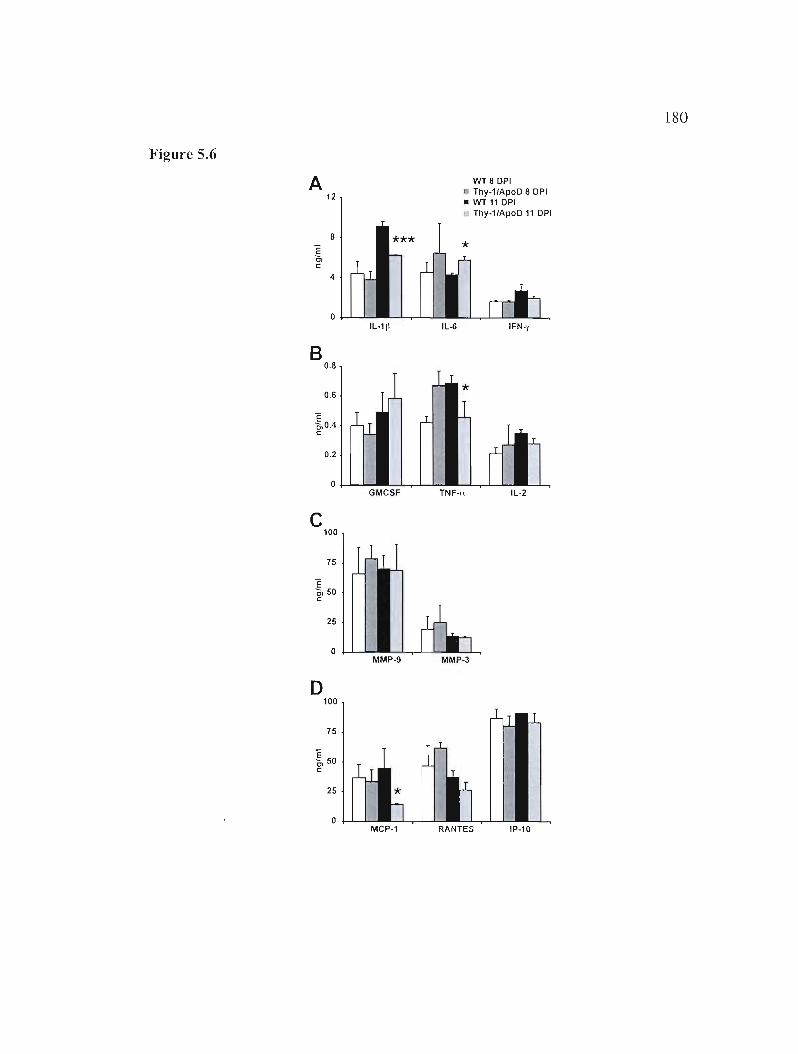
180
Figure 5.6
A 12
WT 8 DPI • Thy.1/ApoD 8 DPI • WT 11 DPI
Thy-1/ApoD 11 DPI
8 *** *
4
o IL-11\ IL-6 IFN •.,
B 0.8
0.6 * E 0,0.4 c
0.2
o GMCSF TNF-u
C 100
75
E 0, 50 c
25
o MMP-9 MMP-3
D 100
75
:ê 50Cl c
25
o RANTES Ip-10
181
S.9 Supplemental material
Figure S.IS: T cell infiltration into HCoV-OC43-infected brain. FACS analysis of
CD4+ and CD8+ T cells in total brain extracts of mice at various times after
intracranial inoculation with BCoV-OC43 or saline solution (control). Data from one
representative mouse per genotype and time-point are shown.
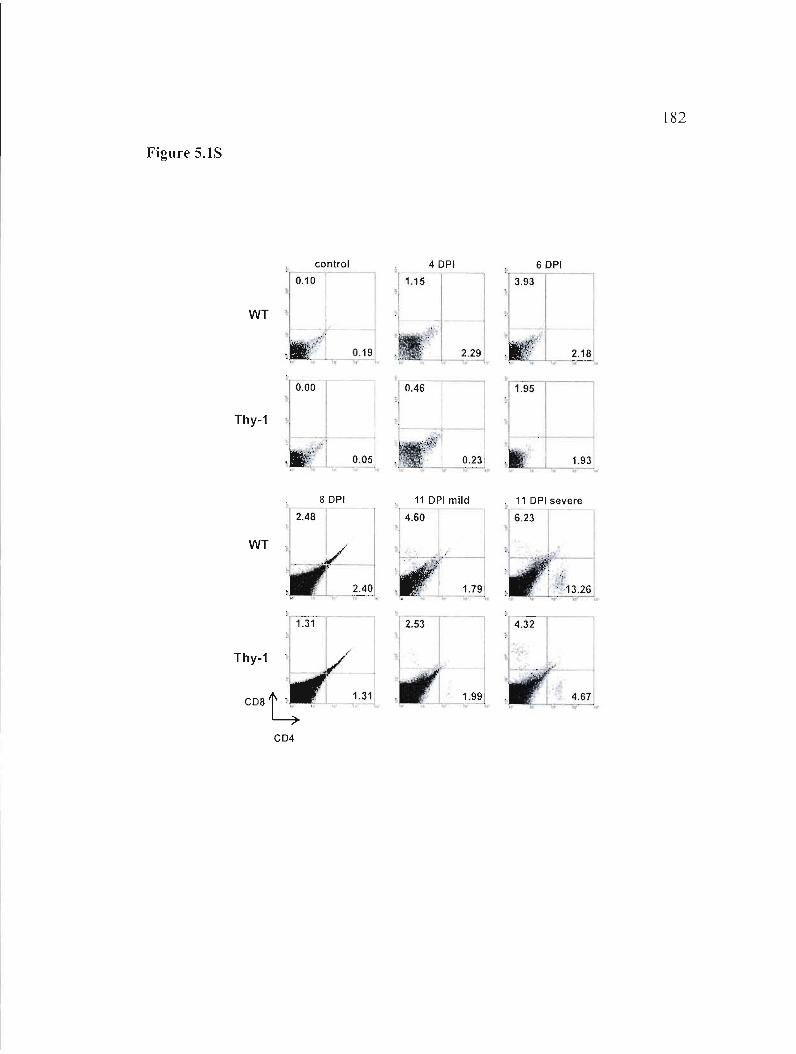
- -
l82
Figure S.IS
, control 4 DPI 6 DPI
10 3.93 ·• 1
, 1 1~l
WT ~ "rr.",..;;
.•" 0.19 < 2.29 , '1 '\.1"
0.00
-10.46 c.1 j ~1-'9+l Thy-1
1- -" ·.ed
~.2'~~ .~O~?~I .'. 1.93 --,.
8 DPI 11 DPI severe
2.48 6.23
WT ~,._
2.40,''-'-.,,-..
Thy-1
C08t!
C04
CHAPITRE VI
Conclusions et perspectives
6.1 Conclusions générales
Les travaux réalisés dans le cadre de ce projet ont permis d'établir que l'apoO
est induite en réponse à des stress cellulaires spécifiques, incluant le stress oxydatif et
l'inflammation. Ces travaux sont également les premiers à démontrer que cette
induction de l'apoO est bénéfique et favorise la survie en réponse à ces stress chez les
mammifères.
Nous avons d'abord déterminé in vitro que l'expression de l'apoO est
déclenchée par des signaux spécifiques ayant une composante oxydante (peroxyde
d'hydrogène et rayons UV) ou inflammatoire (LPS). Cependant, alors qu'en réponse
au stress oxydatif l'expression de l'apoO est corrélée avec un arrêt de croissance, en
réponse au LPS, elle est corrélée avec une stimulation de la prolifération et peut être
inhibée par un traitement anti-inflammatoire. L'activation de l'expression de l'apoO a
été associée à des éléments particuliers au niveau du promoteur. Les SRE avaient déjà
été identifiés comme responsables de la réponse à l'arrêt de croissance. Les éléments
NF-lill, AP-l et APRE-3 ont maintenant été impliqués dans la réponse au LPS.
Nous avons également déterminé que l' apoO, une protéine glycosylée et
sécrétée, est capable d'entrer dans la cellule à partir du milieu extracellulaire et
qu'elle change de localisation en réponse au stress. L'apoO est normalement visible
dans la cellule sous forme d'un alUleau périnucléaire cOITespondant à l'appareil de
Golgi. En réponse au stress, cependant, elle s'accumule dans le cytoplasme et dans le
noyau suggérant qu'elle joue un rôle dans ces compartiments cellulaires.
184
De la même façon, l'expression de ]'apoD est induite dans des modèles in vivo
de neurodégénérescence causée par le stress oxydati f (paraquat) ou l'inflammation
aiguë (HCoV-OC43). En utilisant des souris surexprimant l'apoD humaine dans leur
système nerveux ou déficientes en apoD, nous avons établi que l'apoD joue un rôle
protecteur dans ces situations et que sa surexpression améliore la survie. Les voies
par lesquelles l'apoD pourrait jouer son rôle protecteur sont schématisées dans la
figure 6.1. D'abord, l'apoD limite la peroxydation lipidique induite par les stress.
Ensuite, l'apoD inhibe l'activation de la PLA2 et l'infiltration de cellules T dans le
CNS directement ou via l'inhibition des cytokines et des chemokines. Finalement,
l'apoD induit l'activation de la glie et la prolifération. Nous avons suggéré que le rôle
protecteur de l'apoD est probablement lié à sa capacité à lier un ligand. L'apoD
pourrait stabiliser les lipides à la membrane, empêchant leur oxydation et/ou leur
conversion en AA. Elle pourrait aussi capturer le AA libre ou des lipides dans le
cytoplasme, empêchant leur utilisation dans des réactions enzymatiques ou autres
voies nuisibles pour la cellule. Elle pourrait également participer à l'élimination de
métabolites toxiques et à l'apport de nutriments ou de facteurs nécessaires à la
réparation. Finalement, elle pourrait moduler l'activité de gènes impliqués dans
l'activation gliale, la prolifération, la production de cytokines, la détoxification ou
ayant des propriétés anti-inflammatoires ou anti-oxydantes. Ces différents aspects
seront détai !lés dans la section 6.2.
Par ailleurs, l'apoD intervient également dans le métabolisme des lipides et du
glucose. En plus du système nerveux, les souris H-apoD-Tg expriment l'apoD
humaine dans d'autres tissus dont le foie. La surexpression d'apoD humaine dans le
foie induit une accumulation de lipides dans ce tissu. Ceci provoque la diminution de
la voie de signalisation de l'insuline, menant ainsi à la résistance à l'insuline chez les
souris âgées. Tel qu'illustré à la figure 6.2, nous avons déterminé que l'accumulation
de lipides induite par l'apoD est due à la stimulation de gènes impliqués dans la
185
lipogenèse de nova. L'apoD n'affecte pas ou très peu les autres voies pouvant causer
l'accumulation de lipides. Ainsi, l'apoD ne diminue pas l'oxydation des lipides ni la
production de VLDL. Donc, les souris H-apoD-Tg développent une stéatose
hépatique et une résistance à l'insuline avec l'âge et présentent d'autres phénotypes
entourant la résistance à l'insuline, comme l'augmentation des globules blancs et des
plaquettes. Cependant, ces souris ne sont pas obèses ni diabétiques et ne présentent
pas d'augmentation des marqueurs d'inflammation associés à la résistance à
l'insuline. Ceci rejoint les résultats obtenus dans les modèles neurodégénératifs in
vivo et nous mène à conclure que l'apoD joue un rôle protecteur dans l'organisme en
modulant des voies intimement liées au développement de pathologies soit le stress
oxydatif et l'inflammation.
L'ensemble des travaux présentés dans cette thèse de doctorat met en évidence
l'importance de l'apoD dans la réponse au stress cellulaire. Il propose ainsi l'apoD
comme cible thérapeutique de premier choix dans les pathologies à caractère oxydant
ou inflammatoire en général et dans les maladies neurodégénératives en particulier. 11
met également en valeur le rôle de l'apoD dans le métabolisme lipidique et suggère
l'importance d'un contrôle serré de ses niveaux.
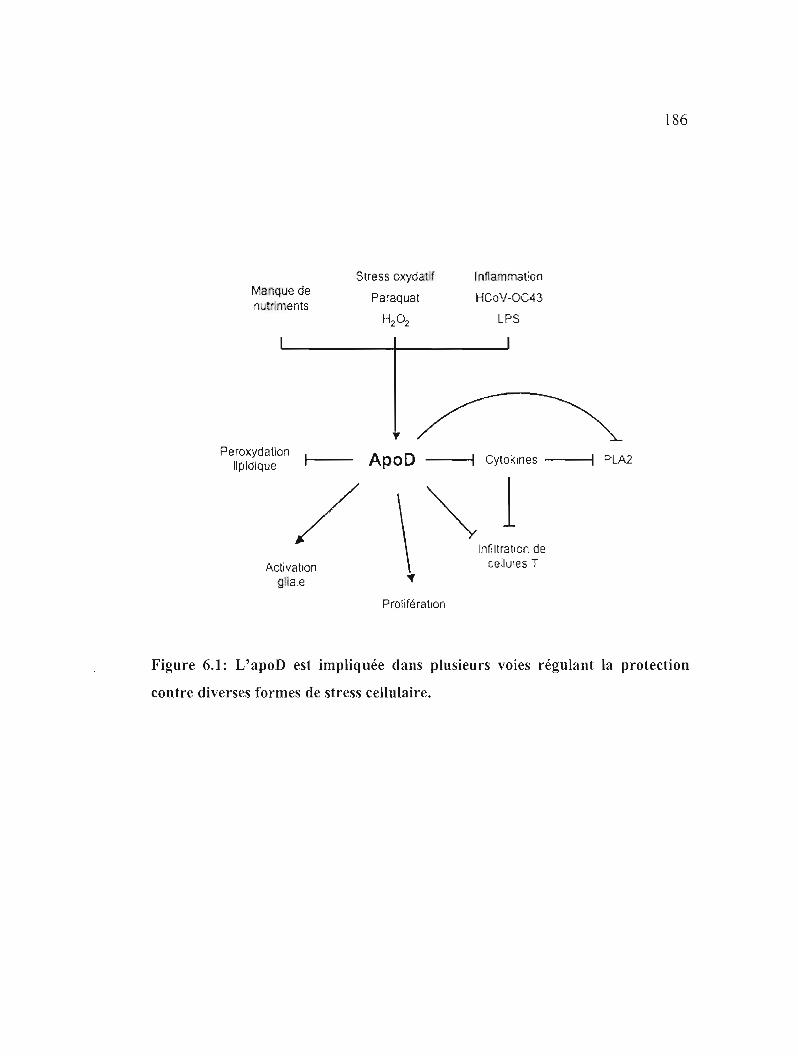
186
Stress oxydatif Infta maüon Ma Que de
Paraquat HCoV-OC43 n' 1 ments
H2 0 2 LPS
Peroxydallon 1 A D Cyto:<lnes ----II PLA2IIplOiQue po
/ \~ lInfiltration de
Activation ce:luies T
glia'e "
ProHfératlon
Figure 6.1: L'apoD est impliquée dans plusieurs voies régulant la protection
contre diverses formes de stress cellulaire.
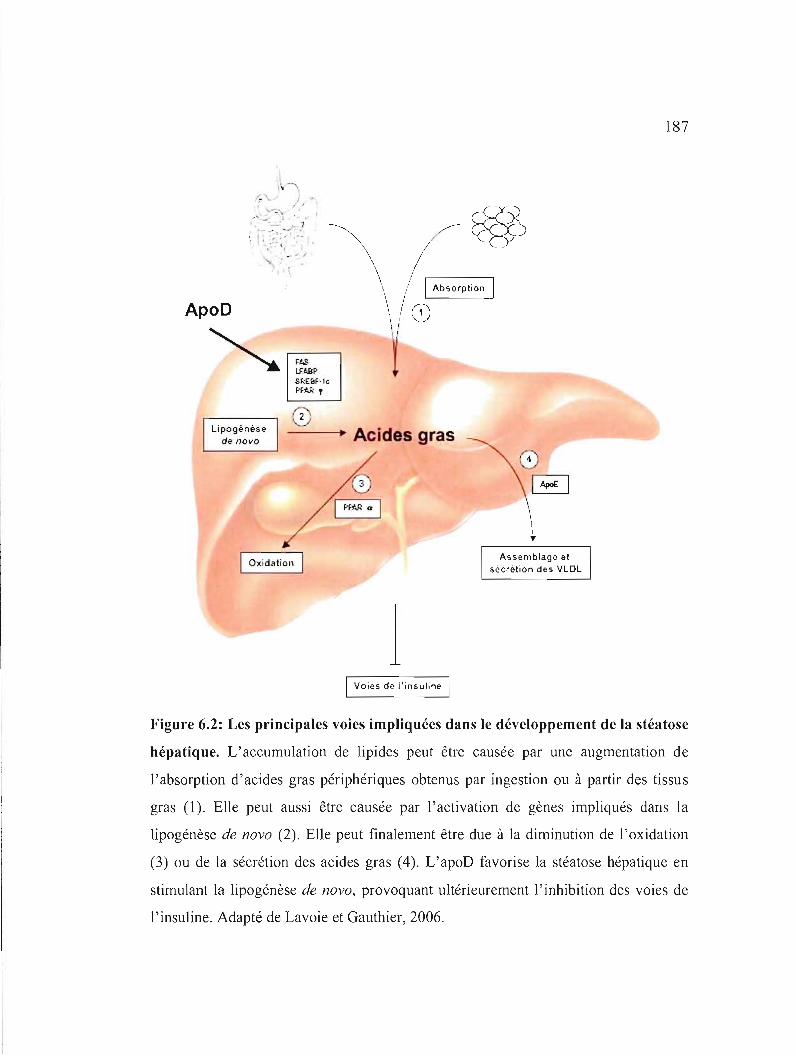
187
\l--\ ':- '~ / " . ......-:.
~'. -. ~i '1
L_ -;-0 ~.. •
" - -1)
ApoD
~ FAS ~ U'A9P SREfsp·l, PF:t.f< T
Lipogenese ---., Acides gras de novo
,,, 1
1 1
" Assemblago el
1 Oxidation 1 5CC'ètion des VLOL
1 Voies do i'insuli,.,e 1
Figure 6.2: Les principales voies impliquées dans le développement de la stéatose
hépatique. L'accumulation de lipides peut être causée par une augmentation de
l'absorption d'acides gras périphériques obtenus par ingestion ou à partir des tissus
gras (1). Elle peut aussi être causée par l'activation de gènes impliqués dans la
lipogénèse de nova (2). Elle peut finalement être due à la diminution de l'oxidation
(3) ou de la sécrétion des acides gras (4). L'apoD favorise la stéatose hépatique en
stimulant la lipogénèse de nova, provoquant ultérieurement l'inhibition des voies de
l'insuline. Adapté de Lavoie et Gauthier, 2006.
188
6.2 Perspectives
Les travaux présentés dans cette thèse représentent une belle avancée pour la
compréhension du rôle de l'apoD. Mais bien sûr, plusieurs questions demeurent. Les
expériences proposées comme perspectives visent, d'une part, à compléter les travaux
présentés et, d'autre part, à comprendre les mécanismes sous-jacents aux résultats
obtenus.
6.2.1 Implication dans les processus cellulaires
6.2.1.1 L'apoD comme modulateur cellulaire
L'examen des gènes modulés en aval de l' apoD peut nous informer quant aux
processus dans lesquels l'apoD est impliquée. L'utilisation des micropuces d'ADN
(DNA microarrays) est tout à fait indiquée pour ce type de question biologique. Les
micropuces sont en fait de petits supports sur lesquels sont distribués des fragments
d'ADN correspondant à des milliers de gènes ou à des portions du génome (sondes).
Les micropuces sont hybridées de façon stringente avec l' ADNc que l'on désire
tester. L'hybridation entre l'ADNc et les sondes est détectée et quantifiée par la
flurorescence émise par le fluorophore couplé à l'ADNc. La fluorescence calculée
permet de déterminer l'abondance relative des gènes dans l'ADNc. Il s'agirait donc
de comparer des souris H-apoD Tg avec des souris WT et des souris ApoD-KG en
situations normales et en conditions de stress. Le cerveau est le tissu idéal pour ce
genre d'étude puisqu'il est le site majeur d'expression de l'apoD chez la souris et que
l'apoD humaine est surexprimée dans ce tissu chez les souris H-apoD Tg. Cependant,
étant donné l'implication de l'apoD dans l'accumulation de lipides au niveau du foie,
l'utilisation de micro-puces avec de l'ARN extrait à partir du foie pourrait aussi être
intéressante. La confirmation des résultats obtenus se fait ensuite au niveau de l'ARN
par PCR en temps réel (qRT-PCR) et au niveau des protéines par immunobuvardage
189
et immunohistochimie. Selon les résultats, d'autres stratégies seront employées. Par
exemple, dans le cas où les microarrays indiquent l'implication de l'apoD dans les
voies spécifiques du métabolisme lipidique ou du glucose, celles-ci seront explorées
plus en profondeur.
6.2.1.2 Identification de son récepteur et de ses interacteurs protéiques
Il est démontré en chapitre II que l' apoD est capable d'entrer dans les cellules
puis de s'accumuler dans le cytoplasme et le noyau en situations de stress. Cependant,
nous ne savons pas comment l'apoD est transportée. Nous ne pouvons pas éliminer la
possibilité que l'entrée de l'apoD dans la cellule se fasse de façon passive. L'apoD
profiterait ainsi de ses propriétés lipophiliques pour se glisser à travers la membrane.
Cependant, il semble improbable que l'entrée dans le noyau se fasse de façon passive.
D'abord l'apoD n'a pas de signal de localisation nucléaire (NLS). Ensuite, l'apoD
GFP utilisée dans l'étude est trop grande pour permettre la diffusion à travers la
membrane nucléaire. Ainsi, il est plus probable que l' apoD entre dans la cellule et
dans le noyau via l'interaction avec d'autres protéines. Il peut s'agir d'une interaction
directe avec un récepteur ou de l'interaction avec une autre protéine possédant un
récepteur. L'identification du récepteur de l'apoD et de ses partenaires d'interaction
devient donc essentielle. Plusieurs méthodes permettent d 'y arriver. On peut postuler
dans un premier temps que l'apoD se lie directement à un récepteur membranaire. La
visualisation d'un récepteur membranaire peut se faire à l'aide de la méthode «ligand
blotting» (Todorov et al. 2007). Dans cette méthode, les membranes cellulaires sont
solubilisées avec du Triton puis séparées par électrophorèse en conditions
dénaturantes ou non-dénaturantes en une ou deux dimensions. Les protéines sont
transférées sur une membrane PVDF à haute rétention (ProBlott, Applied
Biosystems) puis incubées avec le ligand (dans ce cas-ci l'apoD) marqué au 35S. La
spécificité de liaison de 35S_apoD à la membrane est vérifiée par l'incubation en
190
présence d'un excès d'apoO froid. Les bandes radioactives sont ensuite découpées de
la membrane PVOF et identifiées par spectrométrie de masse (MALOI-TOF).
Les partenaires d'interaction de l' apoO, incluant le récepteur, peuvent
également être identifiés avec le système Strep-tag (Schmidt et Skerra 2007). Le
Strep-tag est un peptide contenant 8 résidus (Trp-Ser-His-Pro-Gln-Phe-Glu-Lys) et
ayant une forte affinité pour la streptavine. Le système est disponible
commercialement chez lBA-GmbH (One-STrEP Starter Kit cat # 2-1109-000). La
protéine d'intérêt (apoO) est clonée dans un vecteur d'expression contenant le Strep
Tag. Le plasmide est ensuite transfecté dans les cellules et au stade désiré, les cellules
sont lysées et les complexes apoD-partenaires d'interaction sont purifiés sur une
colonne de streptavidine modifiée (Strep-Tactin). Les complexes sont décrochés de la
colonne par compétition avec la O-Oesthiobiotine puis les protéines sont séparées sur
gel (SOS-PAGE). Les complexes non-spécifiques sont éliminés par comparaison
avec des complexes provenant de cellules transfectées avec le vecteur vide. Les
complexes spécifiques sont découpés du gel et identifiés par spectrométrie de masse.
Cette technique a l'avantage de reposer sur un petit marqueur (tag) comparativement
à d'autres comme le TAP-tag, évitant ainsi ['encombrement stérique. De plus, ses
propriétés physicochimiques permettent une élution douce et rapide en une seule
étape, permettant de garder intactes les protéines formant les complexes.
Une fois les partenaires de l' apoD identifiés, l'interaction entre l' apoO et
chacun de ces partenaires peut être caractérisée par spéctroscopie SPR (surface
plasmon resonance) à l'aide de l'appareil BIAcore. Cette technologie permet de
visualiser l'interaction entre deux ou plusieurs molécules en temps réel et donc de
confirmer que l'interaction est bien réelle. L'apoO est liée à la surface d'une puce de
détection (sensor chip) alors que l'autre (ou autres) partenaire est apporté par un flux
de tampon. Chaque liaison à la surface de la puce de détection induit un changement
de l'indice de réfraction qui est capté par un détecteur. Les changements d'indice de
191
réfraction sont enregistrés en temps réel sous forme de courbes. Ces courbes disen t
non seulement s'il y a eu liaison ou non, mais fournissent aussi de l'information sur la
cinétique et la force de liaison (T6th et al. 2000)
6.2.1.3 Fonction nucléaire
Tel que détaillé également dans le chapitre II, nous avons démontré que
l'apoO accumulée dans le noyau proviendrait fort probablement du milieu
extracellulaire. Entre autres raisons, nous invoquons le fait que l'apoO est une
protéine sécrétée dont la localisation nucléaire lors d'un stress cellulaire est inhibée
par l'application de Brefeldine A, un inhibiteur de l'appareil de Golgi et de la
sécrétion protéique. Malgré cela, il est quand même possible que l'apoO nucléaire
provienne directement de l'appareil de Golgi. L'appareil de Golgi est responsable de
diriger les protéines vers divers compartiments. Entre autres, il peut les diriger vers le
noyau via l'action de la phosphatidylinositol-4-kinase (PI4K) (Tekirian 2002). Afin
de vérifier cette possibilité, des cellules transfectées avec ApoO-GFP et soumises à
un stress pourraient être traitées avec de l' oxide de phenylarsine ou du orobol, des
inhibiteurs de PI4K.
Par ailleurs, la localisation de l'apoO dans le noyau comble certainement une
fonction. L'apoO et/ou son ligand pourraient agir comme facteur de transcription ou
interférer dans des processus nucléaires comme le cycle cellulaire. Souvent, les
protéines impliquées dans le cycle cellulaire subissent une modulation de leur
expression et de leur localisation au cours du cycle. Pour vérifier si tel est le cas pour
l'apoO, il suffit de synchroniser les cellules en phase GO/G 1 par déprivation de sérum
ou en phase S par double blocage avec de la thymidine, puis de vérifier l'expression
et la localisation de l' apoO pendant 24 heures lorsque les cellules sont remises en
cycle. La longueur du cycle cellulaire doit aussi être mesurée puisque certaines
protéines altèrent la durée du cycle cellulaire. De plus, les résultats obtenus suggèrent
192
que l'apoD puisse agir comme signal prolifératif dans les fibroblastes. Il serait donc
intéressant de mener des études de signalisation cellulaire, en particulier de vérifier
l'effet de l'apoD sur l'expression et la translocation nucléaire de ERK 1/2 qui
transmet les signaux extracellulaires de prolifération au noyau. De telles études
avaient déjà été menées sur des cellules de muscle lisse dans lesquelles l'apoD inhibe
la prolifération (Sarjeant et al. 2003).
Le rôle de l'apoD comme facteur de transcription requiert que l'apoD ait la
capacité de lier l'ADN directement ou via l'interaction avec d'autres protéines. Pour
déterminer si l'apoD lie directement l'ADN in vivo et pour connaître le lieu de cette
liaison, c'est-à-dire les gènes qui sont ciblés, on peut utiliser la technique ChIP-chip.
Cette technique combine l'immunoprécipitation de la chromatine (ChlP) avec la
technologie des micropuces à ADN (chip). Ainsi, les cellules ou les tissus dans la
condition désirée sont d'abord traités au formaldéhyde afin de lier de façon réversible
(cross-link) l'ADN et les protéines qui y sont attachées. Les cellules sont ensuite
récoltées et soniquées puis les complexes ADN-protéine d'intérêt sont récupérés. La
récupération peut être faite de plusieurs manières. De façon classique, l'anticorps
détectant l'apoD est lié à des billes de protéine G magnétiques puis l'extrait cellulaire
soniqué est incubé avec ces billes. Alternativement, si l'anticorps est incapable de
reconnaître l'apoD lorsque liée à l'ADN, les cellules peuvent être transfectées avec
un plasmide contenant l'apoD fusionnée à un marqueur facilement purifiable, par
exemple le Strep-tag décrit plus haut. La purification se fait alors sur une résine
spécifique au marqueur, par exemple une résine de streptavidine permettant de
purifier l'apoD-Strep-tag. Les complexes ADN-protéines sont ensuite élués de la
résine et la liaison entre les protéines et l'ADN est inversée par incubation à la
chaleur. Les fragments d'ADN sont ensuite amplifiés par PCR. Il est possible, à cette
étape-ci, de déterminer s'il y a récupération d'ADN grâce à des méthodes ultra
sensibles. Il est possible par exemple d'évaluer la concentration d'ADN par
électrophorèse microfluidique à l'aide d'un Bioanalyser (Agilent 2100). Les
193
fragments d'ADN sont alors couplés à un fluorophore puis hybridés à des micropuces
d'ADN. L'analyse de la fluorescence obtenue permettra d'identifier les régions de
l'ADN liées par l'apoD.
Alternativement, le ChlP-sequencing (ChIP-Seq) peut remplacer le ChIP-chip.
Cette technique utilise aussi l'immunoprécipitation de la chromatine pour purifier
l'ADN lié à la protéine d'intérêt. Cependant, au lieu d'identifier les zones de l'ADN
occupées par la protéine à l'aide de micropuces, celles-ci sont identifiées par
séquençage grâce à la technologie Solexa. Cette technique nécessite moins d'ADN,
n'est pas limitée par le contenu d'une micropuce à ADN et permet une résolution
positionneIle plus fine.
Par la suite, on doit déterminer quel est l'effet de la liaison de l'apoD à ces
régions d'ADN. Si la région d'ADN identifiée avec ChlP-chip ou ChlP-Seq
correspond à un promoteur, des cellules ApoD-KO peuvent être transfectées avec ce
promoteur couplé au gène rapporteur de la luciférase, seul ou en combinaison avec un
plasmide d'expression contenant l'apoD. On peut ainsi déterminer si l'apoD active ou
réprime ce promoteur. Ensuite, on peut vérifier l'expression du gène correspondant et
de sa protéine dans des conditions connues comme induisant l'expression de l'apoD,
par exemple l'arrêt de croissance ou l'exposition au LPS et ce dans des cellules
exprimant ou non l'apoD. Finalement, des mutants délétionnels peuvent indiquer
quelle portion de l'apoD est nécessaire pour la liaison à l'ADN.
Dans le cas où l'apoD ne lie pas directement l'ADN mais fait partie d'un
complexe transcriptionnel, il est possible d'identifier les composants protéiques par
spectrométrie de masse suite à l' immunoprécipitation de la chromatine et
l'élimination de l'apoD. L'ordre d'assemblage de ces protéines peut aussi être
déterminé.
194
6.2.2 Études métaboliques
Il est démontré en chapitre III que la présence d'apoD humaine dans le foie de
souris H-apoD-Tg provoque l'accumulation de lipides dans ce tissu et conduit à une
résistance à l'insuline. Il serait intéressant de continuer l'exploration de ce
phénomène.
6.2.2.1 Métabolisme du glucose et des lipides
Les travaux présentés en chapitre III pourraient être complétés avec l'analyse
métabolique des souris ApoD-KO. Cependant, on ne s'attend pas à voir de différence
par rapport aux souris WT puisque l'accumulation de lipides dans le foie est corrélée
avec la surexpression d'apoD humaine dans ce tissu.
Il faudrait également mieux comprendre ce qui provoque l'accumulation de
lipides chez les souris H-apoD-Tg. Nous avons observé que l'expression des gènes
LFABP, FAS, PPAR gamma et SREBP-I c, impliqués dans la lipogenèse de novo, est
stimulée chez les souris H-apoD-Tg. La lipogenèse de novo peut être quantifiée dans
des cultures primaires de foie ou des tranches de foie en culture grâce à
l'incorporation de 14C-acétate dans les lipides. Nous avons par ailleurs postulé que la
présence de l'apoD humaine pourrait provoquer un débalancement favorisant
l'accumulation de lipides au niveau du foie. Il faudrait donc déterminer la
composition en lipides et en acides gras du foie par chromatographie en phase liquide
et gazeuse (HPLC et Ge) et la comparer avec celle de souris WT. Nous avons
également conclu que l'oxydation des lipides n'était pas affectée puisque l'expression
de PPAR alpha, un gène-clé de l'oxydation lipidique, était stimulée. Cependant,
comme il y a de nombreux autres gènes impliqués dans la beta-oxydation des lipides,
une mesure globale de l'oxydation des acides gras par le foie peut se faire grâce à la
libération de 3H20 par des coupes de foie préincubées avec du 3H-acide palmitique
195
(Harada el al. 2007). Il faudrait également étudier l'influence de l' apoD sur des
protéines impliquées dans la fusion puisqu'il a été démontré que les gouttelettes
lipidiques visibles dans le foie des souris H-apoD-Tg sont d'abord de petites
structures qui s'agrandissent par fusion avec les particules environnantes et que ce
processus est dépendant des microtubules et de la dynéine. Il faudrait donc voir si le
blocage de différentes protéines impliquées dans la fusion, en présence d'acide
oléique, diminue le volume des gouttelettes lipidiques de la même façon dans des
hépatocytes primaires de souris H-apoD-Tg et WT. Les protéines connues comme
impliquées dans la fusion lipidique sont: NSF (N-ethylmaleimide-sensitive-factor),
alpha-SNAP (soluble NSF attachment protein) et ses SNAREs (SNAP receptors),
SNAP23 (synaptosomal-associated protein of 23 lilla), syntaxin-5 et VAMP4
(vesicle-associated membrane protein 4) (Bostrbm el al. 2007).
Il faudrait aussi déterminer l'influence de la surexpression de l'apoD humaine
sur le métabolisme des lipoprotéines. Une modification de la distribution des
lipoprotéines circulantes a été constatée dans divers modèles de stéatose hépatique et
de résistance à l'insuline (Minehira el al. 2008). Ainsi, le profil lipoprotéique des
souris H-apoD-Tg, ApoD-KO et WT peut être analysé par FPLC. Il serait également
pertinent de quantifier l'abondance de d'autres apolipoprotéines importantes dans le
métabolisme lipidique comme l'apoA-I, l'apoA-II, l'apoB-48, l'apoB-lOO, l'apoe-III
et l'apoE.
Nous pourrions aussi vérifier si la résistance à l'insuline chez les souris H
apoD-Tg peut être renversée. Le PPAR gamma, qui est impliqué dans l'adipogénèse
et augmenté chez les diabétiques et les souris H-apoD-Tg, a souvent été désigné
responsable de la résistance à l'insuline et est la cible de thérapies anti-diabète. Le
rosiglitazone, un activateur spécifique de PPAR gamma, active l'adipogénèse induite
par PPAR gamma, mais améliore, de façon paradoxale, la sensibilité à l'insuline en
favorisant préférentiellement l'accumulation de gras sous-cutané (Edvardsson el al.
196
1999). La réponse à l'insuline (ITT) pourrait être testée suite à l'administration de
rosiglitazone. Ceci nous indiquerait aussi l'importance véritable de l'augmentation de
PPAR gamma dans le métabolisme de l'insuline chez les souris H-apoD-Tg.
Puisque la phosphorylation de Akt est diminuée presque de moitié chez les
souns H-apoD-Tg, l'étude plus approfondie des voies signalétiques de l'insuline
pourrait être révélatrice. Vraisemblablement, l'accumulation d'acides gras dans le
foie active PKC theta, qui favorise la phosphorylation de IRS 1 (insulin receptor
substrate 1) (IRS 1) sur les résidus sérine et tréonine plutôt que tyrosine bloquant la
production de IRS2, et conséquemment J'activation de PI3K. L'inhibition de PI3K
empêche finalement le recrutement à la membrane de Akt et donc sa phosphorylation.
Cependant, il est possible que la présence de l'apoO induise un changement dans la
composition ou la fluidité de la membrane empêchant l'insertion de Akt ou sa
phosphorylation. Il faudrait donc vérifier ces deux possibilités en analysant, d'une
part, les protéines en amont de Akt et d'autre part les propriétés membranaires, tel
que décrit plus loin.
Pour déterminer si la résistance à l'insuline provient bien du foie et non du
tissu adipeux ou des muscles, le métabolisme de l'insuline peut être davantage étudié
au niveau cellulaire. Pour cela, des adipocytes, des hépatocytes et des myocytes de
souris WT, ApoD-KG et H-apoD-Tg sont isolés et divers paramètres du métabolisme
du glucose sont évalués. La capacité à lier l'insuline est mesurée par l'incorporation
d'insuline marquée au 1251. La capacité à absorber le glucose se mesure par
l'incorporation de 3-oxy-methyl-D-glucose en présence ou non d'insuline. La
lipolyse est mesurée à l'aide du relarguage de glycerol en réponse à l'insuline en
présence ou non d'isoproterenol, un stimulateur de lipolyse (Ciaraldi et al. 1997).
11 faudrait aussi examiner les phénomènes entourant souvent la résistance à
l'insuline comme l'hypertension, le remodelage cardiaque et l'athérosclérose.
197
L'athérosclérose est visualisée par microscopie de l'aorte proximale. Elle commence
par des dépôts lipidiques puis progresse vers des lésions contenant des cellules
spumeuses et des cellules musculaires lisses puis vers des plaques fibreuses. Le
remodelage cardiaque est visualisé par échocardiographie et l'anomalie la plus
courante est une hypertrophie ventriculaire.
Finalement, il serait intéressant de voir si la surexpression d'apoD humaine
spécifiquement dans le foie induit une stéatose et une résistance à l'insuline
comparables à celles observées lorsque l'apoD humaine est principalement dirigée
vers les neurones. Cela permettrait d'évaluer si une très forte surexpression d'apoO
dans le foie aggrave le phénotype observé. Cela permettrait également de dissocier
l'etfet neuronal de l'effet hépatique sur ces phénomènes.
6.2.2.2 Métabolisme en conditions adipogéniques
Nous avons observé que les souris H-apoD-Tg et ApoD-KO n'ont pas de
différence significative de poids par rapport à des souris WT lorsque nourries avec
une moulée standard. Il est possible cependant qu'avec une diète riche en gras et en
carbohydrates, des différences apparaissent. Il s'agit donc de déterminer si les souris
développent de l'obésité et un diabète de type 2 avec des diètes semi-synthétiques
contenant divers pourcentages de gras et de carbohydrates (% carbohydrates
protéines-gras: HCLF (41:42:17); HCHF (41:16:43); LCHF (11:45:44» et voir
l'impact de ces diètes sur le métabolisme du glucose et des lipides, tel que décrit dans
le chapitre III et ci-haut. En particulier, il faut examiner si la stéatose hépatique
évolue vers la fibrose, la cirrhose ou le développement de tumeurs et si
l'inflammation reste toujours à un faible niveau.
Si une différence au niveau du poids est constatée, ces études pourraient être
complétées avec l'analyse de la composition corporelle et de la dépense énergétique.
198
La composition corporelle peut être analysée par DEXA (Body Dual X-Ray
Absorptiometry) ou par résonnance magnétique qui nous dormeront alors le
pourcentage de masse maigre et de masse grasse. Le métabolisme énergétique peut
être calculé de façon approximative par la consommation d'oxygène (V02). Une
mesure qui reflète mieux la dépense énergétique est le nombre de kilojoules totaux
dépensés par jour. La dépense énergétique peut être aussi normalisée par la masse
maigre (Trevaskis et al. 2005). Il serait aussi intéressant de calculer l'efficacité
alimentaire, ou le taux de conversion de la nourriture en poids corporel, qui est défini
comme la prise de poids relative au poids de la nourriture ingérée (Jormson et al.
2002) ou aux calories ingérées (Butler et Cone 2003). La dépense énergétique peut
aussi être corrélée avec l'activité physique qui peut être mesurée par la distance
parcourue, l'activité spontanée (le nombre de fois que la souris déclenche le détecteur
de mouvement), l'utilisation de la roue d'exercice ou les battements cardiaques.
Si une diminution de la dépense énergétique est constatée, et puisqu'une
réduction de la dépense d'énergie résulte en une augmentation de l'adipogénèse, il
peut être pertinent de mesurer les gènes impliqués dans la combustion d'énergie et la
différentiation des adipocytes. Par exemple, l'acyl-CoA oxidase, la UCP1, la UCP2 et
la carnitine palmitoyltransferase-l sont inhibés dans le tissu adipeux brun (site de la
thermogenèse) des souris p62-/-, un modèle d'obésité où le taux métabolique est
réduit. Ces enzymes sont impliquées dans le taux d'oxydation des acides gras dans la
mitochondrie. Par ailleurs, le PPAR-gamma est induit dans le tissu adipeux blanc
(réserve énergétique de l'organisme) (Rodriguez et al., 2006).
6.2.2.3 Contrôle neuronal du métabolisme
Il y a de plus en plus de preuves en faveur d'un contrôle neuronal de la
résistance à l'insuline et de l'accumulation de gras. Or le site primaire d'expression
de l'apoD humaine chez les souris H-apoD-Tg est les neurones. Il est possible que la
199
surexpression de l'apoD dans les neurones provoque, à long terme, un débalancement
de ce mécanisme. Il faudrait donc regarder par immunohistochimie dans quel type de
neurones s'exprime chacun des transgènes. La local isation de l' apoD dans
l'hypothalamus et plus particulièrement sur les neurones NPY/AGRP et
POMC/CART du noyau arqué ou les neurones du noyau paraventriculaire, impliqués
dans le métabolisme énergétique, pourrait suggérer un rôle pour l'apoD dans le
métabolisme du glucose contrôlé par le cerveau.
La surexpresSIOn de l'apoD pourrait bloquer directement la réponse à
l'insuline ou à la leptine dans les neurones, induisant ainsi une résistance à l'insuline
périphérique. Il faudrait dans un premier temps déterminer si les neurones provenant
de souris H-apoD-Tg sont sensibles à l'insuline. Pour cela, on peut regarder sur des
extraits de cerveau, si la phosphorylation totale sur les tyrosines médiée par l'insuline
est altérée. On peut ensuite regarder de façon plus spécifique la phosphorylation de
Akt, un composant majeur de la voie de l'insuline. La résistance à la leptine pourrait
être causée par la liaison de l'apoD transgénique sur le récepteur de la leptine.
6.2.2.4 Inversion du phénotype
Il serait intéressant de déterminer si le blocage ou l'activation de gènes-clés du
métabolisme peut moduler le phénotype des souris H-apoD-Tg. Par exemple, Pten est
une phosphatase qui inhibe la voie phosphatidy linositol-3 kinase/Akt. Son inhibition
dans les neurones augmente la phosphorylation de Akt, la sensibilité à l'insuline et la
dépense énergétique (Plum et al. 2007). Par contre, sa délétion dans le foie de souris
cause une hépatomégalie et une accumulation de lipides dans le foie, mais améliore la
réponse à l'insuline (Stiles et al. 2004). Par ailleurs, il a été démontré que
l'administration orale de GW3965, un agoniste de LXR, stimule la sécrétion de
cholestérol à partir des cellules, ralentissant ainsi l'accumulation de lipides induite
par une diète riche et améliorant la tolérance au glucose (Laffitte et al. 2003).
200
L'inhibition de Pten ou l'administration de GW3965 à des souris H-apoD-Tg sont
elles capables de renverser la stéatose hépatique ou la résistance à l'insuline?
6.2.3 Mécanismes de protection
La capacité de l'apoD à protéger les cellules, tel que démontrée en chapitre IV
et V, est sûrement étroitement liée à ses propriétés de transporteur, en apportant des
facteurs nutritifs ou régulateurs ou en enlevant des déchets métaboliques toxiques. On
n'écarte cependant pas la possibilité que ses fonctions puissent être autres que son
rôle de transporteur.
6.2.3.1 Interaction avec la membrane cellulaire
Nous avons déterminé que l'apoD protège contre le stress oxydatif en
contrôlant le niveau de lipides peroxydés (chapitre IV). De plus, elle protège contre
l'inflammation aiguë probablement en agissant sur les voies signalétiques impliquant
la PLA2 (chapitre V). Ce rôle peut être joué a priori en stabilisant les lipides à la
membrane, empêchant leur peroxydation et leur conversion en AA. Ce rôle peut
également être joué a posteriori en éliminant les lipides peroxydés des membranes,
prévenant ainsi les boucles de rétroaction positive qui mènent à l'amplification des
dommages oxydatifs. L'apoD pourrait également capturer l'AA libre dans le
cytoplasme, empêchant son utilisation dans des réactions enzymatiques (par exemple
COX-2) ou autres voies nuisibles pour la cellule. Alternativement, le contrôle de la
peroxydation lipidique et de l'inflammation pourrait être la conséquence de la
régulation de la composition lipidique des membranes par l'apoD, qui va déterminer
la susceptibilité des membranes à la peroxydation et à l'action de la PLA2.
Il a déjà été démontré que la composition lipidique du cerveau de souns
ApoD-KO est altérée (Thomas et Yao 2007). Il serait donc intéressant de déterminer
201
la composition en lipides cérébraux des souns H-apoD-Tg, particulièrement la
concentration en AA qui est un ligand préférentiel de l'apoD. Ceci peut être fait en
suivant la même méthode que chez les souris ApoD-KO soit, en utilisant la méthode
HPLC-ELSD (High performance liquid chromatography-Evaporative light scattering
detector) pour mesurer les lipides et la méthode GC-FID (Gaz chromatography-Flame
ionization detector) pour mesurer les acides gras saturés et polyinsaturés (Thomas et
Yao 2007).
Il est également possible de déterminer si l' apoD est capable de lier les
composants lipidiques majeurs des membranes, et donc de les stabiliser ou empêcher
leur dégradation, par «Fat Western blotting» (Ching et al. 2007). Le principe consiste
à évaluer la liaison d'une protéine d'intérêt avec des lipides immobilisés sur une
membrane de nitrocellulose. Il existe des membranes commerciales contenant 100
pmol de chacun des IS lipides membranaires les plus abondants (membrane lipid
strips, cal. # P-6002, Echelon Biosciences lnc., Salt Lake City, UT). Selon le
protocole du fabricant, il s'agit donc de bloquer la membrane avec un tampon
contenant 3% d'albumine sérique bovine sans acides gras (fatty acid-free BSA).
Ensuite, la membrane est incubée avec la protéine recombinante couplée à la GST
(par exemple apoD-GST), lavée puis incubée avec un anticorps anti-GST. La
membrane est ensuite incubée avec un anticorps secondaire couplé à la HRP (horse
radish peroxidase) qui est finalement détecté par chemiluminescence.
Il serait également intéressant d'étudier l'effet de l'apoD sur la stabilité
membranaire. Pour ce faire, on peut comparer les propriétés structurelles et
dynamiques des membranes de cellules, par exemple de neurones, provenant de
souris WT, ApoD-KO et H-ApoD-Tg par la méthode ATR-FTlR (attenuated total
reflection-Fourier transform infrared spectroscopy) (Gattoni et Boffi 2003). Dans
cette technique, des fragments de membrane sont immobilisés sur des cristaux
permettant aux rayons infrarouges de traverser, par exemple, une plaque composée de
202
selenide de zinc (ZnSe). Un détecteur permet alors d'analyser la structure et donc de
comparer le positionnement lipidique dans des membranes provenant de différents
génotypes de souris. De façon plus simple, l'effet de l'apoD sur la fluidité
membranaire peut se mesurer par l'incorporation de 1,6-diphenyl-l ,3,5-hexatriene
(DPH), un lipide fluorescent, dans la membrane cellulaire (Beek et al. 1998).
Des changements de composition lipidique ou de stabil ité membranaire
entraînent souvent des changements morphologiques au niveau des axones. La forme
et l'organisation cytosquelettique des axones sont normalement visualisées dans le
nerf optique (SNC) ou dans le nerf sciatique (SNP) à l'aide de la microscopie
électronique.
Afin d'analyser l'implication de l'apoD dans l'élimination des lipides
peroxidés des membranes, il faut d'abord déterminer si l'apoD peut lier des produits
de peroxydation lipidique comme le trans-4-hydroxy-2-nonenal (4-HNE). Le 4-HNE,
un produit majeur de la peroxidation lipidique causée par le stress oxydatif, est formé
par la dégradation d'acides gras w-6-polyinsaturés comme l'acide linoléique et
l'acide arachidonique, deux acides gras abondants dans les cellules (Hu et al. 2002).
6.2.3.2 Propriétés anti-oxydantes
L'apoD pourrait également protèger contre le stress oxydatif par une activité
anti-oxydante. Cette activité antioxydante peut se faire de façon directe, c'est-à-dire
en éliminant directement les radicaux libres (radical scavenging activity), bien qu'un
tel mécanisme semble improbable à cause des propriétés de liaison de l'apoD. Pour le
tester, plusieurs approches sont possibles (Govindarajan et al. 2003): 1) L'activité
antioxydante peut être quantifiée par le degré de décoloration du radical DPPH ((J,(J
diphenyl-~-picrylhydrazyl) mesurée par l'absorbance à 520 nm. 2) La capacité
203
antioxydante totale est mesurée comme l'absorbance à 695 nm en présence de 0.6 M
d'acide sulfurique, 28 mM de phosphate de sodium et 4 mM d'ammonium
molybdate. 3) L'activité de «scavenging» de l'oxyde nitrique (NO) se mesure par
spectrophotométrie à 546 nm en présence de réactif de Griess (1 % de sulphanilamide,
2% d'acide phosphorique, 0.1 % de naphthyl ethelene diamine dihydrochloride). 4)
L'activité «scavenger» d'acide hypochlorique (HOCI) est déterminée par
spectrométrie à 412 nm en présence de 40 mM d'acide 5-Thio-2-nitrobenzoïque. 5)
La capacité de chélation d'ions Fe2 + est estimée à l'aide de l'agent chélatant 2, 2'
bipyridyl. Ainsi, l'extrait contenant l'apoD est pré-incubé avec 50 mM de FeS04 et
50 mM NaCI (pH 7) avant l'ajout de l mM 2,2'-bipyridyl. L'absorbance du complexe
bipyridyl-ferreux est mesurée à 525 nm. 6) La décomposition du peroxyde
d 'hydrogène peut également être déterminée. À l'aide de ces méthodes, on peut donc
comparer l'activité antioxydante de l'apoD avec celle de composés ayant des
propriétés antioxydantes bien connues comme la vitamine E et l'acide ascorbique.
L'activité antioxydante de l'apoD peut également se faire indirectement via
l'activation de voies anti-oxydantes. L'influence de l'apoD sur les enzymes
antioxydantes telles que la superoxide dismutase, la catalase, la glutathione, la
glutathione reductase et la glutathione peroxidase peut être mesurée par des essais
spectrophotométriques (Pippenger et al. 1998). L'influence de l'apoD sur d'autres
mécanismes de détoxification comme l'activation de la c-jun-N-terminal kinase
(JNK) ou l'induction de hsp 70 (heat-shock protein 70) (Manning-Bog et al. 2003)
peut aussi être étudiée. La JNK est un membre des MAPK (mitogen activated protein
kinase). La voie des JNK peut être bloquée par la surexpression de llP-l bllB 1. Les
cellules deviennent alors insensibles à divers stimuli pro-apoptotiques. Les
chaperones telles que hsp 70 sont souvent sollicitées dans la réponse au stress. Elles
peuvent protéger les protéines contre les dommages oxydatifs et faciliter la
dégradation des protéines oxydées via le système du protéasome.
204
6.2.3.3 Propriétés anti-inflammatoires
L'effet anti-inflammatoire de l'apoO lors d'encéphalite aiguë causée par
HCoV-OC43 a été associé en partie avec la diminution de chemokines et de
cytokines (IL-I~, TNFa et MCP-I) (Chapitre V) qui provoque une diminution de
l'infiltration de leukocytes au cerveau et de la production de PLA2. La prochaine
étape consiste donc à explorer les mécanismes sous-jacents à ces propriétés anti
inflammatoires.
On peut se questionner d'abord sur la façon dont l'apoO régule la production
de cytokines. NF-KB est activé par les Rho GTPases et joue un rôle clé dans la
régulation transcriptionnelle des cytokines, chemokines, molécules d'adhésion et les
protéines de phase aiguë comme la CRP (C-reactive protein) (Pahl 1999). Il serait
intéressant de comparer l'activation nucléaire de NF-KB par retard sur gel en utilisant
des extraits nucléaires provenant de souris ayant divers génotypes d'apoO et un
oligonucléotide contenant NF-KB. Au niveau de la voie de signalisation de NF-K8, on
pourrait étudier la translocation nucléaire de la sous-unité p65, la dégradation de Iill
ainsi que la phosphorylation de p38 suite à l'injection de HCoV-OC43. Plus
simplement, on pourrait simplement regarder la phosphorylation de IKB.
Par ailleurs, les PPAR (peroxisome proliferator-activated receptor) a et y,
inhibent la production et les effets néfastes des chemokines et des cytokines et ont été
impliqués dans les propriétés anti-inflammatoires de certains composés dont les
statines. Entre autres, les PPAR lient les éléments PPRE (PP AR response elements)
sur le promoteur du gène sIL-IRa. L'IL-IRa soluble est induit par l'IL-I~ et module
à son tour la réponse à l' IL-l ~ par sa liaison au récepteur IL-I de type l, prévenant
ainsi les effets de l' IL-l ~ sur les cellules cibles (François et al. 2006). Il est possible
de démontrer l'implication de PPARa dans l'effet anti-inflammatoire de l'apoO par
205
diverses approches: 1) in vitro sur des cellules issues de souris WT, ApoD-KO et H
apoD-Tg dans lesquelles PPARa est inactivé par siRNA. On peut mesurer des
marqueurs d'inflammation (Cox-2, iNOS, TNFa, IL-la, IL-lB, IL-6) lors de
conditions inflammatoires induites par un traitement au LPS. L'expérience inverse
peut être faite par l'administration d'agonistes de PPARa comme le Clofibrate ou le
WY-14643. 2) in vivo suite au croisement de souris H-apoD-Tg avec des souris
PPARa-KO. Si PPARa est impliqué dans l'effet anti-inflammatoire de l'apoD, on
s'attend à ce qu'une souris exprimant normalement ppARa et surexprimant l' apoD
(PPARa-WT, H-apoD-TG) ait moins de marqueurs inflammatoires qu'une souris ne
surexprimant pas l'apoD (PPARa-WT, apoD-WT) suite à l'application d'un modèle
inflammatoire. À l'inverse, une souris déficiente en PPARa et surexprimant l'apoD
(PPARa-KO, H-apoD-TG) devrait démontrer le même niveau ou une augmentation
de marqueurs inflammatoires comparativement à une souris WT. 3) in vivo par
l'administration d'apoD à des souris PPARa-KO suite à l'application d'un modèle
inflammatoire. Le modèle inflammatoire le plus simple est le modèle d'œdème de la
patte induit par l'injection locale de carrageenan (Guay et al. 2004, Paumelle et al.
2006). Les mêmes stratégies peuvent être employées pour étudier les effets de
PPARy. On peut aussi regarder si l'apoD participe à l'activité des PPAR soit en
activant leur transcription ou en fournissant les ligands qui activent les PPAR. Les
ligands des PPAR sont entre autres les acides gras libres et les eicosanoïdes. L'apoD
pourrait donc stimuler les PPAR en apportant directement les acides gras ou en
transportant l'acide arach idonique essentiel à la production des eicosanoïdes.
rI faudrait également déterminer si l'effet de l'apoD sur l'activité de la PLA2
est simplement lié à la réduction des cytokines et chemokines ou si l'apoD régule la
PLA2 via un autre mécanisme. Il a été rapporté que les lipocortines seraient capables
d'inhiber l'activité de la PLA2 en compétitionnant avec la PLA2 pour le substrat
phospholipidique plutôt qu'en inhibant directement la PLA2 (Bonventre 1992).
206
D'autres protéines dont la PLlbeta qui a 33% d'homologie avec la leucine-rich
alpha2-glycoprotein humaine sont aussi capables d'inhiber la PLA2 en la liant
directement via des motifs riches en leucine (LRR) (Okumura et al. 1998). Pour
déterminer si la présence d'apoO influence l'activité PLA2, il suffirait de mettre en
présence la PLA2 et un substrat phospholipidique avec ou sans l'ajout d'apoO et de
calculer l'activité de la PLA2. Il a également été rapporté que des acides gras non
estérifiés cis insaturés de même que certains sous-produits de l'acide arachidonique
sont capables d'inhiber la PLA2. Il faudrait donc déterminer si l'apoO est capable de
lier ces acides gras. Finalement, il faudrait déterminer si l'apoO peut moduler la
transcription de la PLA2.
6.2.3.4 Activation de la glie
L'effet anti-inflammatoire de l'apoO lors d'encéphalite aIguë causée par
HCoV-OC43 correspondait aussi avec une plus grande activation de la microglie et
des astrocytes. L' apoO humaine présente dans les neurones contribue sûrement à
cette activation gliale. Cependant, on ne sait rien du mécanisme impliqué ni de la
fonction de cette activation. On peut supposer que l' apoO supprime les composantes
neurotoxiques tout en augmentant les composantes favorisant la survie neuronale.
Afin de comprendre le mécanisme impliqué dans l'activation, il serait intéressant
d'examiner si l'addition d'apoO à des cultures gliales stimulées ou non au LPS induit
leur activation (activation directe) ou si la présence de neurones est requise
(activation indirecte). Il est également possible que l'apoO contrôle l'activation gliale
en modifiant la disponibilité de l'oestradiol (Tapia-Gonzalez et al. 2008). L'apoO
pourrait donc capturer l'oestradiol, stimulant ainsi l'activation gliale, puis le relarguer
de façon contrôlée afin d'éviter la super-activation. La visualisation par
immunohistochimie des récepteurs d'œstrogène sur la glie devient donc intéressante
(l'expression des récepteurs coïncide avec l'activation gliale). On ne peut non plus
distinguer -entre l'augmentation de la réactivité causée par l'augmentation de la
207
réactivité et celle causée par l'augmentation du nombre de cellules. En effet,
l'encéphalite causée par HCoV-OC43 est très aiguë et il devient impossible d'avoir
des images d'immunohistochimie permettant de discriminer entre ces deux effets dû
au marquage inflammatoire trop intense. Il faudrait donc se tourner vers des cultures
primaires de microglie ou d'astrocytes stimulées au LPS ou infectées au HCoV
OC43. Il est alors possible de quantifier et de comparer la prolifération cellulaire et
l'expression des marqueurs chez les di fférentes lignées de souris.
Nous savons déjà que l' apoD diminue les propriétés neurotoxiques de
l'activation gliale par la diminution du niveau de cytokines. Il serait également
intéressant de déterminer si elle est accompagnée par une diminution de la sensibilité
des neurones aux effets nocifs des cytokines ce qui contribuerait encore à la
protection neuronale. Ainsi, il est possible d'analyser l'effet de milieu conditionné
provenant de microglie stimulée au LPS sur des neurones provenant de souris WT,
ApoD-KO et H-apoD-Tg en co-culhlre. Si la sensibilité des neurones aux cytokines
est modulée, on s'attend à ce que les neurones H-apoD-Tg survivent mieux et les
neurones ApoD-KO survivent moins bien que les neurones WT.
L'une des facettes bénéfiques de l'activation gliale est l'élimination de débris
cellulaires et de molécules neurotoxiques par phagocytose. La phagocytose peut être
mesurée à partir de microglie primaire provenant des divers génotypes de souris. Il
suffit de stimuler cette microglie avec du LPS, par exemple, puis d'y ajouter des
particules à phagocyter comme des particules de E. coli marquées de façon
fluorescente. Après lavage, la fluorescence incorporée dans les cellules est visualisée
par microscopie (Tran et al. 2008). L'autre facette bénéfique est l'apport de facteurs
neurotrophiques ou favorisant la croissance cellulaire tel que détaillé dans la section
suivante.
208
6.2.3.5 Transport de facteurs nutritifs et régulateurs
L'apoD pourrait contribuer au maintien, à la protection, à la réparation et à la
réinervation neuronale simplement en apportant les facteurs nécessaires à la fonction
cellulaire. Les acides gras à longue chaîne comme l'acide arachidonique (AA) et
l'acide docosahexaénoïque (DHA) sont des composants de la membrane
phospholipidique des neurones et de grandes quantités de ces gras sont donc requises
après une lésion afin de permettre aux neurones survivants de s'allonger et de ré
établir des synapses lors de la réinnervation. Les neurones n'ayant pas les enzymes
nécessaires pour la synthèse de novo de AA et DHA, ces acides gras sont donc
fournis par l'alimentation, par leur synthèse dans le foie puis leur transport dans le
cerveau ou par la synthèse de novo dans la glie. 11 a été postulé que le transport de ces
acides gras à partir de la circulation se fait via des transporteurs protéiques.
L'albumine, qui traverse la b31Tière hémato-encéphalique, est un candidat potentiel
(Bazan et al. 2005). L'apoD pourrait aussi jouer ce rôle. Cependant, la capacité de
l'apoD à traverser la barrière hémato-encéphalique n'est pas établie. Afin de le
démontrer, il est possible d'injecter de l'apoD humaine ou de l'apoD marquée
radioactivement de façon intraveineuse à des souris puis d'extraire le cerveau de ces
souris et de procéder à la visualisation de l'apoD injectée à l'aide d'anticorps ou par
détection de la radioactivité. Puisque ces acides gras peuvent également être fournis
par la glie environnante, il serait intéressant de déterminer in vitro si la présence
d'apoD humaine dans les neurones chez les souris H-apoD-Tg ou l'absence d'apoD
chez les souris ApoD-KO modifie la capture de ces acides gras par les neurones. La
comparaison de l'incorporation de eH]AA par des neurones provenant des différents
génotypes de souris serait très informative. Ainsi, il suffirait d'incuber des neurones
avec du eH]AA pendant 72 h à 37°C. La quantité de eH]AA incorporé serait
mesurée après l'élimination du eH]AA non lié par une série de lavages (Beek et al.
1998). Par ailleurs, il a déjà été démontré que l'application d'albumine stimule le
relarguage de AA dans diverses cellules dont les myocytes (Beek et al. 1998). Il
209
serai t donc intéressant de voir si l'application d' apoD sur des astrocytes stimule leur
excrétion de AA. Ainsi, il suffirait d'incuber des astrocytes avec du eH]AA pendant
72 h à 37°C. Le eH]AA non lié est éliminé par une série de lavages. Le relaguage de
eH]AA est mesuré sui te à l' addi tion d' apoD dans le milieu cellulaire (Beek et al.
1998).
Un autre ligand de l'apoD, le cholestérol, est essentiel au maintien et à la
réparation du système nerveux. La conversion du cholestérol en 24S
hydroxycholestérol, qui traverse rapidement la barrière hémato-encéphalique, est la
voie majeure pour l'élimination et le maintien de l'homéostasie du cholestérol dans le
système nerveux. Cependant, lorsque le transport de cholestérol est affecté, comme
chez les patients atteints de la maladie d'Alzheimer et de Niemann-Pick de type C
(NPC), le 24S-hydroxycholestérol s'accumule et devient neurotoxique (Bjorkhem et
Meaney 2004). Il serait intéressant de déterminer si la surexpression d'apoD chez un
modèle de souris NPC est capable de rétablir un niveau normal de 24S
hydroxycholestérol dans le cerveau, par exemple en croisant des souris NPC et des
souris H-apoD-Tg.
L'apoD peut également jouer son rôle de neuroprotection en transportant les
stéroïdes, en particulier les œstrogènes qui jouent un rôle important dans la fonction
neuronale et dans la protection des neurones du cortex cérébral en situations
pathologiques. Ainsi, on peut quantifier les stéroïdes chez les souris ApoD-KO et H
apoD-Tg par GCMS (Gas Chromatography Mass Spectrometry) et/ou par une
méthode ELISA (enzyme-linked immunosorbent assay). On peut ensuite vérifier
l'expression de leurs récepteurs à la surface des neurones et déterminer au niveau de
quelles voies leur action se fait particulièrement sentir.
L'apoD peut finalement influencer la production de neurotrophines telles que
le NGF (nerve growth factor), le BDNF (brain-derived neurotrophic factor), la NT-3
210
(neurotrophin-3), la NT-4 (neurotrophin-4) et la NNT 1 (novel neurotrophin-I) et de
leurs récepteurs p75 et Trk (Tyrosine kinases receptors). Ces protéines peuvent être
analysées par immunobuvardage à partir d'extraits tissulaires provenant des diverses
souns.
6.2.4 Études comportementales
Tel que démontré dans le chapitre IV, les souris ApoD-KG présentent une
diminution de l'activité spontanée et des problèmes de coordination motrice et
d'apprentissage. De plus, les souris H-apoD-Tg ont une augmentation de l'activité
exploratoire. Il faudrait aussi tester la coordination motrice et l'apprentissage chez les
souris H-apoD-Tg grâce au rotarod et au labyrinthe de Bames. Ces études pourraient
être complétées avec la piscine de Morris qui analyse aussi la mémoire référentielle
spaciale, c'est-à-dire la capacité à apprendre à utiliser des repères visuels pour
s'orienter. Des différences au niveau de ces tâches suggèrent des différences dans la
plasticité synaptique. La performance lors de tâches d'apprentissage spatial a été
associée au niveau de neurogénèse et de synaptogénèse des cellules granulaires dans
le gyms dentelé de l'hippocampe (Verina el al. 2007). Il s'agirait donc de déterminer
d'abord si le niveau de neurogénèse est différent chez les différents génotypes de
souris. Cela peut être fait en comparant la quantité de BrdU incorporé dans les
cellules granulaires. La morphologie, la longueur et la densité des dendrites peut,
quant-à-elle, être visualisée par un marquage à la doublecortine. Les connections
synaptiques peuvent également être évaluées par la coloration des «mossy fiber
boutons» avec la coloration de Timm, qui révèle en fait la présence de zinc à
l'intérieur des vésicules synaptiques.
ANNEXE 1
Autre contribution-section d'un chapitre de livre
Apolipoprotein D
Sonia Do Carmo, Eric Rassart
2006
Section de :
van Dijk W, Do Carmo S, Rassart E, Dahlback B, Sodetz JM
The plasma lipocalins al-acid glycoprotein, apolipoprotein D, apolipoprotein M
and complement protein CSy.
Dans: Akerstrom B, Borregaard N, Flower DR, Salier JP, eds.
Lipocalins
Landes Bioscience, Georgetown, TX, USA
p.140-166
212
Al.I Résumé
L'Apolipoprotéine D est une glycoprotéine de 29 kDa qui a été isolée pour la première fois en 1973 à partir d'une fraction de HDL de plasma humain. C'est une apolipoprotéine atypique puisque sa synthèse n'est pas limitée au foie et aux intestins. De plus, elle est exprimée à divers niveaux dans divers tissus chez plusieurs espèces de mammifères et chez le poulet. La large expression du gène de l'apoD chez plusieurs espèces suggère son importance chez les chordés. Des analyses de structure ont révélé que l'apoD fait partie de la famille des lipocalines. Plusieurs molécules hydrophobes ont été identifiées comme des ligands potentiels de l'apoD comme la progestérone, la prégnénolone, la bilirubine, le cholestérol, l'acide arachidonique et l'acide E-3-méthyle-2-héxénoïque. Des études de liaison récentes ont révélé que l'apoD est capable de discriminer entre des composés semblables. Étant donné son hétérogénéité apparente, il a été proposé que l'apoD ait un rôle multi-ligand : multifonction.
Mots-clés: lipocaline, régulation, cancer, système nerveux.
213
A1.2 Abstract
Apolipoprotein 0 is a 29-kDa glycoprotein that was isolated for the first time in 1973 from a human plasma HOL fraction. It is an atypical apolipoprotein since its synthesis is not restricted to the liver and/or the intestine. In addition, it is expressed at different levels in a wide range of tissues of several mammalian species and chicken. The wide distribution of the apoO gene in many species supports its evolutionary importance in the chordate lineage. Structural analyses revealed that the protein was part of the lipocalin family. Several candidate hydrophobie molecules were identified as potential ligand for apoO, such as progesterone, pregnenolone, bilirubin, cholesterol, arachidonic acid and E-3-methyl-2-hexenoic acid. Recent detailed ligand binding studies revealed that apoO discriminates weil in its binding function between closely related compounds. Due to this apparent beterogeneity, a role as a multi-ligand:multi-function protein has been proposed.
Keywords : lipocalin, regulation, cancer, nervous system.
214
Al.3 Introduction
Apolipoprotein 0 (apoD), so called because of its association with plasma
lipoproteins, belongs to the lipocalin superfamily. In human, apoD is present in many
fluids, expressed in several tissues although poorly expressed in the liver and
intestine, which are the major sites of synthesis of other apolipoproteins. In serum of
adult healthy subjects, apoD levels vary from 50-200 mg/L plasma. Plasma apoD is
mainly associated with both apoA-I and apoA-U in HDL and VHDL particles. lt is
also present as apoD/apoB-l 00 heterodimers in LDL and VLDL lipoproteins.
The gene and protein structures, the tissue distribution and known ligands of
apoD have been reviewed in Rassart el af. (2000). Here, the role of apoD is discussed
with respect to its modulation 1) by biological factors, 2) in various types of cancer,
and 3) in the normal and injured nervous systems.
Al.4 Modulation of apoD levels
The regulation of apoD expression is complex and many authors have shown
the importance of biological factors in the modulation of this protein.
Al.4.1 Cellular growth and differentiation
Many lines of evidence suggest an ll1verse relationship between apoD
expression and cell proliferation (Blais el al. 1994, 1995, Do Carmo el al. 2002,
Provost el al. 1991, Simard el al. 1990, 1991, 1992). Furthermore, apoD selectively
suppresses the proliferative response of vascular smooth muscle cells to growth
factors by a mechanism related to nuclear translocation of ERKl/2 (Sarjeant el al.
2003).
215
However, apoD expression might also be related to the differentiation period
that is attained foUowing growth arrest. Both retinoic acid (Lopez-Boado et al. 1994)
and 1,25-dihydroxyvitamin 03 (Lopez-Boado et al. 1997), well known for their
differentiation properties, were able to induce apoD expression in breast cancer ceUs.
This induction was shown later to be mediated by the nuclear retinoic acid receptors
(RAR) leading to a significant inhibition of ceU proliferation suggesting that apoD
could be a biochemical marker of RAR-mediated growth arrest and cell
differenciation (Lopez-Boado et al. 1996).
There is also evidence for such a role in vivo as apoD is expressed mostly in
nonproliferating or terminaUy differentiated prostate glandular epithelial cells
(Aspinall et al. 1995). However, this observation can not be generalized since not aU
nonproliferating or terminally differentiated cells do express apoD (Do Carmo et al.
2002).
A1.4.2 Metabolic studies and energy homeostasis
ApoD modulation is found in pathologies such as Tangier disease (Alaupovic
et al. 1981), familial LCAT deficiency (Albers et al. 1985), mutations in the apoA-1
gene (Deeb et al. 1991), type 2 diabetes (Baker et al. 1994, Vijayaraghavan et al.
1994, Hansen et al. 2004), alcoholism (Lewohl et al. 2002, Saito et al. 2002), corneal
Fuch's dystrophy (Gottsch et al. 2002), renal dysfunction (Dieplinger et al. 1986,
DeWan et al. 2001) and ischemic tissue injuries (James et al. 1986, Lin et al. 2001).
This association with such diseases may be fortuitous and a reflection of lipid
metabolism imbalance. The apoD correlation with type 2 diabetes, obesity and
hyperinsulinemia may be liver X receptor-dependent and the activation of
inflammatory and pro-angiogenic pathways (Hansen et al. 2004, Hummasti et al.
2004).
216
In the hypothalamus, apoD interacts specifically with the cytoplasmic portion
of the long form of the leptin receptor, Ob-Rb, known to play a key function in
regulating food intake and body weight. Moreover, the hypothalamic level of apoD
mRNA is stimulated by dietary fat, and is strongly, positively correlated with body fat
mass and circulating leptin levels. This positive association with body fat, however, is
lost in obese ob-/ob- and db-/db- mice, which exhibit markedly reduced levels of
hypothalamic apo D mRNA compared to that of wild-type mice. These results
suggest that apoD in the hypothalamus is involved in the leptin/Ob-Rb signal
transduction pathway that contrais body fat accumulation on a high-fat diet (Liu et al.
2001).
A1.4.3 Development
ApoD is also involved in gestation (Provost et al. 1995) and foetus
development (McConathy and Lane 1980). In mouse, apoD is selectively modulated
from E9 to birth in mesenchyme and neuroepithelium (Sanchez et al. 2002). In rat
brain, during development and in the early neonatal period, maturation-associated
induction of apoD gene expression coincides with the period of active myelination as
weil as synaptogenesis in rodent brain (Ong et al. 1999).
ApoD is also present in the yolk of the rapidly growing chicken oocyte. First
proposed to play a role in the transport and/or mobilization of lipids during
embryogenesis in oviparous species (Vieira et al. 1995), it is presumed to transport
regulatory molecules such as vitamin A and thyroid hormones (Yao et al. 2002). In
the chicken foetus, apoD is expressed in ectodermal derivatives in the developing
feather follic1es and the nervous system. Both neurons and glia express chicken apoD
in a subset-dependent form, although very dynamic temporal changes of expression
cannot be ruled out. By contrast with the mouse, chicken apoD was not found in
pericytes and meningeal cells. It was suggested that the common ancestor of birds
217
and mammals might have expressed apoD in both mesenchymal and neuroectodermal
derivatives. The expression profiles possibly changed after the split of mammals and
birds, with chicken apoD expression being restricted to neuroectodermal derivatives
(Ganfornina et al. 2005).
A1.4.4 Cancer
ApoD is overexpressed in several types of cancer such as breast, ovanan,
endometrium, prostate, retinal, skin, pancreatic, and central nervous system (CNS)
carcinomas. lt is underexpressed in thyroid oncocytomas (Baris et al. 2004). It is
silenced by DNA methylation in esophageal squamous cell carcinoma and was
identified as a candidate of tumor suppression (Yamashita et al. 2002). However, the
correlation between the degree of tumoral differentiation and apoD expression
remains ambiguous. This association can either be positive or negative depending on
the type of tumor analysed. It can also vary depending upon the sample analysed and
there are even discrepancies within the same tumor type. Whether apoD expression is
a cause or a consequence of these cellular transformations remains unclear. In breast
and central nervous system cancers, high apoD expression is mostly correlated with
highly differentiated, non-invasive/metastatic carcinomas and it is associated with a
longer relapse-free and better survival. The presence of apoD in these tumors serves
as a good prognostic indicator but could simply be a reflection of growth arrest due to
cellular differentiation (Diez-Itza et al. 1994, Hunter et al. 2002, Lamelas et al. 2000,
Porter et al. 2003, Serra Diaz et al. 1999).
In contrast, the inverse relationship between apoD and cell proliferation
appears to be lost during malignant transformation and elevated apoD staining is
associated with advanced invasive prostate (Ashida et al. 2004, Aspinall et al. 1995,
Hall et al. 2004, Zhang et al. 1998), skin (Miranda et al. 2003, West et al. 2004) and
pancreatic carcinomas (Iacobuzio-Donahue et al. 2002, Ryu et al. 2001) and may
218
therefore be a prognostic of unfavorable evolution. It is not known if this is due to an
increased rate of cellular proliferation or a decrease in cell death (Hall et al. 2004).
Moreover, apoD protease activity (Kesner et al. 1988), its implication in cell motility
in response to growth factors (Leung et al. 2004) and its association with the
progression to a more differentiated tumoral stage suggests a potential role for apoD
in tumoral invasiveness.
In other cancers, like endometrial and ovanan carcmomas and
retinoblastomas, there is no significant relationship between apoD immunostaining
and either age of the patients, or the stage and histologie grade of the tumors (Alvarez
et al. 2003, Rojo et al. 2001, Vazquez et al. 2000). There are also contradictions in
the same cancer type. Sorne studies of breast and prostate cancers demonstrate no
significant association between apoD expression and the degree of differentiation
although an association with patient survival remains (Rodriguez et al. 2000, Selim et
al. 2001).
So far, it appears that the utility of apoD as a prognostic remains uncertain and
more studies are required. It was shown that apoD could be useful in the choice and
follow-up of hormonal therapy to treat breast cancers (Hall et al. 1996, Harding et al.
2000, Weber-Chappuis et al. 1996). This observed discrepancy among a wide range
of cancer could be due to the fact that sorne cancers show hormonal dependance for
their growth and the correlation may be restricted to some specifie cancer cell types.
For example, differences in apoD expression between male and female breast cancer,
the latter having a higher 1evel of apoD and a better outcome, opens the field of a
more selective hormonal therapy (Serra et al. 2000). There are numerous sterol
responsive elements in the apoD promoter (Do Carmo et al. 2002) and one would
expect a fine regulation of apoD expression by steroids.
219
A1.4.S Nervous system
A1.4.S.1 Peripheral nervous system
The first report showing an implication of apoD in the nervous system was the
study of Boyles et al. (1990a) that showed an increased expression in the regenerating
sciatic nerve of the rat after a crush injury. The level of ApoD mRNA and protein
transiently increased by 40- and 500-fold, respectively, at the time when axons from
the proximal stump grow into the distal nerve segment (Boyles et al. 1990a, Spreyer
et al. 1990). ApoE, another apolipoprotein, increased 250-fold after crush injury .
ApoD also accumulated in the regenerating sciatic nerve of two other species, the
rabbit and the marmoset monkey (Boyles et al. 1990a). Only small amounts of apoD
mRNA are detected in rat non-injured mature nerve and modest expression was
detected in transected nerves which were prevented from regeneration by ligation.
Since peripheral neural tissue is capable of local synthesis of sorne apolipoproteins
such as apoD and apoE, it seems probable that it would have its own independent
system of lipoproteins that may serve as the vehicles for lipid movement between
cells. This lipid transport system should be most active in the injured peripheral
nerves, in which massive quantities of lipid are freed due to myelin degradation and
are subsequently stored and reused during regeneration.
A1.4.S.2 Central nervous system
In human, apoD is produced by astrocytes and oligodendrocytes in the white
matter and in sorne scattered neurons and protoplasmic astrocytes in the grey matter
(Patel et al. 1995). It is also present in perivascular cells, and pericytes in the walls of
blood vessels suggesting a role in the transport of sterols and small hydrophobie
molecules to, or from, blood vessels to the cortex (Hu et al. 200 l, Navarro et al.
1998, 2004).
220
Ali the apoD ligands, cholesterol, progesterone, pregnenolone, arachidonic
acid and bilirubin are important molecules in the CNS. ApoD also binds androgens
and oestrogens to a lower extent. Two ligands, progesterone and pregnenolone, are
synthesized by astrocytes and oligodendrocytes. Pregnenolone was shown ta
accumulate as pregnenolone sulfate in the brains and sciatic nerves of humans and
rats (Bau lieu 1998). ApoD couId, therefore, be implicated in the local transport of
steroid hormones and may participate in reinnervation process.
Both apoD protein and mRNA increase in aged cerebral cortex probably due
to the increased number of total and reactive astrocytes (Belloir et al. 201, dei Valle
et al. 2003, Kalman et al. 2000). The same observation is also reported in microglia
of mice that lack cystatin B, a model for Unverricht-Lundborg disease, a human
disorder characterized by progressive neurological dysfunction and selzures
(Lieuallen et al. 2001). Also, an even larger increase of apoD is observed in aged
PDAPP transgenic mice, a model for Alzheimer's disease that express the mutated
human amyloid precursor protein (Thomas et al. 2001c). This may represent a glial
cell compensa tory response to beta-amyloid deposition in Alzheimer's disease.
ApoD is increased in the cerebrospinal fluid (CSf) and hippocampus of
patients with Alzheimer disease (Terrisse et al. 1998). This increase is correlated with
the Braak stage of neurodegeneration (Glockner et al. 2003). Although independent
of apoE protein concentrations, it is correlated with the apoE genotype depending on
the brain region analysed (Glockner et al. 2003, Terrisse et al. 1998, Thomas et al.
2003e). The differential association with apoE genotype may be explained by disease
progression. In early stages, an apoD increase in the presence of E4 allele could be a
compensatory mechanism and be indicative of ongoing reinnervation rather than cell
injury and death. However, this correlation is lost during disease progression (Belloir
et al. 2001, Thomas et al. 2003e). The apoD increase correlates with the number of
221
neurofibrillary tangles (NFT) but not with senile plaques (Glockner et al. 2003).
Furthermore, whereas apoE is always located overlapping the amyloid core, apoD
seems preferably around and near the amyloid (Navarro et al. 2003). Colocalization
of apoD and NFT in the same neuron was rare and apoD transcription is impaired
during NFT formation (Belloir et al. 2001), suggesting that apoD is present in
stressed neurons before they possibly accumulate NFT.
ApoD levels are also elevated in the CSF of patients with stroke,
meningoencephalitis, motor neuron disease, dementia (Terrisse et al. 1998), chronic
inflammatory demyelinating polyneuropathy, Guillain-Barre Syndrome, multiple
sclerosis (Reind 1 et al. 2001), and cerebrotendinous xanthomatosis (Salen et al.
1987). Increased ApoD transcripts were identified in glaucoma (Tomarev et al. 2003)
and in the nervous system of virus-infected mice (Dandoy-Dron et al. 1998, Kang et
al. 2003, Saha et al. 2003).
ApoD decreases significantly in serum samples from schizophrenie patients
(Thomas et al. 2001 b). This supports recent hypotheses involving systemic
insufficiencies in lipid metabolism Isignaling in schizophrenia. Deficiencies in
arachidonic acid, a primary apoD ligand, were reported in schizophrenie patients
(Thomas et al. 2003d, Yao et al. 2005). In contrast, apoD levels were significantly
and selectively increased both in schizophrenie and bipolar subjects depending on the
brain region analysed allowing the discrimination between the two disorders (Thomas
et al. 2003b). This apoD elevation in affected CNS regions is emphasized by
neuroleptic drugs, suggesting a focal compensatory response (Thomas et al. 2001 a).
Indeed, elevated apoD levels were reported in post-mortem brains, as weil as plasma,
of schizophrenie patients and in rodent brains after chronic treatment with clozapine
and other atypical antipsychotics (Khan et al. 2003, Mahadik et al. 2002, Thomas et
al. 2001 a, 2003c,). This increase was even more significant in clozapine-treated
chronic patients (Mahadik et al. 2002).
222
The Niemann-Pick disease (NPC) is another human genetic disorder affecting
lipid homeostasis that shows altered apoD expression. lt is an inherited Iysosomal
cholesterol disorder whose major phenotypic feature IS a progresssive
neurodegeneration. The anima! mode! of human NPC also shows abnormalities in
cholesterol metabolism and increased apoD levels in plasma, brain, adipose tissue,
heart, thymus and cultured astrocytes (Suresh et al. 1998, Yoshida et al. 1996). ln
particular, strong!y apoD-immuno!abeled cells are present in the brain regions
previously shown to display the most significant neurodegenerative changes (Ong et
al. 2002). Thus, increased synthesis of apoD, a cholesterol transporter, could reflect
an attempt to improve the cellular cholesterol trafficking.
ApoD is normally produced by astrocytes and oligodendrocytes (Boy les et al.
1990b, Patel et al. 1995). Following an acute brain injury in rodents, its expression is
upregulated in astrocytes and is also found in neurons. It is the case following kainic
acid injection (Montpied et al. 1999, Ong et al. 1997), entorhina! cortex lesion
(Terrisse et al. 1999), traumatic brain injury (Franz et al. 1999) and chronic
treatments with MK-80 1, a noncompetitive antagonist of the NMDA glutamate
receptor (O'Donnell et al. 2003). However, apoD expression appears as a distinct
event in glial and neuronal cells. Astrocyte activation is a general response after a
brain lesion. The recovery of neural tissue after an injury is probably in part the result
of an equilibrium between the negative effets of reactive astroglia on axon growth
and the beneficial properties of the substances released by these reactive astroglia,
such as sex steroids (Garcia-Segura et al. 1999). The latter could potentially be
responsible for the local increase in apoD mRN A and protein by either a direct action
on the apoD gene promoter or, indirectly, by causing a growth arrest of astrocytes
that usually appears 3 to 4 days post-Iesion. The production of apoD by neurons,
however, could be a desperate attempt to retrieve essential survival factors such as
steroids or growth factors. Alternatively, apoD expression couId be devoted to the
223
release of toxic molecules. ApoD may be part of the antioxidant defense system and
act as a scavenger to remove heme-related molecules such as bilirubin (Alvarez et al.
2003, Peitsch and Boguski 1990). ApoD clearly has an important function in the
nervous system in both normal and pathological situations.
A1.5 Conclusion
In spite of the quantity of studies on apoD, !ittle is known about its
physiological functions. It seems possible that because of its multi-ligand properties,
apoD acts through different pathways in each tissue or organ where its expression
was reported. Its implication in cellular processes and pathologies high!ights the
importance of understanding the molecular mechanisms controlling its expression.

ANNEXE II
Autre contribution-article en préparation
Modulation of Apolipoprotein D in pregnancy and association with pre
pregnancy body mass index and gestational weight gain
Sonia Do Carmo, Jean-Claude Forest, Yves Giguère, André Masse,
Julie Lafond, Eric Rassart
2009
225
Avant-propos
Ces travaux s'insèrent dans le cadre du projet de recherche du Dr Julie Lafond
visant à mieux comprendre les échanges mère-fœtus. Il semblait judicieux de tester la
modulation de l'apoD au cours de la grossesse. D'abord, les travaux présentés en
chapitre III suggèrent l'importance de l'apoD dans le métabolisme lipidique alors que
les travaux présentés en chapitre II, IV et V démontrent une fonction dans le stress
cellulaire. La grossesse et les dérangements métaboliques qu'elle implique
représentent une période de stress au niveau de l'organisme. Ensuite, la plupart des
apolipoprotéines testées subissent des modulations au courant de la grossesse. De
plus, l'apoD, bien qu'étant une apolipoprotéine atypique, est retrouvée à la surface
des HDL dont les niveaux sont modulés au courant de la gestation. Finalement, elle
est capable de transporter le cholestérol, l'acide arachidonique, la bilirubine et les
hormones stéroïdes, molécules échangées entre la mère et le fœtus. Nous avons donc
dosé l'apoD dans le plasma de femmes classées en neuf groupes selon leur indice de
masse corporelle et leur gain de poids durant la grossesse. Le dosage a été fait à
chacun des trimestres ainsi que dans le sang du nouveau-né à la naissance. Nous
avons corrélé ces concentrations avec d'autres caractéristiques de la grossesse,
incluant les divers dosages sanguins chez la mère, la durée de la gestation et la
grosseur du nouveau-né. Nous avons également examiné les concentrations de l'apoD
et sa corrélation avec divers paramètres gestationels en fonction du niveau de
cholestérol de la mère. Nous avons de plus examiné la transcription de l'apoD au
niveau du placenta chez les neuf groupes de femmes. Nous avons finalement dosé
l'apoD deux mois après l'accouchement afin de déterminer l'effet de l'allaitement sur
le retour aux niveaux de base de l'apoD.
Le design expérimental de ce travail a été réalisé par Julie Lafond. Elle a
également fourni le matériel biologique et l'expertise concernant la physiologie de la
grossesse. J'ai pour ma part effectué les dosages de l'apoD dans le plasma de même

226
que les RT-PCR quantitatifs (qRT-PCR) pour déterminer le niveau d'ARNm dans le
placenta. J'ai également fait la compilation et l'analyse des données et j'ai écrit
l'article.
227
A2.I Résumé
L'apolipoprotéine D (ApoD) est une lipocaline impliquée dans divers processus incluant le transport lipidique, mais sa modulation au courant de la grossesse chez l'humain n'ajamais été examinée. Nous avons analysé la variation de l'ApoD dans le plasma de 151 femmes à chaque trimestre de leur grossesse et dans le placenta en relation avec leur indice de masse corporelle (IMe) et leur gain de poids gestationnel (GPG). Nos résultats démontrent que les niveaux d'ApoD plasmatique diminuent au cours de la grossesse. Cette diminution est plus prononcée chez les femmes ayant un GPG excessif et leurs nouveaux-nés. Chez ces femmes, comme chez d'autres femmes ayant un IMC ou un GPG sous-optimal, la concentration de l'ApoD était associée à plusieurs paramètres lipidiques et la durée gestationnelle, alors que dans le groupe contrôle, elle était seulement corrélée avec les concentrations de cholestérol et d'albumine. Cependant, le fait que les femmes ayant un faible ou un fort taux de cholestérol possèdent des niveaux d'ApoD similaires suggère que la variation de l'ApoD plasmatique n'est pas dépendante du cholestérol. Plus probablement, la diminution des niveaux d' ApoD chez les femmes ayant un GPG excessif est causé par une plus faible transcription de l'ApoD dans le placenta, un site majeur d'expression de l' ApoD. Ce contrôle est perdu chez les femmes obèses. Après l'accouchement, la concentration plasmatique d' ApoD est reliée à l'allaitement, celuici favorisant un retour plus rapide aux concentrations plasmatiques de base. Il est proposé que la diminution de la concentration plasmatique d'ApoD est une réponse adaptative destinée à maintenir l 'homéostasie fœtale. Le mécanisme exact de cette adaptation n'est pas connu. Il pourrait cependant être relié à l'augmentation des niveaux d'oestrogènes durant la grossesse.
Mots-clés: cholestérol, placenta, grossesse, humain, indice de masse corporelle, gain de poids, œstrogène.
228
A2.2 Abstract
Apolipoprotein 0 (ApoD) is a lipocalin involved in many processes including lipid transport, but its modulation during human pregnancy was never examined. We investigated the changes in the levels of ApoD in the plasma of 151 women at each trimester of gestation and in placenta in relation to their prepregnancy body mass index (BMI) and gestational weight gain (GWG). Our results show that plasma ApoD levels decrease during normal uncomplicated pregnancy. ApoD is further decreased in women with excessive GWG and their newborns. In these women, as in other women with suboptimal BMI or GWG, the ApoD concentration was associated with many lipid parameters as weil as gestation duration, while in the control group, it was only correlated with total cholesterol and albumin values. However, the similar ApoD levels in low cholesterol (LC) and high cholesterol (HC) women, suggested that the plasma ApoD variation is not cholesterol dependant. Most probably, the decrease in plasma ApoD levels in women with excessive GWG derived in part from their lower ApoD mRNA production by the placenta, a main site of ApoD transcription. This control was lost in overweight women. After childbirth, the plasma ApoD concentrations depended on if the mother was breast-feeding or not, lactation favoring a faster return to baseline values. It is speculated that the decrease in plasma ApoD concentration during pregnancy is an adaptive response aimed at maintaining fetallipid homeostasis. The exact mechanism of this adaptation is not known. It may, however, be related to pregnancy-induced increase in estrogen levels.
Keywords : cholesterol, placenta, pregnancy, human, body mass index, weight gain, estrogen.
229
A2.3 Introduction
Human pregnancy is associated with profound changes in the maternai lipid,
carbohydrate and protein metabolisms. These changes are aimed at favoring the
maintenance of pregnancy, sustaining fetal growth and brain development, and
facilitating parturition (DeCherney and Pernoll 1994). MaternaI metabolism is
intimately linked with prepregnancy body mass index (BM!) and gestational weight
gain (GWG), which greatly influence the outcome of pregnancy (Nohr et al. 2008). In
association with an unhealthy lifestyle, suboptimal prepregnancy BMI and GWG also
increase the risk of birth defects and chronic health problems in the children (Kaiser
et al. 2008).
The lipid metabolism during pregnancy is characterized by progressive
increases in plasma cholesterol and triglyceride levels accompanied by increases in
low density lipoprotein (LDL) and very low density lipoprotein (VLDL), leading to
maternai hyperlipidemia during late pregnancy (Potter and Nestel 1979). Cholesterol
is essential for optimal embryonic and fetal development. It is an important
component of plasma membranes, is required for cell proliferation and differentiation
and modulates morphogenesis (Porter et al. 1996). It is also used by the placenta for
the synthesis of steroid hormones (Kallen 2004). Triglycerides are also crucial as they
are used as a source of essential fatty acids for the fetus, although they do not directly
cross the placental barrier (Herrera 2000).
Plasma lipid metabolism is regulated in part by the specific apolipoprotein
constituents of the various lipoprotein classes. Apolipoprotein D (ApoD) is a
lipocalin assigned to many putative functions including lipid transport. Its
macromolecular distribution extends from VLDL into very high density lipoproteins
(VHDL) with a maximum concentration in high density lipoproteins 3 (HDL3)
(McConathy and Alaupovic 1976). It is considered an atypical apolipoprotein as both
230
its structure and major sites of synthesis differ from the other apolipoproteins. Indeed,
in human, ApoD is poorly expressed in the liver and intestine while it is highly
expressed in adrenal glands, kidneys, pancreas, placenta, spleen, nervous system,
lungs, avaries and testes (Drayna et al. 1986, Rassart et al. unpublished results).
Several hydrophobie molecules were identified as its potential ligands including
cholesterol (Drayna et al. 1986), bilirubin (Peitsch and Boguski 1990), pregnenolone,
progesterone, estrogens (Dilley et al. 1990, Simard et al. 1991) and arachidonic acid
(Morais Cabral et al. 1995).
ApoD expression is modulated in many situations (for review see Rassart et
al. 2000, van Dijk et al. 2006), namely cellular growth and differentiation (Do Carma
et al. 2002, Lopez-Boado et al. 1994, Simard et al. 1990), cancer (Hunter et al. 2002,
Simard et al. 1990), nervous system pathologies (Bayles et al. 1990a, Terrisse et al.
1998, Thomas et al. 2001 b), inflammation (Do Carma et al. 2007) and oxidative
stress (Ganfornia et al. 2008). ApoD is also involved in gestation and fetus
development. In human, it is up-regulated in endometrium during the window of
uterine receptivity for embryonic implantation (Kao et al. 2002), is highly expressed
in placenta (Drayna et al. 1986) and is found in colustrum and milk (Palmer et al.
2006). Its levels are also increased in fallopian tubes and avaries of gestating
compared ta non-gestating guinea pigs (Provost et al. 1995) but are decreased in
lactating compared ta virgin mouse mammary gland (Cofer and Ross 1996). During
mouse development, ApoD expression is selectively modulated from E9 ta birth
(Sanchez et al. 2002) and in brain, its expression coincides with the periad of active
myelination and synaptogenesis (Gng et al. 1999). The raIe of ApoD in
embryogenesis is not limited ta mammals as it is found in the yolk of the rapidly
growing chicken oocyte, where it might transport lipids or regulatory molecuJes such
as vitamin A and thyroid hormones (Vieira et al. 1995, Yao and Vieira 2002), and
expressed during late chicken embryogenesis (Ganfornina et al. 2005).
231
ln spite of the raie of ApoD in lipid transport and its expression in gestation
related tissues and during fetus development in various species, no information is
available concerning the modulation of ApoD, a secreted protein, throughout human
pregnancy. To address this question, we measured plasma ApoD levels at each
trimester of pregnancy and two months after delivery. We also examined how ApoD
levels are modified by factors affecting lipid metabolism such as maternai
prepregnancy BMI, gestational weight gain and hypercholesterolemia.
232
A2.4 Materials and methods
A2.4.1 Population
The women participating in the study were recruited at their first prenatal
visit, before their tenth week of pregnancy, at the Clinique Fidès of Montréal
(Montréal, QC, Canada) and at the Saint-Luc Hospital's Perinatology Service of the
Centre Hospitalier de l'Université de Montréal (Montréal, QC, Canada), from 2002
2006. This study included 151 pregnant women of similar socio-economic situation.
The study was approved by the ethical committee of Saint-Luc Hospital and
Université du Québec à Montréal (Montréal, QC, Canada). Ali subjects provided
written informed consent. A group of 5 non-pregnant women of similar age was also
included.
A2.4.2 Population classification
The study population was c1assified into nlne groups according to their
prepregnancy BMI and GWG. The normal values for BMI were established at 20-26
kg/m2. The normal values for GWG were established at 11-18 kg. The normal control
group was defined as: BM! 20-26 kg/m2, GWG 11-18 kg. A classification based on
the median plasmatic total cholesterol level at delivery (6,85 mM) was also
established. The low cholesterol group (LC) is composed of women with a
cholesterol concentration inferior to 7 mM (n=38) while the high cholesterol group
(HC) is composed of women with a cholesterol concentration superior to 8 mM
(n=29).
233
A2.4.3 Blood and tissue samples
Blood samples were collected at first (10-17 weeks), second (22-28 weeks),
and third trimester (36-40 weeks) of gestation. A few blood samples were also
collected two months after parturition (postpartum). Newborn blood samples were
retrieved from the umbilical cord (cord blood). The blood samples were centrifuged
15 min at 3500 x g and plasma samples were kept at -20°C until analysis. The
placentas, from vaginal delivery, were obtained from the Centre Hospitalier de
l'Université de Montréal (Montréal, QC, Canada) and were immediately immersed in
Dulbecco's Modified Eagle Medium (DMEM) (Sigma, Oakville, ON, Canada)
supplemented with antibiotics (penicillin, streptomycin and neomycin, Invitrogen,
Burlington, ON, Canada) and NaHC03. After the removal of the amnion, the chorion
and the decidual layer, the placental tissue was cut in 5 cm2 sections, immediately
frozen in liquid nitrogen and kept at -80°C until analysis.
A2.4.4 Plasma biochemistry
The plasma levels of total cholesterol, LDL-cholesterol, HDL-cholesterol,
triglycerides and glucose were individually measured using the Uni Cel 36 DX600
Synchron Clinical System (Beckman-Coulter, Mississauga, ON, Canada) at the
Clinical Biochemistry Service of Saint-François d'Assise Hospital (Québec, QC,
Canada). Total plasma fatty acids were measured by gas phase chromatography.
Plasma insulin and alpha-fetoprotein were measured by an automatic enzymatic
immunological method using a Elecsys automate (Roche Diagnostics, Laval, QC,
Canada) while plasma albumin was analyzed using an Hitachi 717 device (Roche
Diagnostics). ApoA- 1 and ApoB- 100 levels were measured by RIA or ELISA
methods at the Centre Hospitalier Universitaire de Québec (Québec, QC, Canada).
ApoD IcveJs were measured by competitive ELISA using the human ApoD

234
monoclonal antibody 2B9 as previously described (TelTisse et al. 1998). Briefly,
microtiter plates were coated with antigen (1 flg ApoD/ml) ovemight at 4°C in 5 mM
glycin buffer (pH 9.2). Unreacted sites were blocked with PBS-BSA 1% for 1 h. A
mixture containing diluted plasma and 2B9 antibody in PBS-BSA 1% then replaced
the saturation solution. Bound 2B9 antibody was detected by peroxidase 1abeled anti
mouse IgG (KPL, Gaithersburg, MD) and revealed with ABTS substrate (KPL).
Optical density was measured at 410 nm. Ali quantifications were performed in
triplicate.
A2.4.S RNA isolation and quantitative Real-Time PCR (qRT-PCR)
Total RNA was prepared from 25 mg of placenta1 tissue using the High Pure
RNA Tissue Kit (Roche Diagnostics) according to the manufacturer's instructions.
Subsequently, cDNA was obtained by reverse transcription of total RNA using the
Omniscript RT kit (Qiagen, Mississauga, ON, Canada). The quantification of ApoD
and 18S transcripts were assessed by qRT-PCR using the LightCycler 480 SYBR
Green l Master and the LightCycler 480 instrument and software (Roche
Diagnostics). For each gene, diluted amounts of known templates provided
quantitative standard curves from which cDNA copy number in clinical samples
could be determined. ApoD transcript expression was then normalized versus the
housekeeping gene l8S. The following primers were used in qRT-PCR: ApoD
forward primer, S'-CAT CTT GGG AAG TGC CCC AA-3'; ApoD reverse primer, 5'
CCA TCA GCT CTC AAC TCC TGG TTT-3'; 18S forward primer, S'-CGC CGC
TAG AGG TGA AAT TC-3'; 18S reverse primer, 5'-TTG GCA AAT GCT TTC
GCT C-3'.
235
A2.4.6 Statistical analyses
Data were expressed as means ± SEM and analyzed with unpaired Student's t
test or with one-way ANGVA and Turkey-Kramer post-test for multiple
comparisons. Results were considered significant at p < 0.05. The association
between two variables of the same population was assessed using Pearson's
correlation coefficient. AU statistical analyses were performed using Prism 4.0
(GraphPad Software, San Diego, CA, USA).
236
A2.S Results
A2.S.1 Population characteristics
As shown in Table A2.1, the 151 pregnant women participating to this study
were classified into nine groups according to their prepregnancy BMI and GWG.
GWG had a greater impact on group characteristics than BMI. Thus, especially in
groups with normal or high BMI, high GWG was associated with lower levels of total
cholesterol, LDL-cholesterol and to a less extent HDL-cholesterol. ApoB-100 and
alphafetoprotein were also affected by GWG. However, while suboptimal GWG
induced decreases in ApoB-100 concentration in the normal and high BMI groups,
alphafetoprotein was affected by GWG mainly in low BM! groups. Suboptimal GWG
had the strongest impact in the high BMI group. ft decreased the duration of gestation
(gestational age), total cholesterol, LDL-cholesterol and ApoB-1 00 values. Free fatty
acids levels were decreased in the most extreme groups, that is women with low BMI
and GWG and women with high BM! and GWG. Finally, sorne groups had
distinctive characteristics. The group with high BMI and high GWG had lower levels
of ail lipid parameters except triglycerides and reduced albumin levels. On the other
hand, the group with normal BMI and low GWG had low triglyceride and ApoB-1 00
concentrations and smaller newborns. ln spite of these differences, ail groups had
similar glucose levels at their third trimester of gestation (Table A2.1).
A2.5.2 Plasma ApoD levels decrease during pregnancy
Plasma ApoD levels were measured in women at each trimester of pregnancy.
ln the control group (BMI 20-26 kg/m2, GWG 11-18 kg), plasma ApoD concentration
declined early in pregnancy as its levels were already reduced by 40% at the first
trimester of pregnancy compared to non-pregnant women (Fig. A2.1). ApoD levels
continued to progressively decrease at the second trimester and at third trimester of
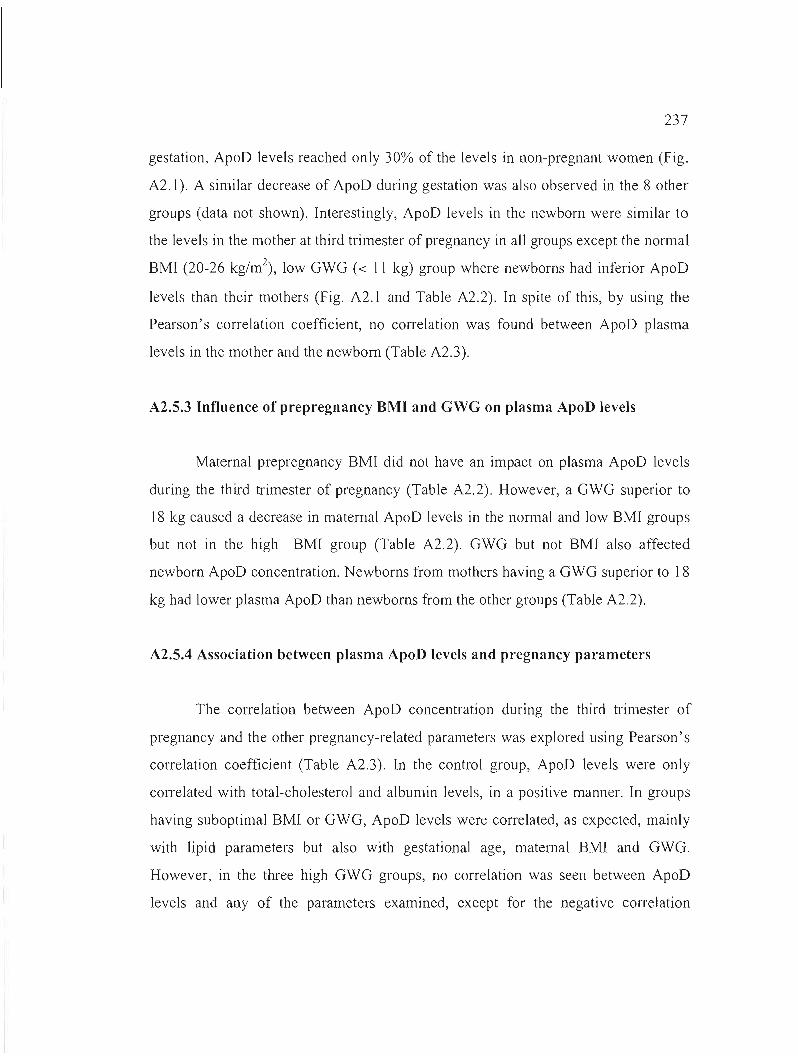
237
gestation, ApoD levels reached only 30% of the levels in non-pregnant women (Fig.
A2.1). A similar decrease of ApoD during gestation was also observed in the 8 other
groups (data not shown). Interestingly, ApoD levels in the newborn were similar ta
the levels in the mother at third trimester of pregnancy in ail groups except the normal
BMI (20-26 kg/m2), low GWG « Il kg) group where newborns had inferior ApoD
levels than their mothers (Fig. A2.1 and Table A2.2). In spite of this, by using the
Pearson's correlation coefficient, no correlation was found between ApoD plasma
levels in the mother and the newborn (Table A2.3).
A2.5.3 Influence of prepregnancy BMI and GWG on plasma ApoD levels
Maternai prepregnancy BMI did not have an impact on plasma ApoD levels
during the third trimester of pregnancy (Table A2.2). However, a GWG superior to
18 kg caused a decrease in maternai ApoD levels in the normal and low BMI groups
but not in the high BMI group (Table A2.2). GWG but not BMI also affected
newborn ApoD concentration. Newborns from mothers having a GWG superior to 18
kg had lower plasma ApoD than newborns from the other groups (Table A2.2).
A2.5.4 Association between plasma ApoD levels and pregnancy parameters
The correlation between ApoD concentration during the third trimester of
pregnancy and the other pregnancy-related parameters was explored using Pearson's
correlation coefficient (Table A2.3). In the control group, ApoD levels were only
correlated with total-cholesterol and albumin levels, in a positive manner. In groups
having suboptimal BMI or GWG, ApoD levels were correlated, as expected, mainly
with lipid parameters but also with gestational age, maternai BMI and GWG.
However, in the three high GWG groups, no correlation was seen between ApoD
levcls and any of the parameters examined, except for the negative correlation
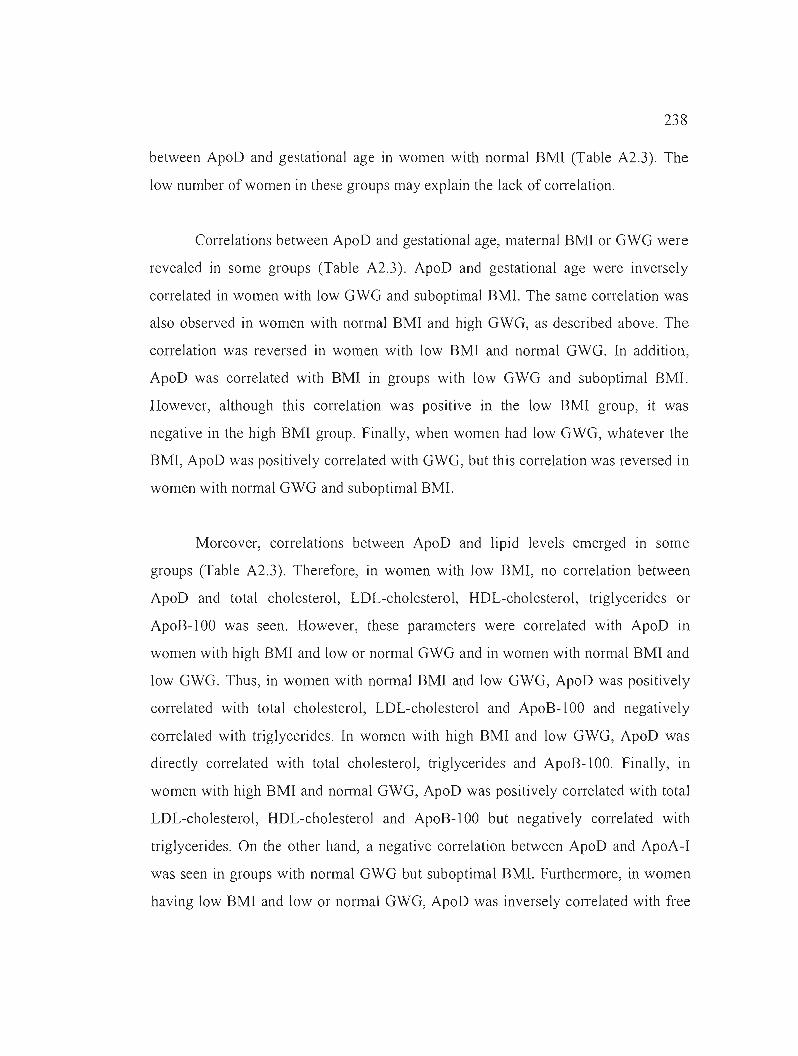
238
between ApoD and gestational age in women with normal BMI (Table A2.3). The
low number of women in these groups may explain the lack of correlation.
Correlations between ApoD and gestational age, maternai BMI or GWG were
revealed in sorne groups (Table A2.3). ApoD and gestational age were inversely
correlated in women with low GWG and suboptimal BMI. The same correlation was
also observed in women with normal BMI and high GWG, as described above. The
correlation was reversed in women with low BMI and normal GWG. In addition,
ApoD was correlated with BMI in groups with low GWG and suboptimal BMI.
However, although this correlation was positive in the low BMI group, it was
negative in the high BMI group. Finally, when women had low GWG, whatever the
BMI, ApoD was positively correlated with GWG, but this correlation was reversed in
women with normal GWG and suboptimal BMI.
Moreover, correlations between ApoD and lipid levels emerged in sorne
groups (Table A2.3). Therefore, in women with low BMI, no correlation between
ApoD and total cholesterol, LDL-cholesterol, HDL-cholesterol, triglycerides or
ApoB-lOO was seen. However, these parameters were correlated with ApoD ll1
women with high BMI and low or normal GWG and in women with normal BMI and
low GWG. Thus, in women with nonnal BMI and low GWG, ApoD was positively
correlated with total cholesterol, LDL-cholesterol and ApoB-lOO and negatively
correlated with triglycerides. ln women with high BMI and low GWG, ApoD was
directly correlated with total cholesterol, triglycerides and ApoB-lOO. Finally, in
women with high BMI and nonnal GWG, ApoD was positively correlated with total
LDL-cholesterol, HDL-cholesterol and ApoB-lOO but negatively correlated with
triglycerides. On the other hand, a negative correlation between ApoD and ApoA-i
was seen in groups with normal GWG but suboptimal BMI. Furthermore, in women
having low BMI and low or normal GWG, ApoD was inversely correlated with free
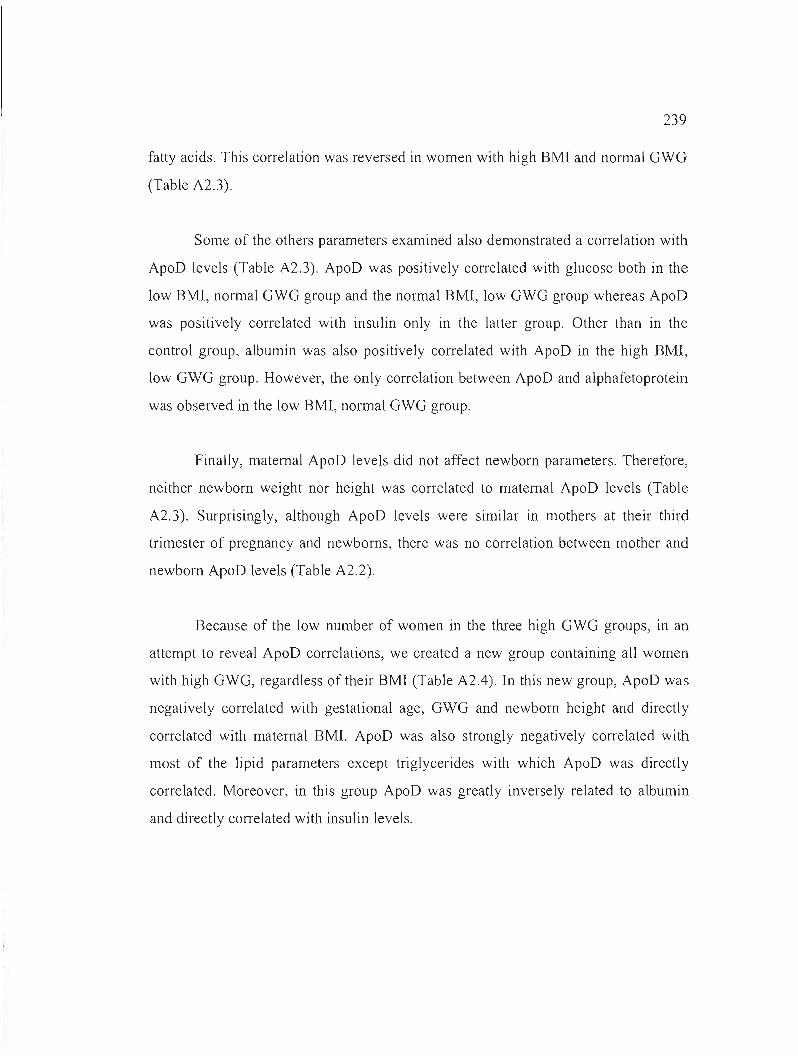
239
fatty acids. This correlation was reversed in women with high BMI and normal GWG
(Table A2.3).
Sorne of the others parameters examined also demonstrated a correlation with
ApoD levels (Table A2.3). ApoD was positively correlated with glucose both in the
low BMI, normal GWG group and the normal BMI, low GWG group whereas ApoD
was positively correlated with insu lin only in the latter group. Other than in the
control group, albumin was also positively correlated with ApoD in the high BMI,
low GWG group. However, the only correlation between ApoD and alphafetoprotein
was observed in the low BMI, normal GWG group.
Finally, maternaI ApoD levels did not affect newborn parameters. Therefore,
neither newborn weight nor height was correlated to maternaI ApoD levels (Table
A2.3). Surprisingly, although ApoD levels were similar in mothers at their third
trimester of pregnancy and newborns, there was no correlation between mother and
newborn ApoD levels (Table A2.2).
Because of the low number of women in the three high GWG groups, in an
attempt to reveal ApoD correlations, we created a new group containing ail women
with high GWG, regardless of their BMI (Table A2.4). ln this new group, ApoD was
negatively correlated with gestational age, GWG and newborn height and directly
correlated with maternai BMI. ApoD was also strongly negatively correlated with
most of the lipid parameters except triglycerides with which ApoD was directly
correlated. Moreover, in this group ApoD was greatly inversely related to albumin
and directly conelated with insulin levels.
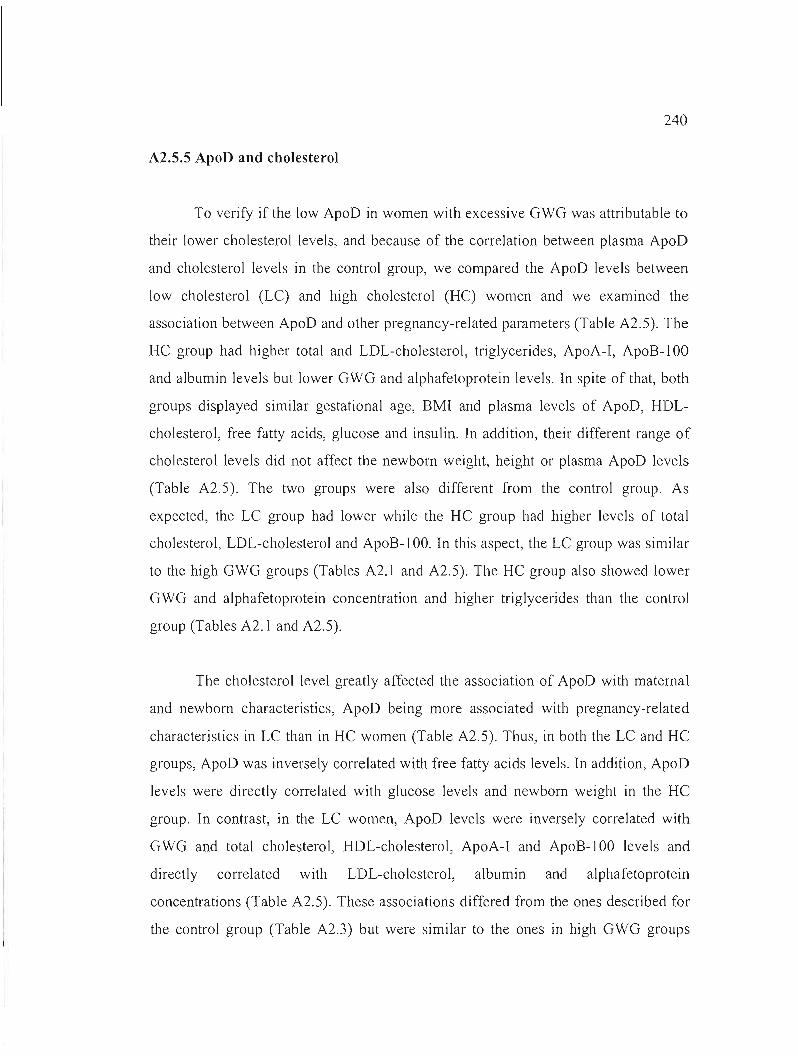
240
A2.S.S ApoD and cholesterol
To verify if the low ApoD in women with excessive GWG was attributable to
their lower cholesterol levels, and because of the correlation between plasma ApoD
and cholesterol levels in the control group, we compared the ApoD levels between
low cholesterol (Le) and high cholesterol (He) women and we examined the
association between ApoD and other pregnancy-related parameters (Table A2.S). The
HC group had higher total and LDL-cholesterol, triglycerides, ApoA-I, ApoB-IOO
and albumin levels but lower GWG and alphafetoprotein levels. In spite of that, both
groups displayed similar gestational age, BMI and plasma levels of ApoD, HDL
cholesterol, free fatty acids, glucose and insulin. In addition, their different range of
cholesterol levels did not affect the newborn weight, height or plasma ApoD levels
(Table A2.S). The two groups were also different from the control group. As
expected, the LC group had lower while the HC group had higher levels of total
cholesterol, LDL-cholesterol and ApoB-1 00. In this aspect, the LC group was similar
to the high GWG groups (Tables A2.1 and A2.S). The HC group also showed lower
GWG and alphafetoprotein concentration and higher triglycerides than the control
group (Tables A2.1 and A2.S).
The cholesterol level greatly affected the association of ApoD with maternai
and newborn characteristics, ApoD being more associated with pregnancy-related
characteristics in LC than in HC women (Table A2.S). Thus, in both the LC and HC
groups, ApoD was inversely correlated with free fatty acids levels. In addition, ApoD
levels were directly correlated with glucose levels and newborn weight in the HC
group. In contrast, in the LC women, ApoD levels were inversely correlated with
GWG and total cholesterol, HDL-cholesterol, ApoA-I and ApoB-IOO levels and
directly correlated with LDL-cholesterol, albumin and alphafetoprotein
concentrations (Table A2.S). These associations differed from the ones described for
the control group (Table A2.3) but were similar to the ones in high GWG groups
241
(Tables A2.3 and A2.4), although the association with LDL-cholesterol was reversed
and there was no conelation with triglycerides and insulin values.
A2.S.6 ApoD transcription in placenta
Because of the high levels of ApoD mRNA in human placenta and the
importance of this tissue in fetal development, we examined placental ApoD
expression in relation to maternaI BMI and GWG. Besides its influence on plasma
ApoD levels (Table A2.2), maternai GWG also affected placental ApoD transcription
(Fig. A2.2). However, in contrast to plasma, ApoD transcript levels were decreased in
both low and high GWG compared with normal GWG groups. This pattern was
mostly noticed in women with normal or low BMI but, although not significant, this
tendency was also observed in women with high BMl.
A2.S.? Postpartum plasma ApoD levels
Given the fact that plasma ApoD levels were decreased by 70% at the end of
pregnancy, we examined ApoD levels in control women after delivery and whether
these levels were affected by lactation (Fig. A2.3). Two months after delivery, breast
feeding (lactating) women had plasma ApoD levels similar to non-pregnant women.
However, in bottle-feeding (non-lactating) women, ApoD concentration was
comparable to third trimester levels.
242
A2.6 Discussion
This study is the first to our knowledge to demonstrate that plasma ApoD
levels decrease during pregnancy. Plasma ApoD levels were already significantly
lower during first trimester of pregnancy than values detected in non-pregnant women
and continued to decrease until the end of pregnancy. The mechanisms governing this
decrease are currently unknown, but many potential reasons cou Id explain it.
As for albumin, which concentration decreases from 30% during pregnancy
(Maher et al. 1993), the decrease in plasma ApoD levels could be explained by
hemodilution. Maternai blood volume increases until term and although dependant on
many factors, the average increase in volume at term is 45-50% (Hytten 1985). Still,
hemodilution alone cannot explain the observed 70% decrease of plasma ApoD.
Low levels of plasma ApoD couId also result from decreased ApoD synthesis
or secretion. Plasma ApoD can originate from many sources, one of which being the
placenta. Since ApoD mRNA levels are almost as high in placenta as in adrenal
glands and spleen (Drayna et al. 1986), major sources of ApoD in non-pregnant
humans, decreased ApoD transcription is unlikely the origin of low plasma ApoD
concentration. Another argument against ApoD transcriptional downregulation is the
presence of oxidative and inflammatory markers mostly in complicated but also in
normal pregnancies (Fialova et al. 2006). Oxidative stress (Do Carmo et al. 2007,
Ganfomina et al. 2008) and inflammation (Do Carmo et al. 2007) were both reported
as intensifying ApoD mRNA production. ApoD decrease could also be caused by the
inhibition of its translation or the increase of its degradation rate. More likely, the
decline in ApoD levels could be imputable to its reduced secretion during pregnancy.
In breast or prostate cancer cells, ApoD secretion is stimulated by IL-l alpha (Blais et
al. 1994), androgens, glucocorticoids (Simard et al. 1990, 1991, 1992), retinoic acid
(Lopez-Boado et al. 1994) and l ,25-dihydroxyvitamin D3 (Lopez-Boado et al. 1997)
243
and inhibited by IL-6 (Blais et al. 1995) and estrogens (Simard et al. 1990). Estrogens
are greatly increased during pregnancy. Estrogen values, already high at first
trimester, continue to increase until the third trimester to reach levels more than 100
fold higher than the non-pregnant levels (Alvarez et al. 1996, Soldin et al. 2005). As
prolonged exposure to physio10gical concentrations of 17 beta-estradiol inhibited
markedly (70-90%) ApoD secretion in human breast cells (Simard et al. 1990), high
estrogen concentrations, as seen during gestation, could be the root of plasma ApoD
decrease.
This reduction in ApoD secretion might take place not only in tissues directly
related to pregnancy such as placenta, uterus and mammary gland but also in other
tissues expressing high leve1s of ApoD mRNA and whose physiology is altered in
response to gestation-induced hormonal changes, including the spleen, adrenals,
pancreas and kidneys (Bender and Chickering 1985, Maymon et al. 2007, Novak et
al. 2001). Assuming that ApoD synthesis and degradation rates remain unchanged, a
reduced secretion will result in ApoD accumulation inside these tissues, suggesting
an intratissular role for ApoD in pregnancy. ln the placenta, in collaboration with
other mo1ecu1es, ApoD could play a key role in the transport of essential nutrients,
regulation factors and toxic metabolites between the mother and the fetus, thus
influencing fetal development and health in later life. Those couId include cholesterol
(Drayna et al. 1986), arachidonic acid (Lafond et al. 2000, Morais Cabral et al.
1995), steroids (Dilley et al. 1990, Simard et al. 1991), vitamin A and thyroid
hormones (Yao and Vieira 2002) as well as the removal of bilirubin (Peitsch and
Boguski 1990).
It was already reported that ApoD levels in newborns represent about 37% of
the 1evels found in adults (Lane and McConathy 1983, McConathy and Lane 1980).
Accordingly, we observed that the concentration of circu1ating ApoD in the newborn
was very similar to the one of the mother at the third trimester of pregnancy, although
244
the levels found in the newborn and in the mother were not statistically correlated.
This lack of correlation suggests that ApoD does not pass through the placenta!
barrier. Since ApoD mRNA is expressed as early as E8.5 during mouse
embryogenesis (Sanchez et al. 2002), the fetus might not be dependent on a maternai
ApoD supply. Furthermore, the similarity in mother and newborn ApoD
concentrations suggests that even if maternai plasma ApoD does not directly cross the
placental barrier, both might be subjected to the same regulatory mechanisms.
An exception to the close match between maternai and newborn ApoD levels
was found in the group displaying normal maternai BMI (20-26 kg/m2) and low
GWG « 11 kg). This difference could be related to the lower maternai triglycerides
and ApoB- LOO levels. As triglycerides, a source of fatty acids, and ApoB- LOO, which
influences the transfer of cholesterol and Iipid soluble vitamins, are both essential for
fetus development (Madsen et al. 2004), their low levels probably explain the smaller
size of the newborns as weil as the low levels of ApoD.
We also observed that, while prepregnancy maternaI BMI had no incidence on
plasma ApoD concentrations on both mother and newborn, high GWG (> L8 kg)
significantly decreased ApoD values. This decrease is very Iikely multifactorial. First,
it could be related to defects in Iipid metabolism. Indeed, high GWG groups
displayed lower levels of total cholesterol, LDL-cholesterol, and ApoB-l 00. This was
present in normal, high and pooled BMI groups but the tendency, although not
significant, was also observed in the low BMI group. In addition, in the group
composed of ail women with high GWG regardless of their BMI, ApoD and lipid
markers were strongly correlated. An involvement of ApoD in Iipid metabolism was
already suggested. Because of its capacity to bind cholesterol (Drayna et al. 1986)
and its presence on lipoprotein fractions (McConathy and Alaupovic L976), ApoD, in
collaboration with apoA-I, lecithin-cholesterol acyltransferase (LCAT) and
cholesteryl ester transfer protein (CETP) (Francone et al. L989), may participate in
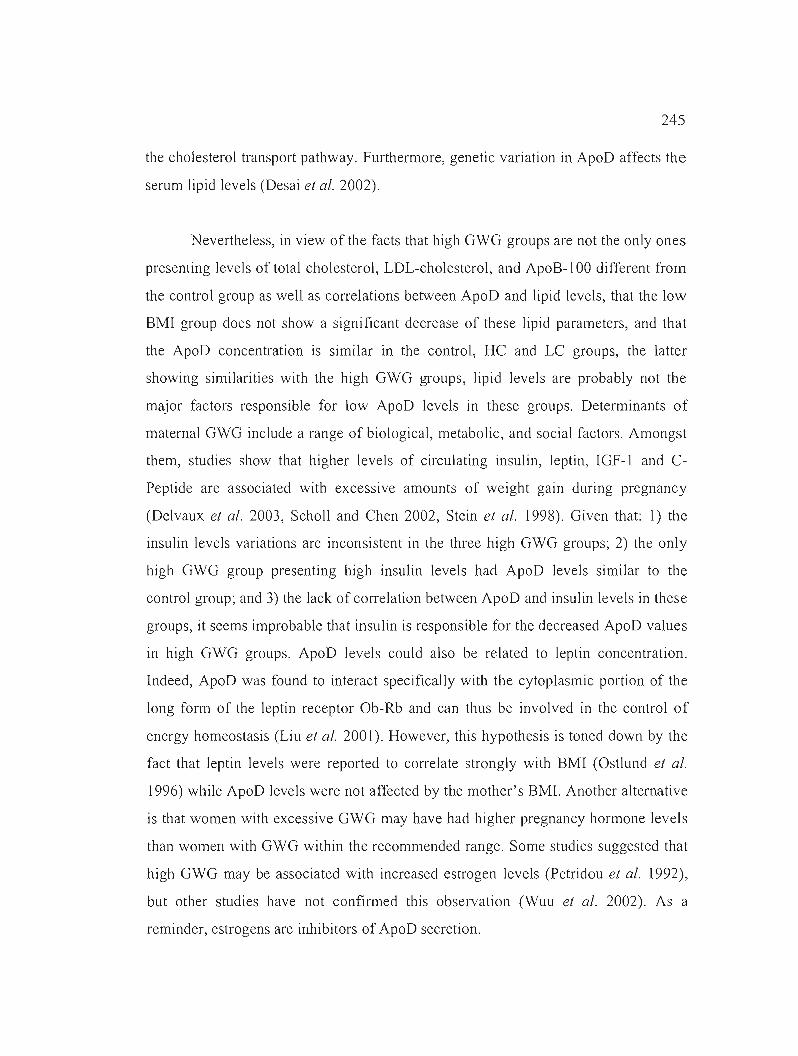
245
the cholesterol transport pathway. Furthermore, genetic variation in ApoD affects the
serum lipid levels (Desai et al. 2002).
Nevertheless, in view of the facts that high GWG groups are not the only ones
presenting levels of total cholesterol, LDL-cholesterol, and ApoB-l 00 different from
the control group as weil as correlations between ApoD and lipid levels, that the low
BM! group does not show a significant decrease of these lipid parameters, and that
the ApoD concentration is similar in the control, HC and LC groups, the latter
showing similarities with the high GWG groups, lipid levels are probably not the
major factors responsible for low ApoD levels in these groups. Determinants of
maternai GWG include a range of biological, metabolic, and social factors. Amongst
them, studies show that higher levels of circulating insulin, leptin, IGF-l and C
Peptide are associated with excessive amounts of weight gain during pregnancy
(Delvaux et al. 2003, Scholl and Chen 2002, Stein et al. 1998). Given that: 1) the
insulin levels variations are inconsistent in the three high GWG groups; 2) the only
high GWG group presenting high insulin levels had ApoD levels similar to the
control group; and 3) the lack of correlation between ApoD and insulin levels in these
groups, it seems improbable that insulin is responsible for the decreased ApoD values
in high GWG groups. ApoD levels could also be related to leptin concentration.
Indeed, ApoD was found to interact specifically with the cytoplasmic portion of the
long form of the leptin receptor Ob-Rb and can thus be involved in the control of
energy homeostasis (Liu et al. 2001). However, this hypothesis is toned down by the
fact that leptin levels were reported to correlate strongly with BM! (Ostlund et al.
1996) while ApoD levels were not affected by the mother's BMI. Another alternative
is that women with excessive GWG may have had higher pregnancy hormone levels
than women with GWG within the recommended range. Sorne studies suggested that
high GWG may be associated with increased estrogen levels (Petridou et al. 1992),
but other studies have not confirmed this observation (Wuu et al. 2002). As a
reminder, estrogens are inhibitors of ApoD secretion.
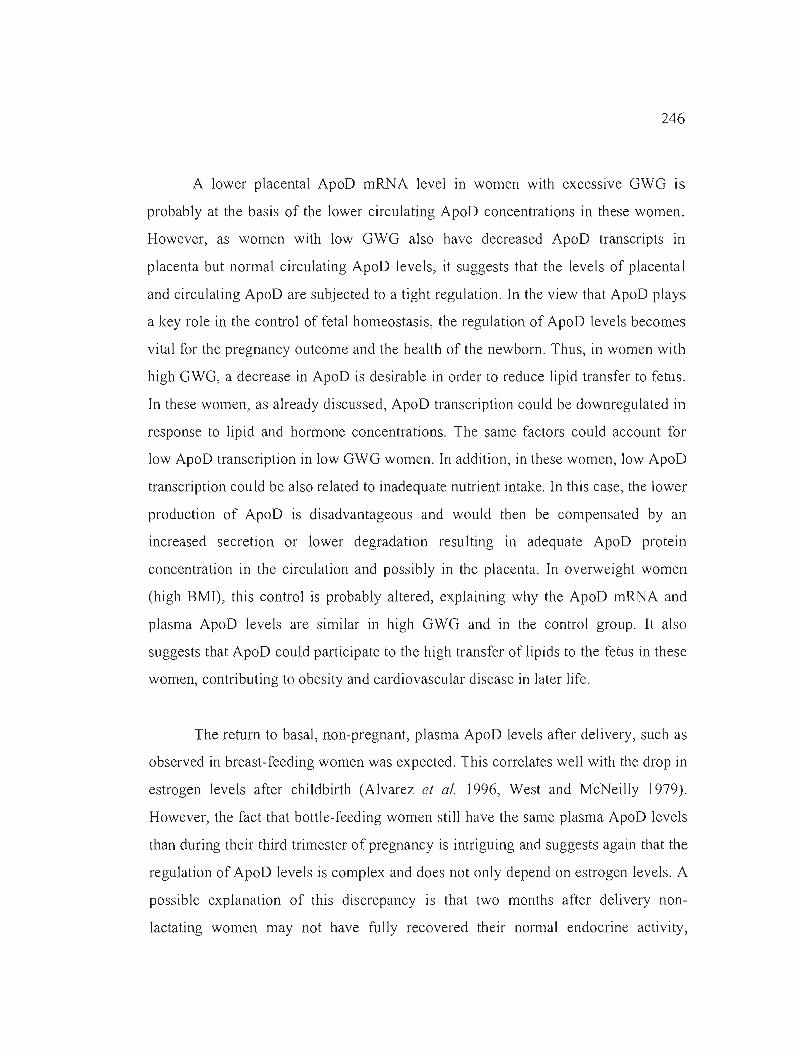
246
A lower placental ApoD mRNA level in women with excessive GWG is
probably at the basis of the lower circulating ApoD concentrations in these women.
However, as women with low GWG also have decreased ApoD transcripts in
placenta but normal circulating ApoD levels, it suggests that the levels of placental
and circulating ApoD are subjected to a tight regulation. ln the view that ApoD plays
a key role in the control of fetal homeostasis, the regulation of ApoD levels becomes
vital for the pregnancy outcome and the health of the newborn. Thus, in women with
high GWG, a decrease in ApoD is desirable in order to reduce lipid transfer to fetus.
ln these women, as already discussed, ApoD transcription could be downregulated in
response to lipid and hormone concentrations. The same factors could account for
low ApoD transcription in low GWG women. ln addition, in these women, low ApoD
transcription could be also related to inadequate nu trient intake. ln this case, the lower
production of ApoD is disadvantageous and would then be compensated by an
increased secretion or lower degradation resulting in adequate ApoD protein
concentration in the circulation and possibly in the placenta. ln overweight women
(high BMI), this control is probably altered, explaining why the ApoD mRNA and
plasma ApoD levels are similar in high GWG and in the control group. lt also
suggests that ApoD could participate to the high transfer of lipids to the fetus in these
women, contributing ta obesity and cardiovascular disease in later life.
The retum to basal, non-pregnant, plasma ApoD levels after delivery, such as
observed in breast-feeding women was expected. This correlates weil with the drop in
estrogen levels after childbirth (Alvarez et al. 1996, West and McNeilly 1979).
However, the fact that bottle-feeding women still have the same plasma ApoD levels
than during their third trimester of pregnancy is intriguing and suggests again that the
regulation of ApoD levels is complex and does not only depend on estrogen levels. A
possible explanation of this discrepancy is that two months after delivery non
lactating women may not have fully recovered their normal endocrine activity,
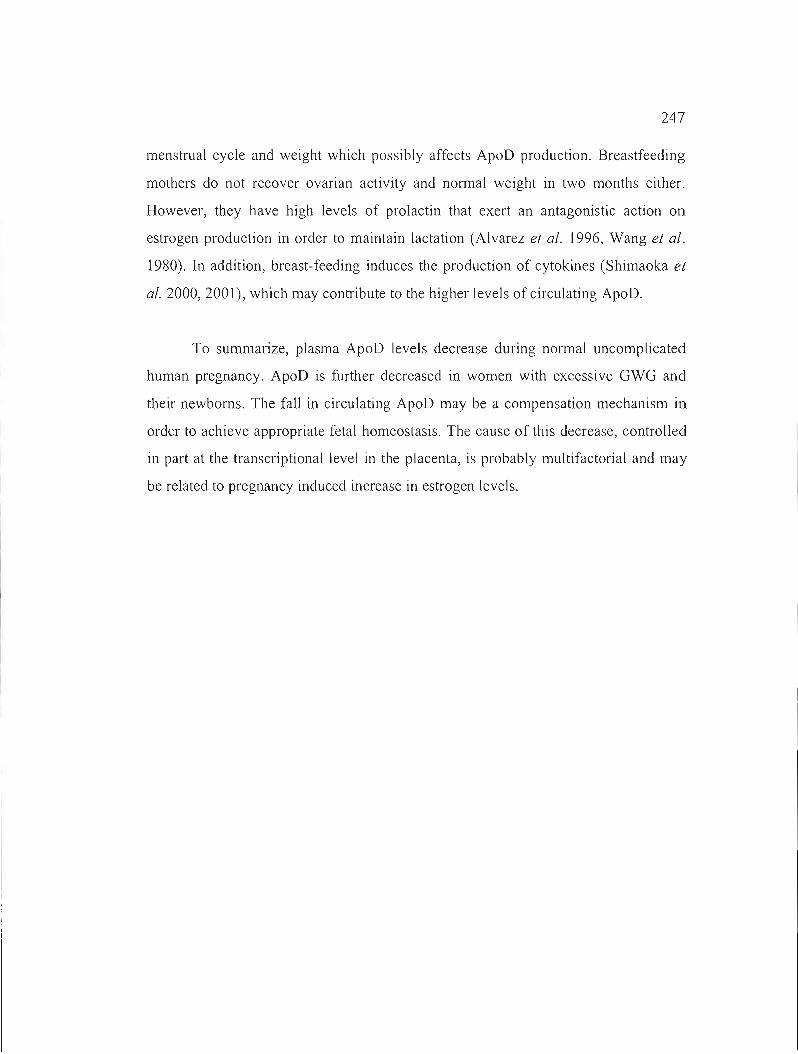
247
menstrual cycle and weight which possibly affects ApoD production. Breastfeeding
mothers do not recover ovarian activity and normal weight in two months either.
However, they have high levels of prolactin that exert an antagonistic action on
estrogen production in order to maintain lactation (Alvarez et al. 1996, Wang et al.
1980). In addition, breast-feeding induces the production of cytokines (Shimaoka et
al. 2000,2001), which may contribute to the higher levels of circulating ApoD.
To summarize, plasma ApoD levels decrease during normal uncomplicated
human pregnancy. ApoD is further decreased in women with excessive GWG and
their newborns. The faU in circulating ApoD may be a compensation mechanism in
order to achieve appropriate fetal homeostasis. The cause of this decrease, controUed
in part at the transcriptional level in the placenta, is probably multifactorial and may
be related to pregnancy induced increase in estrogen levels.
248
Table A2.I : Clinical and biochemical characteristics of the studied population
during the third trimester of pregnancy. Data are organized according to maternaI
body mass index (BMI) at first trimester of pregnancy and weight gain during
pregnancy (GWG). Results are expressed as mean ± SE. * The same letter within one
parameter means no statistical differences between groups; different letters indicate
significant differences between the corresponding groups (p < 0.01).
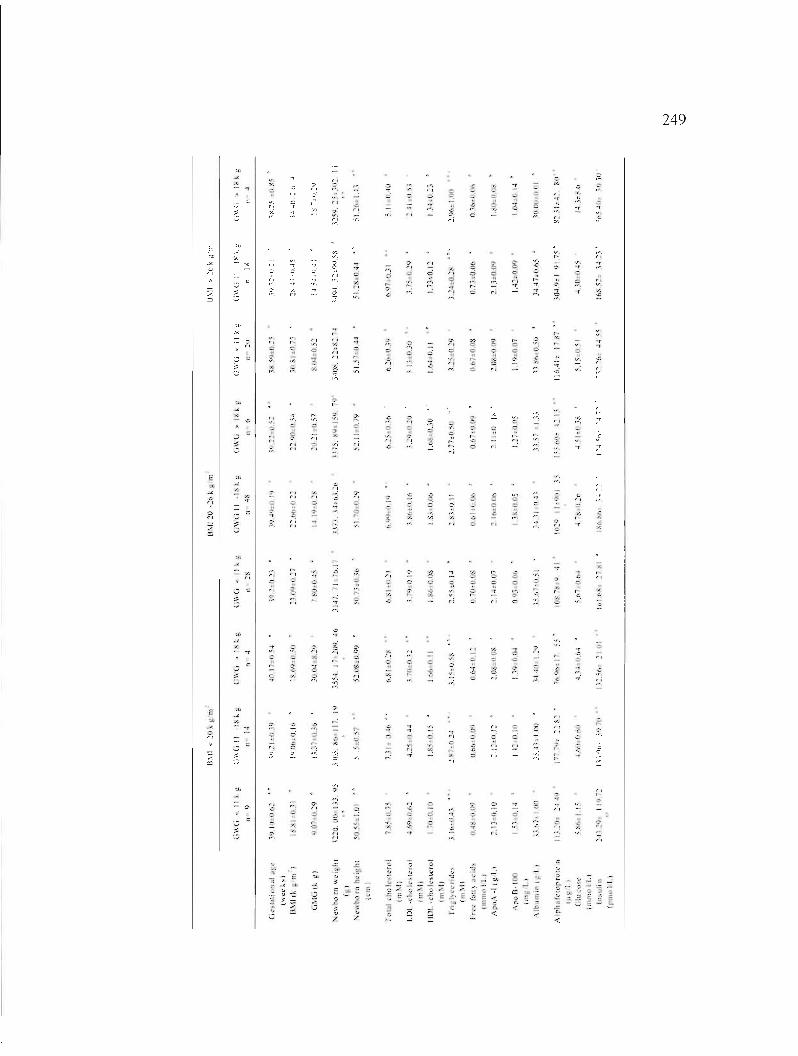
249
,n .., ,.. " ".
0-. "
",.
'/~.,. .,., " oc.
.,., o y. r'
6 ...,., "0'. -/.. c
.,. " t 'l.,.,
" VOo
ci 10
-:1 :;
C 'l
~j
l' X
..,
"
.,.,
·r;
, '1
'" r, 0'.. '
"., ,~
"
.., "
'".,
"~.
~,
ri -,".
c
"
.~ '"
...:
".
,;
c., S'. -, ., .,. 0' •
,;
., J.
'" ".
,.. '
.,., .,r, ç
,;
" ~ .,
.~
"0 o~
",0' o
-'7>
,;
="t-,' "
" -, "
'>
l - 0,
1~1 " .. ~ '-:
g ~
;" ~ ,'"
:: ~. E .71 !~ ~
'C
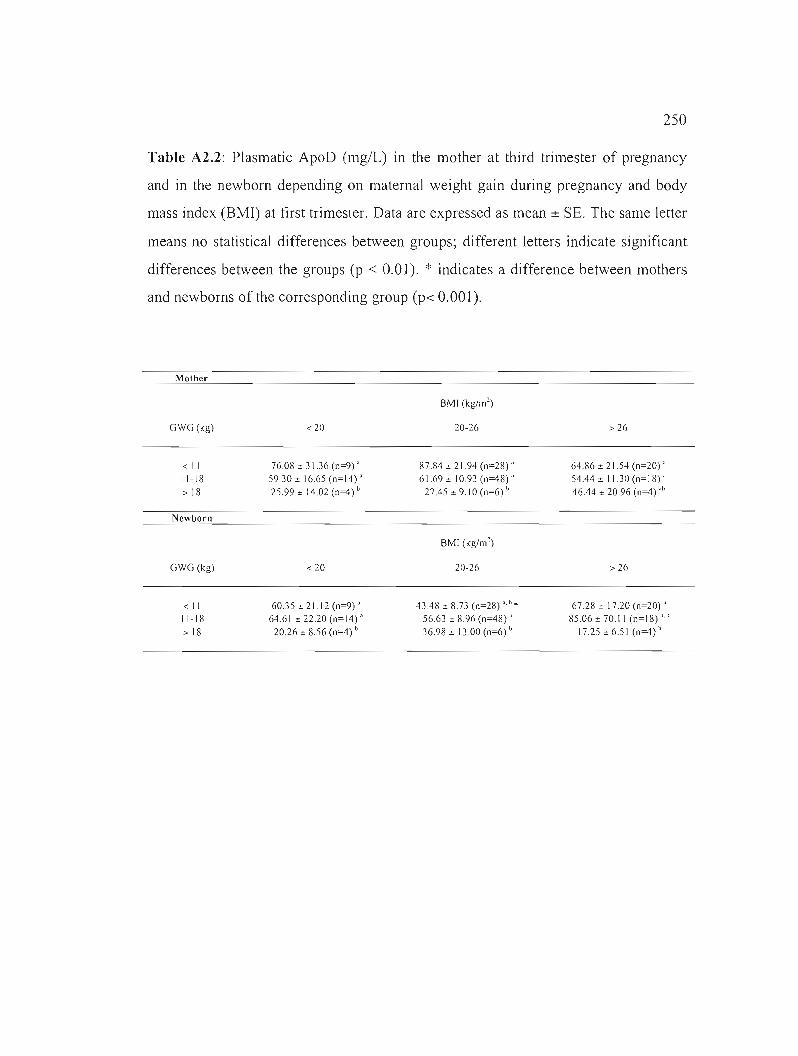
250
Table A2.2: Plasmatic ApoD (mg/L) in the mother at third trimester of pregnancy
and in the newborn depending on maternai weight gain during pregnancy and body
mass index (BMI) at first trimester. Data are expressed as mean ± SE. The same letter
means no statistical differences between groups; different letters indicate significant
differences between the groups (p < 0.01). * indicates a difference between mothers
and newborns of the corresponding group (p< 0.001).
Mothcr
BMI (kg/m')
GWG (kg) < 20 20-26 > 26
< Il 76.08 :!: 31.36 (n=9) , 87.84 :!: 21.94 (n=28), 64.86 :!: 2154 (n=20)" 11-18 59.30:!: 16.65 (n=14)" 61.69:!: 10.93 (n=48)' 54.44:!: 11.30 (n=18)' > 18 25.99:!: 14.02 (n=4) b 27.45:!: 9.10 (n=6) b 46.44 :!: 2096 (n=4) "h
Ncwborn
BMI (kg/m')
GWG (kg) < 20 20-26 > 26
<II 60.35 :!: 21.12 (n=9) , 43.48 :!: 8.73 (n=28) •. b. 6728:!: 17.20 (n~20)·'
11-18 64.61 :!: 22.20 (n=14)" 56.63 :!: 8.96 (n=48) , 85.06:!: 70.11 (n=18) ".h
> 18 20.26:!: 8.56 (n=4) h 36.98 :!: 13 .00 (n=6) b 17.25 :!: 6.51 (n=4) b

251
Table A2.3: Association of plasma ApoD levels with clinical and biochemical
characteristics in women at their third trimester. Pearson correlations (r) are
significant at * p<O.05, ** p<O.05, ***p<O.OO 1.
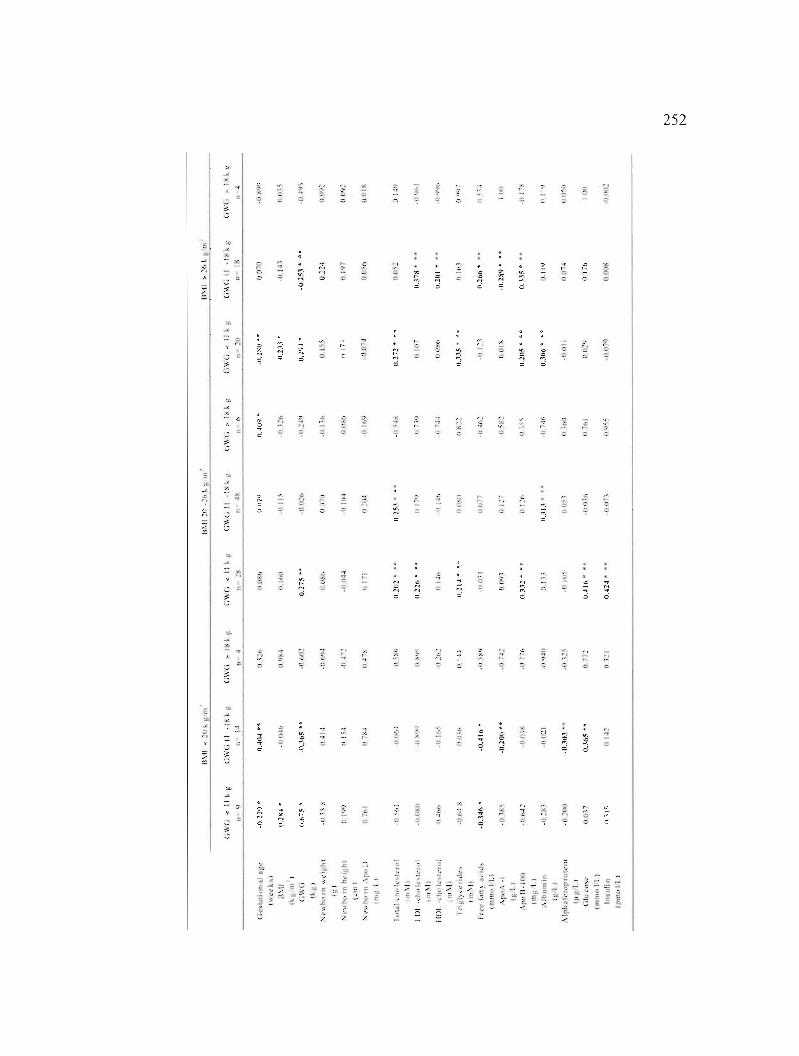
252
i '. ~
:.(,
..., .,' . 1 ., .,
:: ~:
;; -.,.. ::
.,.:: ;:
:: -,-. . D
., ci
" ". ·"-1 r., ,"., /. ...,,. ..
"
Y. 1
., ~
. 'r,::. ci
'..,
' .,.
~ , ;: .... ::: :: ~.::.-~
'J _ "
c:. ~ ~ - .~
::'::. ::..'= ~-;,;
Ë
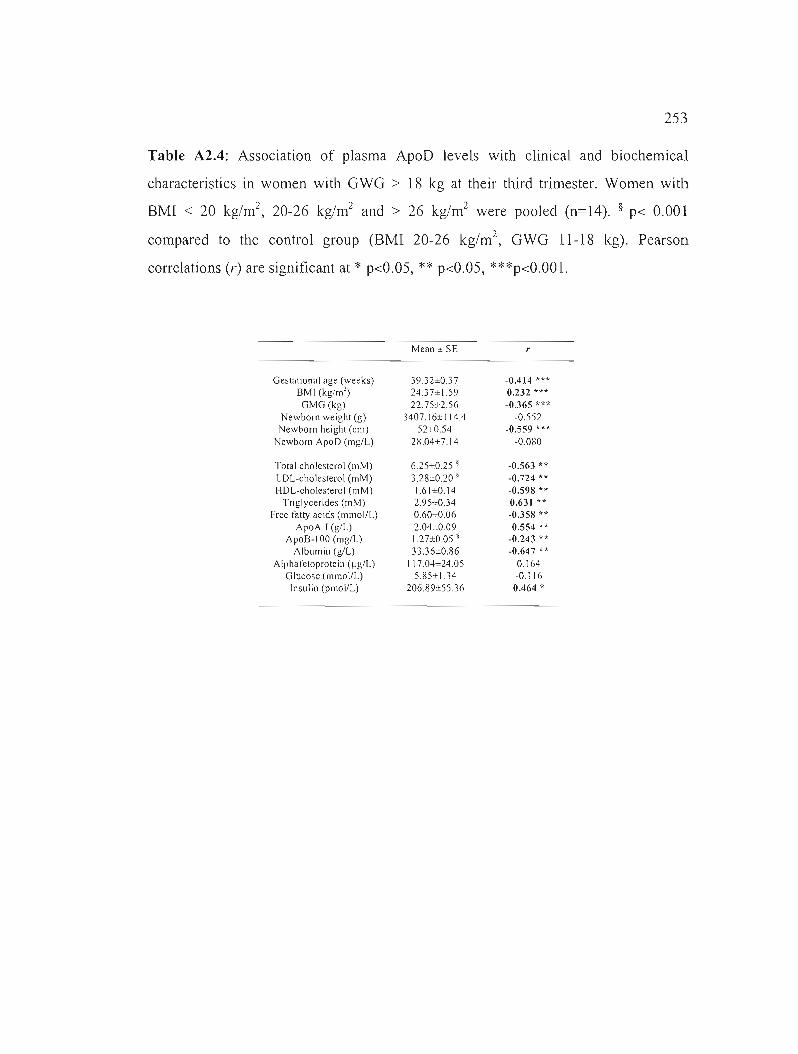
253
Table A2.4: Association of plasma ApoD levels with clinical and biochemical
characteristics in women with GWG > 18 kg at their third trimester. Women with
BMI < 20 kg/m2, 20-26 kg/m2 and> 26 kg/m2 were pooled (n=14). § p< 0.001
compared to the control group (BMI 20-26 kg/m 2, GWG 11-18 kg). Pearson
correlations (r) are significant at * p<0.05, ** p<0.05, ***p<O.OO 1.
Mean ± SE
Gestational age (weeks) 39.32±0.37 -0.414 H'·
BMI (kg/m') 24.37±1.59 0.232 *** GMG (kg) 22.7502.56 -0.365 ***
Newborn weight (g) 3407. [6± [ 14.4 -0.552 Newborn height (cm) 5210.54 -0.559 ***
Newborn ApoD (mg/L) 2S.04±7.14 -O.OSO
Total cholesterol (mM) 625±025 § -0.563 ** LDL-cholesterol (mM) 3.28±020 \ -0.724 ** HDL-cholesterol (mM) 1.61±0.14 -0.598 **
Triglycerides (mM) 2.95±0.34 0.63! ** Free fatty acids (mmol/L) 0.60±0.06 -0.358 **
ApoA-1 (g/L) 2.04±009 -0.554 H
ApoB·1 00 (mg/L) 1.27±0.05 § -0.243 *., Albumin (g/L) 33.36±0.86 -0.647 **
Alphafetoprotein ([tg/L) 117 .04±24 .05 0.164 Glucose (mmoIlL) 5.85± 1.34 -0.116 Insulin (pmoIlL) 206.89±55.36 0.464 'k
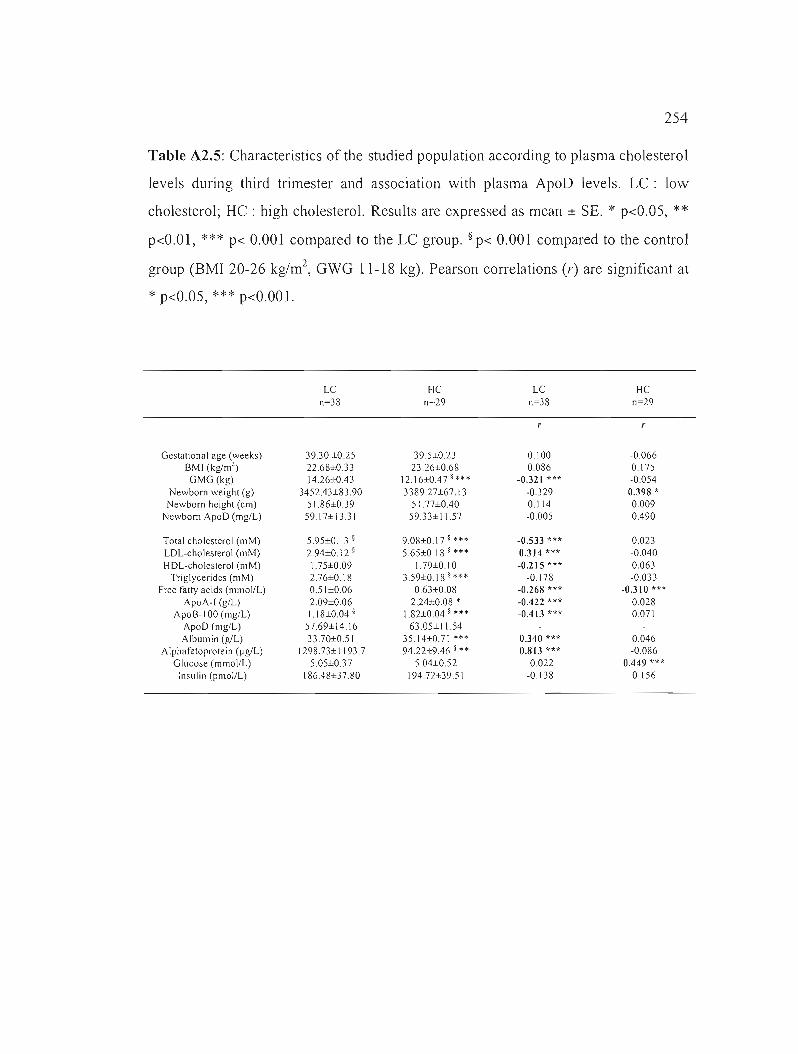
254
Table A2.S: Characteristics of the studied population according to plasma cholesterol
levels during third trimester and association with plasma ApoD levels. LC: low
cholesterol; HC : high cholesterol. Results are expressed as mean ± SE. * p<0.05, ** p<O.OI, *** p< 0.001 compared ta the LC group. § p< 0.001 compared ta the control
group (BMI 20-26 kg/m2, GWG 11-18 kg). Pearson correlations (r) are significant at
* p<0.05, *** p<O.OOl.
LC HC LC HC n=38 n=29 n=38 n=29
r
Gestalional age (weeks) 3930 :1:0.25 39.5±0.23 0.100 -0.066 BMI (kg/m') 2268±0.33 2326±0.68 0086 0.175 GMG (kg) 14.26:1:0.43 12.16±0.47 1 ... -0.321 *** -0.054
Newborn weighl (g) 3452.43±83.90 3389.27±67.13 -0.329 0.398 *
Newborn height (cm) 51.86±0.39 51.77±0.40 0.114 0.009 Newborn ApoD (mg/L) 59.17±13.31 59.33±11.57 -0.005 0.490
Total cholesterol (mM) 5.95±0.13 § 9.08±0.17 § ,., -0.533 ·k'" 0.023 LDL-choleslerol (mM) 2.94±0.12 § 5.65±0.18 § ••• 0.314 *-a -0.040 HDL-choleslerol (mM) 1.75±0.09 1.79±0.10 -0.215 *** 0.063
Triglycerides (mM) 2.76±0.18 3.59±0.18 1 ••• -0.178 -0.033 Free fatty acids (mmol/L) 0.51±0.06 0.6J±0.08 -0.268 H* -0.310 ***
ApoA-1 (g/L) 2.09±0.06 2.24:1:0.08 • -0.422 *** 0.028 ApoB-1 00 (mg/L) 1.18±0.04 § 1.82±0.04 § , •• -0.413 *·H 0.071
ApoD (mg/L) 57.69±14.16 63.05± 11.54 Albumin (g/L) 33.70±0.51 35.14±0.71 ••• 0.340 *H 0.046
Alphafetoprolein <llg/L) 1298.73±11937 94.22±9.46 § •• 0.813 H* -0.086 Glucose (mmoIlL) 5.05±O.3 7 5.04±0.52 -0.022 0.449 ***
Insulin (pmoIlL) 186.48±37.80 194.72±39.51 -0.138 0.156
255
A2.7 Figure legends
Figure A2.I: Plasrnatic ApoD levels during pregnancy. ApoD levels were
measured in women with a BMI of 20-26 kg/ml and a WG of 11-18 kg at the two
first trimesters of pregnancy (l st and 2nd) and at delivery (3 rd
) and compared with
levels in non-pregnant women (BMI 20-26 kg/ml). ApoD levels in the cord blood
were also measured. Data are expressed as means ± SEM. The same letter means no
statistical differences between groups; different letters indicate significant differences
between the groups (p < 0.001)
Figure A2.2: Expression of apoD rnRNA in placenta according to the pre
pregnancy BMI and gestationaI WG. The level of apoD expression was measured
by qRT-PCR using specifie primers for apoD. Data are expressed as the normalized
ratio of apoD mRNA to 18S RNA (means ± SEM). The same letter means no
statistical differences between groups; different letters indicate significant differences
between the groups (p < 0.01).
Figure A2.3: The effect of breast- and bottle-feeding on plasrnatic ApoD levels.
ApoD concentration was measured in mothers two month after delivery (women with
a BMI of 20-26 kg/ml and a WG of 11-18 kg) and compared with levels in non
pregnant women (BMI 20-26 kg/ml). Data are expressed as means ± SEM. The same
letter means no statistical differences between groups; different letters indicate
significant differences between the groups (p < 0.001).
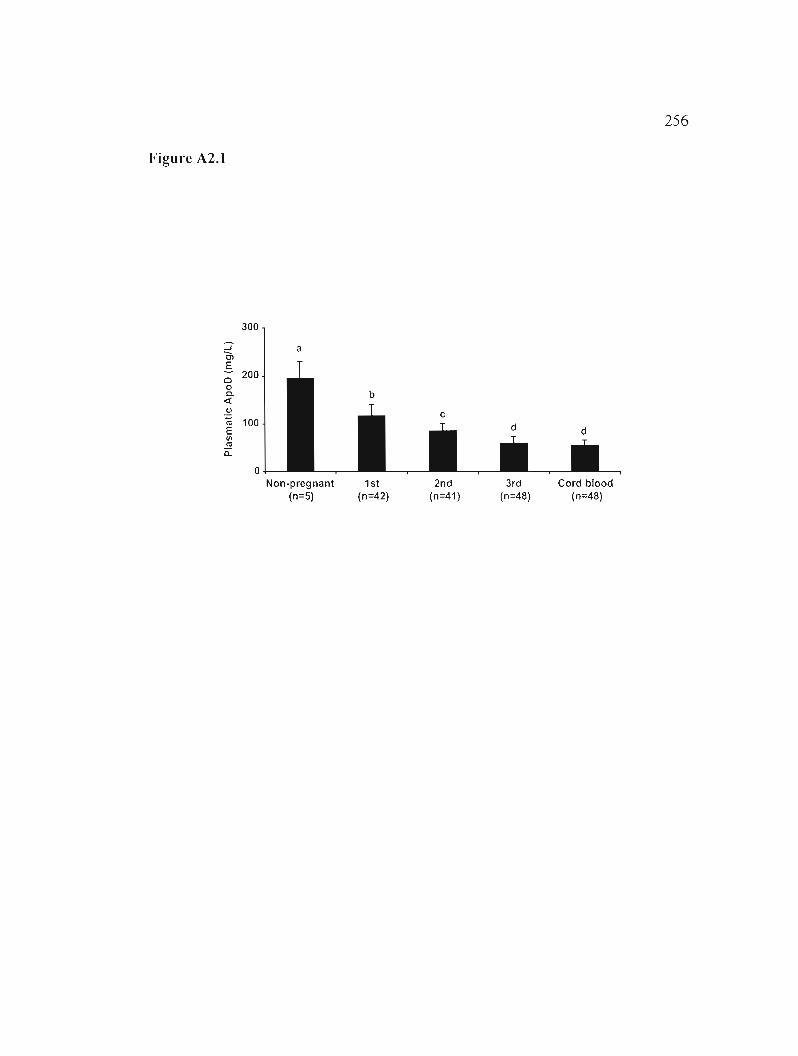
256
Figure A2.I
300
:l 0,
a
g Cl
200 0 0. ~
.~ ~ E
100 (/) ~
a:: 0
Non-pregnant 1st 2nd 3rd Cord blood (n=5) (n=42) (n=41) (n=48) (n=48)
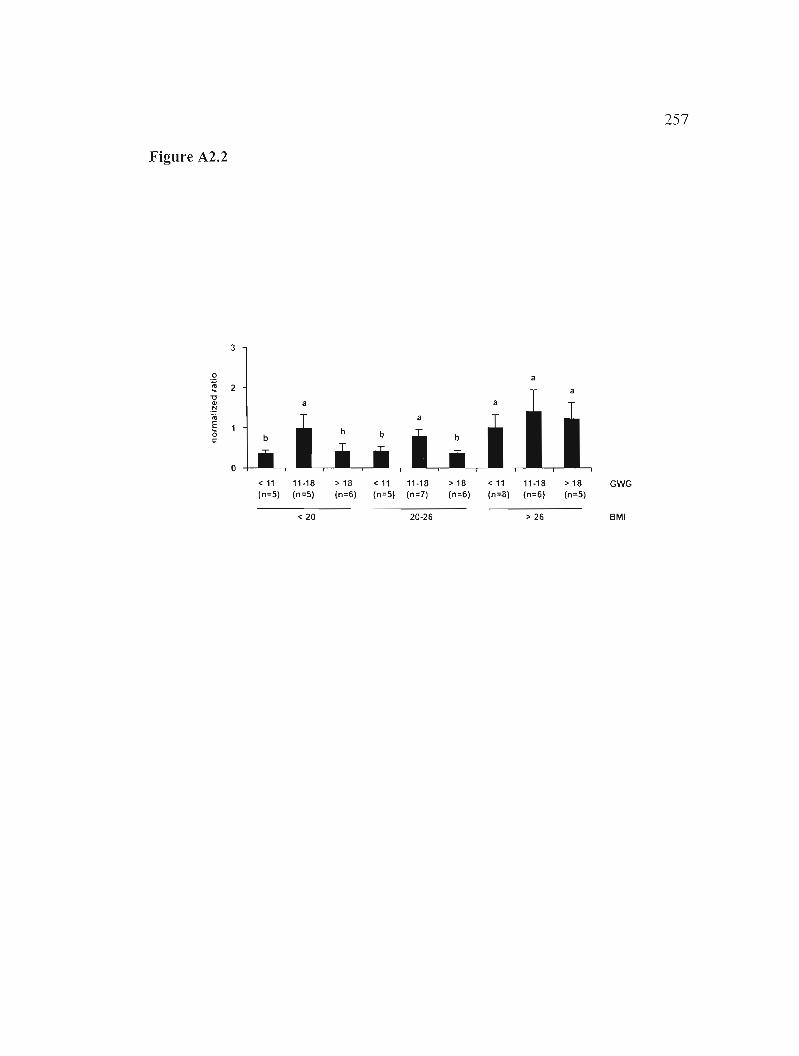
257
Figure A2.2
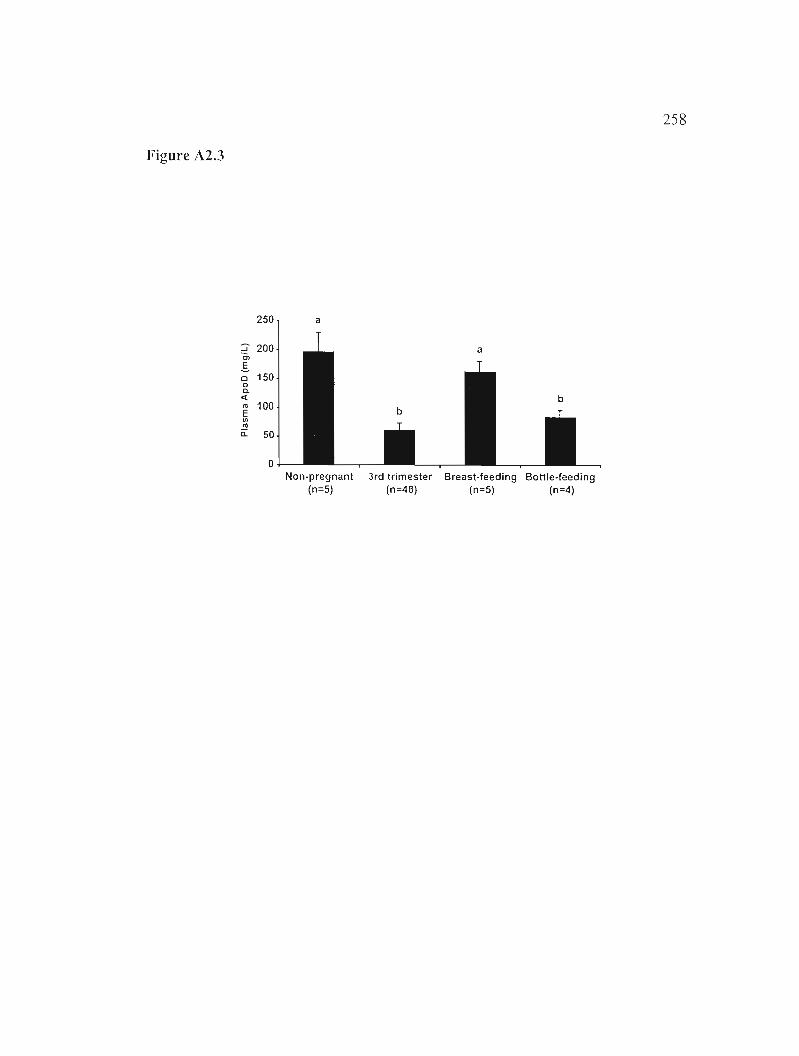
258
Figure A2.3
250 a
::J 200 0> .s Cl 150 0 0« 0)
E 100
Ul 0)
a: 50
0 Non-pregnant 3rd trimester Breast-reeding Bottle-reeding
(n=5) (n=48) (n=5) (n=4)

ANNEXE III
Résultats supplémentaires non-publiés
Survie des souris Thy-l/ApoD et NSE/ApoD
260
A3.1 Résultats
Les souns Thy-l/ApoD et NSEIApoD présentent une survie différente de
celle des souris WT. Cependant, cette différence de survie est difficilement
réconciliable avec le phénotype métabolique et nécessite une plus grande exploration
avant publication. C'est pourquoi ces résultats n'ont pas été inclus dans le chapitre
III.
Tel qu'illustré dans la figure A3.1A, la courbe de survie de Kaplan-Meier des
souris Thy-llApoD démontre une claire divergence par rapport à la courbe des souris
WT (p=O.0045) avec une plus grande survie médiane (753 jours comparativement à
643 jours chez les souris WT). Cependant, la longévité maximale des souris Thy
l/ApoD (824.4 ± 43.9 jours, p>0.05, n=40), n'est pas significativement différente de
celle des souris WT (808.4 ± 47 jours, n=60). En comparaison, les souris NSEIApoD
vivent plus longtemps (909.8 ± 21.5 jours, p<O.OOl, n=57) et démontrent une courbe
de survie différente par rapport aux souris WT (p=0.0227), mais ont une survie
médiane similaire (629 jours) (Fig. A3.1B). Ces courbes de survie peuvent être reliées
à l'expression du transgène dans le cerveau de ces souris en fonction du temps. Chez
les souris Thy-l/ApoD, l'expression du transgène diminue dans le temps à partir de
500 jours pour atteindre de faibles niveaux à 900 jours. Cette diminution est
probablement reliée au déclin du nombre des neurones dopaminergiques dû au
vieillissement. Cependant, l'expression de H-ApoD reste constante durant la vie des
souris NSE/ApoD (Fig. A3.1C).
261
A3.2 Légende des figures
Figure A3.1: Courbes de survie Kaplan-Meier des souris H-apoD Tg. Courbes de
survie des souris Thy-l/ApoD (n=40) (A) et NSEIApoD (n=57) (B) versus les souris
WT (n=60). Puisque aucune différence n'a été constatée entre les sexes, un mélange
de sexes a été utilisé pour ces courbes. C: Immunobuvardage démontrant l'expression
protéique de H-apoD dans le cerveau des souris transgéniques en fonction de l'âge
(jours). Un anticorps polyclonal anti-GAPDH a été utilisé pour la normalisation.
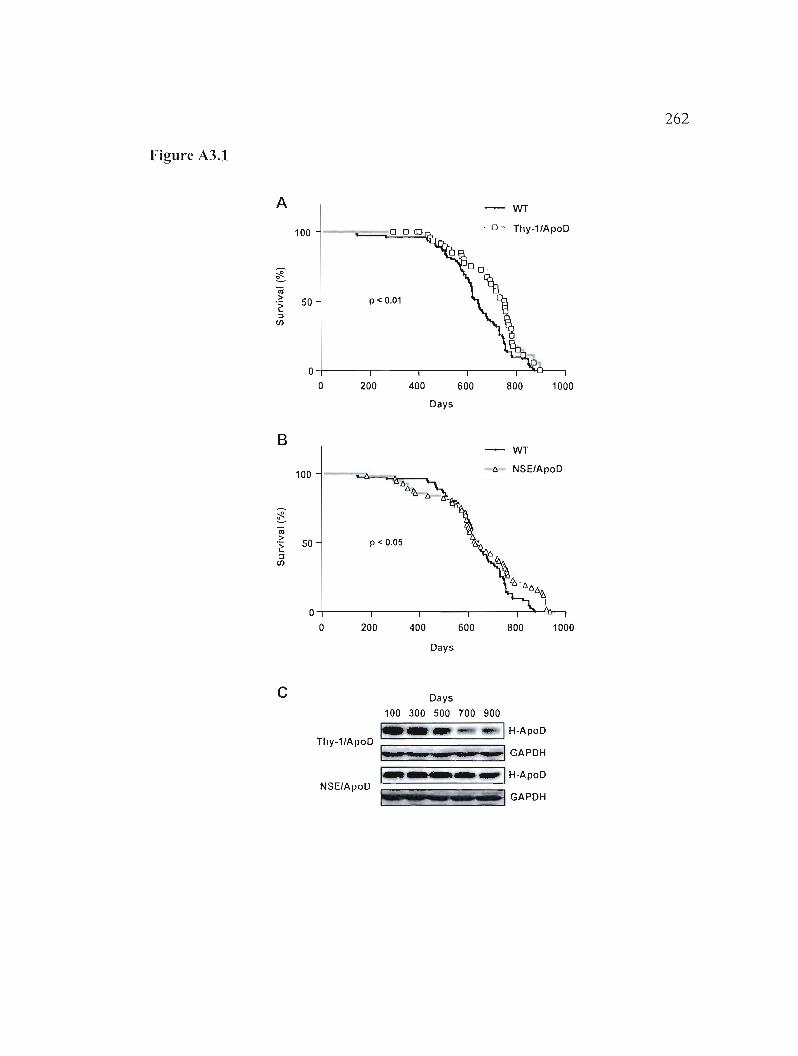
262
Figure A3.1
A WT
. 0 ~ Thy-1/ApoD100 oOUJ
00.,~ ïü > p < 0.01 .~ 50 ::J
Y3 (J) ~ a
0
0 200 400 600 800 1000
Days
B WT
1:> NSE/ApoD100
~
> .~ '" 50 p < 0.05
::J (J)
O+----,----r---,.---..-''''--'h-, o 200 400 600 800 1000
Days
c Days
100 300 500 700 900
je_ ... 1 H-ApoD Thy-1/ApoD
1_ - _ - - 1 GAPDH
1_- - ---1 H-ApoDNSE/ApoD
GAPDH

ANNEXE IV
Résultats supplémentaires non-publiés
Caractérisation des souris NFLIApoD
264
A4.1 Résultats
Les souris NFL/ApoD ont aussi été partiellement caractérisées. Cependant, la
divergence de ces souris au niveau de la réponse au glucose et à l'insuline reste pour
l'instant inexplicable et nécessite une plus grande exploration avant publication. C'est
pourquoi ces résultats n'ont pas été inclus dans le chapitre III.
Les souns NFL/ApoD expriment l'apoD humaine sous le contrôle du
promoteur du gène NFL (Fig. A4.IA-B). Ce promoteur est un promoteur faible qui
s'exprime au niveau de tous les types de neurones. Chez ces souris, la H-apoD
s'exprime dans le système nerveux, particulièrement au niveau de la medulla
oblongata, du cortex et du cervelet (Fig. A4.1 C). L'expression de H-apoD a aussi été
retrouvée hors du système nerveux dans le sang, le muscle, le cœur, les poumons et
les reins (Fig. A4.1 C). Sauf pour les cellules sanguines, l'expression de NFL dans ces
tissus avait déjà été rapportée.
Les souris NFL/ApoD présentent des différences par rapport aux souris WT et
aux autres souris transgéniques. Ces souris ont un plus gros cerveau mais moins de
gras épididymal (Table A4.1). Elles ont aussi plus de créatine kinase, un marqueur de
la fonction rénale et musculaire (Table A4.2). Comme les souris NSEIApoD (Table
3.4), elles ont aussi un plus grand nombre de globules blancs, causé par une
augmentation des neutrophiles, des lymphocytes et des monocytes (Table A4.3).
Cependant, les souris NFL/ApoD ont une longévité similaire à celle des souris WT
(Fig. A4.2). Elles ont aussi une plus grande tolérance au glucose (Fig. A4.3A-B) et ne
présentent pas de résistance à l'insuline (Fig. A4.3C). De plus, ces souris n'ont pas ou
très peu d'accumulation de lipides au niveau du foie (Fig. A4.4). Finalement, ces
souris ont des niveaux de pAkt, d'apoE, de LFABP, de FAS, de PPAR a et y, de
265
SREBPlc, d'IL-la, d'IL-6, d'IL-Iû, de TNFa, de IFNy, de TGF~, de leptine,
d'adiponectine et de résistine semblables aux souris WT (résultats non-montrés).
La cause de ce phénotype reste inconnue. Il pourrait s'expliquer par le fait que
ce promoteur est le plus faible des trois. De plus, le transgène n'est pas exprimé dans
le foie ce qui explique probablement la plus petite accumulation de lipides
comparativement aux autres souris transgéniques et éviterait donc l'inhibition des
voies de l'insuline. Par ailleurs, la tolérance accrue au glucose reste inexpliquée, mais
pourrait être corrélée avec l'expression de H-apoD dans le muscle. D'autres études
seront essentielles à la clarification de ces phénomènes.
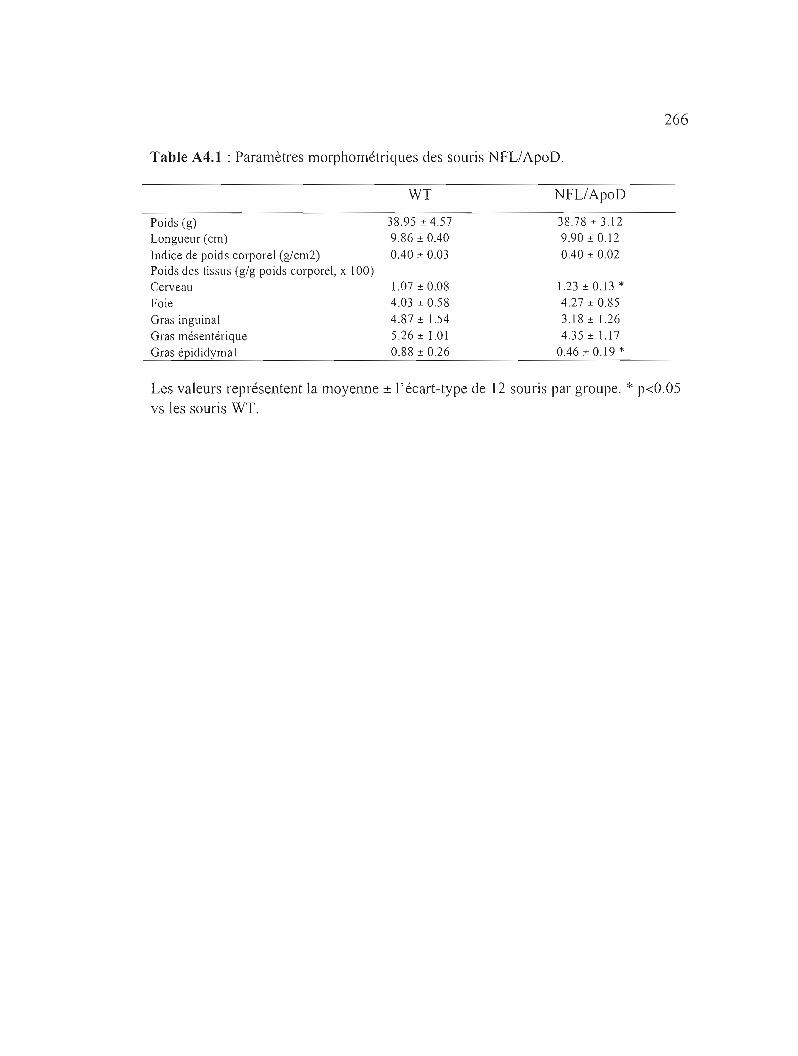
266
Table A4.1 : Paramètres morphométriques des souris NFL/ApoD.
Poids (g) Longueur (cm) Indice de poids corporel (g/cm2) Poids des tissus (g/g poids corporel, x 100) Cerveau Foie Gras inguinal Gras mésentérique Gras épididymal
WT
38.95 ± 4.57 9.86 ± 0.40 0.40 ± 0.03
1.07 ± 0.08 4.03 ± 0.58 4.87 ± 1.54 5.26± l.01 0.88 ± 0.26
NFL/ApoD
38.78±3.12 9.90±0.12 0.40 ± 0.02
1.23 ± 0.13 * 4.27 ± 0.85 3.18±1.26 4.35 ± 1.17
0.46 ± 0.19 *
Les valeurs représentent la moyenne ± l'écart-type de 12 souris par groupe. * p<O.OS vs les souris WT.
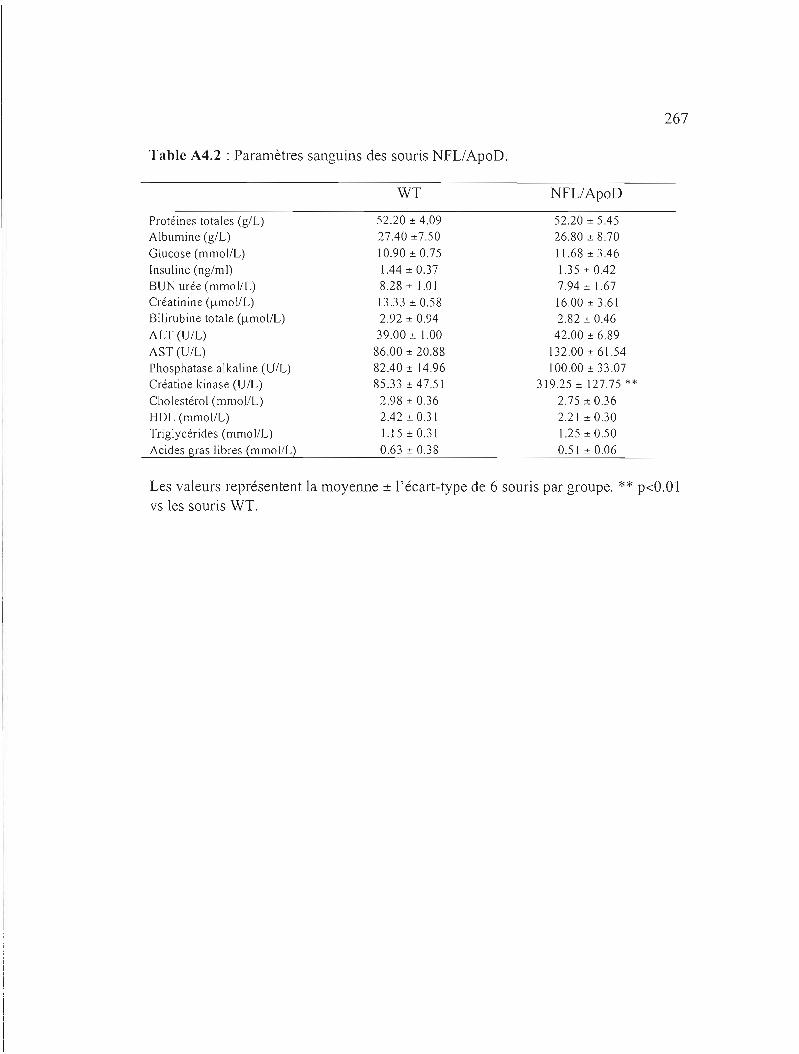
267
Table A4.2 : Paramètres sanguins des souris NFL/ApoD.
Protéines totales (g/L) Albumine (g/L)
Glucose (mmol/L)
Insuline (ng/ml)
BUN urée (mmol/L) Créatinine (f.lmol/L)
Bilirubine totale (~lmol/L)
ALT (U/L)
AST (UlL) Phosphatase alkaline (U/L)
Créatine kinase (U/L)
Cholestérol (mmoJ/L)
HDL (mmol/L)
Triglycérides (mmol/L)
Acides gras libres (mmol/L)
WT
52.20 :!: 4.09 27.40 :!:7.50 10.90:!: 0.75 1.44 :!: 0.37 8.28:!: 1.01 1333:!:0.58 2.92:!: 0.94 39.00 :!: 1.00 86.00 :!: 20.88 82.40:!: 14.96 85.33 :!: 47.51 2.98 :!: 0.36 2.42 :!: 031 1.15 :!: 0.31 0.63 :!: 0.38
NFL/ApoD
52.20 :!: 5.45 26.80 :!: 8.70 1l.68 :!: 3.46 135 :!: 0.42 7.94:!: 1.67 16.00:!:3.61 2.82 :!: 0.46 42.00 :!: 6.89
132.00 :!: 61.54 100.00:!: 33.07
319.25:!: 127.75 ** 2.75 :!: 0.36 2.21 :!: 0.30 1.25:!: 0.50 0.51 :!: 0.06
Les valeurs représentent la moyenne ± l'écart-type de 6 souris par groupe. ** p<O.OI vs les souris WT.
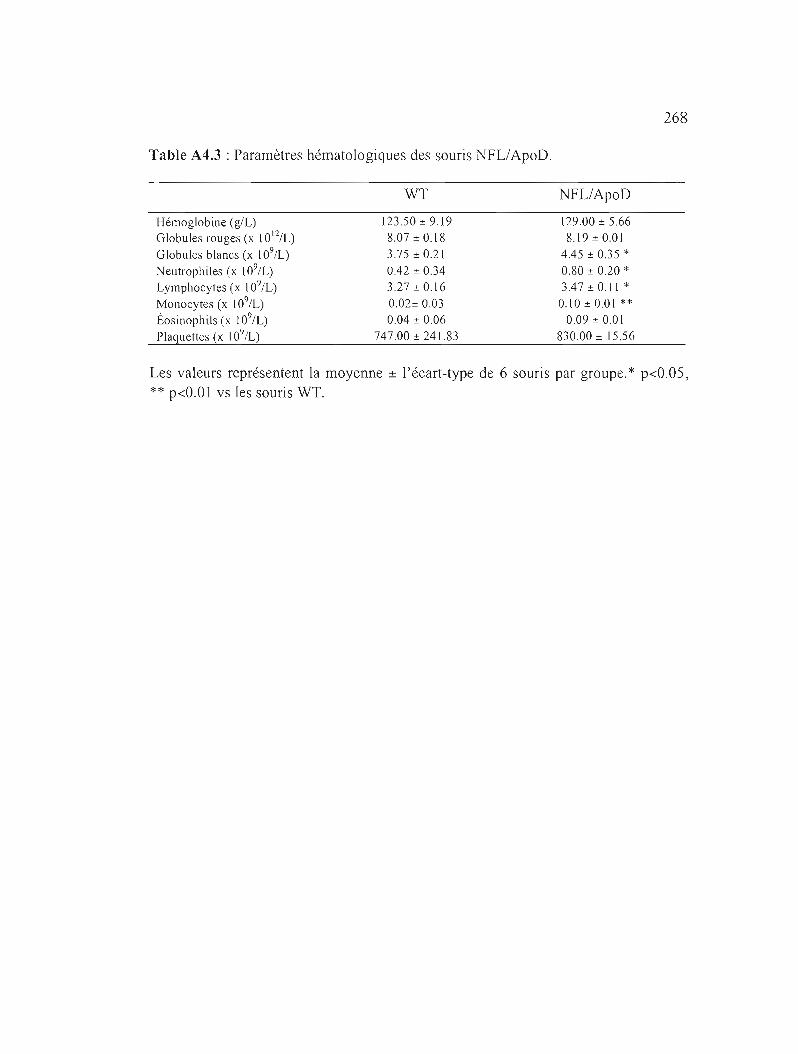
268
Table A4.3 : Paramètres hématologiques des souris NFLIApoO.
Hémoglobine (g/L) Globules rouges (x 1012/L)
Globules blancs (x 109/L) Neutrophiles (x 109/L) Lymphocytes (x 109/L)
Monocytes (x 109/L) Éosinophils (x 109/L) Plaquettes (x 109/L)
WT
123.50 ± 9.19 8.07 ± 0.18
3.75 ± 0.21
0.42 ± 0.34 3.27±0.16
0.02± 0.03 0.04 ± 0.06
747.00 ± 241.83
NFL/ApoD
129.00 ± 5.66 8.19 ± 0.01
4.45 ± 0.35 * 0.80 ± 0.20 * 3.47±0.1\ *
0.10 ± 0.01 ** 0.09 ± 0.01
830.00 ± J 5.56
Les valeurs représentent la moyenne ± l'écart-type de 6 souris par groupe. * p<O.OS, ** p<O.Ol vs les souris WT.
269
A4.2 Légende des figures
Figure A4.1: Structure et expression du transgène NFLIApoD. A) La partie
codante du gène de l'H-apoD (noir) fusionnée avec le signal de polyadénylation du
gène de l'hormone de croissance bovine (BGH; gris) ont été insérés dans le gène de la
chaîne légère du neurofilament (NFL; blanc). B: BamHl, H: HindIll, Sac: Sacl, Sma:
Smal, SIX: Sall/XhoI, X: XbaI. Le transgène a été excisé par digestion avec les
enzymes SmaI et SacI (NFL/ApoD; 7 kpb). B) Analyse de type Southern des souris
NFL/ApoD. L'ADN génomique (10 )lg) digéré par BamHI a été analysé en utilisant
le transgène comme sonde. Les témoins (gauche) correspondant à 1 (1 c) ou 10 (1Oc)
copies du transgène sont utilisés pour déterminer le nombre de copies intégrés à
l'ADN. C) Analyse de divers tissus par RT-PCR semi-quantitatif en utilisant des
oligonuléotides spécifiques à H-apoD. Le gène HPRT sert de témoin interne.
Medulla: medulla oblongata. Muscle: muscle squelettique. Les résultats sont
représentatifs de 3 expériences séparées.
Figure A4.2: Courbes de survie Kaplan-Meier des souris NFLIApoD. NFL/ApoD
(n=21) versus WT (n=60). Puisqu'il n'y avait pas de différence entre les sexes, mâles
et femelles ont été inclus dans la courbe.
Figure A4.3: Analyse in vivo de la tolérance au glucose et de la sensibilité à
l'insuline. A) Niveaux de glucose sanguin pendant le test de tolérance au glucose
intrapéritonéal (IPGTT), démontrant une plus grande tolérance au glucose chez les
souris NFL/ApoD (2 g/kg poids corporel; animaux à jeun de 12-15h). B)
Concentration d'insuline plasmatique durant le IPGTT. C) Niveaux de glucose
pendant le test de tolérance à l'insuline (ITT) montrant une plus grande tolérance
chez les animaux NFL/ApoD. Les valeurs représentent la moyenne ± l'écart-type de 6
souris par génotype. * p<O.O 1 vs les souris WT.
270
Figure A4.4: Stéatose hépatique chez les souris NFL/ApoD. A-B) Coupes de foie
colorées à l'hématoxyline-éosine. C-O) Cryosections de foie colorées à l'huile
rougeO. Magnification originale, x 100; n=6. E) Contenu lipidique total. Les valeurs
représentent la moyenne ± l'écart-type de 6 souris par génotype.
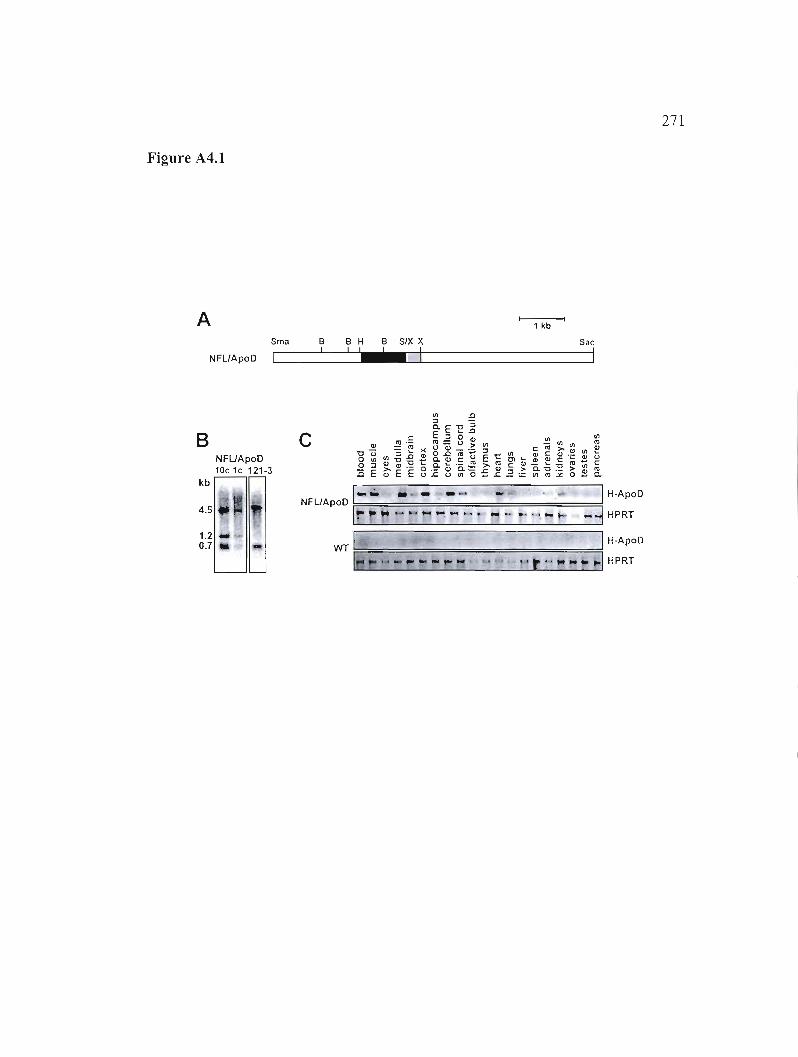
271
Figure A4.1
A 1 kb
Sma B B H B SIX X Sac 1 1 1 C\-----------IINFLIApoD !
1
B c ~
"tJ '-' NFLIApoD '"aa :l10c 1c 121-3 :0 E
kb ~- _. - _-.- 1 H-ApoD
NFLIApoD I============== I~"'''' . .....,.. ...... _j HPRT
1.2 _ j H-ApoD0.7 • 1WT~==========.- Ir .. -.............. ., ., t " "" .. ~ ~I HPRT
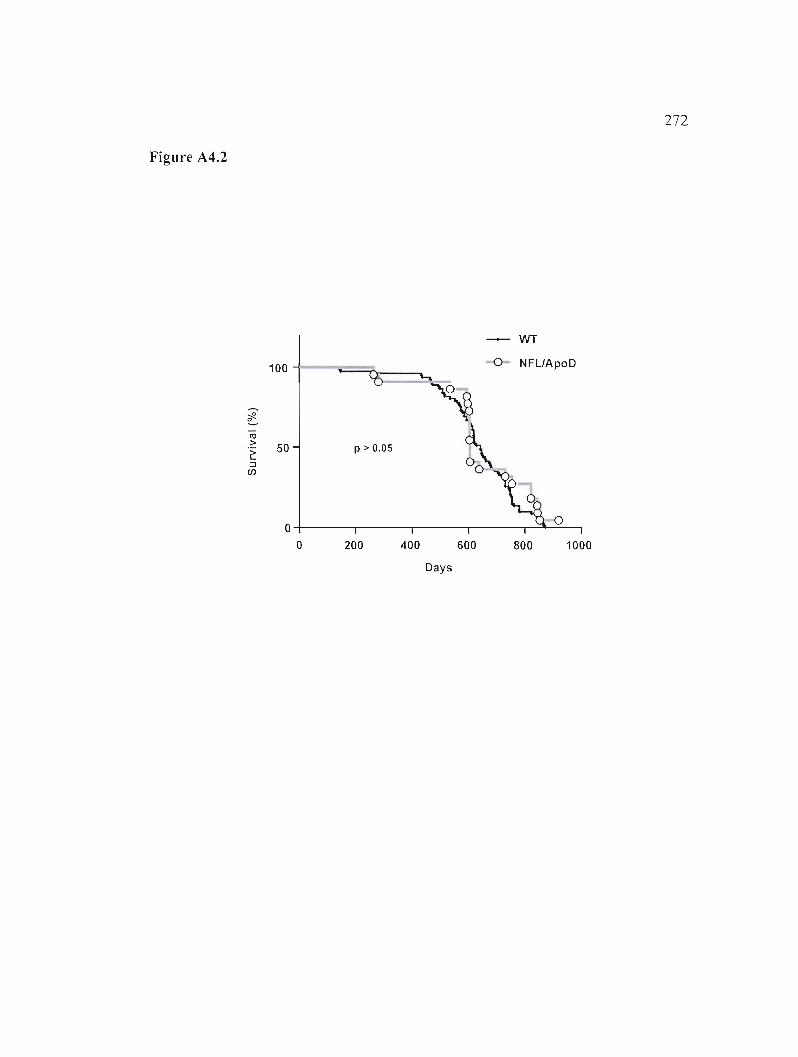
272
Figure A4.2
WT
0- NFLIApoD100 et; h
::!!. ~
ro > 50 p > 0.05 ~ :::l
rf) ~ o+----.-----r------r-------,,........::Jo...--.:::-,
o 200 400 600 800 1000
Days
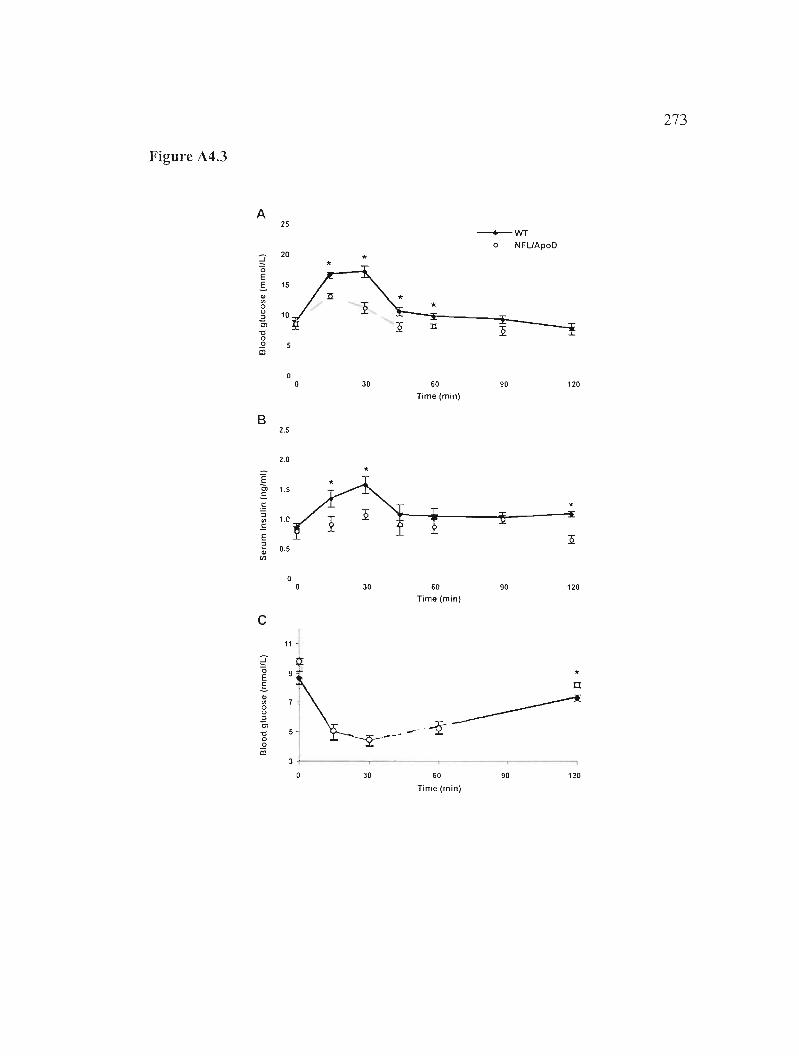
273
Figure A4.3
A
~ 0 E .s '" '" 0 0 ::> ë> u 0 0
10
25
20
15
10
* *
I
*
--+--WT 0 NFUApoO
0 a 30 60
Time (min)
90 120
B 2.5
:§ Cl .s
2.0
*
==:; " .= c :l <; '"
1.0
0.5 Q
a 0 30 60
Time (min) 90 120
C
11i
~ "0 E .s '" "0 0 :l
u 0
ë> ---' -0 10
30
* rI
~ ~
60 90 120
Time (min)
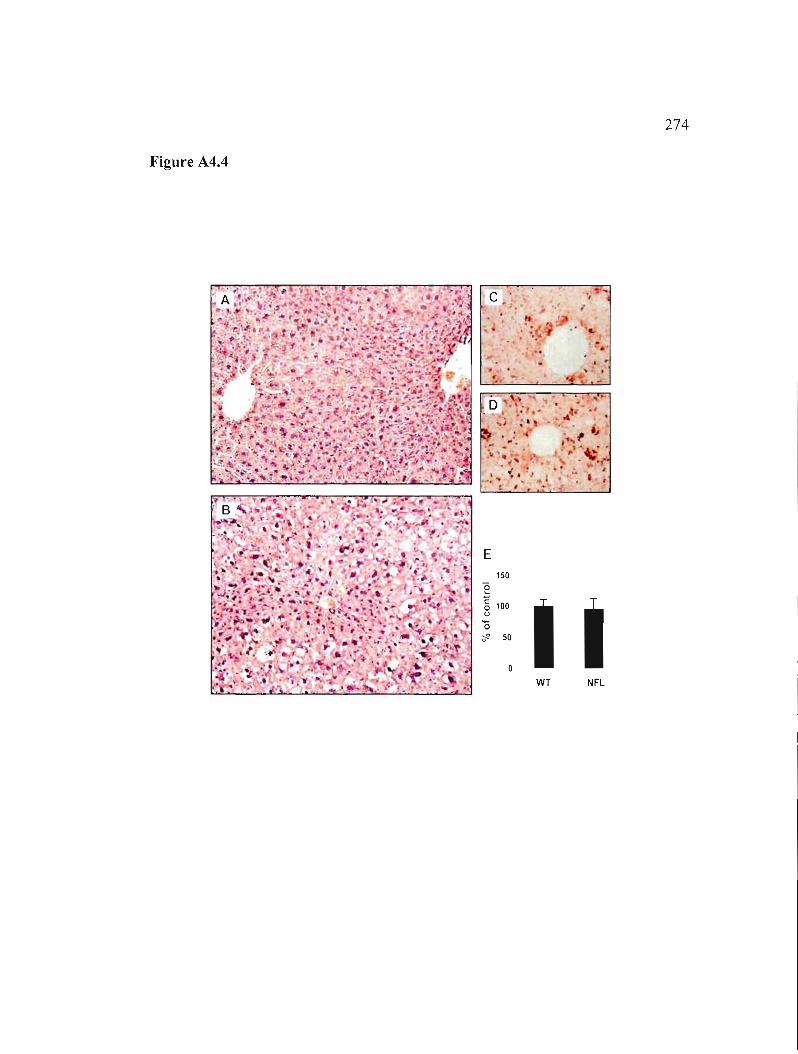
274
Figure A4.4
,>.. ....
150
100
50
o WT NFL
ANNEXE V
Résultats supplémentaires non-publiés
Réponse des souris ApoD-KO à l'infection par HCoV-OC43
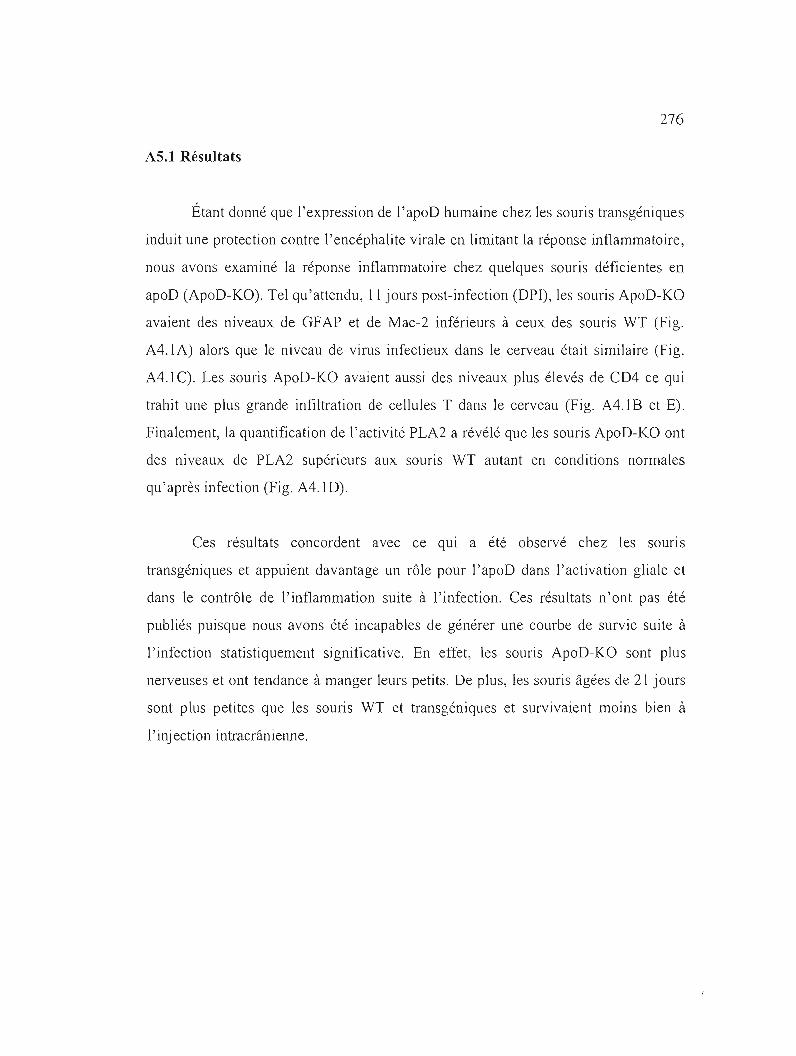
276
AS.l Résultats
Étant donné que l'expression de l'apoD humaine chez les souris transgéniques
induit une protection contre l'encéphalite virale en limitant la réponse inflammatoire,
nous avons examiné la réponse inflammatoire chez quelques souris déficientes en
apoD (ApoD-KO). Tel qu'attendu, Il jours post-infection (DPI), les souris ApoD-KO
avaient des niveaux de GFAP et de Mac-2 inférieurs à ceux des souris WT (Fig.
A4.lA) alors que le niveau de virus infectieux dans le cerveau était similaire (Fig.
A4.l C). Les souris ApoD-KO avaient aussi des niveaux plus élevés de CD4 ce qui
trahit une plus grande infiltration de cellules T dans le cerveau (Fig. A4.1B et E).
Finalement, la quantification de l'activité PLA2 a révélé que les souris ApoD-KO ont
des niveaux de PLA2 supérieurs aux souris WT autant en conditions normales
qu'après infection (Fig. A4.lD).
Ces résultats concordent avec ce qui a été observé chez les souris
transgéniques et appuient davantage un rôle pour l'apoD dans l'activation gliale et
dans le contrôle de l'inflammation suite à l'infection. Ces résultats n'ont pas été
publiés puisque nous avons été incapables de générer une courbe de survie suite à
l'infection statistiquement significative. En effet, les souris ApoD-KO sont plus
nerveuses et ont tendance à manger leurs petits. De plus, les souris âgées de 21 jours
sont plus petites que les souris WT et transgéniques et survivaient moins bien à
l' inj ection intracrânienne.
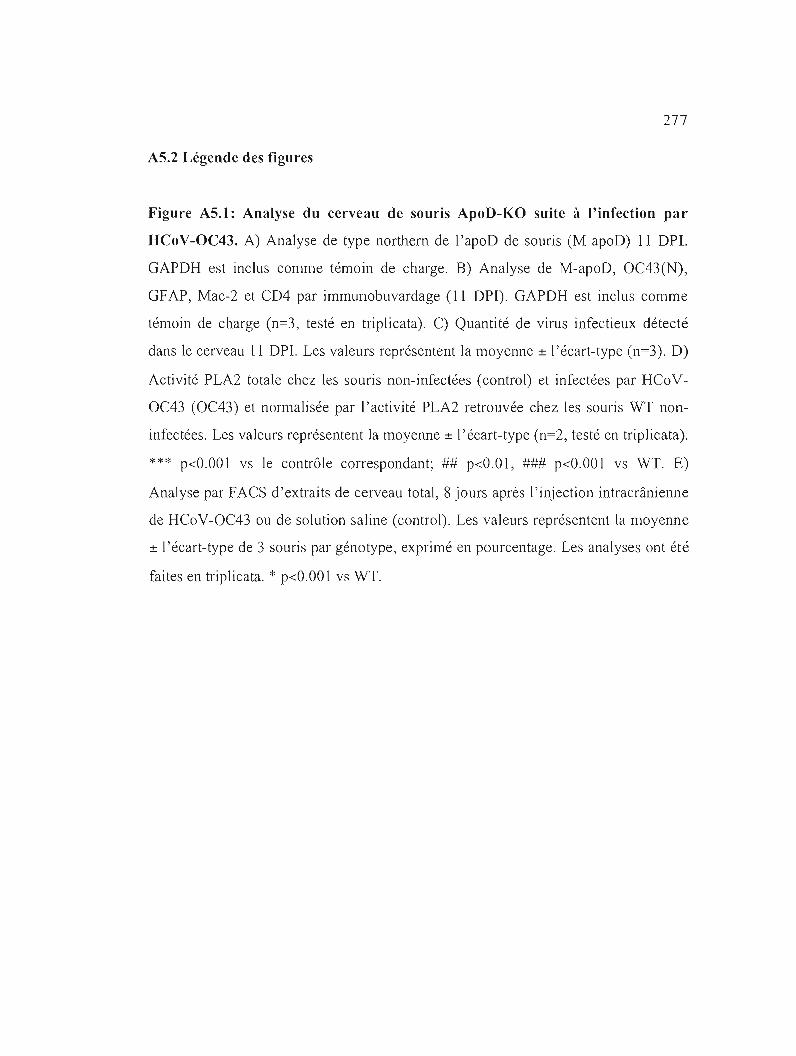
277
AS.2 Légende des figures
Figure AS.1: Analyse du cerveau de souris ApoD-KO suite à l'infection par
HCoV-OC43. A) Analyse de type northern de l'apoD de souris (M-apoD) Il DPI.
OAPDH est inclus comme témoin de charge. B) Analyse de M-apoD, OC43(N),
OFAP, Mac-2 et CD4 par immunobuvardage (Il DPI). OAPDH est inclus comme
témoin de charge (n=3, testé en triplicata). C) Quantité de virus infectieux détecté
dans le cerveau Il DPI. Les valeurs représentent la moyenne ± l'écart-type (n=3). 0)
Activité PLA2 totale chez les souris non-infectées (control) et infectées par HCoV
OC43 (OC43) et normalisée par l'activité PLA2 retrouvée chez les souris WT non
infectées. Les valeurs représentent la moyenne ± l'écart-type (n=2, testé en triplicata).
*** p<O.OO 1 vs le contrôle correspondant; ## p<O.O 1, ### p<O.OO 1 vs WT. E)
Analyse par FACS d'extraits de cerveau total, 8 jours après l'injection intracrânienne
de HCoV-OC43 ou de solution saline (control). Les valeurs représentent la moyenne
± l'écart-type de 3 souris par génotype, exprimé en pourcentage. Les analyses ont été
faites en triplicata. * p<O.OO 1 vs WT.
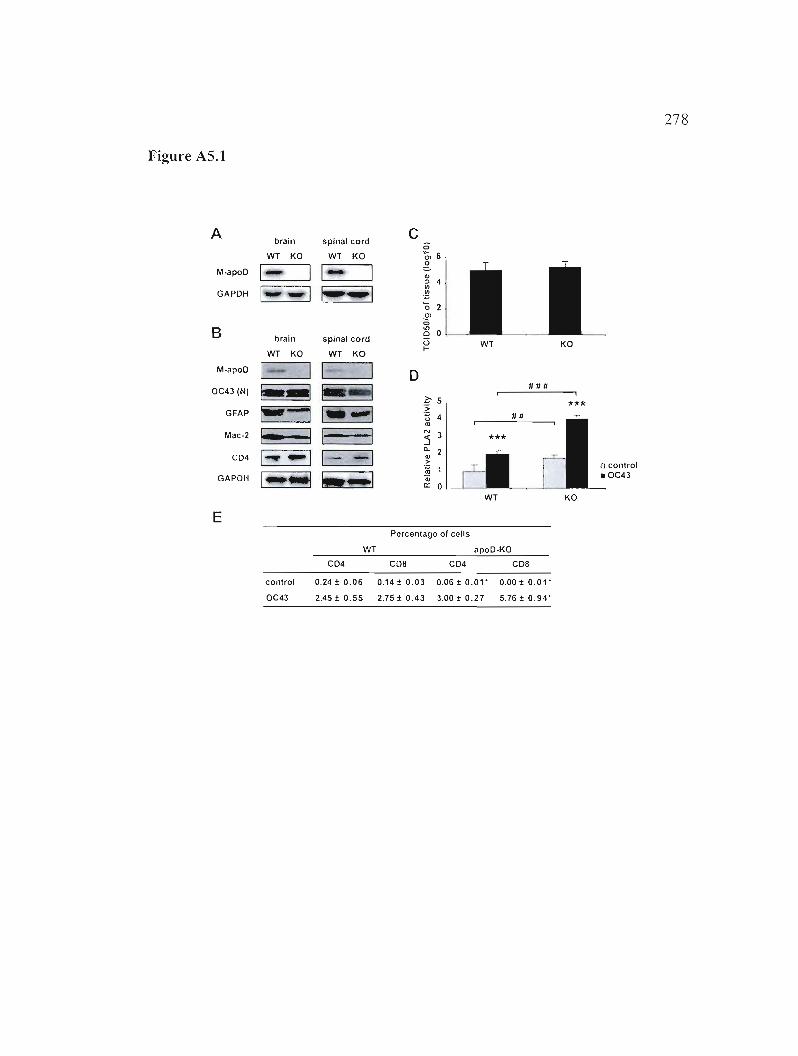
278
Figure AS.!
A brain spinal cord
WT KO WT Ka
M-apOO 1_ 1 1 - 1
GAPDH 1- -1 jW'..1
B brain spinal co rd WT KO
WT KO WT Ka •M-apoD 1 1 1 1 D
### OC43(N) _-1 .~
l?: 5 :~ ***
GFAP t> 4 ##t-=-J 1" --1 "
3Mac·2 1_ 1 1 1 '":) *** 0....
CD4 .::1-"'1 1 -1 o control • aC43QiGAPOH I-.e.j _--1 cr
;;;
0 WT KO
E Porcentago of colis
WT apoD-KO
C04 COB CD4 COB
control 0.24 ± 0.06 0.14 ± 0.03 0.06 ± 0.01' 0.00 ± 0.01'
OC43 2.45 ± 0.55 2.75 ± 0.43 3.00 ± 0.27 5.76 ± 0.94'
RÉFÉRENCES
Adibhatla, KM., Hatcher, JF. 2007. Secretory phospholipase A2 lIA is up-regulated
by TNF-alpha and IL-l alpha/beta after transient focal cerebral ischemia in rat.
Brain Res. 1134: 199-205.
Agdeppa, E.D., Kepe, V., Liu, J, Small, G.W., Huang, S.C., Petrie, A., Satyamurthy,
N., Barrio, JR. 2003. 2-Dialkylamino-6-acylmalononitrile substituted
naphthalenes (DDNP analogs): novel diagnostic and therapeutic tools in
Alzheimer's disease. Mol.lmaging Biol. 5: 404-417.
Akerstrom, B., Borregaard, N., Flower, D.R., Salier, J-P. (Eds) 2006. Lipocalins.
Landes Biosciences, Georgetown, TX, USA.
Akerstrom, B., Maghzal, G., Winterbourn, c.c., Kettle, AJ. 2007. The lipocalin
alpha I-microglobulin has radical scavenger activity. J Biol. Chem. 282: 31493
31503.
Alaupovic, P., Schaefer, EJ., McConathy, WJ., Fesmire, JD., Brewer, H.B. Jr 1981.
Plasma apolipoprotein concentrations in familial apolipoprotein A-I and A-Il
deficiency (Tangier disease). Metabolism 30: 805-809.
Albers, JJ, Adolphson, J, Chen, C.H., Murayama, N., Honma, S., Akanuma, Y.
1985. Defective enzyme causes lecithin-cholesterol acyltransferase deficiency in a
Japanese kindred. Biochim. Biophys. Acta 835: 253-257.
Albers, JJ, Cheung, M.C., Ewens, S.L., Tollefson, JH. 1981. Characterization and
immunoassay of apolipoprotein D. Atherosclerosis 39: 395-409.
Alexander, H., Stegner, A.L., Wagner-Mann, c., Du Bois, G.c., Alexander, S.,
Sauter, E.R. 2004. Proteomic analysis to identify breast cancer biomarkers in
nipple aspirate fluid. Clin. Cancer Res. 10 :7500-7510.
Allhorn, M., Berggard, 1., Nordberg, J, Olsson, M.L., Akerstrom, B. 2002.
Processing of the Iipocalin alpha( 1)-microglobulin by hemoglobin induces heme
binding and heme-degradation properties. Blood 99: 1894-1901.
280
Allhorn, M., Klapyta, A., Akerstrom, B. 2005. Redox properties of the lipocalin
alpha 1-microglobulin: reduction of cytochrome c, hemoglobin, and free iron. Free
Radic. Biol. Med. 38: 557-567.
Alvarez, 1.1., Montelongo, A., Iglesias, A., Lasuncion, M.A" Herrera, E. 1996.
Longitudinal study on lipoprotein profile, high density lipoprotein subclass, and
postheparin lipases during gestation in women. 1. Lipid Res. 37: 299-308.
Alvarez, M.L., Barbon, J.1., Gonzalez, L.O., Abelairas, 1., Boto, A., Vizoso, F.1.
2003. Apolipoprotein 0 expression in retinoblastoma. Ophthalmic Res. 35: 111
116.
Alvarez, M.L., Barbon, J.1., Gonzalez, L.O., Lamelas, M.L., Vazquez, l, Vizoso, F.J.
2004. Expression of two androgen-induced proteins (pepsinogen C and
apolipoprotein d) in epithelial skin cancers of the eyelids. Ophthalmologica 218:
115-9.
Andra, K., Abramowski, O., Duke, M., Probst, A., Wiederho1d, K.H., Burki, K.,
Goedert, M., Sommer, B., Staufenbiel, M. 1996. Expression of APP in transgenic
mice: a comparison of neuron-specific promoters. Neurobiol. Aging 17 :183-90.
Arbour, N., Day, R., Newcombe, 1., Talbot, P.1. 2000. Neuroinvasion by human
respiratory coronaviruses. 1. Virol. 74: 8913-8921.
Ashida, S., Nakagawa, H., Katagiri, T., Furihata, M., Iiizumi, M., Anazawa, Y.,
Tsunoda, T, Takata, R., Kasahara, K., Miki, T, Fujioka, T., Shuin, T, Nakamura,
y. 2004. Mo1ecular features of the transition from prostatic intraepithelial
neoplasia (PIN) to prostate cancer: genome-wide gene-expression profiles of
prostate cancers and PINs. Cancer Res. 64: 5963-5972.
Aspinall, 1.0., Bentel, lM., Horsfall, 0.1., Haagensen, D.E., Marshall, V.R., Tilley,
W.D. 1995. Differentiai expression of apo1ipoprotein-D and prostate specific
antigen in benign and malignant prostate tissues. l Urol. 154: 622-628.
Ayrault-Jarrier, M., Levy, G., Polonovski, 1. 1963a. Study of human serum alpha
lipoproteins by immunoelectrophoresis. Bull. Soc. Chim. Biol. (Paris) 45: 703
713.
281
Ayrau1t-Jarrier, M., Levy, G., Wald, R., Polonovski 1. 1963b. Separation by
ultracentrifugation of the alpha-lipoproteins of nonnal human serum. Bull. Soc.
Chim. Biol. (Paris) 45: 349-359.
Babcock, A.A., Kuziel, W.A, Rivest, S., Owens, T. 2003. Chemokine expression by
glial cells directs leukocytes to sites ofaxonal injury in the CNS. 1. Neurosci. 23:
7922-7930.
Baker, W.A., Hitman, G.A., Hawrami, K., McCarthy, M.L, Riikonen, A.,
Tuomilehto-Wolf, E., Nissinen, A., Tuomilehto, l, Mohan, V., Viswanathan, M.,
Snehalatha, c., Ramachandran, A, Dowse, G.K., Zimmet, P., Seljeantson, S.W.
1994. Apolipoprotein D gene polymorphism: a new genetic marker for type 2
diabetic subjects in Nauru and south India. Diabet. Med. 11: 947-952.
Balbin, M., Freije, lM., Fueyo, A, Sanchez, L.M., Lopez-Otin, C. 1990.
Apolipoprotein D is the major protein component in cyst fluid from women with
human breast gross cystic disease. Biochem. J. 271: 803-807.
Balboa, M.A., Balsinde, l 2006. Oxidative stress and arachidonic acid mobilization.
Biochim. Biophys. Acta 1761: 385-391.
Baris, O., Savagner, F., Nasser, V., Loriod, B., Granjeaud, S., Guyetant, S., Franc, B.,
Rodien, P., Rohmer, V., Bertucci, F., Birnbaum, D., Malthièry, Y., Reynier, P.,
Houlgatte, R. 2004. Transcriptional profiling reveals coordinated up-regulation of
oxidative metabolism genes in thyroid oncocytic tumors. l Clin. Endocrinol.
Metab. 89: 994-1005.
Bames, C.A. 1979. Memory deficits associated with senescence: a
neurophysiological and behavioral study in the rat. l Comp. Physiol. Psychol. 93:
74-104.
Basili, S., Pacini, G., Guagnano, M.T., Manigrasso, M.R., Santilli, F., Pettinella, c., Ciabattoni, G., Patrono, c., Davi, G. 2006. lnsulin resistance as a determinant of
platelet activation in obese women. l Am. Coll. Cardiol. 48: 2531-2538.
Baulieu, E.E. 1998. Neurosteroids: a novel function of the brain.
Psychoneuroendocrinology 23: 963-987.
282
Bazan, N,G" Marcheselli, V.L., Cole-Edwards, K. 2005. Brain response to injury and
neurodegeneration: endogenous neuroprotective signaling. Ann. N. Y Acad. Sci.
1053 : 137-147.
Beai, M.F. 2002. Oxidatively modified proteins in aging and disease. Free Radie.
Biol. Med. 32: 797-803.
Beck, R., Bertolino, S., Abbot, S.E., Aaronson, P.L, Smirnov, S.V. 1998. Modulation
of arachidonic acid release and membrane fluidity by album in in vascular smooth
muscle and endothelial cells. Circ. Res. 83: 923-931.
Belloir, B., Kovari, E., Surini-Demiri, M., Savioz, A. 2001. Altered apolipoprotein 0
expression in the brain of patients with Alzheimer disease. 1. Neurosci. Res. 64:
61-69.
Bender, H.S., Chickering, W.R. 1985. Pregnancy and diabetes: the maternal response.
Life Sci. 37: 1-9.
Biernacki, K., Prat, A., Blain, M., Antel, 1.P. 2004. Regulation of cellular and
molecular trafficking across human brain endothelial cells by Th 1- and Th2
polarized lymphocytes. 1. Neuropathol. Exp. Neurol. 63: 223-232.
Bishop, R.E., Penfold, S.S., Frost, L.S., Holtje, 1.V., Weiner, 1.B. 1995. Stationary
phase expression of a novel Escherichia coli outer membrane lipoprotein and its
relationship with mammalian apolipoprotein D. Implications for the ongm of
lipocalins. J. Biol. Chem. 270: 23097-23103.
Bjorkhem, L, Meaney, S. 2004. Brain cholesterol: long secret life behind a barrier.
Arterioscler. Thromb. Vasco Biol. 24: 806-815.
Blais, Y., Sugimoto, K., Carrière, M.C., Haagensen, D.E., Labrie, F., Simard, 1. 1995.
Interleukin-6 inhibits the potent stimulatory action of androgens, glucocorticoids
and interleukin-I alpha on apolipoprotein 0 and GCDFP-15 expression in human
breast cancer cells. Int. 1. Cancer 62: 732-737.
Blais, Y, Sugimoto, K., Carrière, M.C., Haagensen, D.E., Labrie, F., Simard, 1. 1994.
Potent stimulatory effect of interleukin-I alpha on apolipoprotein D and gross
283
cystic disease fluid protein-15 expression In human breast-cancer ceUs. Int. J.
Cancer 59: 400-407.
Blanco-Vaca, F., Via, D.P., Yang, c.v., Massey, J.B., Pownall, H.J. 1992.
Characterization of disulfide-linked heterodim€rs containing apolipoprotein D in
human plasma lipoproteins. J. Lipid Res. 33: 1785-1796.
Bojanovski, D., Alaupovic, P., McConathy, W.J., Kelly, 1.L. 1980. Isolation and
partial characterization of apolipoprotein D and lipoprotein D from baboon
plasma. FEBS Lett. 112: 251-254.
Bonavia, A., Arbour, N., Yong, V.W., Talbot, P.J. 1997. Infection of primary cultures
of human neural cells by human coronaviruses 229E and OC43. J. Virol. 71: 800
806.
Bonventre, J.V. 1992. Phospholipase A2 and signal transduction. 1. Am. Soc.
Nephrol. 3: 128-150.
Borghini, 1., Barja, F., Pometta, D., James, R.W. 1995. Characterization of
subpopulations of lipoprotein particles isolated from human cerebrospinal fluid.
Biochim. Biophys. Acta 1255: 192-200.
Bostrbm, P., Andersson, L., Rutberg, M., Perman, 1., Lidberg, u., Johansson, B.R.,
Fernandez-Rodriguez, J., Ericson, 1., Nilsson, T., Borén, J., Olofsson, S.O. 2007.
SN ARE proteins mediate fusion between cytosolic lipid drop1ets and are
implicated in insulin sensitivity. Nat. Cel!. Biol. 9: 1286-1293.
Boucher, A., Desforges, M., Duquette, P., Talbot, P.J. 2007. Long-term human
coronavirus-myelin cross-reactive T-ce\l clones derived from multiple sclerosis
patients. Clin. Immunol. 123: 258-267.
Boyles, J.K., Notterpek, L.M., Anderson, L.J. 1990a. Accumulation of
apolipoproteins in the regenerating and remyelinating mammalian peripheral
nerve. Identification of apolipoprotein D, apolipoprotein A-IV, apolipoprotein E,
and apolipoprotein A-I. 1. Biol. Chem. 265: 17805-17815.
284
Boyles, J.K., Notterpek, L.M., Wardel1, M.R., Rail, S.c. Jr. 1990b. Identification,
characterization, and tissue distribution of apolipoprotein D in the rat. J. Lipid
Res. 31: 2243-2256.
Brasier, A.R., Ron, D., Tate, J.E., Habener, J.F. 1990. A family of constitutive
C/EBP-like DNA binding proteins attenuate the IL-l alpha induced, NF kappa B
mediated trans-activation of the angiotensinogen gene acute-phas response
element. EMBO J. 9: 3933-3944.
Breustedt, D.A., Schonfeld, D.L., Skerra, A. 2006. Comparative ligand-binding
analysis often human lipocalins. Biochim. Biophys. Acta. 1764: 161-173.
Bujalska, I.J., Quinkler, M., Tomlinson, J.W., Montague, C.T, Smith, D.M., Stewart,
P.M. 2006. Expression profiling of Il beta-hydroxysteroid dehydrogenase type-l
and glucocorticoid-target genes 111 subcutaneous and omental human
preadipocytes. J. Mol. Endocrinol. 37: 327-340.
Busacchi, P., De Giorgio, R., Santini, D., Bel1avia, E., Perri, T, Oliverio, c., Paradisi,
R., Corinaldesi, R., Flamigni, C. 1999. A histological and immunohistochemical
study of neuropeptide containing somatic nerves in the levator ani muscle of
women with genitourinary prolapse. Acta Obstet. Gynecol. Scand. 78: 2-5.
Bush, TG., Puvanachandra, N., Homer, C.H., Polito, A., Ostenfeld, T., Svendsen,
C.N., Mucke, L., Johnson, M.H., Sofroniew, M.V. 1999. Leukocyte infiltration,
neuronal degeneration, and neurite outgrowth after ablation of scar-forming,
reactive astrocytes in adult transgenic mice. Neuron 23: 297-308.
Buss, H., Chan, TP., Sluis, K.B., Domigan, N.M., Winterbourn, C.C. 1997. Protein
carbonyl measurement by a sensitive ELISA method. Free Radie. Biol. Med. 23:
361-366.
Butler, A.A., Cone, R.D. 2003. Knockout studies defining different roles for
melanocortin receptors in energy homeostasis. Ann. N. Y. Acad. Sei. 994: 240
245.
285
Butler, N., Pewe, L., Trandem, K., Perlman, S. 2006. Murine encephalitis caused by
HCoV-OC43, a human coronavirus with broad species specificity, is partly
immune-mediated. Virology 347: 410-421.
Calder, P.C. 2005. Polyunsaturated fatty acids and inflammation. Biochem. Soc.
Trans. 33: 423-427.
Calvo, C.F., Yoshimura, T, Gelman, M., Mallat, M. 1996. Production of monocyte
chemotactic protein-I by rat brain macrophages. Eur. J Neurosci. 8: 1725-1734.
Carr, D.J, Chodosh, J, Ash, J, Lane, TE. 2003. Effect of anti-CXCLI 0 monoclonal
antibody on herpes simplex virus type 1 keratitis and retinal infection. J Virol. 77:
10037-10046.
Chan, P.H., Epstein, CJ., Li, Y., Huang, TT, Carlson, E., Kinouchi, H., Yang, G.,
Kamii, H., Mikawa, S., Kondo, T, et al. 1995. Transgenic mice and knockout
mutants in the study of oxidative stress in brain injury. J Neurotrauma 12: 815
824.
Charron lB, Ouellet F, Houde M, Sarhan F. 2008. The plant Apolipoprotein D
ortho log protects Arabidopsis against oxidative stress. BMC Plant Biol. 8: 86
[Epub ahead of print].
Ching, K.H., Kisailus, A.E., Burbelo, P.D. 2007. Biochemical characterization of
distinct regions of SPEC molecules and their l'ole in phagocytosis. Exp. Cell. Res.
313: 10-21.
Ciaraldi, TP., Morales, AJ., Hickman, M.G., Odom-Ford, R., Olefsky, JM., Yen,
S.S. 1997. Cellular insulin resistance in adipocytes from obese polycystic ovary
syndrome subjects involves adenosine modulation of insu lin sensitivity. J Clin.
Endocrinol. Metab. 82: 1421-1425.
Clements, JA., Rohde, P., Allen, V., Hyland, VJ., Samaratunga, M.L., Tilley, W.D.,
Lavin, M.F., Gardiner, R.A. 1999. Molecular detection of prostate cells in
ejaculate and urethral washings in men with suspected prostate cancer. l. Urol.
161: 1337-1343.
286
Cofer, S., Ross, S.R. 1996. The murine gene encoding apolipoprotein 0 exhibits a
unique expression pattern as compared to other species. Gene 171: 261-263.
Crawley, 1. 2000. What's wrong with my mouse?: behavioral phenotyping of
transgenic and knockout mice. Wiley-Liss, New York, NY, USA.
Dakhale, G., Khanzode, S., Khanzode, S., Saoji, A., Khobragade, L., Turankar, A.
2004. Oxidative damage and schizophrenia: the potential benefit by atypical
antipsychotics. Neuropsychobiology 49: 205-209.
Dandoy-Dron, f., Guillo, f., Benboudjema, L., Deslys, 1.P., Lasmezas, C., Dormont,
O., Tovey, M.G., Oron, M. 1998. Gene expression in scrapie. Cloning of a new
scrapie-responsive gene and the identification of increased levels of seven other
mRl\JA transcripts. 1. Biol. Chem. 273: 7691-7697.
Davies, K.1. 1999. The broad spectrum of responses to oxidants in proliferating ceUs:
a new paradigm for oxidative stress. IUBMB Life 48: 41-47.
DeCherney, A., Pernoll, M.L. 1994. Current Obstetric & Gynecologie Diagnosis &
Treatment 8th edition. McGraw-Hill Companies, East Norwalk, Connecticut,
USA.
Deeb, S.S., Cheung, M.C, Peng, R.L., Wolf, A.C, Stern, R., Albers, J.1., Knopp,
R.H. 1991. A mutation in the human apolipoprotein A-I gene. Dominant effect
on the level and characteristics of plasma high density lipoproteins. 1. Biol. Chem.
266: 13654-13660.
deI Valle, E., Navarro, A., Astudillo, A., Tolivia, 1. 2003. Apolipoprotein 0
expression in human brain reactive astrocytes. 1. Histochem. Cytochem. 51: 1285
1290.
Delvaux, T., Buekens, P., Thoumsin, H., Dramaix, M., Collette, J. 2003. Cord C
peptide and insulin-like growth factor-l, birth weight, and placenta weight among
North African and Belgian neonates. Am. J. Obstet. Gynecol. 189: 1779-1784.
Demeester, N., Castro, G., Desrumaux, C, De Geitere, C, Fruchart, 1.C., Santens, P.,
Mulleners, E., Engelborghs, S., De Deyn, P.P., Vandekerckhove, 1., Rosseneu,
M., Labeur, C 2000. Characterization and functional studies of lipoproteins, lipid
287
transfer proteins, and lecithin:cholesterol acyltransferase in CSF of normal
individuals and patients with Alzheimer's disease. J. Lipid Res. 41: 963-974.
Oesai, P.P., Bunker, C.H., Ukoli, F.A., Kamboh, M.I. 2002. Genetic variation in the
apolipoprotein 0 gene among African blacks and its significance in lipid
metabolism. Atherosclerosis 163: 329-338.
Oesai, P.P., Hendrie, H.C., Evans, R.M., Murrell, J.R., OeKosky, S.T, Kamboh, M.l.
2003. Genetic variation in apolipoprotein 0 affects the risk of Alzheimer disease
in African-Americans. Am. 1. Med. Genet. 116B: 98-101.
Oesai, P.P., Ikonomovic, M.O., Abrahamson, E.E., Hamilton, R.L., Isanski, B.A.,
Hope, C.E., Klunk, W.E., OeKosky, S.T., Kamboh, M.I. 2005. Apolipoprotein D
is a component of compact but not diffuse amyloid-beta plaques in Alzheimer's
disease temporal cortex. Neurobiol Dis. 20: 574-582.
OeWan, A.T, Arnett, D.K., Atwood, L.O., Province, M.A., Lewis, C.E., Hunt, S.c.,
Eckfeldt, J. 2001. A genome scan for renal function among hypertensives: the
HyperGEN study. Am. 1. Hum. Genet. 68: 136-144.
Oiau, G.Y, Hsieh, A.T, Sarkadi-Nagy, E.A., Wijendran, V., Nathanielsz, P.W.,
Brenna, 1.T. 2005. The influence of long chain polyunsaturate supplementation on
docosahexaenoic acid and arachidonic acid in baboon neonate central nervous
system. BMC Med. 3: Il.
Oieplinger, H., Schoenfeld, P.Y, Fielding, c.1. 1986. Plasma cholesterol metabolism
in end-stage renal disease. Difference between treatment by hemodialysis or
peritoneal dialysis. 1. Clin. Invest. 77: 1071-1083.
Diez-Itza, I., Vizoso, F., Merino, A.M., Sanchez, L.M., Tolivia, 1., Fernandez, J.,
Ruibal, A., Lopez-Otin, C. 1994. Expression and prognostic significance of
apolipoprotein 0 in breast cancer. Am. 1. Pathol. 144: 310-320.
Oilley, W.G., Haagensen, O.E., Cox, C.E., Wells, S.A. Jr. 1990. Immunologic and
steroid binding properties of the GCDFP-24 protein isolated from human breast
gross cystic disease fluid. Breast Cancer Res. Treat. 16: 253-260.
288
Do Carmo S, Levros LC Jr, Rassart E. 2007. Modulation of apolipoprotein D
expression and translocation under specific stress conditions. Biochim Biophys
Acta. 1773: 954-969.
Do Carmo, S., Séguin, O., Milne, R., Rassart, E. 2002. Modulation of apolipoprotein
o and apolipoprotein E mRNA expression by growth arrest and identification of
key elements in the promoter. J. Biol. Chem. 277: 5514-5523.
Drayna, O., Fielding, c., McLean, 1., Baer, B., Castro, G., Chen, E., Comstock, L.,
Henzel, W., Kohr, W., Rhee, L., Wion, K., Lawn, R. 1986. Cloning and expression
ofhuman apolipoprotein 0 cDNA. J. Biol. Chem. 261: 16535-16539.
Drayna, D.T., McLean, J.W., Wion, K.L., Trent, lM., Drabkin, H.A., Lawn, R.M.
1987. Human apolipoprotein 0 gene: gene sequence, chromosome localization,
and homology to the alpha 2u-globulin superfamily. DNA 6: 199-204.
Dudas, 1., Mansuroglu, T., Batusic, O., Saile, B., Ramadori, G. 2007. Thy-I IS an ID
vivo and in vitro marker of liver myofibroblasts. Cell Tissue Res. 329: 503-514.
Edvardsson, U., Bergstrom, M., Alexandersson, M., Bamberg, K., Ljung, 8., DahllOf,
B. 1999. Rosiglitazone (BRL49653), a PPARgamma-selective agonist, causes
peroxisome proliferator-like liver effects in obese mice. 1. Lipid Res. 40: 1177
1184.
Eichinger, A., Nasreen, A., Kim, H.J., Skerra, A. 2007. Structural insight into the
dual ligand specificity and mode of high density lipoprotein association of
apolipoprotein D. 1. Biol. Chem. 282: 31068-31075.
Elkabes, S., DiCicco-Bloom, E.M., Black, LB. 1996. Brain microglia/macrophages
express neurotrophins that selectively regulate microglial proliferation and
function. J. Neurosci. 16: 2508-2521.
Facchini, F.S., Hua, N., Abbasi, F., Reaven, G.M. 2001. Insulin resistance as a
predictor of age-related diseases. l Clin. Endocrinol. Metab. 86: 3574-3578.
Farooqui, A.A., Horrocks, L.A., Farooqui, T. 2007. Modulation of inflammation in
brain: a matter of fat. J. Neurochem. 1û1: 577-599.
289
Farooqui, A.A, Ong, W.Y., Horrocks, L.A 2004. Biochemical aspects of
neurodegeneration ln human brain: involvement of neural membrane
phospholipids and phospholipases A2. Neurochem. Res. 29: 1961-1977.
Farooqui, A.A., Yang, H.C., Horrocks, L. 1997. Involvement of phospholipase A2 in
neurodegeneration. Neurochem. Int. 30: 517-522.
Faulkner, J.R., Herrmann, lE., Woo, M.l, Tansey, K.E., Ooan, N.B., Sofroniew,
M. V. 2004. Reactive astrocytes protect tissue and preserve function after spinal
cord injury. l Neurosci. 24: 2143-2155.
Fialova, L., Malbohan, L, Kalousova, M., Soukupova, l, Krofta, L., Stipek, S., Zima,
T. 2006. Oxidative stress and inflammation in pregnancy. Scand. l Clin. Lab.
Invest. 66: 121-127.
Fielding, P.E., Fielding, C.J. 1980. A cholesteryl ester transfer complex in human
plasma. Proc. Natl Acad. Sei. USA 77: 3327-3330.
Flatscher-Bader, T., Wilce, P.A. 2006. Chronic smoking and alcoholism change
expression of selective genes in the human prefrontal cortex. Alcohol Clin. Exp.
Res. 30: 908-915.
Flo, T.H., Smith, K.O., Sato, S., Rodriguez, O.l, Holmes, M.A, Strong, R.K., Akira,
S., Aderem, A. 2004. Lipocalin 2 mediates an innate immune response to bacterial
infection by sequestrating iron. Nature 432: 917-92 1.
Flower, O.R., North, AC.T., Sansom, C.E. 2000. The lipocalin protein family:
structural and sequence overview. Biochim. Biophys. Acta. 1482: 9-24.
Forss-Petter, S., Oanielson, P.E., Catsicas, S., Battenberg, E., Priee, l, Nerenberg,
M., Sutcliffe, lO. 1990. Transgenic mice expressing beta-galactosidase in mature
neurons under neuron-specific enolase promoter control. Neuron 5: 187-197.
François, M., Richette, P., Tsagris, L., Fitting, c., Lemay, c., Benallaoua, M., Tahiri,
K., Corvol, M.T. 2006. Activation of the peroxisome proliferator-activated
reeeptor alpha pathway potentiates interleukin-l receptor antagonist production in
cytokine-treated chondrocytes. Arthritis Rheum. 54: 1233-1245.
290
Francone, O.L., Gurakar, A., Fielding, e. 1989. Distribution and functions of
lecithin:cholesterol acyltransferase and cholesteryl ester transfer protein in plasma
lipoproteins. Evidence for a functional unit containing these activities together
with apolipoproteins A-I and 0 that catalyzes the esterification and transfer of
cell-derived cholesterol. J Biol. Chem. 264 :7066-7072.
Franz, G., Reindl, M., Patel, S.e., Beer, R., Unterrichter, 1., Berger, T., Schmutzhard,
E., Poewe, W., Kampf1, A. 1999. Increased expression of apolipoprotein D
following experimental traumatic brain injury. J Neurochem. 73: 1615-1625.
Frenette Charron, JB., Breton, G., Badawi, M., Sarhan, F. 2002. Molecular and
structural analyses of a novel temperature stress-induced lipocalin from wheat and
Arabidopsis. FEBS Lett. 517: 129-32.
Ganfornina, M.D., Do Carmo, S., Lora, lM., Torres-Schumann, S., Vogel, M.,
Allhorn, M., Gonzalez, e., Bastiani, M.l, Rassart, E., Sanchez, D. 2008.
Apolipoprotein 0 is involved in the mechanisms regulating protection from
oxidative stress. Aging cell 7: 506-515.
Ganfornina, M.D., Sanchez, O., Pagano, A., Tonachini, L., Descalzi-Cancedda, F.,
Martinez, S. 2005. Molecular characterization and developmental expression
pattern of the chicken apolipoprotein 0 gene: implications for the evolution of
vertebrate lipocalines. Dev. Dyn. 232: 191-199.
Garcia-Segura, L.M., Naftolin, F., Hutchison, lB., Azcoitia, 1., Chowen, lA. 1999.
Role of astroglia in estrogen regulation of synaptic plasticity and brain repair. J.
Neurobiol. 40: 574-584.
Gattoni, M., Boffi, A. 2003. The effect of isof1urane on erythrocyte membranes
studied by ATR-FTIR. Biochim Biophys Acta 1613: 72-78.
Gebicke-Haerter, P.J. 2005. Microarrays and expression profiling 111 microglia
research and in inf1arnrnatory brain disorders. J. Neurosci. Res. 81: 327-341.
Ghoumari, A.M., Ibanez, e., EI-Etr, M., Leclerc, P., Eychenne, B., O'Malley, B.W.,
Baulieu, E.E., Schllmacher, M. 2003. Progesterone and its metabolites increase
291
myelin basic protein expression in organotypic slice cultures of rat cerebellum. J.
Neurochem. 86: 848-859.
Giovannoni, G., Baker, O. 2003. Inflammatory disorders of the central nervous
system. Curr. Opin. Neurol. 16: 347-350.
Glockner, F., Ohm, T.G. 2003. Hippocampal apolipoprotein 0 level depends on
Braak stage and APOE genotype. Neuroscience 122: 103-110.
Goessling, W., Zucker, S.O. 2000. Role of apolipoprotein 0 in the transport of
bilirubin in plasma. Am. J. Physiol. Gastrointest. Liver Physiol. 279: G356-G365.
Goetz, O.H., Holmes, M.A, Borregaard, N., Bluhm, M.E., Raymond, K.N., Strong,
R.K. 2002. The neutrophil lipocalin NGAL is a bacteriostatic agent that interferes
with siderophore-mediated iron acquisition. Mol. Cell. 10: 1033-1043.
Gordon, 1.W., Chesa, P.G., Nisbimura, H., Rettig, W.1., Maccari, J.E., Endo, T.,
Seravalli, E., Seki, 1., Silver, 1. 1987. Regulation of Thy-l gene expressIOn 10
transgenic mice. Cel! 50: 445-452.
Gottsch, J.O., Bowers, AL., Margulies, E.H., Seitzman, G.O., Kim, S.W., Saha, S.,
Jun, A.S., Stark, W.1., Liu, S.H. 2003. Seriai analysis of gene expression in the
corneal endothelium of Fuchs' dystrophy. lnvest. Ophthalmol. Vis. Sci. 44: 594
599.
Govindarajan, R., Rastogi, S., Vijayakumar, M., Shirwaikar, A, Rawat, A.K.,
Mehrotra, S., Pushpangadan, P. 2003. Studies on the antioxidant activities of
Oesmodium gangeticum. Biol. Pharm. Bull. 26: 1424-1427.
Guay, 1., Bateman, K., Gordon, R., Mancini, J., Riendeau, O. 2004. Carrageenan
induced paw edema in rat elicits a predominant prostaglandin E2 (PGE2) response
in the central nervous system associated with the induction of microsomal PGE2
synthase-l. J. Biol. Chem. 279: 24866-24872.
Hal!, R.E., Aspinall, J.O., Horsfall, 0.1., Birrel!, S.N., Bentel, J.M., Sutherland, R.L.,
Tilley, w.o. 1996. Expression of the androgen receptor and an androgen
responsive protein, apolipoprotein D, in human breast cancer. Br. J. Cancer 74:
1175-1180.
292
Hall, R.E., Horsfall, 0.1., Stahl, 1., Vivekanandan, S., Ricciardelli, C., Stapleton,
A.M., Scardino, P.1., Neufing, P., Tilley, W.O. 2004. Apolipoprotein-O: a novel
cellular marker for HGPIN and prostate cancer. Prostate 58: 103-108.
Hansen, L., Gaster, M., Oakeley, E.J., Brusgaard, K., Oamsgaard Nielsen, E.M.,
Beck-Nielsen, H., Pedersen, O., Hemmings, B.A. 2004. Expression profiling of
insulin action in human myotubes: induction of inflammatory and pro-angiogenic
pathways in relationship with glycogen synthesis and type 2 diabetes. Biochem.
Biophys. Res. Commun. 323: 685-695.
Harada, N., Oda, Z., Hara, Y., Fujinami, K., Okawa, M., Ohbuchi, K., Yonemoto, M.,
Ikeda, Y., Ohwaki, K., Aragane, K., Tamai, Y., Kusunoki, 1. 2007. Hepatic de
nova lipogenesis is present in liver-specific ACC I-deficient mice. Mo!. Cel!. Biol.
27: 1881-1888.
Harding, c., Osundeko, O., Tetlow, L., Faragher, E.B., Howell, A., Bundred, N.J.
2000. Honnonally-regulated proteins in breast secretions are markers of target
organ sensitivity. Br. 1. Cancer 82: 354-360.
Helisalmi, S., Hiltunen, M., Vepsalainen, S., Iivonen, S., Corder, E.H., Lehtovirta,
M., Mannermaa, A., Koivisto, A.M., Soininen, H. 2004. Genetic variation in
apolipoprotein 0 and Alzheimer's disease. 1. Neurol. 251: 951-957.
Herrera, E. 2000. Metabolic adaptations in pregnancy and their implications for the
availability of substrates to the fetus. Eur. J. Clin. Nutr. 54: S47-S51.
Hitman, G.A., McCarthy, M.L, Mohan, V., Viswanathan, M. 1992. The genetics of
non-insulin-dependent diabetes mellitus in south India: an overview. Ann. Med.
24: 491-497.
Hu, B., Wu, Z., Jin, H., Hashimoto, N., Liu, 1., Phan, S.H. 2004. CCAAT/enhancer
binding protein beta isoforms and the regulation of alpha-smooth muscle actin
gene expression by IL-l beta. J. Immuno!. 173: 4661-4668.
Hu, c.Y., Ong, W.Y., Sundaram, R.K., Chan, C., Patel, S.C. 2001.
Immunocytochemical localization of apolipoprotein 0 in oligodendrocyte
293
precursor-like cells, perivascular ceUs, and pericytes in the human cerebral cortex.
l Neurocytol. 30: 209-218.
Hu, W., Feng, Z., Eveleigh, l, Iyer, G., Pan, l, Amin, S., Chung, F.L., Tang, M.S.
2002. The major lipid peroxidation product, trans-4-hydroxy-2-nonenal,
preferentially forms DNA adducts at codon 249 of human p53 gene, a unique
mutational hotspot in hepatocellular carcinoma. Carcinogenesis 23: 1781-1789.
Hu, Z.Y., Boun'eau, E., lung-Testas, L, Robel, P., Baulieu, E.E. 1987. Neurosteroids:
oligodendrocyte mitochondria convert cholesterol to pregnenolone. Proc. Natl
Acad. Sei. USA 84: 8215-8219.
Hudon-David, F., Bouzeghrane, F., Couture, P., Thibault, G. 2007. Thy-l expression
by cardiac fibroblasts: lack of association with myofibroblast contractile markers.
J. Mol. Cel!. Cardiol. 42: 991-1000.
Hulbert, A.J. 2005. On the importance of fatty acid composition of membranes for
aging. l Theor. Biol. 234: 277-288.
Hummasti, S., Laffitte, B.A., Watson, M.A., Galardi, c., Chao, L.C, Ramamurthy,
L., Moore, lT., Tontonoz, P. 2004. Liver X receptors are regulators of adipocyte
gene expression but not differentiation: identification of apoD as a direct target. J.
Lipid Res. 45: 616-625.
Hunter, S., Young, A., Oison, l, Brat, D.l, Bowers, G., Wilcox, lN., laye, D.,
Mendrinos, S., Neish, A. 2002. Differentiai expression between pilocytic and
anaplastie astrocytomas: identification of apolipoprotein D as a marker for low
grade, non-infiltrating primary CNS neoplasms. l Neuropathol. Exp. Neurol. 61:
275-28l.
Hytten, F. 1985. Blood volume changes in normal pregnancy. Clin. Haematol. 14:
601-12.
Iacobuzio-Donahue, C.A., Maitra, A., Shen-Ong, G.L., van Heek, T., Ashfaq, R.,
Meyer, R., Walter, K., Berg, K., HoUingsworth, M.A., Cameron, lL., Yeo, Cl,
Kern, S.E., Goggins, M., Hruban, R.H. 2002a. Discovery of novel tumor markers
294
of pancreatic cancer using global gene expression technology. Am. J. Pathol. 160:
1239-1249.
Iacobuzio-Donahue, C.A., Ryu, B., Hruban, R.H., Kern, S.E. 2002b. Exploring the
host desmoplastic response to pancreatic carcinoma: gene expression of stromal
and neoplastic ceIls at the site of primary invasion. Am. J. Pathol. 160: 91-99.
Irani, D.N., Griffin, D.E. 1996. Regulation of lymphocyte homing into the brain
during viral encephalitis at various stages of infection. J. Immunol. 156: 3850
3857.
Jacomy, H., Fragoso, G., Almazan, G., Mushynski, W.E., Talbot, P.J. 2006. Human
coronavirus OC43 infection induces chronic encephalitis leading to disabilities in
BALB/C mice. Virology 349: 335-346.
Jacomy, H., Talbot, P.J. 2003. Vacuolating encephalitis in mice infected by human
coronavirus OC43. Virology 315: 20-33.
Jamaluddin, M. Meng, T. Sun, J. Boldogh, 1. Han, Y. Brasier, A.R. 2000. Angiotensin
II induces nuclear factor (NF)-kappaB 1 isoforms to bind the angiotensinogen gene
acute-phase response element: a stimulus-specific pathway for NF-kappaB
activation. Mol. Endocrinol. 14: 99-113.
James, R.W., Martin, B., Pometta, D., Grab, B., Suenram, A. 1986. Apoprotein D in a
healthy, male population and in male myocardial infarction patients and their
male, first-degree relatives. Atherosclerosis 60: 49-53.
Jin, D., El-Tanani, M., Campbell, F.C. 2006. Identification of apolipoprotein D as a
novel inhibitor of osteopontin-induced neoplastic transformation. Int. J. Oncol. 29:
1591-1599.
Johnston, c., Jiang, W., Chu, T., Levine, B. 2001. Identification of genes involved in
the host response to neurovirulent alphavirus infection. J. Virol. 75: 10431-10445.
Jonsson, L., Skarphedinsson, J.O., Skuladottir, G.V., Watanobe, H., Schioth, H.B.
2002. Food conversion is transiently affected during 4-week chronic
administration of melanocortin agonist and antagonist in rats. J. Endocrinol. 173:
517-523.
295
Kaiser, L., Allen, L.H.; American Dietetic Association. 2008. Position of the
American Dietetic Association: nutrition and lifestyle for a healthy pregnancy
outcome. l Am. Diet. Assoc. 108: 553-561.
Kallen, C.B. 2004. Steroid hormone synthesis in pregnancy. Obstet. Gynecol. Clin.
North. Am. 31: 795-816.
Kalman, l, McConathy, W., Araoz, c., Kasa, P., Lacko, A.G. 2000. Apolipoprotein
D in the aging brain and in Alzheimer's dementia. Neurol. Res. 22: 330-336.
Kang, S., Seo, S., Hill, l, Kwon, B., Lee, H., Cho, H., Vinay, D., Kwon, B. 2003.
Changes in gene expression in latent HSV-\-infected rabbit trigeminal ganglia
following epinephrine iontophoresis. Curr. Eye Res. 26: 225-229.
Kao, L.c., Tulac, S., Lobo, S., lmani, B., Yang, lP., Germeyer, A., Osteen, K.,
Taylor, R.N., Lessey, B.A., Giudice, L.c. 2002. Global gene profiling in human
endometrium during the window of implantation. Endocrinology 143: 2119-2138.
Kesner, L., Yu, W.S., Bradlow, H.L., Breed, C.W., Fleisher, M. 1988. Proteases in
cyst fluid from human gross cyst breast disease. Cancer Res. 48: 6379-6383.
Khan, M.M., Parikh, V.V., Mahadik, S.P. 2003. Antipsychotic drugs differentially
modulate apolipoprotein D in rat brain. l Neurochem. 86: 1089-1100.
Khanzode, S.S., Muddeshwar, M.G., Khanzode, S.D., Dakhale, G.N. 2004.
Antioxidant enzymes and lipid peroxidation in different stages of breast cancer.
Free Radic. Res. 38: 81-85.
Kim, H.J., Je, H.l, Cheon, H.M., Kong, S.Y., Han, l, Yun, c.Y., Han, Y.S., Lee,
I.H., Kang, Y.J., Seo, S.l 2005. Accumulation of 23 kDa lipocalin during brain
development and injury in Hyphantria cunea. lnsect Biochem. Mol. Biol. 35:
1133-1141.
Klein, R.S. 2004. Regulation of neuroinflammation: the role of CXCL lOin
lymphocyte infiltration during autoimmune encephalomyelitis. l Cel!. Biochem.
92: 213-222.
Kolodny, E.H. 2000. Niemann-Pick disease. Curr. Opin. Hematol. 7: 48-52.
296
Kostner, G.M., Schaupp, K., Stvarnik, G. 1988. Exchange and transfer of
apolipoproteins and lipids: impact on lipoprotein metabolism. Adv. Exp. Med.
Biol. 243: 333-338.
Kraegen, E.W., Cooney, G.J., Ye, l, Thompson, A.L. 2001. Triglycerides, fatty acids
and insulin resistance hyperinsulinemia. Exp. Clin. Endocrinol. Diabetes 109:
S516-S526.
Kushner, P.J., Agard, D.A., Greene, G.L., Scanlan, T.S., Shiau, A.K., Uht, R.M.,
Webb, P. 2000. Estrogen receptor pathways to AP-l, l Steroid Biochem. Mol.
Biol. 74: 311-317.
Laffitte, B.A., Chao, L.C., Li, l, Walczak, R., Hummasti, S., Joseph, S.B., Castrillo,
A., Wilpitz, D.C., Mangelsdorf, D.J., Collins, J.L., Saez, E., Tontonoz, P. 2003.
Activation of liver X receptor improves glucose tolerance through coordinate
regulation of glucose metabolism in liver and adipose tissue. Proc Natl Acad Sci
USA 100: 5419-5424.
Lafond, l, Moukdar, F., Rioux, A., Ech-Chadli, H., Brissette, L., Robidoux, l,
Masse, A., Simoneau, L. 2000. Implication of ATP and sodium in arachidonic acid
incorporation by placental syncytiotrophoblast brush border and basal plasma
membranes in the human. Placenta 21: 661-669.
Lambert, J., Provost, P.R., Marcel, Y.L., Rassart, E. 1993. Structure of the human
apolipoprotein 0 gene promoter region. Biochim. Biophys. Acta. 1172: 190-192.
Lamelas, M.L., Vazquez, l, Enguita, M.l., Rodriguez, lC., Gonzalez, L.O., Merino,
A.M., Vizoso, F. 2000. Apolipoprotein 0 expression in metastasic Iymph nodes
ofbreast cancer. Int. l Surg. Investig. 2: 285-293.
Lane, D.M., McConathy, W.J. 1983. Factors affecting the lipid and apolipoprotein
levels of cord sera. Pediatr. Res. 17: 83-91.
Lavoie, lM., Gauthier, M.S. 2006. Regulation of fat metabolism in the liver: link to
non-alcoholic hepatic steatosis and impact of physical exercise. Cell. Mol. Life
Sci. 63: 1393-1409.
297
Lea, O.A. 1988. Binding properties of progesterone-binding Cyst protein, PBCP.
Steroids 52: 337-338.
Lechner, M., Wojnar, P., Redl, B. 2001. Human tear lipocalin acts as an oxidative
stress-induced scavenger of potentially harrnful lipid peroxidation products in a
cell culture system. Biochem. 1. 356: 129-135.
Lee, A.K. Sung, S.R Kim, Y.c. Kim, S.O. 2003. Inhibition of lipopolysaccharide
inducible nitric oxide synthase, TNF-alpha and COX-2 expression by sauchinone
effects on I-kappaBalpha phosphorylation, C/EBP and AP-I activation. Br. l.
Pharmacol. 139: 11-20.
Leung, W.c., Lawrie, A., Demaries, S., Massaeli, H., Burry, A., Yablonsky, S.,
Sarjeant, 1.M., Fera, E., Rassart, E., Pickering, lO., Rabinovitch, M. 2004.
Apolipoprotein D and platelet-derived growth factor- BB synergism mediates
vascular smooth muscle cell migration. Circ. Res. 95: 179-186.
Lewohl, lM., Wang, L., Miles, M.F., Zhang, L., Dodd, P.K, Harris, R.A. 2000. Gene
expression in human alcoholism: microarray analysis of frontal cortex. Alcohol
Clin. Exp. Res. 24: 1873-1882.
Li, X., Miyajima, M., Mineki, R., Taka, H., Murayama, K., Arai, H. 2006. Analysis
of potential diagnostic biomarkers in cerebrospinal fluid of idiopathie normal
pressure hydrocephalus by proteomics. Acta Neurochir. (Wien). 148: 859-864.
LieuaUen, K., Pennacchio, L.A., Park, M., Myers, KM., Lennon, G.G. 2001. Cystatin
B-deficient mice have increased expression of apoptosis and glial activation
genes. Hum. Mol. Genet. 10: 1867-1871.
Lin, C.S., Ho, RC., Gholami, S., Chen, K.c., lad, A., Lue, T.F. 2001. Gene
expression profiling of an arteriogenic impotence model. Biochem. Biophys. Res.
Commun. 285: 565-569.
Liu, Z. Chang, G.Q. Leibowitz, S.F. 2001. Apolipoprotein D interacts with the long
form leptin receptor: a hypothalamic function in the control of energy homeostasis.
FASEB 1. 15: 1329-1331.
298
Lopez-Boado, YS., Klaus, M., Dawson, M.l., Lopez-Otin, C. 1996. Retinoic acid
induced expression of apolipoprotein D and concomitant growth arrest in human
breast cancer cells are mediated through a retinoic acid receptor RARalpha
dependent signaling pathway, 1. Biol. Chem. 271: 32105-32111.
Lopez-Boado, YS., Puente, X.S., Alvarez, S., Tolivia, 1., Binderup, L., Lopez-Otin,
C. 1997. Growth inhibition of human breast cancer cells by 1,25
dihydroxyvitamin 03 is accompanied by induction of apolipoprotein 0
expression. Cancer Res. 57: 4091-4097.
Lopez-Boado, YS., Tolivia, J., Lopez-Otin, C. 1994. Apolipoprotein D gene
induction by retinoic acid is concomitant with growth arrest and cel1
differentiation in human breast cancer cells. l Biol. Chem. 269: 26871-26878.
Lynch, lR., Morgan, D., Mance, l, Matthew, W.D., Laskowitz, D.T. 2001.
Apolipoprotein E modulates glial activation and the endogenous central nervous
system inflammatory response. 1. Neuroimmunol. 114: 107-113.
Madsen, E.M., Lindegaard, M.L., Andersen, C.B., Damm, P., Nielsen, L.B. 2004.
Human placenta secretes apolipoprotein B-I00-containing lipoproteins. l Biol.
Chem. 279: 55271-55276.
Mahadik, S.P., Khan, M.M., Evans, D.R., Parikh, V.V. 2002. Elevated plasma level
of apolipoprotein D in schizophrenia and its treatment and outcome. Schizophr.
Res. 58: 55-62.
Maher, lE., Goldenberg, R.L., Tamura, T., Cliver, S.P., Hoffman, H.J., Davis, R.O.,
Boots, L. 1993. Albumin levels in pregnancy: a hypothesis--decreased levels of
albumin are related to increased levels of alpha-fetoprotein. Early Hum. Dev. 34:
209-215.
Manning-Bog, A.B., McCormack, A.L., Purisai, M.G., BoJin, L.M., Di Monte, D.A.
2003. Alpha-synuclein overexpression protects against paraquat-induced
neurodegeneration. l Neurosci. 23: 3095-3099.
299
Marques, c.P., Hu, S., Sheng, W., Lokensgard, J.R. 2006. Microglial cells initiate
vigorous yet non-protective immune responses during HSV-1 brain infection.
Virus Res. 121: 1-10.
Marques, F., Rodrigues, A.J., Sousa, J.c., Coppola, G., Geschwind, D.B., Sousa, N.,
Correia-Neves, M., Palha, J.A 2008. Lipocalin 2 is a choroid plexus acute-phase
protein. J. Cereb. Blood Flow Metab. 28: 450-455.
Masliah, E., Mallory, M., Ge, N., Alford, M., Veinbergs, 1., Roses, A.D. 1995.
Neurodegeneration in the central nervous system of apoE-deficient mice. Exp.
Neurol. 136: 107-122.
Maymon, R., Zimerman, AL., Strauss, S., Gayer, G. 2007. MaternaI spleen size
throughout normal pregnancy. Sernin. Ultrasound CT MR. 28: 64-66.
McConathy, W.J., Alaupovic, P. 1976. Studies on the isolation and partial
characterization of apolipoprotein 0 and lipoprotein 0 of human plasma.
Biochemistry 15: 515-520.
McConathy, W.J., Lane, O.M. 1980. Studies on the apolipoproteins and lipoproteins
of cord serum. Pediatr. Res. 14: 757-761.
McCormack, A.L., Atienza, J.G., Johnston, L.c., Andersen, J.K., Vu, S., Di Monte,
O.A 2005. Role of oxidative stress in paraquat-induced dopaminergic cell
degeneration. J. Neurochem. 93: 1030-1037.
McEwen, B.S. 1994. How do sex and stress hormones affect nerve cells? Ann. N Y
Acad. Sei. 743: 1-16.
Mensenkamp, AR., Havekes, L.M., Romijn, J.A., Kuipers, F. 2001. Hepatic steatosis
and very low density lipoprotein secretion: the involvement of apolipoprotein E. J.
Hepatol. 35: 816-822.
Milne, R., Rassart, E., Marcel, Y. 1993. Molecular biology of apolipoprotein O.
Current Op. in lipidol. 4: 100-106.
Minehira, K., Young, S.G., Villanueva, C.J., Yetukuri, L., Oresic, M., Hellerstein,
M.K., Farese, R.V. Jr, Horton, J.O., Prcitner, F., Thorens, B., Tappy, L. 2008.
300
Blocking VLDL secretion causes hepatic steatosis but does not affect peripheral
lipid stores or insulin sensitivity in mice. J. Lipid Res. [Epub ahead of print]
Miranda, E., Vizoso, F., Martin, A., Quintela, 1., Corte, M.D., Segui, M.E., Ordiz, 1.,
Merino, A.M. 2003. Apolipoprotein 0 expression in cutaneous malignant
melanoma. J. Surg. Oncol. 83: 99-105.
Montpied, P., de Bock, F., Lerner-Natoli, M., Bockaert, J., Rondouin, G. 1999.
Hippocampal alterations of apolipoprotein E and 0 mRNA levels in vivo and in
vitro following kainate excitotoxicity. Epilepsy Res. 35: 135-146.
Morais Cabral, J.H., Atkins, G.L., Sanchez, L.M., Lopez-Boado, YS., Lopez-Otin,
c., Sawyer, L. 1995. Arachidonic acid binds to apolipoprotein 0: implications for
the protein's function. FEBS Lett. 366: 53-56.
Muffat J, Walker DW, Benzer S. 2008. Human ApoD, an apolipoprotein up-regulated
in neurodegenerative diseases, extends lifespan and increases stress resistance in
Drosophila. Proc Natl Acad Sci USA 105: 7088-7093.
Myint, S., Johnston, S., Sanderson, G., Simpson, H. 1994. Evaluation of nested
polymerase chain methods for the detection of human coronaviruses 229E and
OC43. Mol. Cell. Probes 8: 357-364.
Nakajima, K., Honda, S., Tohyama, Y, lmai, Y, Kohsaka, S., Kurihara, T. 2001.
Neurotrophin secretion from cultured microglia. J. Neurosci. Res. 65: 322-331.
Navarro, A., dei Valle, E., Astudillo, A., Gonzalez dei Rey, c., Tolivia, J. 2003.
lmmunohistochemical study of distribution of apolipoproteins E and 0 in human
cerebral beta amyloid deposits. Exp. Neurol. 184: 697-704.
Navarro, A., dei Valle, E., Tolivia, J. 2004. Differentiai expression of apolipoprotein
o in human astroglial and oligodendroglial cells. J. Histochem. Cytochem. 52:
1031-1036.
Navarro, A., Tolivia, J., Astudillo, A., deI Valle, E. 1998. Pattern of apolipoprotein D
immunoreactivity in human brain. Neurosci Lett. Sep 254: 17-20.
301
Nguyen, K.O. Lee, D.A. 1993. In vitro evaluation of antiproliferative potential of
topical cyclooxygenase inhibitors in human Tenon's fibroblasts. Exp. Eye Res. 57:
97-105.
Nohr, E.A., Vaeth, M., Baker, 1.L., S0rensen, T.I.A., Olsen, J., Rasmussen, K.M.
2008. Combined associations of prepregnancy body mass index and gestational
weight gain with the outcome of pregnancy. Am. 1. Clin. Nutr. 87: 1750-1759.
Novak, 1., Danielson, L.A., Kerchner, LJ., Sherwood, 0.0., Ramirez, RJ., Moalli,
P.A., Conrad, K.P. 2001. Relaxin is essential for renal vasodilation during
pregnancy in conscious rats. J. Clin. Invest. 107: 1469-1475.
O'Donnell, 1., Stemmelin, 1., Nitta, A., Brouillette, 1., Quirion, R. 2003. Gene
expressIOn profiling following chronic NMDA receptor blockade-induced
learning deficits in rats. Synapse 50: 171-180.
Ogawa, K., Utsunomiya, T., Mimori, K., Yamashita, K., Okamoto, M., Tanaka, F.,
Inoue, H., Ikeda, Y, Saku, M., Murayama, S., Mori, M. 2005. Genomic screens
for genes upregulated by demethylation in colorectal cancer: possible usefulness
for clinical application. Int. 1. Oncol. 27: 417-426.
Ohm, T.G., Treiber-Held, S., Distl, R., Glockner, F., Schonheit, B., Tamanai, M.,
Meske,V. 2003. Cholesterol and tau protein--findings in Alzheimer's and
Niemann Pick Cs disease. Pharmacopsychiatry 36: S120-S 126.
Okumura, K., Ohkura, N., Inoue, S., Ikeda, K., Hayashi, K. 1998. A novel
phospholipase A2 inhibitor with leucine-rich repeats from the blood plasma of
Agkistrodon blomhoffii siniticus. Sequence homologies with human leucine-rich
alpha2-glycoprotein.1. Biol. Chem. 273: 19469-19475.
O'Neill, L, 2000. The Toillinterleukin-i receptor domain: a molecular switch for
inflammation and host defence. Biochem. Soc. Trans. 28: 557-563.
Ong, W.Y., He, Y, Suresh, S., Patel, S.c. 1997. Differentiai expressIOn of
apolipoprotein 0 and apolipoprotein E in the kainic acid-lesioned rat
hippocampus. Neuroscience 79: 359-367.
302
Ong, W.Y, Hu, c.y, Patel, S.c. 2002. Apolipoprotein 0 in the Niemann-Pick type C
disease mouse brain: an ultrastructural immunocytochemical analysis. J.
Neurocytol. 31: 121-129.
Ong, W.Y, Lau, c.P., Leong, S.K., Kumar, U., Suresh, S., Patel, S.c. 1999.
Apolipoprotein 0 gene expression ID the rat brain and light and electron
microscopie immunocytochemistry of apolipoprotein 0 expressIOn In the
cerebellum ofneonatal, immature and adult rats. Neuroscience 90: 913-922.
Ordofiez, C. Navarro, A. Perez, C. Astudillo, A. Martinez, E. Tolivia, J. 2006.
Apolipoprotein 0 expression in substantia nigra of Parkinson disease. Histol.
Histopathol. 21: 361-366.
Ostlund, R.E. Jr, Yang, J.W., Klein, S., Gingerich, R. 1996. Relation between plasma
leptin concentration and body fat, gender, diet, age, and metabolic covariates. J.
Clin. Endocrinol. Metab. 81: 3909-3913.
Pacifico, L., Di Renzo, L., Anania, c., Osborn, J.F., lppoliti, F., Schiavo, E., Chiesa,
C. 2006. lncreased T-helper interferon-gamma-secreting cells in obese children.
Eur J Endocrinol154: 691-697.
Pahl, H.L. 1999. Activators and target genes of ReIINF-KB transcription factors.
Oncogene 18: 6853-6866.
Palmer, 0.1., Kelly, V.c., Smit, A.M., Kuy, S., Knight, C.G., Cooper, G.J. 2006.
Human colostrum: Identification of minor proteins in the aqueous phase by
proteomics. Proteomics 6: 2208-2216.
Patel, R.C., Lange, O., McConathy, W.J., Patel, Y.C., Patel, S.C. 1997. Probing the
structure of the ligand binding cavity of lipocalins by fluorescence spectroscopy.
Protein Eng. 10: 621-625.
Patel, S.c., Asotra, K., Patel, Y.c., McConathy, W.J., Patel, R.C., Suresh, S. 1995.
Astrocytes synthesize and secrete the lipophilic ligand carrier apolipoprotein O.
Neuroreport 6: 653-657.
Paumelle, R., Blanquart, c., Briand, O., Barbier, O., Ouhem, C., Woerly, G.,
Percevault, F., FruchaIt, J.c., Dombrowicz, O., Glineur, c., Staels, B. 2006. Acute
303
antiinflammatory properties of statins involve peroxisome proliferator-activated
receptor-alpha via inhibition of the protein kinase C signaling pathway. Circ. Res.
98: 361-369.
Pearlman, W.H., Guériguian, 1.L., Sawyer, M.E. 1973. A specific progesterone
binding component of human breast cyst fluid. 1. Biol. Chem. 248: 5736-5741.
Pechumer, H., Bender-Gotze, c., Ziegler-Heitbrock, H.W. 1993. Detection of neuron
specific gamma-enolase messenger ribonucleic acid in normal human leukocytes
by polymerase chain reaction amplification with nested primers. Lab. Invest. 69:
743-749.
Peitsch, M.C., Boguski, M.S. 1990. Is apolipoprotein D a mammalian bilin-binding
protein? New Biol. 2: 197-206.
Peng, J., Mao, X.O., Stevenson, F.F., Hsu, M., Andersen, 1.K. 2004. The herbicide
paraquat induces dopaminergic nigral apoptosis through sustained activation of
the JNK pathway. 1. Biol. Chem. 279: 32626-32632.
Pippenger, C.E., Browne, R.W., Armstrong, O. 1998. Regulatory antioxidant
enzymes. Methods Mol. Biol. 108: 299-313.
Petersen, K.F., Shulman, G.1. 2006. Etiology of insulin resistance. Am. 1. Med. 119:
S10-S16.
Peterson, P.K., Hu, S., Salak-Johnson, 1., Molitor, T.W., Chao, c.c. 1997.
Differentiai production of and migratory response to beta chemokines by human
microglia and astrocytes. 1. Infect. Dis. 175: 478-481.
Petridou, E., Katsouyanni, K., Hsieh, c.c., Antsaklis, A., Trichopoulos, D. 1992.
Diet, pregnancy estrogens and their possible relevance to cancer risk in the
offspring. Oncology 49: 127-132.
Phipps, R.P., Penney, D.P., Keng, P., Quill, H., Paxhia, A., Derdak, S., Felch, M.E.
1989. Characterization of two major populations of lung fibroblasts: distinguishing
morphology and discordant display of Thy 1 and class II MHC. Am. 1. Respir.
Cell. Mol. Biol. 1: 65-74
304
Pippenger, C.E., Browne, R. W., Armstrong, D. 1998. Regulatory antioxidant
enzymes. Methods Mol. Biol. 108: 299-313.
Plum, L., Rother, E., Münzberg, H., Wunderlich, F.T., Morgan, D.A., Hampel, B.,
Shanabrough, M., Janoschek, R., Kanner, A.C., Alber, l, Suzuki, A., Krone, W.,
Horvath, T.L., Rahmouni, K., Brüning, lC. 2007. Enhanced leptin-stimulated Pi3k
activation in the CNS promotes white adipose tissue transdifferentiation. Cell.
Metab. 6: 431-445.
Porter, D., Lahti-Domenici, l, Keshaviah, A., Bae, Y.K., Argani, P., Marks, l,
Richardson, A., Cooper, A., Strausberg, R., Riggins, G.J., Schnitt, S., Gabrielson,
E., Gelman, R., Polyak, K. 2003. Molecular markers in ductal carcinoma in situ of
the breast. Mol. Cancer Res. 1: 362-375.
Porter, lA., Young, K.E., Beachy, P.A. 1996. Cholesterol modification of hedgehog
signaling proteins in animal development. Science 274: 255-259.
Potter, lM., Nestel, P.J. 1979. The hyperlipidemia of pregnancy 111 normal and
complicated pregnancies. Am. l übstet. Gynecol. 133: 165-170.
Prosniak, M., Hooper, D.C., Dietzschold, B., Koprowski, H. 2001. Effect of rabies
virus infection on gene expression in mouse brain. Proc. Natl Acad. Sci. USA 98:
2758-2763.
Provos t, P.R., Marcel, Y.L., Milne, R.W., Weech, P.K., Rassart, E. 1991a.
Apolipoprotein D transcription occurs specifically in nonproliferating quiescent
and senescent fibroblast cultures. FEBS Lett. 290: 139-141.
Provost, P.R., Tremblay, Y., el-Amine, M., Belanger, A. 1995. Guinea plg
apolipoprotein D RNA diversity, and developmental and gestational modulation of
mRNA levels. Mol. Cell. Endocrinol. 109: 225-236.
Provost, P.R., Villeneuve, L., Weech, P.K., Milne, R.W., Marcel, Y.L., Rassart, E.
1991 b. Localization of the major sites of rabbit apolipoprotein D gene
transcription by in situ hybridization. J. Lipid Res. 32: 1959-1970.
305
Provost, P.R., Weech, P.K., Tremblay, N.M., Marcel, Y.L., Rassart, E. 1990.
Molecular characterization and differential mRNA tissue distribution of rabbi t
apolipoprotein D. 1. Lipid Res. 31: 2057-2065.
Rassart, E., Bedirian, A., Do Carmo, S., Guinard, O., Sirois, J., Terrisse, L., Milne, R.
2000. Apolipoprotein D. Biochim. Biophys. Acta. 1482: 185-198.
Reindl, M., Knipping, G., Wicher, 1., Dilitz, E., Egg, R., Deisenhammer, F., Berger,
T 2001. Increased intrathecal production of apolipoprotein D in multiple sclerosis.
1. Neuroimmunol. 119: 327-332.
Rickhag, M., Deierborg, T, Patel, S., Ruscher, K., Wieloch, T 2008. Apolipoprotein
o is elevated in oligodendrocytes in the peri-infarct region after experimental
stroke: influence of enriched environment. 1. Cereb. Blood Flow Metab. 28: 551
562.
Rickhag, M., Wieloch, T, Gido, G., Elmér, E., Krogh, M., Murray, 1., Lohr, S.,
Bitter, H., Chin, 0.1., von Schack, D., Shamloo, M., Nikolich, K. 2006.
Comprehensive regional and temporal gene expression profiling of the rat brain
during the first 24 h after experimental stroke identifies dynamic ischemia-induced
gene expression patterns, and reveals a biphasic activation of genes in surviving
tissue. 1. Neurochem. 96: 14-29.
Rinaldi, P., Polidori, M.C., Metastasio, A., Mariani, E., Mattioli, P., Cherubini, A.,
Catani, M., Cecchetti, R., Senin, U., Mecocci, P. 2003. Plasma antioxidants are
similarly depleted in mild cognitive impairment and in Alzheimer's disease.
Neurobiol. Aging 24: 915-919.
Rodriguez, 1.c., Diaz, M., Gonzalez, L.O., Sanchez, 1., Sanchez, M.T, Merino, A.M.,
Vizoso, F. 2000. Apolipoprotein 0 expression in benign and malignant prostate
tissues. Int. 1. Surg. Investig. 2: 319-326.
Rodriguez, A., Duran, A., Selloum, M., Champy, M.F., Diez-Guerra, F.1., Flores,
1.M., Serrano, M., Auwerx, 1., Diaz-Meco, M.T, Moscat, 1. 2006. Mature-onset
obesity and insulin resistance in mice deficient in the signaling adapter p62. Cel!
Metab. 3: 211-222.
306
Rojo, lV., Gonzalez, L.O., Lamelas, M.L., Merino, A., Vizoso, F. 2001.
Apolipoprotein 0 expression in endometrial carcinomas. Acta Obstet. Gynecol.
Scand. 80: 158-161.
Ruhlen, R.L., Sauter E.R., Proteomics of nipple aspirate fluid, breast cyst fluid, milk,
and colostrum. Proteomics 1: 845-852.
Ryu, B., Jones, l, HoUingsworth, M.A, Hruban, R.H., Kern, S.E. 2001. Invasion
specifie genes in malignancy: seriai analysis of gene expression comparisons of
primary and passaged cancers. Cancer Res. 61: 1833-1838.
Saha, S., Rangarajan, P.N. 2003. Common host genes are activated in mouse brain by
Japanese encephalitis and rabies viruses. 1 Gen. Viro\. 84: 1729-1735.
Saito, M., Smiley, l, Toth, R., Vadasz, C. 2002. Microarray analysis of gene
expression in rat hippocampus after chronic ethanol treatment. Neurochem. Res.
27: 1221-1229.
Salen, G., Berginer, V., Shore, V., Horak, 1., Horak, E., Tint, G.S., Shefer, S. 1987.
Increased concentrations of cholestanol and apolipoprotein B in the cerebrospinal
fluid of patients with cerebrotendinous xanthomatosis. Effect of
chenodeoxycholic acid. N. Eng\. 1 Med. 316: 1233-1238.
Sanchez, O., Ganfornina, M.O., Martinez, S. 2002. Expression pattern of the lipocalin
apolipoprotein 0 during mouse embryogenesis. Mech. Oev. 110: 225-229.
Sanchez, D., L6pez-Arias, B., Torroja, L., Canal, 1., Wang, X., Bastiani, M.J.,
Ganfornina, M.O. 2006. Loss of glial lazaril1o, a homolog of apolipoprotein D,
reduces lifespan and stress resistance in Orosophila. Curr. Biol. 16: 680-686.
Sandhya, T.L., Ong, W.Y., HOITocks, L.A, Farooqui, A.A. 1998. A light and electron
microscopie study of cytoplasmic phospholipase A2 and cyclooxygenase-2 in the
hippocampus after kainate lesions. Brain Res. 788: 223-231.
Sarjeant, lM., Lawrie, A, Kinnear, C, Yablonsky, S., Leung, W., Massaeli, H.,
Prichett, W., Veinot, J.P., Rassart, E., Rabinovitch, M. 2003. Apolipoprotein 0
inhibits platelet derived growth factor-BB-induced vascular smooth muscle ceU
proliferated by preventing translocation of phosphorylated extracellular signal
307
regulated kinase l/2 to the nucleus. Arterioscler. Thromb. Vase. Biol. 23: 2172
2177.
Sato, N., Fujii, K., Yuge, O., Morio, M. 1992. Changes in lipid peroxidation levels
and lipid composition in the lungs, livers, kidneys and brains of mice treated with
paraquat. 1 Appl. Toxicol. 12: 365-368.
Schaeren-Wiemers, N., Schaefer, c., Valenzuela, D.M., Yancopoulos, G.D., Schwab,
M.E. 1995. Identification of new oligodendrocyte- and myelin-specific genes by a
differential screening approach. 1 Neurochem. 65: 10-22.
Schinner, S., Scherbaum, W.A, Bornstein, S.R., Barthel, A. 2005. Molecular
mechanisms of insulin resistance. Diabet. Med. 22: 674-682.
Schmidt, S., Barcellos, L.F., DeSombre, K., Rimmler, lB., Lincoln, R.R., Bucher, P.,
Saunders, A.M., Lai, E., Martin, E.R., Vance, lM., Oksenberg, lR., Hauser, S.L.,
Pericak-Vance, M.A, Haines, lL. 2002. Association of polymorphisms in the
apolipoprotein E region with susceptibility to and progression of multiple
sclerosis. Am. l Hum. Genet. 70: 708-717.
Schmidt, T.G., Skerra, A. 2007. The Strep-tag system for one-step purification and
high-affinity detection or capturing of proteins. Nat Protoc. 2: 1528-1535.
Scholl, T.O., Chen, X. 2002. Insu lin and the "thrifty" woman: the influence of insu lin
during pregnancy on gestational weight gain and postpartum weight retention.
Matem. Chi Id. Health l 6: 255-261.
Séguin, D., Desforges, M., Rassart, E. 1995. Molecular characterization and
differential mRNA tissue distribution of mouse apolipoprotein D. Brain Res. Mol.
Brain Res. 30: 242-250.
Selim, AA., El-Ayat, G., Wells, C.A. 2001. Immunohistochemical localization of
gross cystic disease fluid protein-15, -24 and -44 in ductal carcinoma in situ of the
breast: relationship to the degree of differentiation. Histopathology 39: 198-202.
Serra Diaz, c., Vizoso, F., Lamelas, M.L., Rodriguez, lC., Gonzalez, L.O., Baltasar,
A., Medrano, 1. 1999. Expression and clinical significance of apolipoprotein D in
male breast cancer and gynaecomastia. Br. 1. Surg. 86: 1190-1197.
308
Serra, c., Vizoso, F., Lamelas, M.L., Rodriguez, lC., Gonzalez, L.O., Merino, A.M.,
Baltasar, A., Perez-Vazquez, M.T., Medrano, l 2000. Comparative study of two
androgen-induced markers (apolipoprotein D and pepsinogen C) in female and
male breast carcinoma. lnt. l Surg. lnvestig. 2: 183-192.
Shimaoka, Y, Hidaka, Y, Tada, H., Nakamura, T., Mitsuda, N., Morimoto, Y.,
Murata, Y., Amino, N. 2000. Changes in cytokine production during and after
normal pregnancy. Am. l Reprod. lmmunol. 44: 143-147.
Shimaoka, Y., Hidaka, Y., Tada, H., Takeoka, K., Morimoto, Y, Amino, N. 2001.
Influence of breast-feeding on the production of cytokines. Am. J. Reprod.
lmmunol. 45: 100-102.
Shintaku, K., Arima, Y, Dan, Y, Takeda, T., Kogushi, K., Tsujimoto, M., Nagata,
H., Satoh, S., Tsukimori, K., Nakano, H., Hori, S., Ohtani, H., Sawada, Y. 2007.
Kinetic analysis of the transport of salicylic acid, a nonsteroidal anti-inflammatory
drug, across human placenta. Drug Metab. Dispos. 35: 772-778.
Simard, A.R., Rivest, S. 2007. Neuroprotective effects of resident microglia
following acute brain injury. l Comp. Neurol. 504: 716-729.
Simard, l, Dauvois, S., Haagensen, D.E., Levesque, c., Merand, Y., Labrie, F. 1990.
Regulation of progesterone-binding breast cyst protein GCDFP-24 secretion by
estrogens and androgens in human breast cancer cells: a new marker of steroid
action in breast cancer. Endocrinology 126: 3223-3231.
Simard, l, de Launoit, Y., Haagensen, D.E., Labrie, F. 1992. Additive stimulatory
action of glucocorticoids and androgens on basal and estrogen-repressed
apolipoprotein-D messenger ribonucleic acid levels and secretion in human breast
cancer cells. Endocrinology 130: 1115-1121.
Simard, 1., Veil1eux, R., de Launoit, Y, Haagensen, D.E., Labrie, F. 1991.
Stimulation of apolipoprotein D secretion by steroids coincides with inhibition of
cell proliferation in human LNCaP prostate cancer cells. Cancer Res. 51: 4336
4341.
309
Smith, c., Andreakos, E., Crawley, lB., Brennan, F.M., Feldmann, M., Foxwell,
B.M., 2001. NF-kappaB-inducing kinase is dispensable for activation of NF
kappaB in inflammatory settings but essential for lymphotoxin beta receptor
activation of NF-kappaB in primary human fibroblasts. l Immunol. 167: 5895
5903.
Smith, K.M., Lawn, KM., Wilcox, lN. 1990. Cellular localization of apolipoprotein
D and lecithin:cholesterol acyltransferase mRNA in rhesus monkey tissues by in
situ hybridization. l Lipid Res. 31: 995-1004.
Soldin, O.P., Guo, T, Weiderpass, E., Tractenberg, R.E., Hilakivi-Clarke, L., Soldin,
S.J. 2005. Steroid hormone levels in pregnancy and 1 year postpartum using
isotope dilution tandem mass spectrometry. Fertil. Steril. 84: 701-710.
Song, H., Jin, X., Lin, J. 2004. Stat3 upregulates MEK5 expression in human breast
cancer cells. Oncogene 23: 8301-8309.
Spreyer, P., Schaal, H., Kuhn, G., Rothe, T, Unterbeck, A., Olek, K., Muller, H.W.
1990. Regeneration-associated high level expression of apolipoprotein D mRNA
in endoneurial fibroblasts of peripheral nerve. EMBO J. 9: 2479-2484.
Stein, TP., Scholl ,TO., Schluter, M.D., Schroeder, C.M. 1998. Plasma leptin
influences gestational weight gain and postpartum weight retention. Am. J. Clin.
Nutr. 68: 1236-1240.
Stephenson, D.T, Lemere, C.A., Selkoe, D.1., Clemens, J.A. 1996. Cytosolic
phospholipase A2 (cPLA2) immunoreactivity is elevated in Alzheimer's disease
brain. Neurobiol. Dis. 3: 51-63.
Steyrer, E., Kostner, G.M. 1988. Activation of lecithin-cholesterol acyltransferase by
apolipoprotein D: comparison of proteoliposomes containing apolipoprotein D, A
l or C-l. Biochim. Biophys. Acta 958: 484-491.
Stiles, B., Wang, Y., Stahl, A., Bassilian, S., Lee, W.P., Kim, Y.1., Sherwin, R.,
Devaskar, S., Lesche, R., Magnuson, M.A., Wu, H. 2004. Liver-specific deletion
of negative regulator Pten results in fatty liver and insulin hypersensitivity. Proc.
Natl Acad. Sci. USA. 101: 2082-2087.
310
Stohlman, S.A., Bergmann, c.c., van der Veen, R.C., Hinton, D.R. 1995. Mouse
hepatitis virus-specifie cytotoxic T lymphocytes protect from lethal infection
without eliminating virus from the central nervous system. 1. Virol. 69: 684-694.
Stoll, G., lander, S., Schroeter, M. 2000. Cytokines in CNS disorders: neurotoxicity
versus neuroprotection. 1. Neural Transm. Suppl. 59: 81-89.
Strehlow, 1., Seegert, O., Frick, c., Bange, F.C., Schindler, c., Bottger, E.C., Decker,
T. 1993. The gene encoding lFP 53/tryptophanyl-tRNA synthetase is regulated by
the gamma-interferon activation factor. 1. Biol. Chem. 268: 16590-16595.
Streit, W.J., Mrak, R.E., Griffin, W.S. 2004. Microglia and neuroinflammation: a
pathological perspective. 1. Neuroinflammation 1: 14.
Strittmatter, W.J., Roses, A.D. 1996. Apolipoprotein E and Alzheimer's disease.
Annu. Rev. Neurosci. 19: 53-77.
Sugimoto, K., Simard, J., Haagensen, D.E., Labrie, F. 1994. Inverse relationships
between cell proliferation and basal or androgen-stimulated apolipoprotein 0
secretion in LNCaP human prostate cancer cells. 1. Steroid Biochem. Mol. Biol.
51: 167-174.
Suresh, S., Yan, Z., Patel, R.C., Patel, Y.c., Patel, S.c. 1998. Cellular cholesterol
storage in the Niemann-Pick disease type C mouse is associated with increased
expression and defective processing of apolipoproteinD. J. Neurochem. 70: 242
251.
Suzuki, S., Gerhold, L.M., Bottner, M., Rau, S.W., Dela Cruz, c., Yang, E., Zhu, H.,
Yu, 1., Cashion, A.B., Kindy, M.S., Merchenthaler, 1., Gage, F.H., Wise, P.M.
2007. Estradiol enhances neurogenesis following ischemic stroke through estrogen
receptors alpha and beta. J. Comp. Neurol. 500: 1064-1075.
Talbot, P.J., Arnold, O., Antel, 1.P. 2001. Virus-induced autoimmune reactions in the
CNS. Curr. Top. Microbiol. Immunol. 253: 247-271.
Talbot, P.J., Jacomy, H.J., Desforges, M. 2008. Pathogenesis of Human
Coronaviruses other than severe acute respiratory syndrome coronavirus. ln:
311
Perlman, S., Gallagher, T., Snijder, EJ. (eds). Nidovirus. ASM Press. Washington,
DC, USA, pp313-324.
Tanigawa, T., Iso, H., Yamagishi, K., Muraki, 1., Kawamura, N., Nakata, A., Sakurai,
S., Ohira, T., Shimamoto, T. 2004. Association of lymphocyte sub-populations
with clustered features of metabolic syndrome in middle-aged Japanese men.
Atherosc1erosis 173: 295-300.
Tapia-Gonza1ez, S., Carrero, P., Pernia, O., Garcia-Segura, L., Diz-Chaves, Y. 2008.
Selective oestrogen receptor modulators reduce microglia reactivity in vivo after
peripheral inflammation: potential role of microglial oestrogen receptors. J.
Endocrino!. 198: 219-230.
Tardif, F. Ross, G. Rouabhia, M. 2004. Gingival and dermal fibroblasts produce
interleukin-1 beta converting enzyme and interleukin-1 beta but not interleukin-18
even after stimulation with 1ipopo1ysaccharide. 1. Cell Physio!. 198: 125-132.
Tekirian, T.L. 2002. The central role of the trans-Golgi network as a gateway of the
early secretory pathway: physiologie vs nonphysiologic protein transit. Exp. Cel!.
Res. 281: 9-18.
Terrisse, L., Poirier, J., Bertrand, P., Merched, A., Visvikis, S., Siest, G., Milne, R.,
Rassart, E. 1998. Increased levels of apolipoprotein D in cerebrospinal fluid and
hippocampus of Alzheimer's patients. 1. Neurochem. 71: 1643-1650.
Terrisse, L., Séguin, D., Bertrand, P., Poirier, J., Milne, R.W., Rassart, E. 1999.
Modulation of Apolipoprotein D and apolipoprotein E mRNA expression in rat
hippocampus after enthorinal cortex lesion. Mol. Brain Res. 70: 26-35.
Thiruchelvam, M., Richfield, E.K., Baggs, R.B., Tank, A.W., Cory-Slechta, D.A.
2000. The nigrostriatal dopaminergic system as a preferentia1 target of repeated
exposures to combined paraquat and maneb: implications for Parkinson's disease. J
Neurosci. 20: 9207-9214.
Thomas, E.A., Copolov, D.L., Sutcliffe, 1.G. 2003a. From pharmacotherapy to
pathophysiology: emerging mechanisms of apolipoprotein D in psychiatrie
disorders. Curr. Mo!. Med. 3: 408-418.
312
Thomas, E.A., Danielson, P.E., Nelson, P.A., Pribyl, T.M., Hilbush, B.S., Hasel,
K.W., Sutcliffe, J.G. 2001a. Clozapine increases apolipoprotein D expression in
rodent brain: towards a mechanism for neuroleptic pharmacotherapy. J.
Neurochem. 76: 789-796.
Thomas, E.A., Dean, B., Pavey, G., Sutcliffe, J.G. 2001 b. Increased CNS levels of
apolipoprotein D in schizophrenie and bipolar subjects: implications for the
pathophysiology of psychiatrie disorders. Proc. Natl Acad. Sei. USA 98: 4066
4071.
Thomas, E.A., Dean, B., Scarr, E., Copolov, D., Sutcliffe, J.G. 2003b. Differences in
neuroanatomical sites of apoD elevation discriminate between schizophrenia and
bipolar disorder. Mol. Psychiatry 8: 167-175.
Thomas, E.A., George, R.C., Danielson, P.E., Nelson, P.A., Warren, A.J., Lo, D.,
Sutcliffe, J.G. 2003c. Antipsychotic drug treatment alters expression of mRNAs
encoding lipid metabolism-related proteins. Mol. Psychiatry 8: 983-393.
Thomas, E.A., George, R.c., Sutc1iffe, J.G. 2003d. Apolipoprotein D modulates
arachidonic acid signaling in cultured cells: implications for psychiatrie disorders.
Prostaglandins Leukot. Essent. Fatty Acids. 69: 421-427.
Thomas, E.A., Laws, S.M., Sutcliffe, J.G., Harper, C., Dean, B., McClean, C.,
Masters, c., Lautenschlager, N., Gandy, S.E., Martins, R.N. 2003e.
Apolipoprotein D levels are elevated in prefrontal cortex of subjects with
Alzheimer's disease: no relation to apolipoprotein E expression or genotype. Biol.
Psychiatry 54: 136-141.
Thomas, E.A., Sautkulis, L.N., Criado, J.R., Games, D., Sutcliffe, J.G. 2001 c.
Apolipoprotein D mRNA expression is elevated in PDAPP transgenic mice. J.
Neurochem. 79: 1059-1064.
Thomas, E.A., Yao, J.K. 2007. Clozapine specifically alters the arachidonic acid
pathway in mice lacking apolipoprotein D. Schizophr. Res. 89: 147-153.
Thompson, G.N., Halliday, D. 1992. Protein tumover in pregnancy. Eur. J. Clin.
Nutr. 46: 411-417.
313
Ti1g, H., Moschen, A.R. 2008. Inflammatory mechanisms in the regu1ation of insu1in
resistance. Mol. Med. 14: 222-231.
Todorov, P.T., Wyke, S.M., Tisdale, M.1. 2007. Identification and characterization of
a membrane receptor for proteolysis-inducing factor on ske1etal muscle. Cancer
Res. 67: 11419-11427.
Tokugawa, Y, Koyama, M., Si1ver, 1. 1997. A molecular basis for species differences
in Thy-l expression patterns. Mol. Immunol. 34: 1263-1272.
Tomarev, S.L, Wistow, G., Raymond, V., Dubois, S., Ma1yukova, I. 2003. Gene
expression profile of the human trabecular meshwork: NElBank sequence tag
ana1ysis. lnvest. Ophtha1mol. Vis. Sci. 44: 2588-2596.
Tomita, M., Okuyama, 1., Katsuyama, H., lshikawa, 1. 2006a. Paraquat-induced
gene expression in rat kidney. Arch. Toxicol. 80: 687-693.
Tomita, M., Okuyama, 1., Katsuyama, H., Hidaka, K., Otsuki, T., lshikawa, T.
2006b. Gene expression in rat lungs during early response to paraquat-induced
oxidative stress. lnt. 1. Mol. Med. 17: 37-44.
T6th, A., Kiss, E., Herberg, F.W., Gergely, P., Hartshorne, 0.1., Erdodi, F. 2000.
Study of the subunit interactions in myosin phosphatase by surface p1asmon
resonance. Eur. 1. Biochem. 267: 1687-1697.
Tran, I.A., McCoy, M.K., Sporn, M.B., Tansey, M.G. 2008. The synthetic
triterpenoid CDDO-methy1 ester modu1ates microglial activities, inhibits TNF
production, and provides dopaminergic neuroprotection. 1. Neuroinflammation 5:
14.
Trevaskis, 1., Wa1der, K., Foletta, V., Kerr-Bayles, L., McMillan, 1., Cooper, A., Lee,
S., Bolton, K., Prior, M., Fahey, R., Whitecross, K., Morton, G.1., Schwartz,
M.W., Collier, G.R. 2005. Src homology 3-domain growth factor receptor-bound
2-like (endophilin) interacting protein l, a novel neuronal protein that regulates
energy balance. Endocrino1ogy 146: 3757-3764.
Uematsu, S., Matsumoto, M., Takeda, K., Akira, S. 2002. Lipopolysaccharide
dependent prostaglandin E(2) production is regulated by the glutathione-dependent
314
prostaglandin E(2) synthase gene induced by the Toll-like receptor 4/MyD88INF
IL6 pathway. 1. Immunol. 168: 5811-5816.
Ulmer, AJ. Flad, H. Rietschel, T. Mattern, T 2000. Induction of proliferation and
cytokine production in human T lymphocytes by lipopolysaccharide (LPS).
Toxicology 152: 37-45.
Utsunomiya, T, Ogawa, K., Yoshinaga, K., Ohta, M., Yamashita, K., Mimori, K.,
Inoue, H., Ezaki, T., Yoshikawa, Y., Mori, M. 2005. Clinicopathologic and
prognostic values of apolipoprotein D alterations in hepatocellular carcinoma. Int.
1. Cancer 116: 105-109.
Vajragupta, O., Monthakantirat, O., Wongkrajang, Y, Watanabe, H., Peungvicha, P.
2000. Chroman amide 12P inhibition of lipid peroxidation and protection against
learning and memory impairment. Life Sei. 67: 1725-1734.
van Dijk, W., Do Carmo, S., Rassart, E., Dahlback, B., Sodetz, 1.M. 2006. The
plasma lipocalins al-acid glycoprotein, apolipoprotein D, apolipoprotein M and
complement protein C8y, in: B. Akerstrbm, N. Borregaard, D.R. Flower, J.-P.
Salier (Eds.), Lipocalins, Landes Bioscience, Georgetown, TX, USA. pp.140-166.
Vazquez, 1., Gonzalez, L., Merino, A, Vizoso, F. 2000. Expression and clinical
significance of apolipoprotein D in epithelial ovarian carcinomas. Gynecol.
Oncol. 76: 340-347.
Verina, T., Rohde, C.A., Guilarte, TR. 2007. Environmental lead exposure during
early life alters granule cell neurogenesis and morphology in the hippocampus of
young adult rats. Neuroscience 145: 1037-1047.
Vieira, A.V., Lindstedt, K., Schneider, WJ., Vieira, P.M. 1995. Identification of a
circulatory and oocytic avian apolipoprotein D. Mol. Reprod. Dev. 42: 443-446.
Vijayaraghavan, S., Hitman, G.A., Kopelman, P.G. 1994. Apolipoprotein-D
polymorphism: a genetic marker for obesity and hyperinsulinemia. 1. Clin.
Endocrinol. Metab. 79: 568-570.
Vogt, M., Skerra, A. 2001. Bacterially produced apolipoprotein D binds progesterone
and arachidonic acid, but not bilirubin or E-3M2H. J. Mol. Recognit. 14: 79-86.
315
Volonte, D. Zhang, K. Lisanti, M.P. Galbiati, f. 2002. Expression of caveolin-1
induces premature cellular senescence in primary cultures of murine fibroblasts.
Mol. Biol. Cell. 13: 2502-2517.
Walker, D.W., Muffat, J., Rundel, C, Benzer, S. 2006. Overexpression of a
Drosophila homolog of apolipoprotein D leads to increased stress resistance and
extended lifespan. Curr. Biol. 16: 674-679.
Walton, M., Sirimanne, E., Williams, C, Gluckman, P.D., Keelan, J., Mitchell, M.D.,
Dragunow, M. 1997. Prostaglandin H synthase-2 and cytosolic phospholipase A2
in the hypoxic-ischemic brain: role in neuronal death or survival? Brain Res. Mol.
Brain Res. 50: 165-170.
Wang, C, Hsueh, A.J., Erickson, G.f. 1980. Prolactin inhibition of estrogen
production by cultured rat granulosa cells. Mol. Cell. Endocrinol. 20: 135-144.
Wang, L., Zhang S, Liu Z, Li H, Wang Y, Jiang S. 2007. Characterization and
expression of amphioxus ApoD gene encoding an archetype of vertebrate ApoD
proteins. Cell. Biol. lnt. 31: 74-81.
Warner, R.L. Bhagavathula, N. Nerusu, K.C Lateef, H. Younkin, E. Johnson, K.J.
Varani, J. 2004. Matrix metalloproteinases in acute inflammation: induction of
MMP-3 and MMP-9 in fibroblasts and epithelial cells following exposure to pro
inflammatory mediators in vitro. Exp. Mol. Pathol. 76: 189-195.
Weber-Chappuis, K., Bieri-Burger, S., Hurlimann, J. 1996. Comparison of prognostic
markers detected by immunohistochemistry in male and female breast
carcinomas. Eur. 1. Cancer 32A: 1686-1692.
Weech, P.K., Camato, R., Milne, R.W., Marcel, Y.L. 1986. Apolipoprotein 0 and
cross-reacting human plasma apolipoproteins identified using monoclonal
antibodies.1. Biol. Chem. 261: 7941-7951.
Weiss, J.M., Downie, S.A., Lyman, W.D., Berman, J.W. 1998. Astrocyte-derived
monocyte-chemoattractant protein-I directs the transmigration of leukocytes
across a model of the human blood-brain barrier. J. Immunol. 161: 6896-6903.
316
West, c.P., McNeilly, A.S. 1979. Hormonal profiles in lactating and non-Iactating
women immediately after delivery and their relationship to breast engorgement.
Br. 1. Obstet. Gynaeco!. 86: 501-506.
West, R.B., Harvell, 1., Linn, S.c., Liu, c.L., Prapong, W., Hernandez-Boussard, T.,
Montgomery, K., Nielsen, T.O., Rubin, B.P., Patel, R., Goldblum, 1.R., Brown,
P.O., van de Rijn, M., Lui, c.L. 2004. Apo D in soft tissue tumors: a novel
marker for derrnatofibrosarcoma protuberans. Am. 1. Surg Patho!. 28: 1063-1069.
Wuu, l, Hellerstein, S., Lipworth, L., Wide, L., Xu, B., Yu, G.P., Kuper, H., Lagiou,
P., Hankinson, S.E., Ekbom, A, Carlstrom, K., Trichopoulos, D., Adami, H.O.,
Hsieh, C.C. 2002. Correlates of pregnancy oestrogen, progesterone and sex
hormone-binding globulin in the USA and China. Eur. 1. Cancer Prey. 11: 283
293.
Yamashita, K., Upadhyay, S., Osada, M., Hoque, M.O., Xiao, Y., Mori, M., Sato, F.,
Meltzer, SJ., Sidransky, D. 2002. Pharmacologie unmasking of epigenetically
silenced tumor suppressor genes in esophageal squamous cell carcinoma. Cancer
Cel!. 2: 485-495.
Yang, c.Y., Gu, Z.W., Blanco-Vaca, F., Gaskell, SJ., Yang, M., Massey, lB., Gotto,
AM. Jr, Pownall, HJ. 1994. Structure of human apolipoprotein D: locations of
the intermolecular and intramo1ecular disulfide links. Biochemistry 33: 12451
12455.
Yao, lK., Thomas, E.A., Reddy, R.D., Keshavan, M.S. 2005. Association of plasma
apolipoproteins D with RBC membrane arachidonic acid levels in schizophrenia.
Schizophr. Res. 72: 259-266.
Yao, Y., Vieira, A 2002. Comparative 17beta-estradiol response and lipoprotein
interactions of an avian apolipoprotein. Gen. Comp. Endocrino!. 127: 89-93.
Yoshida, K., Cleaveland, E.S., Nagle, 1.W., French, S., Yaswen, L., Ohshima, T.,
Brady, R.O., Pentchev, P.G., Kulkami, A.B. 1996. Mo1ecular cloning of the
mouse apolipoprotein D gene and its upregulated expression in Niemann-Pick
disease type C mouse mode!. DNA Cell Biol. 15 :873-882.
317
Yoshikawa, T., Shimano, H., Yahagi, N., Ide, T., Amemiya-Kudo, M., Matsuzaka, T.,
Nakakuki, M., Tomita, S., Okazaki, H., Tarnura, Y, Iizuka, Y., Ohashi, K.,
Takahashi, A., Sone, H., Osuga Ji, J., Gotoda, 1., Ishibashi, S., Yamada, N. 2002.
Polyunsaturated fatty acids suppress sterol regulatory elernent-binding protein 1c
promoter activity by inhibition of liver X receptor (LXR) binding to LXR
response elements. 1. Biol. Chem. 277: 1705-1711.
Yuan, J., Wegenka, V.M., Lutticken, c., Buschmann, 1., Decker, 1., Schindler, C.,
Heinrich, P.C., Horn, F. 1994. The signalling pathways of interleukin-6 and
gamma interferon converge by the activation of different transcription factors
which bind to common responsive DNA elements. Mol. Cell. Biol. 14: 1657-1668.
Zandi, P.P. Anthony, J.C. Hayden, K.M. Mehta, K. Mayer, L. Breitner, 1.c. 2002.
Reduced incidence of AD with NSAID but not H2 receptor antagonists: the Cache
County Study. Neurology 59: 880-886.
Zeng, C., Spielman, A.l., Vowels, B.R., Leyden, J.1., Biemann, K., Preti, G. 1996. A
human axillary odorant is carried by apolipoprotein D. Proc. Natl Acad. Sei. V S
A 93: 6626-6630.
Zhang, J., He, Q., Liu, Q.Y, Guo, W., Deng, X.M., Zhang, W.W., Hu, X.X., Li, N.
2007. Differentiai gene expression profile in pig adipose tissue treated
with/without clenbuterol. BMC Genomics 8: 433.
Zhang, S.X., Bentel, lM., Ricciardelli, c., Horsfal1, 0.1., Haagensen, D.E., Marshall,
Y.R., Tilley, W.D. 1998. Immunolocalization of apolipoprotein D, androgen
receptor and prostate specifie antigen in early stage prostate cancers. 1. Vrol. 159:
548-554.


