Embed Size (px)
Citation preview

Energy Conversion and Management 47 (2006) 1748–1760
www.elsevier.com/locate/enconman
Evaluation of the flow forces on an open centredirectional control valve by means of a computational
fluid dynamic analysis
R. Amirante a,*, G. Del Vescovo a, A. Lippolis b
a Dipartimento di Ingegneria Meccanica e Gestionale, Politecnico di Bari, Dimeg, Via Re David 200, 70125 Bari, Italyb Dipartimento di Ingegneria dell’Ambiente e per lo Sviluppo Sostenibile, Politecnico di Bari, Viale del Turismo 8, 74100 Taranto, Italy
Received 15 March 2005; received in revised form 20 September 2005; accepted 2 October 2005Available online 23 November 2005
Abstract
The aim of the present paper is the evaluation of the driving forces acting on a 4/3 hydraulic open center directionalcontrol valve spool by means of a complete numerical analysis. In a previous paper by the same authors, the valve wasinserted in a closed hydraulic circuit and was tested with different pump flow rate values to obtain experimental resultsabout the driving forces. The experimental results are used in this paper to evaluate and validate the numerical analysisof the valve. The obtained numerical results show important differences between an open center valve and a closed centerone, the latter being extensively analyzed in the literature. The numerical analysis is performed by using the commercialcode ‘‘Fluent’’, and the numerical results show the complete flow field inside the valve. The aim of this analysis is to eval-uate the valve fluid dynamic performance, exploiting computational fluid dynamics (CFD) techniques, in order to give thereliable indications needed to define the valve design criteria and avoid expensive experimental tests.� 2005 Elsevier Ltd. All rights reserved.
Keywords: Flow forces; Open centre directional control valve; Computational fluid dynamics
1. Introduction
The optimum design of a directional control valve driving system requires a preliminary estimation of the driv-ing forces. In order to solve this problem, many experimental measurements on the specific valve are needed.Alternatively, a numerical analysis can be performed by means of computational fluid dynamics (CFD) codes.
In a previous paper [1], the behaviour of the flow force profile and of its peak value during the axial spoolmovement on an open center directional control valve has been experimentally analyzed. Indeed, the positionof the flow force peak value on a closed center directional control valve has been studied by Batoli [2], while
0196-8904/$ - see front matter � 2005 Elsevier Ltd. All rights reserved.
doi:10.1016/j.enconman.2005.10.005
* Corresponding author. Tel.: +39 0805963470; fax: +39 0805963411.E-mail address: [email protected] (R. Amirante).

Nomenclature
Aij fluid dynamic areaMij momentum flow#ij fluid dynamic anglex spool positionq fluid densityk turbulent kinetic energyy distance from walll dynamic viscosityu velocitylt turbulent dynamic viscosityS mean strain rate tensor normm kinematic viscositymt turbulent kinematic viscositye turbulent dissipation ratelt turbulence characteristic lengthCl, rk, Al, Ce1, Ce2, re, Cl model constantssij Reynolds stress tensor component
R. Amirante et al. / Energy Conversion and Management 47 (2006) 1748–1760 1749
Borghi et al. [3] also provided a fluid dynamic similarity based procedure to estimate analytically the flow forcepeak value at different pressure drops and flow rates. Macor et al. [4,5], Del Vescovo and Lippolis [6] analyzedthe effects that different spool edge shapes produce on the flow force profile during the axial spool movement.Finally, Del Vescovo et al. [7–9] analyzed the differences between the fluid dynamic behaviour of a propor-tional valve and a traditional one. The above mentioned investigations dealt exclusively with closed centerdirectional control valves, while this paper analyzes numerically the driving forces on a 4/3 open center direc-tional control valve. In the open center valve (Fig. 1), when the spool is in the neutral position, the recircu-lation of the pump flow rate towards the tank is allowed, while in a closed center directional valve boththe high pressure and return/exhaust ports are blocked.
Furthermore, the paper presents CFD results, to confirm and explain the experimental data [1]. Theemployed CFD codes are Fluent 6.1 and Gambit [10–13]. Then, the diagrams of the measured quantities, suchas forces, flow rate, pressures in the connection ports P, A, B and T (see Fig. 1) at different spool axial posi-tions will be analyzed by the CFD code. In order to evaluate the different behaviours of the valve, this analysiswill be performed at different flow rates enforced in the inlet section.
In particular, the research has focused its attention on the study of the efflux angles through the orifices inthe first phase of recirculation.
The difficulties introduced by the use of CFD techniques deal with the necessity to reduce the computa-tional domain to the most important regions of the flow where the fluid dynamic phenomena are concentratedin order not to exceed the available computational resources. In fact, the traditional approach is axisymmetricmodelling of the valve. This approximation allows the use of a more refined grid and a more accurate analysis[3,7,14] of the flow field inside the valve. The limits of such approximation have been put in evidence in a pre-vious work [8]. In fact, a three dimensional analysis of a closed centre directional control valve is necessary todetermine correctly the flow force and the flow rate values, especially at the greatest valve openings, when thecircumferential pressure losses are remarkable.
A three dimensional analysis was realized also for a proportional valve [9] and the CFD study has shownthat simplification of the computational domain is possible because of the negligible importance of the circum-ferential flows.
In this work, the attention has been focused on an ON–OFF open centre directional control valve, and themodelled geometry is necessarily three dimensional although the periodicity of the geometrical domain hasbeen exploited in order to reduce the computational efforts.

Fig. 1. Sectional view of the directional valve: (1) hollow sliding spool, (2) spool centering springs, (3) spring extension stopping disk,(4) armature, (5) cylindrical case, (6) clamping flange, (7) centering element, (8) leakage slit, (9) coil fixing cover, (10) closing plug.
1750 R. Amirante et al. / Energy Conversion and Management 47 (2006) 1748–1760
The numerical results, as far as the flow rate and flow force global values are concerned, are very reliableand indicate the possibility to use CFD codes extensively in the design stage of hydraulic valves.
2. The open centre directional control valve and the computational design
Fig. 1 shows a sectional view of the tested valve: an electro-piloted sliding spool directional ON/OFF valvewith centering springs. The maximum allowable flow rate is 120 l/min, while the maximum allowable pressureis 320 bar. In the valve body, a hollow sliding spool (1) with four patterns of radial holes and lateral centeringsprings (2) are visible. Each spring extension is stopped by a disk (3) located at 1/10 mm so that only the oppo-site spring opposes the spool movement. The electromagnetic force acts on the armature (4) that moves thespool axially. The armature moves inside a cylindrical case (5) closed by a plug (10). The same figure showsthat the P port and the exhaust/return T port are connected, respectively, to the central and the lateral cham-bers machined in the valve body. During the spool movement, the spool radial holes determine the differenthydraulic connections of the directional control valve.
Three possible flow configurations can be identified, x being the spool location measured from the neutralposition:
(1) 0 < x < 1.4 mm: Fig. 2 shows two different recirculation flows flowing through the two lateral sides of thehollow spool.
(2) 1.4 < x < 2.4 mm: Fig. 3 shows a flow directed to the actuator through the port A and coming back fromthe port B, coexisting with the recirculation flow rate in the hollow spool right side. The left P–T passageis definitively closed.
(3) 2.4 < x < 3.4 mm: Fig. 4 shows the whole pump flow directed to the actuator and the right P–T passageclosed.
The reference test rig, described in detail in a previous work [1], is shown in Fig. 5. It is a closed hydraulictransmission. The valve has been experimentally tested at different pump flow rate values. A charge pump anda pressure relief valve set the pressure value on the low pressure line.
The computational fluid dynamic analysis has been preceded by valve geometry modelling realized bymeans of ‘‘Gambit’’ [12,13], a pre-processor of ‘‘Fluent’’ [10,11].

Fig. 2. The fluid dynamic conditions in the first phase.
Fig. 3. The fluid dynamic conditions in the second phase.
Fig. 4. The fluid dynamic conditions in the third phase.
R. Amirante et al. / Energy Conversion and Management 47 (2006) 1748–1760 1751
An axisymmetric simplification is impossible because of the presence of the radial holes, and at the sametime, whole valve geometry modelling is not realizable because of the great CPU and RAM requests. So, only1/16 of the valve geometry has been considered: the modelled geometry is limited by the symmetry plane of theholes and by the symmetry plane located between two successive longitudinal lines of holes.
This simplified geometry does not allow evaluation of the circumferential pressure losses due to the circum-ferential flows directed towards the valve ports. These last effects are very important in closed centre valves
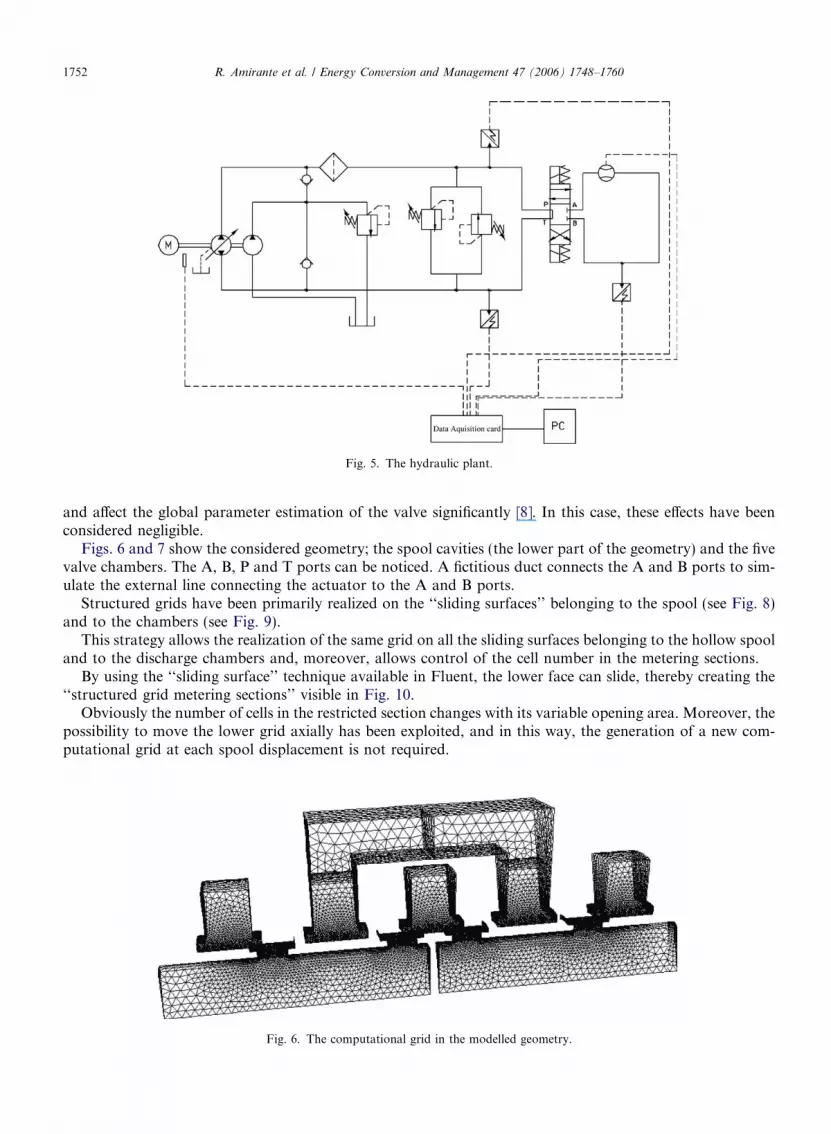
Fig. 5. The hydraulic plant.
1752 R. Amirante et al. / Energy Conversion and Management 47 (2006) 1748–1760
and affect the global parameter estimation of the valve significantly [8]. In this case, these effects have beenconsidered negligible.
Figs. 6 and 7 show the considered geometry; the spool cavities (the lower part of the geometry) and the fivevalve chambers. The A, B, P and T ports can be noticed. A fictitious duct connects the A and B ports to sim-ulate the external line connecting the actuator to the A and B ports.
Structured grids have been primarily realized on the ‘‘sliding surfaces’’ belonging to the spool (see Fig. 8)and to the chambers (see Fig. 9).
This strategy allows the realization of the same grid on all the sliding surfaces belonging to the hollow spooland to the discharge chambers and, moreover, allows control of the cell number in the metering sections.
By using the ‘‘sliding surface’’ technique available in Fluent, the lower face can slide, thereby creating the‘‘structured grid metering sections’’ visible in Fig. 10.
Obviously the number of cells in the restricted section changes with its variable opening area. Moreover, thepossibility to move the lower grid axially has been exploited, and in this way, the generation of a new com-putational grid at each spool displacement is not required.
Fig. 6. The computational grid in the modelled geometry.

Fig. 7. The boundary conditions.
Fig. 8. Structured grid on the lower sliding surface.
R. Amirante et al. / Energy Conversion and Management 47 (2006) 1748–1760 1753
The whole computational grid is shown in Fig. 6: the used three dimensional grids are unstructured, andmoreover, a particular technique provided by Gambit, the so-called ‘‘size function’’, has allowed the refine-ment of the grid near the metering sections where there are the maximal velocity and pressure gradients.
In Fig. 7, the boundary condition surfaces have been indicated:
(a) INLET: on this surface, the pump flow rate value has been enforced.(b) OUTLET: on this surface, the pressure value set by the pressure relief valve on the charge pump line has
been imposed [1].(c) PRESSURE JUMP (section black in middle of the fictitious line): on this surface, a pressure drop
between the A and B ports can be specified.(d) SYMMETRY (grey lateral surfaces): these are the symmetry faces and allow the use of the simplified
geometry as previously described.(e) INTERFACE SURFACES: these surfaces slide, thereby generating the different metering sections dur-
ing the axial spool movement as described in Figs. 7–9.
The fluid density has been set to 900 kg/m3, while the kinematic viscosity has been set to 30 mm2/s.

Fig. 10. The metering section derived from the superposition of the two sliding surfaces.
Fig. 9. Structured grid on the upper sliding surface.
1754 R. Amirante et al. / Energy Conversion and Management 47 (2006) 1748–1760
As far as the flow modelling is concerned, it must be stressed that a proper estimation of the turbulent phe-nomena has great importance to determine the valve flow features; and therefore, a very short description ofthe adopted turbulence model is here reported.
In particular, the flow inside a hydraulic valve is characterized by the coexistence of ‘‘free shear flows’’, i.e.the flow jets created by the restricted sections, and ‘‘wall bounded flows’’ strongly influenced by the walleffects.
The most suitable turbulence model for this kind of problem [10,11] has been considered the RNG k–emodel coupled with the so-called ‘‘Two Layer Zonal Model’’. In fact, this model solves the two zonesdifferently;
(1) the zone near the walls (where the Rey number is lower than 200),(2) the central zone,

R. Amirante et al. / Energy Conversion and Management 47 (2006) 1748–1760 1755
where the Rey number is given by
Rey ¼qffiffiffikp
yl
ð1Þ
Near the walls, only the transport equation for the kinetic energy of turbulence is used
okotþ uj
okoxj¼ ltS
2 þ o
oxjmþ mt
rk
� �okoxj
� �� e ð2Þ
and the dissipation rate e is computed according to the equation
e ¼ C3=4l k3=2=lt ð3Þ
where the turbulence characteristic length lt is estimated according to the damping function:
lt ¼ Cl½1� eð�Rey=AlÞ� ð4Þ
In the central zone of the flow, the code uses the turbulence RNG k–e model that is substantially very similar tothe standard k–e model with the exception of some different constants and some additional terms in the trans-port equations.
The traditional k–e model adds to Eq. (2) the following transport equation for e
oeotþ uj
oeoxj¼ Ce1
kesij
oui
oxj� Ce2
e2
kþ o
oxjmþ mt
re
� �oeoxj
� �ð5Þ
The described model gives a reliable estimation of the turbulent quantities upstream and downstream of therestricted sections and is able to estimate properly both the free jet and the wall bounded region.
3. Numerical analysis and results
Figs. 11–13 show the velocity contours in the case of 50 l/min pump flow rate in the three ranges of thespool movement.
When the spool remains in the neutral position, the recirculation flows in the two cavities of the spool aresymmetric so that opposite but equal axial momentum variations are determined (as in Fig. 14), and obvi-ously, no flow force acts on the spool.
When the spool is moved from the neutral position (as in Fig. 11), the initial symmetric flow conditions areperturbed because the two equivalent metering sections in the right and left cavities of the spool become dif-ferent. The efflux angles and the flow rate distribution in this phase produce a flow force acting in the openingdirection [1].
In the range 1.4–2.4 mm, (as in Fig. 12), the left recirculation passage is definitively blocked, while the flowrate begins to pass through the actuator ports.
The momentum introduced by the opening of the A/B ports creates a force that acts in the closing direction,originating a gradual compensation of the positive effect given by the coexistent right recirculation flow.
Then, the effects of the opening of the A/B ports prevail over the effects of the right recirculation flow rate,and the global flow force becomes disadvantageous for the spool opening. When the recirculation flow ratevanishes, the flow force reaches its maximum value, thereby explaining the maximum of the flow force locatedat the 2.4 mm spool opening value. In the third range of the spool travel (as in Fig. 13), the connection portsP–T are definitively closed; the flow force acts in the closing direction, but its value decreases with the increas-ing spool movement because the connection surface areas P! A and B! T are increasing.
The analysis of the obtained numerical results starts from the comparative study of the pressure values inthe ports P, A and B with a constant pump flow rate value (Fig. 15). The qualitative courses of the numericaland experimental results are identical, while it is evident that both the P and A–B pressure experimental valuesare always greater than the numerical ones. The mismatch between the numerical and experimental results isdue to the neglected circumferential pressure losses.

Fig. 12. Velocity contours (m/s); x = 1.8 mm.
Fig. 11. Velocity contours (m/s); x = 0.8 mm.
1756 R. Amirante et al. / Energy Conversion and Management 47 (2006) 1748–1760
In the experimental results, a load cell measures the axial force [1] in the range 0–12 daN, by means of anappropriate extensimeter, the measuring error being 1% of full scale; a gear volumetric flow meter and threepressure transducers [1] are located near the ports of the directional valve. The measuring error of the flowmeter is 0.1% of full scale (80 l/min) in the temperature range �30 to 150 �C. The pressure transducers mea-sure the pressure values by means of an extensimeter and are electronically assisted to compensate the temper-ature variations. The measuring error of these devices is 1% of full scale (100 bar).
In Fig. 16, the flow rate in the line A–B is presented in the numerical and experimental case. In this case, thecurves are almost overlapping. Only in the central zone do the results seem to be slightly different.
Finally, the results relative to the flow forces are presented in Fig. 17. It can be noticed that the numericalresults confirm the advantageous sign of the flow force during the first axial spool opening phase.
Moreover, the gradual compensation of this force in the second phase is confirmed. It can be observed thatthe peak flow force position is located in the point where the recirculation flow rate vanishes, and the decreas-ing trend in the third opening phase is confirmed too.

Fig. 13. Velocity contours (m/s); x = 2.8 mm.
Fig. 14. Momentum flows and efflux angles in the first phase.
0
5
10
15
20
25
30
35
40
45
50
0 0.5 1 21.5 2.5 3 3.5Axial spool movement (mm)
Pres
sure
(ba
r)
P pressure numerical
P pressure experimental
A-B pressure numerical
A-B pressure experimental
Fig. 15. Experimental and numerical port pressure values.
R. Amirante et al. / Energy Conversion and Management 47 (2006) 1748–1760 1757
Anyway, it can be noticed that in the first phase, there is an almost perfect overlapping of the curves, whilethe compensation effect is overestimated in the numerical results. In the third phase, the numerically evaluatedforces are slightly different from the experimental measurements.
Finally, the flow force courses at the different flow rate values in the numerical simulations are reported inFig. 18. The observations relative to the experimental analysis [1] are perfectly confirmed.
Particularly interesting is the analysis of the flow conditions in the first phase of the spool axial movement.Obviously, the sign of the flow force depends on the distribution of the recirculation flow rates in the two

-10
0
10
20
30
40
50
60
0 0.5 1 1.5 2 2.5 3 3.5
Axial spool movement (mm)
Flow
rat
e (l
/min
) A-B flow rate numerical
A-B flow rate experimental
Fig. 16. Experimental and numerical flow rates in the line A–B.
-1.5
-1
-0.5
0
0.5
1
1.5
2
2.5
3
3.5
0 0.5 1 1.5 2 2.5 3 3.5
Axial spool movement (mm)
Flow
for
ce (
daN
) flow force numerical
flow force experimental
Fig. 17. Experimental and numerical flow forces.
-20
-10
0
10
20
30
40
50
60
70
0 1 1.50.5 2 2.5 3 3.5
Axial spool movement (mm)
Flo
w f
orce
(N) 33 l/min
50 l/min
70 l/min
Fig. 18. Flow forces at different pump flow rates in the numerical simulations.
1758 R. Amirante et al. / Energy Conversion and Management 47 (2006) 1748–1760
lateral sides of the valve and on the average fluid dynamic angles in the connection surfaces. Fig. 19 shows thetwo flow rates crossing the right and left passage. The two flow rates start from the same value in the neutralvalve position and then become different. Finally, at 1.4 mm of spool movement, the discharged flow ratepasses only through the right passage.
Very significant from a fluid dynamic point of view is the analysis of the efflux angles with respect to thepercentage opening of a generic connection surface (for the nomenclature of the angles, refer to Fig. 14).The results, shown in Fig. 20, refer to the efflux angles computed on two different kinds of surfaces. In fact,

0
0.005
0.01
0.015
0.02
0.025
0.03
0.035
0.04
0.045
0.05
0 1 20.5 1.5 2.5 3 3.5Axial spool movement (mm)
Flow
rat
e (K
g/s) Flow rate.left passage
Flow rate.right passage
Recirculation phase
Fig. 19. Pump flow rate distribution in the two lateral discharge ports.
0
10
20
30
40
50
60
70
80
90
100
0.00% 10.00% 20.00% 30.00% 40.00% 50.00% 60.00% 70.00% 80.00% 90.00% 100.00%Percentage opening
Ang
12
221121Efflux angle through the radial hole, direct flowEfflux angle through the radial hole, inverse flow22 after the first phase11 after the first phase
Fig. 20. Average fluid dynamic angles at the different connection surface opening percentages.
R. Amirante et al. / Energy Conversion and Management 47 (2006) 1748–1760 1759
it must be considered that rigorous analysis of the efflux angles must consider the rectangular connection sur-face that the axial movement of the spool creates between the hollow spool and the discharge chambers.
The other two curves have been overlapped to the previous ones and refer to the efflux angles computedonly through the radial holes. This last computation has been considered in a previous work [1].
It can be noticed that the estimation of the efflux angles in the first case seems to tend asymptotically to theresults relative to the radial hole, testifying that the influence of the circumferential groove vanishes with theincreasing opening area, while its effect is very strong at the smaller percentage openings.
It must be noticed, anyway, that after 25% opening, the flows exiting the spool (M22, M12 and direct flow)are always more radial than the flows entering the spool (M11, M21 and inverse flow), confirming the obser-vations made in the previous work.
4. Conclusions
This paper deals with a complete numerical analysis of the flow forces acting on the spool of an open centreON–OFF hydraulic directional control valve. The numerical analysis has been realized in order to explainsome fluid dynamic phenomena described in a previous work [1] and evidenced by an experimentalinvestigation.
The analysis has been realized at different pump flow rate values. The results put in evidence that the max-imum flow force value occurs when the recirculation flow rate vanishes, while in the first opening phase, theflow force acts in the opening direction. The peak value of the flow force increases with increasing pump flowrate, but its position remains fixed. This flow force behaviour is different from the flow force profile in a closed

1760 R. Amirante et al. / Energy Conversion and Management 47 (2006) 1748–1760
centre directional valve where the position of the flow force peak value depends on both the pump flow rateand pressure drop values. The numerical results are very reliable because they confirm the experimental mea-surements. The mismatch of pressure trends between the numerical and the experimental analysis is due to thesimplification of the valve geometry and is theoretically explainable. The numerical analysis has providedimportant fluid dynamic indications about the efflux angle values and the flow rate distribution inside thevalve, in particular during the first opening phase; moreover, the code is able to give a sufficiently accurateestimation of the flow force peak value needed to drive the system design.
References
[1] Amirante R, Del Vescovo G, Lippolis A. A flow forces analysis of an open center hydraulic directional control valve sliding spool.Energy Conversion and Management 2006;47(1):114–31.
[2] Batoli M. Theoretical and experimental analysis of flow forces on a hydraulic directional control valve. Oleodinam Pneumat1996;3:10–6 [in Italian].
[3] Borghi M, Milani M, Paoluzzi R. Stationary axial flow force analysis on compensated spool valves. Int J Fluid Power2000;1(1):17–25.
[4] Macor A, Badin D. Turbulence modelling influence on flow force analysis in hydraulic directional control valves. In: Proceedings ofthe 54th congresso nazionale ATI, 1999 [in Italian].
[5] Macor A. Experimental analysis on a directional valve with a flat notch metering section. In: Proceedings of the 57th congressonazionale ATI, Pisa, 2002 [in Italian].
[6] Del Vescovo G, Lippolis A. Flow forces analysis on an electro piloted hydraulic directional control valve. In: Proceedings of the 3rdinternational congress MiniHydro, Maratea, 2001 [in Italian].
[7] Del Vescovo G, Lippolis A. CFD analysis of flow forces on spool valves. In: Proceedings of the 1st international conference oncomputational methods in fluid power technology, Melbourne November 26–28, 2003; 2003.
[8] Del Vescovo G, Lippolis A. Three-dimensional analysis of flow forces on directional control valves. Int J Fluid Power 2003;4(2).[9] Del Vescovo G, Lippolis A. Flow forces analysis on a four way valve. In: Proceedings of 2nd FPN PhD international symposium,
Modena, July 3–6, 2002; 2002.[10] Fluent 6.1 Inc. 2003. Fluent Europe user�s guide. vols. 1–4.[11] Fluent 6.1 Inc. 2003. Fluent tutorial guide. vols. 1 and 2.[12] Fluent Inc. 2000. Gambit user�s guide.[13] Fluent Inc. 2000. Gambit Modelling guide.[14] Renn J-C, Kao T-C. Application of CFD to design a power-saving hydraulic directional two-land-four-way-valve. In: Proceedings of
the 1st international conference on computational methods in fluid power technology, Melbourne November 26–28, 2003; 2003.