Embed Size (px)
Citation preview

materials
Article
FEM Analysis of Textile Reinforced Composite MaterialsImpact Behavior
Savin Dorin Ionesi 1,*, Luminita Ciobanu 1,*, Catalin Dumitras 2, Manuela Avadanei 1, Ionut Dulgheriu 1,Irina Ionescu 1 and Maria Carmen Loghin 1,*
�����������������
Citation: Ionesi, S.D.; Ciobanu, L.;
Dumitras, C.; Avadanei, M.;
Dulgheriu, I.; Ionescu, I.; Loghin, M.C.
FEM Analysis of Textile Reinforced
Composite Materials Impact Behavior.
Materials 2021, 14, 7380. https://
doi.org/10.3390/ma14237380
Academic Editor: Abbas S. Milani
Received: 5 November 2021
Accepted: 28 November 2021
Published: 2 December 2021
Publisher’s Note: MDPI stays neutral
with regard to jurisdictional claims in
published maps and institutional affil-
iations.
Copyright: © 2021 by the authors.
Licensee MDPI, Basel, Switzerland.
This article is an open access article
distributed under the terms and
conditions of the Creative Commons
Attribution (CC BY) license (https://
creativecommons.org/licenses/by/
4.0/).
1 Faculty of Industrial Design and Business Management, “Gheorghe Asachi” Technical University of Iasi,Blvd. Mangeron, No. 29, 700050 Iasi, Romania; [email protected] (M.A.); [email protected] (I.D.);[email protected] (I.I.)
2 Faculty of Machine Manufacturing and Industrial Management, “Gheorghe Asachi” Technical University ofIasi, Blvd. Mangeron, No. 59, 700050 Iasi, Romania; [email protected]
* Correspondence: [email protected] (S.D.I.); [email protected] (L.C.); [email protected] (M.C.L.)
Abstract: Composite materials reinforced with textile fabrics represent a complex subject. Whenexplaining these materials, one must consider their mechanical behavior in general, and impactresistance in particular, as many applications are characterized by dynamic strains. Impact char-acteristics must be considered from the early stages of the design process in order to be controlledthrough structure, layer deposition and direction. Reinforcement materials are essential for thequality and behavior of composites, and textile reinforcements present a large range of advantages.It takes a good understanding of the requirements specific to an application to accurately designtextile reinforcements. Currently, simulations of textile reinforcements and composites are efficienttools to forecast their behavior during both processing and use. The paper presents the steps thatmust be followed for modelling the impact behavior of composite materials, using finite elementanalysis (FEM). The FEM model built using Deform 3D software offers information concerningthe behavior structure during impact. The behavior can be visualized for the structure as a wholeand, for different sections, be considered significant. Furthermore, the structure’s strain can bevisualized at any moment. In real impact tests, this is not possible due to the very short time intervaland the impossibility to record inside the structure, as well as to record all significant stages usingconventional means.
Keywords: FEM; impact behavior; composite materials; knitted fabrics
1. Introduction
Mechanical properties of textile reinforced composites are essential in applicationscharacterized by a high level of strains, and predicting their behavior during use is adeterminant for the design stage and ensures its quality. The complexity of textile structuresand geometries, their anisotropy and discontinuous nature make the process of modellingmechanical behavior extremely difficult.
In terms of prediction, applied mathematics is used to define boundary conditions insolving continuum mechanics. The scientific literature contains studies of applied physicsaimed at solving similar problems, but is directed to obtain continuous functions based onapproximated areas. Aerospace engineering researches focus on finding optimal ways ofexpressing the influence of the rigidity coefficients. All these results can be summed up inthree distinct approaches and solutions, each expressing a different view on the same issue,namely modelling the behavior of composite materials.
The term finite element method (FEM) defines a broad range of computing techniquesthat have certain common characteristics. Currently the main drawbacks related to ap-plication difficulties have been removed with the widespread use of computers and thedevelopment of a large range of analytic software such as ANSYS, Algor or Deform 3D.
Materials 2021, 14, 7380. https://doi.org/10.3390/ma14237380 https://www.mdpi.com/journal/materials

Materials 2021, 14, 7380 2 of 15
In the textile domain, modelling using the finite element method has experienced anaccelerated growth in the last decade, most models predicting the mechanical behavior ofcomposite materials with woven reinforcement [1–5].
Even if they have a lower mechanical resistance, knitted fabrics are widely usedfor composite reinforcement. The complexity of their specific geometry and the largenumber of structural possibilities, as well as the direct influence of the mechanical strainsintroduced during knitting at yarn level, led to the formulation of different geometricaland mechanical models for knitted fabrics, each one based on different assumptions andproduction conditions, and considered the micro, meso or macro level of the fabrics.Mechanical models of knitted fabrics can be divided into models based on force analysis,models based on energy minimization, and FEM models [6].
The situation is even more complicated in the case of knitted fabrics built along all thethree axes, the so-called 3D knitted fabrics, as it is not only the fabric structure that has tobe modelled, but also the 3D geometry of that fabric and its particularities in connectionbetween stitches.
This is the case of weft/warp knitted spacer fabrics, materials characterized by thepresence of (at least) two independent layers connected by yarns or by knitted layers [7,8].Connection through yarns limits the spatial geometry of the 3D fabrics but is widely usedin technical applications, especially as warp knitted fabrics. A large range of possibilitiesis offered by the flexibility of weft knitted spacers with connections through knitted lay-ers [9–12]. Such possibilities are beneficial for developing preforms for composite materialswith the final shape of the product.
In the literature, there are fewer FEM models for the mechanical behavior of knittedfabrics mainly due to the complexity of the yarn geometry in the stitches and the highnumber of factors influencing their properties.
All FEM models are based on geometrical models developed for knitted fabricsin general, there is an exhaustive review being carried out in this [13], or for knittedfabrics for composite reinforcement, considering the particularities of high-performancefibers [14–16]. These models concern mainly 2D knitted fabrics. Still, a literature surveyshows a limited number of models dealing with the mechanical behavior of warp knittedspacers exemplified by [17–19], as well as weft knitted spacers [20,21]. The model proposedby Hamedi [21], simulates the flexural behavior of weft knitted spacer fabrics with aconstant width (connected through knitted layers), considering the geometrical specificitiesproposed by Vassiliadis [22].
The paper presents a different approach for the modelling of mechanical behavior ofcomposite materials reinforced with weft knitted spacer fabrics, by replacing the compositewith an equivalent continuous material, with similar mechanical characteristics. Theadvantage of such an equivalence is given by the elimination of the numerical models forthe knitted structure with all their restrictions and limitations. Furthermore, an equivalentcontinuous material can be placed easily to form the required specific geometry. This is aninnovative approach to modelling composites reinforced with knitted fabrics that simplifiesthe behavior simulation. The approach requires careful consideration in determining thecharacteristics of the equivalent continuous material to correspond to the properties ofreal composite.
The equivalent model proposed in the paper deals with low velocity impact behaviorof a composite material reinforced with knitted spacers of predetermined geometry (dis-tance between connecting layers and distance between independent layers). The proposedmodel is described and used to predict impact behavior. Validation is carried out based onexperimental results to see the level of conformity the model presents.
2. Materials and Methods
The knitted reinforcement selected for this study is a sandwich fabric where theindependent outer layers (plain jersey) are connected through knitted layers placed perpen-dicularly to them. The distance between the connecting layers is 10 mm. The samples were

Materials 2021, 14, 7380 3 of 15
designed without or with inlay yarns in the exterior layers (yarns placed horizontally in thefabric, without looping it into stitches). Inlay yarns are an efficient way to enhance fabricstrength. Figure 1 presents the production of the textile reinforced composite, starting withthe knitting of the reinforcement.
Materials 2021, 14, x FOR PEER REVIEW 3 of 16
The knitted reinforcement selected for this study is a sandwich fabric where the in-dependent outer layers (plain jersey) are connected through knitted layers placed perpen-dicularly to them. The distance between the connecting layers is 10 mm. The samples were designed without or with inlay yarns in the exterior layers (yarns placed horizontally in the fabric, without looping it into stitches). Inlay yarns are an efficient way to enhance fabric strength. Figure 1 presents the production of the textile reinforced composite, start-ing with the knitting of the reinforcement.
(a) (b) (c)
(d) (e)
Figure 1. Composite reinforced with sandwich knitted fabrics—machine view (a), aspect of the outer layers with (b) and without in-lay yarns (c), preparation of the knitted reinforcement–insertion of moulds (d) and final aspect of the knitted spacer reinforced composite (e).
The 3D knitted fabric variants were produced on a STOLL CMS 320 TC flat knitting machine, Reutlingen, Germany, gauge 10E. The fabrics were made of para-aramid (Steel Kevlar and Twaron, DuPont, Wilmington, DE, USA) and technical natural yarns (Linen). The use of natural fibers was designed so as not to affect the performance of the spacer fabrics, and target an increase in sustainability. Different raw materials were used to pro-duce the outer and connecting layers, as presented in Table 1. The volume fraction of the composite samples required to increase fabric compactness was obtained by introducing transversal Twaron yarns.
Table 1. Characterisation of the experimental variants (weft knitted spacer fabrics).
Fabr
ic Outer Layers Connecting Layer
Yarn Type Layer Structure Yarn Linear
Density (Tex) Yarn Type Layer Structure Yarn Linear
Density (Tex) 1 Kevlar 49® Plain jersey 28 Kevlar 49® Plain jersey 28 2 Kevlar 49® Plain jersey 28 Linen Plain jersey 20
3 Kevlar 49® Plain jersey 28
Kevlar 49® Plain jersey 28 Twaron®
Plain jersey with inlay
6
4 Kevlar 49® Plain jersey 2
Linen® Plain jersey 20 Twaron®
Plain jersey with inlay
6
The 3D composite materials studied in this paper were produced using the 4 variants of the spacer fabrics presented in Table 1 as performs, and epoxy EPICURE 04908, Hexion,
Figure 1. Composite reinforced with sandwich knitted fabrics—machine view (a), aspect of the outer layers with (b) andwithout in-lay yarns (c), preparation of the knitted reinforcement–insertion of moulds (d) and final aspect of the knittedspacer reinforced composite (e).
The 3D knitted fabric variants were produced on a STOLL CMS 320 TC flat knittingmachine, Reutlingen, Germany, gauge 10E. The fabrics were made of para-aramid (SteelKevlar and Twaron, DuPont, Wilmington, DE, USA) and technical natural yarns (Linen).The use of natural fibers was designed so as not to affect the performance of the spacerfabrics, and target an increase in sustainability. Different raw materials were used toproduce the outer and connecting layers, as presented in Table 1. The volume fraction ofthe composite samples required to increase fabric compactness was obtained by introducingtransversal Twaron yarns.
Table 1. Characterisation of the experimental variants (weft knitted spacer fabrics).
Fabr
ic
Outer Layers Connecting Layer
Yarn Type Layer Structure Yarn LinearDensity (Tex) Yarn Type Layer Structure Yarn Linear
Density (Tex)
1 Kevlar 49® Plain jersey 28 Kevlar 49® Plain jersey 28
2 Kevlar 49® Plain jersey 28 Linen Plain jersey 20
3
Kevlar 49® Plain jersey 28
Kevlar 49® Plain jersey 28Twaron® Plain jersey
with inlay 6
4
Kevlar 49® Plain jersey 2
Linen® Plain jersey 20Twaron® Plain jersey
with inlay 6
The 3D composite materials studied in this paper were produced using the 4 variantsof the spacer fabrics presented in Table 1 as performs, and epoxy EPICURE 04908, Hexion,Columbus, OH, USA, and polyester DISTITRON 3501S, Polynt, Bergamo, Italy, as matrices,

Materials 2021, 14, 7380 4 of 15
resulting in two sets of composites. The epoxy matrix had a mixing ratio of 30% EPIKURECuring Agent 04908 and 5% Dearing agent BYK A535, while for the polyester resin themixing contained 1.5% of initiator for unsaturated polyester resin NOROX MCP 75 and0.08% polyester inhibitor NLC 10. The composite materials were processed using theVacuum Assisted Resin Transfer Molding (VARTM) technology. All experimental sampleswere cured at room temperature (23 ◦C), the ones with epoxy matrix for 46 h and the oneswith polyester for 23 h.
The modelling of the behavior to low intensity impact of the composite materials hasto be based on the physical-mechanical properties of the reinforcement and matrix used forcomposite materials. The experimental values obtained for these properties are shown inTable 2.
Table 2. Physical mechanical characteristics of composite materials.
Structure Variant Polymeric Matrix
Kevlar–Twaron Kevlar–LinenEpoxy Resin Polyester Resin
Row Wale Row Wale
Young module [N/mm2] 6376 30,411 6161 5513 2900 4000
Force [N] 2430.59 745.18 - -
Thread weight [g] 6.4 3.7 - -
Composite sample weight [g] 19.3 14 - -
Dimension of the impactor head [mm] 20
3. Definition of the Model
The general geometry of the composite material to be analyzed using FEM is definedin Figure 2a, where the exterior walls and connecting layers form the repetitive element,the partition.
Materials 2021, 14, x FOR PEER REVIEW 4 of 16
Columbus, OH, USA, and polyester DISTITRON 3501S, Polynt, Bergamo, Italy, as matri-ces, resulting in two sets of composites. The epoxy matrix had a mixing ratio of 30% EPIKURE Curing Agent 04908 and 5% Dearing agent BYK A535, while for the polyester resin the mixing contained 1.5% of initiator for unsaturated polyester resin NOROX MCP 75 and 0.08% polyester inhibitor NLC 10. The composite materials were processed using the Vacuum Assisted Resin Transfer Molding (VARTM) technology. All experimental samples were cured at room temperature (23 °C), the ones with epoxy matrix for 46 h and the ones with polyester for 23 h.
The modelling of the behavior to low intensity impact of the composite materials has to be based on the physical-mechanical properties of the reinforcement and matrix used for composite materials. The experimental values obtained for these properties are shown in Table 2.
Table 2. Physical mechanical characteristics of composite materials.
Structure Variant Polymeric Matrix
Kevlar–Twaron Kevlar–Linen Epoxy Resin Polyester Resin
Row Wale Row Wale Young module [N/mm2] 6376 30,411 6161 5513 2900 4000
Force [N] 2430.59 745.18 - - Thread weight [g] 6.4 3.7 - -
Composite sample weight [g] 19.3 14 - - Dimension of the impactor head
[mm] 20
3. Definition of the Model The general geometry of the composite material to be analyzed using FEM is defined
in Figure 2a, where the exterior walls and connecting layers form the repetitive element, the partition.
(a)
(b) (c)
Figure 2. Cont.

Materials 2021, 14, 7380 5 of 15Materials 2021, 14, x FOR PEER REVIEW 5 of 16
(d)
Figure 2. Model design. (a) Geometrical model for the equivalent continuous material. (b) Impactor position on connection layer. (c) Impactor position between connection layers. (d) Aspect of processed model.
Taking into consideration the fact that a composite material is an advanced structure made from at least two distinct materials that are combined at a macroscopic scale with different mechanical properties, a composite structure with equivalent mechanical prop-erties was considered.
Due to the specific 3D geometry of the composite, the equivalent continuous model presents open areas with predefined dimensions, and, therefore, it is important to select the position of the impactor used for low velocity impact test simulations in relation to the connecting walls, as illustrated in Figure 2. We estimated that two positions are of conse-quence: one illustrated in Figure 2b shows that the impactor is placed on the connecting layers, while in Figure 2c the impactor is placed between connecting layers. These two positions exemplify the possibilities of impact during composite’s life cycle.
The model was designed in a DEFORM 3D software, DEFORM, Columbus, OH, USA, application and was meshed with “brick” or “tetrahedral” elements [23], as illus-trated in Figure 2d. The mesh size was adjusted from fine to coarse and the number of finite elements was established at 180,000/volume.
The main steps to be taken in order to perform a finite element analysis can be grouped into a number of operations, as follows: • Division into finite elements (discretization); • Defining interpolation functions; • Defining the equations of finite elements; • Assembling elementary equations into system equations; • Solving the obtained system of equations; • Performing additional calculations if necessary to determine secondary unknowns.
For model calibration an initial testing was carried out on similar composite materi-als. A Fractovis Plus impact testing machine, Instron, Norwood, MA, USA, equipped with a round head impactor and pneumatic clamping system was used to carry out the tests.
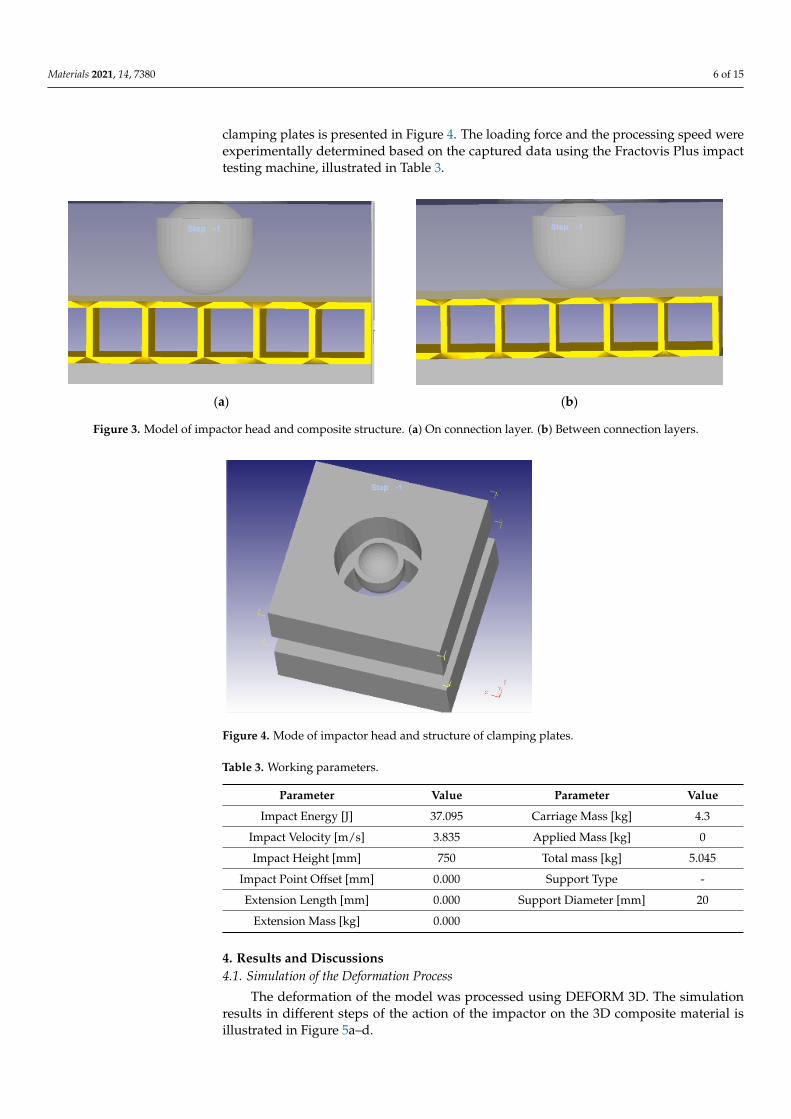
All physical pieces involved in the impact testing were modelled. The impactor po-sition on connection layer is presented in Figure 3a, while impactor position between con-nection layers is presented in Figure 3b. The model of impactor head and structure of clamping plates is presented in Figure 4. The loading force and the processing speed were experimentally determined based on the captured data using the Fractovis Plus impact testing machine, illustrated in Table 3.
Figure 2. Model design. (a) Geometrical model for the equivalent continuous material. (b) Impactor position on connectionlayer. (c) Impactor position between connection layers. (d) Aspect of processed model.
Taking into consideration the fact that a composite material is an advanced structuremade from at least two distinct materials that are combined at a macroscopic scale with dif-ferent mechanical properties, a composite structure with equivalent mechanical propertieswas considered.
Due to the specific 3D geometry of the composite, the equivalent continuous modelpresents open areas with predefined dimensions, and, therefore, it is important to selectthe position of the impactor used for low velocity impact test simulations in relationto the connecting walls, as illustrated in Figure 2. We estimated that two positions areof consequence: one illustrated in Figure 2b shows that the impactor is placed on theconnecting layers, while in Figure 2c the impactor is placed between connecting layers.These two positions exemplify the possibilities of impact during composite’s life cycle.
The model was designed in a DEFORM 3D software, DEFORM, Columbus, OH, USA,application and was meshed with “brick” or “tetrahedral” elements [23], as illustratedin Figure 2d. The mesh size was adjusted from fine to coarse and the number of finiteelements was established at 180,000/volume.
The main steps to be taken in order to perform a finite element analysis can be groupedinto a number of operations, as follows:
• Division into finite elements (discretization);• Defining interpolation functions;• Defining the equations of finite elements;• Assembling elementary equations into system equations;• Solving the obtained system of equations;• Performing additional calculations if necessary to determine secondary unknowns.
For model calibration an initial testing was carried out on similar composite materials.A Fractovis Plus impact testing machine, Instron, Norwood, MA, USA, equipped with around head impactor and pneumatic clamping system was used to carry out the tests.
All physical pieces involved in the impact testing were modelled. The impactorposition on connection layer is presented in Figure 3a, while impactor position betweenconnection layers is presented in Figure 3b. The model of impactor head and structure of
Materials 2021, 14, 7380 6 of 15
clamping plates is presented in Figure 4. The loading force and the processing speed wereexperimentally determined based on the captured data using the Fractovis Plus impacttesting machine, illustrated in Table 3.
Materials 2021, 14, x FOR PEER REVIEW 6 of 16
(a) (b)
Figure 3. Model of impactor head and composite structure. (a) On connection layer. (b) Between connection layers.
Figure 4. Mode of impactor head and structure of clamping plates.
Table 3. Working parameters.
Parameter Value Parameter Value Impact Energy [J] 37.095 Carriage Mass [kg] 4.3
Impact Velocity [m/s] 3.835 Applied Mass [kg] 0 Impact Height [mm] 750 Total mass [kg] 5.045
Impact Point Offset [mm] 0.000 Support Type - Extension Length [mm] 0.000 Support Diameter [mm] 20
Extension Mass [kg] 0.000
4. Results and Discussions 4.1. Simulation of the Deformation Process
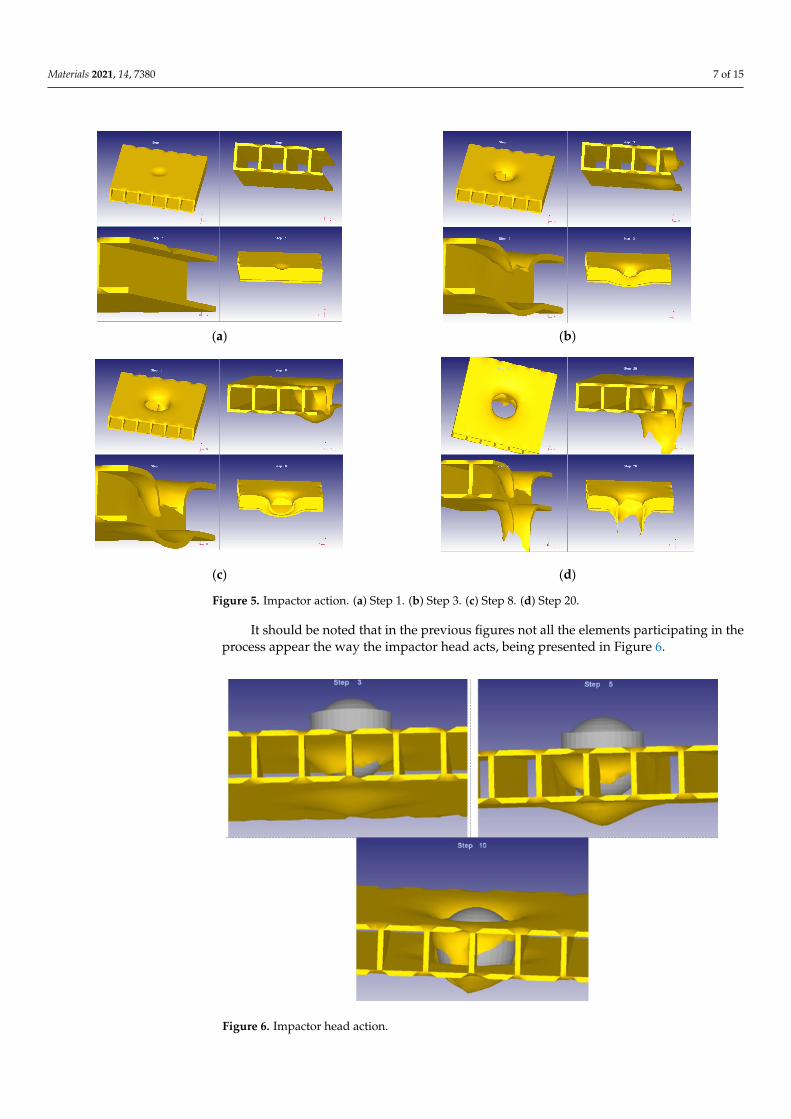
The deformation of the model was processed using DEFORM 3D. The simulation results in different steps of the action of the impactor on the 3D composite material is illustrated in Figure 5a−d.
Figure 3. Model of impactor head and composite structure. (a) On connection layer. (b) Between connection layers.
Materials 2021, 14, x FOR PEER REVIEW 6 of 16
(a) (b)
Figure 3. Model of impactor head and composite structure. (a) On connection layer. (b) Between connection layers.
Figure 4. Mode of impactor head and structure of clamping plates.
Table 3. Working parameters.
Parameter Value Parameter Value Impact Energy [J] 37.095 Carriage Mass [kg] 4.3
Impact Velocity [m/s] 3.835 Applied Mass [kg] 0 Impact Height [mm] 750 Total mass [kg] 5.045
Impact Point Offset [mm] 0.000 Support Type - Extension Length [mm] 0.000 Support Diameter [mm] 20
Extension Mass [kg] 0.000
4. Results and Discussions 4.1. Simulation of the Deformation Process
The deformation of the model was processed using DEFORM 3D. The simulation results in different steps of the action of the impactor on the 3D composite material is illustrated in Figure 5a−d.
Figure 4. Mode of impactor head and structure of clamping plates.
Table 3. Working parameters.
Parameter Value Parameter Value
Impact Energy [J] 37.095 Carriage Mass [kg] 4.3
Impact Velocity [m/s] 3.835 Applied Mass [kg] 0
Impact Height [mm] 750 Total mass [kg] 5.045
Impact Point Offset [mm] 0.000 Support Type -
Extension Length [mm] 0.000 Support Diameter [mm] 20
Extension Mass [kg] 0.000
4. Results and Discussions4.1. Simulation of the Deformation Process
The deformation of the model was processed using DEFORM 3D. The simulationresults in different steps of the action of the impactor on the 3D composite material isillustrated in Figure 5a–d.
Materials 2021, 14, 7380 7 of 15Materials 2021, 14, x FOR PEER REVIEW 7 of 16
(a) (b)
(c) (d)
Figure 5. Impactor action. (a) Step 1. (b) Step 3. (c) Step 8. (d) Step 20.
It should be noted that in the previous figures not all the elements participating in the process appear the way the impactor head acts, being presented in Figure 6.
Figure 6. Impactor head action.
Figure 5. Impactor action. (a) Step 1. (b) Step 3. (c) Step 8. (d) Step 20.
It should be noted that in the previous figures not all the elements participating in theprocess appear the way the impactor head acts, being presented in Figure 6.
Materials 2021, 14, x FOR PEER REVIEW 7 of 16
(a) (b)
(c) (d)
Figure 5. Impactor action. (a) Step 1. (b) Step 3. (c) Step 8. (d) Step 20.
It should be noted that in the previous figures not all the elements participating in the process appear the way the impactor head acts, being presented in Figure 6.
Figure 6. Impactor head action.
Figure 6. Impactor head action.

Materials 2021, 14, 7380 8 of 15
The simulation results were compared with those obtained after performing a realexperiment, as illustrated in Figure 7.
Materials 2021, 14, x FOR PEER REVIEW 8 of 16
The simulation results were compared with those obtained after performing a real experiment, as illustrated in Figure 7.
Figure 7. Comparison of the breaking area for the simulated model and impacted samples.
The program provides information on the time frames for each deformation snap-shot, and about the characteristics of the process in that moment (work speed, force de-formation, the value of the impactor stroke, etc.), as illustrated in Table 4.
Table 4. Extracted information obtained from finite element analysis.
Step No.
Mesh No. Stroke Time (s) Load X
(DaN) Load Y (DaN)
Load Z (DaN)
Speed X (mm/s)
Speed Y (mm/s)
Speed Z (mm/s)
Volume (mm3)
−1 1 0 0 -- -- -- 0 0 0 61,478.8 5 1 0.892857 0.00357142857143 4.7649 1272.9 2.4996 0 250 0 62,600.4 10 1 1.78571 0.00714285714286 0.851317 1296.5 5.0737 0 250 0 62,600.5 15 1 2.67857 0.0107142857143 2.3586 1362.9 5.6681 0 250 0 62,600.5 20 1 3.57143 0.0142857142857 1.4461 1449.8 1.5543 0 250 0 62,600.5 25 1 4.46429 0.0178571428571 2.2943 1522.6 10.955 0 250 0 62,600.5 30 1 5.35714 0.0214285714286 101.61 1604.9 103.43 0 250 0 62,600.5 35 1 6.25 0.025 2.7895 1638 25.168 0 250 0 62,600.5 40 1 7.14286 0.0285714285714 124.62 1706.6 49.233 0 250 0 62,600.5 45 1 8.03571 0.031428571429 132.49 1830.6 47.951 0 250 0 62,600.5 50 1 8.92857 0.0357142857143 160.64 1565.8 20.883 0 250 0 62,600.5 55 1 9.82143 0.0392857142857 9.905 1932.3 4.7249 0 250 0 62,600.5 60 1 10.7143 0.0428571428571 181.59 2004.4 16.246 0 250 0 62,600.5 65 1 11.6071 0.0464285714286 149.33 2032.4 2.2658 0 250 0 62,600.5 70 1 12.5 0.05 140.42 2091.5 14.438 0 250 0 62,600.4
Figure 8 present the variation on the three axes of the displacement field on the com-posite structure following the impact.
Figure 7. Comparison of the breaking area for the simulated model and impacted samples.
The program provides information on the time frames for each deformation snapshot,and about the characteristics of the process in that moment (work speed, force deformation,the value of the impactor stroke, etc.), as illustrated in Table 4.
Table 4. Extracted information obtained from finite element analysis.
StepNo.
MeshNo. Stroke Time (s) Load X
(DaN)Load Y(DaN)
Load Z(DaN)
Speed X(mm/s)
Speed Y(mm/s)
Speed Z(mm/s)
Volume(mm3)
−1 1 0 0 – – – 0 0 0 61,478.8
5 1 0.892857 0.00357142857143 4.7649 1272.9 2.4996 0 250 0 62,600.4
10 1 1.78571 0.00714285714286 0.851317 1296.5 5.0737 0 250 0 62,600.5
15 1 2.67857 0.0107142857143 2.3586 1362.9 5.6681 0 250 0 62,600.5
20 1 3.57143 0.0142857142857 1.4461 1449.8 1.5543 0 250 0 62,600.5
25 1 4.46429 0.0178571428571 2.2943 1522.6 10.955 0 250 0 62,600.5
30 1 5.35714 0.0214285714286 101.61 1604.9 103.43 0 250 0 62,600.5
35 1 6.25 0.025 2.7895 1638 25.168 0 250 0 62,600.5
40 1 7.14286 0.0285714285714 124.62 1706.6 49.233 0 250 0 62,600.5
45 1 8.03571 0.031428571429 132.49 1830.6 47.951 0 250 0 62,600.5
50 1 8.92857 0.0357142857143 160.64 1565.8 20.883 0 250 0 62,600.5
55 1 9.82143 0.0392857142857 9.905 1932.3 4.7249 0 250 0 62,600.5
60 1 10.7143 0.0428571428571 181.59 2004.4 16.246 0 250 0 62,600.5
65 1 11.6071 0.0464285714286 149.33 2032.4 2.2658 0 250 0 62,600.5
70 1 12.5 0.05 140.42 2091.5 14.438 0 250 0 62,600.4
Figure 8 present the variation on the three axes of the displacement field on thecomposite structure following the impact.

Materials 2021, 14, 7380 9 of 15Materials 2021, 14, x FOR PEER REVIEW 9 of 16
Figure 8. Variation on the 3 axes of the displacement field.
The curves in the graphs, illustrated in Figure 8, represent the evolution of the dis-placements in the direction of the specified axes in two points, considered P1 and P2, ar-ranged on the surfaces (point 1 is arranged on the upper surface and point 2 on the lower surface). On the right side is the color legend of the displacements expressed in mm.
Figure 9 presents the variation on the three axes of the strain forces on the composite structure following the impact.
Figure 8. Variation on the 3 axes of the displacement field.
The curves in the graphs, illustrated in Figure 8, represent the evolution of the dis-placements in the direction of the specified axes in two points, considered P1 and P2,arranged on the surfaces (point 1 is arranged on the upper surface and point 2 on the lowersurface). On the right side is the color legend of the displacements expressed in mm.
Figure 9 presents the variation on the three axes of the strain forces on the compositestructure following the impact.
Materials 2021, 14, x FOR PEER REVIEW 9 of 16
Figure 8. Variation on the 3 axes of the displacement field.
The curves in the graphs, illustrated in Figure 8, represent the evolution of the dis-placements in the direction of the specified axes in two points, considered P1 and P2, ar-ranged on the surfaces (point 1 is arranged on the upper surface and point 2 on the lower surface). On the right side is the color legend of the displacements expressed in mm.
Figure 9 presents the variation on the three axes of the strain forces on the composite structure following the impact.
Figure 9. Cont.

Materials 2021, 14, 7380 10 of 15Materials 2021, 14, x FOR PEER REVIEW 10 of 16
Figure 9. Variation on the 3 axes of the strain force and velocity.
Finite element modelling and analysis is particularly important in the context of the research conducted because it provides an impressive amount of information regarding the studied process, namely the impact stress of the composite structure reinforced with textile yarns. However, this information may be of no value if it is not continued and ver-ified with one or more experimental tests performed under conditions similar to those in which the analysis was performed. These experiments will validate the finite element analysis, and once it has validated several values (e.g., the level of forces in the system, working speeds, process dynamics, etc.), it is assumed that all values, and implicitly the simulations, have been validated.
4.2. Validation—Experimental Results The results from the simulation were compared to the results obtained for the com-
posite materials reinforced with spacer weft knitted U-shaped structures defined in Table 1.
Considering the results of the experimental low velocity impact tests for the samples of composite materials defined in Table 1, it can be stated that the simulation with finite elements was confirmed because the level of forces in the system (shown in the figures above) at the simulation level corresponds as an order of magnitude, size, and approaches as a value, the level experimentally determined. Thus, it is observed that we have as an order of magnitude values of thousands of N (more precisely between 1200 and 2480 N, as illustrated in Figures 10 and 11) for the force measured at an experimental level, and variations from 1276 N to 2781 N in the case of the simulation performed.
Figure 9. Variation on the 3 axes of the strain force and velocity.
Finite element modelling and analysis is particularly important in the context of theresearch conducted because it provides an impressive amount of information regarding thestudied process, namely the impact stress of the composite structure reinforced with textileyarns. However, this information may be of no value if it is not continued and verifiedwith one or more experimental tests performed under conditions similar to those in whichthe analysis was performed. These experiments will validate the finite element analysis,and once it has validated several values (e.g., the level of forces in the system, workingspeeds, process dynamics, etc.), it is assumed that all values, and implicitly the simulations,have been validated.
4.2. Validation—Experimental Results
The results from the simulation were compared to the results obtained for the compos-ite materials reinforced with spacer weft knitted U-shaped structures defined in Table 1.
Considering the results of the experimental low velocity impact tests for the samplesof composite materials defined in Table 1, it can be stated that the simulation with finiteelements was confirmed because the level of forces in the system (shown in the figuresabove) at the simulation level corresponds as an order of magnitude, size, and approachesas a value, the level experimentally determined. Thus, it is observed that we have as anorder of magnitude values of thousands of N (more precisely between 1200 and 2480 N,as illustrated in Figures 10 and 11) for the force measured at an experimental level, andvariations from 1276 N to 2781 N in the case of the simulation performed.
Materials 2021, 14, x FOR PEER REVIEW 11 of 16
Figure 10. Force displacement curves—EPOXY resin.
Figure 11. Force displacement curves—Polyester resin.
Furthermore, the experimental results show that the maximum level of displacement is placed between 10 and 36.56 mm, depending on the structure and the material used. In the case of the simulation, the values for virtual displacement vary between 27 and 37 mm.
It is observed that the intervals of variation of the forces in the system, and of the displacements obtained experimentally and virtually are significantly close in order of magnitude, and values which lead to the conclusion that the way the data were intro-duced and the conditions imposed to obtain process simulation are correct. Existing dif-ferences can be attributed to the characteristics imposed to the equivalent continuous ma-terial used for the simulation, and these characteristics can be corrected in order to im-prove the accuracy of the simulation.
Based on this, it can be stated that the simulation performed is confirmed by the ex-perimental results.
4.3. Comparative Analysis
Figure 10. Force displacement curves—EPOXY resin.

Materials 2021, 14, 7380 11 of 15
Materials 2021, 14, x FOR PEER REVIEW 11 of 16
Figure 10. Force displacement curves—EPOXY resin.
Figure 11. Force displacement curves—Polyester resin.
Furthermore, the experimental results show that the maximum level of displacement is placed between 10 and 36.56 mm, depending on the structure and the material used. In the case of the simulation, the values for virtual displacement vary between 27 and 37 mm.
It is observed that the intervals of variation of the forces in the system, and of the displacements obtained experimentally and virtually are significantly close in order of magnitude, and values which lead to the conclusion that the way the data were intro-duced and the conditions imposed to obtain process simulation are correct. Existing dif-ferences can be attributed to the characteristics imposed to the equivalent continuous ma-terial used for the simulation, and these characteristics can be corrected in order to im-prove the accuracy of the simulation.
Based on this, it can be stated that the simulation performed is confirmed by the ex-perimental results.
4.3. Comparative Analysis
Figure 11. Force displacement curves—Polyester resin.
Furthermore, the experimental results show that the maximum level of displacementis placed between 10 and 36.56 mm, depending on the structure and the material used. Inthe case of the simulation, the values for virtual displacement vary between 27 and 37 mm.
It is observed that the intervals of variation of the forces in the system, and of thedisplacements obtained experimentally and virtually are significantly close in order ofmagnitude, and values which lead to the conclusion that the way the data were introducedand the conditions imposed to obtain process simulation are correct. Existing differencescan be attributed to the characteristics imposed to the equivalent continuous materialused for the simulation, and these characteristics can be corrected in order to improve theaccuracy of the simulation.
Based on this, it can be stated that the simulation performed is confirmed by theexperimental results.
4.3. Comparative Analysis
The information provided by the simulation is more detailed than the experimentitself. This information can be broken down into several areas.
A first information refers to the behavior of the structure during the impact stress.This behavior can be viewed on the simulated structure in its entirety and, in differentsections, be considered relevant. Moreover, it can be seen how the structure is deformed atdifferent moments. This is not possible in reality because the time interval in which theprocess takes place is very short, while the means of recording the image do not allowaccess inside the structure. Furthermore, the short time in which the process takes placeleads to the impossibility of recording all the important phases by classical means.
From the deformation of the composite structure, two cases can be identified in whichthe process takes place, depending on the position between the impactor head and thecomposite structure:
• Case 1 results from the position of the axis of symmetry of the impactor head in relationto the partition. In this situation the impactor head passes through the partition wall(defined in Figure 2b).
• Case 2, the axis of symmetry of the impactor head passes between the partitions(defined in Figure 2c).
The deformations of the structure in the two considered cases are illustrated inFigure 12.

Materials 2021, 14, 7380 12 of 15
Materials 2021, 14, x FOR PEER REVIEW 12 of 16
The information provided by the simulation is more detailed than the experiment itself. This information can be broken down into several areas.
A first information refers to the behavior of the structure during the impact stress. This behavior can be viewed on the simulated structure in its entirety and, in different sections, be considered relevant. Moreover, it can be seen how the structure is deformed at different moments. This is not possible in reality because the time interval in which the process takes place is very short, while the means of recording the image do not allow access inside the structure. Furthermore, the short time in which the process takes place leads to the impossibility of recording all the important phases by classical means.
From the deformation of the composite structure, two cases can be identified in which the process takes place, depending on the position between the impactor head and the composite structure: • Case 1 results from the position of the axis of symmetry of the impactor head in rela-
tion to the partition. In this situation the impactor head passes through the partition wall (defined in Figure 2b).
• Case 2, the axis of symmetry of the impactor head passes between the partitions (de-fined in Figure 2c). The deformations of the structure in the two considered cases are illustrated in Figure
12.
Figure 12. Deformations of the structure in the two considered cases.
It can be remarked that the penetration time in the second case is shorter and also the deformations are different in size. This phenomenon leads to the idea that the level of forces of the unitary efforts are different in the two situations.
In addition to data on the deformed structure (which can be presented as a “record” of the event), the simulation provides very important information on the field of displace-ment, deformation, unit effort, as well as the deformation forces in the system at any given time during the process presented in the form of a diagram. This phenomenon has been explicitly presented previously.
Figure 13 presents the stress-effective efforts for both considered cases.
Figure 12. Deformations of the structure in the two considered cases.
It can be remarked that the penetration time in the second case is shorter and alsothe deformations are different in size. This phenomenon leads to the idea that the level offorces of the unitary efforts are different in the two situations.
In addition to data on the deformed structure (which can be presented as a “record” ofthe event), the simulation provides very important information on the field of displacement,deformation, unit effort, as well as the deformation forces in the system at any given timeduring the process presented in the form of a diagram. This phenomenon has been explicitlypresented previously.
Figure 13 presents the stress-effective efforts for both considered cases.Materials 2021, 14, x FOR PEER REVIEW 13 of 16
Figure 13. Stress-effective efforts of the structure in the two considered cases.
Contrary to expectations, it is observed that the level of stress-effective effort in Case 2 is lower than in Case 1. It was assumed that in the second case, due to the fact that there were two vertical walls on the direction of action, which offered a higher rigidity and resistance, the level of effort would be higher. However, this can be explained by the hem-ispherical shape of the impactor head. In Case 1, the first point of contact is made in the direction of the partition wall which, during the whole process, is subjected to defor-mation, generating great efforts. In the second case, the walls are on the sides of the im-pactor head. Initially, the impactor head acts on the horizontal flat surface, which has a low resistance. Subsequently, after the contact between the partition walls has been can-celled, the punch will act on the partition walls.
Based on these considerations, it can be concluded that the arrangement of the com-posite structure in relation to the impactor head has an influence on: the process times (a shorter time in Case 2); the forces in the system (Case 2 requiring high values for the Y axis direction, perpendicular to the structure, but much higher in the other two directions which leads to a lower resultant force); and the variation of the deformation speed on the three axes for the two cases (presented in Figures 14–16).
Figure 14. Stress-effective efforts—X axes in the two considered cases.
Figure 13. Stress-effective efforts of the structure in the two considered cases.
Contrary to expectations, it is observed that the level of stress-effective effort in Case2 is lower than in Case 1. It was assumed that in the second case, due to the fact thatthere were two vertical walls on the direction of action, which offered a higher rigidityand resistance, the level of effort would be higher. However, this can be explained by thehemispherical shape of the impactor head. In Case 1, the first point of contact is made in thedirection of the partition wall which, during the whole process, is subjected to deformation,generating great efforts. In the second case, the walls are on the sides of the impactor head.Initially, the impactor head acts on the horizontal flat surface, which has a low resistance.Subsequently, after the contact between the partition walls has been cancelled, the punchwill act on the partition walls.
Based on these considerations, it can be concluded that the arrangement of the com-posite structure in relation to the impactor head has an influence on: the process times (ashorter time in Case 2); the forces in the system (Case 2 requiring high values for the Yaxis direction, perpendicular to the structure, but much higher in the other two directions

Materials 2021, 14, 7380 13 of 15
which leads to a lower resultant force); and the variation of the deformation speed on thethree axes for the two cases (presented in Figures 14–16).
Materials 2021, 14, x FOR PEER REVIEW 13 of 16
Figure 13. Stress-effective efforts of the structure in the two considered cases.
Contrary to expectations, it is observed that the level of stress-effective effort in Case 2 is lower than in Case 1. It was assumed that in the second case, due to the fact that there were two vertical walls on the direction of action, which offered a higher rigidity and resistance, the level of effort would be higher. However, this can be explained by the hem-ispherical shape of the impactor head. In Case 1, the first point of contact is made in the direction of the partition wall which, during the whole process, is subjected to defor-mation, generating great efforts. In the second case, the walls are on the sides of the im-pactor head. Initially, the impactor head acts on the horizontal flat surface, which has a low resistance. Subsequently, after the contact between the partition walls has been can-celled, the punch will act on the partition walls.
Based on these considerations, it can be concluded that the arrangement of the com-posite structure in relation to the impactor head has an influence on: the process times (a shorter time in Case 2); the forces in the system (Case 2 requiring high values for the Y axis direction, perpendicular to the structure, but much higher in the other two directions which leads to a lower resultant force); and the variation of the deformation speed on the three axes for the two cases (presented in Figures 14–16).
Figure 14. Stress-effective efforts—X axes in the two considered cases. Figure 14. Stress-effective efforts—X axes in the two considered cases.
Materials 2021, 14, x FOR PEER REVIEW 14 of 16
Figure 15. Stress-effective efforts—Y axes in the two considered cases.
Figure 16. Stress-effective efforts—Z axes in the two considered cases.
Another variable that is influenced by the relative position between the impactor head and the composite structure is the size of the displacements of the structure, illus-trated in Figure 17.
Figure 15. Stress-effective efforts—Y axes in the two considered cases.
Materials 2021, 14, x FOR PEER REVIEW 14 of 16
Figure 15. Stress-effective efforts—Y axes in the two considered cases.
Figure 16. Stress-effective efforts—Z axes in the two considered cases.
Another variable that is influenced by the relative position between the impactor head and the composite structure is the size of the displacements of the structure, illus-trated in Figure 17.
Figure 16. Stress-effective efforts—Z axes in the two considered cases.

Materials 2021, 14, 7380 14 of 15
Another variable that is influenced by the relative position between the impactor headand the composite structure is the size of the displacements of the structure, illustrated inFigure 17.
Materials 2021, 14, x FOR PEER REVIEW 14 of 16
Figure 15. Stress-effective efforts—Y axes in the two considered cases.
Figure 16. Stress-effective efforts—Z axes in the two considered cases.
Another variable that is influenced by the relative position between the impactor head and the composite structure is the size of the displacements of the structure, illus-trated in Figure 17.
Figure 17. Displacement variation in the two considered cases.
5. Conclusions
Modelling and finite element analysis are particularly important in the present re-search context, providing an impressive amount of information regarding the impactbehavior of polymeric composites reinforced with knitted 3D sandwich fabrics. However,this information has no value if not validated by one or more experimental tests carriedout in similar conditions to those under which the analysis was performed.
An FEM model was proposed in the paper, in which the ensemble knitted rein-forcement and matrix is considered a continuous material with specific properties. Thisequivalent material was used to build the model and to simulate low velocity impactbehavior.
This is a different approach than models presented in the literature as it eliminates thecomplex and restrictive geometrical models of the knitted structures, especially difficultand time consuming for 3D geometries and the specific connections between layers. Themodel was developed using Deform 3D software, calibrated using the data from an initialtest carried out for all experimental variants.
The FEM model offered important information concerning the behavior structureduring impact, showing how the material reacts with the impactor, how it breaks and towhich level of stress. The simulation takes into consideration both situations in which thecomposite can be impacted during use: the impact can occur perpendicular to a connectingwall or between two connecting walls.
The behavior can be visualized for the structure as a whole and, for different sections,be considered significant. Furthermore, the structure’s strain can be visualized at anymoment. This is not possible for the tests used for validation due to the very shorttime interval, and the impossibility to record inside the structure, as well as to record allsignificant stages using conventional means.
Apart from the information regarding the material deformation (that can be pre-sented as a ‘movie’ about this event), important data are gained concerning the displace-ment/strain/stress/effort, as well as the deformation forces for single moments during theimpact and a diagram of their evolution throughout the entire phenomenon.
Author Contributions: Conceptualization, S.D.I., L.C., C.D. and M.C.L.; methodology and software,C.D., M.A., I.I. and I.D.; performed the experiments S.D.I., L.C. and I.D.; validation, M.A., I.I. andL.C.; formal analysis, S.D.I. and L.C.; investigation, C.D., I.D., M.C.L. and I.I.; resources, M.C.L.and L.C.; data curation, M.C.L. and S.D.I.; writing—original draft preparation, S.D.I., M.A. and I.I.;

Materials 2021, 14, 7380 15 of 15
writing—review and editing, L.C., I.D., M.C.L. and C.D.; funding acquisition, M.C.L. and S.D.I. Allauthors have read and agreed to the published version of the manuscript.
Funding: This work is funded by TUIASI Internal Grants Program (GI_P17/2021) financed by theRomanian Government.
Institutional Review Board Statement: Not applicable.
Informed Consent Statement: Not applicable.
Data Availability Statement: Not applicable.
Conflicts of Interest: The authors declare no conflict of interest.
References1. Lomov, S.; Ivanov, D.; Verpoest, I.; Zako, M.; Kurashiki, T.; Nakai, H.; Hirosawa, S. Meso-FE modelling of textile composites:
Road map, data flow and algorithms. Compos. Sci. Technol. 2007, 67, 1870–1891. [CrossRef]2. D’Amato, E. Finite element modeling of textile compozites. Compos. Struct. 2001, 54, 467–475. [CrossRef]3. Nilakantan, G.; Keefe, M.; Bogetti, T.; Adkinson, R.; Gillespie, J. On the finite element analysis of woven fabric impact using
multiscale modeling techniques. Int. J. Solids Struct. 2010, 47, 2300–2315. [CrossRef]4. Nawafleh, M.A.; Al-Kloub, N. Plane deformation of a textile material with boundary forces using finite element method. Jordan J.
Mech. Ind. Eng. 2009, 3, 222–227.5. Zhou, Y.; Sun, Y.; Huang, T. Bird-Strike Resistance of Composite Laminates with Different Materials. Materials 2020, 13, 129.
[CrossRef] [PubMed]6. Loginov, A.U.; Grishanov, S.A.; Hardwood, R.J. Modelling the Load–Extension Behaviour of Plain-knitted Fabric: Part I: A
Unit-cell Approach towards Knitted-fabric Mechanics. J. Text. Inst. 2002, 93, 218–238. [CrossRef]7. Araújo, M.; Fangueiro, R.; Hong, H. Modelling and Simulation of the Mechanical Behaviour of Weft-Knitted Fabrics for Technical
Applications. Part II: 3D model based on the elastica theory. Autex Res. J. 2003, 3, 166–172.8. Araujo, M.; Fangueiro, R.; Soutinho, F. Improving the stiffness of unidirectionally orientated weft knitted structures for polymer
matrix composite reinforcement. J. Text. Inst. 2009, 100, 715–721. [CrossRef]9. Abounaim, M.; Hoffmann, G.; Diestel, O.; Cherif, C. High performance thermoplastic composite from flat knitted multi-layer
textile perform using hybrid yarn. Compos. Sci. Technol. 2011, 71, 511–519. [CrossRef]10. Abounaim, M.; Hoffmann, G.; Diestel, O.; Cherif, C. Termoplastic composite from innovative flat knitted 3D multi-kayer spacer
fabric using hybrid yarn and the study of 2D mechanical properties. Compos. Sci. Technol. 2010, 70, 363–370.11. Ionesi, D.; Dumitras, C.; Ciobanu, L.; Vircan, A. Analysis of low velocity impact behaviour of aramid-linen fibre reinforced
compositesusing Taguchi method. J. Optoelectron. Adv. Mater. 2012, 14, 544–550.12. Ionesi, D.; Fangueiro, R.; Ciobanu, L.; Budulan, C. Practical aspects regarding the production of composite materials with 3D
textile reinforcements. In Proceedings of the 16th International Conference MODTECH 2012, Sinaia, Romania, 24–26 May 2012;pp. 477–480.
13. Liu, D.; Christe, D.; Shakibajahromi, B.; Knittel, C.; Castaneda, N.; Breen, D.; Dion, G.; Kontos, A. On the role of materialarchitecture in the mechanical behavior of knitted textiles. Int. J. Solids Struct. 2017, 109, 101–111. [CrossRef]
14. Kyosev, Y. Survey over the mechanical modelling of weft knitted structures. In Proceedings of the 2nd International TechnicalTextiles Congress 2005, Istanbul, Turkey, 13–15 July 2005. [CrossRef]
15. Araújo, M.; Fangueiro, R.; Hong, H. Modeling and Simulation of the Mechanical Behavior of Weft-Knitted Fabrics for TechnicalApplications, Part III: 2D hexagonal FEA model with non-linear truss elements. Autex Res. J. 2004, 4, 25–32.
16. Choi, K.; Lo, T. An Energy Model of Plain Knitted Fabric. Textile Res. J. 2003, 73, 739–748. [CrossRef]17. Aranda-Iglesias, D.; Giunta, G.; Peronnet-Paquin, A.; Sportelli, F.; Keniray, D.; Belouettar, S. Multiscale modelling of the
mechanical response of 3D multi-axial knitted 3D spacer composites. Compos. Struct. 2021, 257, 1–13. [CrossRef]18. Chen, S.; Long, H.; Liu, Y.; Hu, F. Mechanical properties of 3d-structure composites based on warp-knitted spacer fabrics. Autex
Res. J. 2015, 15, 127–137. [CrossRef]19. Orlik, J.; Krier, M.; Neusius, D.; Pietsch, K.; Sivak, O.; Steiner, K. Recent Efforts in Modeling and Simulation of Textiles. Textiles
2021, 1, 322–336. [CrossRef]20. Omrani, E.; Hasani, H.; Dibajian, S.H. Multi-Scaled Modeling the Mechanical Properties of Tubular Composites Reinforced with
Innovated 3DWeft Knitted Spacer Fabrics. Appl. Compos. Mater. 2018, 25, 145–161. [CrossRef]21. Hamedi, S.; Hasani, H.; Dibajian, S.H. Numerical simulating the flexural properties of 3D weft-knitted spacer fabric reinforced
composites. J. Compos. Mater. 2017, 51, 1887–1899. [CrossRef]22. Vassiliadis, S.; Provatidis, C.; Kallivretaki, A. Geometrical modeling of plain weft knitted fabrics. Indian J. Fibre Text Res. 2007, 32,
62–71.23. Dumitras, C.; Hobjila, V. Programarea si Utilizarea Calculatorului. Elemente Finite; Cerni Publishing House: Bucharest, Romania, 2003.