Embed Size (px)
Citation preview
Power Market Integration: Contribution to Climate Mitigation ENTRO 1/90
Nile Basin Initiative
Eastern Nile Technical Regional Office (ENTRO)
Power Market Integration Activity Contribution to
Climate Mitigation
Consultancy Service
By
Elfatih A B Eltahir
Final Report
December 2012
Power Market Integration: Contribution to Climate Mitigation ENTRO 2/90
TABLE OF CONTENTS
Executive Summary ........................................................................................................................ 6
1.0 BACKGROUND .............................................................................................................................................. 7
2.1 CARBON TRADING AND THE KYOTO PROTOCOL .......................................................................................................... 9
2.2 CLEAN DEVELOPMENT MECHANISM (CDM) ........................................................................................................... 10
CDM Engagement Steps ..................................................................................................................................... 11
CDM story in numbers ........................................................................................................................................ 12
Carbon Funds ..................................................................................................................................................... 13
2.0 STUDY OBJECTIVES AND TASKS (FROM TOR) .............................................................................................. 14
3.0 METHODOLOGY OF THIS STUDY ................................................................................................................. 15
3.1 STEP:1 REVIEW OF POWER DEVELOPMENT PLANS AND POWER TRADE STUDIES ............................................................. 15
3.2 STEP 2: SELECT AN “IDEAL” SCENARIO .................................................................................................................... 15
3.3 STEP 3: ESTIMATE THE POTENTIAL REDUCTION IN CARBON EMISSION ............................................................................ 16
3.4 STEP 4: PROVIDE A ROAD MAP FOR ENGAGEMENT OF THE CDM PROCESS ..................................................................... 16
4.0 APPLICATION OF METHODOLOGY: ESTIMATION OF POWER MARKET INTEGRATION ACTIVITY
CONTRIBUTION TO CLIMATE MITIGATION ........................................................................................................... 16
4.1 STEP 1 ............................................................................................................................................................. 16
Power Development Plans ................................................................................................................................. 20
Financial Costs and Benefits from Interconnection ............................................................................................ 21
4.2 STEP 2 ............................................................................................................................................................. 25
Considerations for CDM Engagement ................................................................................................................ 25
Potential Power Trade Scenarios ....................................................................................................................... 26
4.3 STEP 3 ............................................................................................................................................................. 31
CDM Baseline Methodologies ............................................................................................................................ 33
AM0108 Interconnection between electricity systems for energy exchange .................................................... 34
Emission Reduction ............................................................................................................................................ 36
Monetary Value of CER ...................................................................................................................................... 37
4.4 STEP 4 ............................................................................................................................................................. 38
Institutional Roles............................................................................................................................................... 38
CDM Registration Steps...................................................................................................................................... 38
What is needed in the PDD? ............................................................................................................................... 41
5.0 SCENARIO III: EXPORT OF ELECTRICITY FROM ETHIOPIA TO SUDAN AND EGYPT (1200MW/2000MW) .......... 42
5.1 EXPORT OF ELECTRICITY FROM ETHIOPIA TO EGYPT (2000MW) ..................................................................................... 43
Emission Reduction ............................................................................................................................................ 45
Monetary Value of CER ...................................................................................................................................... 47
5.2 EXPORT OF ELECTRICITY FROM ETHIOPIA TO SUDAN (1200 MW) ................................................................................... 51
Emission Reduction ............................................................................................................................................ 54
Monetary Value of CER ...................................................................................................................................... 56
6.0 CONCLUSIONS AND RECOMMENDATIONS ..................................................................................... 59
REFERENCES ......................................................................................................................................................... 61
Power Market Integration: Contribution to Climate Mitigation ENTRO 3/90
APPENDIX A: CDM METHODOLOGIES ...................................................................................................... 62
APPENDIX B: EMISSION REDUCTION SPREADSHEET AND CALCULATION (SCENARIO II) ......... 63
APPENDIX C: EMISSION REDUCTION SPREADSHEET AND CALCULATION (SCENARIO III) ........ 76
(I) EXPORT OF ELECTRICITY FROM ETHIOPIA TO EGYPT ............................................................. 76
(II) EXPORT OF ELECTRICITY FROM ETHIOPIA TO SUDAN ........................................................ 83
LIST OF TABLES
Table 1: List of Carbon Funds that may finance Hydropower-related CERs in Africa ............... 13
Table 2: Basic Information about Population, Economy, and Electric Sector in Egypt, Sudan, and
Ethiopia (CIA World facts book) .................................................................................................. 17
Table 3: Power development Plans in Egypt, Ethiopia, and Sudan 2006-2030 (Source: Power
Trade Study reports and minor modifications by consultant) ....................................................... 18
Table 4: Investment cost of the Interconnection Options ............................................................. 23
Table 5: Net Present Value of the interconnection – Loose pool model ...................................... 24
Table 6: Benefit to Cost Ratio – Loose pool model...................................................................... 24
Table 7: Total additional export and CO2 reductions - Loose pool ............................................. 30
Table 8: 700MW Scenario for CDM Engagement ....................................................................... 31
Table 9: List of UNFCC Approved Methodologies for Calculating Baseline and Emissions
Reductions Relevant to Electricity Transmission and Generation Projects .................................. 33
Table 10: 2000MW Scenario for Egypt CDM Engagement ......................................................... 43
Table 11: Estimated Emissions Reductions from 2020-2028 for 2000 MW Power Transmission
from Ethiopia to Egypt.................................................................................................................. 47
Table 12: Net Present Value of the Emission Reduction using a Discount Rate of 6.24% .......... 49
Table 13: Net Present Value of the Emission Reduction using a Discount Rate of 10% ............. 51
Table 14: 1200MW Scenario for Sudan CDM Engagement ........................................................ 52
Power Market Integration: Contribution to Climate Mitigation ENTRO 4/90
Table 15: Estimated Emissions Reductions from 2020-2028 for 1200 MW Power Transmission
from Ethiopia to Sudan ................................................................................................................. 55
Table 16: Net Present Value of the Emission Reduction using a Discount Rate of 6.24% .......... 57
Table 17: Net Present Value of the Emission Reduction using a Discount Rate of 10% ............. 58
LIST OF FIGURES
Figure 1: Registered Clean Development Mechanism Projects around the World (Source:
UNFCC) .......................................................................................................................................... 8
Figure 2: Comparison of economic generation costs in the different generation mixes (6 000
hours/ year) - Year 2030 - Medium fuel price scenario (60 USD/bbl) - 10% discount rate ......... 22
Figure 3: Generation and Consumption of Electricity in Sudan (1980-2008) (US EIA) ............. 27
Figure 4: CDM Project Cycle (Source: CDM Watch) .................................................................. 40
Power Market Integration: Contribution to Climate Mitigation ENTRO 5/90
Acronyms and Abbreviations
AM Approved Methodology
BM Build Margin
CCGT combined cycle gas turbine
COP Conference of the Parties
DNA Designated National Authority
DOE Designated Operational entity
EB Executive Board
ENCOM Eastern Nile Council of Ministries
ENSAP Eastern Nile Subsidiary Action Program
ENTRO Eastern Nile Technical Regional Office
EPA Environmental Protection Agency
ERU Emission Reduction Unit
ET Emission trading
EU ETS European Union Emission Trading Scheme
GDP Gross Domestic Product
GHG Greenhouse Gases
JI Joint Implementation
KWh Kilo watt hours
LULUCF Land Use/ Land Use change and forestry
MBTU Million British Thermal Units
MOP Meeting of Parties
MW Megawatts
NPV Net Present Value
OM Operating Margin
Power Market Integration: Contribution to Climate Mitigation ENTRO 6/90
Executive Summary
The Eastern Nile Power Trade Project and the Ethiopia-Sudan Interconnection Project point towards a
future where the energy markets in the Eastern Nile (EN) countries is transformed from three national
independent markets into one regional integrated market. As a result, planners in the EN region will have
the opportunity to compare under a single framework the two options for expanding electric generation
capacity: hydropower; or burning of fossil fuels (oil, coal, or natural gas). These two options can be
compared in their profitability, but also in their impact on the environment and in particular their impact
on anthropogenic emissions of carbon dioxide, and hence on climate change mitigation. Without
introducing connectivity between the three countries, the two options for electricity generation may not
both be feasible for each country considered independently. The objectives of this study are: (i) Document
how the Eastern Nile Power Trade Project and the Ethiopia-Sudan Transmission Line have integrated the
energy markets in the three EN countries from three different national markets into one regional market;
(ii) Analyze how the integration of the markets offers an opportunity for a different screening criterion to
be used in selection of new energy sources for the region; and (iii) Illustrate with examples how
integration of three markets can be used within the Clean Development Mechanism (CDM) process to
secure certified emission reductions(CERs).
Based on analysis of the power development plans for the three countries, the Power Trade Study
identified the potential for export of electricity from Ethiopia to Sudan and Egypt as a promising trade
opportunity. Hydropower projects in Ethiopia are identified as power supply projects that rely on clean
technology and have the potential to satisfy regional demand, beyond the national boundaries. The
ENCOM has decided as a strategic choice to proceed with the option of 1200MW/2000MW
transmission line for export of electricity from Ethiopia to Sudan/Egypt. Under this scenario, and
assuming that Sudan uses coal as an alternative energy source we estimate a steady state emission
reduction of 6.2 million tonnes of CO2 per year. In recent years, the value of the CERs declined
significantly, in response to trends in supply and demand, and due to uncertainty about future regulation
environment. A current CER price of $1.3 translates into a yearly credit of about $8 million USD.
Assuming that Egypt use natural gas as an alternative source of energy we estimate a steady state
emission reduction of 4.6 million tonnes of CO2 per year, and a yearly credit of about $6 million USD.
As an alternative scenario, we analyze a project recommended by the Power Trade Study involving
connecting Egypt to the regional electricity grid, for the purpose of importing (700MW) of electricity
from Ethiopia to Egypt instead of local generation from natural gas. This scenario may represent an
economically attractive and relatively optimal candidate for engaging the CDM. The annual average price
of natural gas declined significantly in recent years, by about 40% between 2007 and 2011. Under such
conditions, it is not clear that export of electricity from Ethiopia to Egypt instead of local generation of
electricity from natural gas would be an economically profitable activity. This conclusion can change,
however, if credit due to potential CERs is added to the equation. Conditions such as these make it
feasible to satisfy the “additionality” requirement, and hence successfully engage the CDM process.
Additionality requires that the planned emission reductions would not occur without the additional
incentive provided by the CERs. With an estimated steady state emission reduction of about 1.6 tonnes
of CO2 per year and a current CER price of about US $1.3, a project for exporting (700MW) of electricity
from Ethiopia to Egypt could receive CERs with a current market value of about $2 million USD, per
year.
Power Market Integration: Contribution to Climate Mitigation ENTRO 7/90
1.0 BACKGROUND
The Eastern Nile Power Trade Project and the Ethiopia-Sudan Interconnection Project are
two complementary ENSAP projects. The objective of the Eastern Nile Power Trade Project is
to “promote Eastern Nile regional power trade through coordinated planning and development of
power generation and transmission interconnection and creation of an enabling environment.”
The objective of Ethiopia-Sudan Interconnection project is to “facilitate, through high voltage
transmission line, cross-border power trade between Ethiopia and Sudan, and thus optimize
utilization of existing and planned generation capacity.” While the former emphasizes institution
building and policy formulation, the latter is concerned with infrastructure development and
optimizing the use of electricity generation capacity. These two projects will have important
impact on the region. Taken together, the two projects transform the energy market in the
Eastern Nile (EN) countries from three national independent markets into one regional integrated
market. The three EN countries have different types of natural resources that can be used for
enhancing electric generation capacity: Ethiopia is relatively rich in hydropower potential; Sudan
is relatively rich in oil resources; and Egypt is relatively rich in natural gas resources. Following
integration of the three national markets into one regional market, planners in the EN region will
have the opportunity to compare under a single framework the two options for expanding electric
generation capacity: generating electricity from hydropower; or generating electricity from
burning fossil fuels (oil, or natural gas). These two options can be compared in their profitability.
However, another important way to compare these two options is relative to their impact on the
environment and in particular their impact on anthropogenic emissions of carbon dioxide, and
hence on the process of climate change. Without the connectivity introduced between the three
countries, the two options for electricity generation may not both be feasible for each individual
country taken separately.
The Power Trade project in the Nile Basin is an effort to promote regional power trade
through coordinated planning and development of power generation and transmission. By
facilitating cross border power trade, it will be possible to take advantage of complementary
renewable resources and replace gas production in Egypt and oil production in Sudan with
surplus renewable hydropower energy from Ethiopia. The concept is that the power trade would
reduce the greenhouse gas (GHG) emissions as it would replace a carbon intensive fuel source
Power Market Integration: Contribution to Climate Mitigation ENTRO 8/90
with a renewable source. These greenhouse gases are the main drivers in global and regional
climate change. A reduction in GHG may receive credit if the project can qualify for a Clean
Development Mechanism under renewable energy registration.
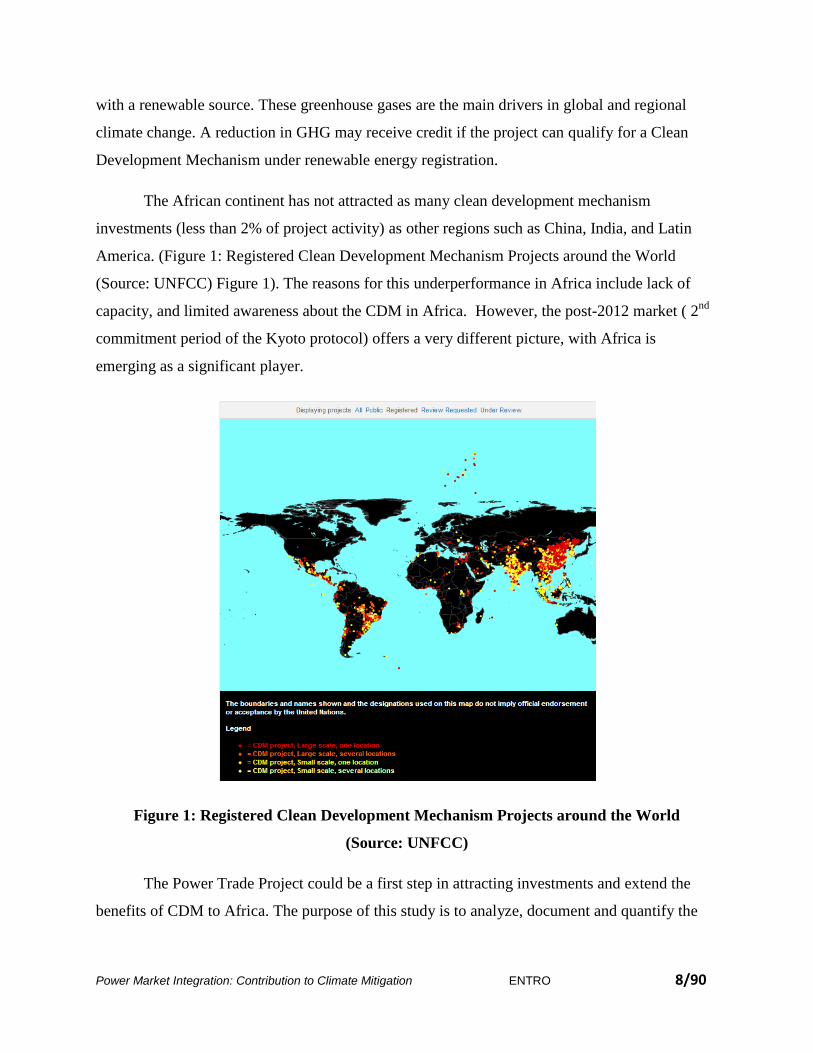
The African continent has not attracted as many clean development mechanism
investments (less than 2% of project activity) as other regions such as China, India, and Latin
America. (Figure 1: Registered Clean Development Mechanism Projects around the World
(Source: UNFCC) Figure 1). The reasons for this underperformance in Africa include lack of
capacity, and limited awareness about the CDM in Africa. However, the post-2012 market ( 2nd
commitment period of the Kyoto protocol) offers a very different picture, with Africa is
emerging as a significant player.
Figure 1: Registered Clean Development Mechanism Projects around the World
(Source: UNFCC)
The Power Trade Project could be a first step in attracting investments and extend the
benefits of CDM to Africa. The purpose of this study is to analyze, document and quantify the
Power Market Integration: Contribution to Climate Mitigation ENTRO 9/90
Power Trade Project and provide a guideline for how it may apply for CDM registration.
Ultimately the goal is to show how these efforts can be used to guide future activities.
2.1 Carbon Trading and the Kyoto Protocol
In 1997, the Kyoto Protocol was developed to place a limit on GHG emissions. The
Protocol set targets for industrialized countries to reduce their domestic emissions by an average
of 5% below 1990 levels in the period 2008-2012 (the first commitment period). The Kyoto
Protocol, created a new commodity in the form of emission reductions or removals. Carbon, the
principal green-house gas, is now tracked and traded like any other commodity on the "carbon
market."
The Kyoto Protocol allows for three main flexible mechanisms of reducing one tonne of a
greenhouse gas (GHG) emissions: Emissions Trading (ET), Joint Implementation (JI) and the
Clean Development Mechanism (CDM). While different in operation, these three mechanisms
are based on the same principle: help industrialized countries decrease the volume of GHG
regardless of where the reduction is implemented at the lowest cost possible. JI and the CDM are
called “project-based” mechanisms because they fund actual projects whereas ET is a transfer of
from one country to another.
The Kyoto Protocol entered into force in February 2005 and the carbon units are tracked and
recorded through a registry system. The carbon units are categorized as follows based on the
flexible mechanism implemented:
A Removal Unit (RMU) is based on land-use/land-use change and forestry (LULUCF)
An Emission Reduction Unit (ERU) is generated by a joint implementation project in
which a developed country buys a credit from projects in transitional economies
A Certified Emission Reduction (CER) is generated from a clean development
mechanism project in which a developed country buys a carbon credit from a sustainable
project in a developing nation.
Power Market Integration: Contribution to Climate Mitigation ENTRO 10/90
In the past decade Africa did not engage the CDM to any significant degree. However, the post-
2012 market ( 2nd commitment period of the Kyoto protocol) offers a very different picture.
China accounted for 43% of post-2012 CERs in 2011. Other Asian countries accounted for 25%
of the volume. Africa is emerging as a significant player, accounting for 21% of post-2012
CERs.
The following are a few examples of projects which are eligible to receive certified carbon
credits:
1. Renewable Energy Projects. Use sources of energy that are readily available and quickly
replenished by nature such as hydro, wind and solar. To qualify, the projects must need the
revenue from carbon credits to become economically viable and emissions cannot be released
elsewhere as a result of the renewable power installation. (Feed-in tariffs subsidized by the
national government are usually not eligible)
2. Forestry projects. Use the carbon sequestration capacity of trees and, thus, earn carbon
credits. There is a collaborative initiative for Reducing Emissions from Deforestation and
Forest Degradation (REDD) in the developing countries.
3. Sustainable agriculture. Uses adapted grazing land management techniques to reduce
emissions related to livestock production and other sustainable farming techniques which
facilitate increased carbon storage in soil.
4. Low-emission consumer goods. Allow project developers to earn carbon credits offset from
the emissions prevented and sell these credits to generate a return on their investment. The
funds they earn are used to pay back investors and to keep the project financially feasible.
2.2 Clean Development Mechanism (CDM)
The three main sectors of the carbon trading market are rooted in (1) European Union
Emission Trade Scheme (EU ET S) and the associated European Union Allowances (EUA)
issued and distributed by the European Union to the different countries, as the main tool for
establishing the European Cap and Trade mechanism; (2) The CDM and the associated CERs;
and (3) The voluntary offset markets where companies, individuals, and events buy emission
Power Market Integration: Contribution to Climate Mitigation ENTRO 11/90
reductions certificates to reduce their carbon footprint, and the associated Voluntary Emissions
Reductions (VERs). The size of these three market sectors are quite different. In 2011, the last
year for which data is available, trade in secondary EUAs, CERs and VERs accounted for (77%,
19%, <1%). CERs can be sold both for countries attempting to satisfy Kyoto Protocol
obligations, and corporations attempting to remain within their EU emissions caps. As a result
CERs offer the most attractive instrument to be engaged by power projects on the Nile basin.
The (CDM) would be most suitable for Egypt, Sudan, and Ethiopia, especially for the
hydro power generation, power trade projects currently under consideration and thus warrant
main focus in this report. CDM is an important part of the Kyoto Protocol as it has an explicit
mandate to promote sustainable development (unlike JI or ET) and that it directly involves
developing countries in reducing greenhouse gas emissions.
The CDM was established under Article 12 of the Kyoto Protocol, and allows a country
with an emission-reduction commitment to “effectively” implement an emission-reduction
project in different (usually developing) countries. Such projects can earn saleable certified
emission reduction (CER) credits, (each CER is equivalent to one tonne of CO2 reduction).
These CERs can in turn be sold to industrialized countries or corporations for use in accounting
of their emission reduction and can be counted towards meeting Kyoto targets. This is the first
global, environmental investment and credit scheme of its kind, providing standardized
emissions offset instrument, CERs.
The CDM is often regarded as the most efficient and effective long term method to
reduce and offset GHG emissions. It is a system by which low-cost carbon emission reductions
in developing countries can be implemented and made viable with the help of funds from
developed countries in exchange for offset credits. CDM helps support projects undertaken in
developing countries and are intended to meet two overall objectives: first, to address the
sustainable development needs of the host country; and second, to reduce/limit carbon emissions
to generate CERs that are deemed valid for developed countries’ emission reduction targets for
2008-2012 and thus increase their compliance options.
CDM Engagement Steps
The specific steps for engagement of the CDM are:
Power Market Integration: Contribution to Climate Mitigation ENTRO 12/90
(i) A project participating in the CDM has to first be approved by a designated national
authority as contributing to the country’s sustainable development objectives;
(ii) Formal registration by the Executive Board of the CDM has to be secured;
(iii) The project has to establish a baseline scenario to determine emissions levels assuming
that the project is not developed. This is often called “Quantification”;
(iv) The project has to meet the “additionality” requirement which establishes that the
planned reductions would not occur without the additional incentive provided by the
CERs credits. The CDM should only generate carbon credits from activities beyond
business-as-usual, i.e. from projects that were built only because of the extra income from
selling carbon credits; and
(v) A crediting period must be determined and the project must demonstrate “permanence”
The project has to be monitored over a pre-specified accounting period to determine the
difference between actual emissions and the corresponding emissions under the baseline
assumptions. This difference is then credited to the project as a CER. The emissions
reductions are verified during the crediting period and must show that there is indeed a
reduction in emission and not “leakage” or displacement of carbon emissions to a
different location.
CDM story in numbers
According to the CDM watch organization, “The first CDM project was registered on 18th
November 2004, and the next ones followed rapidly. In 2010, the 2,000th project was registered.
Now, with another 2,500 projects at the validation stage, the mechanism is expected to generate
more than 2.9 billion CERs in the first commitment period of the Kyoto Protocol. The UNFCC
celebrated the issuance of the billionth certified emission reduction credit of CO2 equivalent
offset. They present the CDM story in numbers as follows:
4,600 CDM projects registered since 2004
1,900 small scale projects
3,200 renewable energy projects (120 GW installed capacity)
161 countries-76 have registered CDM projects, CER’s issued to projects in 50 countries
Power Market Integration: Contribution to Climate Mitigation ENTRO 13/90
$215 billion invested in CDM projects
Carbon Funds
Many specialized businesses serve as Carbon Funds; they are agents that buy credits on
behalf of clients (government, business etc.) seeking CERs. Renewable energy sources such as
biomass and hydropower are generally more interesting to carbon funds.
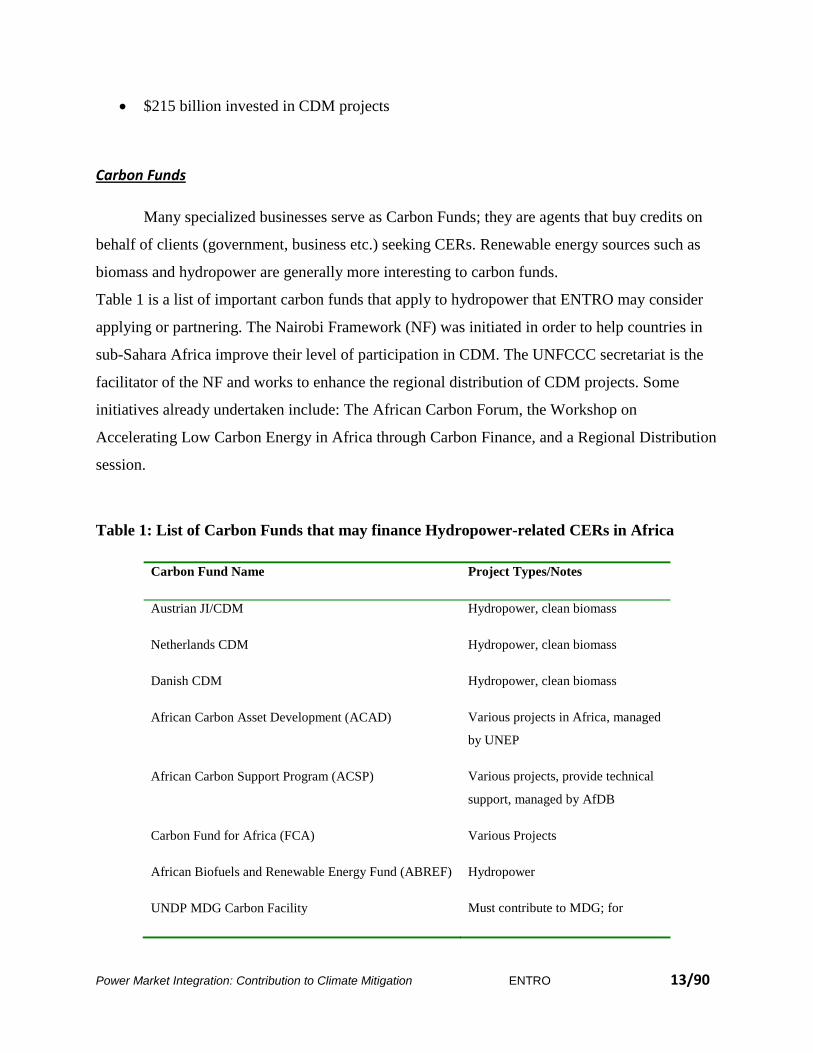
Table 1 is a list of important carbon funds that apply to hydropower that ENTRO may consider
applying or partnering. The Nairobi Framework (NF) was initiated in order to help countries in
sub-Sahara Africa improve their level of participation in CDM. The UNFCCC secretariat is the
facilitator of the NF and works to enhance the regional distribution of CDM projects. Some
initiatives already undertaken include: The African Carbon Forum, the Workshop on
Accelerating Low Carbon Energy in Africa through Carbon Finance, and a Regional Distribution
session.
Table 1: List of Carbon Funds that may finance Hydropower-related CERs in Africa
Carbon Fund Name Project Types/Notes
Austrian JI/CDM Hydropower, clean biomass
Netherlands CDM Hydropower, clean biomass
Danish CDM Hydropower, clean biomass
African Carbon Asset Development (ACAD) Various projects in Africa, managed
by UNEP
African Carbon Support Program (ACSP) Various projects, provide technical
support, managed by AfDB
Carbon Fund for Africa (FCA) Various Projects
African Biofuels and Renewable Energy Fund (ABREF) Hydropower
UNDP MDG Carbon Facility Must contribute to MDG; for
Power Market Integration: Contribution to Climate Mitigation ENTRO 14/90
countries with no CDM project;
2.0 STUDY OBJECTIVES AND TASKS (From TOR)
The three main objectives of this study are:
(i) Document how the Eastern Nile Power Trade Project and the Ethiopia-Sudan Transmission
Line have integrated the energy markets in the three EN countries from three different national
markets into one regional market;
(ii) Analyze how the integration of the markets offers an opportunity for a different screening
criterion to be used in selection of new energy sources for the region; and
(iii) Illustrate with examples how integration of three markets (Ethiopia, Sudan and Egypt) can
be used within the CDM process to secure certified emission credits.
The tasks of this study are:
1. Review the power development plans of the EN countries and develop power demand
trajectories
2. Identify how the regional power trade project can assist in filling the power demand in
the EN countries according to the power trade studies. The consultant shall identify opportunities
as well as peak demand complementarities and other opportunities as well.
3. Develop necessary tools to estimate carbon emissions due to power development
trajectories with and without the regional power trade options developed in the power trade
studies.
4. Estimate carbon emission savings that integration of the EN power market will provide
5. Make recommendations for further carbon financing engagement
6. Conduct a preliminary Economic appraisal on the carbon emissions reduction financing
opportunities
Power Market Integration: Contribution to Climate Mitigation ENTRO 15/90
7. Prepare road map for carbon trade engagement.
3.0 METHODOLOGY OF THIS STUDY
The proposed methodology for this study consists of the following four steps:
3.1 Step:1 Review of power development plans and Power Trade Studies of the EN countries
The first step in this study will consist of
(i) A thorough review of national power development plans to define demand trajectories, and
proposed supply projects for each of the EN countries;
(ii) A review of the Power Trade Studies in order to identify mechanisms that have already
been discussed on how to match demand projections and supply projects at the regional
scale; and
(iii) An identification of power supply projects that rely on clean technology and have the
potential to satisfy regional demand, beyond the national boundaries.
3.2 Step 2: Select an “ideal” scenario as specific example for illustrating how integration of the
national energy markets into a regional market can facilitate engagement of the Clean
Development Mechanism (CDM).
In the second step of the proposed methodology, we will seek to select an “ideal” example for
illustrating how integration of the national energy markets into a regional market can facilitate
engagement of the CDM. For this purpose, we will
(i) Identify different possible scenarios of regional power development integration as
candidates for engagement of the CDM, based on the review in Step 1;
(ii) Develop an objective screening criterion for comparing and ranking of the different
scenarios; and
(iii) Apply the screening criterion to select a relatively “ideal” scenario for illustrating how
integration of energy markets can facilitate engagement of the CDM
Power Market Integration: Contribution to Climate Mitigation ENTRO 16/90
3.3 Step 3: Estimate the potential reduction in carbon emission due to the adoption of a clean
development option at the regional scale.
In Step 3 we will estimate the carbon emissions assuming the clean power development choice
made possible through regional integration, and the default choice for power development
option. The difference between the two estimates will define the potential carbon emission
reduction.
3.4 Step 4: Provide a road map for engagement of the CDM process , economic analysis, and
recommendations
The estimates of the reduction in carbon emissions from adopting clean development option will
be used to recommend a specific road map for engaging the CDM. Economic analysis will be
carried out to estimate the financial costs and potential returns for the specific scenario of
regional power development. Although we will put some efforts into estimation of the financial
and non-financial benefits of the proposed scenario, our main efforts will focus on estimation of
the financial returns from the CERs given current market conditions. We will conduct a
preliminary evaluation on financing opportunities to fund any project with the aim of reducing
carbon emissions. We will identify promising opportunities (in both mitigation and adaptation
funding mechanisms) and outline a roadmap for the CDM engagement process.
4.0 APPLICATION OF METHODOLOGY: Estimation of Power Market
Integration Activity Contribution to Climate Mitigation
4.1 Step 1: Review the national power development plans and Power Trade Studies of the
EN countries.
Egypt and Ethiopia are similar in size, with about 1 and 1.1 million square kilometers,
respectively and a population of 84 and 91 million respectively. Sudan is somewhat larger with
about 1.9 million square kilometers (of these, 616 thousand km2 form the independent nation of
South Sudan) and holds less than half the population of the other two nations. Table 2 provides a
summary of basic information about population, economies and the electric sector in Egypt,
Ethiopia, and Sudan. Several important observations can be made. Ethiopia already has the
largest population in the region, and the fastest population growth; in addition, it has the fastest
Power Market Integration: Contribution to Climate Mitigation ENTRO 17/90
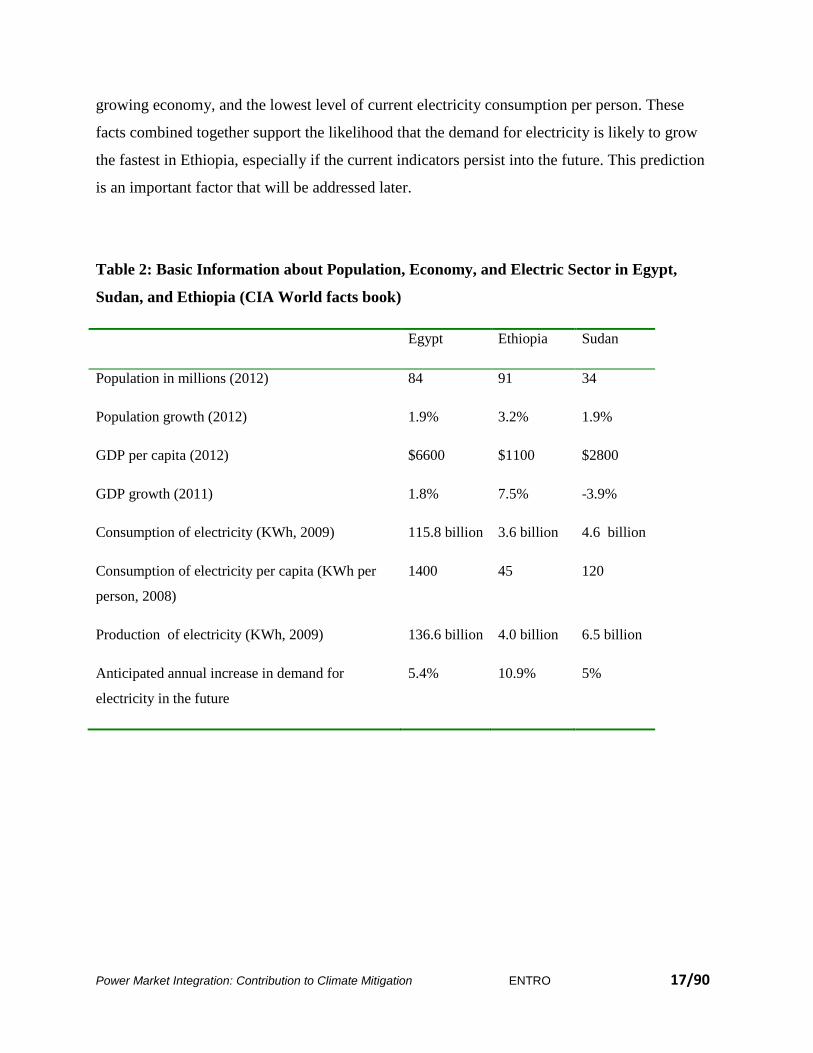
growing economy, and the lowest level of current electricity consumption per person. These
facts combined together support the likelihood that the demand for electricity is likely to grow
the fastest in Ethiopia, especially if the current indicators persist into the future. This prediction
is an important factor that will be addressed later.
Table 2: Basic Information about Population, Economy, and Electric Sector in Egypt,
Sudan, and Ethiopia (CIA World facts book)
Egypt Ethiopia Sudan
Population in millions (2012) 84 91 34
Population growth (2012) 1.9% 3.2% 1.9%
GDP per capita (2012) $6600 $1100 $2800
GDP growth (2011) 1.8% 7.5% -3.9%
Consumption of electricity (KWh, 2009) 115.8 billion 3.6 billion 4.6 billion
Consumption of electricity per capita (KWh per
person, 2008)
1400 45 120
Production of electricity (KWh, 2009) 136.6 billion 4.0 billion 6.5 billion
Anticipated annual increase in demand for
electricity in the future
5.4% 10.9% 5%
Power Market Integration: Contribution to Climate Mitigation Recommendations for ENTRO 18/90
Table 3: Power development Plans in Egypt, Ethiopia, and Sudan 2006-2030 (Source: Power Trade Study reports, updates by
countries, and minor modifications to account for separation in Sudan )
Year 2006 2007
P eak lo ad (MW) 18400 19600
To ta l capac ity (MW) 20600 22200
Added Capac ity (MW) 2000 150 60 1000 700 130 1350 10 160 750 1000 5 200 1750 40 200
Type CCGT Solar Hydro CCGT Steam Wind Steam Hydro Wind CCGT Steam Hydro Wind Steam Hydro Wind
P eak lo ad (MW)
To ta l capac ity (MW) 730
Added Capac ity (MW)
Type
P eak lo ad (MW) 1220 1920
To ta l capac ity (MW) 870 1200
Added Capac ity (MW) 330 290 30 380
Type comm Therm Hydro Therm
Year
P eak lo ad (MW)
To ta l capac ity (MW)
Added Capac ity (MW) 1000 1350 200 1000 1100 200 500 450 1000 500 1300 300 200 500 1750 200
Type CCGT Steam Wind CCGT Steam Wind CCGT Steam Nuclear CCGT Steam Solar Wind CCGT Steam Wind
P eak lo ad (MW)
To ta l capac ity (MW)
Added Capac ity (MW)
Type
P eak lo ad (MW)
To ta l capac ity (MW)
Added Capac ity (MW) 210 380 340 -80
Type Therm Therm Hydro retire
Egypt
Ethiopia
Sudan
comm comm
40
comm
comm comm comm
hydro Hydro Therm
400 2500 1170
300 300 440
7490 7790 8230
1600 4100 5270 5760 6300
6600 6850
5600 5900 6200
Sudan
2580 3400 4180 4480 4970
5100 5350
Hydro WindHydro Hydro Hydro
Hydro Hydro Hydro
900 40
270 160
1480
1100 100 1210
640 410
5200 6680 6680 6680
800 1900 2000 2940 4150
4790
1420
1580 1770 1970 2130 2300
Ethiopia
820 970 1120 1270
34400 36700 38850 41150 43600
24500 26400 27900 29860 31850
28120 29800 31560 33250 35000
Egypt
20900 22260 23600 25060 26550
2014 2015 2016 2017
2008 2009 2010 2011 2012
2013
Power Market Integration: Contribution to Climate Mitigation Recommendations for ENTRO 19/90
Year
P eak lo ad (MW)
To ta l capac ity (MW)
Added Capac ity (MW) 500 1750 300 200 1000 1300 200 500 650 1000 200 500 1950 200 500 1000 1000 500 2200
Type CCGT Steam Solar Wind CCGT Steam wind CCGT Steam Nuclear wind CCGT Steam wind CCGT SteamNuclea
rCCGT Steam
P eak lo ad (MW)
To ta l capac ity (MW)
Added Capac ity (MW)
Type
P eak lo ad (MW)
To ta l capac ity (MW)
Added Capac ity (MW) 450
Type Therm
Year 2025
P eak lo ad (MW) 51823
To ta l capac ity (MW) 64200
Added Capac ity (MW) 500 900 1000 2650 1750 1000 1750 1000 1750 1000 1750 1000 1750 1000
Type CCGT Steam Nuclear Steam Steam Nuclear Steam Nuclear Steam Nuclear Steam Nuclear Steam Nuclear
P eak lo ad (MW) 4320
To ta l capac ity (MW) 8570
Added Capac ity (MW) 400
Type Hydro
P eak lo ad (MW) 8950
To ta l capac ity (MW) 11900
Added Capac ity (MW) 450
Type Therm
2023
900
Therm
6400
12240
440
Hydro
11100
13900
5910
11800
220
Hydro
10650
13900
350
Therm
5460
11580
1350
Hydro
10250
13000
400
Therm
5050
10220
750
Hydro
9750
12600
59300
72450
62000
75200
64900
77950
comm
7900
11100
8250
11350
250
Therm
Therm
12250
350
Hydro
9350
9470
900
66950
4670
54200
2027 2028 2029
Egypt
Ethiopia
Sudan
2026
Egypt
Ethiopia
Sudan
Therm
2020 2021
2030
2022
Therm
100
2910
6680
380
11450
7200
10500
42960
53850
8610 9340
40960
51200
45050
56450
8650
47250
59150
3150
6680
6600 6700
3410
7380
Hydro
700
hydro
490
8170
3690
7680
300
hydro
6680 6680
3990
7600
11100
600
Therm
2490 2690
48850
61550
280
Hydro
56700
69700
46350
38880
49550
36900
2024
950
Therm
200
2018 2019
Power Market Integration: Contribution to Climate Mitigation Recommendations for ENTRO 20/90
Power Development Plans
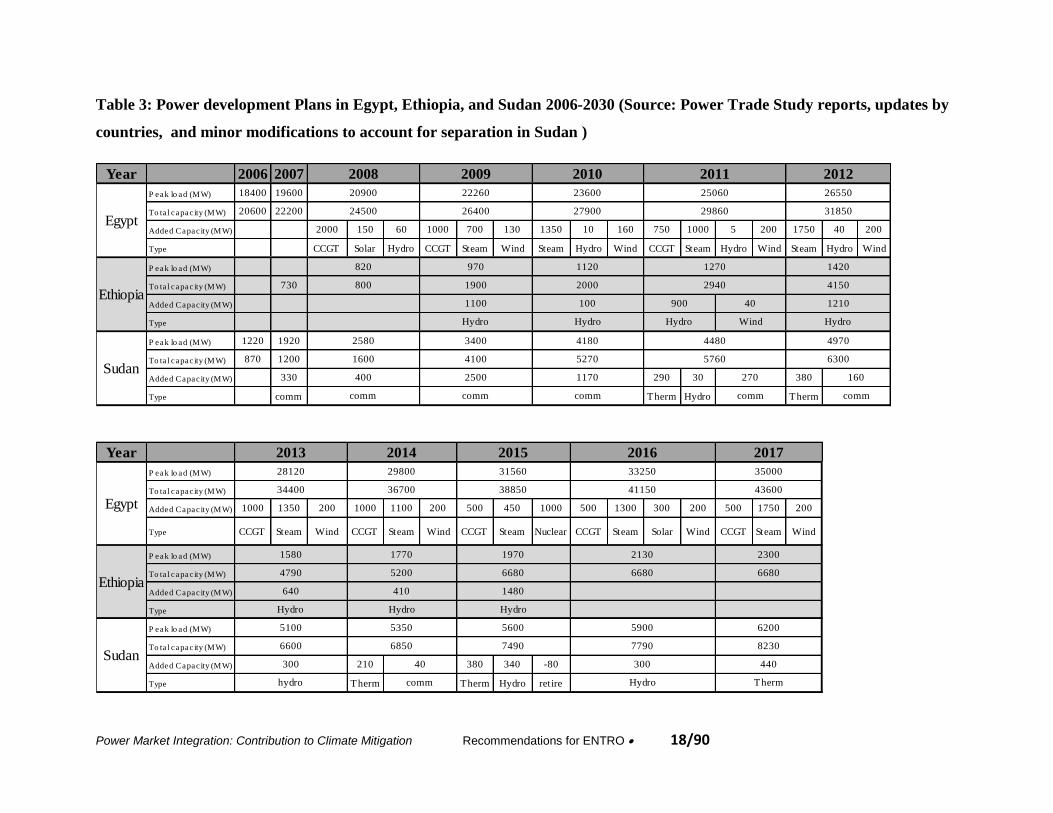
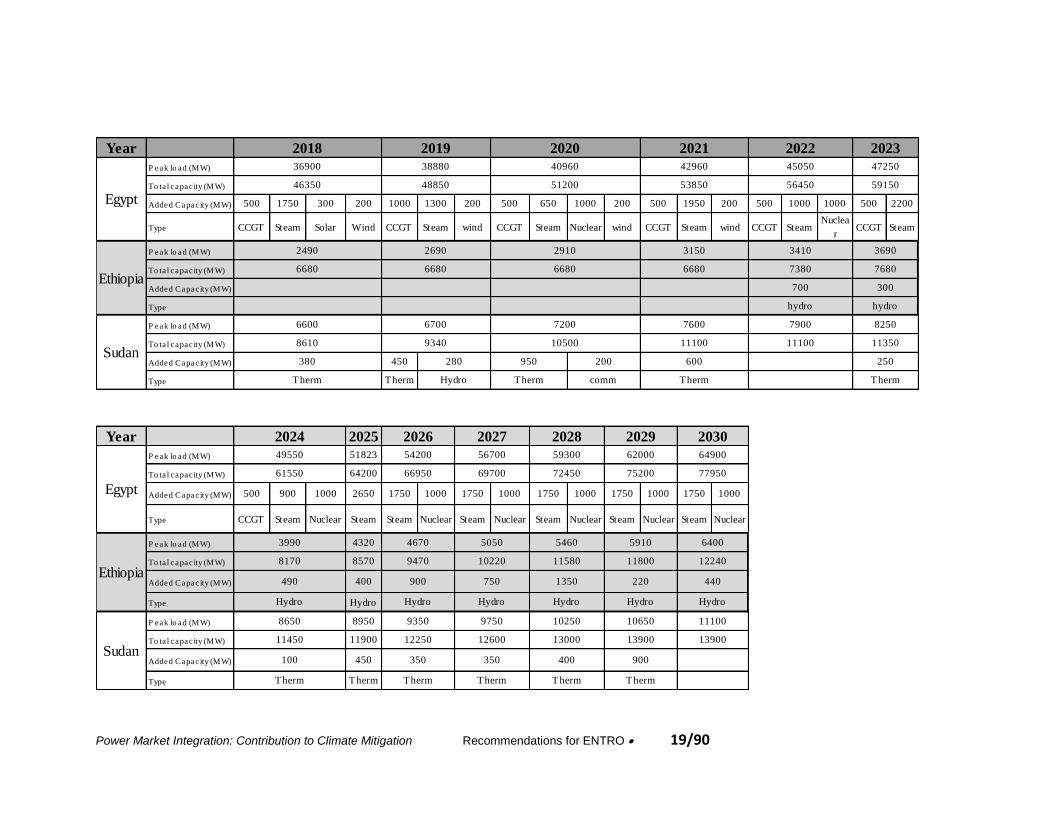
Table 3 summarizes the basic features of the power development plans for Egypt,
Ethiopia, and Sudan. These plans are summarized based on the information in the Power Trade
Study and minor modifications by the consultant to account for the independence of South
Sudan. The observations and recommendations in this report are not sensitive to these
modifications.
Several observations can be made from Table 3:
(i) There are great differences in the current rates of electricity consumption in the region
form 45 KWh per person in Ethiopia to 120 KWh per person in Sudan and 1,400 KWh
per person in Egypt;
(ii) The aggregate demand for electricity in the region is likely to increase by a factor of
about 2.5 (from a power load of about 33,000 MW to 82,000MW). This additional
demand will have to be satisfied by adding new capacity from combination of thermal
power generation options, hydropower, in addition to other renewable sources;
(iii) Egypt which already exploited most of its hydropower potential will follow in the future
a diversified expansion strategy that features (a) new renewable sources such as nuclear,
solar, and wind; (b) traditional sources such as steam turbines and thermal units; in
addition to (c) increasing reliance on abundant natural gas as a source of energy using
Combined Cycle Gas Turbines (CCGT) units. These CCGT units emit greenhouse gases
and produce electricity at a relatively high cost which is a function of natural gas price;
(iv) Ethiopia, which enjoys the largest untapped potential of hydropower in the region (total
potential estimated at 30,000 MW), will follow in the future an ambitious strategy of
accelerated growth in developing this hydropower potential, for domestic consumption as
well as export to the region. Hydropower is by far the largest source of electricity in
Ethiopia, now and into the future;
(v) Sudan’s situation lies in the middle, both geographically as well as in the level of
exploitation of its hydropower potential. By roughly 2020, Sudan is anticipated to
develop most of its hydropower potential. Additional capacity after that date will rely on
Power Market Integration: Contribution to Climate Mitigation Recommendations for ENTRO 21/90
thermal generation units, which produce electricity at relatively the highest cost in the
region of about (0.13$ per KWh in 2006); and
(vi) Ethiopia is the country with the largest excess capacity relative to domestic demand
(defined here as (capacity –peak load)/peak load. Without exports, the relative excess
capacity in 2030 is anticipated to be about 90%. This fact makes Ethiopia the most likely
candidate to export electricity in the region.
Based on a thorough the analysis of the power development plans for the 3 countries, the
Power Trade Study identified the potential for export of electricity from Ethiopia to Sudan and
Egypt as a potential trade opportunity that deserved further investigation. Hydropower projects
in Ethiopia are identified as power supply projects that rely on clean technology and have the
potential to satisfy regional demand, beyond the national boundaries.
In the Eastern Nile Power Trade Program Study, four interconnection plans (including
both AC and DC options) were presented to connect the electrical networks in Ethiopia, Sudan,
and Egypt. Such physical interconnections should make it feasible to export electricity from
Ethiopia to Egypt. It was concluded that “to transmit a huge power over a long distance, such as
between Ethiopia and Egypt, DC solutions are the less expensive ones.” The Power Trade Study
estimates that transmission costs under the DC option would range from about 21 USD/MWh to
about 28 USD/MWh. The associated investment costs were estimated to be about USD 760
Million.
Financial Costs and Benefits from Interconnection
The basic idea behind the perceived opportunity for export of electricity from Ethiopia to
Sudan and Egypt can be explained by reviewing Figure 1.3.1 from Module 6: Volume 2 of the
Power Trade Study report.
Power Market Integration: Contribution to Climate Mitigation Recommendations for ENTRO 22/90
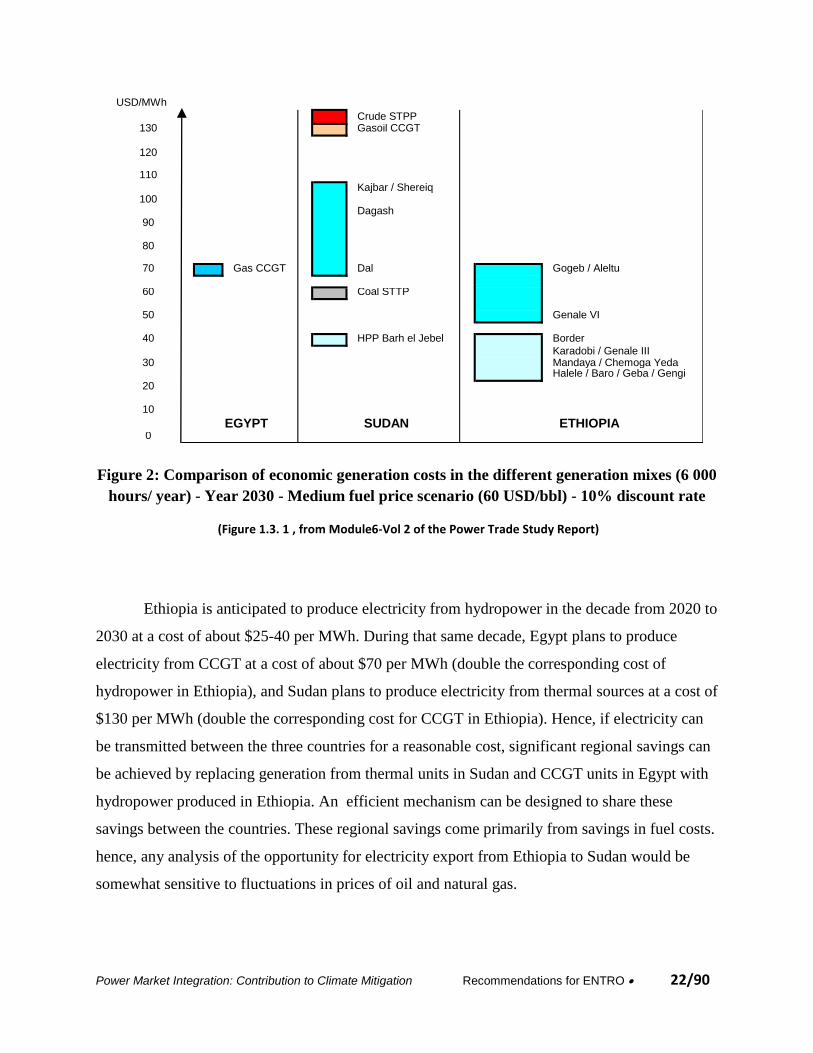
Figure 2: Comparison of economic generation costs in the different generation mixes (6 000
hours/ year) - Year 2030 - Medium fuel price scenario (60 USD/bbl) - 10% discount rate
(Figure 1.3. 1 , from Module6-Vol 2 of the Power Trade Study Report)
Ethiopia is anticipated to produce electricity from hydropower in the decade from 2020 to
2030 at a cost of about $25-40 per MWh. During that same decade, Egypt plans to produce
electricity from CCGT at a cost of about $70 per MWh (double the corresponding cost of
hydropower in Ethiopia), and Sudan plans to produce electricity from thermal sources at a cost of
$130 per MWh (double the corresponding cost for CCGT in Ethiopia). Hence, if electricity can
be transmitted between the three countries for a reasonable cost, significant regional savings can
be achieved by replacing generation from thermal units in Sudan and CCGT units in Egypt with
hydropower produced in Ethiopia. An efficient mechanism can be designed to share these
savings between the countries. These regional savings come primarily from savings in fuel costs.
hence, any analysis of the opportunity for electricity export from Ethiopia to Sudan would be
somewhat sensitive to fluctuations in prices of oil and natural gas.
USD/MWh
Crude STPP130 Gasoil CCGT
120
110
Kajbar / Shereiq100
Dagash90
80
70 Gas CCGT Dal Gogeb / Aleltu
60 Coal STTP
50 Genale VI
40 HPP Barh el Jebel Border
Karadobi / Genale III30 Mandaya / Chemoga Yeda
Halele / Baro / Geba / Gengi
20
10
EGYPT SUDAN ETHIOPIA0
Power Market Integration: Contribution to Climate Mitigation Recommendations for ENTRO 23/90
There have been important trends in the cost of fuel since 2007, the date of the Power
Trade Study. The price of natural gas declined significantly by about 40% from 7.1 USD per
MBTU, which is the average for 2007, to 4.0 USD per MBTU, which is the average for 2011.
However, during the same period, the price of oil moved in the opposite direction increasing by
about 30% from 72 USD per barrel, which is the average for 2007, to 95 USD per barrel, which
is the average price for 2011. These trends will have important implications to the analysis
presented in the following sections.
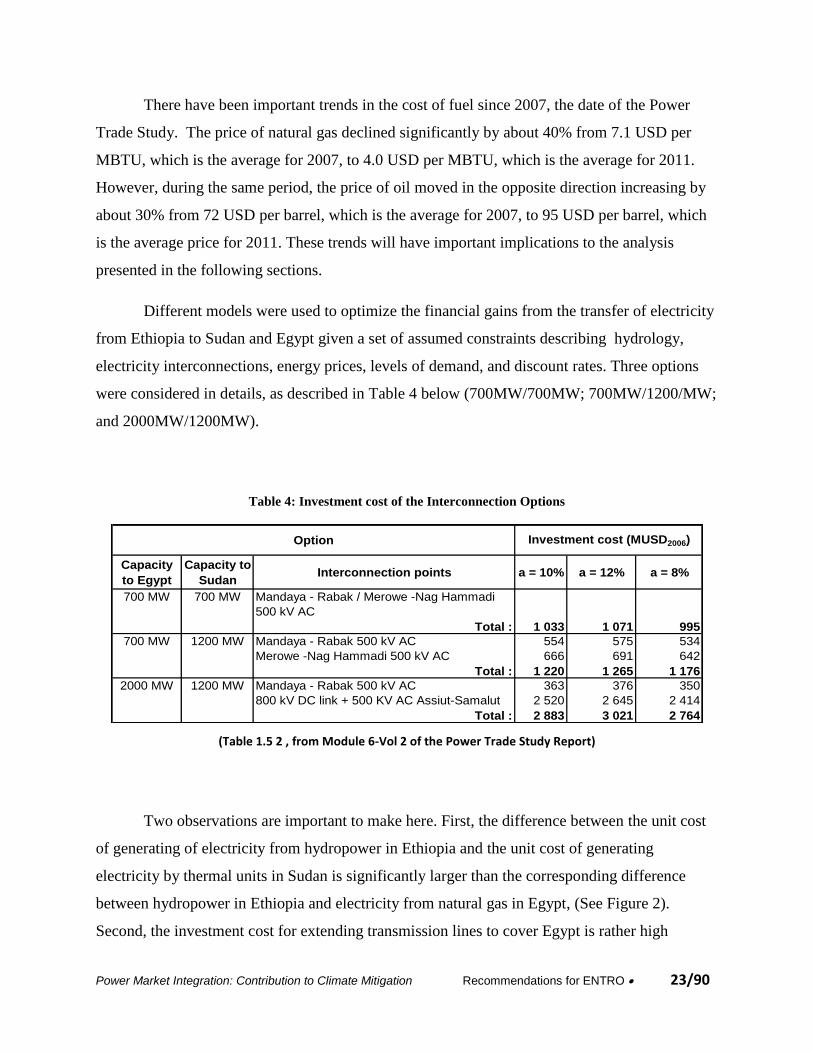
Different models were used to optimize the financial gains from the transfer of electricity
from Ethiopia to Sudan and Egypt given a set of assumed constraints describing hydrology,
electricity interconnections, energy prices, levels of demand, and discount rates. Three options
were considered in details, as described in Table 4 below (700MW/700MW; 700MW/1200/MW;
and 2000MW/1200MW).
Table 4: Investment cost of the Interconnection Options
Option Investment cost (MUSD2006)
Capacity
to Egypt
Capacity to
SudanInterconnection points a = 10% a = 12% a = 8%
700 MW 700 MW Mandaya - Rabak / Merowe -Nag Hammadi
500 kV AC
Total : 1 033 1 071 995
700 MW 1200 MW Mandaya - Rabak 500 kV AC 554 575 534
Merowe -Nag Hammadi 500 kV AC 666 691 642
Total : 1 220 1 265 1 176
2000 MW 1200 MW Mandaya - Rabak 500 kV AC 363 376 350
800 kV DC link + 500 KV AC Assiut-Samalut 2 520 2 645 2 414
Total : 2 883 3 021 2 764
(Table 1.5 2 , from Module 6-Vol 2 of the Power Trade Study Report)
Two observations are important to make here. First, the difference between the unit cost
of generating of electricity from hydropower in Ethiopia and the unit cost of generating
electricity by thermal units in Sudan is significantly larger than the corresponding difference
between hydropower in Ethiopia and electricity from natural gas in Egypt, (See Figure 2).
Second, the investment cost for extending transmission lines to cover Egypt is rather high
Power Market Integration: Contribution to Climate Mitigation Recommendations for ENTRO 24/90
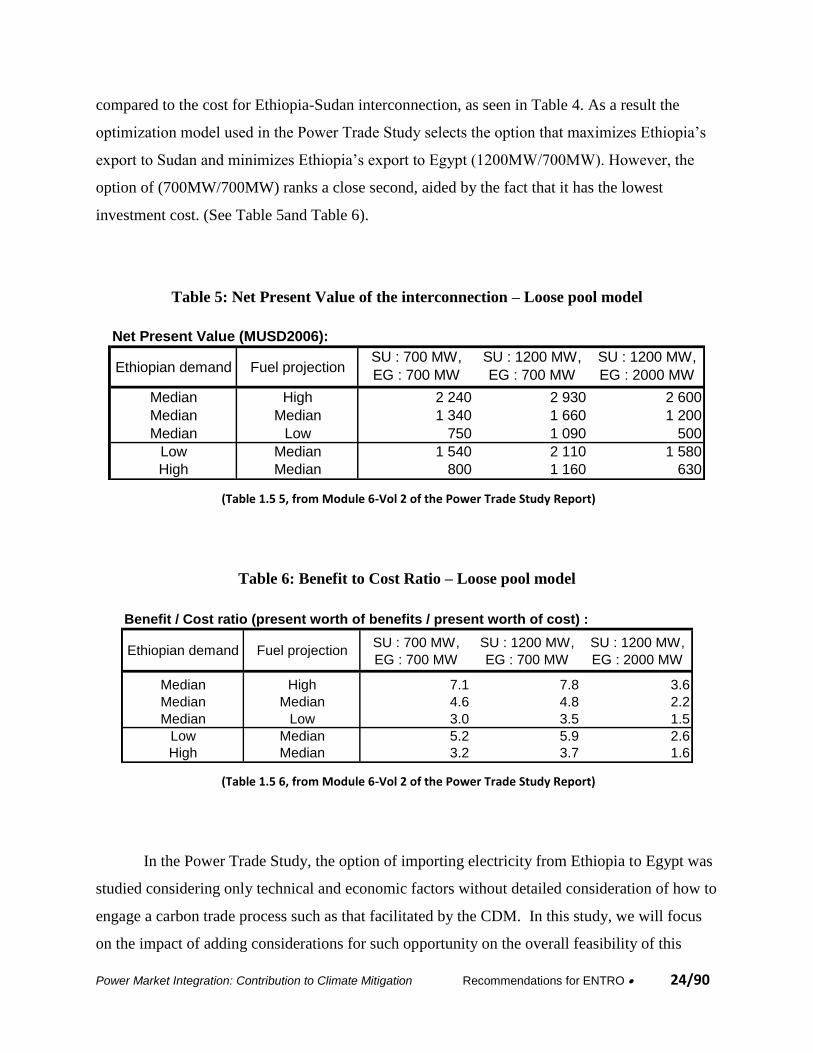
compared to the cost for Ethiopia-Sudan interconnection, as seen in Table 4. As a result the
optimization model used in the Power Trade Study selects the option that maximizes Ethiopia’s
export to Sudan and minimizes Ethiopia’s export to Egypt (1200MW/700MW). However, the
option of (700MW/700MW) ranks a close second, aided by the fact that it has the lowest
investment cost. (See Table 5and Table 6).
Table 5: Net Present Value of the interconnection – Loose pool model
Net Present Value (MUSD2006):
Ethiopian demand Fuel projectionSU : 700 MW,
EG : 700 MW
SU : 1200 MW,
EG : 700 MW
SU : 1200 MW,
EG : 2000 MW
Median High 2 240 2 930 2 600
Median Median 1 340 1 660 1 200
Median Low 750 1 090 500
Low Median 1 540 2 110 1 580
High Median 800 1 160 630
(Table 1.5 5, from Module 6-Vol 2 of the Power Trade Study Report)
Table 6: Benefit to Cost Ratio – Loose pool model
Benefit / Cost ratio (present worth of benefits / present worth of cost) :
Ethiopian demand Fuel projectionSU : 700 MW,
EG : 700 MW
SU : 1200 MW,
EG : 700 MW
SU : 1200 MW,
EG : 2000 MW
Median High 7.1 7.8 3.6
Median Median 4.6 4.8 2.2
Median Low 3.0 3.5 1.5
Low Median 5.2 5.9 2.6
High Median 3.2 3.7 1.6
(Table 1.5 6, from Module 6-Vol 2 of the Power Trade Study Report)
In the Power Trade Study, the option of importing electricity from Ethiopia to Egypt was
studied considering only technical and economic factors without detailed consideration of how to
engage a carbon trade process such as that facilitated by the CDM. In this study, we will focus
on the impact of adding considerations for such opportunity on the overall feasibility of this
Power Market Integration: Contribution to Climate Mitigation Recommendations for ENTRO 25/90
option, including feasibility of the physical infrastructure investment in a new interconnection
project linking Ethiopia, Sudan, and Egypt.
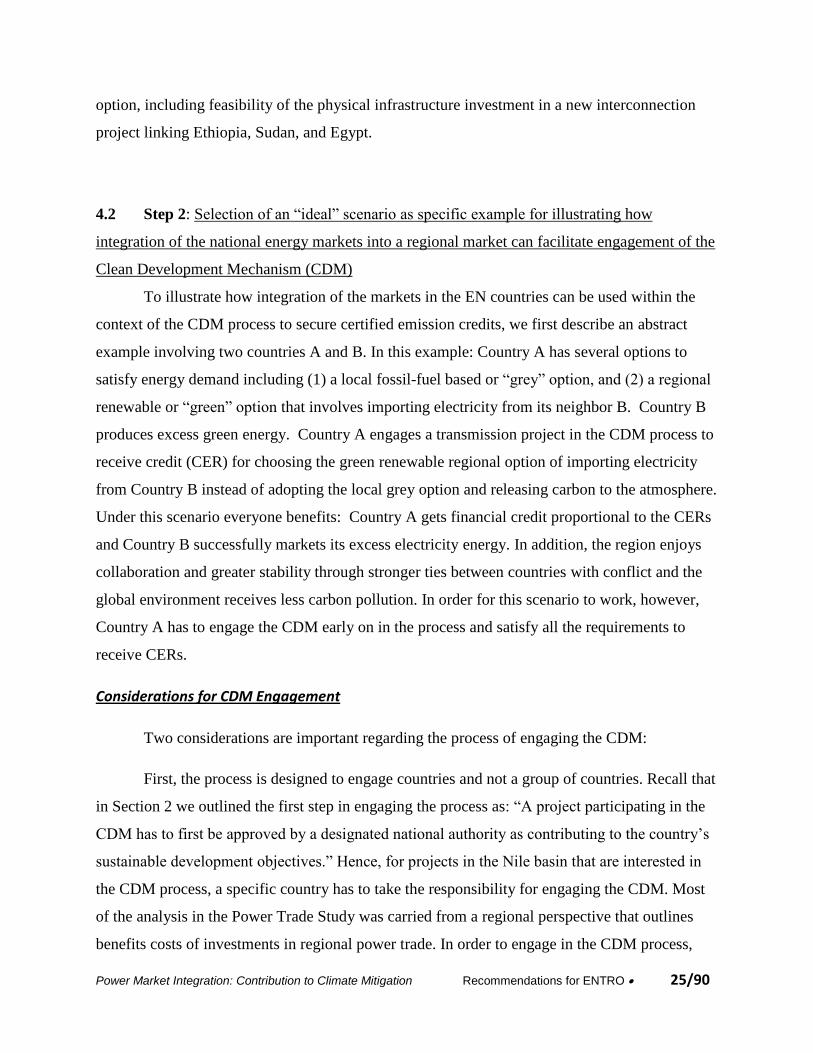
4.2 Step 2: Selection of an “ideal” scenario as specific example for illustrating how
integration of the national energy markets into a regional market can facilitate engagement of the
Clean Development Mechanism (CDM)
To illustrate how integration of the markets in the EN countries can be used within the
context of the CDM process to secure certified emission credits, we first describe an abstract
example involving two countries A and B. In this example: Country A has several options to
satisfy energy demand including (1) a local fossil-fuel based or “grey” option, and (2) a regional
renewable or “green” option that involves importing electricity from its neighbor B. Country B
produces excess green energy. Country A engages a transmission project in the CDM process to
receive credit (CER) for choosing the green renewable regional option of importing electricity
from Country B instead of adopting the local grey option and releasing carbon to the atmosphere.
Under this scenario everyone benefits: Country A gets financial credit proportional to the CERs
and Country B successfully markets its excess electricity energy. In addition, the region enjoys
collaboration and greater stability through stronger ties between countries with conflict and the
global environment receives less carbon pollution. In order for this scenario to work, however,
Country A has to engage the CDM early on in the process and satisfy all the requirements to
receive CERs.
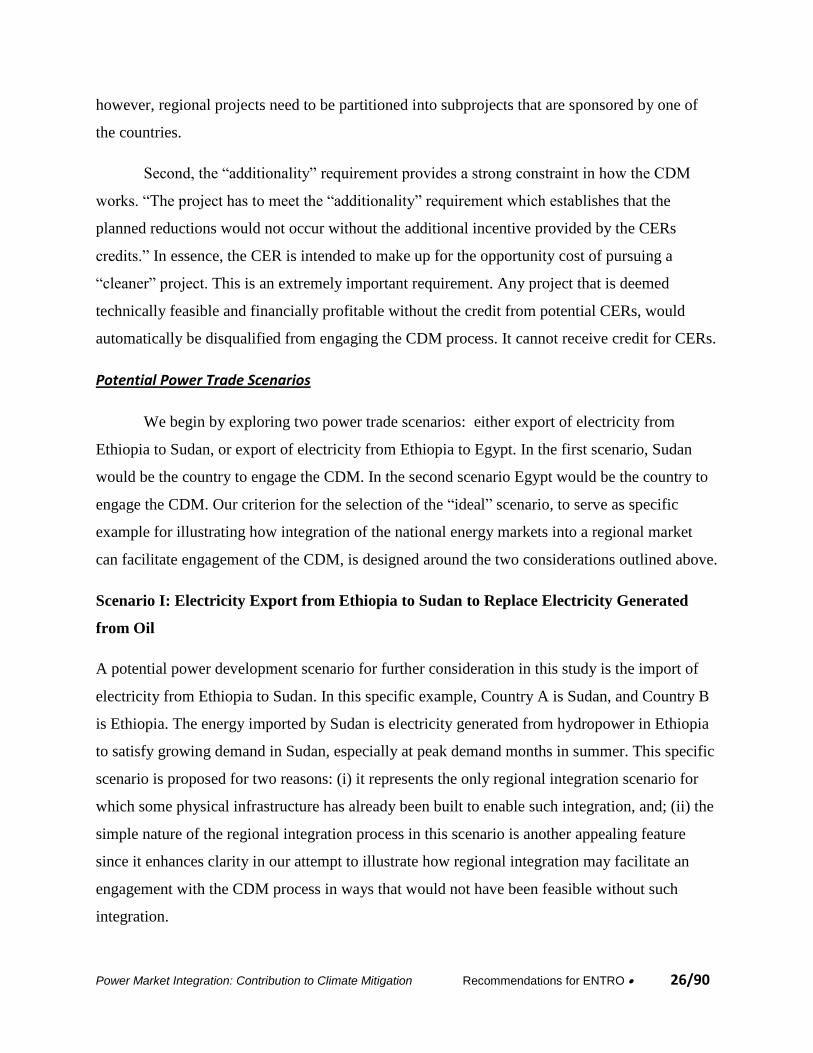
Considerations for CDM Engagement
Two considerations are important regarding the process of engaging the CDM:
First, the process is designed to engage countries and not a group of countries. Recall that
in Section 2 we outlined the first step in engaging the process as: “A project participating in the
CDM has to first be approved by a designated national authority as contributing to the country’s
sustainable development objectives.” Hence, for projects in the Nile basin that are interested in
the CDM process, a specific country has to take the responsibility for engaging the CDM. Most
of the analysis in the Power Trade Study was carried from a regional perspective that outlines
benefits costs of investments in regional power trade. In order to engage in the CDM process,
Power Market Integration: Contribution to Climate Mitigation Recommendations for ENTRO 26/90
however, regional projects need to be partitioned into subprojects that are sponsored by one of
the countries.
Second, the “additionality” requirement provides a strong constraint in how the CDM
works. “The project has to meet the “additionality” requirement which establishes that the
planned reductions would not occur without the additional incentive provided by the CERs
credits.” In essence, the CER is intended to make up for the opportunity cost of pursuing a
“cleaner” project. This is an extremely important requirement. Any project that is deemed
technically feasible and financially profitable without the credit from potential CERs, would
automatically be disqualified from engaging the CDM process. It cannot receive credit for CERs.
Potential Power Trade Scenarios
We begin by exploring two power trade scenarios: either export of electricity from
Ethiopia to Sudan, or export of electricity from Ethiopia to Egypt. In the first scenario, Sudan
would be the country to engage the CDM. In the second scenario Egypt would be the country to
engage the CDM. Our criterion for the selection of the “ideal” scenario, to serve as specific
example for illustrating how integration of the national energy markets into a regional market
can facilitate engagement of the CDM, is designed around the two considerations outlined above.
Scenario I: Electricity Export from Ethiopia to Sudan to Replace Electricity Generated
from Oil
A potential power development scenario for further consideration in this study is the import of
electricity from Ethiopia to Sudan. In this specific example, Country A is Sudan, and Country B
is Ethiopia. The energy imported by Sudan is electricity generated from hydropower in Ethiopia
to satisfy growing demand in Sudan, especially at peak demand months in summer. This specific
scenario is proposed for two reasons: (i) it represents the only regional integration scenario for
which some physical infrastructure has already been built to enable such integration, and; (ii) the
simple nature of the regional integration process in this scenario is another appealing feature
since it enhances clarity in our attempt to illustrate how regional integration may facilitate an
engagement with the CDM process in ways that would not have been feasible without such
integration.
Power Market Integration: Contribution to Climate Mitigation Recommendations for ENTRO 27/90
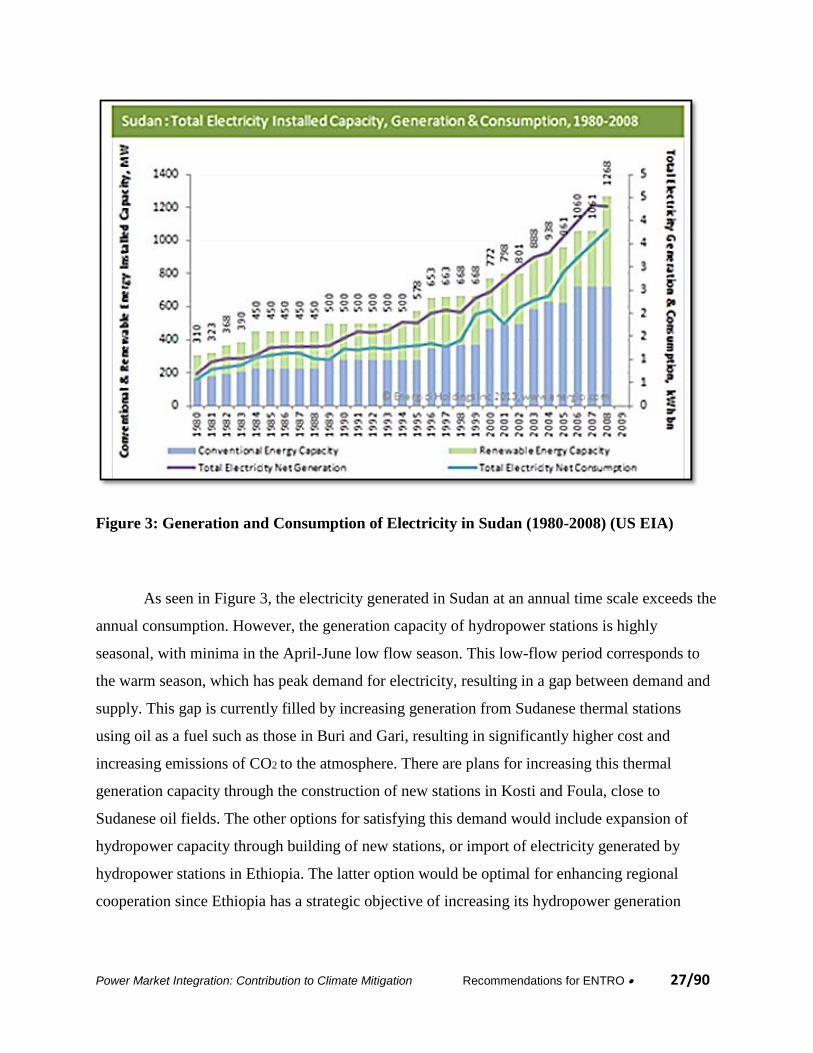
Figure 3: Generation and Consumption of Electricity in Sudan (1980-2008) (US EIA)
As seen in Figure 3, the electricity generated in Sudan at an annual time scale exceeds the
annual consumption. However, the generation capacity of hydropower stations is highly
seasonal, with minima in the April-June low flow season. This low-flow period corresponds to
the warm season, which has peak demand for electricity, resulting in a gap between demand and
supply. This gap is currently filled by increasing generation from Sudanese thermal stations
using oil as a fuel such as those in Buri and Gari, resulting in significantly higher cost and
increasing emissions of CO2 to the atmosphere. There are plans for increasing this thermal
generation capacity through the construction of new stations in Kosti and Foula, close to
Sudanese oil fields. The other options for satisfying this demand would include expansion of
hydropower capacity through building of new stations, or import of electricity generated by
hydropower stations in Ethiopia. The latter option would be optimal for enhancing regional
cooperation since Ethiopia has a strategic objective of increasing its hydropower generation
Power Market Integration: Contribution to Climate Mitigation Recommendations for ENTRO 28/90
capacity by building a series of dams on its rivers, and export of generated electricity to its
neighbors.
The main challenge with the scenario of importing electricity from Ethiopia to Sudan to
replace electricity generated from oil is the highly profitable nature of such activity! As shown in
Figure 2 there is a large difference between the cost of generation of electricity from hydropower
in Ethiopia ($35 per MWh) and the cost of generation of electricity by thermal stations fueled by
oil in Sudan ($140 per MWh), a factor of four. Due to this large difference, the optimization
model used in the Power Trade Study picks investments that emphasize import of electricity
from Ethiopia to Sudan as the most feasible economically (700MW/700MW & 700MW/1200
MW). The high level of profitability justifies the investment in that activity, even without any
credit that can be gained due to any potential CERs. This fact makes it almost impossible to
satisfy the “additionality” requirement of the CDM, unless the price of oil declines dramatically
in the future.
The recent trends in the fuel costs resulted in increasing the cost of oil from $72 in 2007
when the Power Trade Study report was published, to more than $95 in 2011, the last year for
which we have complete yearly records. The implication of this trend is that investment in the
import of electricity from Ethiopia to Sudan to replace electricity generated from oil is even
more profitable now compared to 5 years ago.
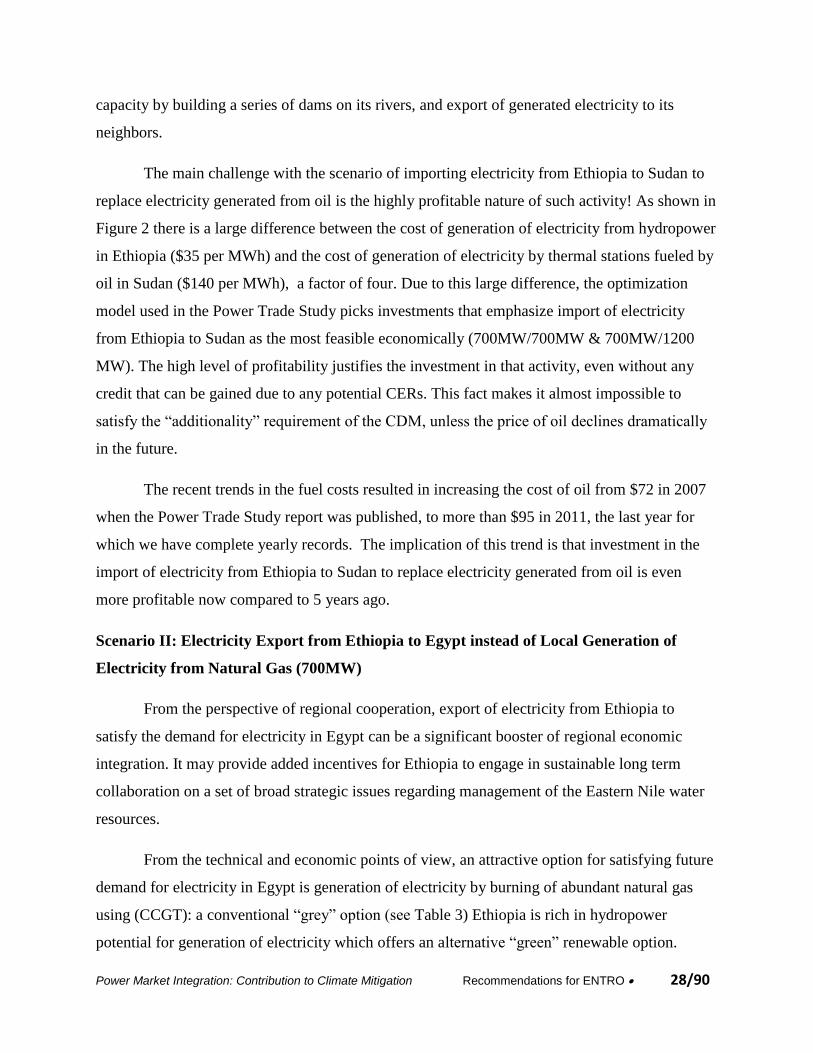
Scenario II: Electricity Export from Ethiopia to Egypt instead of Local Generation of
Electricity from Natural Gas (700MW)
From the perspective of regional cooperation, export of electricity from Ethiopia to
satisfy the demand for electricity in Egypt can be a significant booster of regional economic
integration. It may provide added incentives for Ethiopia to engage in sustainable long term
collaboration on a set of broad strategic issues regarding management of the Eastern Nile water
resources.
From the technical and economic points of view, an attractive option for satisfying future
demand for electricity in Egypt is generation of electricity by burning of abundant natural gas
using (CCGT): a conventional “grey” option (see Table 3) Ethiopia is rich in hydropower
potential for generation of electricity which offers an alternative “green” renewable option.
Power Market Integration: Contribution to Climate Mitigation Recommendations for ENTRO 29/90
However, in order for the import of electricity from Ethiopia to Egypt to make economic sense
the combined cost of electricity generation from hydropower plants (HPP) (typically about 35
USD/MWh) and the cost of transmission has to be smaller than the cost of electricity generated
using natural gas in Egypt. The latter depends on the future price of natural gas.
In order for import of electricity from Ethiopia to Egypt to make economic sense the
Power Trade Study estimates that the price of natural gas in the coming decade should be about 5
- 6 USD/MBTU. However, the recent trend in the price of natural gas has been negative. The
price of natural gas declined significantly by about 40% from 7.1 USD per MBTU, which is the
average for 2007, to 4.0 USD per MBTU, which is the average for 2011. The current price of
natural gas is about half of that target price (currently @ about 3 USD/MBTU). Under such
conditions, it is not clear that import of electricity from Ethiopia to Egypt instead of local
generation of electricity from natural gas would be an economically feasible activity. This
conclusion can change, however, if credit due to potential CERs is added to the equation. It is
indeed conditions such as these is what may make it feasible to satisfy the “additionality”
requirement, and hence successfully engage the CDM process.
Based on the above analysis we recommend that a separate project involving connecting
Egypt to an already connected network between Sudan and Ethiopia, for the purpose of
importing electricity from Ethiopia to Egypt, may represent the ideal candidate for engaging the
CDM process. The engagement with the CDM is on the basis of Egypt decision to import
electricity, instead of the local generation of electricity. Ethiopia cannot receive credit for the
generation of electricity from hydropower due to the profitable nature of hydropower generation
in Ethiopia, and the lack of a cheaper fossil fuel-based alternative.
In the Power Trade Study, three options for power trade from Ethiopia to (Sudan/Egypt)
were considered: (700MW/700MW), (1200MW, 700MW), (1200MW, 2000MW) as detailed in
Table 4. Based on pure economic analysis, these options were ranked as (1) (1200MW,
700MW), (2) (700MW, 700 MW) as close second, and (3) (1200MW, 2000MW), as a distant
third. We recommend that the (700MW/700MW) option for transmission be considered. In
making this recommendation, we offer four reasons:
Power Market Integration: Contribution to Climate Mitigation Recommendations for ENTRO 30/90
(i) The (700MW/700MW) and the (1200MW,700MW) are close in terms of their Net
Present Value and Benefit /Cost ratios (see Table 5 and Table 6), with minor differences.
(ii) The (700MW/700MW) option needs the least amount of financial investment, which
should make it easier to secure financing.
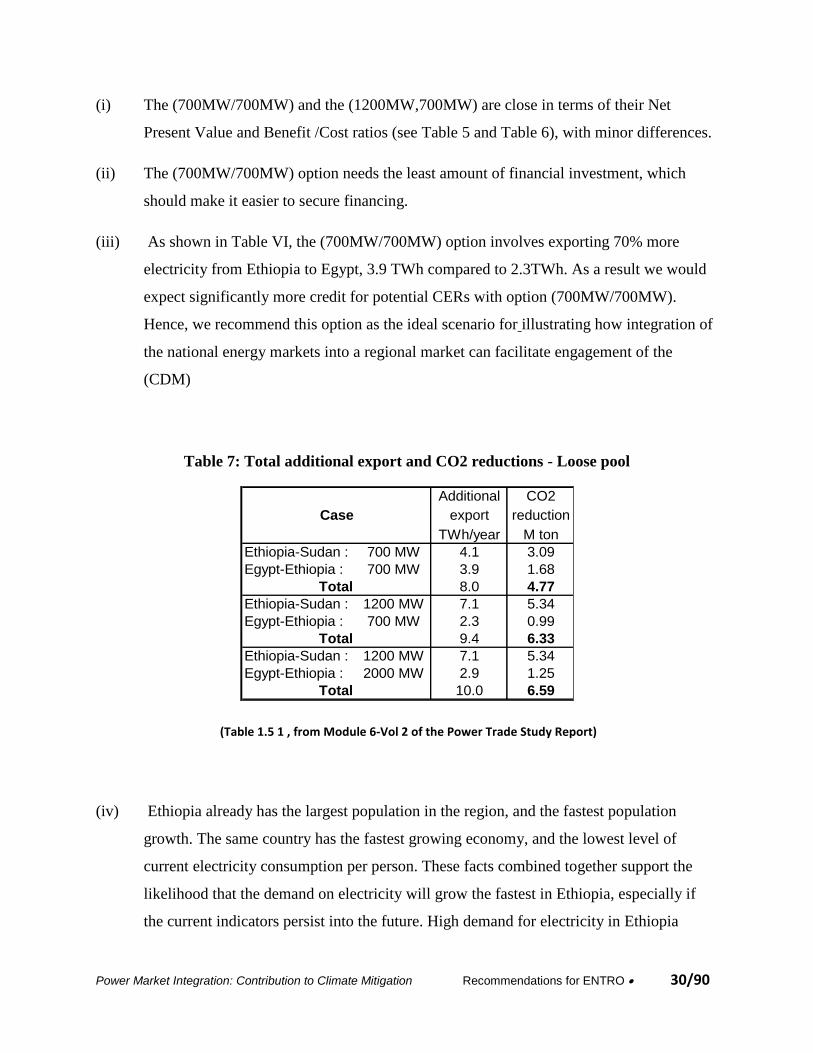
(iii) As shown in Table VI, the (700MW/700MW) option involves exporting 70% more
electricity from Ethiopia to Egypt, 3.9 TWh compared to 2.3TWh. As a result we would
expect significantly more credit for potential CERs with option (700MW/700MW).
Hence, we recommend this option as the ideal scenario for illustrating how integration of
the national energy markets into a regional market can facilitate engagement of the
(CDM)
Table 7: Total additional export and CO2 reductions - Loose pool
Additional CO2 8% discount rate 10% discount rate 12% discount rate
Case export reduction 5 USD/tCO2 10 USD/tCO2 5 USD/tCO2 10 USD/tCO2 5 USD/tCO2 10 USD/tCO2
TWh/year M ton MUSD MUSD MUSD MUSD MUSD MUSD
Ethiopia-Sudan : 700 MW 4.1 3.09 83 166 54 108 37 74
Egypt-Ethiopia : 700 MW 3.9 1.68 45 90 29 59 20 40
Total 8.0 4.77 128 256 84 167 57 114
Ethiopia-Sudan : 1200 MW 7.1 5.34 143 286 94 187 64 128
Egypt-Ethiopia : 700 MW 2.3 0.99 27 53 17 35 12 24
Total 9.4 6.33 170 339 111 222 76 152
Ethiopia-Sudan : 1200 MW 7.1 5.34 143 286 94 187 64 128
Egypt-Ethiopia : 2000 MW 2.9 1.25 33 67 22 44 15 30
Total 10.0 6.59 177 353 115 231 79 158
(Table 1.5 1 , from Module 6-Vol 2 of the Power Trade Study Report)
(iv) Ethiopia already has the largest population in the region, and the fastest population
growth. The same country has the fastest growing economy, and the lowest level of
current electricity consumption per person. These facts combined together support the
likelihood that the demand on electricity will grow the fastest in Ethiopia, especially if
the current indicators persist into the future. High demand for electricity in Ethiopia
Power Market Integration: Contribution to Climate Mitigation Recommendations for ENTRO 31/90
would limit the feasibility of the two other options which both involve massive exports of
electricity.
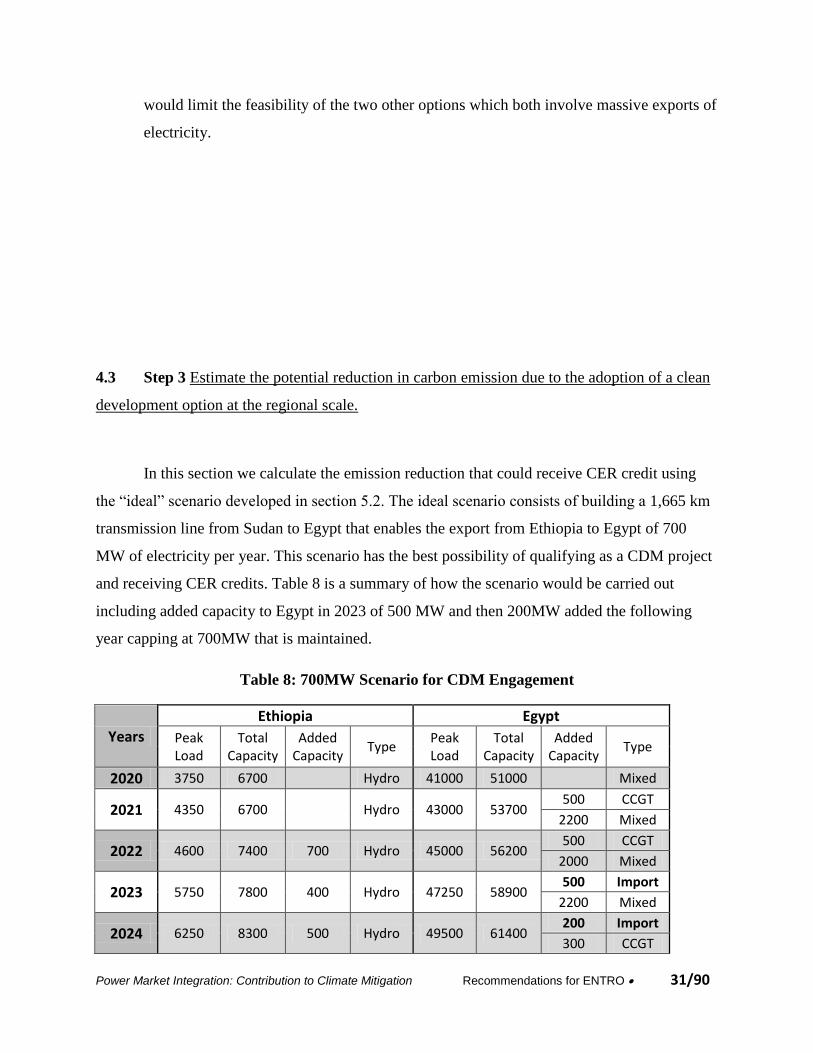
4.3 Step 3 Estimate the potential reduction in carbon emission due to the adoption of a clean
development option at the regional scale.
In this section we calculate the emission reduction that could receive CER credit using
the “ideal” scenario developed in section 5.2. The ideal scenario consists of building a 1,665 km
transmission line from Sudan to Egypt that enables the export from Ethiopia to Egypt of 700
MW of electricity per year. This scenario has the best possibility of qualifying as a CDM project
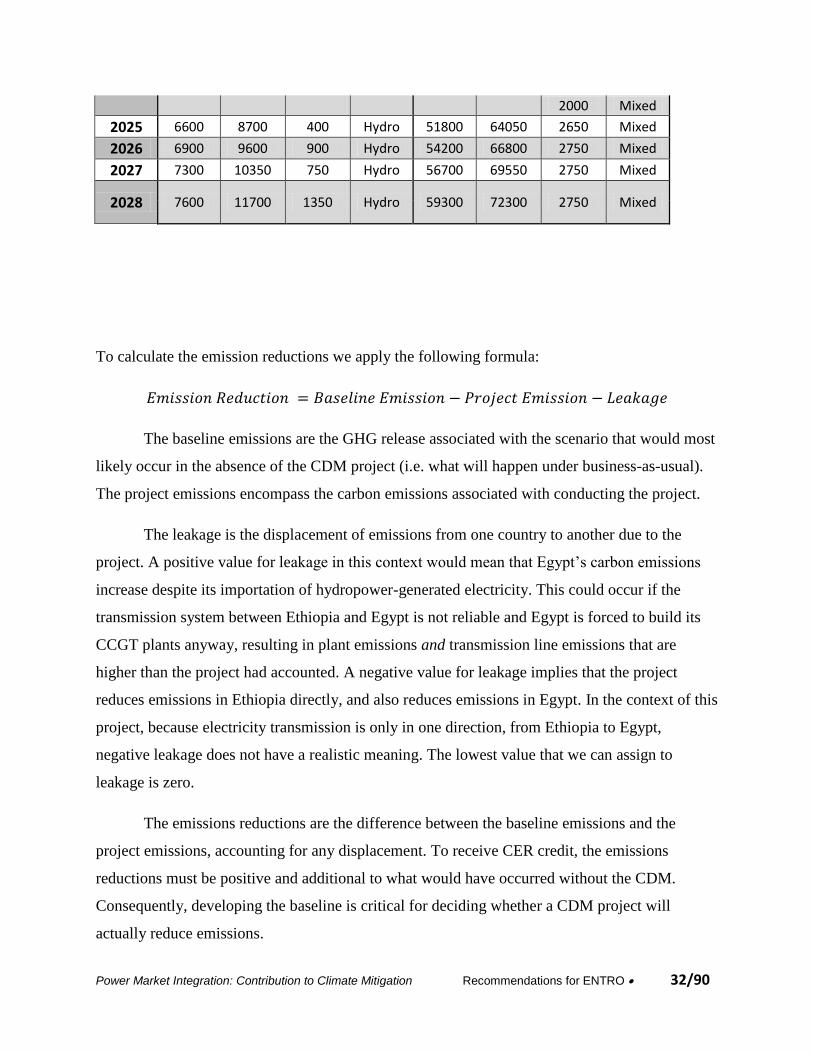
and receiving CER credits. Table 8 is a summary of how the scenario would be carried out
including added capacity to Egypt in 2023 of 500 MW and then 200MW added the following
year capping at 700MW that is maintained.
Table 8: 700MW Scenario for CDM Engagement
Years
Ethiopia Egypt
Peak Load
Total Capacity
Added Capacity
Type Peak Load
Total Capacity
Added Capacity
Type
2020 3750 6700
Hydro 41000 51000
Mixed
2021 4350 6700
Hydro 43000 53700 500 CCGT
2200 Mixed
2022 4600 7400 700 Hydro 45000 56200 500 CCGT
2000 Mixed
2023 5750 7800 400 Hydro 47250 58900 500 Import
2200 Mixed
2024 6250 8300 500 Hydro 49500 61400 200 Import
300 CCGT
Power Market Integration: Contribution to Climate Mitigation Recommendations for ENTRO 32/90
2000 Mixed
2025 6600 8700 400 Hydro 51800 64050 2650 Mixed
2026 6900 9600 900 Hydro 54200 66800 2750 Mixed
2027 7300 10350 750 Hydro 56700 69550 2750 Mixed
2028 7600 11700 1350 Hydro 59300 72300 2750 Mixed
To calculate the emission reductions we apply the following formula:
The baseline emissions are the GHG release associated with the scenario that would most
likely occur in the absence of the CDM project (i.e. what will happen under business-as-usual).
The project emissions encompass the carbon emissions associated with conducting the project.
The leakage is the displacement of emissions from one country to another due to the
project. A positive value for leakage in this context would mean that Egypt’s carbon emissions
increase despite its importation of hydropower-generated electricity. This could occur if the
transmission system between Ethiopia and Egypt is not reliable and Egypt is forced to build its
CCGT plants anyway, resulting in plant emissions and transmission line emissions that are
higher than the project had accounted. A negative value for leakage implies that the project
reduces emissions in Ethiopia directly, and also reduces emissions in Egypt. In the context of this
project, because electricity transmission is only in one direction, from Ethiopia to Egypt,
negative leakage does not have a realistic meaning. The lowest value that we can assign to
leakage is zero.
The emissions reductions are the difference between the baseline emissions and the
project emissions, accounting for any displacement. To receive CER credit, the emissions
reductions must be positive and additional to what would have occurred without the CDM.
Consequently, developing the baseline is critical for deciding whether a CDM project will
actually reduce emissions.
Power Market Integration: Contribution to Climate Mitigation Recommendations for ENTRO 33/90
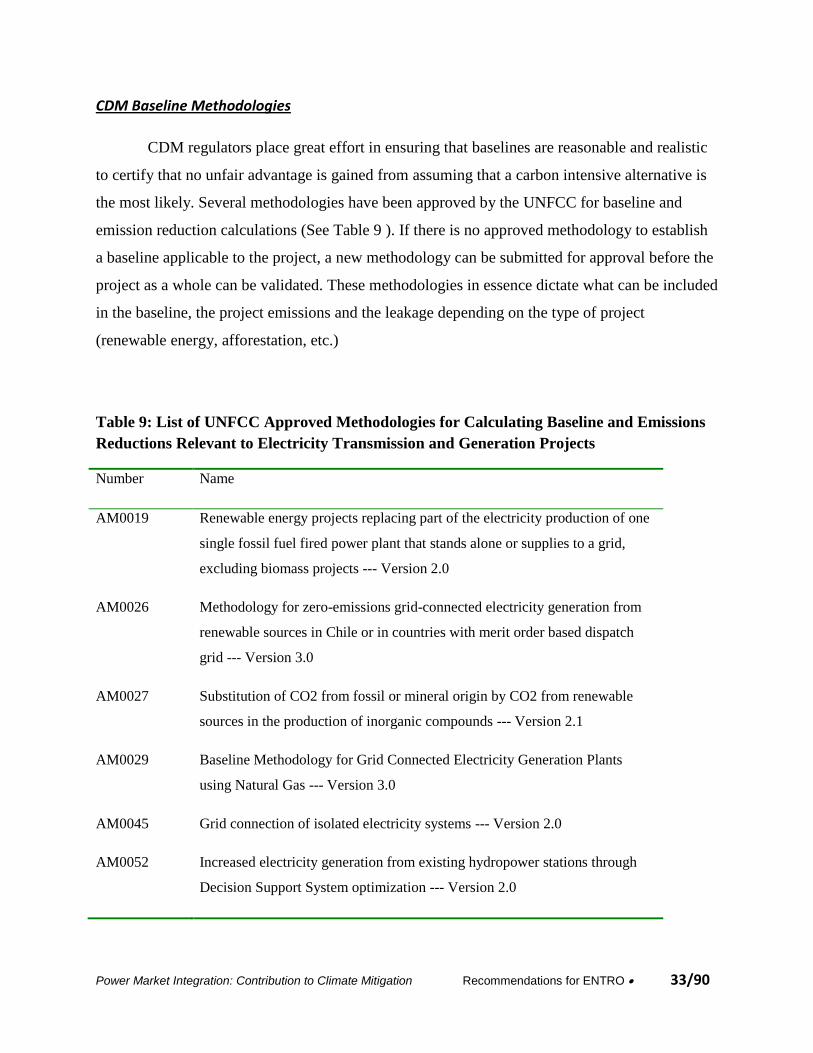
CDM Baseline Methodologies
CDM regulators place great effort in ensuring that baselines are reasonable and realistic
to certify that no unfair advantage is gained from assuming that a carbon intensive alternative is
the most likely. Several methodologies have been approved by the UNFCC for baseline and
emission reduction calculations (See Table 9 ). If there is no approved methodology to establish
a baseline applicable to the project, a new methodology can be submitted for approval before the
project as a whole can be validated. These methodologies in essence dictate what can be included
in the baseline, the project emissions and the leakage depending on the type of project
(renewable energy, afforestation, etc.)
Table 9: List of UNFCC Approved Methodologies for Calculating Baseline and Emissions
Reductions Relevant to Electricity Transmission and Generation Projects
Number Name
AM0019 Renewable energy projects replacing part of the electricity production of one
single fossil fuel fired power plant that stands alone or supplies to a grid,
excluding biomass projects --- Version 2.0
AM0026 Methodology for zero-emissions grid-connected electricity generation from
renewable sources in Chile or in countries with merit order based dispatch
grid --- Version 3.0
AM0027 Substitution of CO2 from fossil or mineral origin by CO2 from renewable
sources in the production of inorganic compounds --- Version 2.1
AM0029 Baseline Methodology for Grid Connected Electricity Generation Plants
using Natural Gas --- Version 3.0
AM0045 Grid connection of isolated electricity systems --- Version 2.0
AM0052 Increased electricity generation from existing hydropower stations through
Decision Support System optimization --- Version 2.0
Power Market Integration: Contribution to Climate Mitigation Recommendations for ENTRO 34/90
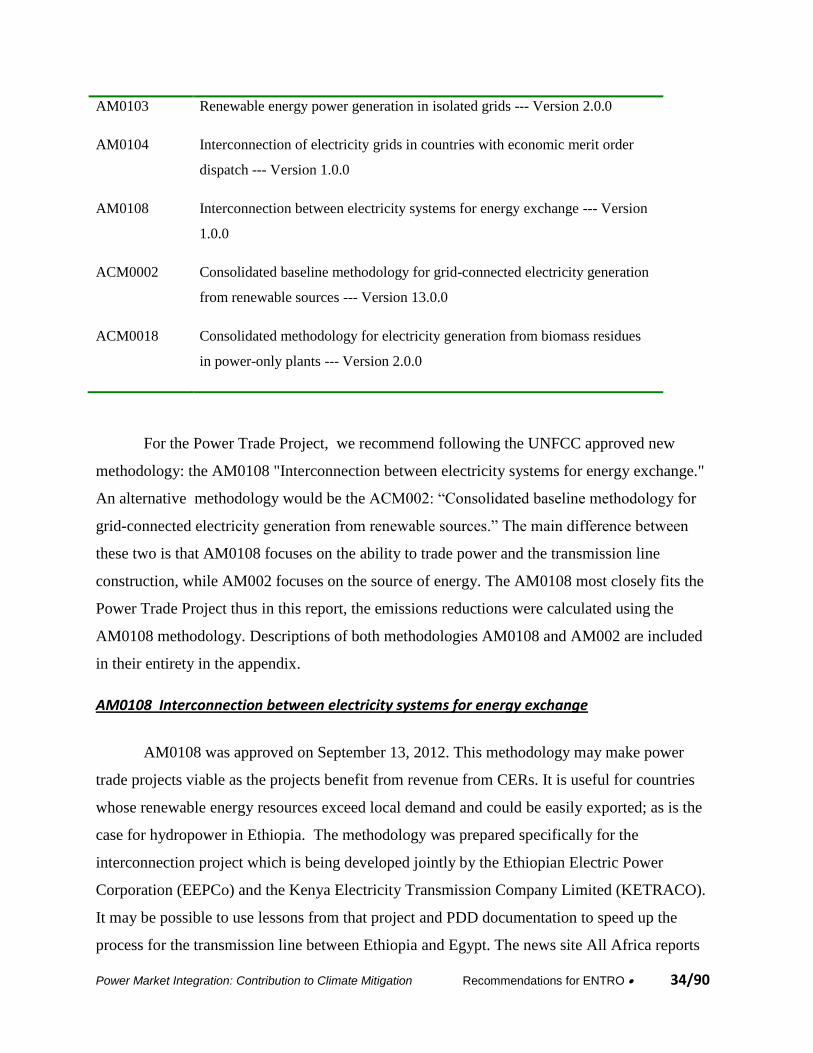
AM0103 Renewable energy power generation in isolated grids --- Version 2.0.0
AM0104 Interconnection of electricity grids in countries with economic merit order
dispatch --- Version 1.0.0
AM0108 Interconnection between electricity systems for energy exchange --- Version
1.0.0
ACM0002 Consolidated baseline methodology for grid-connected electricity generation
from renewable sources --- Version 13.0.0
ACM0018 Consolidated methodology for electricity generation from biomass residues
in power-only plants --- Version 2.0.0
For the Power Trade Project, we recommend following the UNFCC approved new
methodology: the AM0108 "Interconnection between electricity systems for energy exchange."
An alternative methodology would be the ACM002: “Consolidated baseline methodology for
grid-connected electricity generation from renewable sources.” The main difference between
these two is that AM0108 focuses on the ability to trade power and the transmission line
construction, while AM002 focuses on the source of energy. The AM0108 most closely fits the
Power Trade Project thus in this report, the emissions reductions were calculated using the
AM0108 methodology. Descriptions of both methodologies AM0108 and AM002 are included
in their entirety in the appendix.
AM0108 Interconnection between electricity systems for energy exchange
AM0108 was approved on September 13, 2012. This methodology may make power
trade projects viable as the projects benefit from revenue from CERs. It is useful for countries
whose renewable energy resources exceed local demand and could be easily exported; as is the
case for hydropower in Ethiopia. The methodology was prepared specifically for the
interconnection project which is being developed jointly by the Ethiopian Electric Power
Corporation (EEPCo) and the Kenya Electricity Transmission Company Limited (KETRACO).
It may be possible to use lessons from that project and PDD documentation to speed up the
process for the transmission line between Ethiopia and Egypt. The news site All Africa reports
Power Market Integration: Contribution to Climate Mitigation Recommendations for ENTRO 35/90
that the Ethiopia-Kenya project “will lead to an annual reduction of over 7 million tonnes of CO2
per year. This reduction is equivalent to the CO2 emissions from a coal-fired power station
generating about 4,700 GWh of electricity per year, and is also practically equal to Ethiopia's or
Côte d'Ivoire's current total annual CO2 emissions. Over the project's 10-year crediting period,
emission reductions (ER) will total approximately 70 million tonnes of CO2 and revenues from
the sale of these ERs will strengthen the project's viability.”
The AM108 methodology applies to project activities that involve the establishment of
new electrical interconnections between grids to achieve or increase electricity exchange
between two grids.
The methodology is applicable under the following conditions:
The interconnection is through the construction of new transmission lines;
The relation between annual electricity flow from the exporting (Ethiopian) to the
importing (Egyptian) electricity system and vice versa shall not fall below 80/20.
The exporting electricity system must have more than 15 per cent of reserve capacity.
Having reserve capacity ensures that the importing country can receive a reliable supply
of electricity and is not forced to build more conventional plants to meet the demand due
to an unreliable importing network.
Any other interconnections that the importing and the exporting electricity system have
with neighbouring grids prior to the implementation of the project activity (i.e. Sudan,
Kenya, Djibouti) should be identified and described in the CDM-PDD.
The geographic and system boundaries for the relevant country electricity systems can be
clearly identified and information on the characteristics and composition of the grids is
available;
The amount of electricity generated in the exporting electricity system by hydropower
plants with a power density of the reservoirs below or equal to 4 W/m2 and that start
commercial operation during the crediting period shall be excluded from the calculations
of the emission reductions. (According to original power development plans in Ethiopia,
Power Market Integration: Contribution to Climate Mitigation Recommendations for ENTRO 36/90
in 2023 and 2024 Ethiopia should commission Advance Beko Abo, and Mandaya
hydropower projects. While Mandaya reservoir power density is less than 4 W/m2, the
power density of the Beko Abo which will generate about 700MW, is greater than 4
W/m2. Hence in engaging the CDM the Beko Abo project should be emphasized)
The most plausible baseline scenario is that the new grid-connected generation capacity
using the similar fuel/technology mix as existing power units in the importing electricity
system that will provide the same amount of electricity to end users.
Some alternative baselines to consider would be whether the proposed project would
occur without being registered as a CDM, whether Egypt could generate electricity capacity from
a renewable energy source to meet its demand or whether isolated mini-grids could provide the
electricity. Egypt has abundance in gas and currently gas is cheap; there is not much renewable
ability to try to provide its own renewable source of energy; the same project without registering
is too expensive and mini projects would not enjoy the economies of scale. If there is only one
alternative scenario that is not prevented by any barrier, then this scenario alternative is the most
plausible baseline scenario. Thus, the most likely baseline, is that Egypt meets its energy demand
with conventional existing technology mix such as CCGT using the relatively inexpensive
natural gas as a fuel.
Emission Reduction
The approved methodologies make adjustments to fine-tune the emission reduction
calculation, however, a quick “back-of-the-envelope” calculation with simplifying assumptions
can provide a relative magnitude for the scenario in which Egypt imports 700 MW of selected.
Assuming hydropower has negligible carbon emissions
Assuming leakage is negligible
Applying the United States’ average emissions rate from natural gas-fired
generation of 1135 lbs/MWh (EPA) = 0.51 T CO2/MWh
Using the 700 MW of electricity being imported from Ethiopia to Egypt with a
load factor of 63% applied during one year (8760 hours)
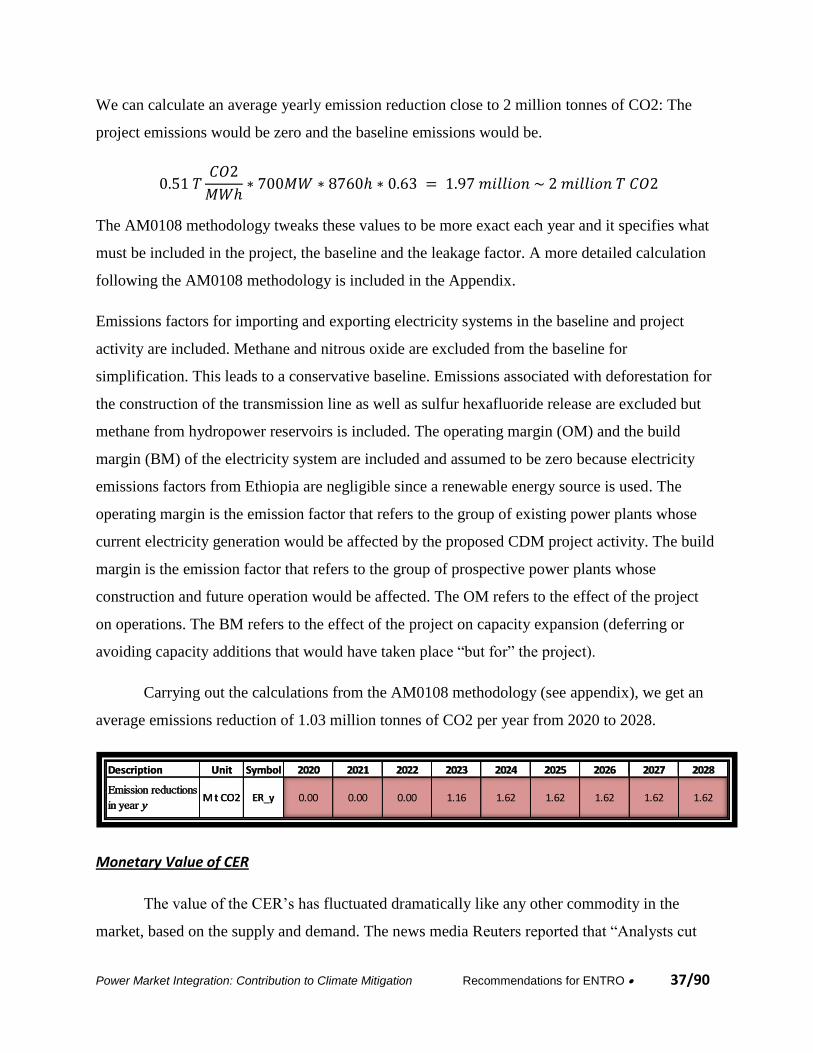
Power Market Integration: Contribution to Climate Mitigation Recommendations for ENTRO 37/90
We can calculate an average yearly emission reduction close to 2 million tonnes of CO2: The
project emissions would be zero and the baseline emissions would be.
The AM0108 methodology tweaks these values to be more exact each year and it specifies what
must be included in the project, the baseline and the leakage factor. A more detailed calculation
following the AM0108 methodology is included in the Appendix.
Emissions factors for importing and exporting electricity systems in the baseline and project
activity are included. Methane and nitrous oxide are excluded from the baseline for
simplification. This leads to a conservative baseline. Emissions associated with deforestation for
the construction of the transmission line as well as sulfur hexafluoride release are excluded but
methane from hydropower reservoirs is included. The operating margin (OM) and the build
margin (BM) of the electricity system are included and assumed to be zero because electricity
emissions factors from Ethiopia are negligible since a renewable energy source is used. The
operating margin is the emission factor that refers to the group of existing power plants whose
current electricity generation would be affected by the proposed CDM project activity. The build
margin is the emission factor that refers to the group of prospective power plants whose
construction and future operation would be affected. The OM refers to the effect of the project
on operations. The BM refers to the effect of the project on capacity expansion (deferring or
avoiding capacity additions that would have taken place “but for” the project).
Carrying out the calculations from the AM0108 methodology (see appendix), we get an
average emissions reduction of 1.03 million tonnes of CO2 per year from 2020 to 2028.
Monetary Value of CER
The value of the CER’s has fluctuated dramatically like any other commodity in the
market, based on the supply and demand. The news media Reuters reported that “Analysts cut
Description Unit Symbol 2020 2021 2022 2023 2024 2025 2026 2027 2028
Emission reductions
in year yM t CO2 ER_y 0.00 0.00 0.00 1.16 1.62 1.62 1.62 1.62 1.62
Power Market Integration: Contribution to Climate Mitigation Recommendations for ENTRO 38/90
their price forecasts for United Nations' carbon permits to 2020 further as over-supply continued
to put pressure on prices.” They report that last month prices fell to about 1.0 euros per tonne of
CO2. Some expect that the price will stay below 3 euros indefinitely. With an emission reduction
of about 1.6 tonnes of CO2 per year and a price of 1 euro per tonne, (1 euro is about US $1.3).
This would mean that the Project could receive financial credit of about 2 million USD per year.
4.4 Step 4 Provide a road map for engagement of the CDM process, economic analysis, and
recommendations
Institutional Roles
In applying for the CDM, several parties are involved. This section provides a brief description
on the institutions’ roles. The designated operational entity (DOE’s) validates the project design
document (PDD) and checks if the Marrakesh Accords’ requirements are met. The DOE then
recommends to the CDM Executive Board whether to certify or not the credits generated by the
project. If the Board does not disagree with this recommendation within 8 weeks, the project is
automatically registered and constitutes final approval. The project can begin monitoring and
claiming credits for the reduction of emissions. This means that the CDM Executive Board trusts
the recommendations of the validators in principle, but there is a “checks-and-balances” option
enabling the Executive Board to have the last word in case of disagreement. After the initial
phase, another DOE validates the reductions during the entire period in which the project claims
reductions.
CDM Registration Steps
The CDM registration process consists of the following steps (Figure 4) :
1. Preparing the Project Design Document (PDD)
a. Local stakeholder consultation
b. Environmental impact assessment (EIA)
c. Methodologies to estimate the baseline
d. Demonstrating additionality

Power Market Integration: Contribution to Climate Mitigation Recommendations for ENTRO 39/90
2. Getting approval from each country involved
3. Validation and 30 day public comment period
4. Registration by the CDM Executive Board
5. Monitoring emission reductions
6. Verification, certification and issuance of emission reduction credits
7. Renewal of the crediting period
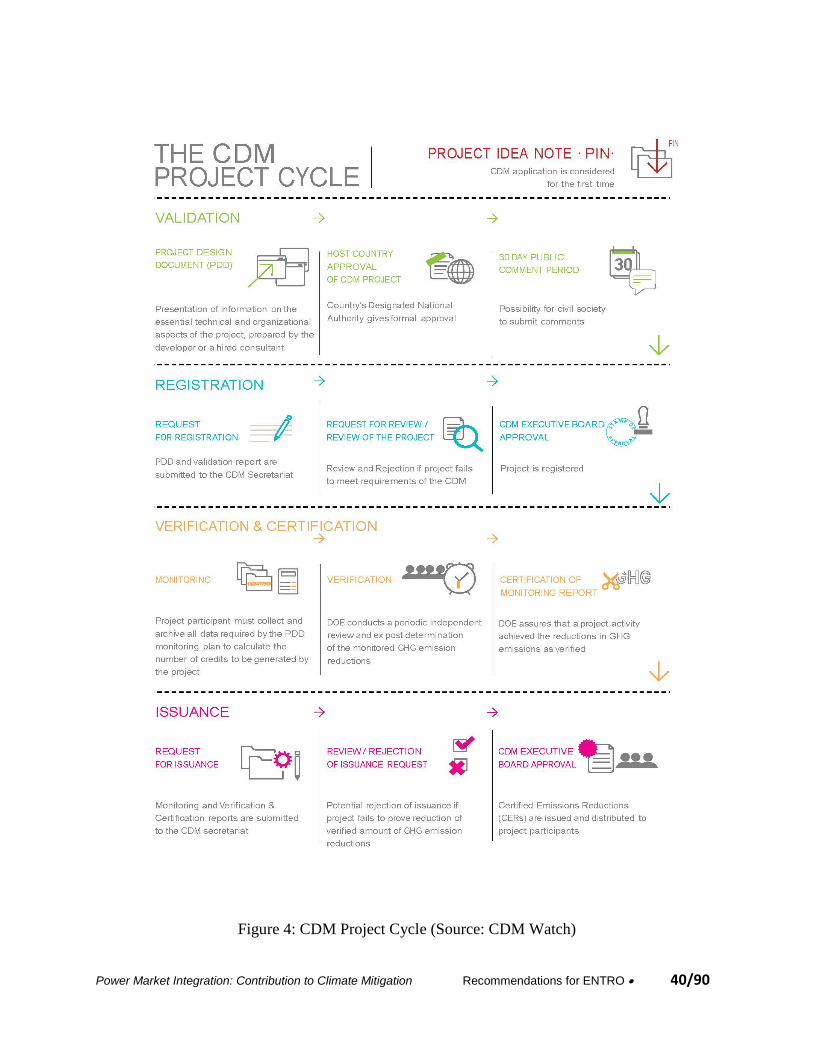
Power Market Integration: Contribution to Climate Mitigation Recommendations for ENTRO 40/90
Figure 4: CDM Project Cycle (Source: CDM Watch)
Power Market Integration: Contribution to Climate Mitigation Recommendations for ENTRO 41/90
The first step to engage in the CDM is to prepare a PDD. This report has attempted to provide
some of the necessary information for the DOE to prepare a PDD. Particularly the selection of a
feasible and justifiable baseline, the explanation of a valid approved methodology for the project
and an example of the calculation and magnitude for emission reductions.
What is needed in the PDD?
The PDD is one of 3 documents required to register along with a validation report from DOE and
letter of approval from DNA (designated national authority). It has the following components:
A general description of the project.
A baseline derived from an approved baseline methodology. ( If there is no approved
methodology to establish a baseline applicable to the project, a new methodology can be
submitted for approval before the project as a whole can be validated. The baseline the
scenario that would most likely occur in the absence of the CDM project (i.e. what will
happen under business-as-usual) Developing a baseline is critical for deciding whether a
CDM project is additional. When assessing the PDD it is worthwhile checking whether
all alternative scenarios have been considered.. The PDD should have considered all
realistic credible alternative scenarios, investment and barrier analysis to show the
option is only financially attractive with carbon credit and that the carbon credit
eliminates barriers/risk and have a common practice check.
• The estimated lifetime of the project and the crediting period
The project operator can chose between two different approaches to decide upon the
length of the crediting period: A maximum of 7 years which may be renewed at most 2
times. This would require an updated PDD. OR A maximum of 10 years with no option
of renewal.
• A demonstration of how the project generates emission reductions that are additional to what
would have occurred without the CDM.
• An analysis of the environmental impacts
Power Market Integration: Contribution to Climate Mitigation Recommendations for ENTRO 42/90
• A discussion of the stakeholder consultation process and how stakeholder comments were
taken into account
• A monitoring and verification plan
The PDD should have considered all realistic credible baseline alternative scenarios, investment
and barrier analysis to show the option is only financially attractive with carbon credit and that
the carbon credit eliminates barriers/risk. After submitting a PDD, the DOE will officially
engage in the CDM process shown in Figure 4.
5.0 SCENARIO III: EXPORT OF ELECTRICITY FROM ETHIOPIA TO SUDAN AND
EGYPT (1200MW/2000MW)
In the analysis presented in section 4, we made two assumptions:
(i) We compared different export options, based on the economic feasibility analysis in
the Power Trade Study only, without considerations for other comparison criterion.
(ii) The analysis of the different options assumed a base case of electricity generation in
Sudan from oil based fuels, which is a relatively expensive option. While this option
may be profitable in economic terms, it does not favor engagement with the CDM.
Any strategic analysis of different options for development in the EN region would favor
scenarios that enhance large-scale cooperation in the region such as the (1200MW/2000MW)
scenario of export of electricity from Ethiopia to (Sudan/Egypt). In fact the Eastern Nile Council
of Ministers (ENCOM) has decided to proceed with the option of 1200MW/2000MW
transmission line for export of electricity from Ethiopia to Sudan/Egypt. Although before the
recent separation into two states, Sudan was relatively rich in oil resources, separation left
Sudan with significantly less oil resources. Under these conditions, generation of electricity from
coal which is a relatively less expensive option (see Figure 2) deserves further consideration. In
this section, we analyze the carbon trade implications of the 1200MW/2000MW option of export
of electricity from Ethiopia to Sudan/Egypt, assuming base case scenario of local generation of
electricity from coal in Sudan, and from natural gas in Egypt.
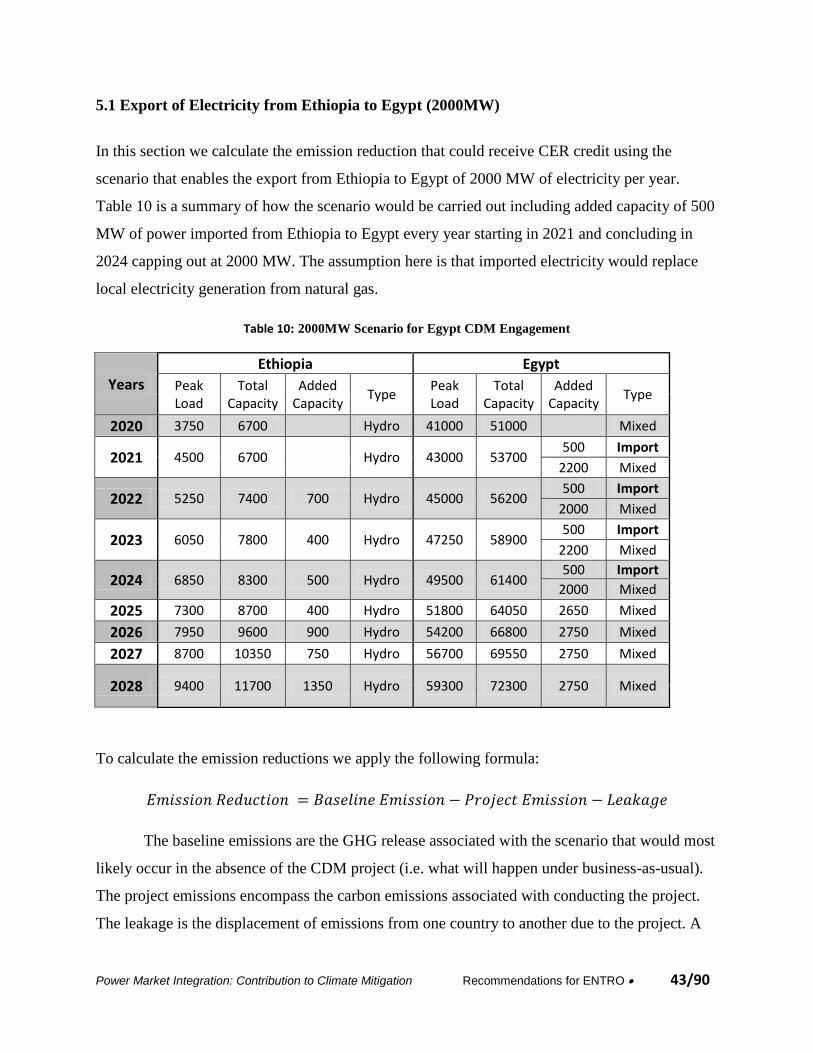
Power Market Integration: Contribution to Climate Mitigation Recommendations for ENTRO 43/90
5.1 Export of Electricity from Ethiopia to Egypt (2000MW)
In this section we calculate the emission reduction that could receive CER credit using the
scenario that enables the export from Ethiopia to Egypt of 2000 MW of electricity per year.
Table 10 is a summary of how the scenario would be carried out including added capacity of 500
MW of power imported from Ethiopia to Egypt every year starting in 2021 and concluding in
2024 capping out at 2000 MW. The assumption here is that imported electricity would replace
local electricity generation from natural gas.
Table 10: 2000MW Scenario for Egypt CDM Engagement
Years
Ethiopia Egypt
Peak Load
Total Capacity
Added Capacity
Type Peak Load
Total Capacity
Added Capacity
Type
2020 3750 6700
Hydro 41000 51000
Mixed
2021 4500 6700
Hydro 43000 53700 500 Import
2200 Mixed
2022 5250 7400 700 Hydro 45000 56200 500 Import
2000 Mixed
2023 6050 7800 400 Hydro 47250 58900 500 Import
2200 Mixed
2024 6850 8300 500 Hydro 49500 61400 500 Import
2000 Mixed
2025 7300 8700 400 Hydro 51800 64050 2650 Mixed
2026 7950 9600 900 Hydro 54200 66800 2750 Mixed
2027 8700 10350 750 Hydro 56700 69550 2750 Mixed
2028 9400 11700 1350 Hydro 59300 72300 2750 Mixed
To calculate the emission reductions we apply the following formula:
The baseline emissions are the GHG release associated with the scenario that would most
likely occur in the absence of the CDM project (i.e. what will happen under business-as-usual).
The project emissions encompass the carbon emissions associated with conducting the project.
The leakage is the displacement of emissions from one country to another due to the project. A
Power Market Integration: Contribution to Climate Mitigation Recommendations for ENTRO 44/90
positive value for leakage in this context would mean that Egypt’s carbon emissions increase
despite its importation of hydropower-generated electricity. This could occur if the transmission
system between Ethiopia and Egypt is not reliable and Egypt is forced to build its CCGT plants
anyway, resulting in plant emissions and transmission line emissions that are greater than the
project had accounted. A negative value for leakage implies that the project reduces emissions in
Ethiopia directly, and also reduces emissions in Egypt. In the context of this project, because
electricity transmission is only in one direction, from Ethiopia to Egypt, negative leakage does
not have a realistic meaning. The lowest value that we can assign to leakage is zero.
The AM108 methodology applies to project activities that involve the establishment of
new electrical interconnections between grids to achieve or increase electricity exchange
between two grids.
The methodology is applicable under the following conditions:
The interconnection is through the construction of new transmission lines;
The relation between annual electricity flow from the exporting (Ethiopia) to the
importing (Egypt) electricity system and vice versa shall not fall below 80/20.
The exporting electricity system must have more than 15 per cent of reserve capacity.
Having reserve capacity ensures that the importing country can receive a reliable supply
of electricity and is not forced to build more conventional plants to meet the demand due
to an unreliable importing network.
Any other interconnections that the importing and the exporting electricity system have
with neighbouring grids prior to the implementation of the project activity (i.e. Sudan,
Kenya, Djibouti) should be identified and described in the CDM-PDD.
The geographic and system boundaries for the relevant country electricity systems can be
clearly identified and information on the characteristics and composition of the grids is
available;
The amount of electricity generated in the exporting electricity system by hydropower
plants with a power density of the reservoirs below or equal to 4 W/m2 and that start
Power Market Integration: Contribution to Climate Mitigation Recommendations for ENTRO 45/90
commercial operation during the crediting period shall be excluded from the calculations
of the emission reductions.
The most plausible baseline scenario is that the new grid-connected generation capacity
using the similar fuel/technology mix as existing power units in the importing electricity
system that will provide the same amount of electricity to end users.
Some alternative baselines to consider would be whether the proposed project would
occur without being registered as a CDM, whether Egypt could generate electricity capacity from
a renewable energy source to meet its demand or whether isolated mini-grids could provide the
electricity. Egypt has abundance in natural gas and currently natural gas is relatively cheap; the
same project without registering is too expensive and mini projects would not enjoy the
economies of scale. If there is only one alternative scenario that is not prevented by any barrier,
then this scenario alternative is the most plausible baseline scenario. Thus, the most likely
baseline, is that Egypt meets its energy demand with conventional existing technology mix such
as CCGT using the relatively inexpensive natural gas as a fuel.
Emission Reduction
The approved methodologies make adjustments to fine-tune the emission reduction
calculation, however, a quick “back-of-the-envelope” calculation with simplifying assumptions
can provide a relative magnitude for the scenario in which Egypt imports 2000 MW of selected.
Assuming hydropower has negligible carbon emissions
Assuming leakage is negligible
Applying the United States’ average emissions rate from natural gas-fired generation of
1135 lbs/MWh (EPA) = 0.51 T CO2/MWh
Using the 2000 MW of electricity being imported from Ethiopia to Egypt with a load
factor of 63% applied during one year (8760 hours)
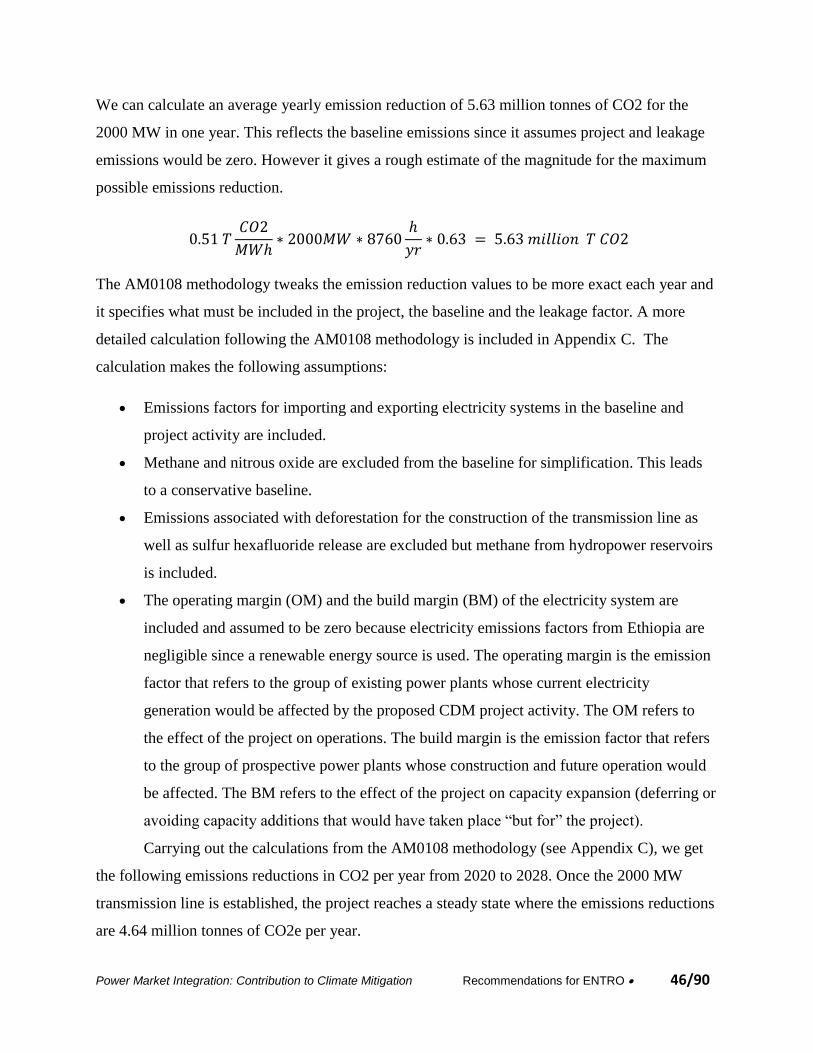
Power Market Integration: Contribution to Climate Mitigation Recommendations for ENTRO 46/90
We can calculate an average yearly emission reduction of 5.63 million tonnes of CO2 for the
2000 MW in one year. This reflects the baseline emissions since it assumes project and leakage
emissions would be zero. However it gives a rough estimate of the magnitude for the maximum
possible emissions reduction.
The AM0108 methodology tweaks the emission reduction values to be more exact each year and
it specifies what must be included in the project, the baseline and the leakage factor. A more
detailed calculation following the AM0108 methodology is included in Appendix C. The
calculation makes the following assumptions:
Emissions factors for importing and exporting electricity systems in the baseline and
project activity are included.
Methane and nitrous oxide are excluded from the baseline for simplification. This leads
to a conservative baseline.
Emissions associated with deforestation for the construction of the transmission line as
well as sulfur hexafluoride release are excluded but methane from hydropower reservoirs
is included.
The operating margin (OM) and the build margin (BM) of the electricity system are
included and assumed to be zero because electricity emissions factors from Ethiopia are
negligible since a renewable energy source is used. The operating margin is the emission
factor that refers to the group of existing power plants whose current electricity
generation would be affected by the proposed CDM project activity. The OM refers to
the effect of the project on operations. The build margin is the emission factor that refers
to the group of prospective power plants whose construction and future operation would
be affected. The BM refers to the effect of the project on capacity expansion (deferring or
avoiding capacity additions that would have taken place “but for” the project).
Carrying out the calculations from the AM0108 methodology (see Appendix C), we get
the following emissions reductions in CO2 per year from 2020 to 2028. Once the 2000 MW
transmission line is established, the project reaches a steady state where the emissions reductions
are 4.64 million tonnes of CO2e per year.
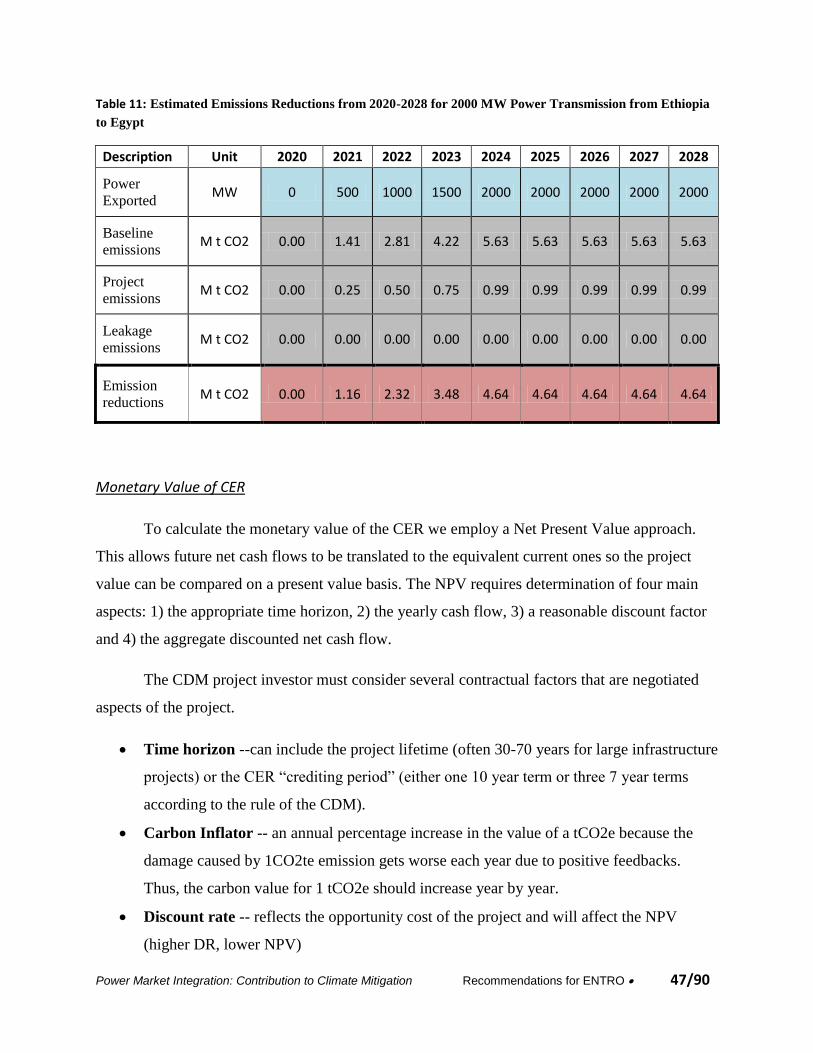
Power Market Integration: Contribution to Climate Mitigation Recommendations for ENTRO 47/90
Table 11: Estimated Emissions Reductions from 2020-2028 for 2000 MW Power Transmission from Ethiopia
to Egypt
Description Unit 2020 2021 2022 2023 2024 2025 2026 2027 2028
Power
Exported MW 0 500 1000 1500 2000 2000 2000 2000 2000
Baseline
emissions M t CO2 0.00 1.41 2.81 4.22 5.63 5.63 5.63 5.63 5.63
Project
emissions M t CO2 0.00 0.25 0.50 0.75 0.99 0.99 0.99 0.99 0.99
Leakage
emissions M t CO2 0.00 0.00 0.00 0.00 0.00 0.00 0.00 0.00 0.00
Emission
reductions M t CO2 0.00 1.16 2.32 3.48 4.64 4.64 4.64 4.64 4.64
Monetary Value of CER
To calculate the monetary value of the CER we employ a Net Present Value approach.
This allows future net cash flows to be translated to the equivalent current ones so the project
value can be compared on a present value basis. The NPV requires determination of four main
aspects: 1) the appropriate time horizon, 2) the yearly cash flow, 3) a reasonable discount factor
and 4) the aggregate discounted net cash flow.
The CDM project investor must consider several contractual factors that are negotiated
aspects of the project.
Time horizon --can include the project lifetime (often 30-70 years for large infrastructure
projects) or the CER “crediting period” (either one 10 year term or three 7 year terms
according to the rule of the CDM).
Carbon Inflator -- an annual percentage increase in the value of a tCO2e because the
damage caused by 1CO2te emission gets worse each year due to positive feedbacks.
Thus, the carbon value for 1 tCO2e should increase year by year.
Discount rate -- reflects the opportunity cost of the project and will affect the NPV
(higher DR, lower NPV)
Power Market Integration: Contribution to Climate Mitigation Recommendations for ENTRO 48/90
Risk level -- who takes the risk, the buyer or the seller; how are liquidated damages
considered if the CER is not delivered or if the carbon credits are not issued. These
aspects are reflected in the price and discount rate
Political and institutional uncertainty beyond 2012 -- The Kyoto protocol has been
established up to 2012, however since CER’s could be generated up to 21 years (3
periods of 7 years each) one can infer that the policy makers intended CER’s to keep the
value after 2012. The European Union Emission Trading Scheme (EU ETS) is the single
largest market for greenhouse gases emission allowances. Still, the future of the market is
uncertain following the UNFCCC protocol. According to the World Bank, currently
“Carbon Funds are primarily interested in buying Certified Emission Reductions (CERs)
from projects that will generate sizeable CERs before the end of 2012”
Transaction cost in applying for the project--- these cost varies depending upon the
project type and size, often falling in the $50,000-$250,000 range for pre-implementation
(UNEP, 2005).
The following are the assumptions used in this analysis:
Time Horizon: we select crediting period to be when the capital expenditure cost is
generated, 2020 (0th year) until the end of the third term crediting period, 2041. Some
projects do not generate candidate CERs until after the fifth year but the crediting period
remains the same. The numbers of interest are the steady state values.
Currency: is shown in US dollars since most of the projects use USD for the PDD.
Carbon Inflator: is excluded for simplicity. It can be reflected in the discount rate.
Transaction costs: excluded for the CDM project. This assessment aims to investigate
the project’s potential benefit in carbon emission reduction, not costs. The CDM costs of
applying should be considered separately.
Price: A benchmark price often used for investment appraisal is the World Bank
Prototype Carbon Fund price. The WB PCF was the first carbon fund formed by a
partnership of 17 companies and 6 governments to pioneer the market for project based
GHG reduction. However, like with many commodities in the market, the price value of
the CER’s has fluctuated dramatically, based on the risk, supply and demand. The news
media Reuters reported that “analysts cut their price forecasts for United Nations' carbon
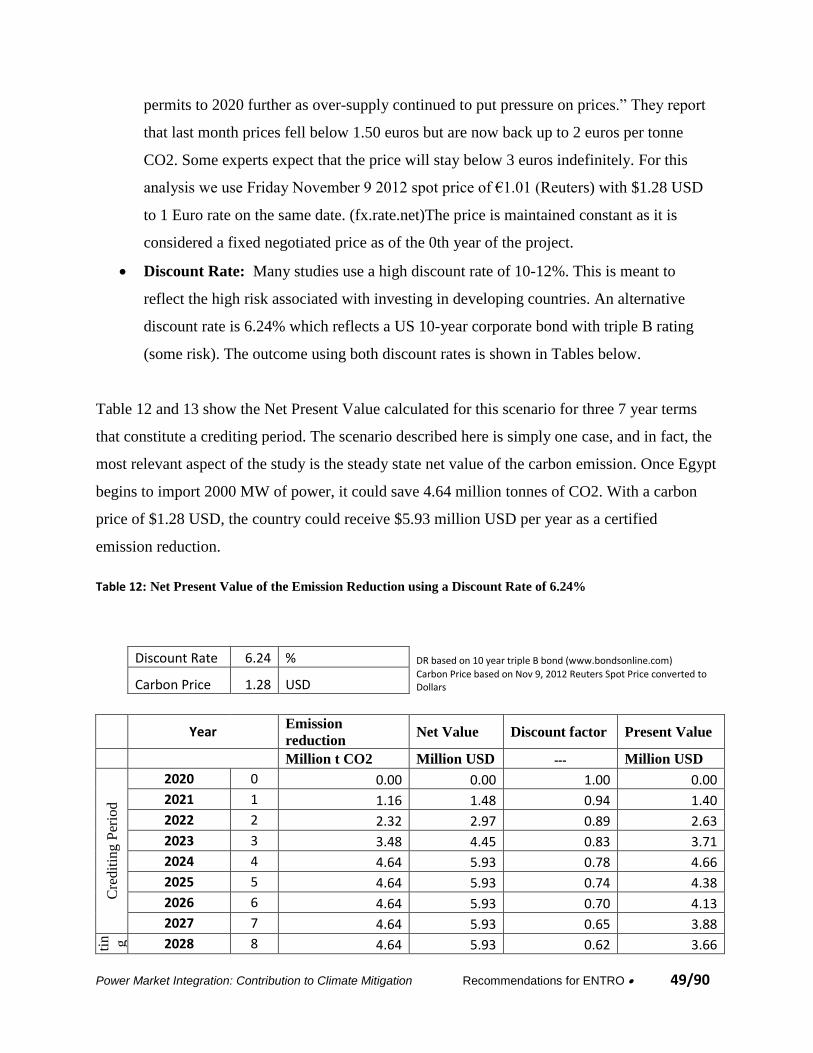
Power Market Integration: Contribution to Climate Mitigation Recommendations for ENTRO 49/90
permits to 2020 further as over-supply continued to put pressure on prices.” They report
that last month prices fell below 1.50 euros but are now back up to 2 euros per tonne
CO2. Some experts expect that the price will stay below 3 euros indefinitely. For this
analysis we use Friday November 9 2012 spot price of €1.01 (Reuters) with $1.28 USD
to 1 Euro rate on the same date. (fx.rate.net)The price is maintained constant as it is
considered a fixed negotiated price as of the 0th year of the project.
Discount Rate: Many studies use a high discount rate of 10-12%. This is meant to
reflect the high risk associated with investing in developing countries. An alternative
discount rate is 6.24% which reflects a US 10-year corporate bond with triple B rating
(some risk). The outcome using both discount rates is shown in Tables below.
Table 12 and 13 show the Net Present Value calculated for this scenario for three 7 year terms
that constitute a crediting period. The scenario described here is simply one case, and in fact, the
most relevant aspect of the study is the steady state net value of the carbon emission. Once Egypt
begins to import 2000 MW of power, it could save 4.64 million tonnes of CO2. With a carbon
price of $1.28 USD, the country could receive $5.93 million USD per year as a certified
emission reduction.
Table 12: Net Present Value of the Emission Reduction using a Discount Rate of 6.24%
Discount Rate 6.24 % DR based on 10 year triple B bond (www.bondsonline.com)
Carbon Price 1.28 USD
Carbon Price based on Nov 9, 2012 Reuters Spot Price converted to Dollars
Year Emission
reduction Net Value Discount factor Present Value
Million t CO2 Million USD --- Million USD
Cre
dit
ing
Per
iod
2020 0 0.00 0.00 1.00 0.00
2021 1 1.16 1.48 0.94 1.40
2022 2 2.32 2.97 0.89 2.63
2023 3 3.48 4.45 0.83 3.71
2024 4 4.64 5.93 0.78 4.66
2025 5 4.64 5.93 0.74 4.38
2026 6 4.64 5.93 0.70 4.13
2027 7 4.64 5.93 0.65 3.88
Cr
edi
tin g
Per
iod
2028 8 4.64 5.93 0.62 3.66
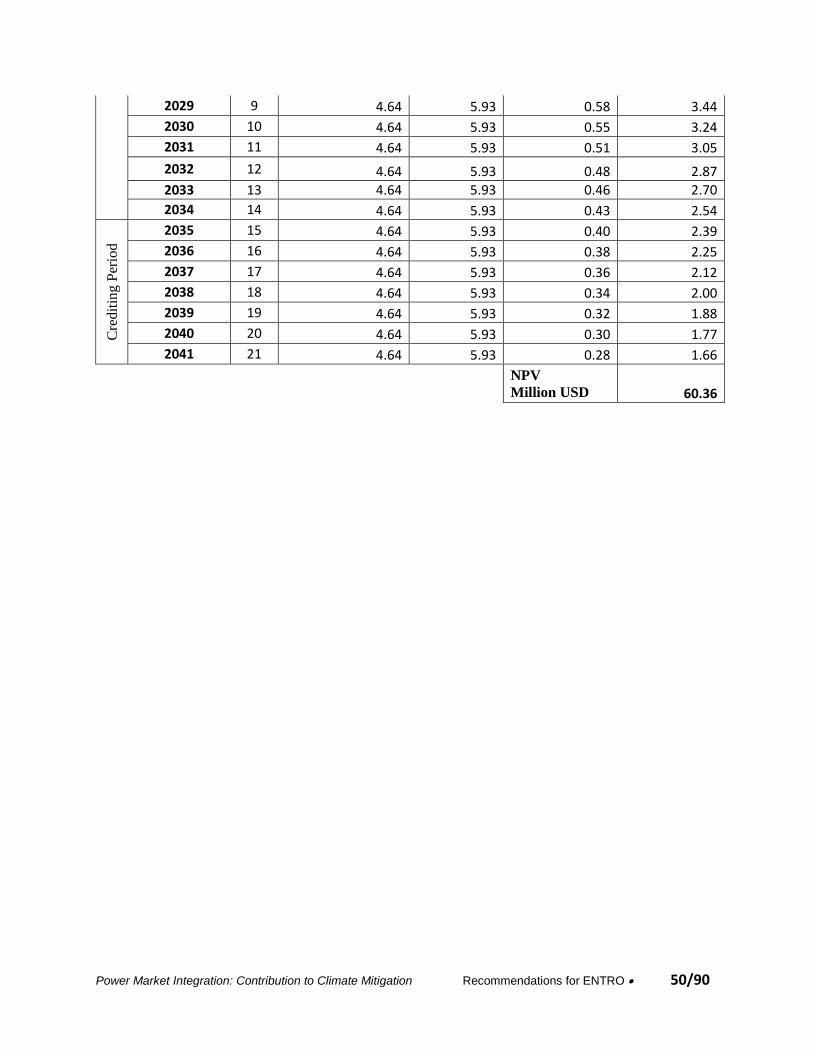
Power Market Integration: Contribution to Climate Mitigation Recommendations for ENTRO 50/90
2029 9 4.64 5.93 0.58 3.44
2030 10 4.64 5.93 0.55 3.24
2031 11 4.64 5.93 0.51 3.05
2032 12 4.64 5.93 0.48 2.87
2033 13 4.64 5.93 0.46 2.70
2034 14 4.64 5.93 0.43 2.54
Cre
dit
ing
Per
iod
2035 15 4.64 5.93 0.40 2.39
2036 16 4.64 5.93 0.38 2.25
2037 17 4.64 5.93 0.36 2.12
2038 18 4.64 5.93 0.34 2.00
2039 19 4.64 5.93 0.32 1.88
2040 20 4.64 5.93 0.30 1.77
2041 21 4.64 5.93 0.28 1.66
NPV
Million USD 60.36
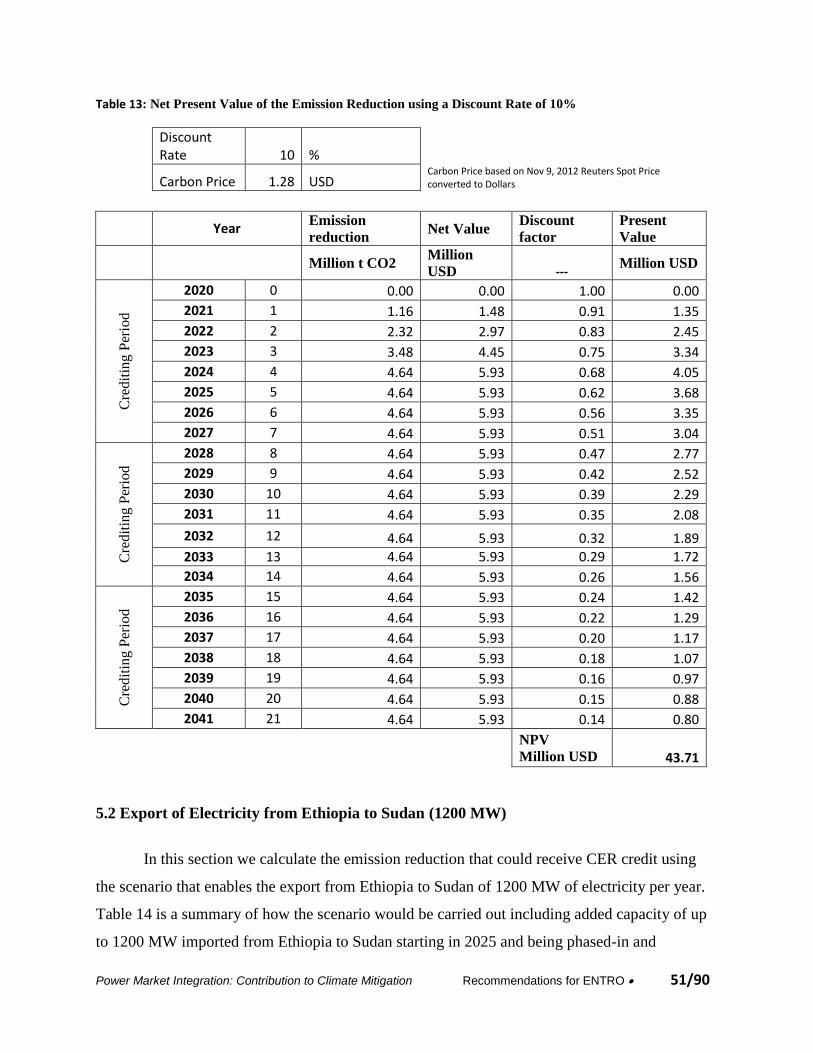
Power Market Integration: Contribution to Climate Mitigation Recommendations for ENTRO 51/90
Table 13: Net Present Value of the Emission Reduction using a Discount Rate of 10%
Discount Rate 10 %
Carbon Price 1.28 USD
Carbon Price based on Nov 9, 2012 Reuters Spot Price converted to Dollars
Year Emission
reduction Net Value
Discount
factor
Present
Value
Million t CO2
Million
USD --- Million USD
Cre
dit
ing
Per
iod
2020 0 0.00 0.00 1.00 0.00
2021 1 1.16 1.48 0.91 1.35
2022 2 2.32 2.97 0.83 2.45
2023 3 3.48 4.45 0.75 3.34
2024 4 4.64 5.93 0.68 4.05
2025 5 4.64 5.93 0.62 3.68
2026 6 4.64 5.93 0.56 3.35
2027 7 4.64 5.93 0.51 3.04
Cre
dit
ing P
erio
d
2028 8 4.64 5.93 0.47 2.77
2029 9 4.64 5.93 0.42 2.52
2030 10 4.64 5.93 0.39 2.29
2031 11 4.64 5.93 0.35 2.08
2032 12 4.64 5.93 0.32 1.89
2033 13 4.64 5.93 0.29 1.72
2034 14 4.64 5.93 0.26 1.56
Cre
dit
ing P
erio
d
2035 15 4.64 5.93 0.24 1.42
2036 16 4.64 5.93 0.22 1.29
2037 17 4.64 5.93 0.20 1.17
2038 18 4.64 5.93 0.18 1.07
2039 19 4.64 5.93 0.16 0.97
2040 20 4.64 5.93 0.15 0.88
2041 21 4.64 5.93 0.14 0.80
NPV
Million USD 43.71
5.2 Export of Electricity from Ethiopia to Sudan (1200 MW)
In this section we calculate the emission reduction that could receive CER credit using
the scenario that enables the export from Ethiopia to Sudan of 1200 MW of electricity per year.
Table 14 is a summary of how the scenario would be carried out including added capacity of up
to 1200 MW imported from Ethiopia to Sudan starting in 2025 and being phased-in and
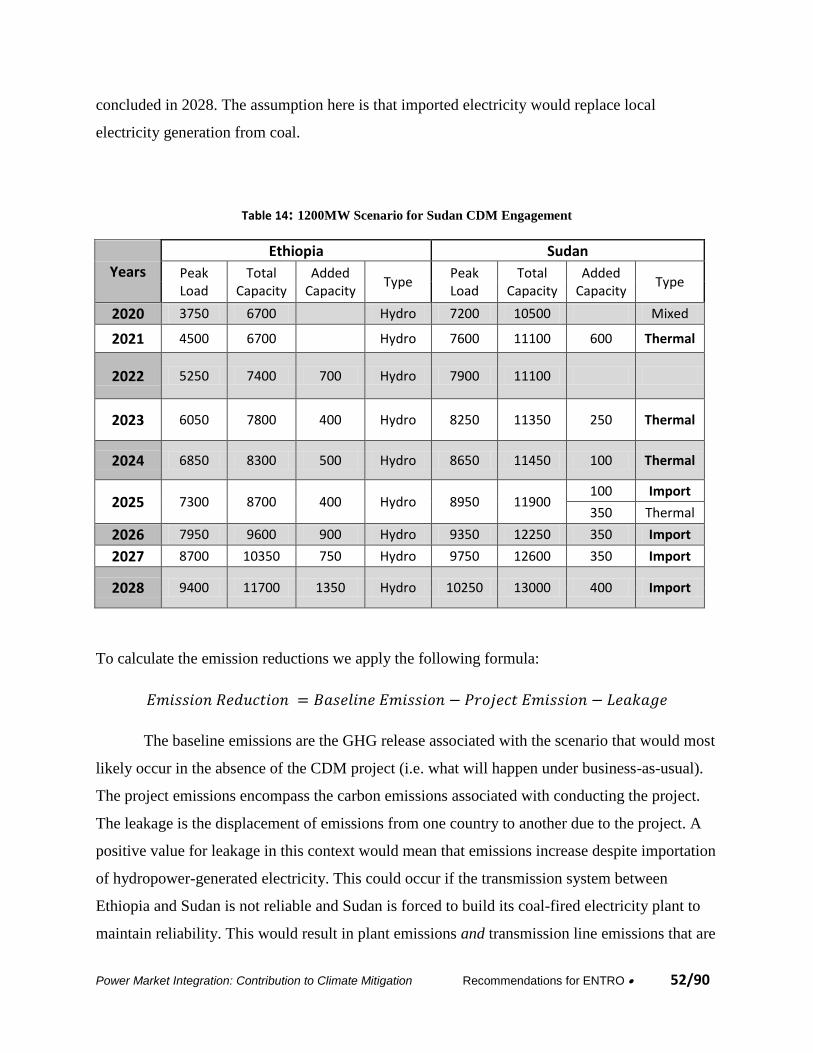
Power Market Integration: Contribution to Climate Mitigation Recommendations for ENTRO 52/90
concluded in 2028. The assumption here is that imported electricity would replace local
electricity generation from coal.
Table 14: 1200MW Scenario for Sudan CDM Engagement
Years
Ethiopia Sudan
Peak Load
Total Capacity
Added Capacity
Type Peak Load
Total Capacity
Added Capacity
Type
2020 3750 6700
Hydro 7200 10500 Mixed
2021 4500 6700
Hydro 7600 11100 600 Thermal
2022 5250 7400 700 Hydro 7900 11100
2023 6050 7800 400 Hydro 8250 11350 250 Thermal
2024 6850 8300 500 Hydro 8650 11450 100 Thermal
2025 7300 8700 400 Hydro 8950 11900 100 Import
350 Thermal
2026 7950 9600 900 Hydro 9350 12250 350 Import
2027 8700 10350 750 Hydro 9750 12600 350 Import
2028 9400 11700 1350 Hydro 10250 13000 400 Import
To calculate the emission reductions we apply the following formula:
The baseline emissions are the GHG release associated with the scenario that would most
likely occur in the absence of the CDM project (i.e. what will happen under business-as-usual).
The project emissions encompass the carbon emissions associated with conducting the project.
The leakage is the displacement of emissions from one country to another due to the project. A
positive value for leakage in this context would mean that emissions increase despite importation
of hydropower-generated electricity. This could occur if the transmission system between
Ethiopia and Sudan is not reliable and Sudan is forced to build its coal-fired electricity plant to
maintain reliability. This would result in plant emissions and transmission line emissions that are
Power Market Integration: Contribution to Climate Mitigation Recommendations for ENTRO 53/90
greater than the project had accounted. A negative value for leakage implies that the project
reduces emissions in Ethiopia directly, and also reduces emissions in Sudan. In the context of
this project, because electricity transmission is only in one direction, from Ethiopia to Sudan,
negative leakage does not have a realistic meaning. The lowest value that we can assign to
leakage is zero.
The AM108 methodology applies to project activities that involve the establishment of
new electrical interconnections between grids to achieve or increase electricity exchange
between two grids.
The methodology is applicable under the following conditions:
The interconnection is through the construction of new transmission lines;
The relation between annual electricity flow from the exporting (Ethiopian) to the
importing (Sudan) electricity system and vice versa shall not fall below 80/20.
The exporting electricity system must have more than 15 per cent of reserve capacity.
Having reserve capacity ensures that the importing country can receive a reliable supply
of electricity and is not forced to build more conventional plants to meet the demand due
to an unreliable importing network.
Any other interconnections that the importing and the exporting electricity system have
with neighbouring grids prior to the implementation of the project activity (i.e. Kenya,
Djibouti) should be identified and described in the CDM-PDD.
The geographic and system boundaries for the relevant country electricity systems can be
clearly identified and information on the characteristics and composition of the grids is
available;
The amount of electricity generated in the exporting electricity system by hydropower
plants with a power density of the reservoirs below or equal to 4 W/m2 and that start
commercial operation during the crediting period shall be excluded from the calculations
of the emission reductions.
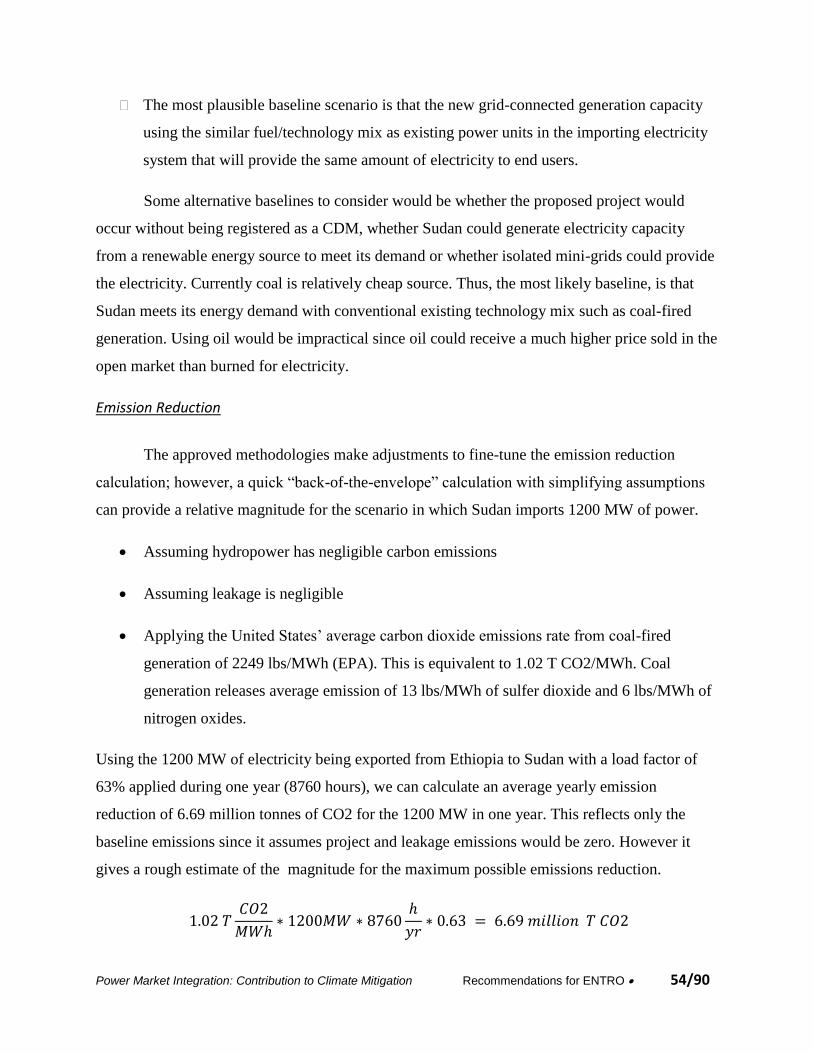
Power Market Integration: Contribution to Climate Mitigation Recommendations for ENTRO 54/90
The most plausible baseline scenario is that the new grid-connected generation capacity
using the similar fuel/technology mix as existing power units in the importing electricity
system that will provide the same amount of electricity to end users.
Some alternative baselines to consider would be whether the proposed project would
occur without being registered as a CDM, whether Sudan could generate electricity capacity
from a renewable energy source to meet its demand or whether isolated mini-grids could provide
the electricity. Currently coal is relatively cheap source. Thus, the most likely baseline, is that
Sudan meets its energy demand with conventional existing technology mix such as coal-fired
generation. Using oil would be impractical since oil could receive a much higher price sold in the
open market than burned for electricity.
Emission Reduction
The approved methodologies make adjustments to fine-tune the emission reduction
calculation; however, a quick “back-of-the-envelope” calculation with simplifying assumptions
can provide a relative magnitude for the scenario in which Sudan imports 1200 MW of power.
Assuming hydropower has negligible carbon emissions
Assuming leakage is negligible
Applying the United States’ average carbon dioxide emissions rate from coal-fired
generation of 2249 lbs/MWh (EPA). This is equivalent to 1.02 T CO2/MWh. Coal
generation releases average emission of 13 lbs/MWh of sulfer dioxide and 6 lbs/MWh of
nitrogen oxides.
Using the 1200 MW of electricity being exported from Ethiopia to Sudan with a load factor of
63% applied during one year (8760 hours), we can calculate an average yearly emission
reduction of 6.69 million tonnes of CO2 for the 1200 MW in one year. This reflects only the
baseline emissions since it assumes project and leakage emissions would be zero. However it
gives a rough estimate of the magnitude for the maximum possible emissions reduction.
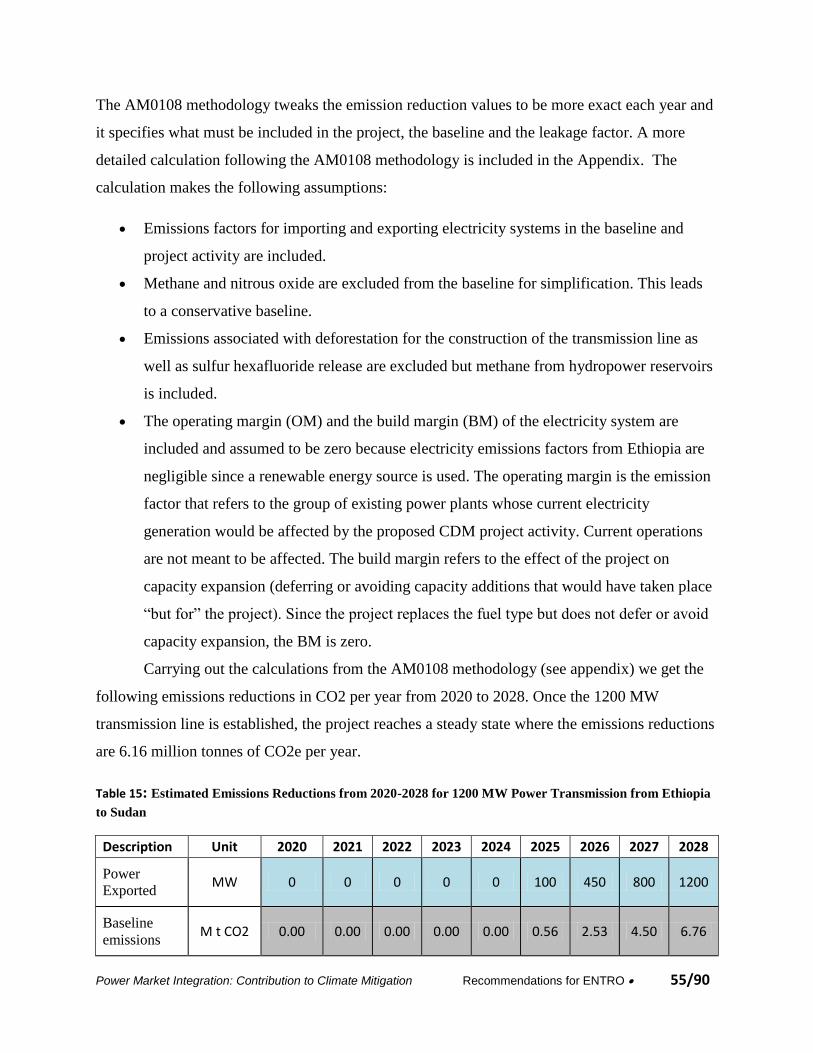
Power Market Integration: Contribution to Climate Mitigation Recommendations for ENTRO 55/90
The AM0108 methodology tweaks the emission reduction values to be more exact each year and
it specifies what must be included in the project, the baseline and the leakage factor. A more
detailed calculation following the AM0108 methodology is included in the Appendix. The
calculation makes the following assumptions:
Emissions factors for importing and exporting electricity systems in the baseline and
project activity are included.
Methane and nitrous oxide are excluded from the baseline for simplification. This leads
to a conservative baseline.
Emissions associated with deforestation for the construction of the transmission line as
well as sulfur hexafluoride release are excluded but methane from hydropower reservoirs
is included.
The operating margin (OM) and the build margin (BM) of the electricity system are
included and assumed to be zero because electricity emissions factors from Ethiopia are
negligible since a renewable energy source is used. The operating margin is the emission
factor that refers to the group of existing power plants whose current electricity
generation would be affected by the proposed CDM project activity. Current operations
are not meant to be affected. The build margin refers to the effect of the project on
capacity expansion (deferring or avoiding capacity additions that would have taken place
“but for” the project). Since the project replaces the fuel type but does not defer or avoid
capacity expansion, the BM is zero.
Carrying out the calculations from the AM0108 methodology (see appendix) we get the
following emissions reductions in CO2 per year from 2020 to 2028. Once the 1200 MW
transmission line is established, the project reaches a steady state where the emissions reductions
are 6.16 million tonnes of CO2e per year.
Table 15: Estimated Emissions Reductions from 2020-2028 for 1200 MW Power Transmission from Ethiopia
to Sudan
Description Unit 2020 2021 2022 2023 2024 2025 2026 2027 2028
Power
Exported MW 0 0 0 0 0 100 450 800 1200
Baseline
emissions M t CO2 0.00 0.00 0.00 0.00 0.00 0.56 2.53 4.50 6.76
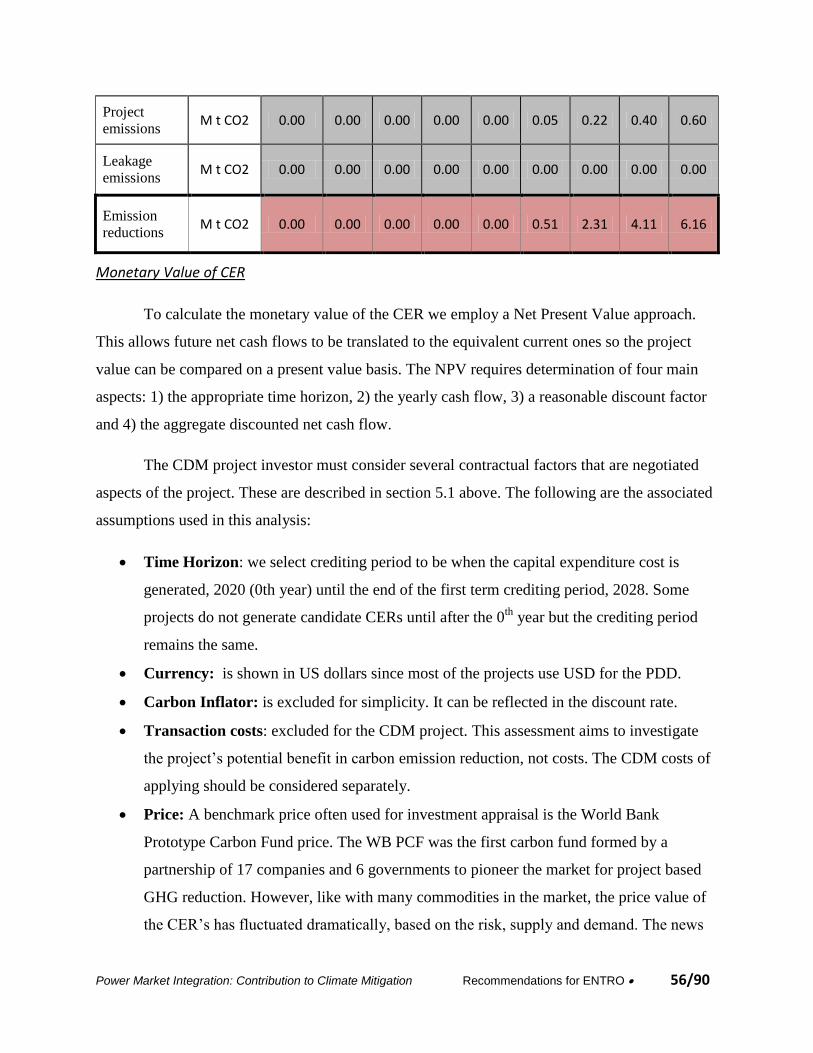
Power Market Integration: Contribution to Climate Mitigation Recommendations for ENTRO 56/90
Project
emissions M t CO2 0.00 0.00 0.00 0.00 0.00 0.05 0.22 0.40 0.60
Leakage
emissions M t CO2 0.00 0.00 0.00 0.00 0.00 0.00 0.00 0.00 0.00
Emission
reductions M t CO2 0.00 0.00 0.00 0.00 0.00 0.51 2.31 4.11 6.16
Monetary Value of CER
To calculate the monetary value of the CER we employ a Net Present Value approach.
This allows future net cash flows to be translated to the equivalent current ones so the project
value can be compared on a present value basis. The NPV requires determination of four main
aspects: 1) the appropriate time horizon, 2) the yearly cash flow, 3) a reasonable discount factor
and 4) the aggregate discounted net cash flow.
The CDM project investor must consider several contractual factors that are negotiated
aspects of the project. These are described in section 5.1 above. The following are the associated
assumptions used in this analysis:
Time Horizon: we select crediting period to be when the capital expenditure cost is
generated, 2020 (0th year) until the end of the first term crediting period, 2028. Some
projects do not generate candidate CERs until after the 0th
year but the crediting period
remains the same.
Currency: is shown in US dollars since most of the projects use USD for the PDD.
Carbon Inflator: is excluded for simplicity. It can be reflected in the discount rate.
Transaction costs: excluded for the CDM project. This assessment aims to investigate
the project’s potential benefit in carbon emission reduction, not costs. The CDM costs of
applying should be considered separately.
Price: A benchmark price often used for investment appraisal is the World Bank
Prototype Carbon Fund price. The WB PCF was the first carbon fund formed by a
partnership of 17 companies and 6 governments to pioneer the market for project based
GHG reduction. However, like with many commodities in the market, the price value of
the CER’s has fluctuated dramatically, based on the risk, supply and demand. The news
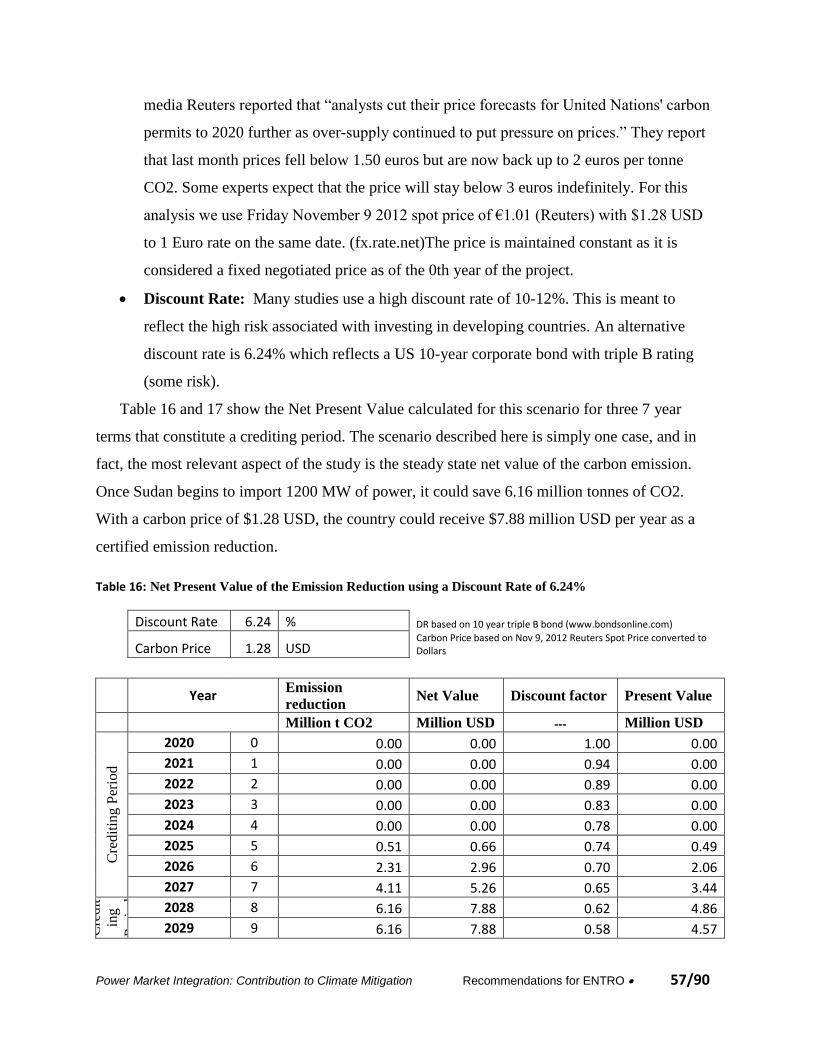
Power Market Integration: Contribution to Climate Mitigation Recommendations for ENTRO 57/90
media Reuters reported that “analysts cut their price forecasts for United Nations' carbon
permits to 2020 further as over-supply continued to put pressure on prices.” They report
that last month prices fell below 1.50 euros but are now back up to 2 euros per tonne
CO2. Some experts expect that the price will stay below 3 euros indefinitely. For this
analysis we use Friday November 9 2012 spot price of €1.01 (Reuters) with $1.28 USD
to 1 Euro rate on the same date. (fx.rate.net)The price is maintained constant as it is
considered a fixed negotiated price as of the 0th year of the project.
Discount Rate: Many studies use a high discount rate of 10-12%. This is meant to
reflect the high risk associated with investing in developing countries. An alternative
discount rate is 6.24% which reflects a US 10-year corporate bond with triple B rating
(some risk).
Table 16 and 17 show the Net Present Value calculated for this scenario for three 7 year
terms that constitute a crediting period. The scenario described here is simply one case, and in
fact, the most relevant aspect of the study is the steady state net value of the carbon emission.
Once Sudan begins to import 1200 MW of power, it could save 6.16 million tonnes of CO2.
With a carbon price of $1.28 USD, the country could receive $7.88 million USD per year as a
certified emission reduction.
Table 16: Net Present Value of the Emission Reduction using a Discount Rate of 6.24%
Discount Rate 6.24 % DR based on 10 year triple B bond (www.bondsonline.com)
Carbon Price 1.28 USD
Carbon Price based on Nov 9, 2012 Reuters Spot Price converted to Dollars
Year Emission
reduction Net Value Discount factor Present Value
Million t CO2 Million USD --- Million USD
Cre
dit
ing
Per
iod
2020 0 0.00 0.00 1.00 0.00
2021 1 0.00 0.00 0.94 0.00
2022 2 0.00 0.00 0.89 0.00
2023 3 0.00 0.00 0.83 0.00
2024 4 0.00 0.00 0.78 0.00
2025 5 0.51 0.66 0.74 0.49
2026 6 2.31 2.96 0.70 2.06
2027 7 4.11 5.26 0.65 3.44
Cre
dit
ing
Per
iod
2028 8 6.16 7.88 0.62 4.86
2029 9 6.16 7.88 0.58 4.57
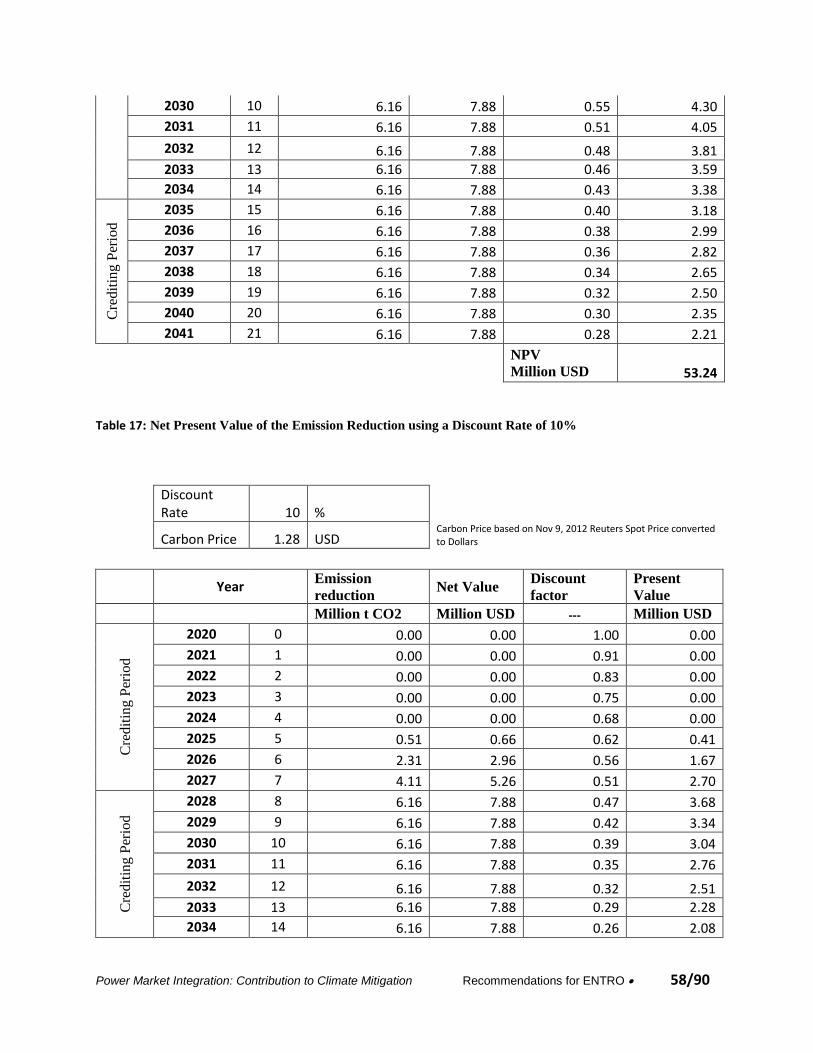
Power Market Integration: Contribution to Climate Mitigation Recommendations for ENTRO 58/90
2030 10 6.16 7.88 0.55 4.30
2031 11 6.16 7.88 0.51 4.05
2032 12 6.16 7.88 0.48 3.81
2033 13 6.16 7.88 0.46 3.59
2034 14 6.16 7.88 0.43 3.38
Cre
dit
ing
Per
iod
2035 15 6.16 7.88 0.40 3.18
2036 16 6.16 7.88 0.38 2.99
2037 17 6.16 7.88 0.36 2.82
2038 18 6.16 7.88 0.34 2.65
2039 19 6.16 7.88 0.32 2.50
2040 20 6.16 7.88 0.30 2.35
2041 21 6.16 7.88 0.28 2.21
NPV
Million USD 53.24
Table 17: Net Present Value of the Emission Reduction using a Discount Rate of 10%
Discount Rate 10 %
Carbon Price 1.28 USD
Carbon Price based on Nov 9, 2012 Reuters Spot Price converted to Dollars
Year Emission
reduction Net Value
Discount
factor
Present
Value
Million t CO2 Million USD --- Million USD
Cre
dit
ing P
erio
d
2020 0 0.00 0.00 1.00 0.00
2021 1 0.00 0.00 0.91 0.00
2022 2 0.00 0.00 0.83 0.00
2023 3 0.00 0.00 0.75 0.00
2024 4 0.00 0.00 0.68 0.00
2025 5 0.51 0.66 0.62 0.41
2026 6 2.31 2.96 0.56 1.67
2027 7 4.11 5.26 0.51 2.70
Cre
dit
ing
Per
iod
2028 8 6.16 7.88 0.47 3.68
2029 9 6.16 7.88 0.42 3.34
2030 10 6.16 7.88 0.39 3.04
2031 11 6.16 7.88 0.35 2.76
2032 12 6.16 7.88 0.32 2.51
2033 13 6.16 7.88 0.29 2.28
2034 14 6.16 7.88 0.26 2.08
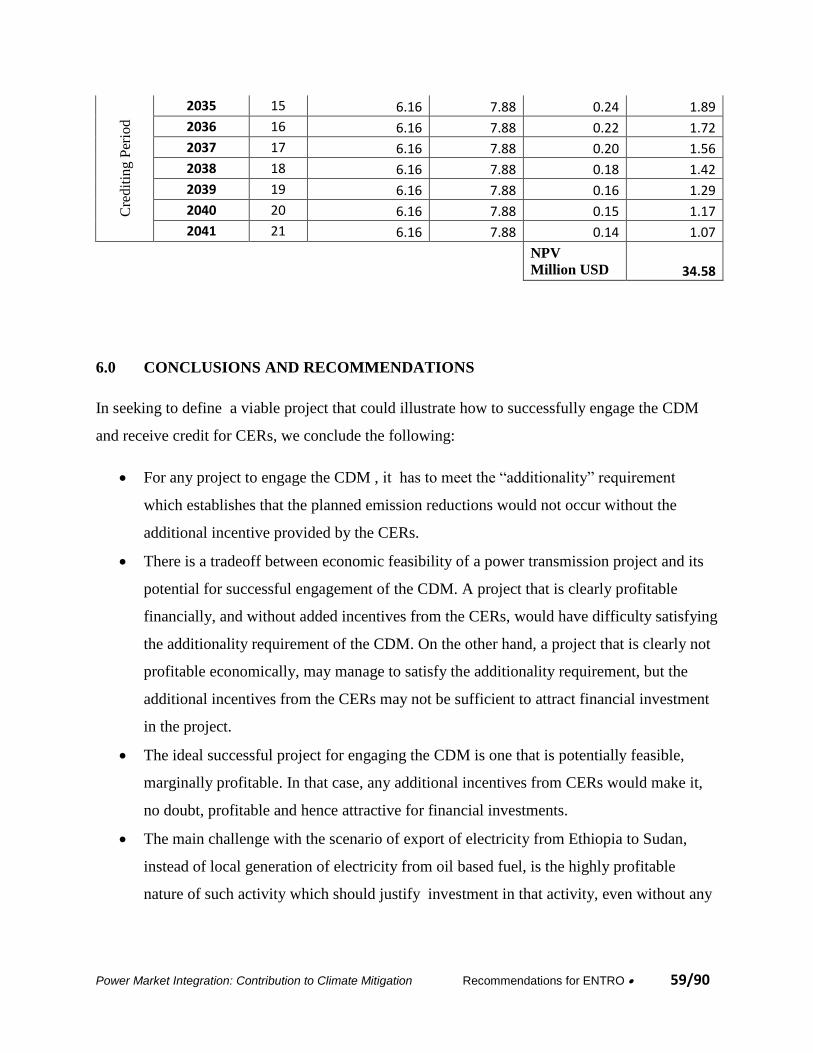
Power Market Integration: Contribution to Climate Mitigation Recommendations for ENTRO 59/90
Cre
dit
ing
Per
iod
2035 15 6.16 7.88 0.24 1.89
2036 16 6.16 7.88 0.22 1.72
2037 17 6.16 7.88 0.20 1.56
2038 18 6.16 7.88 0.18 1.42
2039 19 6.16 7.88 0.16 1.29
2040 20 6.16 7.88 0.15 1.17
2041 21 6.16 7.88 0.14 1.07
NPV
Million USD 34.58
6.0 CONCLUSIONS AND RECOMMENDATIONS
In seeking to define a viable project that could illustrate how to successfully engage the CDM
and receive credit for CERs, we conclude the following:
For any project to engage the CDM , it has to meet the “additionality” requirement
which establishes that the planned emission reductions would not occur without the
additional incentive provided by the CERs.
There is a tradeoff between economic feasibility of a power transmission project and its
potential for successful engagement of the CDM. A project that is clearly profitable
financially, and without added incentives from the CERs, would have difficulty satisfying
the additionality requirement of the CDM. On the other hand, a project that is clearly not
profitable economically, may manage to satisfy the additionality requirement, but the
additional incentives from the CERs may not be sufficient to attract financial investment
in the project.
The ideal successful project for engaging the CDM is one that is potentially feasible,
marginally profitable. In that case, any additional incentives from CERs would make it,
no doubt, profitable and hence attractive for financial investments.
The main challenge with the scenario of export of electricity from Ethiopia to Sudan,
instead of local generation of electricity from oil based fuel, is the highly profitable
nature of such activity which should justify investment in that activity, even without any
Power Market Integration: Contribution to Climate Mitigation Recommendations for ENTRO 60/90
credit that can be gained due to approval of CERs. This fact makes it almost impossible
to satisfy the “additionality” requirement.
Applying the above principles, export of electricity from Ethiopia to Sudan instead of
local generation of electricity from oil is too profitable to succeed in engaging the CDM.
While export of electricity from Ethiopia to Sudan instead of local generation from coal,
or export of electricity from Ethiopia to Egypt instead of local generation from natural
gas are promising projects for successfully engaging the CDM.
For engaging the CDM, we recommend a project that has been considered as a feasible
option by the Power Trade Study and consists of the development of a transmission line
connecting Egypt to the already connected regional network between Sudan and Ethiopia.
Under this scenario, Egypt receives 700MW of imported electricity from Ethiopia
generated from renewable hydropower, and thus, averting the generation of electricity
from CCGT fueled by natural gas. This supply of electricity will be in two phases: In
2023 Egypt will receive 500 MW imported electricity and in 2024 Egypt will receive an
additional 200 MW from Ethiopia.
According to original power development plans in Ethiopia, in 2023 and 2024 Ethiopia
should commission Advance Beko Abo (~700 MW), and Mandaya hydropower projects.
While Mandaya reservoir power density is less than 4 W/m2, the power density of the
Beko Abo which will generate about 700MW, is greater than 4 W/m2. Hence in engaging
the CDM the Beko Abo project should be emphasized.
We recommend applying the AM0108 approved methodology when developing the
PDD. We recommend conducting a clear barrier analysis to ensure that the scenario does
not have other constraints. In order to demonstrate that the additionality condition is met
due to the low price of natural gas, Egypt or Sudan would need to show that the CER
credits are needed to engage in this clean project.
Power Market Integration: Contribution to Climate Mitigation Recommendations for ENTRO 61/90
REFERENCES
United Nations. Clean Development Mechanism Executive Board. 2004. Approved
Consolidated Baseline Methodology ACM0002: Consolidated baseline methodology for
grid-connected electricity generation from renewable sources. Version 2.
http://cdm.unfccc.int/UserManagement/FileStorage/ACM0002_Consolidated_elct_versio
n_2.pdf.
United Nations. United Nations Framework Convention on Climate Change. 1992. Kyoto
Protocol to the United Nations Framework Convention on Climate Change.
http://unfccc.int/resource/docs/convkp/kpeng.html.

Power Market Integration: Contribution to Climate Mitigation Recommendations for ENTRO 62/90
APPENDIX A: CDM Methodologies
Approved consolidated baseline and monitoring methodology ACM0002
“Consolidated baseline methodology for grid-connected
electricity generation from renewable sources”
http://cdm.unfccc.int/methodologies/DB/UB3431UT9I5KN2MUL2FGZXZ6CV71LT/view.html
Approved baseline and monitoring methodology AM0108
“Interconnection between electricity systems for energy exchange”
http://cdm.unfccc.int/methodologies/DB/KR3GWTWMUQ7EWN1UR7Z7H92VA5JQEW
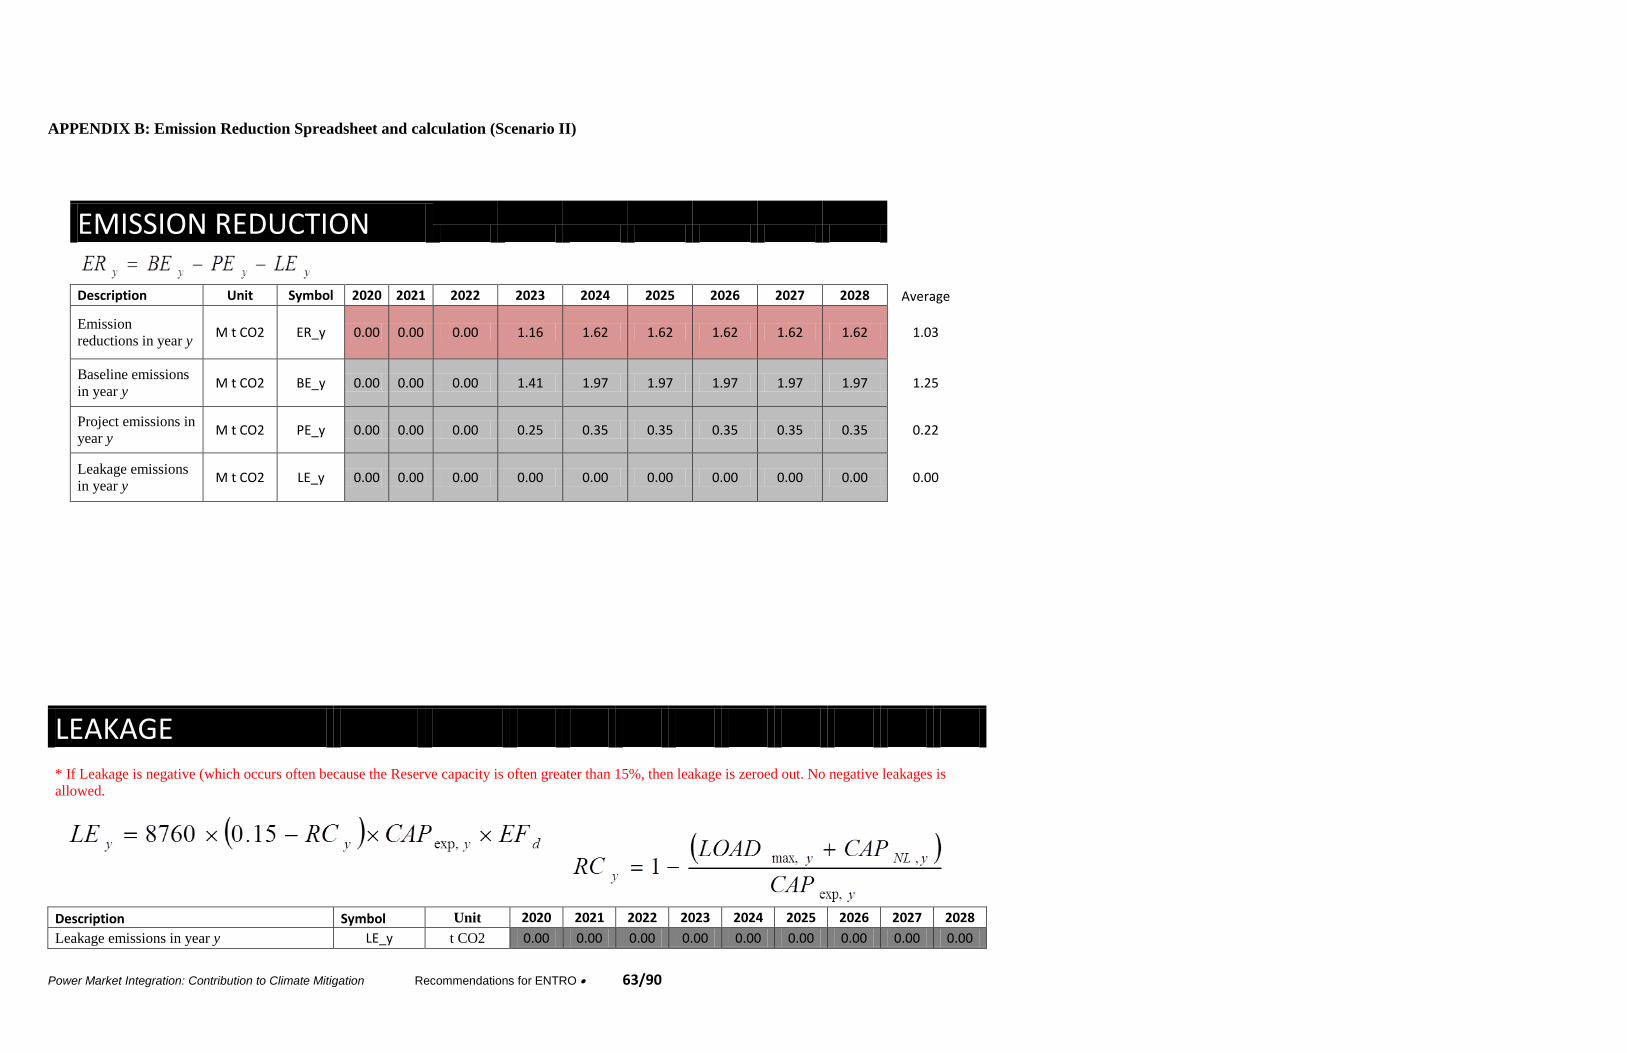
Power Market Integration: Contribution to Climate Mitigation Recommendations for ENTRO 63/90
APPENDIX B: Emission Reduction Spreadsheet and calculation (Scenario II)
EMISSION REDUCTION
Description Unit Symbol 2020 2021 2022 2023 2024 2025 2026 2027 2028 Average
Emission
reductions in year y M t CO2 ER_y 0.00 0.00 0.00 1.16 1.62 1.62 1.62 1.62 1.62 1.03
Baseline emissions
in year y M t CO2 BE_y 0.00 0.00 0.00 1.41 1.97 1.97 1.97 1.97 1.97 1.25
Project emissions in
year y M t CO2 PE_y 0.00 0.00 0.00 0.25 0.35 0.35 0.35 0.35 0.35 0.22
Leakage emissions
in year y M t CO2 LE_y 0.00 0.00 0.00 0.00 0.00 0.00 0.00 0.00 0.00 0.00
LEAKAGE
* If Leakage is negative (which occurs often because the Reserve capacity is often greater than 15%, then leakage is zeroed out. No negative leakages is
allowed.
Description Symbol Unit 2020 2021 2022 2023 2024 2025 2026 2027 2028
Leakage emissions in year y LE_y t CO2 0.00 0.00 0.00 0.00 0.00 0.00 0.00 0.00 0.00
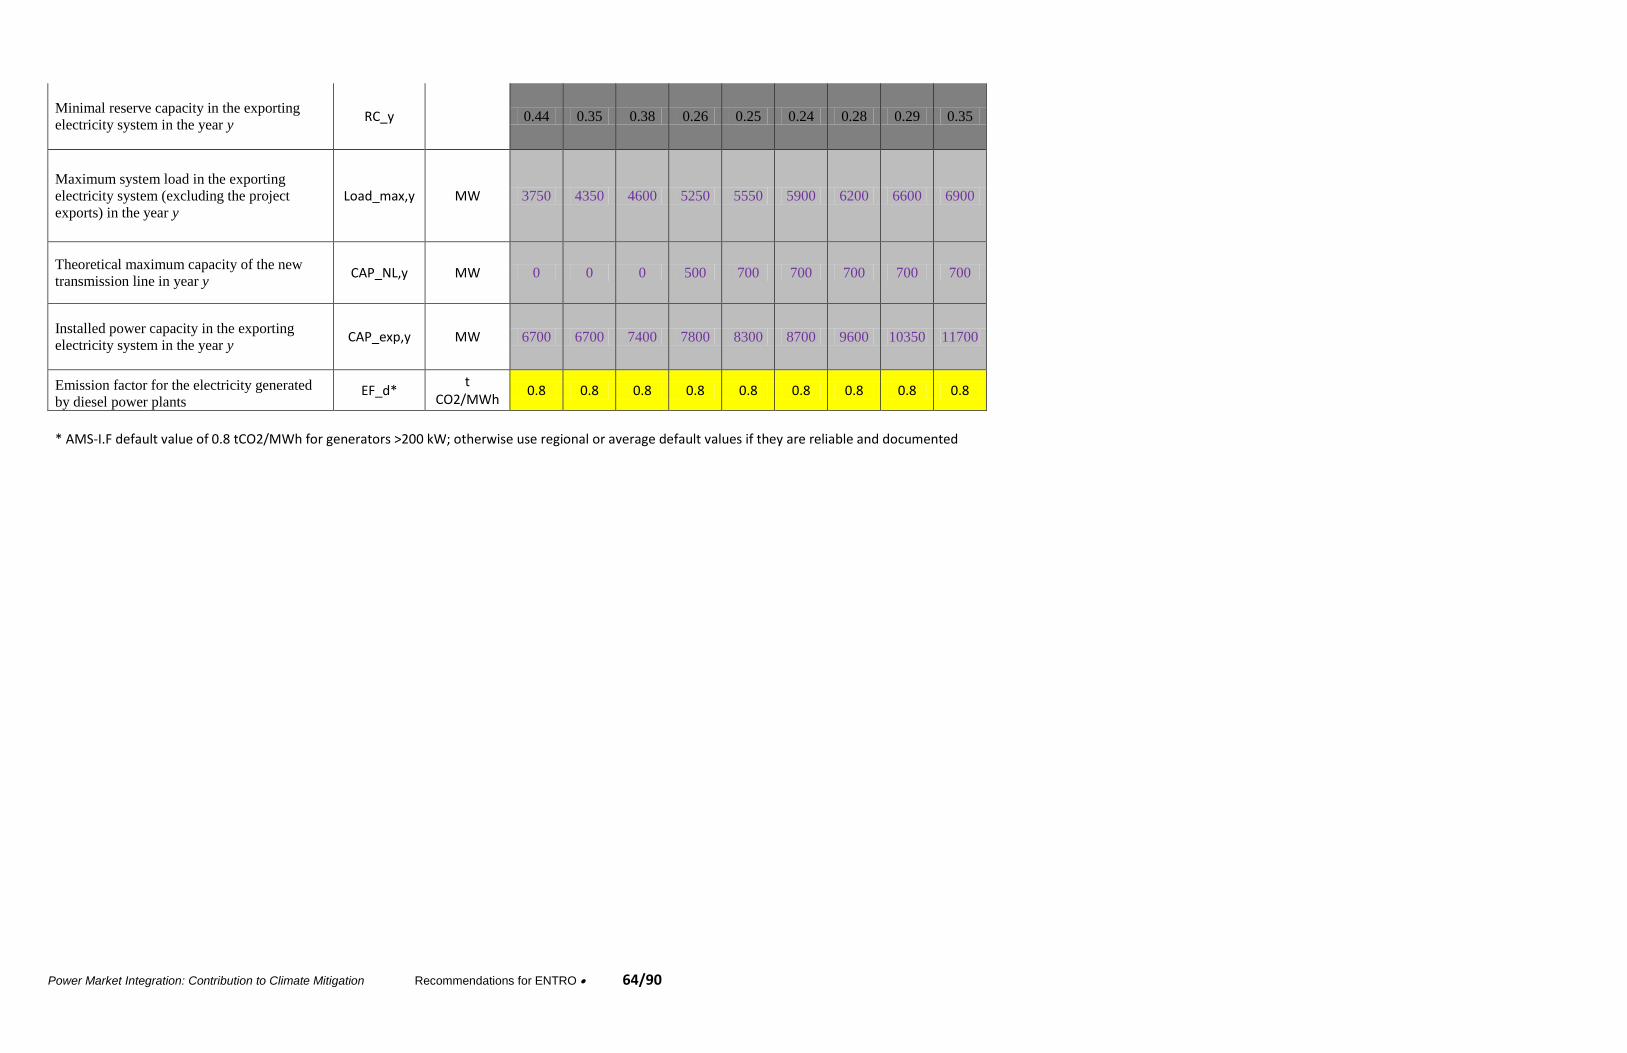
Power Market Integration: Contribution to Climate Mitigation Recommendations for ENTRO 64/90
Minimal reserve capacity in the exporting
electricity system in the year y RC_y 0.44 0.35 0.38 0.26 0.25 0.24 0.28 0.29 0.35
Maximum system load in the exporting
electricity system (excluding the project
exports) in the year y
Load_max,y MW 3750 4350 4600 5250 5550 5900 6200 6600 6900
Theoretical maximum capacity of the new
transmission line in year y CAP_NL,y MW 0 0 0 500 700 700 700 700 700
Installed power capacity in the exporting
electricity system in the year y CAP_exp,y MW 6700 6700 7400 7800 8300 8700 9600 10350 11700
Emission factor for the electricity generated
by diesel power plants EF_d*
t CO2/MWh
0.8 0.8 0.8 0.8 0.8 0.8 0.8 0.8 0.8
* AMS-I.F default value of 0.8 tCO2/MWh for generators >200 kW; otherwise use regional or average default values if they are reliable and documented
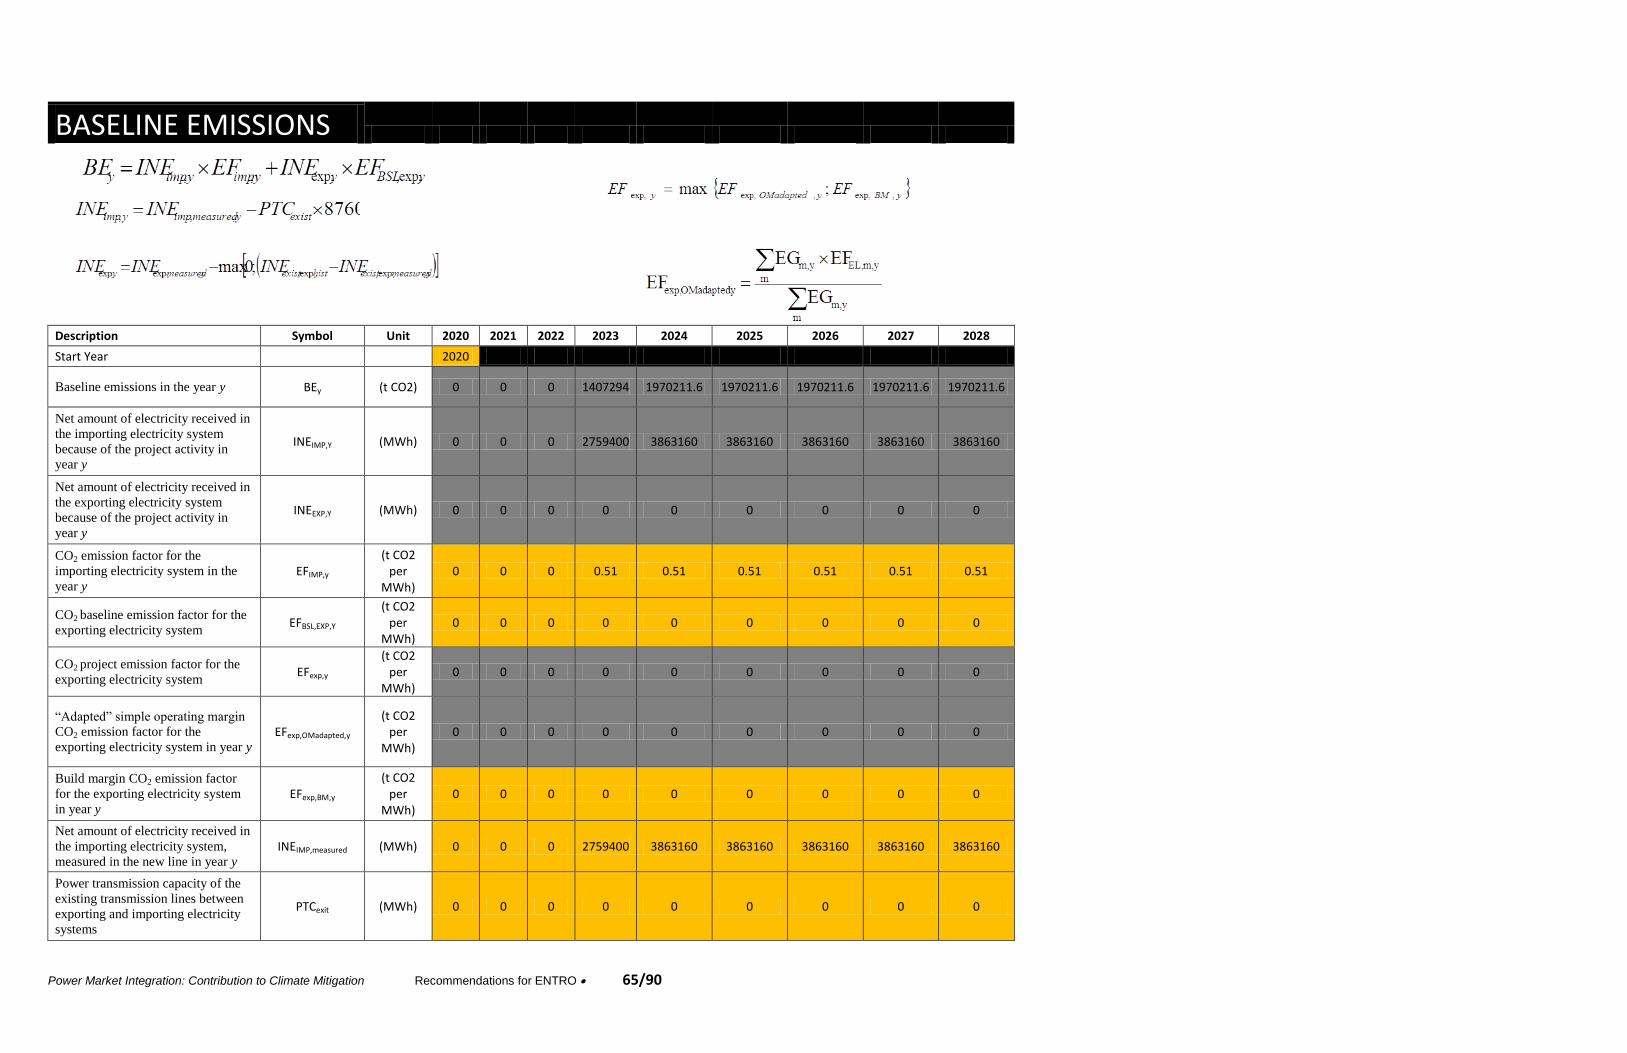
Power Market Integration: Contribution to Climate Mitigation Recommendations for ENTRO 65/90
BASELINE EMISSIONS
Description Symbol Unit 2020 2021 2022 2023 2024 2025 2026 2027 2028
Start Year
2020
Baseline emissions in the year y BEy (t CO2) 0 0 0 1407294 1970211.6 1970211.6 1970211.6 1970211.6 1970211.6
Net amount of electricity received in
the importing electricity system
because of the project activity in
year y
INEIMP,Y (MWh) 0 0 0 2759400 3863160 3863160 3863160 3863160 3863160
Net amount of electricity received in
the exporting electricity system
because of the project activity in
year y
INEEXP,Y (MWh) 0 0 0 0 0 0 0 0 0
CO2 emission factor for the
importing electricity system in the
year y
EFIMP,y (t CO2
per MWh)
0 0 0 0.51 0.51 0.51 0.51 0.51 0.51
CO2 baseline emission factor for the
exporting electricity system EFBSL,EXP,Y
(t CO2 per
MWh) 0 0 0 0 0 0 0 0 0
CO2 project emission factor for the
exporting electricity system EFexp,y
(t CO2 per
MWh) 0 0 0 0 0 0 0 0 0
“Adapted” simple operating margin
CO2 emission factor for the
exporting electricity system in year y
EFexp,OMadapted,y (t CO2
per MWh)
0 0 0 0 0 0 0 0 0
Build margin CO2 emission factor
for the exporting electricity system
in year y
EFexp,BM,y (t CO2
per MWh)
0 0 0 0 0 0 0 0 0
Net amount of electricity received in
the importing electricity system,
measured in the new line in year y
INEIMP,measured (MWh) 0 0 0 2759400 3863160 3863160 3863160 3863160 3863160
Power transmission capacity of the
existing transmission lines between
exporting and importing electricity
systems
PTCexit (MWh) 0 0 0 0 0 0 0 0 0

Power Market Integration: Contribution to Climate Mitigation Recommendations for ENTRO 66/90
Net amount of electricity received in
the exporting electricity system,
measured in the new line in year y
INEexp,measured, y (MWh) 0 0 0 0 0 0 0 0 0
Historical net amount of electricity
received in the exporting electricity
system from the importing electricity
system in the existing lines
INEexist,exp,hist (MWh) 0 0 0 0 0 0 0 0 0
Net amount of electricity received in
the exporting electricity system from
the importing electricity system,
measured in the existing lines in year
y
INEexist,exp,measured,
y (MWh) 0 0 0 0 0 0 0 0 0
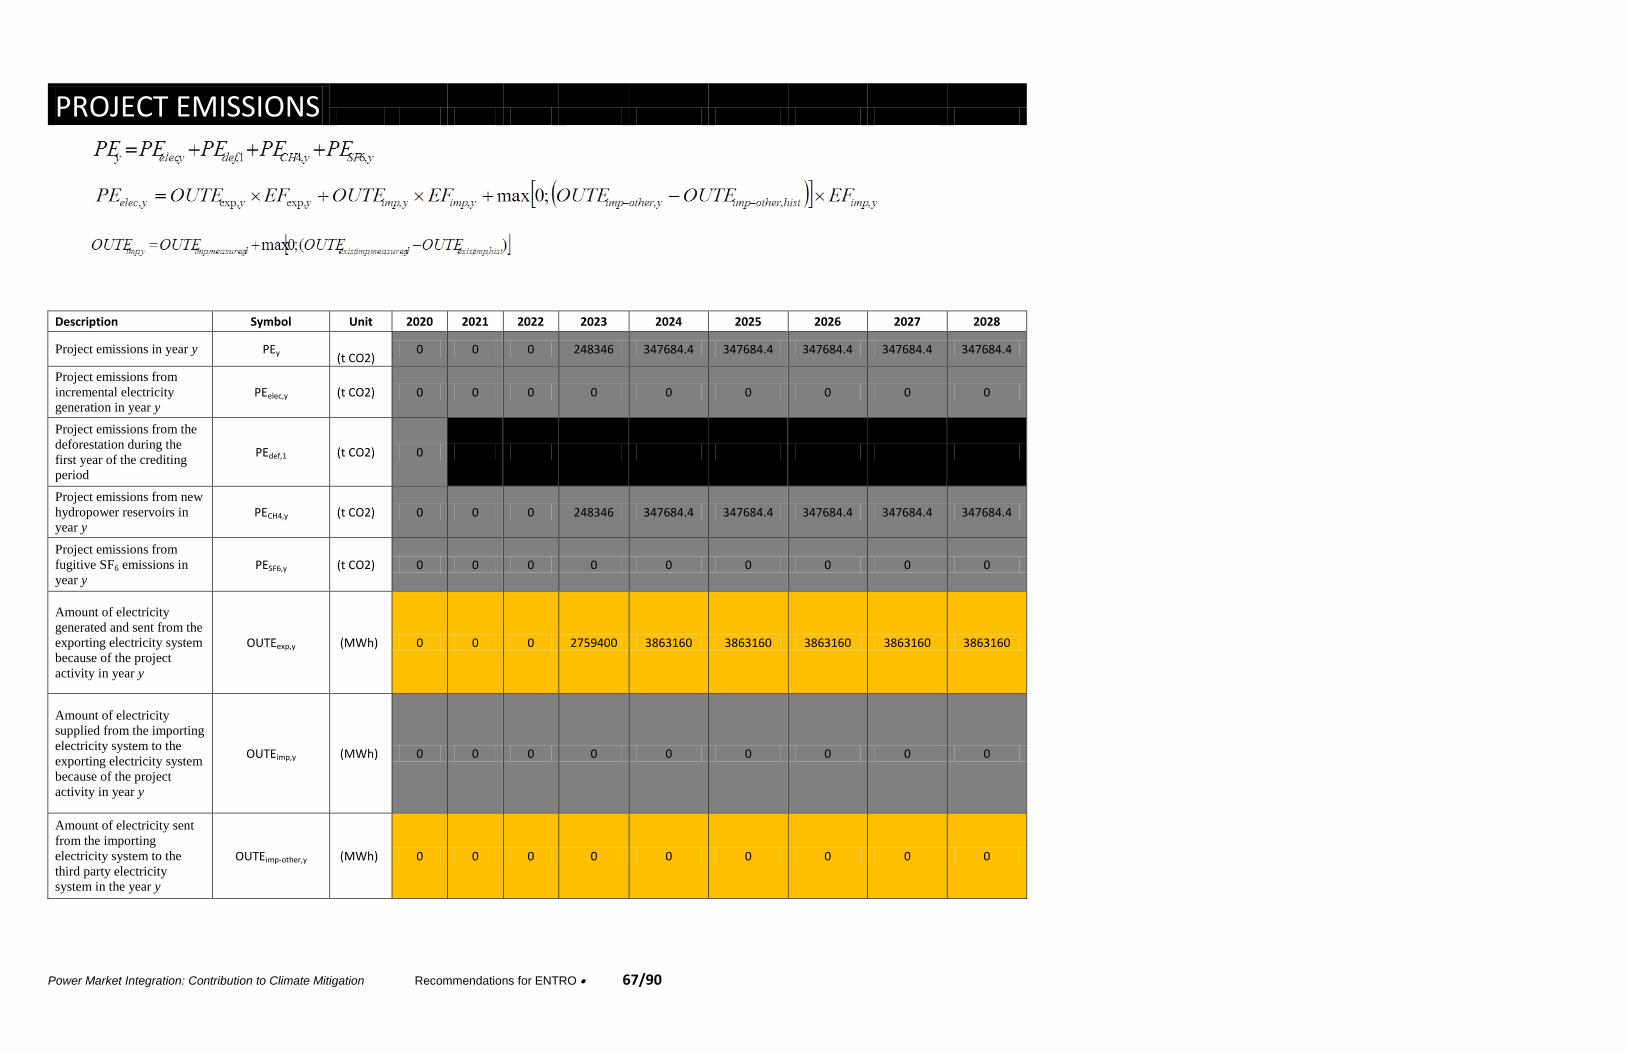
Power Market Integration: Contribution to Climate Mitigation Recommendations for ENTRO 67/90
PROJECT EMISSIONS
Description Symbol Unit 2020 2021 2022 2023 2024 2025 2026 2027 2028
Project emissions in year y PEy (t CO2)
0 0 0 248346 347684.4 347684.4 347684.4 347684.4 347684.4
Project emissions from
incremental electricity
generation in year y PEelec,y (t CO2) 0 0 0 0 0 0 0 0 0
Project emissions from the
deforestation during the
first year of the crediting
period
PEdef,1 (t CO2) 0 x x x x x x x x
Project emissions from new
hydropower reservoirs in
year y PECH4,y (t CO2) 0 0 0 248346 347684.4 347684.4 347684.4 347684.4 347684.4
Project emissions from
fugitive SF6 emissions in
year y
PESF6,y (t CO2) 0 0 0 0 0 0 0 0 0
Amount of electricity
generated and sent from the
exporting electricity system
because of the project
activity in year y
OUTEexp,y (MWh) 0 0 0 2759400 3863160 3863160 3863160 3863160 3863160
Amount of electricity
supplied from the importing
electricity system to the
exporting electricity system
because of the project
activity in year y
OUTEimp,y (MWh) 0 0 0 0 0 0 0 0 0
Amount of electricity sent
from the importing
electricity system to the
third party electricity
system in the year y
OUTEimp-other,y (MWh) 0 0 0 0 0 0 0 0 0
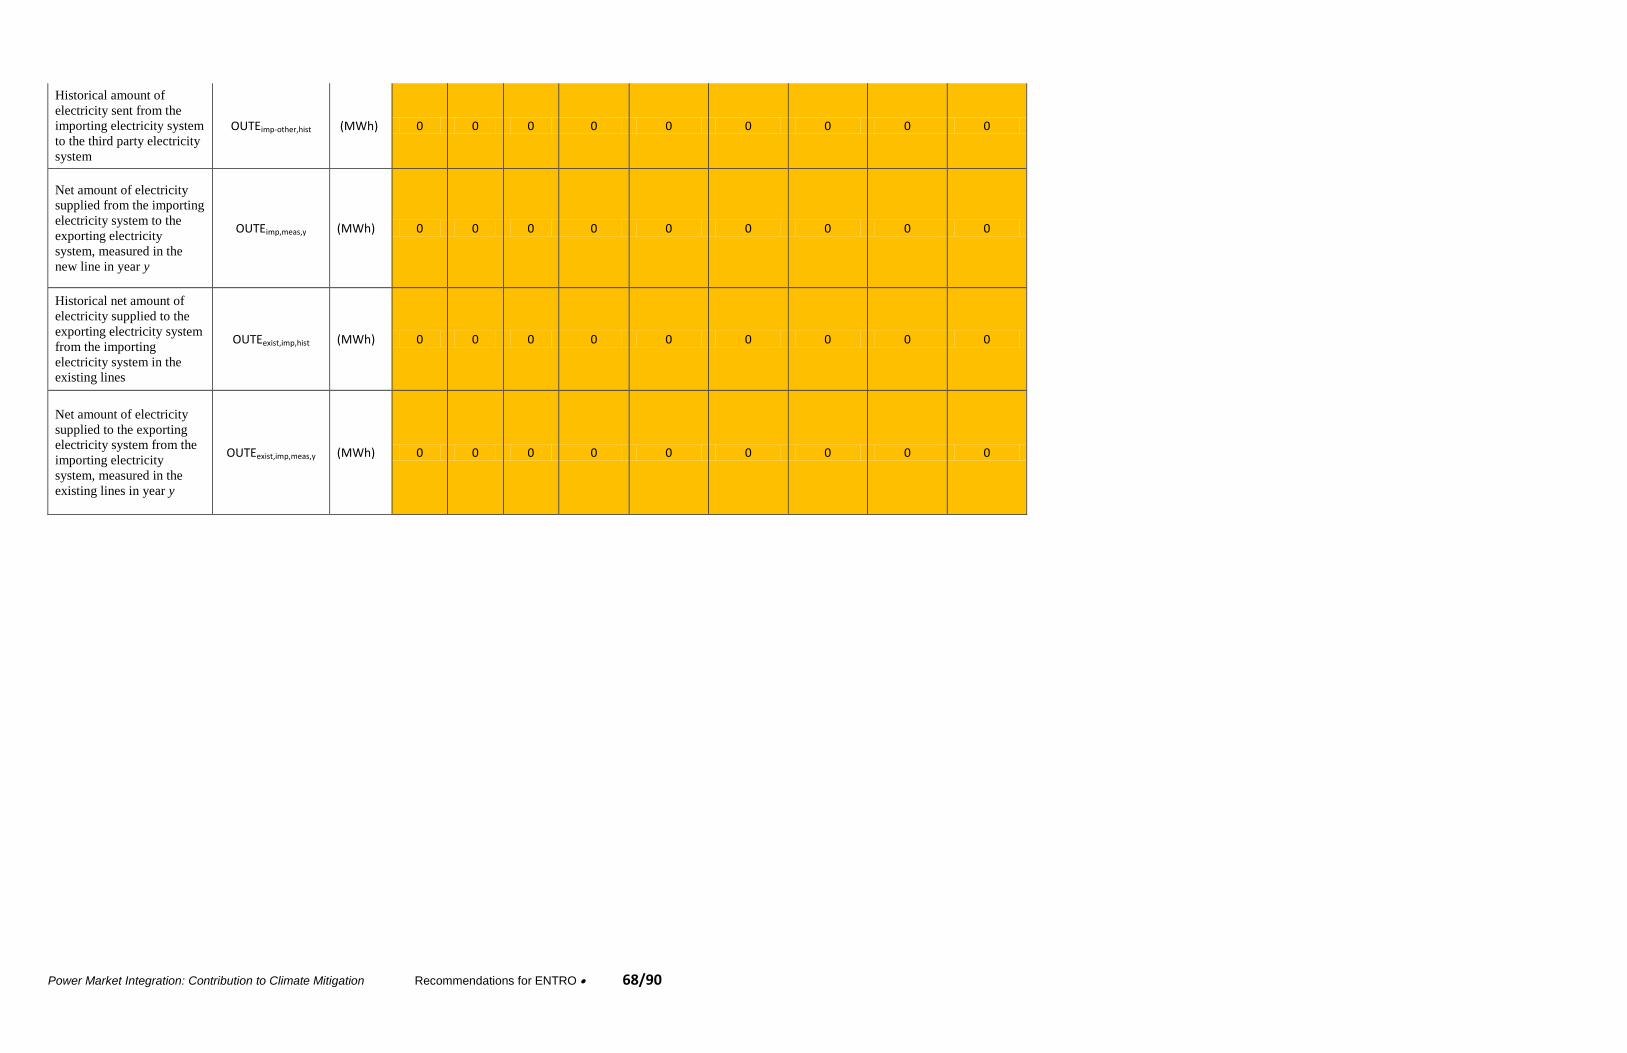
Power Market Integration: Contribution to Climate Mitigation Recommendations for ENTRO 68/90
Historical amount of
electricity sent from the
importing electricity system
to the third party electricity
system
OUTEimp-other,hist (MWh) 0 0 0 0 0 0 0 0 0
Net amount of electricity
supplied from the importing
electricity system to the
exporting electricity
system, measured in the
new line in year y
OUTEimp,meas,y (MWh) 0 0 0 0 0 0 0 0 0
Historical net amount of
electricity supplied to the
exporting electricity system
from the importing
electricity system in the
existing lines
OUTEexist,imp,hist (MWh) 0 0 0 0 0 0 0 0 0
Net amount of electricity
supplied to the exporting
electricity system from the
importing electricity
system, measured in the
existing lines in year y
OUTEexist,imp,meas,y (MWh) 0 0 0 0 0 0 0 0 0
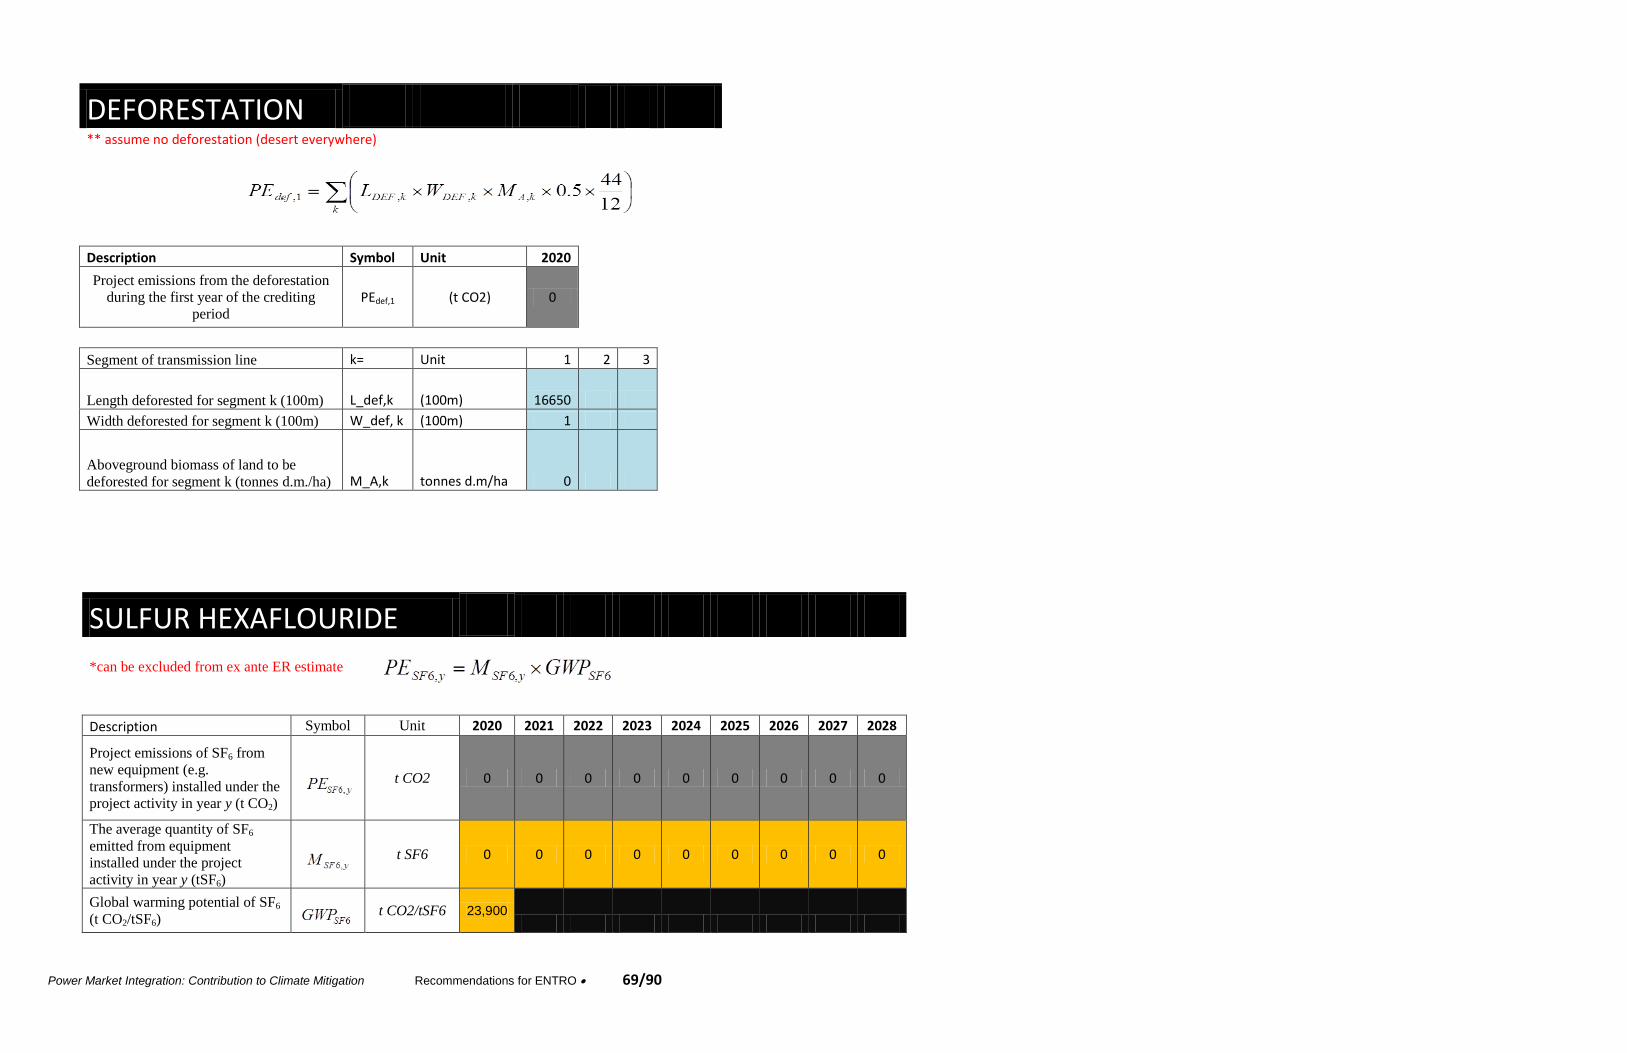
Power Market Integration: Contribution to Climate Mitigation Recommendations for ENTRO 69/90
DEFORESTATION
** assume no deforestation (desert everywhere)
Description Symbol Unit 2020
Project emissions from the deforestation
during the first year of the crediting
period
PEdef,1 (t CO2) 0
Segment of transmission line k= Unit 1 2 3
Length deforested for segment k (100m) L_def,k (100m) 16650
Width deforested for segment k (100m) W_def, k (100m) 1
Aboveground biomass of land to be
deforested for segment k (tonnes d.m./ha) M_A,k tonnes d.m/ha 0
SULFUR HEXAFLOURIDE
*can be excluded from ex ante ER estimate
Description Symbol Unit 2020 2021 2022 2023 2024 2025 2026 2027 2028
Project emissions of SF6 from
new equipment (e.g.
transformers) installed under the
project activity in year y (t CO2)
t CO2 0 0 0 0 0 0 0 0 0
The average quantity of SF6
emitted from equipment
installed under the project
activity in year y (tSF6)
t SF6 0 0 0 0 0 0 0 0 0
Global warming potential of SF6
(t CO2/tSF6)
t CO2/tSF6 23,900
Power Market Integration: Contribution to Climate Mitigation Recommendations for ENTRO 70/90
* GWP: Intergovernmental Panel on Climate Change, Working Group 1, Climate Change 2007, Chapter 2.10.2.
Project participants shall update GWPs according to any decisions by the CMP. For the first commitment period GWPSF6=23,900
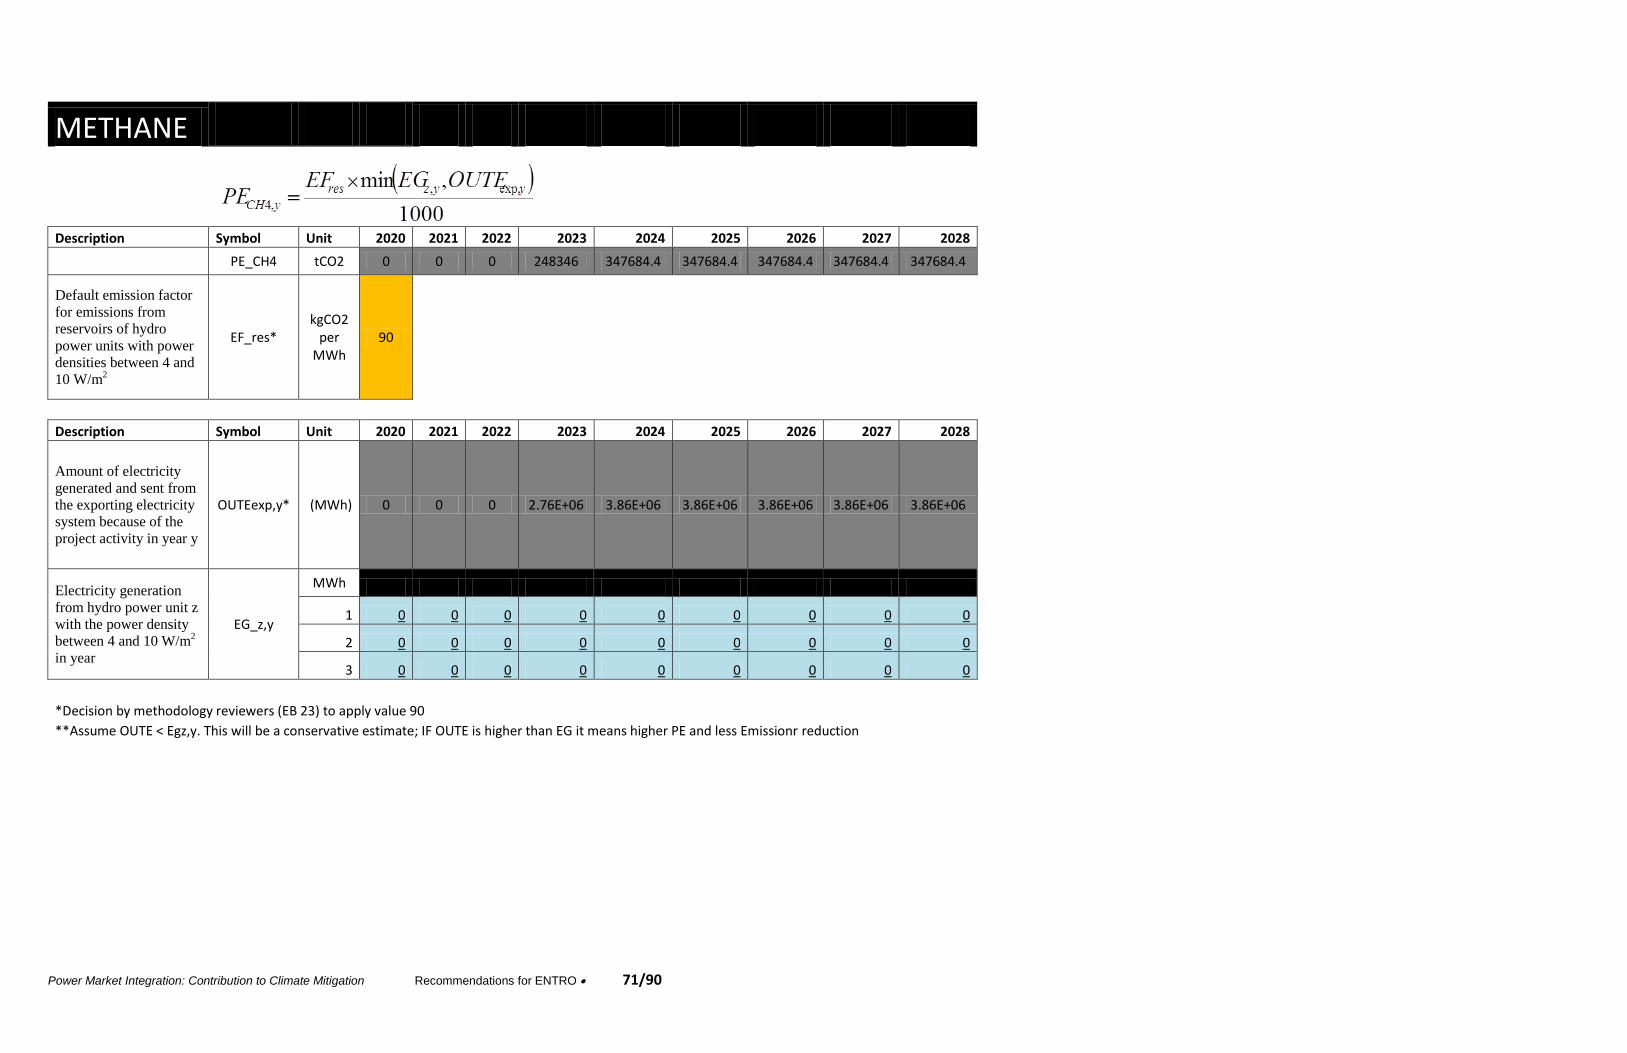
Power Market Integration: Contribution to Climate Mitigation Recommendations for ENTRO 71/90
METHANE
Description Symbol Unit 2020 2021 2022 2023 2024 2025 2026 2027 2028
PE_CH4 tCO2 0 0 0 248346 347684.4 347684.4 347684.4 347684.4 347684.4
Default emission factor
for emissions from
reservoirs of hydro
power units with power
densities between 4 and
10 W/m2
EF_res* kgCO2
per MWh
90
Description Symbol Unit 2020 2021 2022 2023 2024 2025 2026 2027 2028
Amount of electricity
generated and sent from
the exporting electricity
system because of the
project activity in year y
OUTEexp,y* (MWh) 0 0 0 2.76E+06 3.86E+06 3.86E+06 3.86E+06 3.86E+06 3.86E+06
Electricity generation
from hydro power unit z
with the power density
between 4 and 10 W/m2
in year
EG_z,y
MWh
1 0 0 0 0 0 0 0 0 0
2 0 0 0 0 0 0 0 0 0
3 0 0 0 0 0 0 0 0 0
*Decision by methodology reviewers (EB 23) to apply value 90 **Assume OUTE < Egz,y. This will be a conservative estimate; IF OUTE is higher than EG it means higher PE and less Emissionr reduction
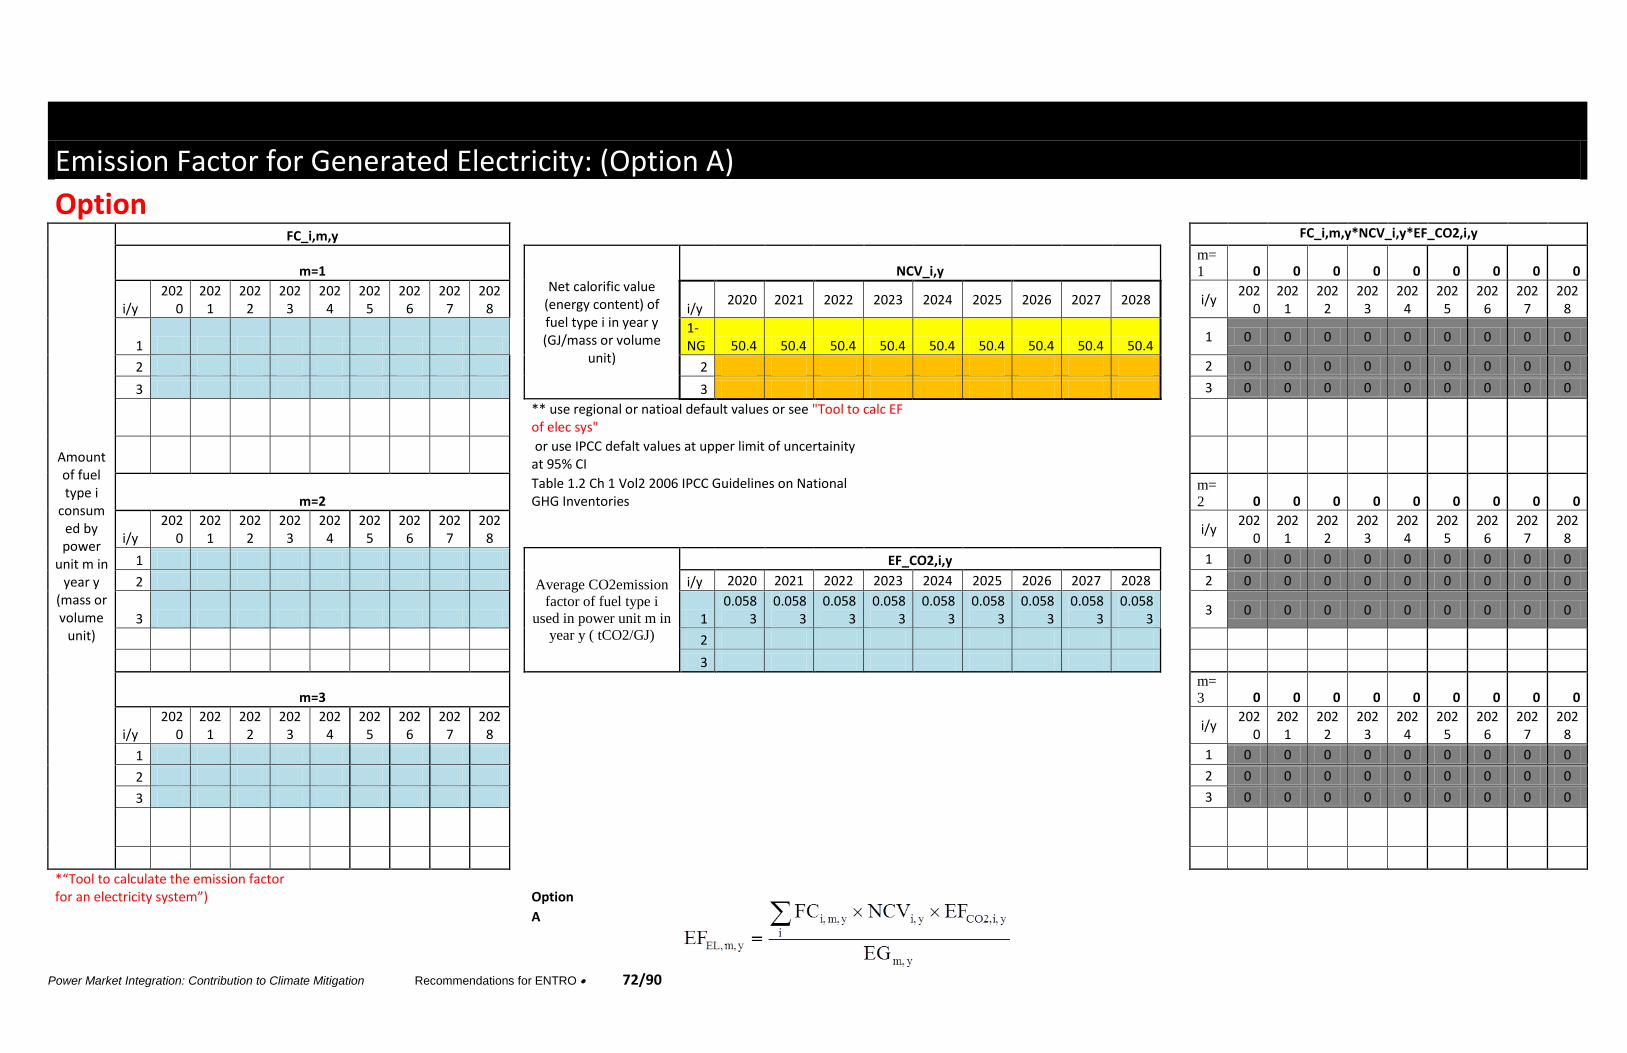
Power Market Integration: Contribution to Climate Mitigation Recommendations for ENTRO 72/90
Emission Factor for Generated Electricity: (Option A)
Option
Amount of fuel type i
consumed by power
unit m in year y
(mass or volume
unit)
FC_i,m,y
FC_i,m,y*NCV_i,y*EF_CO2,i,y
m=1 Net calorific value
(energy content) of fuel type i in year y (GJ/mass or volume
unit)
NCV_i,y
m=
1 0 0 0 0 0 0 0 0 0
i/y 202
0 202
1 202
2 202
3 202
4 202
5 202
6 202
7 202
8
i/y 2020 2021 2022 2023 2024 2025 2026 2027 2028
i/y 202
0 202
1 202
2 202
3 202
4 202
5 202
6 202
7 202
8
1
1- NG 50.4 50.4 50.4 50.4 50.4 50.4 50.4 50.4 50.4
1 0 0 0 0 0 0 0 0 0
2
2
2 0 0 0 0 0 0 0 0 0
3
3
3 0 0 0 0 0 0 0 0 0
** use regional or natioal default values or see "Tool to calc EF of elec sys"
or use IPCC defalt values at upper limit of uncertainity at 95% CI
m=2
Table 1.2 Ch 1 Vol2 2006 IPCC Guidelines on National GHG Inventories
m=
2 0 0 0 0 0 0 0 0 0
i/y 202
0 202
1 202
2 202
3 202
4 202
5 202
6 202
7 202
8
i/y 202
0 202
1 202
2 202
3 202
4 202
5 202
6 202
7 202
8
1 Average CO2emission
factor of fuel type i
used in power unit m in
year y ( tCO2/GJ)
EF_CO2,i,y
1 0 0 0 0 0 0 0 0 0
2
i/y 2020 2021 2022 2023 2024 2025 2026 2027 2028
2 0 0 0 0 0 0 0 0 0
3
1 0.058
3 0.058
3 0.058
3 0.058
3 0.058
3 0.058
3 0.058
3 0.058
3 0.058
3
3 0 0 0 0 0 0 0 0 0
2
3
m=3
m=
3 0 0 0 0 0 0 0 0 0
i/y 202
0 202
1 202
2 202
3 202
4 202
5 202
6 202
7 202
8
i/y 202
0 202
1 202
2 202
3 202
4 202
5 202
6 202
7 202
8
1
1 0 0 0 0 0 0 0 0 0
2
2 0 0 0 0 0 0 0 0 0
3
3 0 0 0 0 0 0 0 0 0
*“Tool to calculate the emission factor for an electricity system”)
Option
A
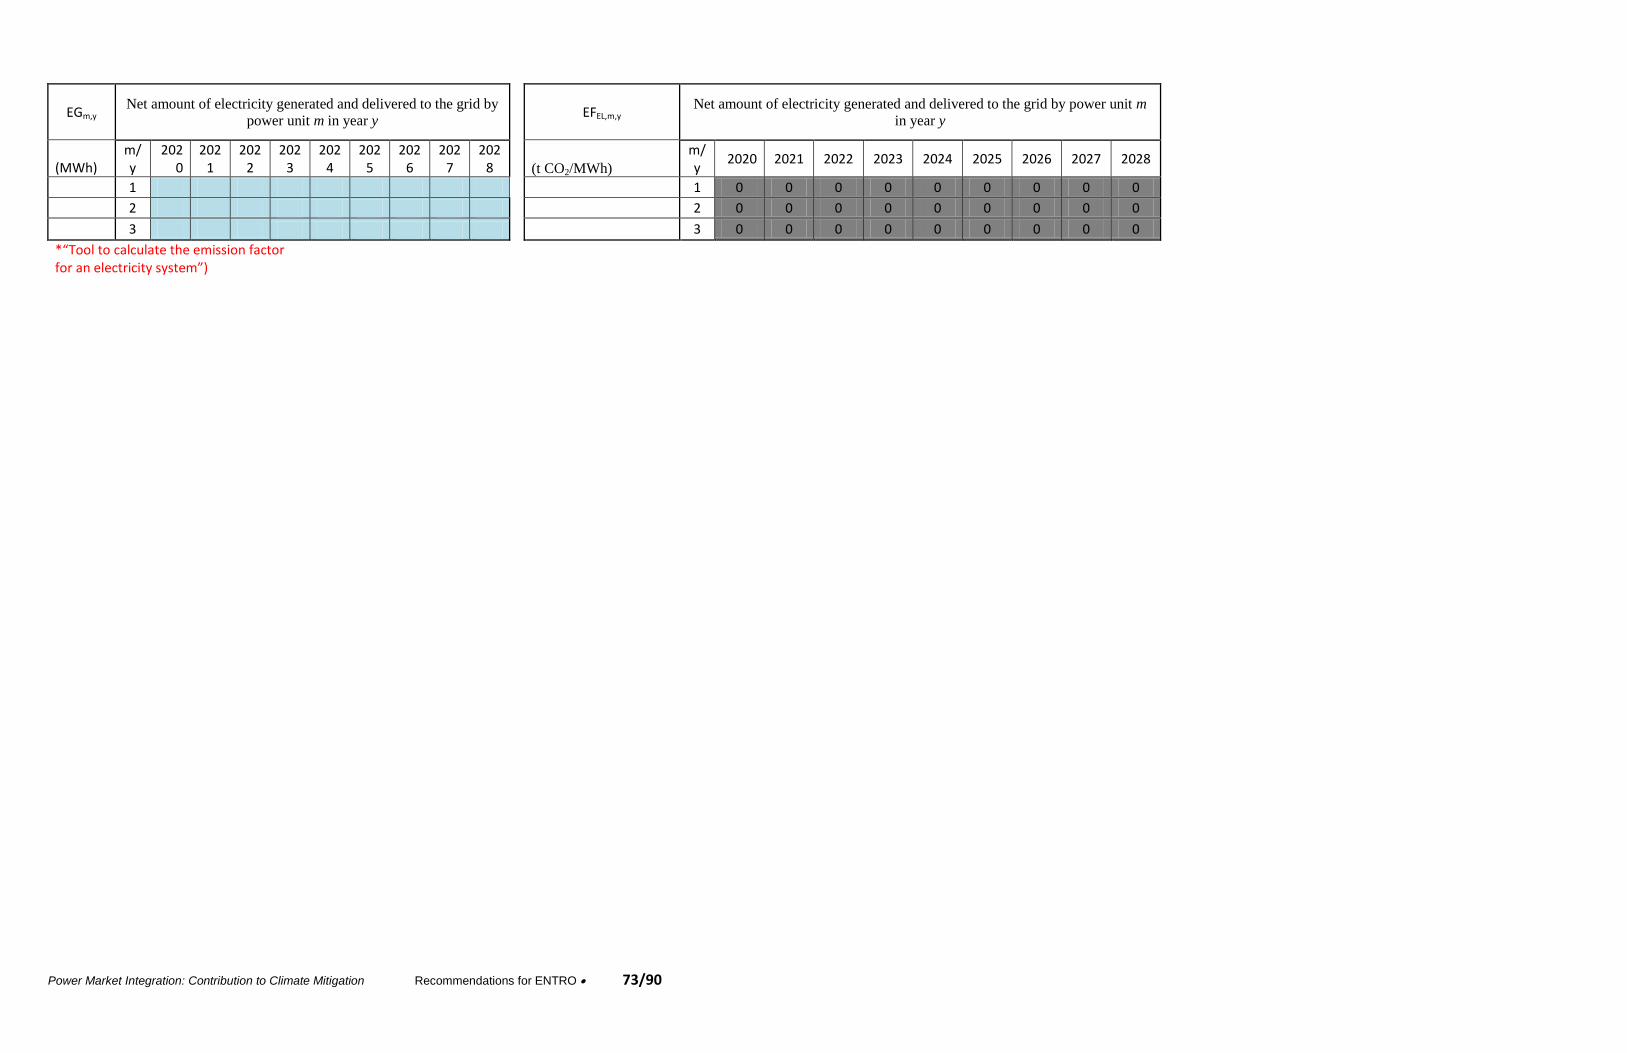
Power Market Integration: Contribution to Climate Mitigation Recommendations for ENTRO 73/90
EGm,y Net amount of electricity generated and delivered to the grid by
power unit m in year y
EFEL,m,y Net amount of electricity generated and delivered to the grid by power unit m
in year y
(MWh) m/y
2020
2021
2022
2023
2024
2025
2026
2027
2028
(t CO2/MWh)
m/y
2020 2021 2022 2023 2024 2025 2026 2027 2028
1
1 0 0 0 0 0 0 0 0 0
2
2 0 0 0 0 0 0 0 0 0
3
3 0 0 0 0 0 0 0 0 0
*“Tool to calculate the emission factor for an electricity system”)

Power Market Integration: Contribution to Climate Mitigation Recommendations for ENTRO 74/90
Emission Factor for Generated Electricity: (Option B)
Option B
Average
CO2emission
factor of fuel type
i used in power
unit m in year y (
tCO2/GJ)
EF_CO2,m,i,y n_m,y
m=1
0.000 0.075 0.075 0.000 0.000 0.000 0.000 0.000 0.000
Average net energy
conversion efficiency
of power unit m in year
y (%)
m/y
2020 2021 2022 2023 2024 2025 2026 2027 2028
i/y 2020 2021 2022 2023 2024 2025 2026 2027 2028
1 0 0.4 0.4 0 0 0 0 0 0
1-NG 0 0.0748 0.0748 0 0 0 0 0 0
0 0 0 0.6 0.6 0 0 0 0
2 3
3
Use either:
• Documented manufacturer’s specifications or
• Data from the utility, the dispatch center or official records if it can be deemed reliable; or
m=2 0 0 0 0.0583 0.0583 0.0583 0.0583 0.0583 0.0583
• The default values provided in the table in Annex 1 of the “Tool to calc EF for elec sys"
i/y 2020 2021 2022 2023 2024 2025 2026 2027 2028
1 0 0 0 0.0583 0.0583 0.0583 0.0583 0.0583 0.0583
2
3
Option
B
m=3 0 0 0 0 0 0 0 0 0
EFEL,m,y
i/y 2020 2021 2022 2023 2024 2025 2026 2027 2028 Net amount of
electricity generated
and delivered to the
grid by power unit m in
year y ((t CO2/MWh))
m/y 2020 2021 2022 2023 2024 2025 2026 2027 2028
1
1 0 0.6732 0.6732 0 0 0 0 0 0
2
2 0 0 0 0.3498 0.3498 0 0 0 0
3
3 0 0 0 0 0 0 0 0 0
** use natioanla or regional defulat values
use the fuel type with the highest CO2 emission factor for EFCO2,m,i,y.
or use IPCC defalt values at upper limit of uncertainity at 95% CI Table 1.4 chap 1 vol2 of 2006 IPCC Guidelines on National GHG inventories
** See Tool to calc EF for elec syst

Power Market Integration: Contribution to Climate Mitigation Recommendations for ENTRO 75/90
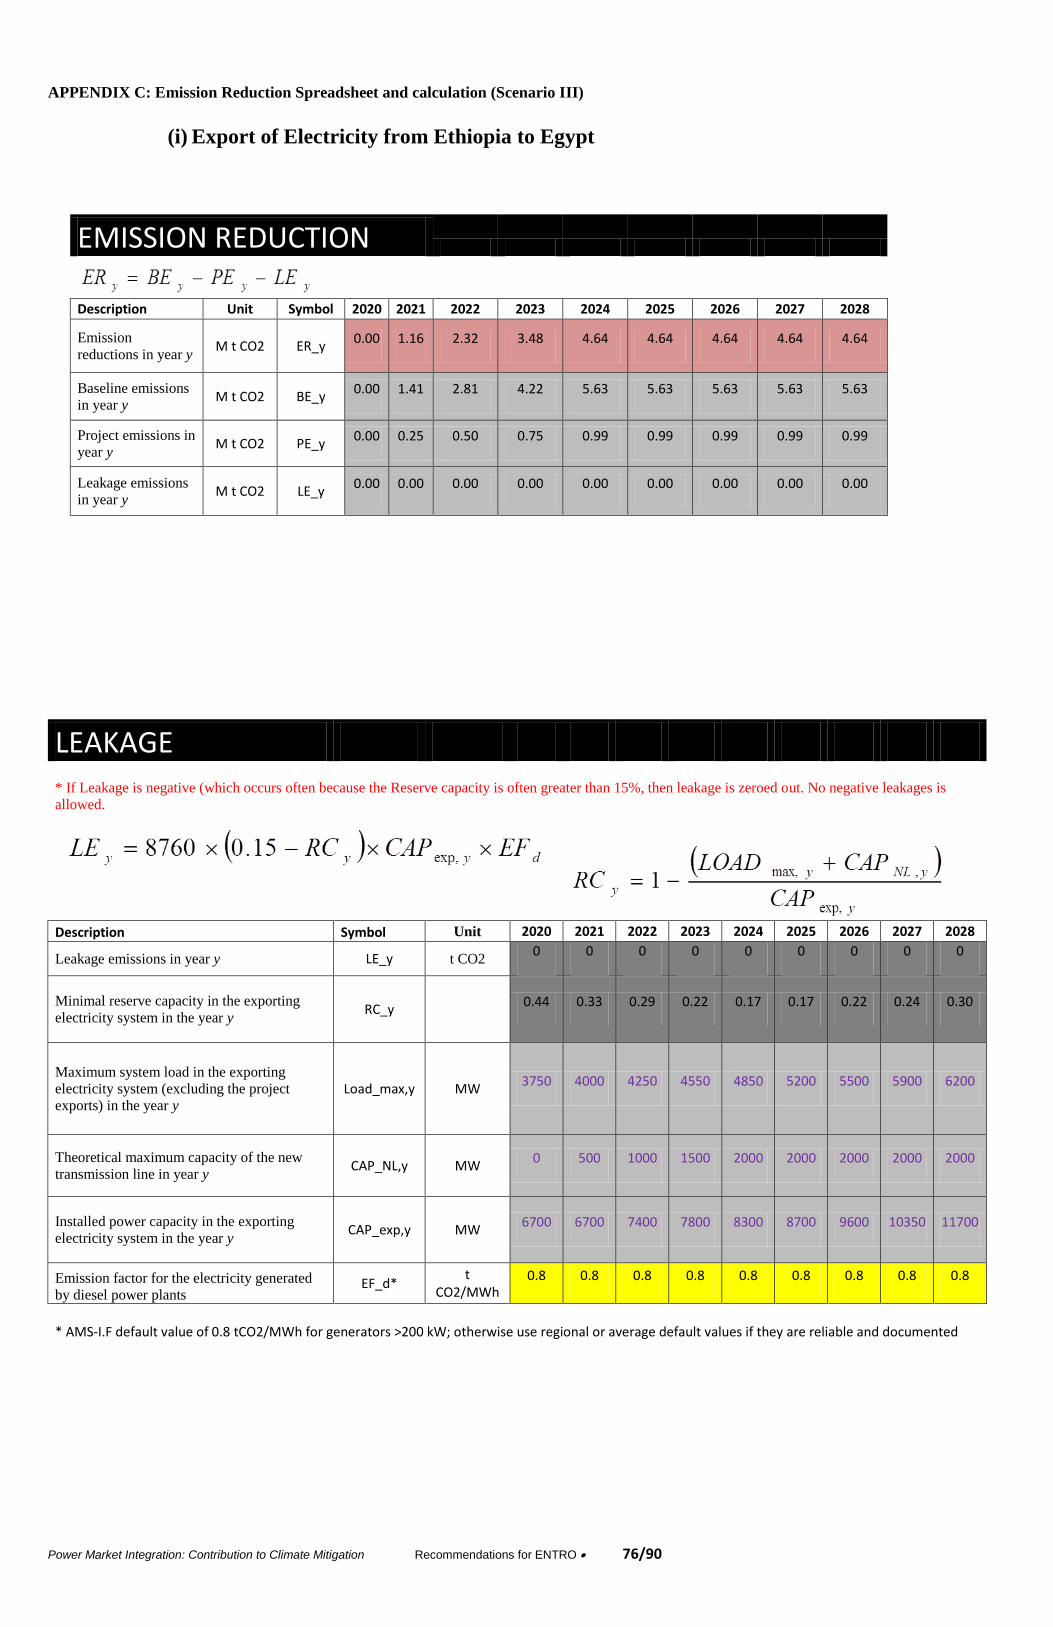
Power Market Integration: Contribution to Climate Mitigation Recommendations for ENTRO 76/90
APPENDIX C: Emission Reduction Spreadsheet and calculation (Scenario III)
(i) Export of Electricity from Ethiopia to Egypt
EMISSION REDUCTION
Description Unit Symbol 2020 2021 2022 2023 2024 2025 2026 2027 2028
Emission
reductions in year y M t CO2 ER_y
0.00 1.16 2.32 3.48 4.64 4.64 4.64 4.64 4.64
Baseline emissions
in year y M t CO2 BE_y
0.00 1.41 2.81 4.22 5.63 5.63 5.63 5.63 5.63
Project emissions in
year y M t CO2 PE_y
0.00 0.25 0.50 0.75 0.99 0.99 0.99 0.99 0.99
Leakage emissions
in year y M t CO2 LE_y
0.00 0.00 0.00 0.00 0.00 0.00 0.00 0.00 0.00
LEAKAGE
* If Leakage is negative (which occurs often because the Reserve capacity is often greater than 15%, then leakage is zeroed out. No negative leakages is
allowed.
Description Symbol Unit 2020 2021 2022 2023 2024 2025 2026 2027 2028
Leakage emissions in year y LE_y t CO2 0 0 0 0 0 0 0 0 0
Minimal reserve capacity in the exporting
electricity system in the year y RC_y
0.44 0.33 0.29 0.22 0.17 0.17 0.22 0.24 0.30
Maximum system load in the exporting
electricity system (excluding the project
exports) in the year y
Load_max,y MW 3750 4000 4250 4550 4850 5200 5500 5900 6200
Theoretical maximum capacity of the new
transmission line in year y CAP_NL,y MW
0 500 1000 1500 2000 2000 2000 2000 2000
Installed power capacity in the exporting
electricity system in the year y CAP_exp,y MW
6700 6700 7400 7800 8300 8700 9600 10350 11700
Emission factor for the electricity generated
by diesel power plants EF_d*
t CO2/MWh
0.8 0.8 0.8 0.8 0.8 0.8 0.8 0.8 0.8
* AMS-I.F default value of 0.8 tCO2/MWh for generators >200 kW; otherwise use regional or average default values if they are reliable and documented
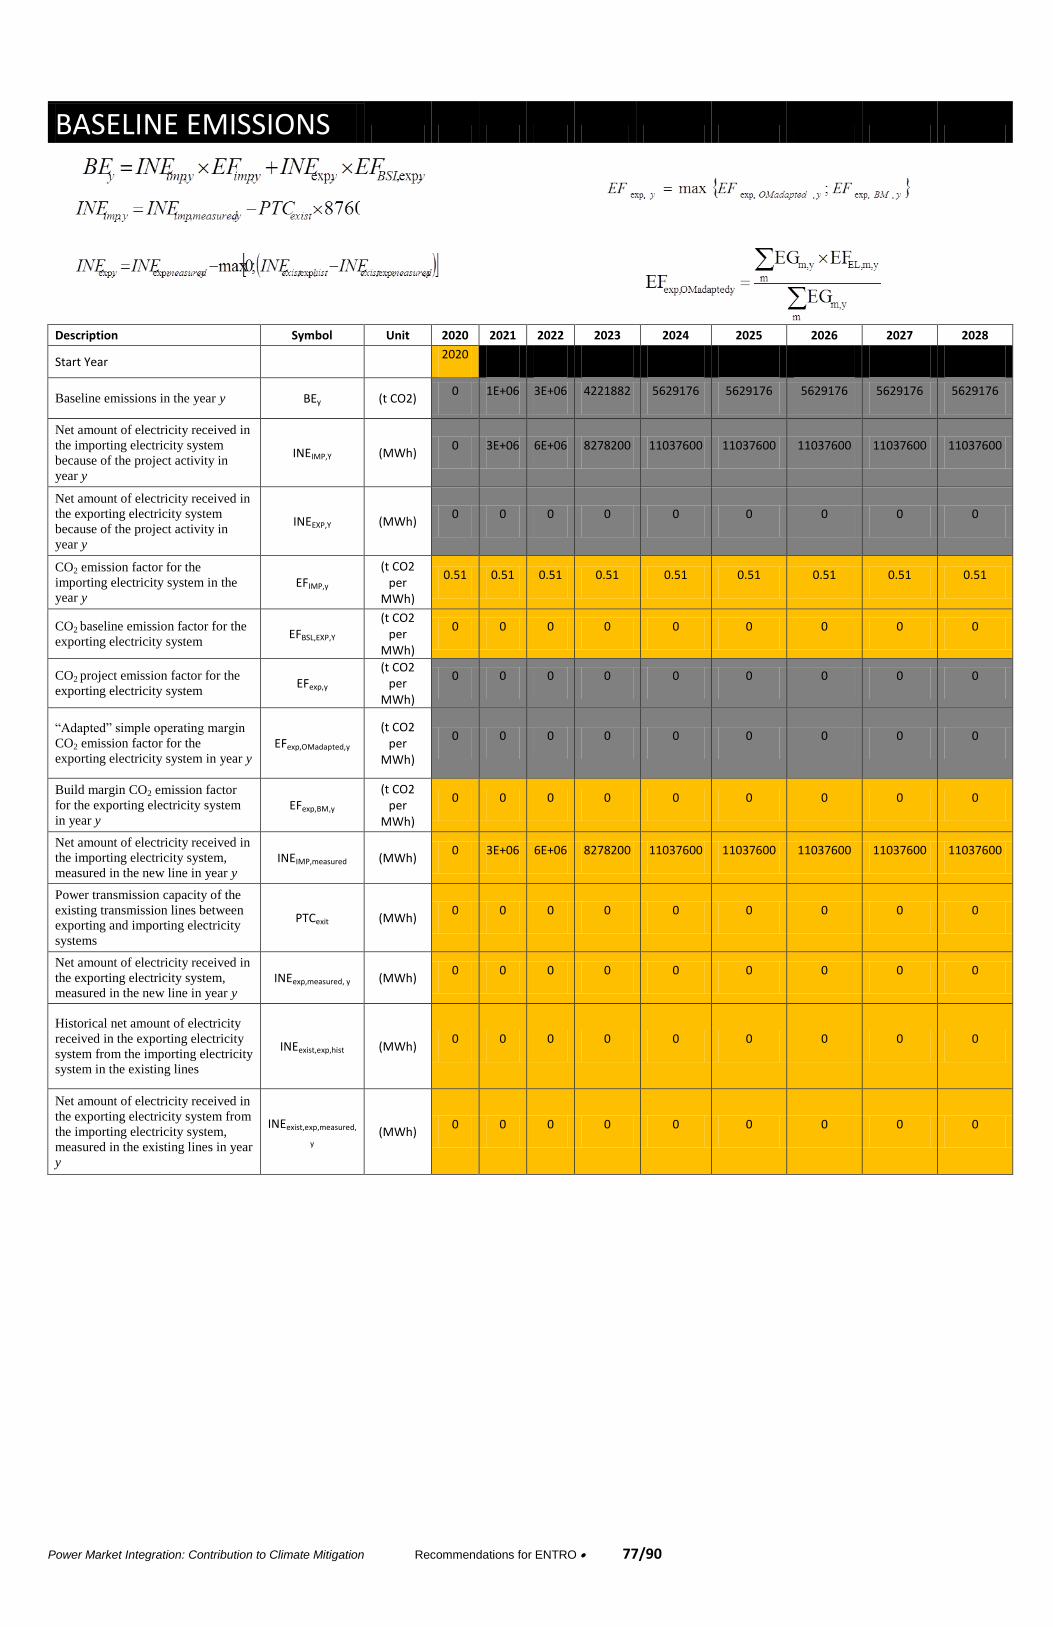
Power Market Integration: Contribution to Climate Mitigation Recommendations for ENTRO 77/90
BASELINE EMISSIONS
Description Symbol Unit 2020 2021 2022 2023 2024 2025 2026 2027 2028
Start Year
2020
Baseline emissions in the year y BEy (t CO2) 0 1E+06 3E+06 4221882 5629176 5629176 5629176 5629176 5629176
Net amount of electricity received in
the importing electricity system
because of the project activity in
year y
INEIMP,Y (MWh) 0 3E+06 6E+06 8278200 11037600 11037600 11037600 11037600 11037600
Net amount of electricity received in
the exporting electricity system
because of the project activity in
year y
INEEXP,Y (MWh) 0 0 0 0 0 0 0 0 0
CO2 emission factor for the
importing electricity system in the
year y EFIMP,y
(t CO2 per
MWh)
0.51 0.51 0.51 0.51 0.51 0.51 0.51 0.51 0.51
CO2 baseline emission factor for the
exporting electricity system EFBSL,EXP,Y
(t CO2 per
MWh)
0 0 0 0 0 0 0 0 0
CO2 project emission factor for the
exporting electricity system EFexp,y
(t CO2 per
MWh)
0 0 0 0 0 0 0 0 0
“Adapted” simple operating margin
CO2 emission factor for the
exporting electricity system in year y
EFexp,OMadapted,y (t CO2
per MWh)
0 0 0 0 0 0 0 0 0
Build margin CO2 emission factor
for the exporting electricity system
in year y
EFexp,BM,y (t CO2
per MWh)
0 0 0 0 0 0 0 0 0
Net amount of electricity received in
the importing electricity system,
measured in the new line in year y INEIMP,measured (MWh)
0 3E+06 6E+06 8278200 11037600 11037600 11037600 11037600 11037600
Power transmission capacity of the
existing transmission lines between
exporting and importing electricity
systems
PTCexit (MWh) 0 0 0 0 0 0 0 0 0
Net amount of electricity received in
the exporting electricity system,
measured in the new line in year y INEexp,measured, y (MWh)
0 0 0 0 0 0 0 0 0
Historical net amount of electricity
received in the exporting electricity
system from the importing electricity
system in the existing lines
INEexist,exp,hist (MWh) 0 0 0 0 0 0 0 0 0
Net amount of electricity received in
the exporting electricity system from
the importing electricity system,
measured in the existing lines in year
y
INEexist,exp,measured,
y (MWh)
0 0 0 0 0 0 0 0 0
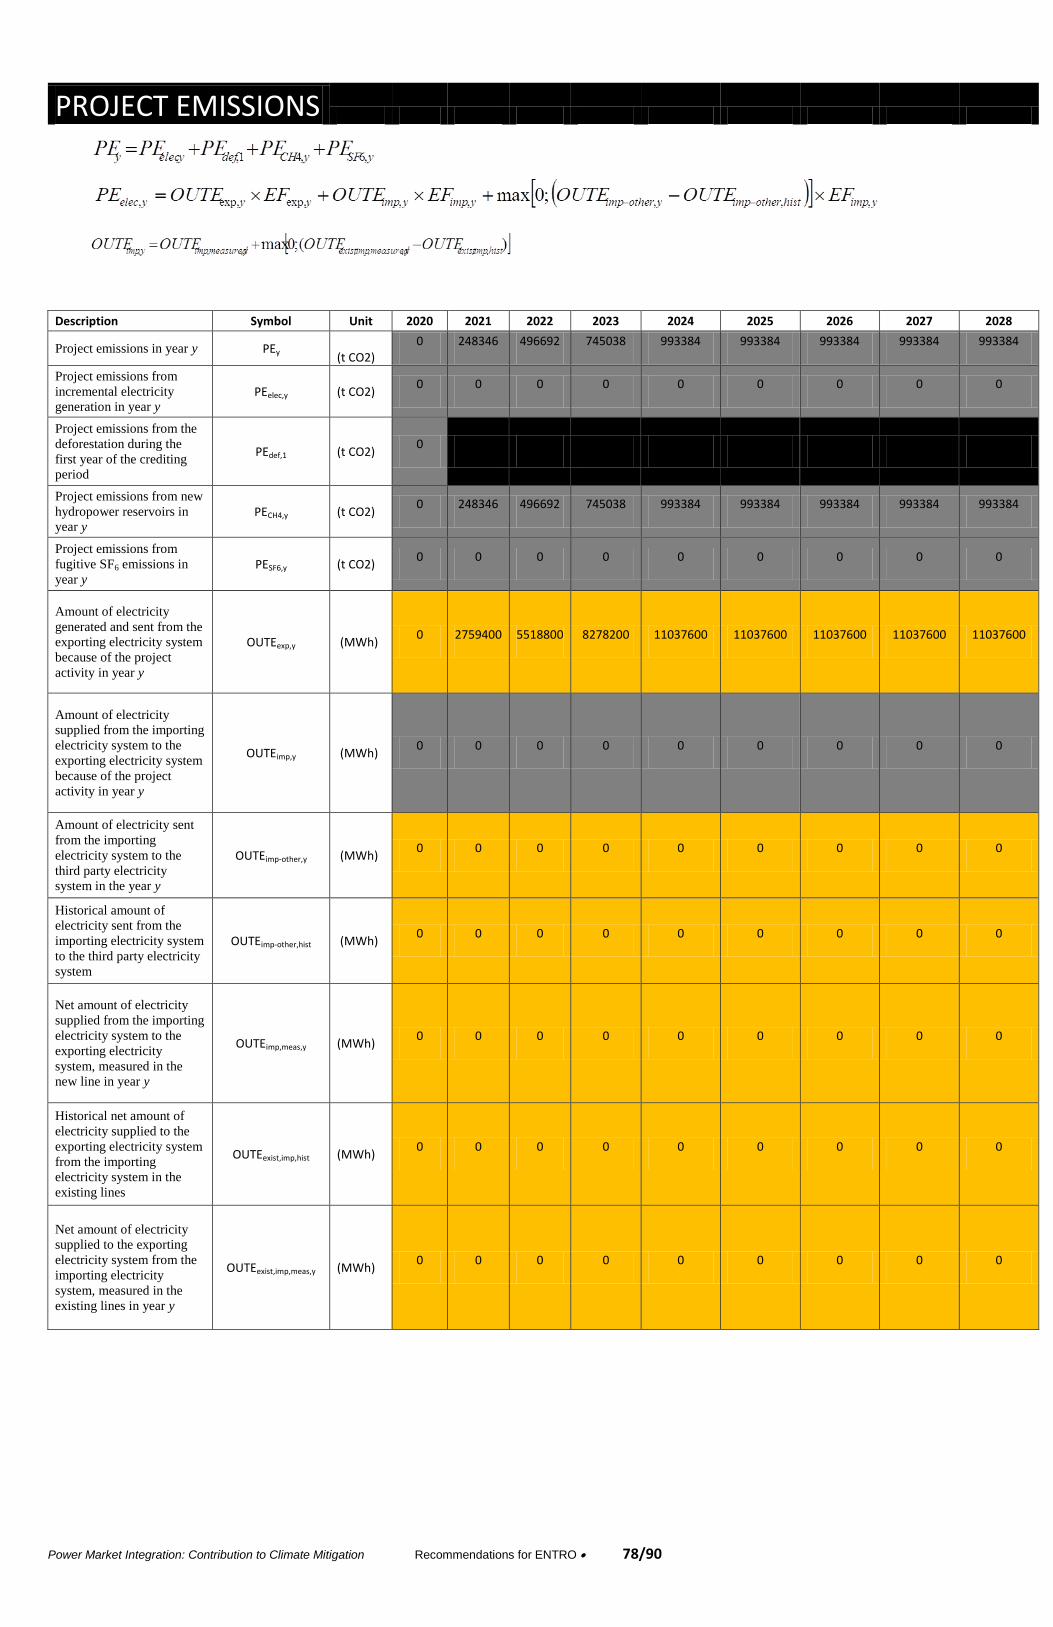
Power Market Integration: Contribution to Climate Mitigation Recommendations for ENTRO 78/90
PROJECT EMISSIONS
Description Symbol Unit 2020 2021 2022 2023 2024 2025 2026 2027 2028
Project emissions in year y PEy (t CO2)
0 248346 496692 745038 993384 993384 993384 993384 993384
Project emissions from
incremental electricity
generation in year y PEelec,y (t CO2)
0 0 0 0 0 0 0 0 0
Project emissions from the
deforestation during the
first year of the crediting
period
PEdef,1 (t CO2) 0 x x x x x x x x
Project emissions from new
hydropower reservoirs in
year y PECH4,y (t CO2)
0 248346 496692 745038 993384 993384 993384 993384 993384
Project emissions from
fugitive SF6 emissions in
year y
PESF6,y (t CO2) 0 0 0 0 0 0 0 0 0
Amount of electricity
generated and sent from the
exporting electricity system
because of the project
activity in year y
OUTEexp,y (MWh) 0 2759400 5518800 8278200 11037600 11037600 11037600 11037600 11037600
Amount of electricity
supplied from the importing
electricity system to the
exporting electricity system
because of the project
activity in year y
OUTEimp,y (MWh) 0 0 0 0 0 0 0 0 0
Amount of electricity sent
from the importing
electricity system to the
third party electricity
system in the year y
OUTEimp-other,y (MWh) 0 0 0 0 0 0 0 0 0
Historical amount of
electricity sent from the
importing electricity system
to the third party electricity
system
OUTEimp-other,hist (MWh) 0 0 0 0 0 0 0 0 0
Net amount of electricity
supplied from the importing
electricity system to the
exporting electricity
system, measured in the
new line in year y
OUTEimp,meas,y (MWh) 0 0 0 0 0 0 0 0 0
Historical net amount of
electricity supplied to the
exporting electricity system
from the importing
electricity system in the
existing lines
OUTEexist,imp,hist (MWh) 0 0 0 0 0 0 0 0 0
Net amount of electricity
supplied to the exporting
electricity system from the
importing electricity
system, measured in the
existing lines in year y
OUTEexist,imp,meas,y (MWh) 0 0 0 0 0 0 0 0 0
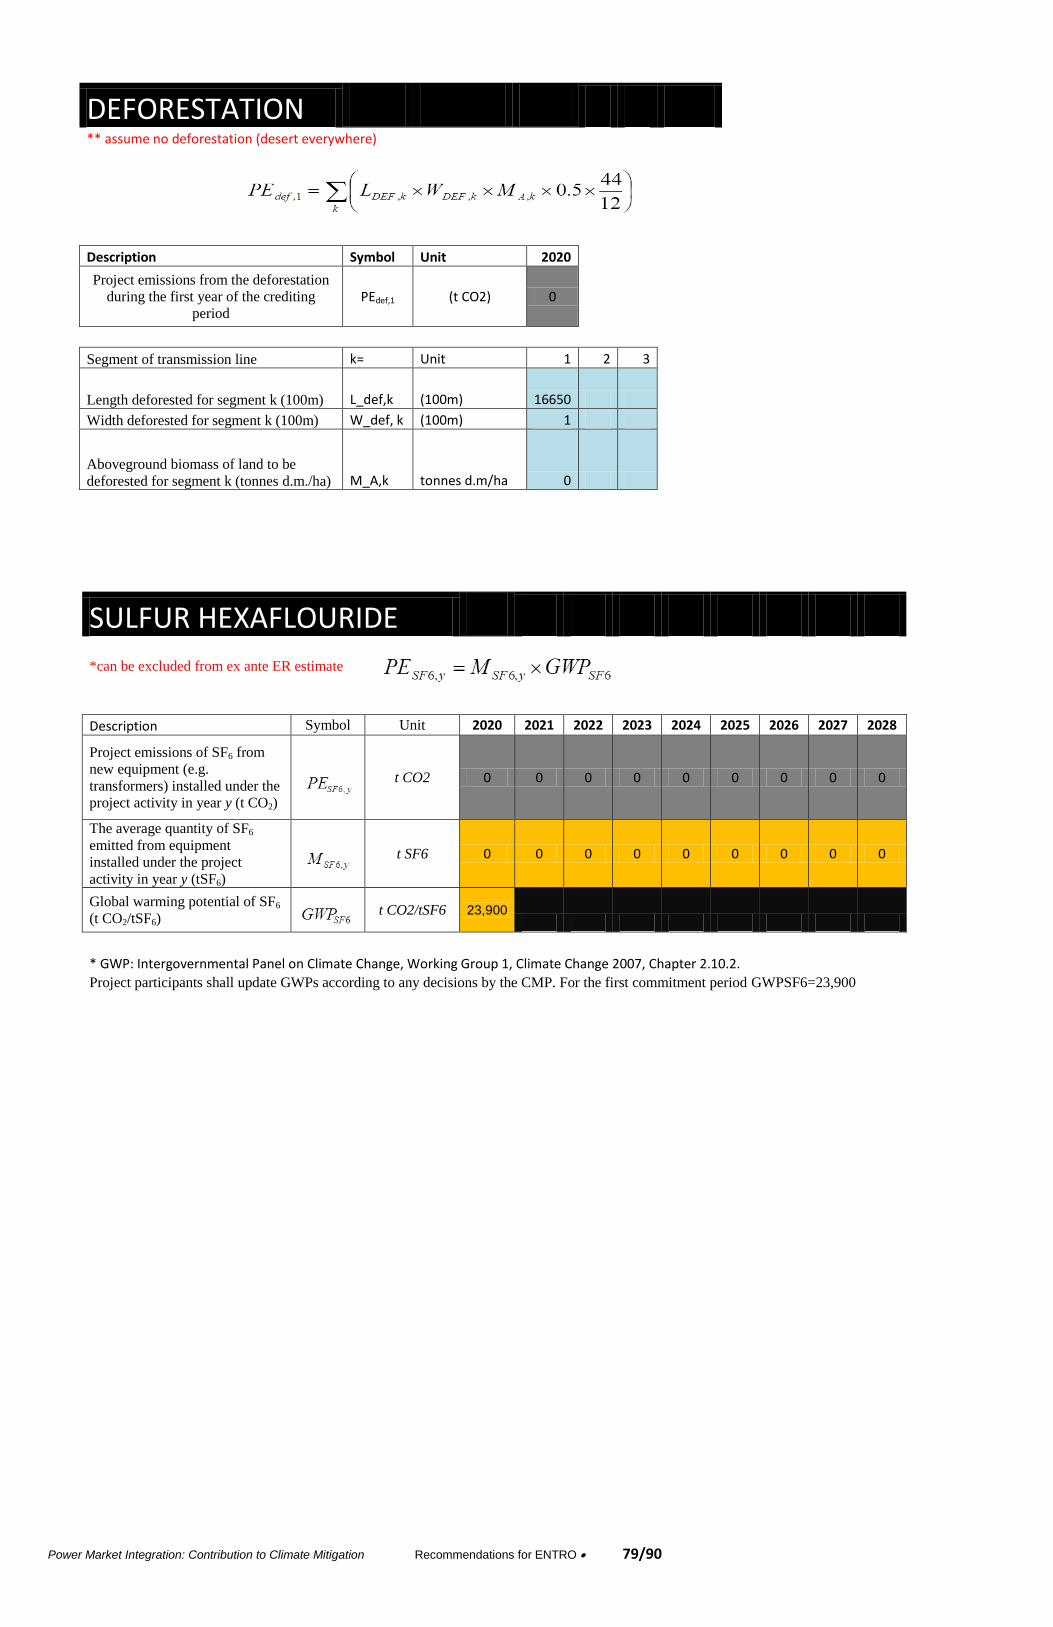
Power Market Integration: Contribution to Climate Mitigation Recommendations for ENTRO 79/90
DEFORESTATION
** assume no deforestation (desert everywhere)
Description Symbol Unit 2020
Project emissions from the deforestation
during the first year of the crediting
period
PEdef,1 (t CO2) 0
Segment of transmission line k= Unit 1 2 3
Length deforested for segment k (100m) L_def,k (100m) 16650
Width deforested for segment k (100m) W_def, k (100m) 1
Aboveground biomass of land to be
deforested for segment k (tonnes d.m./ha) M_A,k tonnes d.m/ha 0
SULFUR HEXAFLOURIDE
*can be excluded from ex ante ER estimate
Description Symbol Unit 2020 2021 2022 2023 2024 2025 2026 2027 2028
Project emissions of SF6 from
new equipment (e.g.
transformers) installed under the
project activity in year y (t CO2)
t CO2 0 0 0 0 0 0 0 0 0
The average quantity of SF6
emitted from equipment
installed under the project
activity in year y (tSF6)
t SF6 0 0 0 0 0 0 0 0 0
Global warming potential of SF6
(t CO2/tSF6)
t CO2/tSF6 23,900
* GWP: Intergovernmental Panel on Climate Change, Working Group 1, Climate Change 2007, Chapter 2.10.2.
Project participants shall update GWPs according to any decisions by the CMP. For the first commitment period GWPSF6=23,900

Power Market Integration: Contribution to Climate Mitigation Recommendations for ENTRO 80/90
METHANE
Description Symbol Unit 2020 2021 2022 2023 2024 2025 2026 2027 2028
PE_CH4 tCO2 0 0 0 248346 347684.4 347684.4 347684.4 347684.4 347684.4
Default emission factor
for emissions from
reservoirs of hydro
power units with power
densities between 4 and
10 W/m2
EF_res* kgCO2
per MWh
90
Description Symbol Unit 2020 2021 2022 2023 2024 2025 2026 2027 2028
Amount of electricity
generated and sent from
the exporting electricity
system because of the
project activity in year y
OUTEexp,y* (MWh) 0 0 0 2.76E+06 3.86E+06 3.86E+06 3.86E+06 3.86E+06 3.86E+06
Electricity generation
from hydro power unit z
with the power density
between 4 and 10 W/m2
in year
EG_z,y
MWh
1 0 0 0 0 0 0 0 0 0
2 0 0 0 0 0 0 0 0 0
3 0 0 0 0 0 0 0 0 0
*Decision by methodology reviewers (EB 23) to apply value 90 **Assume OUTE < Egz,y. This will be a conservative estimate; IF OUTE is higher than EG it means higher PE and less Emissionr reduction

Power Market Integration: Contribution to Climate Mitigation Recommendations for ENTRO 81/90
Emission Factor for Generated Electricity: (Option A)
Option
Amount of fuel type i
consumed
by po
wer unit m in
year y
(mass or volume
unit)
FC_i,m,y
FC_i,m,y*NCV_i,y*EF_CO2,i,y
m=1
Net calorific
value (energy content) of fuel
type i in year y
(GJ/mass or volume
unit)
NCV_i,y
m
=
1 0 0 0 0 0 0 0 0 0
i/y
2020
2021
2022
2023
2024
2025
2026
2027
2028
i/y
2020
2021
2022
2023
2024
2025
2026
2027
2028
i/y
2020
2021
2022
2023
2024
2025
2026
2027
2028
1
1- NG
50.4
50.4
50.4
50.4
50.4
50.4
50.4
50.4
50.4
1 0 0 0 0 0 0 0 0 0
2
2
2 0 0 0 0 0 0 0 0 0
3
3
3 0 0 0 0 0 0 0 0 0
** use regional or natioal default values or see "Tool to calc EF of elec sys"
or use IPCC defalt values at upper limit of uncertainity at 95% CI
m=2
Table 1.2 Ch 1 Vol2 2006 IPCC Guidelines on National GHG Inventories
m
=
2 0 0 0 0 0 0 0 0 0
i/y
2020
2021
2022
2023
2024
2025
2026
2027
2028
i/y
2020
2021
2022
2023
2024
2025
2026
2027
2028
1
Average
CO2emiss
ion factor
of fuel
type i
used in
power
unit m in
year y (
tCO2/GJ)
EF_CO2,i,y
1 0 0 0 0 0 0 0 0 0
2
i/y
2020
2021
2022
2023
2024
2025
2026
2027
2028
2 0 0 0 0 0 0 0 0 0
3
1
0.0583
0.0583
0.0583
0.0583
0.0583
0.0583
0.0583
0.0583
0.0583
3 0 0 0 0 0 0 0 0 0
2
3
m=3
m
=
3 0 0 0 0 0 0 0 0 0
i/y
2020
2021
2022
2023
2024
2025
2026
2027
2028
i/y
2020
2021
2022
2023
2024
2025
2026
2027
2028
1
1 0 0 0 0 0 0 0 0 0
2
2 0 0 0 0 0 0 0 0 0
3
3 0 0 0 0 0 0 0 0 0
*“Tool to calculate the emission factor for an electricity system”)
Option
A
EG
m,y
Net amount of electricity generated and
delivered to the grid by power unit m in
year y
EFEL,m,y Net amount of electricity generated and
delivered to the grid by power unit m in year y
(MWh)
m/y
2020
2021
2022
2023
2024
2025
2026
2027
2028
(t
CO2/MW
h)
m/y
2020
2021
2022
2023
2024
2025
2026
2027
2028
1
1 0 0 0 0 0 0 0 0 0
2
2 0 0 0 0 0 0 0 0 0
3
3 0 0 0 0 0 0 0 0 0
*“Tool to calculate the emission factor for an electricity system”)

Power Market Integration: Contribution to Climate Mitigation Recommendations for ENTRO 82/90
Emission Factor for Generated Electricity: (Option B)
Option B
Average
CO2emission
factor of fuel type
i used in power
unit m in year y (
tCO2/GJ)
EF_CO2,m,i,y n_m,y
m=1
0.000 0.075 0.075 0.000 0.000 0.000 0.000 0.000 0.000
Average net energy
conversion efficiency
of power unit m in year
y (%)
m/y
2020 2021 2022 2023 2024 2025 2026 2027 2028
i/y 2020 2021 2022 2023 2024 2025 2026 2027 2028
1
1
2 3
3
Use either:
• Documented manufacturer’s specifications or
• Data from the utility, the dispatch center or official records if it can be deemed reliable; or
m=2 0 0 0 0.0583 0.0583 0.0583 0.0583 0.0583 0.0583
• The default values provided in the table in Annex 1 of the “Tool to calc EF for elec sys"
i/y 2020 2021 2022 2023 2024 2025 2026 2027 2028
1
2
3
Option
B
m=3 0 0 0 0 0 0 0 0 0
EFEL,m,y
i/y 2020 2021 2022 2023 2024 2025 2026 2027 2028 Net amount of
electricity generated
and delivered to the
grid by power unit m in
year y ((t CO2/MWh))
m/y 2020 2021 2022 2023 2024 2025 2026 2027 2028
1
1
2
2
3
3
** use natioanla or regional defulat values
use the fuel type with the highest CO2 emission factor for EFCO2,m,i,y.
or use IPCC defalt values at upper limit of uncertainity at 95% CI Table 1.4 chap 1 vol2 of 2006 IPCC Guidelines on National GHG inventories
** See Tool to calc EF for elec syst
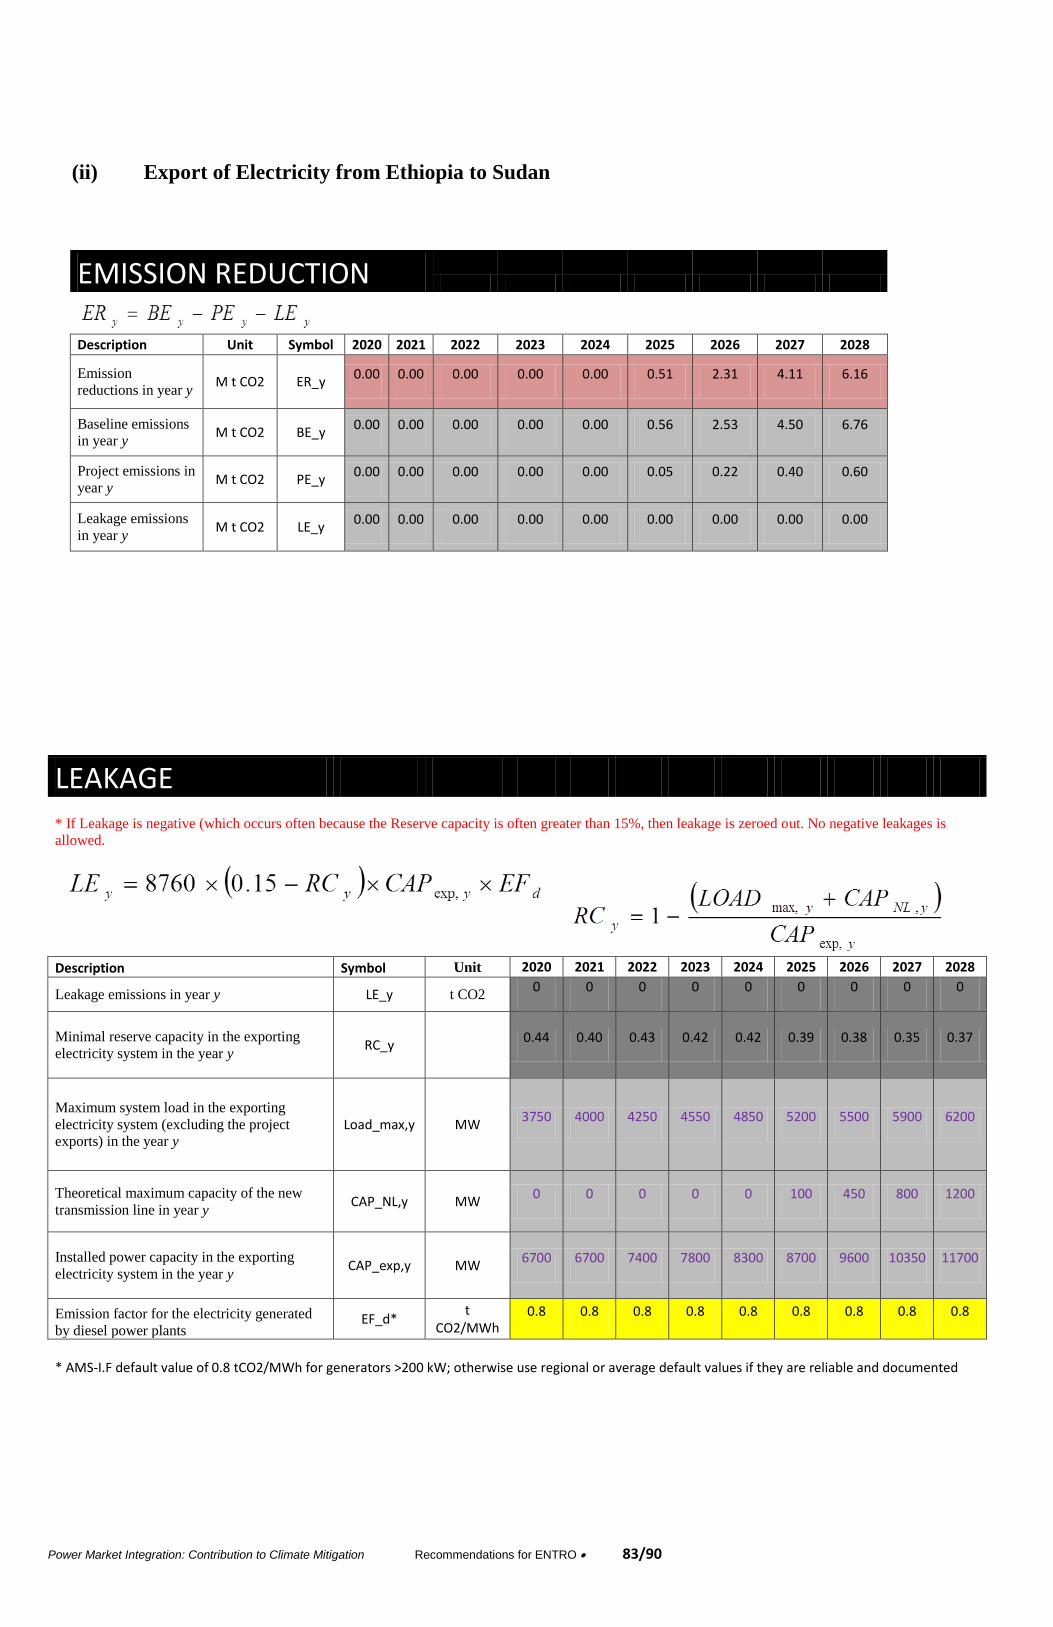
Power Market Integration: Contribution to Climate Mitigation Recommendations for ENTRO 83/90
(ii) Export of Electricity from Ethiopia to Sudan
EMISSION REDUCTION
Description Unit Symbol 2020 2021 2022 2023 2024 2025 2026 2027 2028
Emission
reductions in year y M t CO2 ER_y
0.00 0.00 0.00 0.00 0.00 0.51 2.31 4.11 6.16
Baseline emissions
in year y M t CO2 BE_y
0.00 0.00 0.00 0.00 0.00 0.56 2.53 4.50 6.76
Project emissions in
year y M t CO2 PE_y
0.00 0.00 0.00 0.00 0.00 0.05 0.22 0.40 0.60
Leakage emissions
in year y M t CO2 LE_y
0.00 0.00 0.00 0.00 0.00 0.00 0.00 0.00 0.00
LEAKAGE
* If Leakage is negative (which occurs often because the Reserve capacity is often greater than 15%, then leakage is zeroed out. No negative leakages is
allowed.
Description Symbol Unit 2020 2021 2022 2023 2024 2025 2026 2027 2028
Leakage emissions in year y LE_y t CO2 0 0 0 0 0 0 0 0 0
Minimal reserve capacity in the exporting
electricity system in the year y RC_y
0.44 0.40 0.43 0.42 0.42 0.39 0.38 0.35 0.37
Maximum system load in the exporting
electricity system (excluding the project
exports) in the year y
Load_max,y MW 3750 4000 4250 4550 4850 5200 5500 5900 6200
Theoretical maximum capacity of the new
transmission line in year y CAP_NL,y MW
0 0 0 0 0 100 450 800 1200
Installed power capacity in the exporting
electricity system in the year y CAP_exp,y MW
6700 6700 7400 7800 8300 8700 9600 10350 11700
Emission factor for the electricity generated
by diesel power plants EF_d*
t CO2/MWh
0.8 0.8 0.8 0.8 0.8 0.8 0.8 0.8 0.8
* AMS-I.F default value of 0.8 tCO2/MWh for generators >200 kW; otherwise use regional or average default values if they are reliable and documented
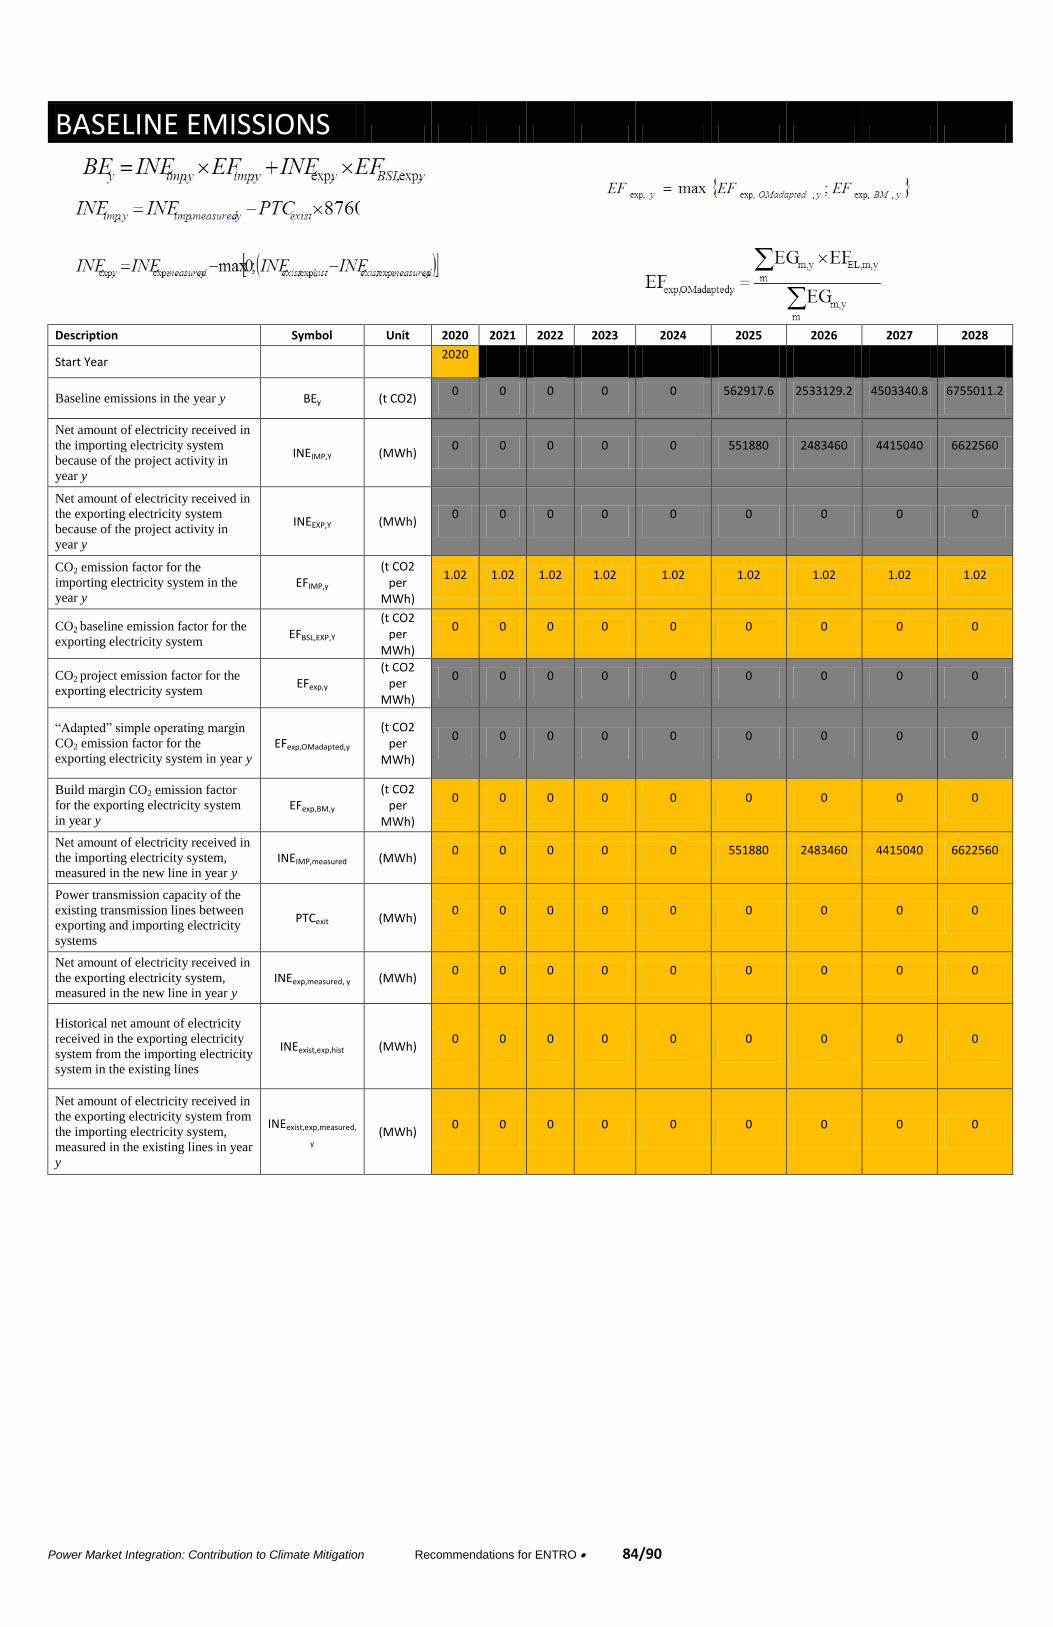
Power Market Integration: Contribution to Climate Mitigation Recommendations for ENTRO 84/90
BASELINE EMISSIONS
Description Symbol Unit 2020 2021 2022 2023 2024 2025 2026 2027 2028
Start Year
2020
Baseline emissions in the year y BEy (t CO2) 0 0 0 0 0 562917.6 2533129.2 4503340.8 6755011.2
Net amount of electricity received in
the importing electricity system
because of the project activity in
year y
INEIMP,Y (MWh) 0 0 0 0 0 551880 2483460 4415040 6622560
Net amount of electricity received in
the exporting electricity system
because of the project activity in
year y
INEEXP,Y (MWh) 0 0 0 0 0 0 0 0 0
CO2 emission factor for the
importing electricity system in the
year y EFIMP,y
(t CO2 per
MWh)
1.02 1.02 1.02 1.02 1.02 1.02 1.02 1.02 1.02
CO2 baseline emission factor for the
exporting electricity system EFBSL,EXP,Y
(t CO2 per
MWh)
0 0 0 0 0 0 0 0 0
CO2 project emission factor for the
exporting electricity system EFexp,y
(t CO2 per
MWh)
0 0 0 0 0 0 0 0 0
“Adapted” simple operating margin
CO2 emission factor for the
exporting electricity system in year y
EFexp,OMadapted,y (t CO2
per MWh)
0 0 0 0 0 0 0 0 0
Build margin CO2 emission factor
for the exporting electricity system
in year y
EFexp,BM,y (t CO2
per MWh)
0 0 0 0 0 0 0 0 0
Net amount of electricity received in
the importing electricity system,
measured in the new line in year y INEIMP,measured (MWh)
0 0 0 0 0 551880 2483460 4415040 6622560
Power transmission capacity of the
existing transmission lines between
exporting and importing electricity
systems
PTCexit (MWh) 0 0 0 0 0 0 0 0 0
Net amount of electricity received in
the exporting electricity system,
measured in the new line in year y INEexp,measured, y (MWh)
0 0 0 0 0 0 0 0 0
Historical net amount of electricity
received in the exporting electricity
system from the importing electricity
system in the existing lines
INEexist,exp,hist (MWh) 0 0 0 0 0 0 0 0 0
Net amount of electricity received in
the exporting electricity system from
the importing electricity system,
measured in the existing lines in year
y
INEexist,exp,measured,
y (MWh)
0 0 0 0 0 0 0 0 0
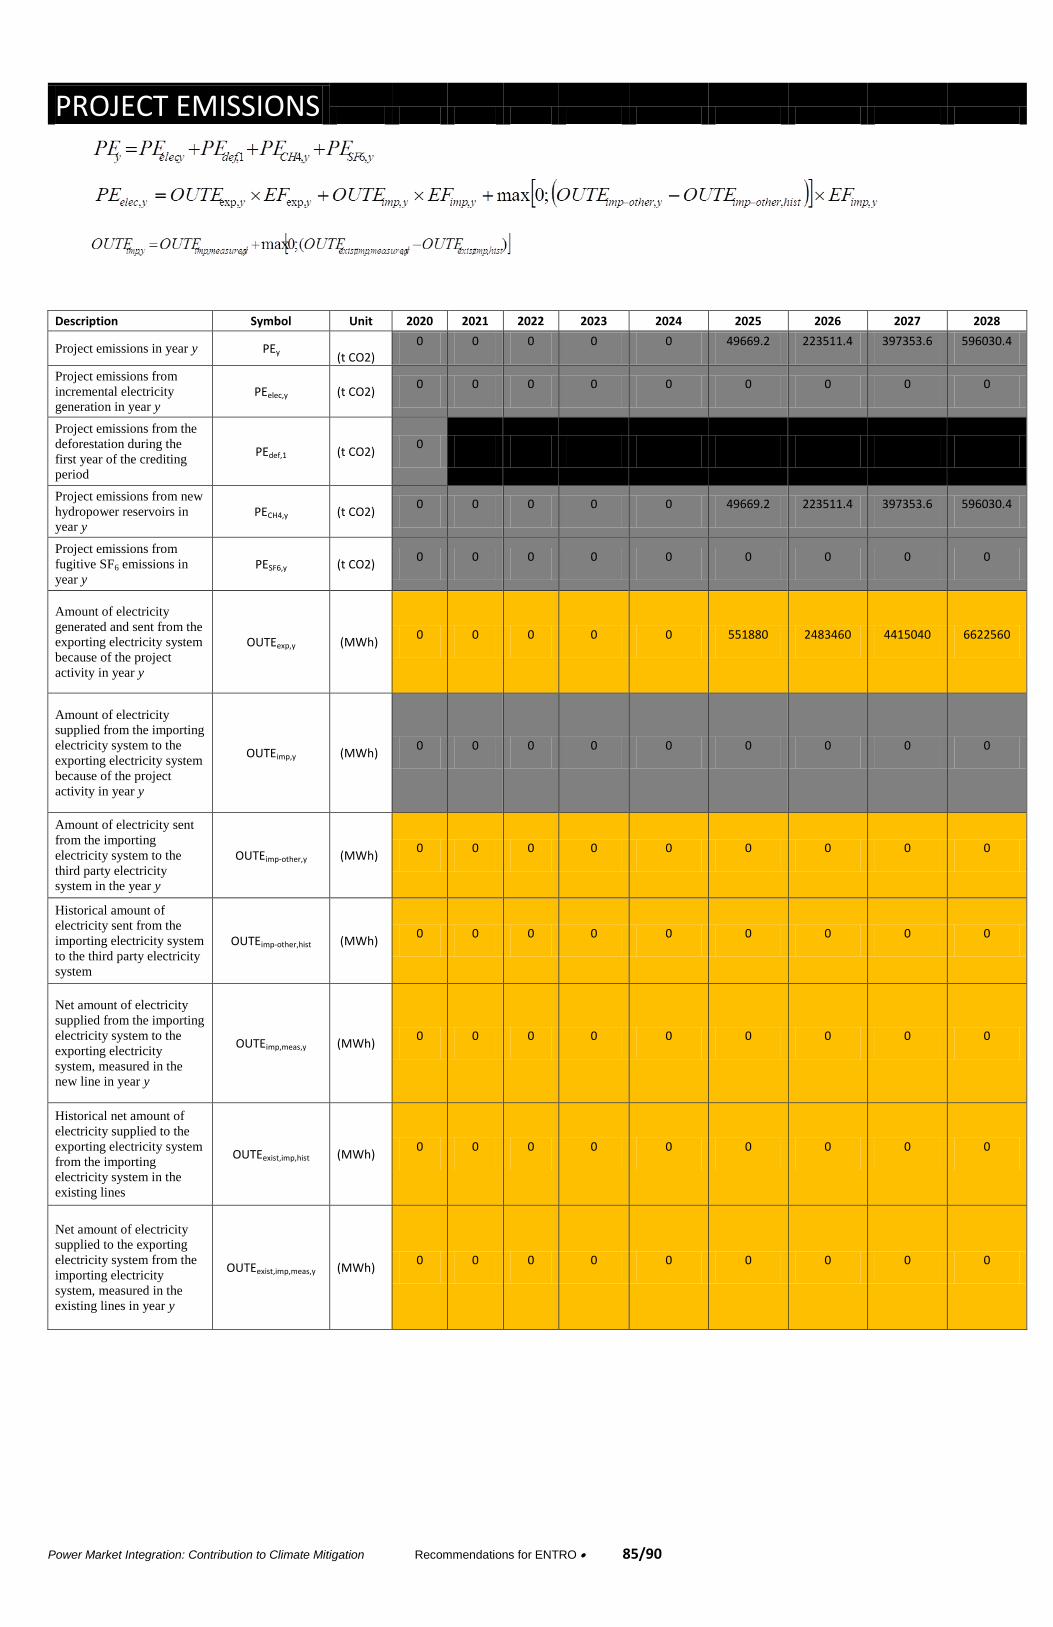
Power Market Integration: Contribution to Climate Mitigation Recommendations for ENTRO 85/90
PROJECT EMISSIONS
Description Symbol Unit 2020 2021 2022 2023 2024 2025 2026 2027 2028
Project emissions in year y PEy (t CO2)
0 0 0 0 0 49669.2 223511.4 397353.6 596030.4
Project emissions from
incremental electricity
generation in year y PEelec,y (t CO2)
0 0 0 0 0 0 0 0 0
Project emissions from the
deforestation during the
first year of the crediting
period
PEdef,1 (t CO2) 0 x x x x x x x x
Project emissions from new
hydropower reservoirs in
year y PECH4,y (t CO2)
0 0 0 0 0 49669.2 223511.4 397353.6 596030.4
Project emissions from
fugitive SF6 emissions in
year y
PESF6,y (t CO2) 0 0 0 0 0 0 0 0 0
Amount of electricity
generated and sent from the
exporting electricity system
because of the project
activity in year y
OUTEexp,y (MWh) 0 0 0 0 0 551880 2483460 4415040 6622560
Amount of electricity
supplied from the importing
electricity system to the
exporting electricity system
because of the project
activity in year y
OUTEimp,y (MWh) 0 0 0 0 0 0 0 0 0
Amount of electricity sent
from the importing
electricity system to the
third party electricity
system in the year y
OUTEimp-other,y (MWh) 0 0 0 0 0 0 0 0 0
Historical amount of
electricity sent from the
importing electricity system
to the third party electricity
system
OUTEimp-other,hist (MWh) 0 0 0 0 0 0 0 0 0
Net amount of electricity
supplied from the importing
electricity system to the
exporting electricity
system, measured in the
new line in year y
OUTEimp,meas,y (MWh) 0 0 0 0 0 0 0 0 0
Historical net amount of
electricity supplied to the
exporting electricity system
from the importing
electricity system in the
existing lines
OUTEexist,imp,hist (MWh) 0 0 0 0 0 0 0 0 0
Net amount of electricity
supplied to the exporting
electricity system from the
importing electricity
system, measured in the
existing lines in year y
OUTEexist,imp,meas,y (MWh) 0 0 0 0 0 0 0 0 0

Power Market Integration: Contribution to Climate Mitigation Recommendations for ENTRO 86/90
DEFORESTATION
** assume no deforestation (desert everywhere)
Description Symbol Unit 2020
Project emissions from the deforestation
during the first year of the crediting
period
PEdef,1 (t CO2) 0
Segment of transmission line k= Unit 1 2 3
Length deforested for segment k (100m) L_def,k (100m) 16650
Width deforested for segment k (100m) W_def, k (100m) 1
Aboveground biomass of land to be
deforested for segment k (tonnes d.m./ha) M_A,k tonnes d.m/ha 0
SULFUR HEXAFLOURIDE
*can be excluded from ex ante ER estimate
Description Symbol Unit 2020 2021 2022 2023 2024 2025 2026 2027 2028
Project emissions of SF6 from
new equipment (e.g.
transformers) installed under the
project activity in year y (t CO2)
t CO2 0 0 0 0 0 0 0 0 0
The average quantity of SF6
emitted from equipment
installed under the project
activity in year y (tSF6)
t SF6 0 0 0 0 0 0 0 0 0
Global warming potential of SF6
(t CO2/tSF6)
t CO2/tSF6 23,900
* GWP: Intergovernmental Panel on Climate Change, Working Group 1, Climate Change 2007, Chapter 2.10.2.
Project participants shall update GWPs according to any decisions by the CMP. For the first commitment period GWPSF6=23,900
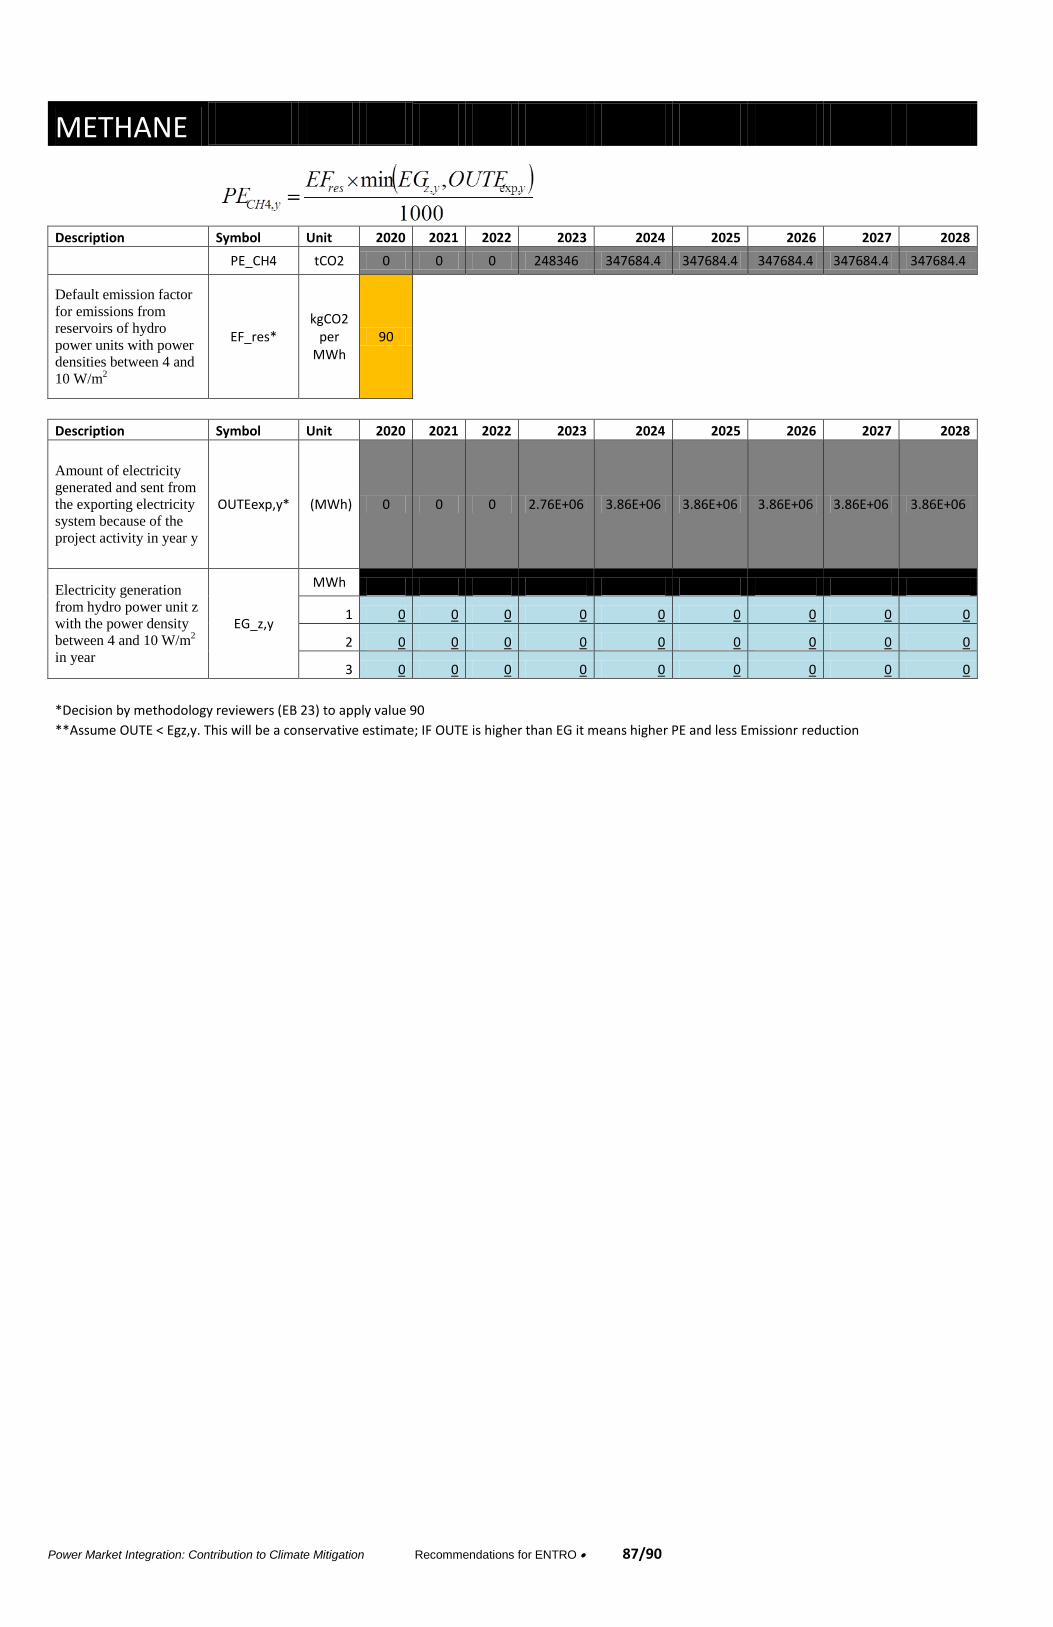
Power Market Integration: Contribution to Climate Mitigation Recommendations for ENTRO 87/90
METHANE
Description Symbol Unit 2020 2021 2022 2023 2024 2025 2026 2027 2028
PE_CH4 tCO2 0 0 0 248346 347684.4 347684.4 347684.4 347684.4 347684.4
Default emission factor
for emissions from
reservoirs of hydro
power units with power
densities between 4 and
10 W/m2
EF_res* kgCO2
per MWh
90
Description Symbol Unit 2020 2021 2022 2023 2024 2025 2026 2027 2028
Amount of electricity
generated and sent from
the exporting electricity
system because of the
project activity in year y
OUTEexp,y* (MWh) 0 0 0 2.76E+06 3.86E+06 3.86E+06 3.86E+06 3.86E+06 3.86E+06
Electricity generation
from hydro power unit z
with the power density
between 4 and 10 W/m2
in year
EG_z,y
MWh
1 0 0 0 0 0 0 0 0 0
2 0 0 0 0 0 0 0 0 0
3 0 0 0 0 0 0 0 0 0
*Decision by methodology reviewers (EB 23) to apply value 90 **Assume OUTE < Egz,y. This will be a conservative estimate; IF OUTE is higher than EG it means higher PE and less Emissionr reduction
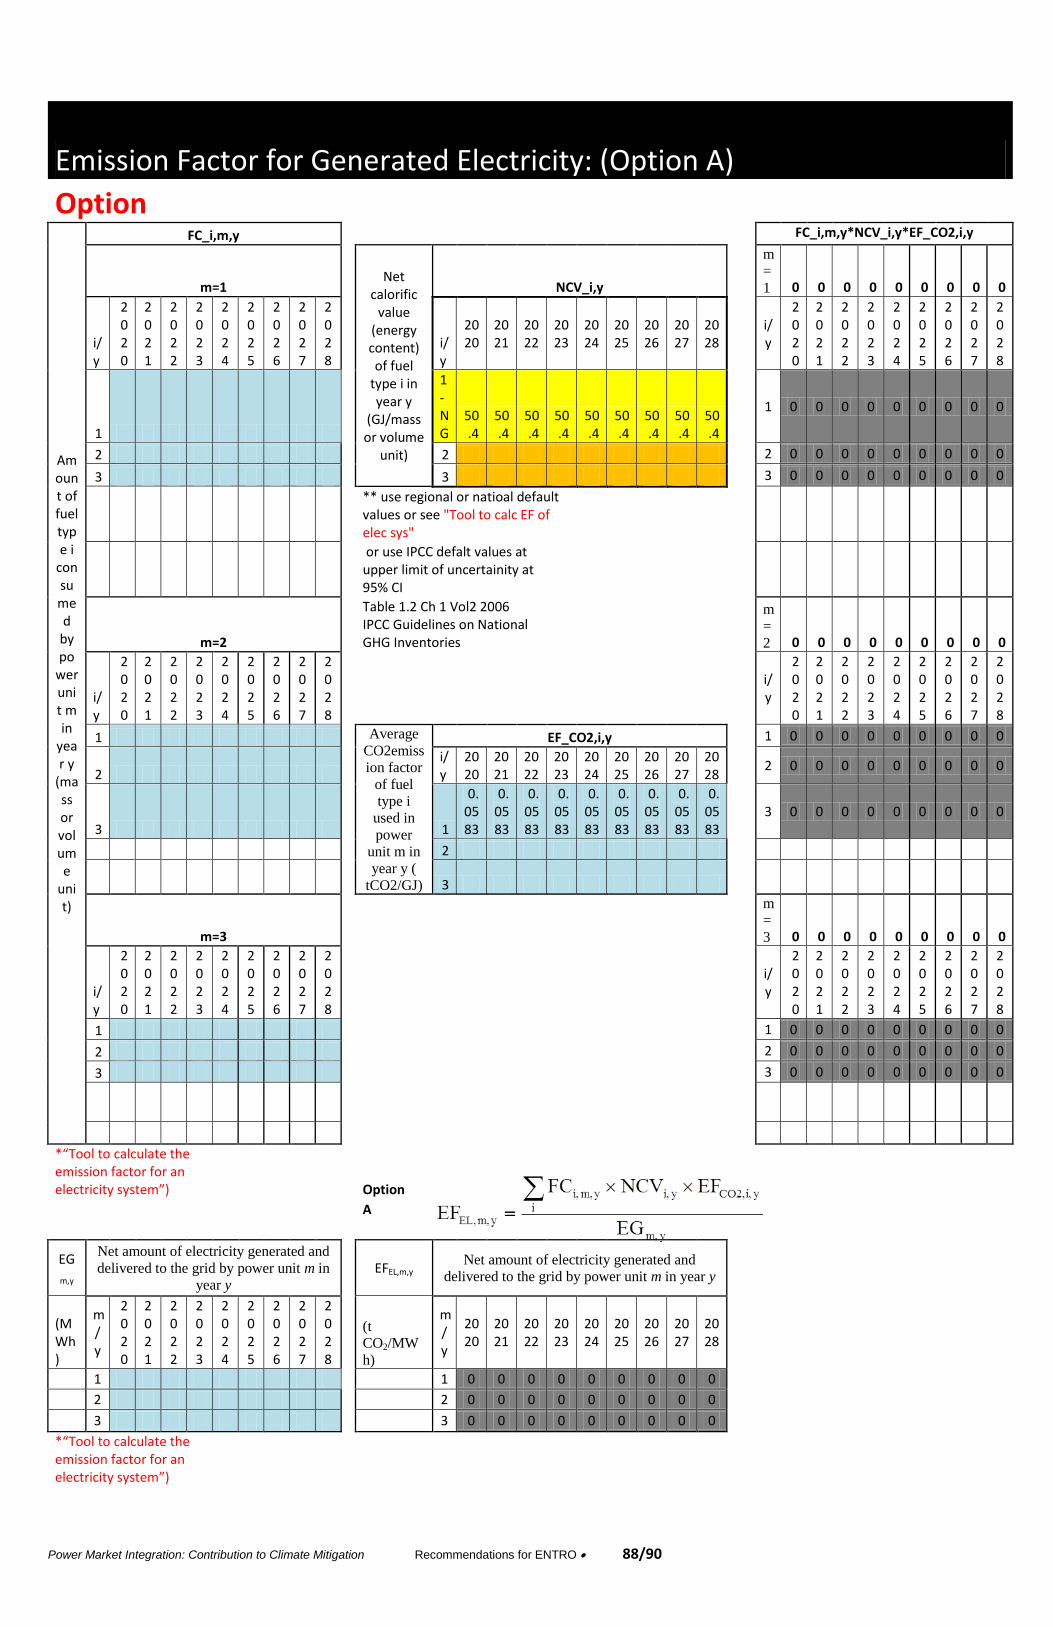
Power Market Integration: Contribution to Climate Mitigation Recommendations for ENTRO 88/90
Emission Factor for Generated Electricity: (Option A)
Option
Amount of fuel type i
consumed
by po
wer unit m in
year y
(mass or volume
unit)
FC_i,m,y
FC_i,m,y*NCV_i,y*EF_CO2,i,y
m=1
Net calorific
value (energy content) of fuel
type i in year y
(GJ/mass or volume
unit)
NCV_i,y
m
=
1 0 0 0 0 0 0 0 0 0
i/y
2020
2021
2022
2023
2024
2025
2026
2027
2028
i/y
2020
2021
2022
2023
2024
2025
2026
2027
2028
i/y
2020
2021
2022
2023
2024
2025
2026
2027
2028
1
1- NG
50.4
50.4
50.4
50.4
50.4
50.4
50.4
50.4
50.4
1 0 0 0 0 0 0 0 0 0
2
2
2 0 0 0 0 0 0 0 0 0
3
3
3 0 0 0 0 0 0 0 0 0
** use regional or natioal default values or see "Tool to calc EF of elec sys"
or use IPCC defalt values at upper limit of uncertainity at 95% CI
m=2
Table 1.2 Ch 1 Vol2 2006 IPCC Guidelines on National GHG Inventories
m
=
2 0 0 0 0 0 0 0 0 0
i/y
2020
2021
2022
2023
2024
2025
2026
2027
2028
i/y
2020
2021
2022
2023
2024
2025
2026
2027
2028
1
Average
CO2emiss
ion factor
of fuel
type i
used in
power
unit m in
year y (
tCO2/GJ)
EF_CO2,i,y
1 0 0 0 0 0 0 0 0 0
2
i/y
2020
2021
2022
2023
2024
2025
2026
2027
2028
2 0 0 0 0 0 0 0 0 0
3
1
0.0583
0.0583
0.0583
0.0583
0.0583
0.0583
0.0583
0.0583
0.0583
3 0 0 0 0 0 0 0 0 0
2
3
m=3
m
=
3 0 0 0 0 0 0 0 0 0
i/y
2020
2021
2022
2023
2024
2025
2026
2027
2028
i/y
2020
2021
2022
2023
2024
2025
2026
2027
2028
1
1 0 0 0 0 0 0 0 0 0
2
2 0 0 0 0 0 0 0 0 0
3
3 0 0 0 0 0 0 0 0 0
*“Tool to calculate the emission factor for an electricity system”)
Option
A
EG
m,y
Net amount of electricity generated and
delivered to the grid by power unit m in
year y
EFEL,m,y Net amount of electricity generated and
delivered to the grid by power unit m in year y
(MWh)
m/y
2020
2021
2022
2023
2024
2025
2026
2027
2028
(t
CO2/MW
h)
m/y
2020
2021
2022
2023
2024
2025
2026
2027
2028
1
1 0 0 0 0 0 0 0 0 0
2
2 0 0 0 0 0 0 0 0 0
3
3 0 0 0 0 0 0 0 0 0
*“Tool to calculate the emission factor for an electricity system”)
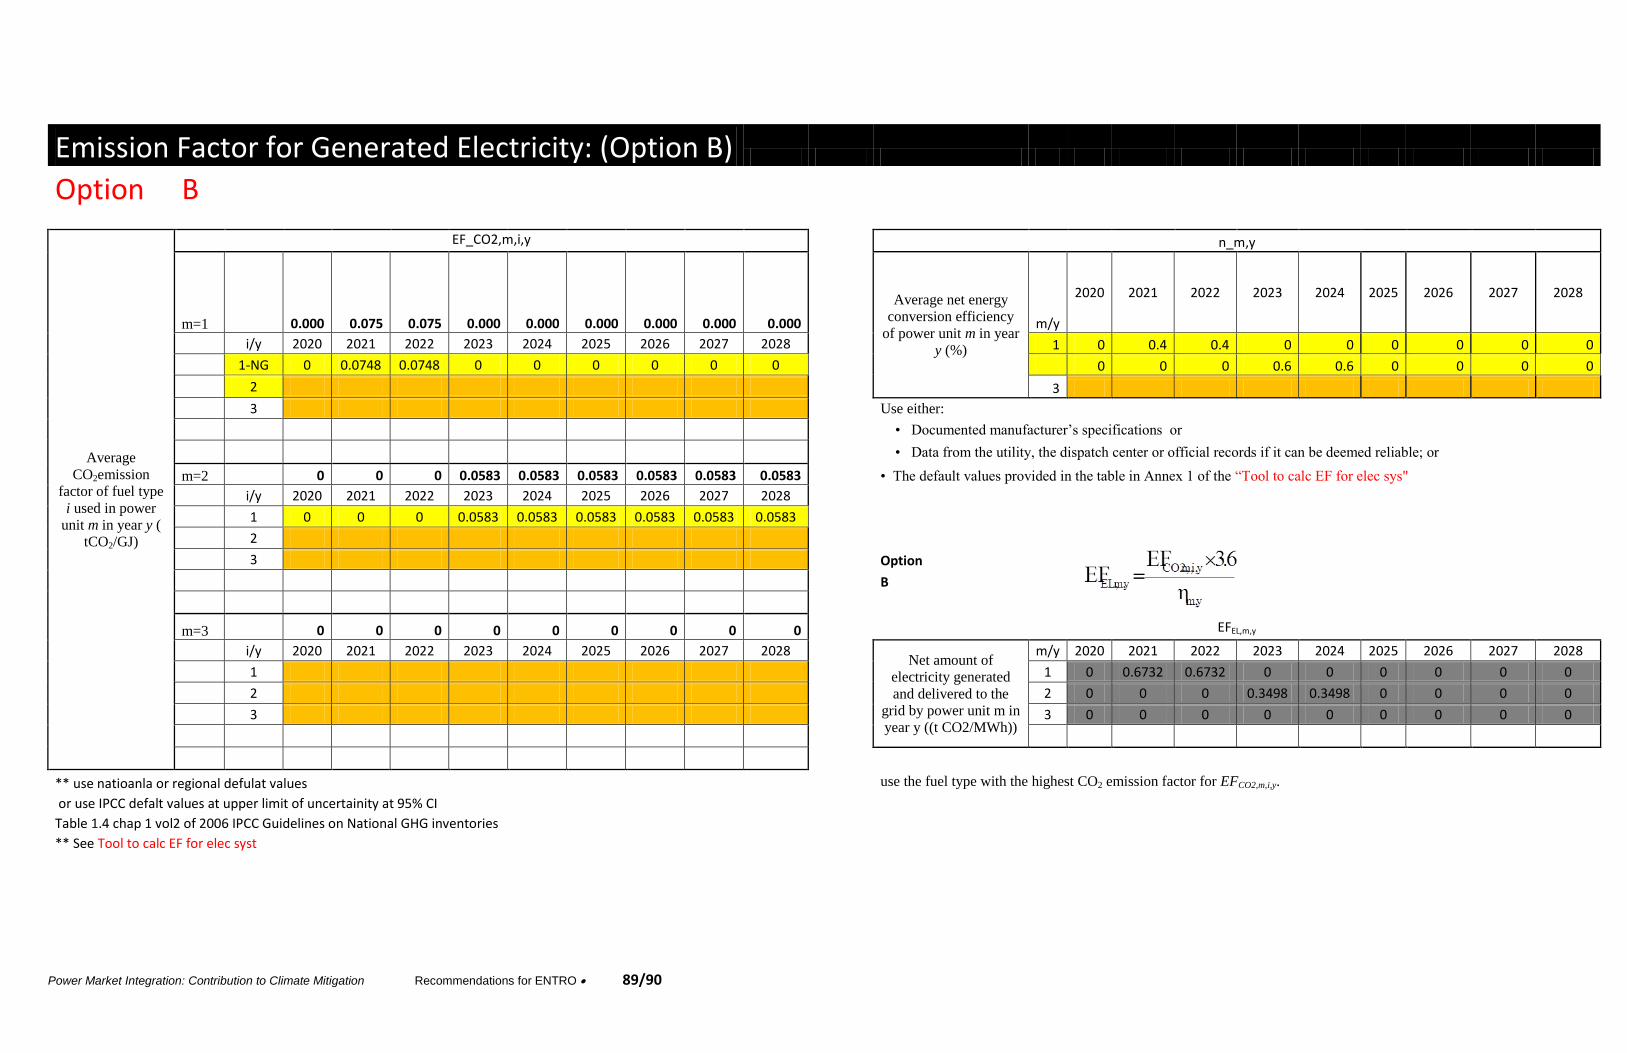
Power Market Integration: Contribution to Climate Mitigation Recommendations for ENTRO 89/90
Emission Factor for Generated Electricity: (Option B)
Option B
Average
CO2emission
factor of fuel type
i used in power
unit m in year y (
tCO2/GJ)
EF_CO2,m,i,y n_m,y
m=1
0.000 0.075 0.075 0.000 0.000 0.000 0.000 0.000 0.000
Average net energy
conversion efficiency
of power unit m in year
y (%)
m/y
2020 2021 2022 2023 2024 2025 2026 2027 2028
i/y 2020 2021 2022 2023 2024 2025 2026 2027 2028
1 0 0.4 0.4 0 0 0 0 0 0
1-NG 0 0.0748 0.0748 0 0 0 0 0 0
0 0 0 0.6 0.6 0 0 0 0
2 3
3
Use either:
• Documented manufacturer’s specifications or
• Data from the utility, the dispatch center or official records if it can be deemed reliable; or
m=2 0 0 0 0.0583 0.0583 0.0583 0.0583 0.0583 0.0583
• The default values provided in the table in Annex 1 of the “Tool to calc EF for elec sys"
i/y 2020 2021 2022 2023 2024 2025 2026 2027 2028
1 0 0 0 0.0583 0.0583 0.0583 0.0583 0.0583 0.0583
2
3
Option
B
m=3 0 0 0 0 0 0 0 0 0
EFEL,m,y
i/y 2020 2021 2022 2023 2024 2025 2026 2027 2028 Net amount of
electricity generated
and delivered to the
grid by power unit m in
year y ((t CO2/MWh))
m/y 2020 2021 2022 2023 2024 2025 2026 2027 2028
1
1 0 0.6732 0.6732 0 0 0 0 0 0
2
2 0 0 0 0.3498 0.3498 0 0 0 0
3
3 0 0 0 0 0 0 0 0 0
** use natioanla or regional defulat values
use the fuel type with the highest CO2 emission factor for EFCO2,m,i,y.
or use IPCC defalt values at upper limit of uncertainity at 95% CI Table 1.4 chap 1 vol2 of 2006 IPCC Guidelines on National GHG inventories
** See Tool to calc EF for elec syst
Power Market Integration: Contribution to Climate Mitigation Recommendations for ENTRO 90/90


