Embed Size (px)
Citation preview

September 2021
First Quarterly Report 2021/22
2
Table of contents
Key performance measures 3
Increase the success of our injury prevention activities 5
Injury prevention 6
Claims experience 7
Claims volumes 7
COVID Impact on claim volumes 8
Improve our customers’ outcomes and experiences 9
Customer outcomes and experience 10
Trust 10
Māori Access 12
Timeliness and Reviews 13
Rehabilitation: weekly compensation 14
Rehabilitation: non-weekly compensation 17
Sustainability 18
Financial summary 19
Outstanding Claims Liability 20
Claims Costs 21
Financial sufficiency 23
Organisational health and capability 26
People 26
Information and Technology 28
Integrated change investment portfolio 29
Introduction
This report provides a summary of performance for the 2021/22 financial year. Quarterly reports
should be read in conjunction with the Service Agreement, Statement of Intent, and the reports
of any preceding quarters for additional context on performance.
Year-to-date results against the measures included in the Service Agreement for 2021/22 and
Statement of Intent 2021-2025
• status of implementing key initiatives as set out in the Service Agreement
• financial performance
• significant trends, risks or issues that impacted performance.
We use the following definitions to assess the status of performance for each individual measure.
Indicator Full Year Outlook
G Tracking to meet or better than target.
If a financial measure, target is met YTD
A Achieving target at year-end is not certain.
If a financial measure result is <10% from target YTD
R Low probability of meeting target at year end.
If a financial measure result is ≥ 10% from target YTD
The quarterly report details:
Appendices 30
Appendix 1: Financial statements 30
Appendix 2: Additional financial information 34
Appendix 3: Additional measures 36
Appendix 4: Risk Section 37
3
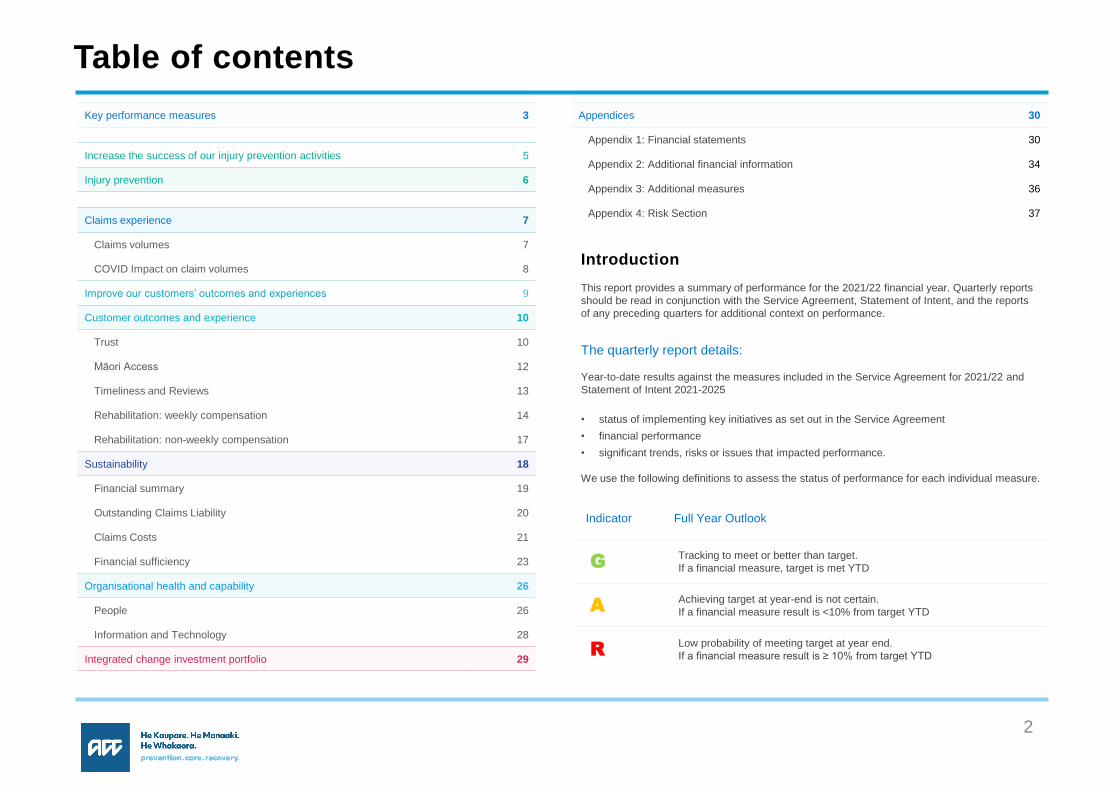
INJURY PREVENTION
YTD FULL YEAR 2020/21
RESULT AS AT ACTUAL TREND TARGET OUTLOOK ACTUAL
Return on investment:
0 to 20-year injury prevention programmesSeptember 2021 $2.18:$1 Stable $2.08:$1 G $2.19:$1
Return on investment:
Workplace injury prevention programmesSeptember 2021 $1.73:$1 Stable $1.60:$1 G New Measure
Rate of serious injury (inc. fatal):
0 to 20-year injury prevention programmesSeptember 2021 9.8 Deteriorating < 9.1 A 9.4
Rate of serious injury (inc. fatal):
Workplace injury prevention programmes September 2021 0.08 Improving < 0.2 G 0.20
CUSTOMER OUTCOMES
& EXPERIENCE
YTD FULL YEAR 2020/21
RESULT AS AT ACTUAL TREND TARGET OUTLOOK ACTUAL
Return to work within ten weeks September 2021 63.6% Improving 65% G 63.3%
Return to independence for those
not in the workforceSeptember 2021 87.5% Improving 87.5% G 87.1%
Growth rate of the Long-Term Claim Pool September 2021 +8.1% Improving +9.5% G +8.7%
Public trust and confidence September 2021 66% Stable 66% G 67%
Client net trust score September 2021 +26.0 Improving +31 G +25.0
Client net trust score for Māori September 2021 +23.0 Improving +28 G +20.0
Provider net trust score September 2021 -24.0 Stable -13.0 A -25.0
Business net trust score September 2021 -21.0 Deteriorating -5.0 A -17.0
Our Key Performance Measures
(Previously : G)
(Previously: G)

4
SUSTAINABILITY
& GOVERNANCE
YTD FULL YEAR 2020/21
RESULT AS AT ACTUAL TREND TARGET OUTLOOK ACTUAL
Change in average
treatment cost per claimSeptember 2021 +6.0% Stable ≤5% A +6.1%
Average care hours
per serious injury claimSeptember 2021 1,393 Stable 1,387 G 1,396
Actuarial movement June 2021 +1.08% Bi-annualWithin
-3 to +1% G +1.08%
Investment performance
after costs relative to benchmarkSeptember 2021 +0.32% Improving +0.15% G +1.90%
ORGANISATIONAL HEALTH
AND CAPABILITY INTENTIONS
YTD FULL YEAR 2020/21
RESULT AS AT ACTUAL TREND TARGET OUTLOOK ACTUAL
Employee net promoter score June 2021 +0 Stable +12 G +0
Total recordable injury frequency rate September 2021 2.0 Stable < 3.5 G 1.7
Number of category 3, 4 and 5
privacy breaches and near missesSeptember 2021 0 Stable < 3
No Category 5G 0
Overall operational system availability September 2021 99.9% Stable 99.5% G 99.9%
OTHER TRANSFORMATION
MEASURES
YTD FULL YEAR 2020/21
RESULT AS AT ACTUAL TREND TARGET OUTLOOK ACTUAL
Claims processed per FTE September 2021 549 Deteriorating 583 A 580
Average WC days paid September 2021 103.9 Days(-6.6 Days)
Improving 102.3 Days(-4.9 Days)
A 105.9 Days(-8.5 Days)
Our Key Performance Measures
(Previously: G)

5
Increase the success of our injury prevention activities
• We piloted Nymbl as part of our Live Stronger for Longer programme. Nymbl is an
in-home balance app that has helped thousands of people across the world get
better balance, lead active lives and live falls free.
• In the pilot over 15,000 people signed up the Nymbl app. We have evidence Nymbl
is reaching a higher risk of falls group. The falls claim history of the people who
completed Nymbl is higher as a rate for falls than the rest of the 65+ population.
• From the group who completed the minimum desired number of trainings, there
were fewer claims (adjusting for risk bias and claim bias) as a rate compared to the
65+ population. There was a 27% difference in the falls claim rate of those who
completed Nymbl and the 65+ populations. However not all people completed the
minimum of four training sessions.
Grants and Subsidies
• We have completed the third funding round of Workplace Injury Prevention grants.
The funding round prioritised proposals that aligned to one of the following
investment priorities:
• Lead, build and deliver solutions to reduce the risk of work-related sprains
and strains in high-risk sectors of Construction, Manufacturing, Agriculture,
and Transport.
• Strengthen the role of sector groups in leading initiatives to lift outcomes
across workplaces, particularly where there is a high risk of injury.
• Four organisations are being awarded a total of $3m in grants to deliver
interventions that will help reduce injuries in the workplace. The recipients are:
• Dairy NZ Ltd - Addressing dairy farming sprains and strains presents a large
opportunity to improve farmer wellbeing.
• Massey University - Identify and monitor all work-related sprains and strains
claims in the Hawkes Bay region between 2021-2023, applying prevention
through design principles to develop specific interventions to prevent those
injuries.
Nymbl
• SaferMe Inc., development and implementation of an algorithm and risk mitigation
solution that enables risk to be identified at the individual level and supports targeted
mitigation actions for high-risk construction workers.
• Horticulture NZ Inc, building system capability and establishing health and safety
leadership in the Horticulture industry.

6
Injury Prevention
MEASURE MOST RECENT
RESULT
YTD
ACTUAL
TREND FULL YEAR
TARGET
FULL YEAR
OUTLOOK
2020/21
ACTUAL
Return on investment:
0 to 20-year injury prevention programmesSeptember 2021 $2.18:$1 Stable $2.08:$1 G $2.19:$1
Return on investment:
Workplace injury prevention programmesSeptember 2021 $1.73:$1 Stable $1.60:$1 G New Measure
Number of claims avoided through our injury prevention initiatives September 2021 1,804 Stable 14,641 G 14,240
Investment in Kaupapa Māori programmes September 2021 $1.6m Stable $7m G $5.8m
Rate of serious injury (inc. fatal):
0 to 20-year injury prevention programmesSeptember 2021 9.8 Deteriorating < 9.1 A 9.4
Rate of serious injury (inc. fatal):
Workplace injury prevention programmesSeptember 2021 0.08 Improving < 0.2 G 0.20
Rate of Serious Injury:
• The 0-20 Fatal & Serious Injury result is tracking as we forecasted and is still
unfavourable. Based on current forecasting it is likely to be unfavourable until at
least the end of the second quarter, and we are working to understand the drivers.
Part of this work will be to understand whether there are more fatal accidents
occurring or more claims being made for these accidents. Our continuing work with
Nymbl will help to reduce older age falls.

7
MEASURE MOST RECENT
RESULT
YTD
ACTUAL
FULL YEAR
BUDGET
2020/21
ACTUAL
New claims registered
(rolling 12 months)September 2021 1,994,464 2,151,105 2,105,833
New Weekly Compensation
claims (rolling 12 months)September 2021 93,284 94,997 95,381
MEASURE 12-MONTH
ROLLING GROWTH
FY
BUDGET
New claims registered +5.8% +1.1%
New Weekly Compensation claims +11.9% +3.1%
• New claims registered volumes increased by 5.8% for the rolling 12 months to September 2021,
but COVID lockdowns have affected volumes.
• Volumes in September 2021 (~120,000) are approximately 45k lower than July 2021, September
2019, and 57k lower than September 2020.
NEW CLAIMS GROWTH RATES - ROLLING 12 MONTHS
New Weekly Comp New Registrations
Claims Experience: Claims Volumes
• New WC commencements increased 11.9% for the rolling 12 months to September
2021. Volumes have dropped off since COVID lockdown.
• Volumes in September 2021 (~5,600) are 800 lower than September 2019 and
2,500 lower than September 2020 and July 2021.
0
2,000
4,000
6,000
8,000
10,000
Jul Aug Sep Oct Nov Dec Jan Feb Mar Apr May Jun
5,618
VOLUME OF WC COMMENCEMENTS - MONTHLY
2020/21 2021/22
0
50,000
100,000
150,000
200,000
250,000
Jul Aug Sep Oct Nov Dec Jan Feb Mar Apr May Jun
119,655
VOLUME OF NEW REGISTRATIONS - MONTHLY
2020/21 2021/22
-8.1%
-3.7%
1.1%
3.1%
-15%
-10%
-5%
0%
5%
10%
15%
20%
Jul Sep Nov Jan Mar May Jul Sep Nov Jan Mar May Jul Sep Nov Jan Mar May
2019/20 2020/21 2021/22
5.8%
11.9%
END OF
YEAR TARGETS

8
Lower claim volumes is consistent with the 2020 lockdown
• For the initial August 2021 lockdown period, the fall in claim
volumes are similar when compared to the 2020 lockdown.
• Claim volume growth seen from week 35, is starting to flatline
as Auckland remains in level 3 lockdown. With more regions
in level 3 now too, we expect this will have a flow on effect to
claim volumes.
Claims Experience: COVID Impact to Claims Volumes
Comparing lockdowns
• The two lockdowns happened at two different times of the
annual claims cycle e.g. winter sports were just starting in the
2020 lockdown but had finished in 2021 lockdown.
• Before the August 2021 lockdown, the claim volumes were
more consistent with 2019 and non-lockdown periods in
2020.
• The initial return to level 2 in 2021 for all of NZ (except
Auckland), is similar to the second week of 2020 at level 2.
-
5,000
10,000
15,000
20,000
25,000
30,000
35,000
40,000
45,000
50,000
1 3 5 7 9 11 13 15 17 19 21 23 25 27 29 31 33 35 37 39 41 43 45 47 49 51
AC
CE
PT
ED
CLA
IMS
RE
GIS
TE
RE
D
WEEK OF CALENDAR YEAR
CLAIM REGISTRATION CHANGES OVER LOCKDOWN
COVID IMPACT TO ALL REGISTERED CLAIMS
2020LEVEL 4
2020LEVEL 3
2020LEVEL 2
-80%
-60%
-40%
-20%
0%
20%
PE
RC
EN
TA
GE
CH
AN
GE
OV
ER
LO
CK
DO
WN
WEEKS PRIOR TO LOCKDOWNS
Outside of Auckland,
NZ moves to level 2
2020 Calendar year 2021 Calendar year
2020 Calendar year 2021 Calendar year
2019 Calendar year
Auckland moves
down to level 3
Waikato moves
up to level 3

9
Improve our customers’ outcomes and experiences
Improved timeliness of responses and first call resolution
Improving the experience for customers by enabling faster contact with ACC and
providing first call resolution remains a key focus for ACC.
In the first quarter we increased the channels for customers to make direct contact, with
the introduction of ‘Live Support’. This gives clients the ability to chat online with an ACC
staff member using the MyACC self-service digital platform.
This quarter within the Contact Centre (the primary point of initial contact for the majority
of ACC customers), we provided timely responses with the following average response
rates to incoming calls, emails and live chat:
• Calls (Client and Provider): 3 minutes
• Calls (Business Customer): 6 minutes
• Email (all customer groups): < 1 day
• Live Chat (MyACC): < 1 minute
Across all these interactions, 83% had first contact resolution. Overall customer
satisfaction of the call experience remains high at 85%.
We are considering different approaches to measuring health outcomes. We are working
on Proof of Concepts (PoC) to measure health outcomes for four specific groups of
clients who:
• Have an upper or lower limb fracture
• Have concussion
• Access physiotherapy
• Have a sensitive claim
It is expected that the PoCs will run until approximately mid-2022, at which time they will
be evaluated.
Measuring client outcomes
ACC continues to focus on improving the accessibility and range of digital self-
management services. This ensures customers can choose the best options to suit their
needs when they need to complete certain tasks, require support, or are seeking
information from ACC.
Early indications from ‘Live Support’ are positive; ~ 2,000 clients using this service with
over 85% customer satisfaction reported.
Work is underway to increase the capability of MyACC for Business. This will enable
employers to view information about their employee’s injuries. The initial focus is on
workplace accidents, giving employers visibility of medical certificates and details of
incapacity. This will provide employers with increased understanding of return to work
due dates and the extent to which the employee can return to work. The initial stage of
these changes are planned for the third quarter.
We are developing a single provider hub. This is a new self-service platform that
providers can access for all their digital interactions with ACC. This quarter focus has
been on the technology build to enable Providers who do not use practice management
systems to also utilise the hub for tasks such as submitting claims and invoices to
ACC. It is anticipated the platform will commence go live in the fourth quarter.
Increase the range of self-service options
10
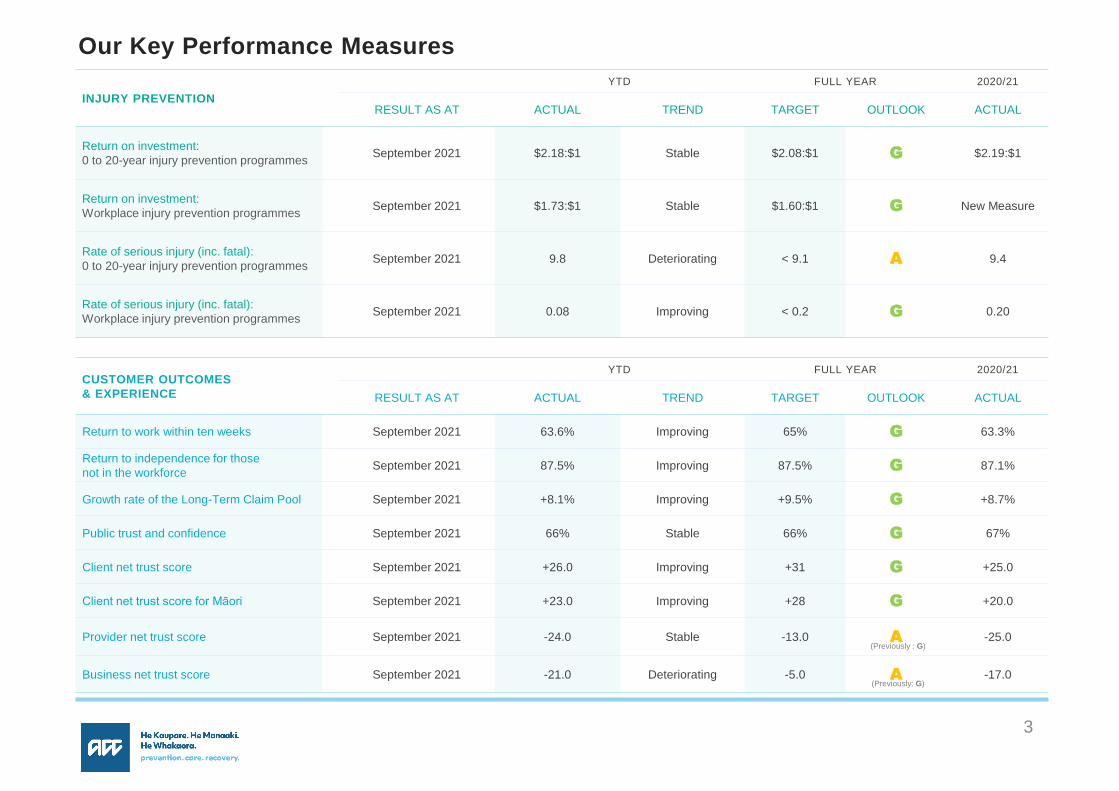
Customer Experience:
MEASURE MOST RECENT
RESULT
YTD
ACTUAL
TREND FULL YEAR
TARGET
FULL YEAR
OUTLOOK
2020/21
ACTUAL
Public trust and confidence September 2021 66% Stable 66% G 67%
Client net trust score September 2021 +26 Improving +31 G +25
ACC is focussed on the best possible outcomes for clients given their situation September 2021 76% Deteriorating 78% G 77%
Provider net trust score September 2021 -24 Stable -13 A -25
Business net trust score September 2021 -21 Deteriorating -5 A -17
Trust
Public trust and confidence:
• The quarterly result is 70%, giving a four-quarter rolling average of 66%. This is
among the highest results recorded, and moves us from 16th to 13th highest among
Government agencies surveyed.
• ACC’s strong presence in the market and media during the quarter is likely to have
been a key contributor to the increase in the quarter.
• Public trust is influenced by 5 key levers: the stories of family and friends, media, and
the experiences of injured clients, healthcare providers and levy payers. It is the
cumulative impact of these 5 levers that contributes towards the public’s overall
perception of ACC and how effectively people chose to engage with prevention and
rehabilitation pathways.
• Key initiatives this quarter to improve the public’s perception and engagement with
ACC include:
• Continuation of public awareness activity as part of ACC’s Engagement Strategy.
This quarter we highlighted the support available for injured people and their
whānau following an injury. The activity includes messages targeted to Māori
and Pasifika audiences about available help with lost wages and the support ACC
offers with medical costs and equipment following an injury.
• Continuation of Preventable, ACC’s long-term injury prevention behaviour-change
programme, which launched in mid-April 2021 on TV, digital channels and radio.
• The public awareness activity is supported by a proactive media strategy with the
objective of deliberately positioning ACC as a transparent, responsive and
proactive organisation.
• There has been some improvement in the NTS results compared to the previous
quarter for GPs (NTS of -26, up from -37) and ‘Other treatment providers’ (NTS of -
16, up from -27), however Physios remain consistent at -42.
• This quarter the following actions have been taken to improve the experience of
Providers:
• Enhancements to ACC’s client relationship management platform enabling
efficient data sharing with the Provider sector and the facilitation of early and
appropriate referrals. This is expected to be in operation in the second quarter.
• Continued development of the ‘Provider Hub’, a modern self-service hub for
Providers to access for digital interactions with ACC, including claim and invoice
submission. Rollout of the hub is expected in 2022.
• Improved engagement with Providers regarding their patients with higher
responsiveness to queries, requests via email and phone resulting from the
change to a single inbound call channel.
Provider net trust score (NTS):
(Previously: G)
(Previously: G)

11
Customer Experience: Trust
• Analysis of the results reflect that the decline, although not significant, is driven by
declines for small businesses at -24 (previously -15) and medium businesses at -20
(previously -4), with most survey questions reflecting lower endorsement compared to
previous quarters.
• Overall, less than half of all businesses (44%) agree ACC provides them with real
benefits and value, which is a slight decline compared to last quarter (47%), largely
due to small (from 47% to 40%) and medium businesses (from 68% to 62%).
• Improving the ease of doing business and more effective engagement, including
greater involvement in the rehabilitation of injured employees, remain key focus areas
for ACC to improve the experience of Business Customers. This quarter the following
initiatives were focused on:
• Continued work to develop digital functionality for employers within MyACC for
Business to access claims information about employees with work injuries. This will
improve business customers interaction and engagement by providing timely
information and enabling the employer to play a more proactive role in the recovery of
their injured employee. Currently we expect to go live with these tools in the third
quarter.
• The Recovery at Work Business Customer Resources and Education Campaign aims
to empower business customers to self-manage recovery at work for their injured
employees. Information and resources are being developed. This will go-live in the
second quarter
• We completed the pre-2021 invoicing proactive communication programme this
quarter. This provided business customers with early notification and information
regarding their invoice, allowing them the opportunity to update key information used
to calculate levies prior to receiving it. Evaluation of this programme showed the
positive impact of these communications.
• Peak annual levy invoicing: Annual invoicing commenced for companies in July and
for Self-Employed in September. This period is known to negatively impact NTS
results.
• Levy Consultation: ACC released its proposed levy rates for public consultation which
included a proposed decrease to the average work account levy and an increase in
the levy rates for the Earners’ Account and the Motor Vehicle Account. Early analysis
from feedback received indicates broad support across the Work Account proposals.
• Analysis indicates that the slight increase in NTS is likely driven by some
improvements regarding ease of dealing with ACC and communication, along with
stable results relating to provision of treatment and support.
• Improvements were seen in some ease/effort related measures for Assisted
Recovery (NTS increased to +28 from +25). Specifically, satisfaction increased
relating to handling of claims, and agreement regarding reaching ACC staff without
difficulty.
• However, there has been a downward trend evident in Supported Recovery across
the last few quarters, with NTS at +2 (from +9). This decline appears to be driven by
a decrease in the proportion of clients who agree it takes little effort to deal with
ACC.
• These key areas continue to be our focus to improve the experience of clients. This
quarter the following initiatives were focused on:
• A new dedicated team to provide welcome conversations to clients within
Assisted Recovery and connect with the client’s employer. These conversations
ensure the employer understands their role in their employee’s recovery. This
will improve timeliness to onboard clients, provide consistent expectations on
entitlements (as well as timely set up), and establish appropriate rehabilitation
journeys.
• A review of clients within Supported Recovery who have been with ACC for 1-
2.5 years commenced this quarter. This work will ensure clients are receiving
the appropriate level of service to support their rehabilitation.
• Embedding ACC’s single inbound call channel, reducing reduced call wait times
and improving task responsiveness. This is also increasing the capacity of staff
to focus on the rehabilitation needs of injured clients.
• Adding an additional key moment to Heartbeat, ACC closed loop feedback
platform, to monitor the experience of clients being transitioned between
recovery teams and take action to recover service experience when required.
Client NTS: Business NTS:

12
Customer Experience: Māori Access
MEASURE MOST RECENT
RESULT
YTD
ACTUAL
TREND FULL YEAR
TARGET
FULL YEAR
OUTLOOK
2020/21
ACTUAL
Client net trust score for Māori September 2021 +23 Improving +28 G +20
Māori lodgement ratio September 2021 0.82 Stable 0.83 G 0.82
• A contributor to the increase in Client NTS for Māori this quarter may relate to an
external engagement campaign that was run to promote the understanding
and uptake of the Rongoā Māori Service and support improved access, experience
and outcomes for injured Māori. This campaign included social media activity, which
had strong reach and positive engagement, and media coverage across national and
regional platforms.
Actions underway
• We currently have a number of initiatives underway that support improving equity of
access, experience and outcomes for Māori who are injured:
• Rongoā Māori Service: We are continuing to build relationships with more
practitioners across Aotearoa and strengthen service controls. We have
completed the national education programme to support the cultural capability
of our client-facing kaimahi. This included learning huddles, support resources,
and workshops with Māori Health kaimahi.
• Kaupapa Māori Health Services: Progress to develop a new pathway for
ACC clients and whānau continues. The current focus is on the procurement
phase of the first tranche of this developing pathway, in the Tainui rohe,
following a temporary pause due to COVID-19 restrictions.
• Raranga: This new project intends to focus on uplifting the cultural safety of all
ACC services in order to improve access, experience and outcomes for Māori,
and for all. The project team’s initial responsibility will include reviewing existing
cultural safety standards in ACC contracts and documents and exploring
opportunities for improvement. The term ‘raranga’ means ‘to weave’ and
reflects the respectful braiding and balancing of te ao Māori and ‘universal’
worldviews, knowledge and practises that ACC intend to bring to its services.
• Hāpai: The Hāpai – Te Pihinga pilot launched in the Kāhui o te Uriteria region
this quarter. The pilot will enable clients to engage with ACC in a more te ao
Māori way. The pilot will run for six months through until January 2022.

13
MEASURE MOST RECENT
RESULT
YTD
ACTUAL
TREND FULL YEAR
TARGET
FULL YEAR
OUTLOOK
2020/21
ACTUAL
Speed of cover decisions - non-complicated claims September 2021 0.9 days Stable <0.9 days G 0.9 days
Speed of cover decisions - complicated claims September 2021 72 days Deteriorating <70 days G 66.9 days
Customer Experience: Timeliness and Reviews
• The September monthly complicated cover decision result was 72 days; improved
from 73.3 days in August.
• The performance in the earlier part of the current rolling 12-months was much better
than it is now.
• Deterioration is primarily driven by Treatment Injury and Late Lodged decisions.
However, Late Lodged timeliness has improved from 68 days in August to 60 days in
September.
Speed of cover decisions – Complicated claims
MEASURE MOST RECENT
RESULT
YTD
ACTUAL
TREND FULL YEAR
TARGET
FULL YEAR
OUTLOOK
2020/21
ACTUAL
Reviews as a percentage of decline decisions September 2021 8.2% Stable ≤ 8.7% G 8.5%
Average time to resolution for claims with reviews September 2021 121.3 days Stable ≤ 130 days G New Measure
Proportion of ACC reviews upheld (in favour of ACC) September 2021 90.6% Stable ≥ 86% G 90.6%
• Work is underway to understand the drivers behind why clients review suspension
decisions, outcomes at review, increase consistency across suspension decisions,
and implement strategies to improve the management of these type of reviews.
• We continue to focus on internal process changes that enable earlier engagement
with customers to discuss the review process and what resolution options are
available for them.
Actions underway to improve review performance
• Alternative Dispute Resolution provides the opportunity to engage in
meaningful conversations with an independent party to find a way forward or
resolution without the need for a formal review hearing. With the introduction of
a new ADR initiative, in September 2021 60 cases were referred through to
Talk-Meet-Resolve (August 2021 30 cases).
• We continue to focus on Hearing Loss and Treatment Injury claim decisions
which are key contributors to the deterioration:
• Hearing Loss telephone scripting has been reintroduced. This shortens
the time taken for information gathering, before a claim is assessed.
• Utilisation of reporting to stream work quicker (Treatment Injury and Late
Lodged) continues, while also building capability of decision makers.
* The average time to resolution for claims with reviews is a new measure this year. Definition: The average time (in calendar days) for reviews to be resolved from review lodgement to review outcome.

14
Customer Experience: Short-term rehabilitation: Weekly Compensation
MEASURE MOST RECENT
RESULT
YTD
ACTUAL
TREND FULL YEAR
TARGET
FULL YEAR
OUTLOOK
2020/21
ACTUAL
Return to work within ten weeks September 2021 63.6% Improving 65% G 63.3%
Return to work within nine months September 2021 90.8% Improving 91% G 90.4%
Durable return to work September 2021 74% Stable1% Higher
than Aus 1 G 72%
Average in weekly compensation days paid September 2021103.9 days
(-6.6 days)Improving
102.3 Days(-4.9 days)
A 105.9 Days(-8.5 days)
1 The Australian RTW survey.
92.4%
91.0%
90.4%
66.8%
65.0%
63.3%
62%
64%
66%
68%
85%
87%
89%
91%
93%
Jun-19 Sep-19 Dec-19 Mar-20 Jun-20 Sep-20 Dec-20 Mar-21 Jun-21 Sep-21
63.6%
90.8%
10 Week (RHS)9 Month (LHS) 10 Week Target (RHS)
RETURN TO WORK WITHIN TEN WEEKS AND NINE MONTHS - 52 WEEK ROLLING
9 Month Target (LHS)
• The ten-week and nine-month return to work rehabilitation rate has continued to
improve.
The improving trend in the past months for both measures has been largely driven by:
• The return to usual claim mix, as the proportions of shorter duration weekly
compensation claims continued to move closer to those seen in pre-COVID times
• the rolling off of the most severely impacted periods due to COVID lockdowns from
last year meaning less impact on the current measure
• continued lift in outcomes being achieved from the rehabilitation focused initiatives
that started earlier in the year
• The lag in the measures between a client ceasing weekly compensation (WC) and
subsequently being reported as an outcome means the August 2021 COVID lockdown
has not significantly affected these results yet. Based on experience from the 2020
lockdown, the impact on weekly performance results peaked approximately 9-10
weeks after the start of the lockdown. For the current lockdown, we expect to see a
similar decline in weekly short term rehabilitation results, from mid-late October 2021
for the shorter duration measures (such as the 70-day rate).
• The August 2021 lockdown has resulted in a decline in new WC claim volumes of
similar magnitude to the 2020 lockdown. However, due to a number of reasons such as
the lockdown starting at a different time in the year compared to 2020, shorter
restrictions for regions other than Auckland, and healthier economic conditions, it is
expected that the claim volume recovery will be sharper with less severe impacts on
the short term rehabilitation performance over the months ahead.
Ten-week and nine-month return to work rates
• We expect some additional deterioration relating to clients issued a suspension or vocational
independence decision immediately prior to lockdown. We have extended notice periods during
the level 3 and 4 lockdown period.
• Given that most of the rehabilitation performance measures are a 52 week/12 month rolling
average, the impact of the current lockdown can be expected to last for much of the financial year,
and will only start to unwind as volumes normalise.

15
Customer Experience: Short-term rehabilitation: Weekly Compensation
• The Average Weekly Compensation Days paid (AWCDP) has continued to improve
month on month and over much of the last quarter.
• The AWCDP measure reflects WC exits between 29 and 365 days. The changing profile
over the last few months of the WC exits has had a direct impact on the results:
• The proportion of claims with 29 - 70 days WC in the WC exits total has remained
largely unchanged over the last two months however the proportion of WC exits with
71 – 182 days improved over last month by ~ 0.5 percentage points.
• Overall, WC exits within 365 days continued with an improving trend (an additional 884
WC exits achieved last month compared to August). There was a small increase in the
proportions within 365 days from the previous month; however, there was an overall
increase in the WC exit volumes and in particular in the band 29 -365 WC days.
• The improvement in WC exit volumes within 365 days is not only having a positive
impact on the AWCD measure but it is also contributing to the improving trend of the
growth rate of the long-term claims pool.
Average weekly compensation days paidRETURN TO WORK WITHIN TEN WEEKS AND NINE MONTHS - 13 WEEK ROLLING
• The 13-week rolling averages reflect a more recent performance profile compared to the 52-week
rolling averages. It highlights performance that has been improving over the last six months has
stabilised over the last couple of months with the impact of the recent COVID lockdowns yet to be
seen.
• The Rehabilitation Outcome Groups are continuing to focus on at risk claims between 1-
182 and 183-365 days of weekly compensation. These claims are being identified
weekly using pre-defined data points. Results have remained strong and progress has
been made in the following areas;
• Automating the identification of claims at risk is being tested (initially in low numbers)
within the Rehabilitation Outcome Groups. The success of this versus the manually
identified ones will feed into continuously improving the accuracy of the modelling and
ultimately lead to a fully automated solution.
• In Supported Recovery, capability-based allocations is being piloted in two geographical
areas. The intention here is to ensure that claims with inherent outcome risks are
allocated to Recovery staff with the capability to manage those risks.
• In Assisted Recovery the dedicated teams of people focusing on client and employer
welcome conversations and recovery check-ins have achieved significant results that we
expect to flow through to tighter duration management. Welcome conversations are
being undertaken within 2 days and recovery check-ins have reduced by ~6,000.
Monitoring has verified the quality of interactions is also high.
Actions
50%
55%
60%
65%
70%
75%
50%
55%
60%
65%
70%
75%
80%
85%
90%
95%
Jul-20 Aug-20 Sep-20 Oct-20 Nov-20 Dec-20 Jan-21 Feb-21 Mar-21 Apr-21 May-21 Jun-21 Jul-21 Aug-21 Sep-21
75%
80%
85%
90%
95%
100%
Jan Feb Mar Apr May Jun Jul Aug Sep Oct Nov Dec
273-day rate (CY-20) 273-day rate (CY-21)
• The charts below represent weekly results for the ten week and the nine month rates over the
2020 and 2021 calendar years. The 2020 results (light blue line) show that weekly performance
dropped sharply about 9-10 weeks after the start of the lockdown. For the current lockdown, the
expectation is for a similar decline in short term rehabilitation results, which will be reflected in a
sharp decline in the weekly results over the coming month.
25%
35%
45%
55%
65%
75%
Jan Feb Mar Apr May Jun Jul Aug Sep Oct Nov Dec
70-day rate (CY-20) 70-day rate (CY-21)
90.7%
64.0%
WEEKLY TEN WEEK RATE PERFORMANCE WEEKLY NINE MONTH RATE PERFORMANCE
10 Week Rehab Rate (RHS)9 Month Rehab Rate (LHS) 10 Week Target (RHS)9 Month Target (LHS)

16
Customer Experience: Long-term rehabilitation: Weekly Compensation
MEASUREMOST RECENT
RESULT
YTD
ACTUALTREND
FULL YEAR
TARGET
FULL YEAR
OUTLOOK
2020/21
ACTUAL
Growth rate of the long-term claims pool September 2021 +8.1% Improving +9.5% G +8.7%
Long-term claims pool returns to independence September 2021 5,174 Improving 5,200 G 4,978
Rate of long-term clients in part-time work September 2021 12.9% Stable 11.5% G 12.6%
2 Claims receiving WC for greater than 365 days.
5,200
0
1,000
2,000
3,000
4,000
5,000
6,000
31JUL2018 31DEC2018 31MAY2019 31OCT2019 31MAR2020 31AUG2020 31JAN2021 30JUN2021 30NOV2021 30APR2022
LONG-TERM CLAIMS POOL RETURN TO INDEPENDENCE
• Growth of the long-term claims pool 2 (LTCP) has improved in the last two
quarters following low WC commencements last year due to the national COVID
lockdown. There has also been improvement in short-term rehabilitation
performance which has slowed new entries.
• In recent months, exit volumes have continued to remain relatively high.
Because of the lag in our reporting from when a client ceases WC to being
counted as an exit, results for August were similar to other months.
However, since early September the volume of LTCP exits have been lower.
• Following the August COVID lockdown, we expect some delays for long-
term clients accessing providers for medical and vocational assessments,
and other services. These delays are expected to slow the progress of
returning some clients to independence in future months.
• At this stage our full year outlook for these measures remains green.
However following the August COVID lockdown there is a degree of
uncertainty as to what our June 2022 position will be.
• All non-serious injury related return to work rates for long-term WC clients have
returned to, pre-COVID levels in March 2020.
Growth rate of the long-term claims pool
• The work in Supported Recovery focused on LTCP claims under 912 days is
continuing. So far over 500 claims have been reviewed with approximately
68% being considered on track, the balance are being considered for more
intense rehabilitation, commencement of the Vocational Independence
process or suspension of entitlements. This work is now being replicated in
Assisted Recovery.
GROWTH IN LONG-TERM CLAIMS POOL
9.5%
10,000
11,000
12,000
13,000
14,000
15,000
16,000
17,000
18,000
19,000
0%
2%
4%
6%
8%
10%
12%
14%
16%
Jul-18 Nov-18 Mar-19 Jul-19 Nov-19 Mar-20 Jul-20 Nov-20 Mar-21 Jul-21 Nov-21 Mar-22
CL
AIM
CO
UN
T
GR
OW
TH
RA
TE
(%
)
Actions
LTCP Return to Independence Target
LTCP Claim Volumes TargetGrowth Rate
5,174
8.1%

17
Customer Experience: Rehabilitation: non-weekly compensation
• September’s result for this measure has improved, up from 87.2% in both July
and August 2021 and 87.1% in June.
• Results for this measure have declined noticeably since its peak in May 2020,
which was temporarily inflated by impacts of last year’s COVID lockdown. As
this measure checks the status of new registrations after 12 months, the effects
of last year’s alert level restrictions were felt later on.
• Although there has been some improved results in recent months, we may see
another temporary rise in this rate soon. This is because clients who are not
able to access services during the 2021 COVID lockdown may be counted as
having returned to independence when they may in fact still require further
services. However, at this point in time it is too early to say how this will affect
results.
Return to independence for those not in the workforce.
MEASURE MOST RECENT
RESULT
YTD
ACTUAL
TREND FULL YEAR
TARGET
FULL YEAR
OUTLOOK
2020/21
ACTUAL
Return to independence for those not in the workforce September 2021 87.5% Improving 87.5% G 87.1%
RETURN TO INDEPENDENCE FOR THOSE NOT IN WORKFORCE - 52 WEEK ROLLING
87.5%
RTI for those not in the workforce Target
85%
86%
87%
88%
89%
90%
Jul-20 Aug-20 Sep-20 Oct-20 Nov-20 Dec-20 Jan-21 Feb-21 Mar-21 Apr-21 May-21 Jun-21 Jul-21 Aug-21 Sep-21

18
Sustainability: Financial KPIs
MEASURE MOST RECENT
RESULT
YTD
ACTUAL
TREND FULL YEAR
TARGET
FULL YEAR
OUTLOOK
2020/21
ACTUAL
Actuarial movement June 2021 +1.08% StableWithin
-3% to +1.5% G +1.08%
Investment performance after costs relative to benchmark September 2021 +0.32% Improving +0.15% G +1.90%
Investment management costs as a proportion of total funds under management September 2021 0.15% Stable 0.15% G 0.14%
Change in average treatment cost per claim September 2021 +6.0% Stable ≤ 5% A +6.1%
Administration cost per claim September 2021 $1,509 Stable $1,4593 A $2,403
Percentage of total expenditure paid directly to clients or for services to clients September 2021 87.7% Stable 88.2%3 A 88.3%
Claims processed per FTE September 2021 549 Deteriorating 583 A 580
Average care hours per serious injury claim September 2021 1,393 Stable 1,387 G 1,396
Change in average treatment cost per claim September 2021 +6.0% Stable ≤ +5.0% A +6.1%
• Decreased to 549 reflects 157,000 fewer claims and 58 fewer FTE than Budget. Year-end
performance is at risk.
• Our current forecast includes a ~150 increase in FTE compared with budget. Most of this
increase is additional resources to support all our customers recovering from injury
through the customer contact centre (One Front Door). Other growth areas are the
Customer Group restructure, Pae Ora and Investments.
• The reduction in new claims volumes resulting from the COVID alert level 4 lockdown
could affect this result further. We do however expect claim volumes to bounce back as
we come out of lockdown.
Claims processed per FTE
Administration cost per claim and % of expenditure paid directly to clients
• Increased FTE forecast increases administration costs. The COVID lockdown may reduce
claims costs. This makes achieving this target uncertain.
3 Presented on a YTD basis for comparability. Full year targets are $2,762 and 88.5% as outlined in the Service Agreement 2021/22.
(Previously: G)
(Previously: G)
• The rolling 12-month growth in average treatment cost per claim increased 0.2% ($4)
to +6.0% ($35) in September 2021. This measure includes the change in the volume
of claims accessing services, price and utilisation of services.
• With in-person access to many services extremely limited during alert levels 3 and
4,claims mix changes occur due to fewer clients with lower acuity injuries accessing
treatment. This increases the ratio of clients with higher acuity injuries, which tend to
have higher treatments per claim.
• Counselling, Hand Therapy, Dental and Physiotherapy all currently have above
budget increases in costs per claim. These are offset by lower than budget Surgery,
Audiology and Radiology costs
• Fewer minor injury claims and reduced access to services as a result of COVID
restrictions will influence this measure over the next 12 months.
Average treatment cost per claim

19
Sustainability: Financial Summary
$m YTD
ACTUAL
YTD
BUDGET
YTD
STATUS
FULL YEAR
BUDGET
Income
Levy revenue 1,269 1,279 A 5,175
Interest, dividend and rental income 4 329 289 G 1,044
Other income - 1 1
Total income 1,598 1,569 G 6,220
Expenditure
Claims paid (1,355) (1,433) G (5,759)
OCL expected (increase)/decrease (329) (306) A (1,523)
OCL net losses from other factors - - -
URL (increase)/decrease 411 337 G (8)
Core operating costs (124) (124) G (501)
Other operating costs (72) (74) G (278)
Total operating costs (196) (198) G (780)
Total expenditure (1,469) (1,600) G (8,070)
Surplus / (deficit) from insurance
operations129 (31) G (1,850)
Net gains (losses) on investments147 69 389
Net gains (losses) in discount and
inflation rates on OCL(3,026) 0 -
Net (deficit) surplus (2,750) 38 (1,461)
• Levy revenue is $10m or 0.9%, below budget year to date, mainly from
unfavourable variances in the Work Account $6m and Earners Account $10m.
This is offset by favourable variances in the Motor Vehicle Account and Non-
Earner’s Account. The unfavourable variances are due to reduced liable earnings
for self-employed (Work and Earners accounts) and a reduction in the weighted
average levy rate for standard employers reflecting a lower rate achieved to date
on provisional invoices issued for the 2021/22 year.
• Total investment income of $476m is $118m higher than budget of $358m year to
date. The investment reserves portfolio has returned 1.00% after costs September
year to date, outperforming the benchmark by 0.32% after costs.
• Total claims paid YTD are $78m or 5.4% under budget. This is mainly due to the
lockdown impact on treatment volumes along with smaller variances in some
rehabilitation services. Weekly compensation is over budget due to increased
claims volumes, but partly offset by the lockdown impact on new claims as well as
lower wage inflation.
• New registered claims growth is up 9.7% and new weekly compensation claims
growth is up 17.4%.
• Total operating costs are $2m or 1.0% under budget. This includes
• Injury Prevention costs are $7m or 23.3% under budget which but is still
expected to be on budget full year. Risk exist with some programme delivery
impacted by the COVID lockdowns.
• Enterprise Change Programme operating costs are $5m or 20.0% over budget
due to the additional effort for initiatives supporting the data centre exits,
including Health Sector Strategy Tech ART (T-ART) and Te Kahu (Corporate
Enterprise Resource Planning) project.
Key points
4 In line with the intention to exclude gains and losses on investments relating to market movement and economic factors impacting OCL
within the return from insurance operations sub-total, income relating to interest, dividend and rental income are recorded separately.

20
The OCL has increased by $3.4b YTD to $58.7b. Economic movements resulted in a YTD
increase of $3.0b.
OUTSTANDING CLAIMS LIABILITY
• The single effective discount rate decreased 7 basis points to 2.87% in September
(3.0% in June 2021).
• A new 30 year bond was issued in September. This has changed the shape of the
discount rate curve and means reaching the long term discount rate of 4.30% has
been pushed out a further 10 years.
• The YTD OCL increase due to discount rates is $2.0 billion.
• The projected inflation over the medium term (up to 2037) increased 7 basis points
to 2.01% at the end of September 2021 (1.88% June 2021).
• The YTD OCL increase due to inflation projections ($962 million), and the
difference between actual versus expected inflation ($92 million) totals $1,054
million.
Inflation Rate movements.
Sustainability: Outstanding Claims Liability
FUNDING SUFFICIENCY
125.7%
106.7%
115.1%
76.3%
72.9%
153.0%
2017/18 2018/19 2019/20 2020/21 Jul-21 Aug-21 Sep-21 Oct-21 Nov-21 Dec-21 2021/22Budget
Earners' portion of Treatment
Injury - pre and post 1999Work Motor Vehicle Earners’
Non-earners’ – Post 2001 Funding Ratio TargetNon-earners' portion of
Treatment Injury - post 2001
153.5%
123.7%
114.5%
106.5%
76.8%
75.6%
LEVIED AND NON-LEVIED FUNDING RATIOS
• The funding position is the measure of the applicable assets available to cover the value of what is
intended to be the fully funded portion of the liabilities in each Account. The funding position is
expressed as a ratio of the assets divided by the liabilities for each Account. The calculation of the
applicable assets and liabilities is defined in the funding policy.
• Where there is a positive funding balance, the assets exceed the liabilities and the funding ratio is
greater than 100%. When there is a negative funding balance, the assets are less than the
liabilities and the funding ratio is less than 100%.
• The funding position is influenced by several factors including our investments, economic factors,
claiming behaviour being different to expectations and approval of recommended levy changes.
These have a cumulative impact to result in under or over funding of the Accounts.
• All funding ratios have improved from June mainly due to the affect of changes in external
economic factors on the Outstanding Claims Liability.
Discount rates continues to fluctuate.
55,387
58,742
329
1,054
1,972
50,000
52,000
54,000
56,000
58,000
60,000
OCL as at
01/07/2021
Expected increase Inflation related
changes
Discount rate
assumptions
OCL as at
30/09/2021
OCL: ANALYSIS OF CHANGE ($m) YTD

215 The OCL multipliers are calculated by dividing the OCL by the 2020/21 cash cost. Multipliers can be used as a proxy for duration and
represent the sensitivity of OCL to the movement in cash costs. Sensitive claims are modelled as a separate payment type in the OCL now.
The impact of these claims is not included in the above multipliers. Sensitive claims impact weekly compensation and medical treatment.
$m AVE ANNUAL GROWTH
FY19 – FY21
GROWTH ON
PRIOR YTD
YTD
ACTUAL
YTD
BUDGET
VARIANCE % VARIANCE YTD
STATUS
FY
BUDGET
OCL
MULTIPLIER5
Weekly compensation (15)% (12)% 467 458 (9) (2)% A 1,870 X7.7
Other compensation 5% 8% 48 53 5 9% G 210
Total compensation (12)% (10)% 515 511 (4) (1)% A 2,080
Vocational rehabilitation 13% 32% 14 23 9 39% G 96 X3.1
Social rehabilitation (10)% (10)% 252 267 15 6% G 1,076 X28.5
Serious injury (5)% (22)% 154 161 (7) (5)% A 648 X41.5
Non-serious injury (21)% 13% 98 106 8 8% G 428 X6.4
Total rehabilitation (7)% (6)% 266 291 25 8% G 1,172
Medical treatment (9)% 5% 232 269 37 14% G 1,081 X2.9
Elective surgery (10)% 7% 112 125 13 10% G 481 X9.6
Public health acute services (6)% (13)% 163 157 (6) (3)% A 630
Other treatments (15)% (7)% 58 62 4 6% G 246
Total treatment (9)% 0% 565 613 48 8% G 2,438
All Other misc. expenses 1% 15% 9 18 9 47% G 69
Total claims paid (10)% (5)% 1,355 1,433 78 5% G 5,759
Increases in costs and higher costs than budget are depicted as negative percentages
Sustainability: Claims Costs – 30 September 2021

22
Sustainability: Claims Costs
• Total claims costs are under budget $78m (5%) YTD.
• COVID alert level restrictions have resulted in fewer treatment and rehabilitation
services being delivered, particularly in Auckland. This impacts not only on treatment
volumes but also lowers the average cost per claim. Uncertainty remains on when
Auckland will move to level 2 restrictions, or whether other parts of the country will
move into level 3 restrictions. Once Auckland returns to level 2, we expect to see a
catch up wave of both new claim volumes and increased service provision costs.
• Compensation costs are unfavourable by $4.6m (0.9%) YTD. For the month of
September compensation is favourable by $4.4m (2.6%) primarily as a result of fewer
new weekly compensation claims from alert level restrictions. We stopped all
suspension of weekly compensation decisions during level 4, and in level 3
suspension decisions need Client Service Leader approval. If a suspension decision
is made, clients will be provided with an additional two weeks notice than business as
usual timeframes. This will result in additional costs whilst level 3 continues but will be
offset by fewer claims.
• Further information on Weekly Compensation and Social Rehabilitation costs and
their impact on the OCL follows.
• Telehealth can be used where clinically appropriate for most treatment and
rehabilitation services under alert level 3 and 4 restrictions. This is dependent on
clients and providers both having access and capability to use the technology. The
largest users of telehealth are Physiotherapists, Hand Therapists and GPs. Over
35,000 telehealth consultations took place in the first full week of lockdown.
Telehealth utilisation has declined from 7 September when areas outside of Auckland
moved to level 2.
• Elective Surgery volumes continue to be impacted by the alert level restrictions in
Auckland. Costs are $13m (10%) favourable YTD. While most elective surgery in
Auckland could take place from 21 September (alert levels dropped), we are yet to
see volumes move closer to expected levels. This should align more closely to
expectations in October 2021.
Other services
Total claims paid
• Public Health Acute Services (PHAS): As per the June 2021 Board paper,
approved PHAS costs are $21m higher than budget. This is due to the final price
increase (12.35%) being higher than the budgeted price increase (8.9%). This
increase reflects demographic and cost pressures, and funding to support reducing
the Ministry of Health estimated gap between the PHAS price and the cost of
delivering PHAS services to clients. This has been incorporated into current
forecasts.
• Social rehabilitation non-capital costs: Factors such as pay equity agreement
changes, payment rates for in-between travel and workforce shortages / skill mix
changes will potentially put pressure on care costs.
• Non-Acute Rehabilitation (NAR): DHBs have requested that ACC reviews NAR
pricing. The DHBs cited a ~30% discrepancy between the rate ACC uses (for both
existing NAR and new Non-Acute Rehab Pathways contracts) and the cost to DHBs
(using rates from four DHBs). Three major DHBs have yet to sign the new contracts
due to pricing concerns but continue to provide services. A pricing review is
underway. Additional washups from the original pilot exceeded the accrued amount
putting pressure on 2021/22 budgets.
• Sick leave and Public holidays: Part year risk of potentially applying the increase in
sick leave allowances and the Matariki public holiday into the labour cost component
of our contract pricing from late 2021 This affects services such a Residential Support
Services and Home and Community Support Services.
• Air Ambulance cost pressures: Additional funding will be required to cover flight
hours where agreed annual limits have already been exceeded.
• High Tech Imaging (HTI): HTI volumes and demand are likely to continue to grow,
with both surgeons and client’s expectations of using HTI to support diagnosis and
treatment becoming more common. ACC received an external review of HTI services
in September 2021 and is currently considering the findings in the report in order to
plan how best to respond.
Risks to budget

23
KEY INSIGHTS CLAIMS COSTS
OCL IMPACT ACTIONS TO ADDRESS
OCL @ 30 September 2021: $13.2b
Claims < 5 years: ~$5.4b
Claims > 5 years: ~$7.8b
Influenceable OCL impact
@ 30 June 2021:(valuation result using 31 March
2021 data)
$503m
strain
Influenceable strain over past 7
years to 30 June 2021:$1,973m
• June 2021 quarter payments were only 0.1% higher than
expected based on the June 2021 OCL valuation. The
number of active weekly compensation claims was 4.3%
higher than expected, mainly caused by more new claims
for the 2021 accident year. This was partially offset by
average claim costs for the June quarter being 4% below
expected in most accident years including 2021.
• It is unclear at this stage how long the COVID-19
restrictions will be in place and how this may impact
rehabilitation rates.
• Claims over 5 years old are staying on claim longer than
expected. If this trend continues, this could result in
significant OCL strain (>$100 million) at the December
valuation
• The June 2021 quarter actual claim payments are indicating an OCL strain of around $15 million for the December
2021 valuation (excluding the strain for claims over 5 years risk mentioned above). Most of the strain is currently
coming through the Earners’ and Work accounts. There are small releases in Motor Vehicle and Non-Earners’.
WEEKLY COMPENSATIONOCL $13.2b to June 2021 BUDGET $1,870m
OCL6 BREAKDOWN
• The volume of new claims has fallen during the lockdowns due to a decline in injuries, especially outside the
home. Existing claims are staying on claim longer than expected, with the pause of weekly compensation
suspensions during these periods a contributing factor. The fall in new claims offset the higher continuance rates
for existing claims.
• Last lockdown, it took a significant period to see rehabilitation measures recover. It remains unclear how
rehabilitation performance may be impacted by this lockdown.
• During previous lockdowns, there was an expectation that unemployment would increase significantly, and the
economy would take some time to recover. The economic recovery was faster than expected and employment
levels returned close to pre-COVID-19 levels. This meant that new weekly compensation claims returned to
normal levels quickly. We expect similar results to follow the current lockdown.
POTENTIAL COVID-19 LOCKDOWN IMPACT
• Total compensation costs are $5m (1%) over budget YTD. The
weekly compensation component is $9.3m overbudget YTD.
For September 2021, compensation costs are $4m (2.6%)
favourable of which, the weekly compensation component is
$3m (2.1%) favourable.
• Higher than expected volumes and durations YTD have
increased compensation costs by 1.6%. Lower than estimated
wage inflation, has however provided an offset of 2.0%.
• We expect that impacts from this COVID outbreak will be felt
for several months due to an extended period of lockdown for
Auckland and changes to suspension of weekly compensation
decisions whilst businesses are unable to operate in level 3.
• Factors outside of ACC’s control such as capacity issues for
specialist assessment and treatment may result in a prolonged
recovery and clients requiring longer periods receiving weekly
compensation.
• Further comments on weekly compensation, rehabilitation
performance and actions to address cost growth are included
in the previous short-term and long-term rehabilitation sections.
6 All OCL figures quoted in this paper include risk margin, liability for the Accredited Employers
Programme and exclude liability for gradual process Incurred But Not Reported claims.

24
OCL @ 30 September 2021: $22.2b
Claims < 5 years: ~$5.1b
Claims > 5 years: ~$17.1b
Influenceable OCL impact
@ 30 June 2021:(valuation result using 31 March
2021 data)
$129m
Strain
Influenceable strain over past
7 years to 30 June 2021:$1,439m
Non-Serious Injury non-capital:
• June quarter actual claim payments were 5.9% higher than
expected in the June 2021 valuation. Both active claims (4.3%)
and average costs (1.5%) were higher than expected.
Serious Injury non-capital:
• June quarter payments for attendant care were 3.1% lower than
expected in the June 2021 valuation. Attendant care hours were
1.7% below expected.
• The mix in care (between contracted and non-contracted) over
the quarter resulted in the average care rate being 2% lower than
expected. New serious injury claims are close to expected for the
June 2021 quarter but are still lower than pre-COVID-19 levels.
Non-Serious Injury: The experience is indicating a strain of around $6.5 million.
Serious Injury: Serious injury OCL impact is reassessed half-yearly.
SOCIAL REHABILITATION NON-CAPITAL OCL $22.2b, 2021/22 BUDGET $648m(non-capital payments includes attendant care, residential care, travel, assessments and active rehabilitation such as training for independence)
OCL BREAKDOWN KEY INSIGHTS
OCL IMPACTACTIONS TO ADDRESS
• We expect fewer new claims (both serious and non-serious) that require social rehabilitation
services. This is due to less traffic on the roads and fewer people taking part in higher risk
activities. After previous lockdowns, there was a significant catch up in the number of non-
serious injury claims. We expect a similar trend after this lockdown.
• Contracted and non-contracted care hours for existing clients may increase, as it did during
the previous lockdowns, due to increased support requirements while clients have limited or
constrained access to normal support services.
• It took some time to return clients back to normal care hours after the last lockdown. If
additional support hours remain in place, this will result in a significant OCL strain.
POTENTIAL COVID-19 LOCKDOWN IMPACT
CLAIMS COSTS
7 Personal supports include home care, residential care and inpatient rehabilitation
• While average care hours for serious injury claims have been reducing, there has
been growth in non-serious injury care hours per claim. We will review how
sustainable the actions implemented following the Attendant Care Proposition
Design earlier in 2021 have been. This will help us understand any further actions
needed to ensure appropriate controls are in place. Considerable work is still
needed in both contracted and non-contracted care hours to be able to realise
the targeted OCL release.
• Changes were made to the TFI adults with other injuries contract, and training
provided to frontline staff to ensure referrals for TFI programmes were targeted at
the right clients. Analysis has shown that these changes had made an impact
prior to the August lockdowns. Further work will take place to consider how to
optimise service utilisation across the range of different TFI services and ensure
clients who are not appropriate for TFI are referred onto other suitable services.
• Personal supports costs7 are $5.6m (3.4%) favourable
YTD.
• Average cost per claim for contracted care is over
budget for both serious injury and non-serious injury
clients. This is offset by under budget non-contracted
care (lower average costs and volumes).
• An improving trend in average care hours per serious
injury claim has been seen in the last quarter although
the impact of COVID lockdowns has resulted in
additional care hours being provided during August and
September. This is to ensure client needs are met while
access to other services (e.g. schools / daytime
activities) are restricted.
• Training for Independence (TFI) costs are $1.6m
favourable YTD. The significant growth seen over recent
years has started to abate as a result of targeted
actions to ensure the right clients are referred into TFI
services.

25
KEY INSIGHTS
OCL IMPACT ACTIONS TO ADDRESS
OCL @ 30 September 2021: $3.5b
Claims < 5 years: ~$0.8b
Claims > 5 years: ~$2.7b
Influenceable OCL impact
@ 30 June 2021:(valuation result using 31 March
2021 data)
$4m
strain
Influenceable strain over past
7 years to 30 June 2021:$600m
Non-Serious Injury
• Actual claim payments were 15.8% above expected in the June 2021 quarter.
Both active claim volumes (10.7%) and payments per active claim (4.6%) are
higher than expected.
• This was largely due to housing modifications increasing in volumes and cost.
Serious Injury
• June quarter actual payments were 4.3% higher than expected in the valuation,
mainly driven by spending on housing modifications and consumables.
• We anticipate a resurgence in demand for capital equipment following the
lockdown. This is unlikely to have a significant impact on the Outstanding
Claims Liability.
• Higher than expected capital claims growth has occurred at the same time as
higher than expected attendant care growth. It is reasonable to expect some
capital items purchased should reduce the requirement for attendant care. For
example, housing modifications making it possible for an injured client to do
more independently. It is not clear why there is no obvious offset to the amount
spent on capital and attendant care hours.
Non-Serious Injury: If experience continues there will be a strain, potentially up to
$30 million, in December.
Serious Injury: Serious injury OCL impact is reassessed half-yearly.
SOCIAL REHABILITATION CAPITAL OCL $3.5b, 2021/22 BUDGET $205m
OCL BREAKDOWN CLAIMS COSTS
• During the previous lockdowns, we saw an underspend in equipment and
modifications (vehicle and housing). This was followed by a significant catch-up and
resurgence in claims in the following quarters. We expect a similar trend to occur.
•
• Supply chain pressures in the construction industry partly driven by lockdowns are
causing delays and cost pressure on housing modifications.
• New claim volumes are likely to be low during level 4 and 3 lockdowns but return to
normal levels from level 2.
POTENTIAL COVID-19 LOCKDOWN IMPACT
• Capital costs continue to be affected by factors outside of ACC’s control, e.g. higher labour
and material costs in construction services, higher importation costs for motor vehicles etc.
This creates additional challenges in achieving a sustained change in trajectory that would
impact positively on OCL strain.
• Training has been rolled out this quarter across Partnered and Supported recovery teams to
improve participation in site visits. This aims to mitigate risks of scope creep and enable ACC
to be clear on expectations on what can and cannot be funded from the outset. Technological
options are being used to facilitate virtual visits when a physical presence is not feasible.
• A new supplier has been selected to supply Managed Rehabilitation Equipment Services from
1 November 2021. Work is underway to transition the service following which, a co-design
process will be used to develop improved cost management outcomes with the new supplier.
• Capital costs for home modifications are $1.6m
favourable YTD (19%), Higher costs for complex
housing modifications as a result of increasing
labour and materials costs are offset by lower
claim volumes and average costs per claim from
alert level restrictions
• Equipment costs are $4.4m favourable YTD with
lower volumes being offset to some extent by
higher costs per claim.
• Motor vehicle modifications are $0.7m
favourable (14.4%), again with lower costs per
claim and volumes.

26
Organisational Capability: People
MEASURE MOST RECENT
RESULT
YTD
ACTUAL
TREND FULL YEAR
TARGET
FULL YEAR
OUTLOOK
2020/21
ACTUAL
Employee net promoter score June 2021 0 Stable +12 G 0
Proportion of ACC staff who identify as Māori June 2021 11.4% Stable 12.5% A 11.4%
Proportion of ACC staff who identify as having a disability June 2021 12.2% Stable 14.0% A 12.2%
Total recordable injury frequency rate September 2021 2.0 Stable <3.5 G 1.7
Lost-time injury frequency rate September 2021 1.5 Stable <1.1 G 1.1
Employee engagement Diversity and Inclusion
• The Executive engagement action plan is still a key focus and regular agenda
item with particular emphasis on flexibility, workload and communications.
There has been significant interest and positive feedback about the home
technology packages and well-being days. Both initiatives contribute to our
wider flexibility and well-being agenda. Over 1,800 technology packages have
been taken up so far and the offer of well-being days has been well received by
our people.
• The Pulse survey will open on 3 November, with results scheduled to be
shared in the first week of December.
• ACC’s employee turnover rate (12 month rolling) is increasing and is currently
16.8% (annualised). This is up from 11.2% at the same time last year but still
below the rate of 17.5% two years ago. We expect that the turnover rate will
continue to increase with the current employment market conditions and the Te
Kawa Mataaho pay guidance impact. We continue to focus on our people’s
development and targeted remuneration initiatives where required for retention.
• The participation of Māori and disabled staff continues to be an area of focus.
Our recruitment during September resulted in:
• 12.4% of external candidates who were offered roles were Māori;
• 11.3% of new hires were Māori, compared to 14.6% of all applicants.
• We continue our focus on disabled candidates through the recruitment
process, however the numbers are often under-represented as candidates
choose not to disclose their disability status at the time. During September
10.5% of external candidates who were hired identified as having a disability,
compared to 9.7% of all applicants.

27
Organisational Capability: People
Health, Safety and Wellbeing
• There were no recordable injuries during September. The lost time injury
frequency rate is above target for the year but we expect it to reduce over
the coming months. For the total recordable injury frequency rate, we are
ahead of target.
• ACC is continuing to actively manage stress incident claims received from
our people. This month we recorded our equal lowest level of workplace
stress incidents since January 2021. We are providing a deep dive into
workplace stress incidents at the October People and Remuneration
Committee meeting.
3.5
1.1
0
6
Jun-20 Aug-20 Oct-20 Dec-20 Feb-21 Apr-21 Jun-21 Aug-21 Oct-21 Dec-21
2.0
1.5
Other Recordable InjuriesLost Time Injuries TRIFR(12 Months)
LTIFR(12 Months)
TRIFR Target(12 Months)
LTIFR Target(12 Months)
NUMBER OF WORK RELATED STRESS INCIDENTS (REPORTED: 01/07/2020 – 30/09/2021)
6
12
13
15
14
10
4
17
20
24
27
21
12
20
12
0
5
10
15
20
25
30
31/07/2020 30/09/2020 30/11/2020 31/01/2021 31/03/2021 31/05/2021 31/07/2021 31/09/2021
NU
MB
ER
OF
IN
CID
EN
TS

28
Organisational Capability: Information and Technology
MEASUREMOST RECENT
RESULT
YTD
ACTUALTREND
FULL YEAR
TARGET
FULL YEAR
OUTLOOK
2020/21
ACTUAL
The number of category 3, 4 or 5 privacy breaches and near misses September 2021 0 Stable< 3
No Category 5 G 0
• 37 breaches were reported in September 2021, one at harm level
two and 36 at harm level one.
• The level of low-level breaches continues to be high, however
incidents are being well managed at the frontline.
• We have established a working group to review privacy issues
occurring in frontline teams. Privacy messaging to frontline staff
continues on a fortnightly basis.
MEASUREMOST RECENT
RESULT
YTD
ACTUALTREND
FULL YEAR
TARGET
FULL YEAR
OUTLOOK
2020/21
ACTUAL
Overall operational system availability September 2021 99.9% Stable 99.5% G 99.9%
• There were 2 incidents in September, including one medium impact event
(EOS) and one with no impact.
• The medium impact event meant frontline staff were unable to open
documents in EOS for reference when speaking with clients one morning until
8:45am. This was an unexpected consequence from a planned change and
was rolled back.
Operational Performance and incidents

29
ICIP: Integrated Change Investment Portfolio
The following is a summary of the status of our integrated change investment portfolio expenditure and benefit measures
$mMOST RECENT
RESULT
LIFE TO DATE
ACTUAL
LIFE TO DATE
BUDGET
FULL YEAR
OUTLOOK
LIFE TO DATE
JUNE 2021
WHOLE LIFE
BUDGET
Total cost September 2021 541 546 G 524 669
MEASUREMOST RECENT
RESULT
YTD
ACTUAL
FULL YEAR
TARGET
FULL YEAR
OUTLOOK
2020/21
ACTUAL
PAGE
REFERENCE
Client net trust score September 2021 +26.0 +31 G +25.0 10
Provider net trust score September 2021 -24.0 -13.0 A -25.0 10
Business net trust score September 2021 -21.0 -5.0 A -17.0 10
Claims processed per FTE September 2021 549 583 A 580 18
Average in weekly compensation days paid September 2021103.9 days
(-6.6 days)
102.3 Days(-4.9 days)
A 105.9 Days(-8.5 days)
14
Employee net promoter score June 2021 0 +12 G 0 26
30
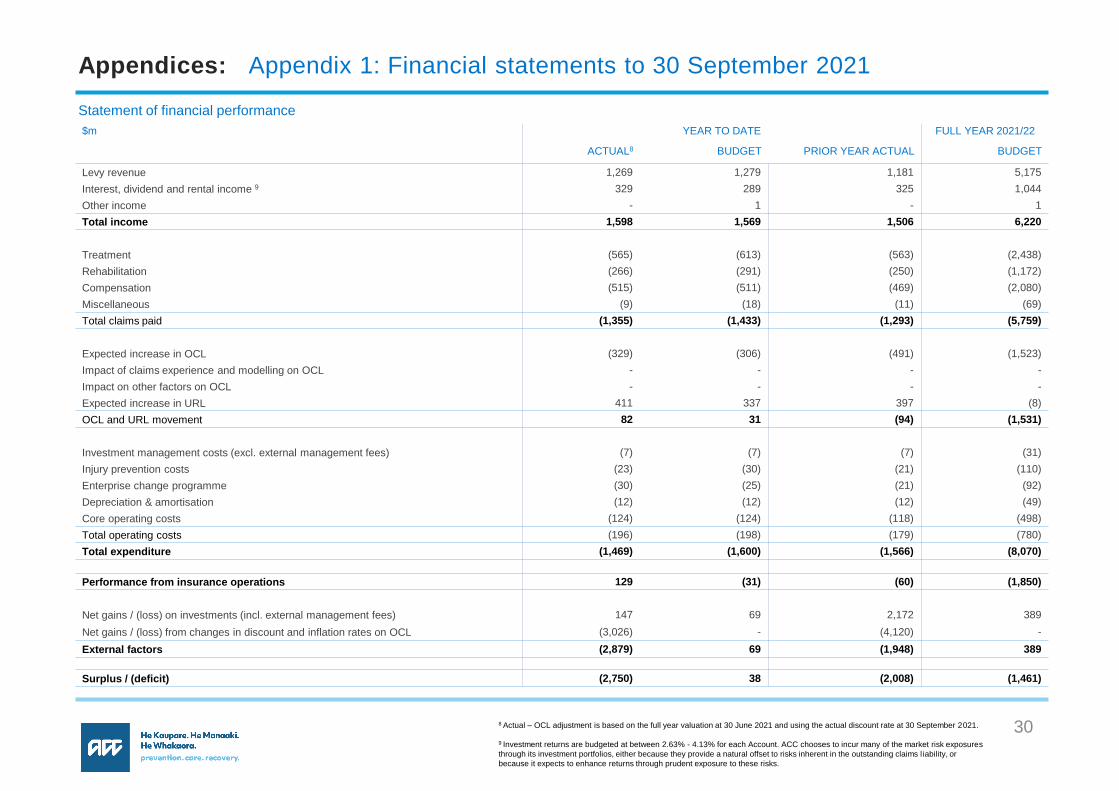
Appendices: Appendix 1: Financial statements to 30 September 2021
$m YEAR TO DATE FULL YEAR 2021/22
ACTUAL8 BUDGET PRIOR YEAR ACTUAL BUDGET
Levy revenue 1,269 1,279 1,181 5,175
Interest, dividend and rental income 9 329 289 325 1,044
Other income - 1 - 1
Total income 1,598 1,569 1,506 6,220
Treatment (565) (613) (563) (2,438)
Rehabilitation (266) (291) (250) (1,172)
Compensation (515) (511) (469) (2,080)
Miscellaneous (9) (18) (11) (69)
Total claims paid (1,355) (1,433) (1,293) (5,759)
Expected increase in OCL (329) (306) (491) (1,523)
Impact of claims experience and modelling on OCL - - - -
Impact on other factors on OCL - - - -
Expected increase in URL 411 337 397 (8)
OCL and URL movement 82 31 (94) (1,531)
Investment management costs (excl. external management fees) (7) (7) (7) (31)
Injury prevention costs (23) (30) (21) (110)
Enterprise change programme (30) (25) (21) (92)
Depreciation & amortisation (12) (12) (12) (49)
Core operating costs (124) (124) (118) (498)
Total operating costs (196) (198) (179) (780)
Total expenditure (1,469) (1,600) (1,566) (8,070)
Performance from insurance operations 129 (31) (60) (1,850)
Net gains / (loss) on investments (incl. external management fees) 147 69 2,172 389
Net gains / (loss) from changes in discount and inflation rates on OCL (3,026) - (4,120) -
External factors (2,879) 69 (1,948) 389
Surplus / (deficit) (2,750) 38 (2,008) (1,461)
8 Actual – OCL adjustment is based on the full year valuation at 30 June 2021 and using the actual discount rate at 30 September 2021.
9 Investment returns are budgeted at between 2.63% - 4.13% for each Account. ACC chooses to incur many of the market risk exposures
through its investment portfolios, either because they provide a natural offset to risks inherent in the outstanding claims l iability, or
because it expects to enhance returns through prudent exposure to these risks.
Statement of financial performance

31
Appendices: Appendix 1: Financial statements to 30 September 2021
$m YEAR TO DATE 2021/22
ACTUAL BUDGET PRIOR YEAR ACTUAL BUDGET
Levy Revenue 205 210 188 850
Interest, dividend and rental income 73 69 75 248
Other income - - - -
Total Income 278 279 263 1,098
Total claims paid (244) (253) (238) (1,024)
Increase / (decrease) in outstanding claims liability (21) (7) (24) (76)
Movement in unexpired risk liability 125 99 125 (10)
Total operating costs (60) (59) (57) (231)
Total expenditure (200) (220) (194) (1,341)
Performance from Insurance Operations 78 59 69 (243)
Net gains / (loss) on investments (incl. external management fees) 19 4 440 40
Net gains / (loss) from changes in discount and inflation rates on OCL (303) - (512) -
External factors (284) 4 (72) 40
Surplus / (Deficit) (206) 63 (3) (203)
Work account
Motor Vehicle account
$m YEAR TO DATE 2021/22
ACTUAL BUDGET PRIOR YEAR ACTUAL BUDGET
Levy Revenue 118 114 102 460
Interest, dividend and rental income 101 92 99 332
Other income - - - -
Total Income 219 206 201 792
Total claims paid (170) (216) (165) (871)
Increase / (decrease) in outstanding claims liability (56) (47) (86) (292)
Movement in unexpired risk liability (10) (3) (5) (11)
Total operating costs (19) (20) (21) (81)
Total expenditure (255) (286) (277) (1,255)
Performance from Insurance Operations (36) (80) (76) (463)
Net gains / (loss) on investments (incl. external management fees) 38 2 716 43
Net gains / (loss) from changes in discount and inflation rates on OCL (835) - (1,158) -
External factors (797) 2 (442) 43
Surplus / (Deficit) (833) (78) (518) (420)

32
Appendices: Appendix 1: Financial statements to 30 September 2021
$m YEAR TO DATE 2021/22
ACTUAL BUDGET PRIOR YEAR ACTUAL BUDGET
Levy Revenue 450 460 434 1,887
Interest, dividend and rental income 79 69 79 250
Other income - 1 - 1
Total Income 529 530 513 2,138
Total claims paid (507) (514) (483) (2,062)
Increase / (decrease) in outstanding claims liability (121) (118) (158) (586)
Movement in unexpired risk liability 296 241 277 13
Total operating costs (70) (69) (58) (275)
Total expenditure (402) (460) (422) (2,910)
Performance from Insurance Operations 127 70 91 (772)
Net gains / (loss) on investments (incl. external management fees) 42 27 506 134
Net gains / (loss) from changes in discount and inflation rates on OCL (504) - (722) -
External factors (462) 27 (216) 134
Surplus / (Deficit) (335) 97 (125) (638)
Earners' Account
Non-Earners' Account
$m YEAR TO DATE 2021/22
ACTUAL BUDGET PRIOR YEAR ACTUAL BUDGET
Levy Revenue 415 414 382 1,652
Interest, dividend and rental income 37 27 35 99
Other income - - - -
Total Income 452 441 417 1,751
Total claims paid (358) (362) (339) (1,447)
Increase / (decrease) in outstanding claims liability (69) (72) (133) (305)
Movement in unexpired risk liability - - - -
Total operating costs (37) (39) (30) (150)
Total expenditure (464) (473) (502) (1,902)
Performance from Insurance Operations (12) (32) (85) (151)
Net gains / (loss) on investments (incl. external management fees) 21 25 242 111
Net gains / (loss) from changes in discount and inflation rates on OCL (805) - (1,022) -
External factors (784) 25 (780) 111
Surplus / (Deficit) (796) (7) (865) (40)

33
Appendices: Appendix 1: Financial statements to 30 September 2021
$m YEAR TO DATE 2021/22
ACTUAL BUDGET PRIOR YEAR ACTUAL BUDGET
Levy Revenue 81 81 75 326
Interest, dividend and rental income 39 32 37 115
Other income - - - -
Total Income 120 113 112 441
Total claims paid (76) (88) (68) (355)
Increase / (decrease) in outstanding claims liability (62) (62) (90) (264)
Movement in unexpired risk liability - - - -
Total operating costs (10) (11) (13) (43)
Total expenditure (148) (161) (171) (662)
Performance from Insurance Operations (28) (48) (59) (221)
Net gains / (loss) on investments (incl. external management fees) 27 11 268 61
Net gains / (loss) from changes in discount and inflation rates on OCL (579) - (706) -
External factors (552) 11 (438) 61
Surplus / (Deficit) (580) (37) (497) (160)
Treatment Injury Account

34
Appendices: Appendix 1: Financial statements to 30 September 2021
Statement of financial position
$m AS AT 30 September 2021 FULL YEAR 2020/21 FULL YEAR 2021/22
ACTUAL BUDGET ACTUAL BUDGET
Account reserves
Work 2,494 2,416 2,699 2,150
Motor vehicle 13 197 847 (145)
Earners’ (1,187) (536) (852) (1,271)
Non-Earners’ (7,395) (6,584) (6,599) (6,617)
Treatment Injury (2,665) (2,232) (2,085) (2,355)
Total reserves (deficit) (8,740) (6,739) (5,990) (8,238)
Assets
Cash and cash equivalents 380 200 131 200
Receivables 1,024 757 1,138 573
Accrued levy revenue 1,352 1,475 2,601 2,821
Investments 50,701 48,378 50,463 48,165
Derivative financial instruments 566 0 519 -
Property, plant and equipment 26 25 25 26
Intangible assets 119 125 127 108
Total assets 54,168 50,960 55,004 51,893
Liabilities
Payables and accrued liabilities (813) (810) (1,262) (802)
Derivative financial instruments (721) - (600) -
Unearned levy liability (1,545) (1,535) (2,248) (2,413)
Unexpired risk liability (1,087) (908) (1,497) (1,253)
Outstanding claims liability (58,742) (54,446) (55,387) (55,663)
Total liabilities (62,908) (57,699) (60,994) (60,131)
Net assets (liabilities) (8,740) (6,739) (5,990) (8,238)
$m ACTUAL
Investments 50,701
Short-term deposits 379
Net derivatives (155)
Investment receivables 463
Investment payables (524)
Total funds under management 50,864

35
Appendices: Appendix 1: Financial statements to 30 September 2021
Funding ratios
$m AS AT 30 SEPTEMBER 2021 AS AT 30 JUNE 2022 AS AT 30 JUNE 2021
ACTUAL BUDGET TARGET FORECAST BUDGET ACTUAL
Levied Accounts:
Work
Including gradual process claims incurred but not yet made 125.7% 125.2% 100.0% 123.4% 123.7% 131.1%
Motor vehicle 115.1% 117.0% 100.0% 113.1% 114.5% 121.8%
Earners’ 106.7% 110.8% 100.0% 102.0% 106.5% 112.1%
Non-levied Accounts:
Non-Earners’
Fully funded portion 72.9% 75.9% 100.0% 72.2% 75.6% 78.0%
Treatment Injury
Non-Earners’ fully funded portion 76.3% 78.4% 100.0% 75.1% 76.8% 82.6%
Earners’ portion 153.0% 156.2% 100.0% 150.5% 153.5% 159.1%
• The funding ratios represents the extent to which applicable net assets cover the value of the fully funded portion of the OCL (excluding risk margin) for each account
• It is presented as a percentage and calculated by dividing total assets, less payables, accrued liabilities, provisions and unearned levy liability by the outstanding claims liability (including additional
liability for work-related gradual process claims not yet made) excluding any risk margin. The funding ratio for the Work Account excludes those claims, and equivalent assets, funded through the
Accredited Employer Programme.
$m AS AT 30 SEPTEMBER 2021 FULL YEAR 2021/22
ACTUAL BUDGET PRIOR YEAR ACTUAL BUDGET
Opening balance – 1 July 2021 (55,387) (54,140) (61,463) (54,140)
Movement due to:
Expected increase (329) (306) (491) (1,523)
Impact of claims experience and modelling - - - -
Impact of change due to other factors - - - -
(Increase) / decrease in OCL (329) (306) (491) (1,523)
Impact of discount rate assumptions (1,972) - (2,299) -
Impact of change in inflation assumptions10 (962) - (1,883) -
Impact of adjustments due to key inflation indicators (92) - 62 -
Impact of economic assumptions and other factors (3,026) - (4,120) -
Closing balance (58,742) (54,446) (66,074) (55,663)
Long-term discount rate 4.30% 4.30% 4.30% 4.30 %
Single effective discount rate 2.87% 3.13% 1.73% 3.13 %
Outstanding claims liability (OCL)
10 The impact of adjustments due to key inflation indicators include the Labour Cost Index, Consumer
Price Index and Average Weekly Earnings changing in a manner not predicted by the previous valuation.

36
Appendices: Appendix 1: Financial statements to 30 September 2021
Statement of cash flows
$m AS AT 31 SEPTEMBER 2021FULL YEAR
2021/22
ACTUAL BUDGET PRIOR YEAR ACTUAL BUDGET
Cash flows from operating activities
Cash was provided from:
Levy revenue 1,494 1,574 997 5,144
Investment income 298 289 296 1,044
Sundry income - - - 1
Goods and services tax (net) 22 - 7 -
1,814 1,863 1,300 6,189
Cash was applied to:
Payments to injured persons, suppliers and employees (1,480) (1,630) (1,593) (6,545)
Goods and services tax (net) - (41) - (3)
(1,480) (1,671) (1,593) (6,548)
Net cash movement from operating activities 334 192 (293) (359)
Net cash flows from investment activities
Cash was provided and applied to:
Net purchase and sale of investments (80) (185) 146 387
Net purchase and sale of property, plant & equipment, and intangible assets (5) (7) (7) (28)
Net cash movement from investing activities (85) (192) 139 359
Net increase in cash and cash equivalents 249 - (154) -
Cash and cash equivalents – opening balance 131 200 256 200
Cash and cash equivalents – closing balance 380 200 102 200

3711 Pay As You Go12 Work related gradual process claims incurred but not reported
Motor Vehicle Work Earners’ Treatment Injury Non-Earners' Total
Net Assets/(Liabilities) $(284)m $2,066m $(2,119)m $(2,780)m $(7,484)m $(10,600)m
Remove PAYG11 portion of OCL $1,524m $4,315m $5,839m
Include WRGP IBNR12 off balance sheet OCL $(1,431)m $(1,431)m
Remove URL $274m $454m $932m $1,660m
Remove risk margin $1,797m $1,079m $1,436m $907m $1,030m $6,249m
Funding gap surplus / (shortfall) $1,787m $2,169m $248m $(348)m $(2,138)m $1,717m
Funding ratio 113.1% 123.4% 102.0% 94.5% 72.2%
Appendices: Appendix 2: Additional financial information
Net Assets / (Liabilities) to funding gap reconciliation – Forecast 30 June 2022

38
Funding ratios
• The funding ratios are based on updated financial
results and forecasts as at 30 September 2021
and updated levy rates as at 30 June 2021.
• The forecasts are shown under two scenarios:
1. Future levy rates and Appropriations are
calculated with an annual caps as per
Funding Policy. Work and Earners’ Account
5%, Motor Vehicle 7.5%.
2. Assuming no levy rate changes and no
changes Non-Earners’ Appropriations.
• As there is a shortfall in levy revenue to the new
year claims costs for all levied accounts. Despite
being currently overfunded, this results in a faster
than desired downward trajectory of the ratios.
• All levied accounts are forecasting to be above
target at the end of 2021/22. The Earners’
account is forecast to be below target by 2022/23.
Funding ratio trajectory
13 The Non-Earner’s including treatment injury non-earners’ is based on December 2020 valuation assumptions and March 2021 economic assumptions.14 The difference, by Account, between levy and appropriations and the lifetime cost of claims in the 2021/22 financial year.
NEW YEAR CLAIMS COST GAP - LEVY YEAR 2021/22
As at 30 June 2021 Motor Vehicle Work Earners’ Treatment Injury
earners
Non-Earners’ including
treatment injury non-earners’ 13
Total
New year claims cost gap surplus / (shortfall) 14 $(383)m $(270)m $(586)m $(103)m $(87)m $(1,429)m
112.1%
102.1%97.0%
92.6%88.8%
132.4% 134.1% 131.4%
111.9%
101.6%
100%
101.9%95.8%
89.6%
83.2%
2015/16 2016/17 2017/18 2018/19 2019/20 2020/21 2021/22~(F) 2022/23 2023/24 2024/25
FORECASTACTUAL
121.8%
113.1%110.6%
108.2%
105.7%
122.9%
127.2% 127.0%
106.7%
100.1%
100%
113.1%
110.5%
107.7%
104.6%
2015/16 2016/17 2017/18 2018/19 2019/20 2020/21 2021/22~(F) 2022/23 2023/24 2024/25
FORECASTACTUAL 91.3%90.2%
86.2%
68.0%
58.8%
100%
78.0%
72.2% 72.3% 72.6% 72.9%
72.2% 70.6%67.9%
64.6%
2015/16 2016/17 2017/18 2018/19 2019/20 2020/21 2021/22~(F) 2022/23 2023/24 2024/25
ACTUAL FORECAST
133.6%
139.4%
130.8%
118.7%
111.4%
131.1%
123.4%120.3%
117.1%
113.9%
100%
123.5%120.9%
117.9%114.6%
2015/16 2016/17 2017/18 2018/19 2019/20 2020/21 2021/22~(F) 2022/23 2023/24 2024/25
ACTUAL
FORECAST
Work Account
Forecast – No Levy or appropriation Increase/Decrease Forecast – Levy or appropriation Increase/DecreaseFunding Policy TargetActual
Earners’ Account
Motor Vehicle Account Non-Earners' Account
Appendices: Appendix 2: Additional financial information

39
Appendices: Appendix 3: Additional measures
Asset performance measures
MEASURE MOST RECENT
RESULT
2020/21
ACTUAL
YTD
ACTUAL
FULL YEAR
TARGET
OUTLOOK
ICT
Utilisation: Percentage of ACC staff utilising mobile computer hardware technology (Quarterly) September 2021 New 97% 85% G
Utilisation: Percentage of active ACC computer devices that are within the accepted lifecycle target. (Quarterly) September 2021 New 82% 75% G
Condition: Number of critical faults for key ACC systems September 2021 3 0 <5 G
Condition: Percentage key systems with a condition rating of Good or Excellent (Quarterly) September 2021 100% 89% >80% G
Functionality: Total operational ICT spend per full-time equivalent (FTE) September 2021 $22,659 $24,616 $28,200 G
Availability: Percentage of time key applications and networks are available to perform required functions September 2021 99.9% 99.9% 99.5% G
PR
OP
ER
TY
Utilisation: Square metres (m2) of leased area per FTE September 2021 14.1m2 13.6m2 12 - 16 m2
/ FTEG
Condition: Percentage of total leased area with a current code compliance certificate/ building warrant of fitness September 2021 100% 100% 100% G
Functionality: Percentage of total leased area that meets or exceeds the ACC security standards September 2021 100% 100% 100% G

40
Risk Key Management activity
Customer outcomes
If we do not define and measure outcomes effectively, we may not
fulfil our obligations under Te Tiriti o Waitangi and may fail to meet the
current and future needs of our customers (injured people, levy
payers, safer communities) in the context of ACC’s strategic
outcomes:
• Reduce the incidence and severity of injury
• Rehabilitate injured people more effectively
• New Zealand has an affordable and sustainable Scheme
• Development and implementation of a health outcomes framework as a tool for identifying and structuring the health
outcomes that matter for our customers.
Māori access and outcomes
We fail to make progress in implementing initiatives that are
meaningful, scalable or timely enough to materially improve Scheme
access, outcomes and engagement with Māori.
• Increase the number and range of kaupapa Māori services available to communities and injured clients.
• Increase cultural intelligence and capability across ACC.
• Measure our progress and evaluate our impact through insights gained by the creation of a Māori Customer Advisory panel
and engagement in research of Māori customer access, experience and outcomes.
Claims cost management
We do not adequately anticipate, monitor and respond to claims cost
performance trends resulting in pressures on levy rates.
• Address performance of the Long-Term Claims Pool by initiatives that (among other things) improve rehabilitation times
and ensure clients receive optimal care.
• Alignment of ACC’s services to clinical evidence, where spend and average cost per claim is reduced while maintaining
efficacy for the customer.
• Initiatives to optimise expenditure on capital items to ensure that the expenditure is as efficient as practicable.
The six entity risks rated High or Extreme are listed below. Many of them are important to delivering our planned initiatives. Most actions are scheduled to be
completed over the 2021/22 financial year; some will be completed in later years.
We have completed a comprehensive review of the risks associated with the social unemployment insurance proposal (SUI). It is likely that a new entity risk related to SUI will be
included in reporting for Quarter 2 2021/22. The recent incident raised in the media involving an alleged breach of privacy is under investigation. Once the facts are determined an
assessment will be made as to the impact of the incident on relevant entity risks, including regarding Privacy, Conduct and People and Culture.
Appendices: Appendix 4: Organisational Risk

41
Risk Key Management activity
Injury Prevention Impact:
If we do not make informed strategic decisions and effectively deliver,
we will not be able to sustainably scale to reduce the incidence and
severity of injuries for people across Aotearoa. This will continue to
result in preventable deaths, loss of wellbeing, and wider economic,
social and funding impacts.
• Develop, prioritise, and implement investments designed to deliver injury prevention outcomes and maximise ACC's return
on investment in workplace harm reduction.
• Mapping of short-term to long-term business plan.
• Investigate ways to demonstrate and measure Māori injury prevention.
Response and Business Interruption Management
Failure to effectively respond to, and recover from, a business
interruption.
• Deliver Business Continuity Work Programme which will improve the organisation’s ability to operate during a business
disruption event and recover in a timely manner.
Benefits
We fail to effectively identify and/or realise the short- and long-term
outcomes and benefits of our Transformation investment.
• Embed an ACC data model standard to exchange data with other agencies and across sectors.
• Implement an Enterprise Prioritisation Framework to assess enterprise-wide priorities, improve decision making and
promote risk taking, where warranted.
• Review and implement Enterprise Benefits Management Framework which reflects greater maturity and volume of change.
Appendices: Appendix 4: Organisational Risk
The six entity risks rated High or Extreme are listed below. Many of them are important to delivering our planned initiatives. Most actions are scheduled to be
completed over the 2021/22 financial year; some will be completed in later years.