Embed Size (px)
Citation preview
Forest Age and Plant Species Composition Determinethe Soil Fungal Community Composition in a ChineseSubtropical ForestYu Ting Wu1,2., Tesfaye Wubet1,3*., Stefan Trogisch4,5, Sabine Both5, Thomas Scholten6,
Helge Bruelheide5,3, Francois Buscot1,2,3
1 UFZ-Helmholtz Centre for Environmental Research, Department of Soil Ecology, Halle (Saale), Germany, 2 Chair of Soil Ecology, Institute of Biology, University of Leipzig,
Leipzig, Germany, 3 German Centre for Integrative Biodiversity Research (iDiv), Leipzig, Germany, 4 Faculty of Biology, Department of Geobotany, University of Freiburg,
Freiburg, Germany, 5 Department of Biology and Geobotany, Martin Luther University Halle Wittenberg, Halle (Saale), Germany, 6 Chair of Physical Geography and Soil
Science, University of Tubingen, Tubingen, Germany
Abstract
Fungal diversity and community composition are mainly related to soil and vegetation factors. However, the relativecontribution of the different drivers remains largely unexplored, especially in subtropical forest ecosystems. We studied thefungal diversity and community composition of soils sampled from 12 comparative study plots representing three forestage classes (Young: 10–40 yrs; Medium: 40–80 yrs; Old: $80 yrs) in Gutianshan National Nature Reserve in South-easternChina. Soil fungal communities were assessed employing ITS rDNA pyrotag sequencing. Members of Basidiomycota andAscomycota dominated the fungal community, with 22 putative ectomycorrhizal fungal families, where Russulaceae andThelephoraceae were the most abundant taxa. Analysis of similarity showed that the fungal community compositionsignificantly differed among the three forest age classes. Forest age class, elevation of the study plots, and soil organiccarbon (SOC) were the most important factors shaping the fungal community composition. We found a significantcorrelation between plant and fungal communities at different taxonomic and functional group levels, including a strongrelationship between ectomycorrhizal fungal and non-ectomycorrhizal plant communities. Our results suggest that insubtropical forests, plant species community composition is the main driver of the soil fungal diversity and communitycomposition.
Citation: Wu YT, Wubet T, Trogisch S, Both S, Scholten T, et al. (2013) Forest Age and Plant Species Composition Determine the Soil Fungal CommunityComposition in a Chinese Subtropical Forest. PLoS ONE 8(6): e66829. doi:10.1371/journal.pone.0066829
Editor: Hauke Smidt, Wageningen University, The Netherlands
Received December 17, 2012; Accepted May 13, 2013; Published June 27, 2013
Copyright: � 2013 Wu et al. This is an open-access article distributed under the terms of the Creative Commons Attribution License, which permits unrestricteduse, distribution, and reproduction in any medium, provided the original author and source are credited.
Funding: The project was mainly supported by the German Research Foundation (DFG) (Grant BU 941/12-1 in the Research Unit FOR 891/1) and additionally bythe Helmholtz Impulse and Networking Fund through Helmholtz Interdisciplinary GRADuate School for Environmental Research (HIGRADE). The funders had norole in study design, data collection and analysis, decision to publish, or preparation of the manuscript.
Competing Interests: The authors have declared that no competing interests exist.
* E-mail: [email protected]
. These authors contributed equally to this work.
Introduction
Fungi are a highly diverse component of soil microbial
communities. They play essential roles in many aspects of
ecosystem development, functioning and stability [1]. As patho-
gens and symbionts, soil fungi influence the species composition
and dynamics of plant communities [2,3]; as saprotrophs, they are
an essential component of the soil food web influencing nutrient
cycling and carbon sequestration [4]. About 100,000 fungal
species have been described, but it has been estimated that there
may be from 1.5 to 5.1 million extant fungal species [5]. Most
investigations on fungal diversity and distribution have been
accomplished in temperate, tropical and boreal regions (e.g. [6–
8]). Consequently, there is a limited knowledge in the subtropics,
although subtropical forest ecosystems are among the most
prominent plant diversity hotspots in the holarctic realm [9].
It has been suggested that high plant diversity supports high
fungal diversity [6,10,11], implying that subtropical ecosystems
might harbor a high fungal diversity [12]. Recent studies on the
fungal diversity in Chinese subtropical forests focused on fungal
biomass [13], ECM sporocarp and mycorrhizal root analyses [14–
16], and on the cultivable active microbial community [17], but
there is still a gap of knowledge on the soil fungal diversity and the
factors influencing the community composition.
In forest ecosystems, fungal diversity and community compo-
sition have been reported to be closely linked to numerous biotic
and abiotic factors, such as stand age [17,18], elevation [19,20],
plant diversity [6,21], plant productivity [2,22], and soil environ-
ment [23,24]. The impact of these factors on the soil fungal
community has rarely been studied in combination, particularly in
the very species-rich subtropical natural forests. In forest
communities dominated by only one or a few tree species, such
as temperate or boreal forests, it is expected that the soil fungal
community is strongly dependent on the identity of a particular
tree species. For example, it has been shown that different
combinations of plant species have a paramount influence on soil
fungal community composition [25]. Consequently, species
identity effects of a particular tree species cannot be separated
PLOS ONE | www.plosone.org 1 June 2013 | Volume 8 | Issue 6 | e66829
from diversity effects (compare [26]). In tropical forests with 6 to 9
different species per 10 sampled individuals [27] and in subtropical
forests with 4.4 to 8.3 different species per 10 sampled individuals,
as is the case in our study area (Helge Bruelheide, personal
communication), plant species identity effects are expected to be
an important factor influencing the fungal community.
In general, a high diversity in plant species is expected to result
in high diversity levels at other trophic levels, as diverse plant
communities offer a larger amount and larger heterogeneity of
resources to consumers, parasites and symbionts [28,29]. In
contrast to simply focusing on richness relationships, comparisons
of communities at different trophic levels have the advantage that
the data also accounts for structural factors and idiosyncratic links
between species. The latter seems to be particularly important for
the analysis of specificity in plant species - microbial community
relationships [30,31], and suggests concordance in the composition
of tree species and fungal communities.
We assessed the diversity and community composition of soil
fungi using a natural species richness gradient along a chronose-
quence representing three forest age classes in a Chinese
subtropical forest located in the Gutianshan National Nature
Reserve (Zhejiang, China). The study plots were established in the
framework of the Biodiversity and Ecosystem Functioning project
(BEF-China) [32]. As soil parent material and other topographic
variables along this chronosequence did only vary to a minor
degree, we expected that most of the variation in the fungal
community composition should be caused by the biotic compo-
nents of the ecosystem. To obtain sufficient depth in our analyses,
we employed massively parallel and targeted ITS rDNA pyrotag
sequencing, an approach currently used in a number of studies
investigating soil bacterial [33,34] and fungal communities
[35,36]. The objectives of this study were to characterize fungal
diversity in this subtropical forest ecosystem, to assess the fungal
community composition among the forest age classes, and analyze
the contribution of the soil environment, plant species richness and
composition on the fungal community. In particular, we hypoth-
esized that 1) fungal community composition differs among the
forest age classes, 2) plant cover and variables related to plant
biomass explain most of the variation in the soil fungal community
composition, and 3) that there is a positive relationship between
plant species and soil fungal community composition.
Materials and Methods
Ethics StatementAll necessary permits for the described field studies were issued
by the Administration Bureau of the Gutianshan National Nature
Reserve, Zhejiang, China.
Study Site and Soil SamplingThe study was conducted at the Gutianshan National Nature
Reserve (NNR) in the Zhejiang Province in south-eastern China
(29u8’18" –29u17’29" N, 118u2’14" –118u11’12" E). The NNR is
approximately 81 km2 in size and is located in a mountainous
region with a typical subtropical climate. The mean annual
temperature at the NNR is 15.3uC with a maximum of 38.1uC in
July and a minimum of 26.8uC in January [37]. The annual mean
precipitation is 1964 mm (calculated based on data from 1958 to
1986), occurring mostly between March and September [38].
Approximately 57% of the reserve is natural forest [38]. The NNR
vegetation type is representative of typical subtropical forest
ecosystems consisting of mixed evergreen broad-leaved species. A
total of 111 woody species, including 24 ectomycorrhizal (ECM)
and 87 non ECM tree species, from 41 families have been
recorded at the study plots, with Castanopsis eyrei (Fagaceae),
Daphniphyllum oldhamii (Daphniphyllaceae), and Schima superba (Thea-
ceae) as the dominant woody species [32].
The study was carried out in 12 Comparative Study Plots
(CSPs), which were randomly selected and stratified by succes-
sional age [32] (Fig. S1). Each CSP had a size of 30 m630 m,
divided into 9 subplots with 10 m610 m size representing three
age classes since natural regeneration (Young: 10–40 yrs; Medium:
40–80 yrs; Old: $ 80 yrs, with four replicate plots each).
Abundance of all tree (.1 m in height) species was assessed in
the entire plot, while herb species abundance (,1 m in height) was
only surveyed in the central subplot. Forest floor litter biomass was
determined with a PVC ring (19 cm in diameter) driven into the
undisturbed litter layer in spring 2009. In each CSP, 4 litter cores
were taken at randomly selected locations (total area of the 4
cores = 0.11 m2) and pooled for dry weight measurement. Soil
sampling was carried out between March and April 2009, where
within each CSP soil samples were collected to 10 cm depth in
each of the 9 subplots using an auger with a 10-cm diameter. The
9 subsamples were then bulked into one composite sample per
study plot. Homogenized samples were immediately hand-sieved
(#2 mm) in the field to remove stones, roots, macrofauna, and
litter materials. Subsamples were frozen in liquid nitrogen,
transported in an ice box and were stored at 220uC until
molecular analysis. The analysis methods of soil characteristics and
the vegetation data (presented in Table 1) are described in detail in
[13].
DNA Extraction, Amplicon Library Generation andPyrosequencing
Soil microbial genomic DNA was extracted from approximately
1 g (wet weight) of soil using a MoBio PowerSoil DNA Isolation
Kit (MoBio Laboratories Inc. Carsbad, CA, USA) following the
manufacturer’s instructions. Fungal ITS rDNA amplicon libraries
were produced using fusion primers [39] designed with pyrose-
quencing primer B, a barcode and the fungal specific primer
ITS1F [40] as a forward primer and pyrosequencing primer A and
the universal eukaryotic primer ITS4 [41] as a reverse primer. We
used a set of 10 bp MID-barcodes provided by Roche (Roche
Applied Science). ITS rDNA amplicon libraries were produced
from a pool of two dilution levels (106 and 1006) from each soil
DNA extract. The PCRs were performed in three replicate
reactions per sample and per dilution to account for potentially
heterogeneous amplification.
PCR reaction was carried out in a total volume of 50 ml
containing 1 ml diluted DNA template, 1 ml 25 pmol of each of the
two custom fusion primers, 25 ml Go TagH Green Master mix
(Promega), and nuclease free water (Promega). We used a
touchdown PCR program with a denaturation at 95uC for
5 min followed by 10 cycles of denaturation at 94uC for 30 sec,
annealing at 60–50uC for 45 sec (21uC per cycle), and extension
at 72uC for 2 min; and then 30 cycles at 94uC for 30 sec, 50uC for
45 sec and 72uC for 2 min, then finalized by an extension step at
72uC for 10 min. PCR products were analyzed using 1.5%
agarose gel and equimolar volumes of the amplified products of
the expected size (ca. 600 bp) from the three positive replicate
amplicons per sample were homogenized. The pooled products
were gel purified using a Qiagen Gel Extraction Kit (Qiagen,
Hilden, Germany). The amount of DNA in the purified amplicons
was quantified using a fluorescence spectrophotometer (Cary
Eclipse, Agilant Technologies, Waldbronn, Germany). An equi-
molar mix of the 12 amplicon libraries was subjected to
unidirectional pyrosequencing from the ITS1F end of the
amplicons using a 454 titanium amplicon sequencing kit and a
Fungal Community in a Chinese Subtropical Forest
PLOS ONE | www.plosone.org 2 June 2013 | Volume 8 | Issue 6 | e66829
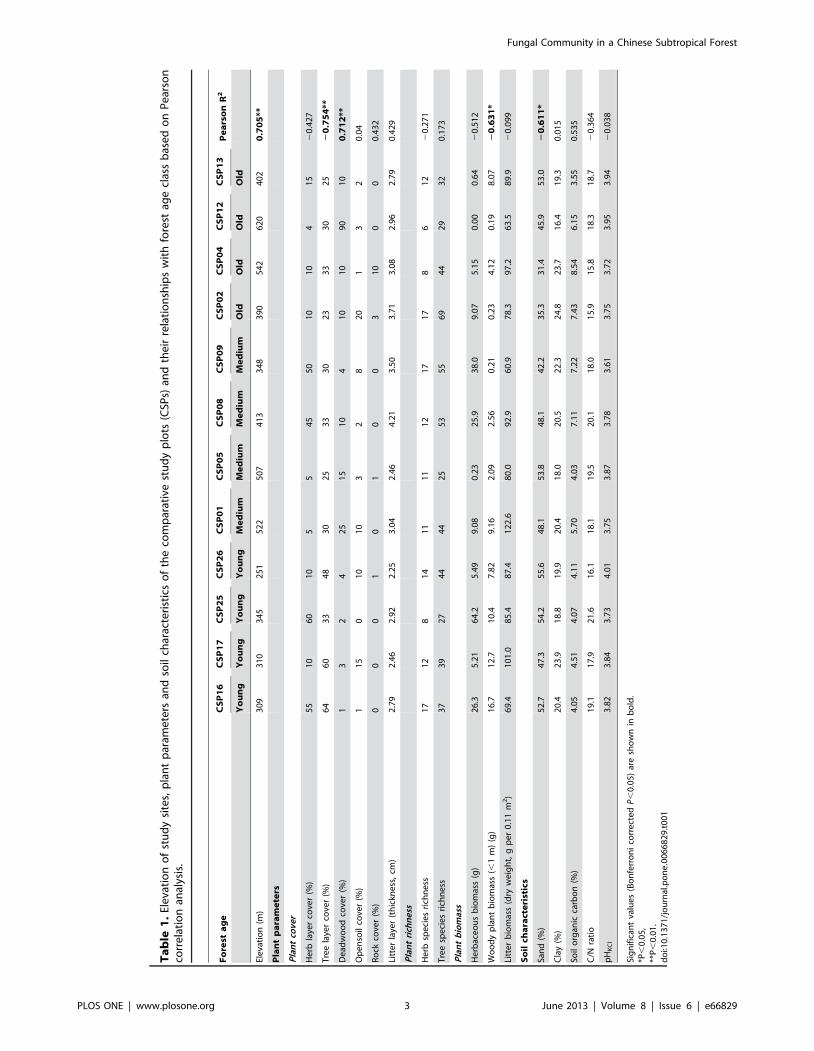
Ta
ble
1.
Ele
vati
on
of
stu
dy
site
s,p
lan
tp
aram
ete
rsan
dso
ilch
arac
teri
stic
so
fth
eco
mp
arat
ive
stu
dy
plo
ts(C
SPs)
and
the
irre
lati
on
ship
sw
ith
fore
stag
ecl
ass
bas
ed
on
Pe
arso
nco
rre
lati
on
anal
ysis
.
Fo
rest
ag
eC
SP
16
CS
P1
7C
SP
25
CS
P2
6C
SP
01
CS
P0
5C
SP
08
CS
P0
9C
SP
02
CS
P0
4C
SP
12
CS
P1
3P
ea
rso
nR
2
Yo
un
gY
ou
ng
Yo
un
gY
ou
ng
Me
diu
mM
ed
ium
Me
diu
mM
ed
ium
Old
Old
Old
Old
Ele
vati
on
(m)
30
93
10
34
52
51
52
25
07
41
33
48
39
05
42
62
04
02
0.7
05
**
Pla
nt
pa
ram
ete
rs
Pla
nt
cove
r
He
rbla
yer
cove
r(%
)5
51
06
01
05
54
55
01
01
04
15
20
.42
7
Tre
ela
yer
cove
r(%
)6
46
03
34
83
02
53
33
02
33
33
02
52
0.7
54
**
De
adw
oo
dco
ver
(%)
13
24
25
15
10
41
01
09
01
00
.71
2**
Op
en
soil
cove
r(%
)1
15
01
01
03
28
20
13
20
.04
Ro
ckco
ver
(%)
00
01
01
00
31
00
00
.43
2
Litt
er
laye
r(t
hic
kne
ss,
cm)
2.7
92
.46
2.9
22
.25
3.0
42
.46
4.2
13
.50
3.7
13
.08
2.9
62
.79
0.4
29
Pla
nt
rich
ne
ss
He
rbsp
eci
es
rich
ne
ss1
71
28
14
11
11
12
17
17
86
12
20
.27
1
Tre
esp
eci
es
rich
ne
ss3
73
92
74
44
42
55
35
56
94
42
93
20
.17
3
Pla
nt
bio
mas
s
He
rbac
eo
us
bio
mas
s(g
)2
6.3
5.2
16
4.2
5.4
99
.08
0.2
32
5.9
38
.09
.07
5.1
50
.00
0.6
42
0.5
12
Wo
od
yp
lan
tb
iom
ass
(,1
m)
(g)
16
.71
2.7
10
.47
.82
9.1
62
.09
2.5
60
.21
0.2
34
.12
0.1
98
.07
20
.63
1*
Litt
er
bio
mas
s(d
ryw
eig
ht,
gp
er
0.1
1m
2)
69
.41
01
.08
5.4
87
.41
22
.68
0.0
92
.96
0.9
78
.39
7.2
63
.58
9.9
20
.09
9
So
ilch
ara
cte
rist
ics
San
d(%
)5
2.7
47
.35
4.2
55
.64
8.1
53
.84
8.1
42
.23
5.3
31
.44
5.9
53
.02
0.6
11
*
Cla
y(%
)2
0.4
23
.91
8.8
19
.92
0.4
18
.02
0.5
22
.32
4.8
23
.71
6.4
19
.30
.01
5
Soil
org
anic
carb
on
(%)
4.0
54
.51
4.0
74
.11
5.7
04
.03
7.1
17
.22
7.4
38
.54
6.1
53
.55
0.5
35
C/N
rati
o1
9.1
17
.92
1.6
16
.11
8.1
19
.52
0.1
18
.01
5.9
15
.81
8.3
18
.72
0.3
64
pH
KC
l3
.82
3.8
43
.73
4.0
13
.75
3.8
73
.78
3.6
13
.75
3.7
23
.95
3.9
42
0.0
38
Sig
nif
ican
tva
lue
s(B
on
ferr
on
ico
rre
cte
dP
,0
.05
)ar
esh
ow
nin
bo
ld.
*P,
0.0
5,
**P
,0
.01
.d
oi:1
0.1
37
1/j
ou
rnal
.po
ne
.00
66
82
9.t
00
1
Fungal Community in a Chinese Subtropical Forest
PLOS ONE | www.plosone.org 3 June 2013 | Volume 8 | Issue 6 | e66829
Genome Sequencer FLX 454 System (454 Life Sciences/Roche
Applied Biosystems, Mannheim, Germany) at the Department of
Soil Ecology, Helmholtz Centre for Environmental Research
(UFZ, Halle/Germany).
Bioinformatics AnalysisMultiple levels of sequence processing and quality filtering were
performed as described in [42]. Briefly the 454 fungal ITS sequences
were initially extracted based on 100% barcode similarity. Simulta-
neously, sequence reads with an average quality score of less than 25,
read length of ,200 bp, ambiguous bases and homo-polymers of .8
bases were removed, barcodes and primers were trimmed using the
split libraries script available in the Quantitative Insights In Microbial
Ecology pipeline (QIIME) [43]. Based on preliminary sequence
analysis, reads .450 bp were trimmed to a maximum read length of
450 bp using MOTHUR [44]. Sequences were then clustered and
assigned to operational taxonomic units (OTU) using the QIIME
implementation of CDHIT with a threshold of 97% pairwise identity
after a pre-filtering step to remove identical sequences using default
parameters. The most abundant representative sequences were
selected and assigned to respective taxa according to NCBI taxonomy.
The searches were based on blastn against the NCBI nucleotide
database for fungi excluding uncultured and environmental sequences
using the blast based taxonomic assignment script of the software for
Cleaning and Analyzing Next Generation Sequences - CANGS [45].
Representative sequences of OTUs of the fungal ITS pyrotags
assigned under the fungal kingdom were checked for chimeras
using the chimera uchime algorithm using the same dataset as a
reference, as implemented in MOTHUR. Subsequently a total of
2398 sequences identified as potentially chimeric and had less than
90% alignment length to sequences in the NCBI fungal reference
database, and 1445 reads not assigned to the fungal kingdom were
removed from the sequence dataset.
Finally, we found 14,136 sequences that were grouped into
1260 OTUs with variable number of reads per sample (Table S1).
Consequently, the number of sequences per sample was normal-
ized to the smallest sample size, 872 reads per sample, using the
normalized shared command as implemented in MOTHUR.
Ectomycorrhizal Fungi DesignationThe Ascomycotan and Basidiomycotan fungal OTUs were further
identified as putative ectomycorrhizal (ECM) fungi at the genus level
based on literature [46–50] as described in [50]. All ECM genera
which were presented as non mycorrhizal (NM) by Tedersoo et al. [50]
in contrast to Rinaldi et al. [48], were treated as NM. Furthermore, we
did a manual NCBI blast search for the representative sequences of
those genera reported to be composed of both ectomycorrhizal and
saprotrophic species. Accordingly only those OTUs with blast
similarities of .97% with sequences derived from mycorrhizal roots
were maintained in our final putative ECM fungal dataset.
Statistical AnalysisThe fungal OTUs were parsed by sample in order to calculate
the abundance of fungal OTUs using the sequence count of each
of the non-singleton OTUs as abundance value [42,51]. Based on
a preliminary rank index analysis, we calculated dissimilarities
between all pairs of samples using the log (x+1) transformed
abundance data and Bray-Curtis dissimilarity coefficient in order
to obtain an abundance based dissimilarity matrix. To assess the
effect of singletons on the fungal community distribution, we
calculated the non-metric multidimensional scaling (NMDS)
ordinations with 20 random starts from the datasets with and
without singletons. The correlation between the ordinations was
tested using the Procrustes correlation analysis using the protest
function [52] of the vegan package [53], where the significance of
the congruence between any two ordinations was tested by a
Monte Carlo procedure with 999 permutations. We found that the
fungal community composition was not affected by the presence or
absence of singletons (Procrustes correlation coefficient = 0.966,
P,0.001, suggesting nearly identical ordinations). Similar analysis
using the presence or absence dataset also showed that the NMDS
ordinations were significantly correlated (Procrustes correlation
coefficient = 0.97, P,0.001). Thus we performed the subsequent
analyses using the dominant fungal community excluding single-
tons.
We used the function ANOSIM of the vegan package to explore
the similarity of fungal community composition among the forest
age classes. Alpha and beta diversity based fungal community
compositions across the three age classes were compared using the
abundance-based pair-wise Bray-Curtis dissimilarity and the
Sorenson pair-wise dissimilarity matrix accounting for beta
diversity using the betapart package [54]. The relative abundance
of ECM fungi at the family level and the distribution of one of the
most abundant ECM family at the OTU level across the three
forest age classes was visualized by a heatmap using the function
heatmap2 of the gplots package [55].
The vegetation and soil characteristics were checked for
collinearity with the function varclus in the Hmisc package [56],
using Spearman’s rank correlation. The resulting set of non-
collinear parameters was maintained for further analyses (Table 1
and Fig. S2). Based on preliminary rank index analysis of these
exploratory variables, non-metric multidimensional scaling
(NMDS) analysis was performed using the nmds function of the
labdsv package [57] based on Bray-Curtis distances to visualize the
distribution of the fungal communities. The function envfit of
vegan was used to calculate a post-hoc regression of the individual
environmental variables on the ordination scores. R2 or the
goodness-of-fit values and their significances were calculated using
999 random permutations. Pearson correlation coefficients were
calculated to elucidate patterns of correlations of environmental
variables using the function corr.test of the Psych package [58].
Model of multivariate analysis of variance was constructed using
distance based redundancy analysis (dbRDA) using Bray–Curtis
distances with the function capscale of vegan to determine the
most influential environmental variables on the fungal community
composition. Permutational multivariate analysis of variance
(Permanova) was used to determine the interaction of the selected
variables and assess their influence on the fungal community
composition using the adonis function of vegan with the Bray-
Curtis distances and 999 permutations.
The concordance of plant and fungal community ordinations
was assessed using Procrustes correlation analysis as described
above using plant and fungal NMDS ordinations. The contribu-
tion of individual soil characteristics to the plant and fungal
community congruence was tested using ANOVA of Procrustes
residuals. Based on the preliminary normality tests, in all the above
analysis both plant species abundances and environmental
variables were log (x+1) transformed. Statistical analysis was
performed using R version 2.15.2 [59].
Results
Pyrosequencing Data Analysis and TaxonomicAssignment
A total of 16,534 fungal ITS pyrotag reads with an average
length of 450 bp were obtained from the 12 soil samples collected
across the three forest age classes. After multiple levels of sequence
processing, quality filtering, and sequence number normalization
Fungal Community in a Chinese Subtropical Forest
PLOS ONE | www.plosone.org 4 June 2013 | Volume 8 | Issue 6 | e66829
followed by a 3% dissimilarity clustering we found 1027 fungal
OTUs including 457 (44%) singletons from 10,464 fungal ITS
reads (Table S1). Taxonomic distribution of the 570 abundant
fungal OTUs, excluding the singletons, showed distribution of the
fungal community mainly across four fungal phyla with 50.2%
belonging to Basidiomycota, 37.3% to Ascomycota, 2.3% to
Zygomycota, and 0.4% to Glomeromycota. We were able to
assign 73.7% and 68.8% of these OTUs to the family and genus
levels, respectively. The remaining 9.8% OTUs were grouped as
unidentified fungi indicating the presence of unknown fungal taxa
in this particular subtropical forest ecosystem.
Within the two major fungal phyla, the Ascomycota comprised
of 213 OTUs, which were mainly members of the subphylum
Pezizomycotina (180/213). A total of 35 ascomycetous families
were identified among which the Trichocomaceae, Myxotrichaceae,
Elaphomycetaceae, Hypocreaceae, and Herpotrichiellaceae were the most
represented. From the total of 286 OTUs identified as members of
the phylum Basidiomycota, the majority (282 OTUs) was assigned
to the subphylum Agaricomycotina. A total of 36 basidiomycetous
families were found, with Russulaceae, Sebacinaceae, Cortinariaceae,
Thelephoraceae, Amanitaceae, Tricholomataceae, and Clavulinaceae being
the most abundant ones.
It is also noteworthy that, within the two dominant fungal phyla,
10% of the 213 ascomycetes and 75% of the 286 basidiomycetes
fungal OTUs were identified as potential ectomycorrhizal (ECM)
fungi. The ECM fungal OTUs (234 OTUs) represented 22
families (5 belonging to Ascomycota and 17 to Basidiomycota) and
34 genera (5 Ascomycota and 29 Basidiomycota). The relative
abundance of ECM fungal communities at the family level showed
that Russulaceae, Thelephoraceae, Helotiaceae, Amanitaceae, Sebacinaceae,
Entolomataceae, Cortinariaceae, Elaphomycetaceae and Ceratobasidiaceae
were the most abundant families across the three forest age classes.
At the genus level, Russula, Tomentella, Amanita, Thelephora, Entoloma,
Sebacina, and Cortinarius were the most abundant (Fig. S3 a, b).
Fungal Community Assemblage across the Three ForestAge Classes
The presence or absence of singletons showed no significant
effect on the fungal community ordination at the fungal Kingdom
level (see Material and Methods). These ordinations were also
consistent when confined to the phylum Ascomycota (Procrustes
correlation coefficient = 0.742, P,0.01), phylum Basidiomycota
(Procrustes correlation coefficient = 0.929, P,0.001), and ECM
fungi (Procrustes correlation coefficient = 0.985, P,0.001) levels
tested. Analysis of similarity of the dominant fungal community
assemblages revealed significant differences of the fungal commu-
nity across the three forest age classes (ANOSIM, R = 0.345,
P,0.01), which was consistent in the phylum Basidiomycota
(ANOSIM, R = 0.24, P,0.05) and ECM (ANOSIM, R = 0.36,
P,0.05) fungal communites.
Both abundance and incidence based pair-wise fungal commu-
nity dissimilarity analysis indicated that fungal alpha diversity
(adonis R2 = 0.235, P, ,0.01) and beta diversity (adonis
R2 = 0.231, P,0.05) were significantly correlated with forest age.
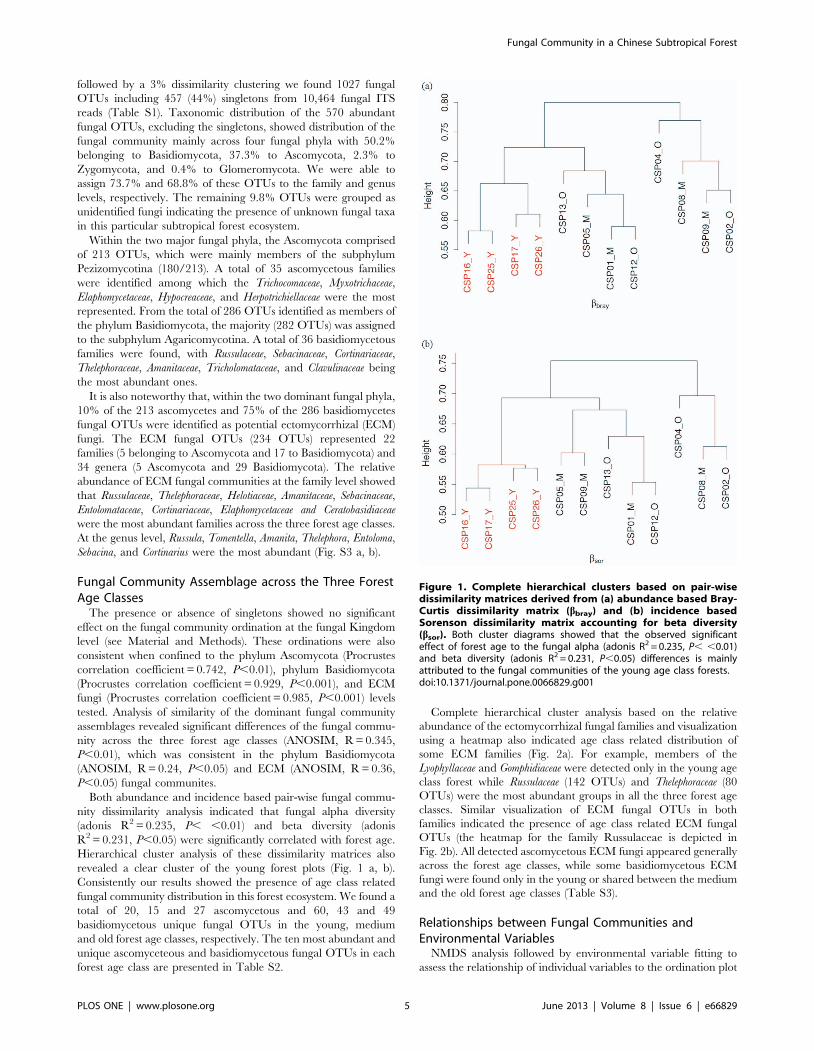
Hierarchical cluster analysis of these dissimilarity matrices also
revealed a clear cluster of the young forest plots (Fig. 1 a, b).
Consistently our results showed the presence of age class related
fungal community distribution in this forest ecosystem. We found a
total of 20, 15 and 27 ascomycetous and 60, 43 and 49
basidiomycetous unique fungal OTUs in the young, medium
and old forest age classes, respectively. The ten most abundant and
unique ascomyceteous and basidiomycetous fungal OTUs in each
forest age class are presented in Table S2.
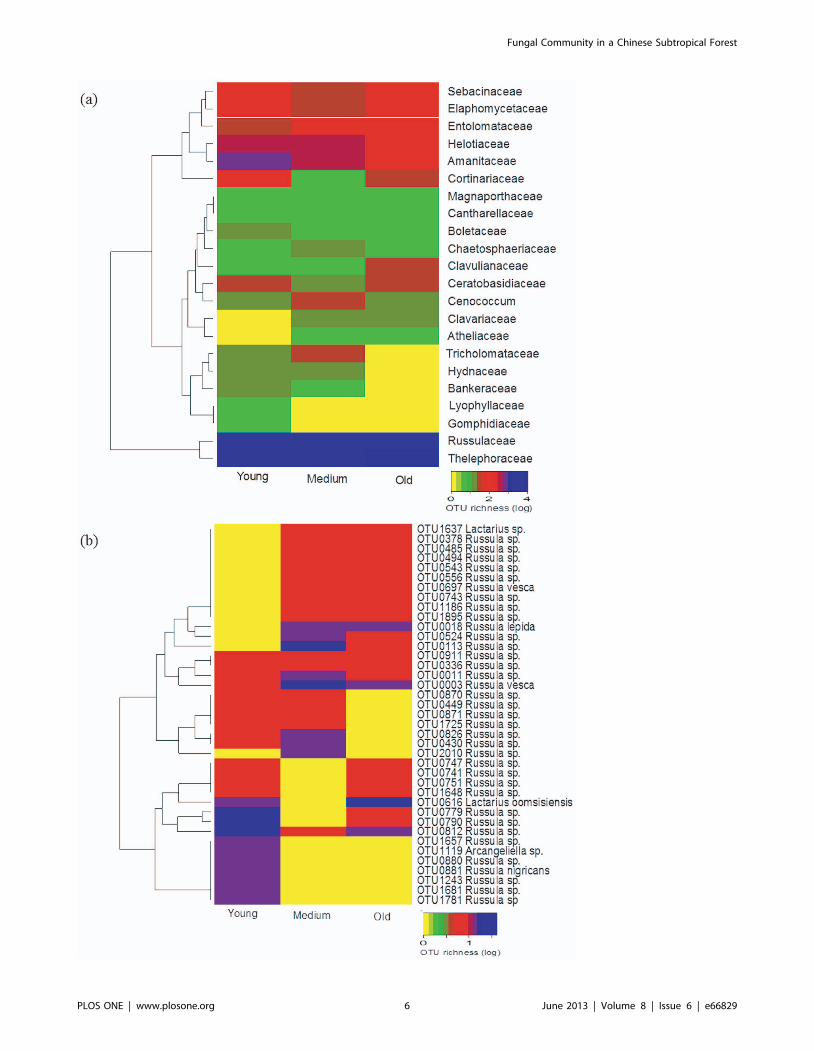
Complete hierarchical cluster analysis based on the relative
abundance of the ectomycorrhizal fungal families and visualization
using a heatmap also indicated age class related distribution of
some ECM families (Fig. 2a). For example, members of the
Lyophyllaceae and Gomphidiaceae were detected only in the young age
class forest while Russulaceae (142 OTUs) and Thelephoraceae (80
OTUs) were the most abundant groups in all the three forest age
classes. Similar visualization of ECM fungal OTUs in both
families indicated the presence of age class related ECM fungal
OTUs (the heatmap for the family Russulaceae is depicted in
Fig. 2b). All detected ascomycetous ECM fungi appeared generally
across the forest age classes, while some basidiomycetous ECM
fungi were found only in the young or shared between the medium
and the old forest age classes (Table S3).
Relationships between Fungal Communities andEnvironmental Variables
NMDS analysis followed by environmental variable fitting to
assess the relationship of individual variables to the ordination plot
Figure 1. Complete hierarchical clusters based on pair-wisedissimilarity matrices derived from (a) abundance based Bray-Curtis dissimilarity matrix (bbray) and (b) incidence basedSorenson dissimilarity matrix accounting for beta diversity(bsor). Both cluster diagrams showed that the observed significanteffect of forest age to the fungal alpha (adonis R2 = 0.235, P, ,0.01)and beta diversity (adonis R2 = 0.231, P,0.05) differences is mainlyattributed to the fungal communities of the young age class forests.doi:10.1371/journal.pone.0066829.g001
Fungal Community in a Chinese Subtropical Forest
PLOS ONE | www.plosone.org 5 June 2013 | Volume 8 | Issue 6 | e66829
Fungal Community in a Chinese Subtropical Forest
PLOS ONE | www.plosone.org 6 June 2013 | Volume 8 | Issue 6 | e66829
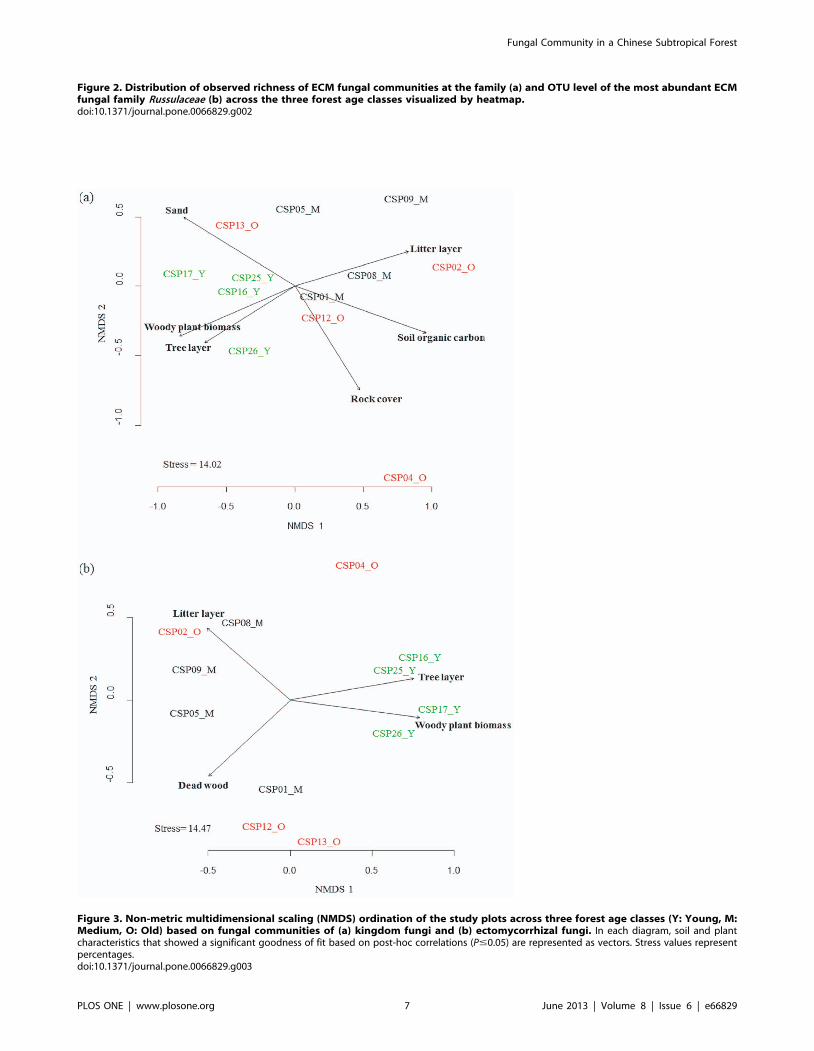
Figure 2. Distribution of observed richness of ECM fungal communities at the family (a) and OTU level of the most abundant ECMfungal family Russulaceae (b) across the three forest age classes visualized by heatmap.doi:10.1371/journal.pone.0066829.g002
Figure 3. Non-metric multidimensional scaling (NMDS) ordination of the study plots across three forest age classes (Y: Young, M:Medium, O: Old) based on fungal communities of (a) kingdom fungi and (b) ectomycorrhizal fungi. In each diagram, soil and plantcharacteristics that showed a significant goodness of fit based on post-hoc correlations (P#0.05) are represented as vectors. Stress values representpercentages.doi:10.1371/journal.pone.0066829.g003
Fungal Community in a Chinese Subtropical Forest
PLOS ONE | www.plosone.org 7 June 2013 | Volume 8 | Issue 6 | e66829
indicated that the fungal community composition was significantly
related to forest age and to plant and soil parameters (Table 2,
Fig. 3a). In contrast to the ascomycetous communities the
basidiomycetous and ECM fungal community ordinations were
influenced by forest age and plant parameters (Table 2, Fig. 3b).
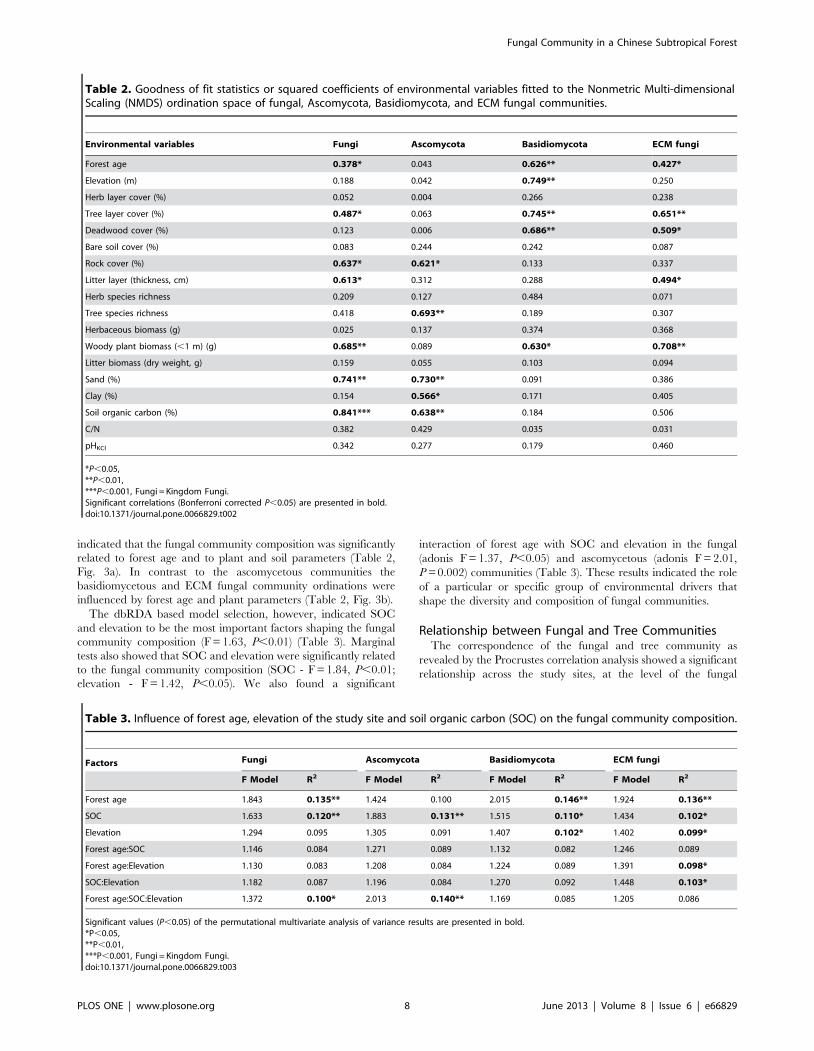
The dbRDA based model selection, however, indicated SOC
and elevation to be the most important factors shaping the fungal
community composition (F = 1.63, P,0.01) (Table 3). Marginal
tests also showed that SOC and elevation were significantly related
to the fungal community composition (SOC - F = 1.84, P,0.01;
elevation - F = 1.42, P,0.05). We also found a significant
interaction of forest age with SOC and elevation in the fungal
(adonis F = 1.37, P,0.05) and ascomycetous (adonis F = 2.01,
P = 0.002) communities (Table 3). These results indicated the role
of a particular or specific group of environmental drivers that
shape the diversity and composition of fungal communities.
Relationship between Fungal and Tree CommunitiesThe correspondence of the fungal and tree community as
revealed by the Procrustes correlation analysis showed a significant
relationship across the study sites, at the level of the fungal
Table 2. Goodness of fit statistics or squared coefficients of environmental variables fitted to the Nonmetric Multi-dimensionalScaling (NMDS) ordination space of fungal, Ascomycota, Basidiomycota, and ECM fungal communities.
Environmental variables Fungi Ascomycota Basidiomycota ECM fungi
Forest age 0.378* 0.043 0.626** 0.427*
Elevation (m) 0.188 0.042 0.749** 0.250
Herb layer cover (%) 0.052 0.004 0.266 0.238
Tree layer cover (%) 0.487* 0.063 0.745** 0.651**
Deadwood cover (%) 0.123 0.006 0.686** 0.509*
Bare soil cover (%) 0.083 0.244 0.242 0.087
Rock cover (%) 0.637* 0.621* 0.133 0.337
Litter layer (thickness, cm) 0.613* 0.312 0.288 0.494*
Herb species richness 0.209 0.127 0.484 0.071
Tree species richness 0.418 0.693** 0.189 0.307
Herbaceous biomass (g) 0.025 0.137 0.374 0.368
Woody plant biomass (,1 m) (g) 0.685** 0.089 0.630* 0.708**
Litter biomass (dry weight, g) 0.159 0.055 0.103 0.094
Sand (%) 0.741** 0.730** 0.091 0.386
Clay (%) 0.154 0.566* 0.171 0.405
Soil organic carbon (%) 0.841*** 0.638** 0.184 0.506
C/N 0.382 0.429 0.035 0.031
pHKCl 0.342 0.277 0.179 0.460
*P,0.05,**P,0.01,***P,0.001, Fungi = Kingdom Fungi.Significant correlations (Bonferroni corrected P,0.05) are presented in bold.doi:10.1371/journal.pone.0066829.t002
Table 3. Influence of forest age, elevation of the study site and soil organic carbon (SOC) on the fungal community composition.
Factors Fungi Ascomycota Basidiomycota ECM fungi
F Model R2 F Model R2 F Model R2 F Model R2
Forest age 1.843 0.135** 1.424 0.100 2.015 0.146** 1.924 0.136**
SOC 1.633 0.120** 1.883 0.131** 1.515 0.110* 1.434 0.102*
Elevation 1.294 0.095 1.305 0.091 1.407 0.102* 1.402 0.099*
Forest age:SOC 1.146 0.084 1.271 0.089 1.132 0.082 1.246 0.089
Forest age:Elevation 1.130 0.083 1.208 0.084 1.224 0.089 1.391 0.098*
SOC:Elevation 1.182 0.087 1.196 0.084 1.270 0.092 1.448 0.103*
Forest age:SOC:Elevation 1.372 0.100* 2.013 0.140** 1.169 0.085 1.205 0.086
Significant values (P,0.05) of the permutational multivariate analysis of variance results are presented in bold.*P,0.05,**P,0.01,***P,0.001, Fungi = Kingdom Fungi.doi:10.1371/journal.pone.0066829.t003
Fungal Community in a Chinese Subtropical Forest
PLOS ONE | www.plosone.org 8 June 2013 | Volume 8 | Issue 6 | e66829
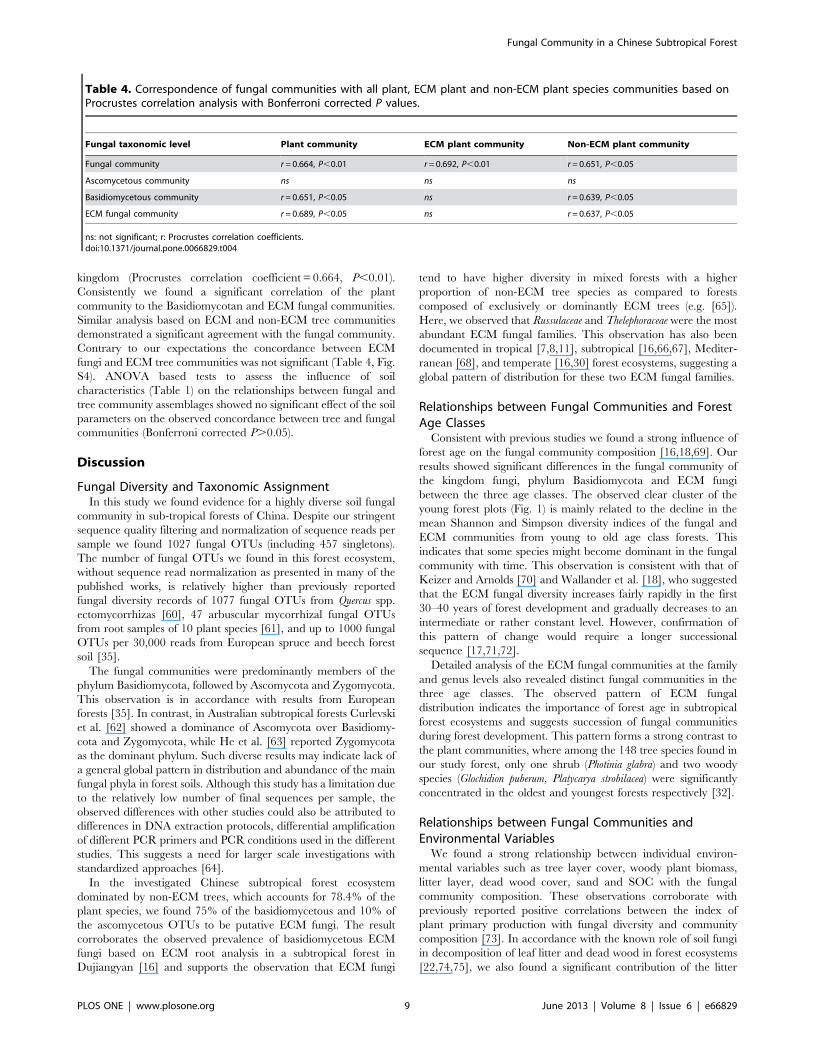
kingdom (Procrustes correlation coefficient = 0.664, P,0.01).
Consistently we found a significant correlation of the plant
community to the Basidiomycotan and ECM fungal communities.
Similar analysis based on ECM and non-ECM tree communities
demonstrated a significant agreement with the fungal community.
Contrary to our expectations the concordance between ECM
fungi and ECM tree communities was not significant (Table 4, Fig.
S4). ANOVA based tests to assess the influence of soil
characteristics (Table 1) on the relationships between fungal and
tree community assemblages showed no significant effect of the soil
parameters on the observed concordance between tree and fungal
communities (Bonferroni corrected P.0.05).
Discussion
Fungal Diversity and Taxonomic AssignmentIn this study we found evidence for a highly diverse soil fungal
community in sub-tropical forests of China. Despite our stringent
sequence quality filtering and normalization of sequence reads per
sample we found 1027 fungal OTUs (including 457 singletons).
The number of fungal OTUs we found in this forest ecosystem,
without sequence read normalization as presented in many of the
published works, is relatively higher than previously reported
fungal diversity records of 1077 fungal OTUs from Quercus spp.
ectomycorrhizas [60], 47 arbuscular mycorrhizal fungal OTUs
from root samples of 10 plant species [61], and up to 1000 fungal
OTUs per 30,000 reads from European spruce and beech forest
soil [35].
The fungal communities were predominantly members of the
phylum Basidiomycota, followed by Ascomycota and Zygomycota.
This observation is in accordance with results from European
forests [35]. In contrast, in Australian subtropical forests Curlevski
et al. [62] showed a dominance of Ascomycota over Basidiomy-
cota and Zygomycota, while He et al. [63] reported Zygomycota
as the dominant phylum. Such diverse results may indicate lack of
a general global pattern in distribution and abundance of the main
fungal phyla in forest soils. Although this study has a limitation due
to the relatively low number of final sequences per sample, the
observed differences with other studies could also be attributed to
differences in DNA extraction protocols, differential amplification
of different PCR primers and PCR conditions used in the different
studies. This suggests a need for larger scale investigations with
standardized approaches [64].
In the investigated Chinese subtropical forest ecosystem
dominated by non-ECM trees, which accounts for 78.4% of the
plant species, we found 75% of the basidiomycetous and 10% of
the ascomycetous OTUs to be putative ECM fungi. The result
corroborates the observed prevalence of basidiomycetous ECM
fungi based on ECM root analysis in a subtropical forest in
Dujiangyan [16] and supports the observation that ECM fungi
tend to have higher diversity in mixed forests with a higher
proportion of non-ECM tree species as compared to forests
composed of exclusively or dominantly ECM trees (e.g. [65]).
Here, we observed that Russulaceae and Thelephoraceae were the most
abundant ECM fungal families. This observation has also been
documented in tropical [7,8,11], subtropical [16,66,67], Mediter-
ranean [68], and temperate [16,30] forest ecosystems, suggesting a
global pattern of distribution for these two ECM fungal families.
Relationships between Fungal Communities and ForestAge Classes
Consistent with previous studies we found a strong influence of
forest age on the fungal community composition [16,18,69]. Our
results showed significant differences in the fungal community of
the kingdom fungi, phylum Basidiomycota and ECM fungi
between the three age classes. The observed clear cluster of the
young forest plots (Fig. 1) is mainly related to the decline in the
mean Shannon and Simpson diversity indices of the fungal and
ECM communities from young to old age class forests. This
indicates that some species might become dominant in the fungal
community with time. This observation is consistent with that of
Keizer and Arnolds [70] and Wallander et al. [18], who suggested
that the ECM fungal diversity increases fairly rapidly in the first
30–40 years of forest development and gradually decreases to an
intermediate or rather constant level. However, confirmation of
this pattern of change would require a longer successional
sequence [17,71,72].
Detailed analysis of the ECM fungal communities at the family
and genus levels also revealed distinct fungal communities in the
three age classes. The observed pattern of ECM fungal
distribution indicates the importance of forest age in subtropical
forest ecosystems and suggests succession of fungal communities
during forest development. This pattern forms a strong contrast to
the plant communities, where among the 148 tree species found in
our study forest, only one shrub (Photinia glabra) and two woody
species (Glochidion puberum, Platycarya strobilacea) were significantly
concentrated in the oldest and youngest forests respectively [32].
Relationships between Fungal Communities andEnvironmental Variables
We found a strong relationship between individual environ-
mental variables such as tree layer cover, woody plant biomass,
litter layer, dead wood cover, sand and SOC with the fungal
community composition. These observations corroborate with
previously reported positive correlations between the index of
plant primary production with fungal diversity and community
composition [73]. In accordance with the known role of soil fungi
in decomposition of leaf litter and dead wood in forest ecosystems
[22,74,75], we also found a significant contribution of the litter
Table 4. Correspondence of fungal communities with all plant, ECM plant and non-ECM plant species communities based onProcrustes correlation analysis with Bonferroni corrected P values.
Fungal taxonomic level Plant community ECM plant community Non-ECM plant community
Fungal community r = 0.664, P,0.01 r = 0.692, P,0.01 r = 0.651, P,0.05
Ascomycetous community ns ns ns
Basidiomycetous community r = 0.651, P,0.05 ns r = 0.639, P,0.05
ECM fungal community r = 0.689, P,0.05 ns r = 0.637, P,0.05
ns: not significant; r: Procrustes correlation coefficients.doi:10.1371/journal.pone.0066829.t004
Fungal Community in a Chinese Subtropical Forest
PLOS ONE | www.plosone.org 9 June 2013 | Volume 8 | Issue 6 | e66829
and dead wood cover on the basidiomycetous and ECM fungal
community composition.
Analysis of the role of these environmental variables on the
fungal community composition accounting the effects of other
parameters indicated that forest age, elevation, and SOC are the
most important variables. This result is in line with our
observation of the strong correlation of forest age with tree layer
cover, woody plant biomass, and dead wood cover, while SOC is
correlated with sand and litter layer (see Table S3). Our finding of
elevation as one of the important variables shaping fungal
community composition is in agreement with Bahram et al.
[20]. Considering the strong correlation between forest age, herb
layer cover, and herb species richness with the elevation of the
study plots and the suggestion of Bahram et al. [20] to take
elevation as a proxy for environmental variables such as
precipitation and temperature, our result indicates, the need for
further large-scale study considering more climatic variables.
Relationship between Fungal and Tree CommunitiesIn accordance with our hypothesis, the Procrustes correlation
analyses revealed a remarkable congruence between tree and
fungal communities, except for the ECM tree and ECM fungal
communities. The absence of concordance between ECM fungal
and ECM tree communities in this study contradict the reports
from boreal forests where close linkages between these groups were
documented [25,76]. This observed lack of correlation could be
attributed to our sampling strategy. First although we sampled 9
subsamples per plot, bulking of the samples would have
homogenized the fungal diversity and reduced the plant species
effect on the fungal community. Second since ECM fungal
distribution shows relationship with soil horizons [77], our
sampling depth might have restricted the number of plant species
specific ECM fungal species recovered in this study. Nevertheless,
our results strongly support previous observations in tropical [8]
and subtropical [14] forests, and indicated that the spatial pattern
of plant communities, proportion of ECM and non-ECM plants as
drivers of the fungal community composition.
ConclusionThis study provides evidence of high soil fungal diversity in this
subtropical forest ecosystem. In general our findings suggested the
existence of plant and soil related effects on soil fungal community
composition. Forest age, elevation of the study plots and SOC
were found to be the most important factors influencing the fungal
community composition. The observed significant correspondence
between tree and fungal communities and the relative contribution
of the ECM and non-ECM tree species communities on the fungal
community composition suggests the existence of unidentified
specific links of resources provision and utilization between plants
and rhizosphere fungal communities in this subtropical forest.
Elucidating these links will require experimental testing in
manipulated systems that vary in plant species diversity, which is
the main focus in the ongoing BEF China project.
Supporting Information
Figure S1 Distribution of the 12 Comparative StudyPlots (CSPs) in the Gutianshan National Nature Reserve
(NNR). CSPs are represented by open circles and labeled
according to their age class.
(TIFF)
Figure S2 Spearman’s rank correlation of the environ-mental variables.
(TIFF)
Figure S3 Relative abundance based distribution of theten most abundant ECM fungal families (a) and genera(b) across the three forest age classes.
(TIF)
Figure S4 Procrustean superimposition plots of plantcommunity ordinations with (a) fungal community, (b)Ascomycotan fungal community, (c) Basidiomycotanfungal community, and (d) ECM fungal communityordination plots.
(TIFF)
Table S1 Study plot names, barcodes and sequencereads recovered per sample at different steps of the dataanalysis. Trimmed dataset: after sequence quality filtering,
barcode and primer and trimming; fungal dataset: Number of
sequence reads after non fungal and chimeric sequence removal;
Normalized dataset: Sequence reads are normalized per sample;
Forward primer: CTTGGTCATTTAGAGGAAGTAA.
(DOCX)
Table S2 NCBI blastn based taxonomic assignments ofthe ten most abundant ascomycetous and basidiomyce-tous fungal OTUs found exclusively in each of the forestage classes.
(DOCX)
Table S3 Putative ectomycorrhizal fungal communitydistribution among the three forest age classes. Numbers
refer to the number of ECM fungal OTUs found from the
respective ECM fungal family and forest age class.
(DOCX)
Table S4 Relationships among the environmental var-iables based on Pearson correlation analysis. Significant
correlations (P,0.05) are in bold.
(DOCX)
Acknowledgments
We are grateful to the staff of the Gutianshan NNR and the students Bo
Tong and Bo Yang for their field assistance. We also thank Melanie
Gunther and Beatrix Schnabel for their assistance in the 454 pyrose-
quencing.
Author Contributions
Conceived and designed the experiments: FB TW. Performed the
experiments: YTW. Analyzed the data: TW YTW. Contributed
reagents/materials/analysis tools: FB TW. Wrote the paper: YTW TW
FB. Contributed data on soil properties and analysis of the data: ST TS.
Contributed vegetation data and analysis of the data: SB HB.
References
1. Morris SJ, Robertson GP (2005) Linking function between scales of resolution;
Dighton J, White JF, Oudemans P, editors. New York: CRC Press.
2. Kernaghan G (2005) Mycorrhizal diversity: Cause and effect? Pedobiologia 49:
511–520.
3. Westover KM, Bever JD (2001) Mechanisms Of Plant Species Coexistence:
Roles Of Rhizosphere Bacteria And Root Fungal Pathogens. Ecology 82: 3285–
3294.
Fungal Community in a Chinese Subtropical Forest
PLOS ONE | www.plosone.org 10 June 2013 | Volume 8 | Issue 6 | e66829
4. Moore JC, Berlow EL, Coleman DC, Ruiter PC, Dong Q, et al. (2004) Detritus,
trophic dynamics and biodiversity. Ecol Lett 7: 584–600.
5. Hibbett DS, Ohman A, Glotzer D, Nuhn M, Kirk P, et al. (2011) Progress in
molecular and morphological taxon discovery in Fungi and options for formal
classification of environmental sequences. Fungal Biology Reviews 25: 38–47.
6. Dickie IA (2007) Host preference, niches and fungal diversity. New Phytologist
174: 230–233.
7. Tedersoo L, Nilsson RH, Abarenkov K, Jairus T, Sadam A, et al. (2010) 454
Pyrosequencing and Sanger sequencing of tropical mycorrhizal fungi provide
similar results but reveal substantial methodological biases. New Phytologist 188:
291–301.
8. Tedersoo L, Sadam A, Zambrano M, Valencia R, Bahram M (2010) Low
diversity and high host preference of ectomycorrhizal fungi in western
Amazonia, a neotropical biodiversity hotspot. ISME J 4: 465–471.
9. Kier G, Mutke J, Dinerstein E, Ricketts TH, Kuper W, et al. (2005) Global
patterns of plant diversity and floristic knowledge. Journal of Biogeography 32:
1107–1116.
10. Zak DR, Holmes WE, White DC, Peacock AD, Tilman D (2003) Plant diversity,
soil microbial communities, and ecosystem function: Are there any links?
Ecology 84: 2042–2050.
11. Peay KG, Kennedy PG, Davies SJ, Tan S, Bruns TD (2010) Potential link
between plant and fungal distributions in a dipterocarp rainforest: community
and phylogenetic structure of tropical ectomycorrhizal fungi across a plant and
soil ecotone. New Phytologist 185: 529–542.
12. Lodge DJ, Cantrell S (1995) Fungal communities in wet tropical forests:
variation in time and space. Canadian Journal of Botany 73: 1391–1398.
13. Wu YT, Gutknecht J, Nadrowski K, Geißler C, Kuhn P, et al. (2012)
Relationships Between Soil Microorganisms, Plant Communities, and Soil
Characteristics in Chinese Subtropical Forests. Ecosystems 15: 624–636.
14. Liang Y, Guo LD, Du XJ, Ma KP (2007) Spatial structure and diversity of
woody plants and ectomycorrhizal fungus sporocarps in a natural subtropical
forest. Mycorrhiza 17: 271–278.
15. Moora M, Berger S, Davison J, Opik M, Bommarco R, et al. (2011) Alien plants
associate with widespread generalist arbuscular mycorrhizal fungal taxa:
evidence from a continental-scale study using massively parallel 454 sequencing.
Journal of Biogeography 38: 1305–1317.
16. Wang Q, He XH, Guo LD (2012) Ectomycorrhizal fungus communities of
Quercus liaotungensis Koidz of different ages in a northern China temperate
forest. Mycorrhiza 22: 461–470.
17. Zhu W, Cai X, Liu X, Wang J, Cheng S, et al. (2010) Soil microbial population
dynamics along a chronosequence of moist evergreen broad-leaved forest
succession in southwestern China. Journal of Mountain Science 7: 327–338.
18. Wallander H, Johansson U, Sterkenburg E, Brandstrom Durling M, Lindahl BD
(2010) Production of ectomycorrhizal mycelium peaks during canopy closure in
Norway spruce forests. New Phytologist 187: 1124–1134.
19. Kernaghan G, Harper KA (2001) Community structure of ectomycorrhizal
fungi across an alpine/subalpine ecotone. Ecography 24: 181–188.
20. Bahram M, Polme S, Koljalg U, Zarre S, Tedersoo L (2011) Regional and local
patterns of ectomycorrhizal fungal diversity and community structure along an
altitudinal gradient in the Hyrcanian forests of northern Iran. New Phytologist
193: 465–473.
21. Waldrop MP, Zak DR, Blackwood CB, Curtis CD, Tilman D (2006) Resource
availability controls fungal diversity across a plant diversity gradient. Ecol Lett 9:
1127–1135.
22. Aucina A, Rudawska M, Leski T, Skridaila A, Riepsas E, et al. (2007) Growth
and mycorrhizal community structure of Pinus sylvestris seedlings following the
addition of forest litter. Appl Environ Microbiol 73: 4867–4873.
23. Peter M, Ayer F, Egli S (2001) Nitrogen addition in a Norway spruce stand
altered macromycete sporocarp production and below-ground ectomycorrhizal
species composition. New Phytologist 149: 311–325.
24. Dickie IA, Xu B, Koide RT (2002) Vertical niche differentiation of
ectomycorrhizal hyphae in soil as shown by T-RFLP analysis. New Phytologist
156: 527–535.
25. DeBellis T, Kernaghan G, Bradley R, Widden P (2006) Relationships between
stand composition and ectomycorrhizal community structure in boreal mixed-
wood forests. Microb Ecol 52: 114–126.
26. Loreau M, Naeem S, Inchausti P, Bengtsson J, Grime JP, et al. (2001)
Biodiversity and Ecosystem Functioning: Current Knowledge and Future
Challenges. Science 294: 804–808.
27. Wills C, Harms KE, Condit R, King D, Thompson J, et al. (2006) Nonrandom
processes maintain diversity in tropical forests. Science 311: 527–531.
28. Balvanera P, Pfisterer AB, Buchmann N, He JS, Nakashizuka T, et al. (2006)
Quantifying the evidence for biodiversity effects on ecosystem functioning and
services. Ecol Lett 9: 1146–1156.
29. Duffy JE, Cardinale BJ, France KE, McIntyre PB, Thebault E, et al. (2007) The
functional role of biodiversity in ecosystems: incorporating trophic complexity.
Ecol Lett 10: 522–538.
30. Ishida TA, Nara K, Hogetsu T (2007) Host effects on ectomycorrhizal fungal
communities: insight from eight host species in mixed conifer-broadleaf forests.
New Phytologist 174: 430–440.
31. Morris MH, Smith ME, Rizzo DM, Rejmanek M, Bledsoe CS (2008)
Contrasting ectomycorrhizal fungal communities on the roots of co-occurring
oaks (Quercus spp.) in a California woodland. New Phytol 178: 167–176.
32. Bruelheide H, Bohnke M, Both S, Fang T, Assmann T, et al. (2011) Community
assembly during secondary forest succession in a Chinese subtropical forest.
Ecological Monographs 81: 25–41.
33. Roesch LF, Fulthorpe RR, Riva A, Casella G, Hadwin AKM, et al. (2007)
Pyrosequencing enumerates and contrasts soil microbial diversity. Isme Journal
1: 283–290.
34. Acosta-Martinez V, Dowd S, Sun Y, Allen V (2008) Tag-encoded pyrose-
quencing analysis of bacterial diversity in a single soil type as affected by
management and land use. Soil Biology & Biochemistry 40: 2762–2770.
35. Buee M, Reich M, Murat C, Morin E, Nilsson RH, et al. (2009) 454
Pyrosequencing analyses of forest soils reveal an unexpectedly high fungal
diversity. New Phytologist 184: 449–456.
36. Lentendu G, Zinger L, Manel S, Coissac E, Choler P, et al. (2011) Assessment of
soil fungal diversity in different alpine tundra habitats by means of
pyrosequencing. Fungal Diversity 49: 113–123.
37. Geißler C, Kuhn P, Bohnke M, Bruelheide H, Shi X, et al. (2011) Splash erosion
potential under tree canopies in subtropical SE China. CATENA 91: 85–93.
38. Legendre P, Mi X, Ren H, Ma K, Yu M, et al. (2009) Partitioning beta diversity
in a subtropical broad-leaved forest of China. Ecology 90: 663–674.
39. Margulies M, Egholm M, Altman WE, Attiya S, Bader JS, et al. (2005) Genome
sequencing in microfabricated high-density picolitre reactors. Nature 437: 376–
380.
40. Gardes M, Bruns TD (1993) ITS primers with enhanced specificity for
basidiomycetes - application to the identification of mycorrhizae and rusts.
Molecular Ecology 2: 113–118.
41. White TJ, Bruns TD, Lee SB, Taylor JW (1990) Amplification and direct
sequencing of fungal ribosomal RNA genes for phylogenetics. In: Innis MA,
Gelfand DH, Sninsky JJ, White TJ, editors. PCR Protocols - a Guide to Methods
and Applications. San Diego, CA: Academic Press. 315–322.
42. Wubet T, Christ S, Schoning I, Boch S, Gawlich M, et al. (2012) Differences in
Soil Fungal Communities between European Beech (Fagus sylvatica L.)
Dominated Forests Are Related to Soil and Understory Vegetation. PLoS
ONE 7(10): e47500.
43. Caporaso JG, Kuczynski J, Stombaugh J, Bittinger K, Bushman FD, et al. (2010)
QIIME allows analysis of high-throughput community sequencing data. Nature
Methods 7: 335–336.
44. Schloss PD, Westcott SL, Ryabin T, Hall JR, Hartmann M, et al. (2009)
Introducing mothur: Open-Source, Platform-Independent, Community-Sup-
ported Software for Describing and Comparing Microbial Communities.
Applied and Environmental Microbiology 75: 7537–7541.
45. Pandey RV (2010) CANGS: a user-friendly utility for processing and analyzing
454 GS-FLX data in biodiversity studies. BMC Research Notes 3.
46. Allen E, Allen M, Allen M, Helm D, Trappe J, et al. (1995) Patterns and
regulation of mycorrhizal plant and fungal diversity. Plant and Soil 170: 47–62.
47. Riviere T, Diedhiou A, Diabate M, Senthilarasu G, Natarajan K, et al. (2007)
Genetic diversity of ectomycorrhizal Basidiomycetes from African and Indian
tropical rain forests. Mycorrhiza 17: 415–428.
48. Rinaldi AC, Comandini O, Kuyper TW (2008) Ectomycorrhizal fungal
diversity: separating the wheat from the chaff. Fungal Diversity 33: 1–45.
49. Smith FA, Read DJ (2008) Mycorrhizal Symbioses. San Diego: Academic Press.
50. Tedersoo L, May TW, Smith ME (2010) Ectomycorrhizal lifestyle in fungi:
global diversity, distribution, and evolution of phylogenetic lineages. Mycorrhiza
20: 217–263.
51. Danzeisen JL, Kim HB, Isaacson RE, Tu ZJ, Johnson TJ (2011) Modulations of
the chicken cecal microbiome and metagenome in response to anticoccidial and
growth promoter treatment. Plos One 6: e27949.
52. Peres-Neto P, Jackson D (2001) How well do multivariate data sets match? The
advantages of a Procrustean superimposition approach over the Mantel test.
Oecologia 129: 169–178.
53. Oksanen J, Blanchet FG, Kindt R, Legendre P, Minchin PR, et al. (2011) vegan:
Community Ecology Package. R package version 2.0–1. Available: http://
CRAN.R-project.org/package = vegan.
54. Baselga A, Orme D, Villeger S (2013) betapart: Partitioning beta diversity into
turnover and nestedness components. R package version 1.2. Available: http://
CRAN.R-project.org/package = betapart.
55. Bolker B, Bonebakker L, Gentleman R, Huber W, Liaw A, et al. (2012) gplots:
Various R programming tools for plotting data. R package version 2.11.0.
Available: http://CRAN.R-project.org/package = gplots.
56. Harrell FE (2012) Hmisc: Harrell Miscellaneous. R package version 3.9–3.
Available: http://CRAN.R-project.org/package = Hmisc.
57. Roberts DW (2012) labdsv: Ordination and Multivariate Analysis for Ecology.
R package version 1.5–0. Available: http://CRAN.R-project.org/
package = labdsv.
58. Revelle W (2011) psych: Procedures for Psychological, Psychometric, and
Personality Research. R package version 1.01.9. Available: http://personality-
project.org/r/psych.manual.pdf.
59. Team RDC (2011) R: A Language and Environment for Statistical Computing.
R Foundation for Statistical Computing, Vienna, Austria. Available: http://
www.R-project.org/.
60. Jumpponen A, Jones KL, Mattox D, Yaege C (2010) Massively parallel 454-
sequencing of fungal communities in Quercus spp. ectomycorrhizas indicates
seasonal dynamics in urban and rural sites. Molecular Ecology 19: 41–53.
Fungal Community in a Chinese Subtropical Forest
PLOS ONE | www.plosone.org 11 June 2013 | Volume 8 | Issue 6 | e66829
61. Opik M, Metsis M, Daniell TJ, Zobel M, Moora M (2009) Large-scale parallel
454 sequencing reveals host ecological group specificity of arbuscularmycorrhizal fungi in a boreonemoral forest. New Phytol 184: 424–437.
62. Curlevski NA, Xu Z, Anderson I, Cairney JG (2010) Soil fungal communities
differ in native mixed forest and adjacent Araucaria cunninghamii plantations insubtropical Australia. Journal of Soils and Sediments 10: 1278–1288.
63. He J, Xu Z, Hughes J (2005) Analyses of soil fungal communities in adjacentnatural forest and hoop pine plantation ecosystems of subtropical Australia using
molecular approaches based on 18S rRNA genes. FEMS Microbiol Lett 247:
91–100.64. Bustin SA, Benes V, Garson JA, Hellemans J, Huggett J, et al. (2009) The MIQE
guidelines: minimum information for publication of quantitative real-time PCRexperiments. Clin Chem 55: 611–622.
65. Courty P-E, Buee M, Diedhiou AG, Frey-Klett P, Le Tacon F, et al. (2010) Therole of ectomycorrhizal communities in forest ecosystem processes: New
perspectives and emerging concepts. Soil Biology and Biochemistry 42: 679–698.
66. Burke DJ, Lopez-Gutierrez JC, Smemo KA, Chan CR (2009) Vegetation andsoil environment influence the spatial distribution of root-associated fungi in a
mature beech-maple forest. Appl Environ Microbiol 75: 7639–7648.67. Jumpponen A, Jones KL, David Mattox J, Yaege C (2010) Massively parallel
454-sequencing of fungal communities in Quercus spp. ectomycorrhizas
indicates seasonal dynamics in urban and rural sites. Mol Ecol 19 Suppl 1:41–53.
68. Richard F, Millot S, Gardes M, Selosse MA (2005) Diversity and specificity ofectomycorrhizal fungi retrieved from an old-growth Mediterranean forest
dominated by Quercus ilex. New Phytologist 166: 1011–1023.69. Smith JE, Molina R, Huso MM, Luoma DL, McKay D, et al. (2002) Species
richness, abundance, and composition of hypogeous and epigeous ectomycor-
rhizal fungal sporocarps in young, rotation-age, and old-growth stands of
Douglas-fir (Pseudotsuga menziesii) in the Cascade Range of Oregon, U.S.A.Canadian Journal of Botany 80: 186–204.
70. Keizer PJ, Arnolds E (1994) Succession of ectomycorrhizal fungi in roadside
verges planted with common oak (Quercus robur L.) in Drenthe, TheNetherlands. Mycorrhiza 4: 147–159.
71. Frankland JC (1998) Fungal succession – unravelling the unpredictable.Mycological Research 102: 1–15.
72. Buee M, Courty PE, Mignot D, Garbaye J (2007) Soil niche effect on species
diversity and catabolic activities in an ectomycorrhizal fungal community. SoilBiology and Biochemistry 39: 1947–1955.
73. Jonsson LM, Nilsson M-C, Wardle DA, Zackrisson O (2001) Context dependenteffects of ectomycorrhizal species richness on tree seedling productivity. Oikos
93: 353–364.74. Tedersoo L, Koljalg U, Hallenberg N, Larsson K-H (2003) Fine Scale
Distribution of Ectomycorrhizal Fungi and Roots across Substrate Layers
Including Coarse Woody Debris in a Mixed Forest. New Phytologist 159: 153–165.
75. Osono T, Hirose D, Fujimaki R (2006) Fungal colonization as affected by litterdepth and decomposition stage of needle litter. Soil Biology and Biochemistry
38: 2743–2752.
76. Qu L, Makoto K, Choi DS, Quoreshi AM, Koike T (2010) The Role ofEctomycorrhiza in Boreal Forest Ecosystem. In: Osawa A, Zyryanova OA,
Matsuura Y, Kajimoto T, Wein RW, editors. Permafrost Ecosystems: SpringerNetherlands. 413–425.
77. Rosling A, Landeweert R, Lindahl BD, Larsson KH, Kuyper TW, et al. (2003)Vertical distribution of ectomycorrhizal fungal taxa in a podzol soil profile. New
Phytologist 159: 775–783.
Fungal Community in a Chinese Subtropical Forest
PLOS ONE | www.plosone.org 12 June 2013 | Volume 8 | Issue 6 | e66829


