Embed Size (px)
Citation preview
of January 15, 2013.This information is current as
LocalizationRatio, Source of Mouse Strain, and RegionalResponses Are Dependent on the T Cell/APC Control Th17 and Regulatory T CellDendritic Cell and Macrophage Subsets That Functional Specializations of Intestinal
Rajat Madan, Christopher L. Karp and Bali PulendranGeem,Medina-Contreras, Santhakumar Manicassamy, Duke
Timothy L. Denning, Brian A. Norris, Oscar
http://www.jimmunol.org/content/187/2/733doi: 10.4049/jimmunol.10027012011;
2011; 187:733-747; Prepublished online 10 JuneJ Immunol
Referenceshttp://www.jimmunol.org/content/187/2/733.full#ref-list-1
, 33 of which you can access for free at: cites 82 articlesThis article
Subscriptionshttp://jimmunol.org/subscriptions
is online at: The Journal of ImmunologyInformation about subscribing to
Permissionshttp://www.aai.org/ji/copyright.htmlSubmit copyright permission requests at:
Email Alertshttp://jimmunol.org/cgi/alerts/etocReceive free email-alerts when new articles cite this article. Sign up at:
Print ISSN: 0022-1767 Online ISSN: 1550-6606. Immunologists, Inc. All rights reserved.Copyright © 2011 by The American Association of9650 Rockville Pike, Bethesda, MD 20814-3994.The American Association of Immunologists, Inc.,
is published twice each month byThe Journal of Immunology
at Em
ory University H
ealth Sciences Library on January 15, 2013
http://jimm
unol.org/D
ownloaded from
The Journal of Immunology
Functional Specializations of Intestinal Dendritic Cell andMacrophage Subsets That Control Th17 and RegulatoryT Cell Responses Are Dependent on the T Cell/APC Ratio,Source of Mouse Strain, and Regional Localization
Timothy L. Denning,*,†,‡,x Brian A. Norris,*,† Oscar Medina-Contreras,x
Santhakumar Manicassamy,*,† Duke Geem,x Rajat Madan,{ Christopher L. Karp,{
and Bali Pulendran*,†,‡
Although several subsets of intestinal APCs have been described, there has been no systematic evaluation of their phenotypes,
functions, and regional localization to date. In this article, we used 10-color flow cytometry to define the major APC subsets in
the small and large intestine lamina propria. Lamina propria APCs could be subdivided into CD11c+CD11b2, CD11c+CD11b+,
and CD11cdullCD11b+ subsets. CD11c+CD11b2 cells were largely CD103+F4/802 dendritic cells (DCs), whereas the CD11c+
CD11b+ subset comprised CD11c+CD11b+CD103+F4/802 DCs and CD11c+CD11b+CD1032F4/80+ macrophage-like cells. The
majority of CD11cdullCD11b+ cells were CD1032F4/80+ macrophages. Although macrophages were more efficient at inducing
Foxp3+ regulatory T (Treg) cells than DCs, at higher T cell/APC ratios, all of the DC subsets efficiently induced Foxp3+ Treg cells. In
contrast, only CD11c+CD11b+CD103+ DCs efficiently induced Th17 cells. Consistent with this, the regional distribution of CD11c+
CD11b+CD103+ DCs correlated with that of Th17 cells, with duodenum > jejunum > ileum > colon. Conversely, CD11c+CD11b2
CD103+ DCs, macrophages, and Foxp3+ Treg cells were most abundant in the colon and scarce in the duodenum. Importantly,
however, the ability of DC and macrophage subsets to induce Foxp3+ Treg cells versus Th17 cells was strikingly dependent on the
source of the mouse strain. Thus, DCs from C57BL/6 mice from Charles River Laboratories (that have segmented filamentous
bacteria, which induce robust levels of Th17 cells in situ) were more efficient at inducing Th17 cells and less efficient at inducing
Foxp3+ Treg cells than DCs from B6 mice from The Jackson Laboratory. Thus, the functional specializations of APC subsets in the
intestine are dependent on the T cell/APC ratio, regional localization, and source of the mouse strain. The Journal of Immu-
nology, 2011, 187: 733–747.
Sensing of microbes by innate immune cells is critical forthe establishment of effective adaptive immune responsesand host defense (1). APCs, including dendritic cells (DCs)
and macrophages, are endowed with the ability to detect micro-bial components via several evolutionarily conserved receptor/signaling pathways, including TLRs, Nod-like receptors, and C-type lectin receptors among others (2–4). The integration of
microbial-derived signals via these pathways and local microen-vironmental cues ultimately dictates the balance between ensuing
tolerogenic and proinflammatory responses (5, 6). Additionally,
specific APC subsets, expressing various levels of cell surface
markers such as CD11c, CD11b, F4/80, CD8a, and CD4, differ-
entially respond to microbial encounter (7, 8).DCs and macrophages are situated in various lymphoid and
nonlymphoid tissues, and under homeostatic conditions they en-
counter the majority of microbial Ags at mucosal surfaces (9). In
particular, DCs and macrophages in the intestinal Peyer’s patches
(PPs) and lamina propria (LP) are situated just beneath a single
layer of epithelial cells that separate them from a vast commensal
microflora. The major portals of entry for many microbes are the
PPs of the small intestine (10). Within the PPs exist several subsets
of DCs that differentially regulate immune responses dependent
upon whether they are CD11b+, CD8a+, or CD11b2CD8a2 (11).
CD11b+ PP DCs can be stimulated to secrete IL-10 and induce the
differentiation of T regulatory cells 1 and may promote IgA B cell
responses (12). Alternatively, CD8a+ and CD11b2CD8a2 PP DCs
can produce IL-12 and generate Th1-like cells (13). In the LP,
CD8a+ and CD11b+ DCs have been identified, and the functions of
these subsets have yet to be clearly defined. CD11b+ LP DCs ap-
pear to express tight junction proteins and can extend dendrites that
interdigitate between neighboring intestinal epithelial cells to
sample luminal microbes (14). The extension of dendrites is con-
trolled by the expression of CX3CR1 by DCs, and such CX3CR1-
dependent processes may control intestinal bacterial clearance (15).
*Vaccine Research Center, Emory University, Atlanta, GA 30329; †Yerkes RegionalPrimate Research Center, Emory University, Atlanta, GA 30329; ‡Department ofPathology and Laboratory Medicine, Emory University, Atlanta, GA 30322; xDepart-ment of Pediatrics, Emory University, Atlanta, GA 30322; and {Division of Molec-ular Immunology, Cincinnati Children’s Hospital Research Foundation and Uni-versity of Cincinnati College of Medicine, Cincinnati, OH 45229
Received for publication August 9, 2010. Accepted for publication April 29, 2011.
This work was supported by National Institutes of Health Grants AI0564499,AI048638, AI05726601, DK057665, AI057157, and AI50019 (to B.P.), NationalInstitutes of Health Grants AA01787001 and AI083554, a Career Developmentaward from the Crohn’s and Colitis Foundation of America, and an Emory EglestonChildren’s Research Center seed grant (to T.L.D.).
Address correspondence and reprint requests to Dr. Timothy L. Denning or Dr. BaliPulendran, Emory University School of Medicine, Whitehead Biomedical Building,Room 105R, 615 Michael Street, Atlanta, GA 30322 (T.L.D.) or Vaccine ResearchCenter, Emory University, 954 Gatewood Road, Atlanta, GA 30329 (B.P.). E-mailaddresses: [email protected] (T.L.D.) and [email protected] (B.P.)
Abbreviations used in this article: ALDH, aldehyde dehydrogenase; DC, dendriticcell; DEAB, diethylaminobenzaldehyde; DSS, dextran sodium sulfate; LP, laminapropria; MFI, mean fluorescence intensity; MLN, mesenteric lymph node; PP,Peyer’s patch; RA, retinoic acid; SFB, segmented filamentous bacteria; Treg, regula-tory T; Vert-X, IL-10–IRES-EGFP reporter.
Copyright� 2011 by The American Association of Immunologists, Inc. 0022-1767/11/$16.00
www.jimmunol.org/cgi/doi/10.4049/jimmunol.1002701
at Em
ory University H
ealth Sciences Library on January 15, 2013
http://jimm
unol.org/D
ownloaded from
Additionally, CD11b+ LP DCs can promote the induction of Th17cell differentiation either constitutively (16) or after stimulation bybacterial flagellin in a TLR5-dependent manner (17). IntestinalDCs also have been reported to specifically induce the gut-homingmolecules a4b7 and CCR9 on responding T and B cells (18–20)and Foxp3+ regulatory T (Treg) cells from naive CD4+ T cellsin vitro in a retinoic acid (RA)-dependent fashion (21–23), andrecent work from our laboratory has demonstrated a potent role forb-catenin signaling in programming such DCs to a tolerogenicstate (24). The ability of LP DCs to induce Foxp3+ Treg cell con-version appears closely linked with the commensal microbiota,because such conversion can be inhibited by bacterial CpG andTLR9-deficient mice have increases in Foxp3+ Treg cells in the LP(25). The role of CD8a+ LP DCs is less clear but also may be toinduce differentiation of Treg cells (26).In addition to DCs, a major macrophage network exists in the
intestinal LP. LP macrophages are avidly phagocytic and hypo-responsive to various inflammatory stimuli, spontaneously secreteIL-10, and can efficiently promote Foxp3+ Treg cell conversionin vitro in the presence of exogenous TGF-b (16, 27–31). Steady-state LP macrophages also may dampen immune responses duringhomeostasis and intestinal inflammation or injury (16, 29, 32–34).For example, depletion of intestinal macrophages using clodro-nate liposomes led to exacerbated dextran sodium sulfate (DSS)-induced experimental colitis (35). Alternatively, certain macro-phage subsets may contribute to the pathogenesis of intestinalinflammation in mice and humans (29, 36). Recently, TREM-1+
and CD14+ LP macrophages were shown to be associated withthe pathogenesis of human inflammatory bowel disease (37, 38).Thus, steady-state LP macrophages may play important roles inmaintaining tolerance, whereas inflammatory macrophages maycontribute to the pathogenesis of intestinal inflammation (36).Thus, unique APCs subsets in different regions of the intestine
may contribute to maintaining the balance between tolerogenic andproinflammatory immune responses. In this article, we have definedmajor DC and macrophage subsets in the small and large intestineLP and demonstrate that the functional specializations of LP DCand macrophage subsets in the intestine are dependent on severalparameters, including the T cell/APC ratio, regional localization, andsource of the mouse strain. Thus, F4/80+ macrophage subsets are themajor IL-10 producers in the LP and concomitantly express TGF-band RA-generating enzymes and promote differentiation of in-ducible Foxp3+ Treg cells. Furthermore, all of the DC subsets couldinduce Foxp3+ Treg cells at particular T cell/APC ratios. Alterna-tively, CD11b+CD103+ LP DCs in C57BL/6 mice from CharlesRiver Laboratories uniquely express IL-6 and TGF-bmRNA as wellas RA-generating enzymes and efficiently induce differentiation ofTh17 cells. CD11b+CD103+ LP DCs are enriched in the duodenumand rare in the colon during the steady state and accumulate in thecolonic LP along with Th17 cells during intestinal inflammation.Strikingly, CD11c+CD11b+ LP DCs from C57BL/6 mice purchasedfrom Charles River Laboratories [that have segmented filamentousbacteria (SFB), which induce robust levels of Th17 cells in situ (39,40)] were more efficient at inducing Th17 cells and less efficient atinducing Foxp3+ Treg cells than their counterparts from C57BL/6mice from The Jackson Laboratory. Therefore, these results dem-onstrate that the functions of intestinal APC subsets are dependenton several parameters, including the T cell/APC ratio, source of themouse strain, and regional localization.
Materials and MethodsMice
C57BL/6 male mice 6–12 wk of age obtained from Charles River Labo-ratory were used in all of the studies. In specific experiments, mice
obtained from The Jackson Laboratory also were used. OT-II (Rag1/2+/+)mice, originally obtained from The Jackson Laboratory, were bred on-site.IL-10–IRES-EGFP reporter (Vert-X) mice (41) were created by insertionof a floxed neomycin–IRES-EGFP cassette between the endogenous stopsite and the polyadenosine site of IL-10. The neomycin resistance markerwas excised by breeding the mice with Zp3-Cre mice, and successful Cre-mediated deletion was confirmed by Southern blot analysis (41). Micewere maintained under specific pathogen-free conditions in the EmoryVaccine Center or Emory Whitehead Biomedical Research Building vi-variums. All of the animal protocols were reviewed and approved by theInstitute Animal Care and Use Committee of Emory University.
Isolation of LP cells
Briefly, small and large intestines were removed and carefully cleaned oftheir mesentery, PPs were excised (small intestine), and intestines wereopened longitudinally and washed of fecal contents. Intestines then were cutinto 0.5-cm pieces, transferred into 50-ml conical tubes, and shaken at 250rpm for 20 min at 37˚C in HBSS medium (Life Technologies) supple-mented with 5% FBS (Mediatech) containing 2 mM EDTA. This processwas repeated two additional times. The cell suspensions were passedthrough a strainer, and the remaining intestinal tissue was washed and thenminced, transferred into a 50-ml conical tube, and shaken for 20 min at37˚C in HBSS + 5% FBS containing type VIII collagenase at 1.5 mg/ml(Sigma-Aldrich). The cell suspension was collected, passed through astrainer, and pelleted by centrifugation at 1200 rpm. CD11b+ or CD11c+
cells were enriched by positive selection with CD11b or CD11cmicrobeads (Miltenyi Biotec), respectively. For FACS experiments, in-testinal CD11b/c-enriched cells were stained with PE-conjugated anti-CD103 (clone M290; BD Pharmingen), PerCP-conjugated anti-CD45(clone 30-F11; BD Pharmingen), PE-Cy7 conjugated anti-F4/80 (cloneBM8), allophycocyanin-conjugated anti-CD11c (clone HL3), Alexa Fluor700-conjugated anti-IAb (clone M5/114), and Pacific blue conjugated anti-CD11b (clone M1/70) (all from eBioscience unless otherwise noted).Stained cells were sorted to purify indicated populations on a FACSAriaat the Emory Vaccine Center Flow Cytometry Core Facility.
Flow cytometry
Isolated splenocytes or small intestine LP cells were resuspended in PBScontaining 5% FBS. After incubation for 15 min at 4˚C with the blockingAb 2.4G2 anti-FcgRIII/I, the cells were stained at 4˚C for 30 min withlabeled Abs. Samples then were washed two times in PBS containing 5%FBS. The samples were analyzed immediately at this point, or they werefixed in PBS containing 2% paraformaldehyde and stored at 4˚C. Absused for analysis were from eBioscience unless otherwise noted: FITC-conjugated anti-mouse B220, PE-conjugated anti-mouse CD103 (BDPharmingen), PE-Texas Red-conjugated anti-mouse CD8a (Caltag Labo-ratories), PerCP-conjugated anti-mouse CD45 (BD Pharmingen), PE-Cy7-conjugated anti-mouse F4/80, allophycocyanin-conjugated anti-mouseCD11c, Alexa Fluor 700-conjugated anti-mouse IAb, allophycocyanin-Alexa Fluor 750-conjugated anti-mouse Gr-1, Pacific blue-conjugatedanti-mouse CD11b, and Alexa Fluor 430 (live/dead stain; Invitrogen).Intracellular IL-17 or Foxp3 staining was performed using PE-conjugatedanti-mouse IL-17 or Foxp3 (eBioscience). Aldehyde dehydrogenase(ALDH) activity was determined using ALDEFLUOR staining kit(Stemcell Technologies) according to the manufacturer’s protocol. In brief,cells were suspended at a concentration of 106 cells/ml in ALDEFLUORassay buffer containing activated ALDEFLUOR substrate (final concen-tration of 1.5 mM) with or without the ALDH inhibitor diethylamino-benzaldehyde (DEAB) (final concentration of 15 mM) and incubated at37˚C for 30 min. Flow cytometric analysis was performed on a BD Bio-sciences FACSCalibur or LSR II flow cytometer at the Emory VaccineCenter.
Imaging
To analyze cell morphology, sorted LP APCs were spun onto glass slidesusing a CytoSpin centrifuge, allowed to air dry for 1 h, fixed in 100%methanol, and then stained using Wright–Giemsa stain.
Real-time PCR
Total RNA was isolated from FACS-sorted LP APCs or enriched, splenicDCs (CD11c+ cells) or macrophages (CD11b+ cells) using the QiagenRNeasy Mini Kit according to the manufacturer’s protocol with on-columnDNase digestion using the Qiagen RNase-Free DNase Set. cDNA wasgenerated using the Superscript First-Strand Synthesis System for RT-PCRand oligo(dT) primers (Invitrogen) according to the manufacturer’s pro-tocol. cDNA was used as a template for quantitative real-time PCR using
734 INTESTINAL APC SUBSETS IN MICE
at Em
ory University H
ealth Sciences Library on January 15, 2013
http://jimm
unol.org/D
ownloaded from
SYBR Green Master Mix (Bio-Rad). PCR and analysis was performedusing a MyiQ iCycler (Bio-Rad). Gene expression was calculated relativeto that of gapdh.
Stimulation of lymphocytes
In vitro FACS-sorted LP APCs (1 3 105 unless otherwise noted) werecocultured with naive CFSE-labeled or unlabeled CD4+CD62L+ OT-IIT cells (1 3 105) and OVA (ISQVHAAHAEINEAGR; 10 mg/ml) in 200ml RPMI 1640 complete medium in 96-well round-bottom plates. ForCFSE experiments, cells were harvested after 90 h. As a positive controlfor CFSE culture stimulation aCD3/28-coated beads (Dynal) were usedat a ratio of one bead per cell. For restimulation, cells were harvested after90 h of primary culture before being restimulated with PMA (50 ng/ml)and ionomycin (500 ng/ml) for 6 h (intracellular cytokine detection) inthe presence of GolgiPlug (BD Pharmingen). Small/large intestine LPlymphocytes were stimulated with PMA and ionomycin for 6 h in thepresence of GolgiPlug. For FoxP3+ Treg cell induction assays 1 ng/mlhuman rTGF-b (PeproTech) was added to the cultures.
Cytokine detection
For intracellular cytokine analysis, cells were stimulated with PMA andionomycin for 6 h in the presence of GolgiPlug and subsequently incubatedwith the blocking Ab 2.4G2 anti-FcgRIII/II (BD Pharmingen) and stainedwith PerCP-conjugated anti-CD4 and allophycocyanin-conjugated anti-mouse TCR-b (BD Pharmingen). Cells were permeabilized by usingCytofix/Cytoperm (BD Pharmingen) and stained by using fluorochrome-conjugated Abs according to the manufacturer’s protocol. IL-10 ELISAs(eBioscience) were performed according to the manufacturer’s protocol.
Suppression assay
Naive OT-II CD4+ T cells (1 3 105) were cultured with CD11c2 LPmacrophages (13 105) in the presence of 1 ng/ml human rTGF-b for 90 h,then harvested, washed, and added at a ratio of 1:1 to cultures of CFSE-labeled naive polyclonal CD4+CD45.1+ splenic T cells stimulated withCD11c+ splenic DCs and soluble anti-CD3ε (2 mg/ml; BD Pharmingen).Cultures were incubated for 48 h and analyzed for CFSE dilution aftergating on CD4+CD45.1+ cells.
Induction and assessment of chronic colitis
Chronic colitis was induced by multiple-cycle administration of DSS indrinking water (42, 43). Mice received either regular drinking water(control) or 3% (w/v) DSS in drinking water (m.w. 40,000 –50,000) (MPBiomedicals) on days 1–5, 8–12, 15–19, and 22–26, and mice were sac-rificed on day 29. Histology was used to evaluate inflammation, and co-lonic shortening was analyzed. This model of colitis is referred to as“chronic,” because it involved four cycles of DSS treatment over thecourse of nearly 1 mo and is distinct from the commonly used “acute”model of DSS-induced colitis where mice are typically treated for 5–7 d.
Statistical analysis
Statistical significances of differences in means 6 SEM from differentgroups were calculated using the unpaired t test (two-tailed) usingGraphPad Prism software. The p values ,0.05 were considered statisti-cally significant.
ResultsCharacterization of intestine LP DC and macrophage subsets
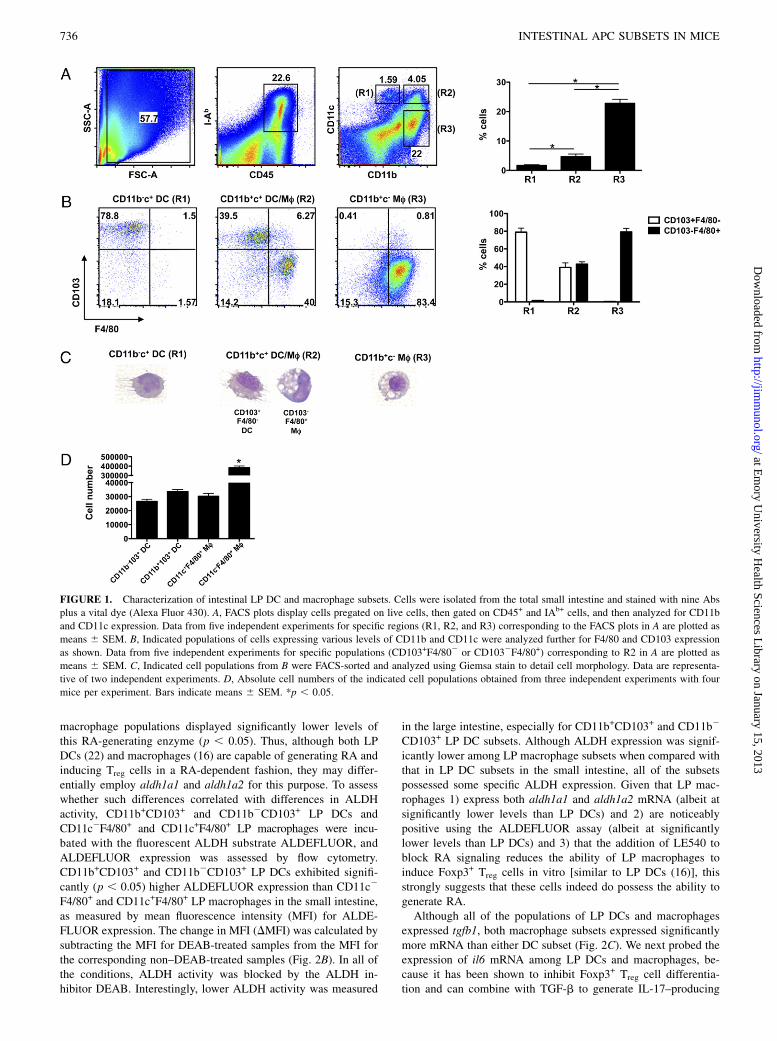
A clear definition of intestine LP DCs and macrophages has beenplagued by a lack of specific markers that clearly delineate eachpopulation and subsets existing within. Therefore, we performed10-color flow cytometry on isolated small intestine LP cellscombining the use of 9 markers (CD8a, CD11b, CD11c, CD45,CD103, IAb, F4/80, Ly-6C/G, and B220) and a vital dye. Aftergating on live, CD45+IAb+ cells, three major cell populationsexpressing either CD11b and/or CD11c were identified (Fig. 1A).Two populations of CD11c+ cells were distinguished by differen-tial expression of CD11b, with the CD11b+CD11c+ cells (4.64 69.2%) ∼2.5-fold more abundant than the CD11bdull/2CD11c+
subset (1.676 0.22%). This difference was statistically significant(p , 0.05). Notably, CD11bdull/2CD11c+ cells were a discretesubset, whereas CD11b+CD11c+ cells displayed variable levels of
CD11c that formed a continuum. The gate for CD11b+CD11c+
cells, with regard to CD11c intensity, was identified based uponthe same level of CD11c expression as that for the clearly definedCD11bdull/2CD11c+ subset gate. The other abundant populationof cells identified was CD11b+CD11cdull/2 cells (22.75 6 1.4%),which were 5.4-fold more abundant than the CD11b+CD11c+
subset and 13.8-fold more abundant than the CD11bdull/2CD11c+
subset. These differences were statistically significant (p , 0.05).All of the above-mentioned populations and subsets did not ex-press B220 or Ly-6C/G (data not shown). Additionally, cells thatdid not stain for either CD11b or CD11c included B cells asidentified by B220 or CD19 staining and other undefined cells(data not shown).To further characterize each of the three major populations
expressing either CD11b and/or CD11c, they were analyzed forexpression of CD103 and F4/80. The large majority (78.96 2.2%)of CD11bdull/2CD11c+ LP cells expressed high levels of CD103and were negative for F4/80 (Fig. 1B). Interestingly, CD11b+
CD11c+ cells included approximately equal frequencies ofCD103+F4/802 and CD1032F4/80+ subsets (39 6 2.5% and42.7 6 1.3%, respectively). The most abundant CD11b+
CD11cdull/2 population was almost entirely CD1032F4/80+
(79.2 6 2%). In order to visualize the cell morphology of each ofthese populations, Giemsa staining was performed on FACS-sorted cells. CD11bdull/2CD11c+ cells, which were largelyCD103+F4/802, displayed classical DC morphology with nu-merous dendrites extending from the cell surface and few de-tectable phagocytic vacuoles (Fig. 1C). Similarly, among theCD11b+CD11c+ population the CD103+F4/802 subset was char-acterized by classical DC morphology, whereas the CD1032
F4/80+ subset displayed typical macrophage morphology charac-terized by abundant phagocytic vacuoles and a relative lackof dendrites. As previously reported by our group, CD11b+
CD11cdull/2 cells also displayed typical macrophage morphology(16). These results collectively demonstrate that IAb+ DCs in thesmall intestine LP are defined largely by the expression of CD103with variable expression of CD11b (hereafter referred to asCD11b+CD103+ and CD11b2CD103+ LP DCs for simplicity),whereas IAb+ macrophages are defined by the expression ofCD11b and F4/80 with variable expression of CD11c (hereafterreferred to as CD11c2F4/80+ and CD11c+F4/80+ LP macro-phages). Additionally, we calculated absolute cell numbers foreach of these populations. As shown in Fig. 1D, both LP DCsubsets as well as CD11c+F4/80+ LP macrophages were present insimilar numbers, whereas CD11c2F4/80+ LP macrophages were∼10-fold more abundant (p , 0.05). Of note, our strategy ofpregating on CD45+IAb+ cells for these analyses intentionally didnot include what may be considered side scatterhiIAb2 macro-phages (44) or eosinophils (17).Because LP DCs and macrophages have been reported to
generate Foxp3+ Treg cells via the production of RA and IL-10 inthe presence of TGF-b1, we analyzed the expression of theRA-generating enzymes retinaldehyde dehydrogenase 1 and 2(aldh1a1 and aldh1a2), il10, and tgfb1 by quantitative real-timePCR. For comparative purposes, splenic DCs (CD11c+ cells) andmacrophages (CD11b+ cells) were included in the analyses. LPDCs and macrophages further displayed a clear difference in ex-pression of RA-generating enzymes. CD11c2F4/80+ LP macro-phages expressed high levels of aldh1a1, CD11c+F4/80+ LPmacrophages and CD11b+CD103+ LP DCs expressed intermediatelevels, and CD11b2CD103+ LP DCs expressed very low levelsthat were comparable to those of splenic DCs and macrophages(Fig. 2A). Alternatively, CD11b+CD103+ and CD11b2CD103+ LPDCs expressed high levels of aldh1a2 mRNA, and both LP
The Journal of Immunology 735
at Em
ory University H
ealth Sciences Library on January 15, 2013
http://jimm
unol.org/D
ownloaded from
macrophage populations displayed significantly lower levels ofthis RA-generating enzyme (p , 0.05). Thus, although both LPDCs (22) and macrophages (16) are capable of generating RA andinducing Treg cells in a RA-dependent fashion, they may differ-entially employ aldh1a1 and aldh1a2 for this purpose. To assesswhether such differences correlated with differences in ALDHactivity, CD11b+CD103+ and CD11b2CD103+ LP DCs andCD11c2F4/80+ and CD11c+F4/80+ LP macrophages were incu-bated with the fluorescent ALDH substrate ALDEFLUOR, andALDEFLUOR expression was assessed by flow cytometry.CD11b+CD103+ and CD11b2CD103+ LP DCs exhibited signifi-cantly (p , 0.05) higher ALDEFLUOR expression than CD11c2
F4/80+ and CD11c+F4/80+ LP macrophages in the small intestine,as measured by mean fluorescence intensity (MFI) for ALDE-FLUOR expression. The change in MFI (DMFI) was calculated bysubtracting the MFI for DEAB-treated samples from the MFI forthe corresponding non–DEAB-treated samples (Fig. 2B). In all ofthe conditions, ALDH activity was blocked by the ALDH in-hibitor DEAB. Interestingly, lower ALDH activity was measured
in the large intestine, especially for CD11b+CD103+ and CD11b2
CD103+ LP DC subsets. Although ALDH expression was signif-icantly lower among LP macrophage subsets when compared withthat in LP DC subsets in the small intestine, all of the subsetspossessed some specific ALDH expression. Given that LP mac-rophages 1) express both aldh1a1 and aldh1a2 mRNA (albeit atsignificantly lower levels than LP DCs) and 2) are noticeablypositive using the ALDEFLUOR assay (albeit at significantlylower levels than LP DCs) and 3) that the addition of LE540 toblock RA signaling reduces the ability of LP macrophages toinduce Foxp3+ Treg cells in vitro [similar to LP DCs (16)], thisstrongly suggests that these cells indeed do possess the ability togenerate RA.Although all of the populations of LP DCs and macrophages
expressed tgfb1, both macrophage subsets expressed significantlymore mRNA than either DC subset (Fig. 2C). We next probed theexpression of il6 mRNA among LP DCs and macrophages, be-cause it has been shown to inhibit Foxp3+ Treg cell differentia-tion and can combine with TGF-b to generate IL-17–producing
FIGURE 1. Characterization of intestinal LP DC and macrophage subsets. Cells were isolated from the total small intestine and stained with nine Abs
plus a vital dye (Alexa Fluor 430). A, FACS plots display cells pregated on live cells, then gated on CD45+ and IAb+ cells, and then analyzed for CD11b
and CD11c expression. Data from five independent experiments for specific regions (R1, R2, and R3) corresponding to the FACS plots in A are plotted as
means 6 SEM. B, Indicated populations of cells expressing various levels of CD11b and CD11c were analyzed further for F4/80 and CD103 expression
as shown. Data from five independent experiments for specific populations (CD103+F4/802 or CD1032F4/80+) corresponding to R2 in A are plotted as
means 6 SEM. C, Indicated cell populations from B were FACS-sorted and analyzed using Giemsa stain to detail cell morphology. Data are representa-
tive of two independent experiments. D, Absolute cell numbers of the indicated cell populations obtained from three independent experiments with four
mice per experiment. Bars indicate means 6 SEM. *p , 0.05.
736 INTESTINAL APC SUBSETS IN MICE
at Em
ory University H
ealth Sciences Library on January 15, 2013
http://jimm
unol.org/D
ownloaded from
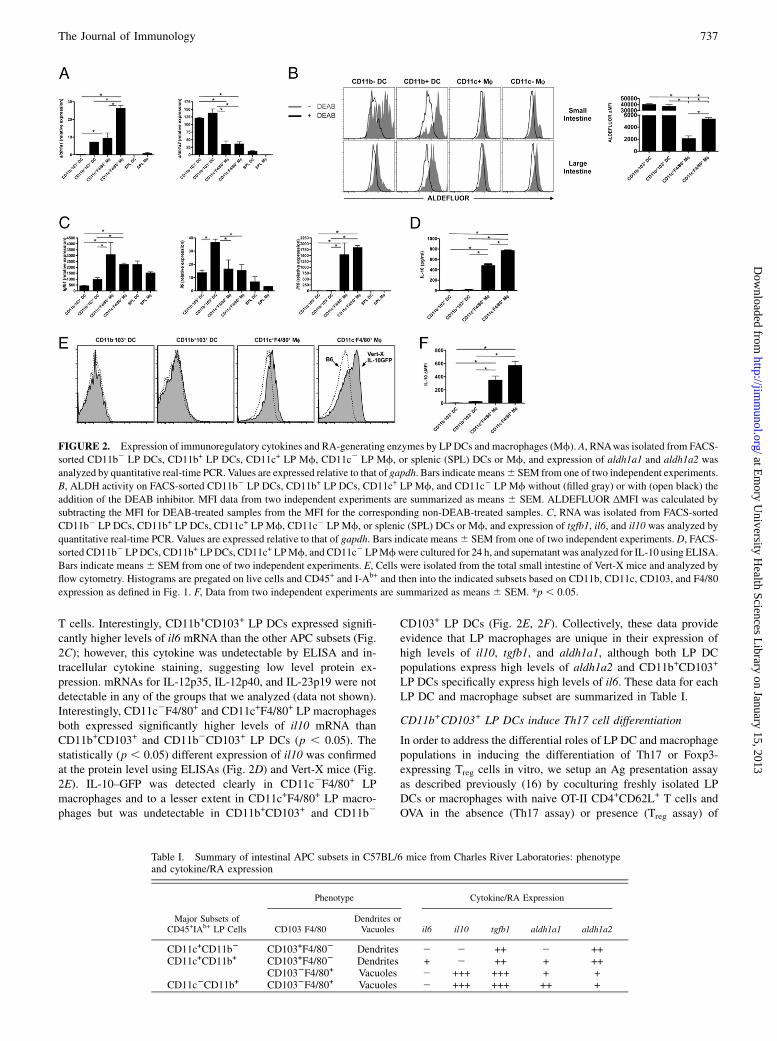
T cells. Interestingly, CD11b+CD103+ LP DCs expressed signifi-cantly higher levels of il6 mRNA than the other APC subsets (Fig.2C); however, this cytokine was undetectable by ELISA and in-tracellular cytokine staining, suggesting low level protein ex-pression. mRNAs for IL-12p35, IL-12p40, and IL-23p19 were notdetectable in any of the groups that we analyzed (data not shown).Interestingly, CD11c2F4/80+ and CD11c+F4/80+ LP macrophagesboth expressed significantly higher levels of il10 mRNA thanCD11b+CD103+ and CD11b2CD103+ LP DCs (p , 0.05). Thestatistically (p , 0.05) different expression of il10 was confirmedat the protein level using ELISAs (Fig. 2D) and Vert-X mice (Fig.2E). IL-10–GFP was detected clearly in CD11c2F4/80+ LPmacrophages and to a lesser extent in CD11c+F4/80+ LP macro-phages but was undetectable in CD11b+CD103+ and CD11b2
CD103+ LP DCs (Fig. 2E, 2F). Collectively, these data provideevidence that LP macrophages are unique in their expression ofhigh levels of il10, tgfb1, and aldh1a1, although both LP DCpopulations express high levels of aldh1a2 and CD11b+CD103+
LP DCs specifically express high levels of il6. These data for eachLP DC and macrophage subset are summarized in Table I.
CD11b+CD103+ LP DCs induce Th17 cell differentiation
In order to address the differential roles of LP DC and macrophagepopulations in inducing the differentiation of Th17 or Foxp3-expressing Treg cells in vitro, we setup an Ag presentation assayas described previously (16) by coculturing freshly isolated LPDCs or macrophages with naive OT-II CD4+CD62L+ T cells andOVA in the absence (Th17 assay) or presence (Treg assay) of
FIGURE 2. Expression of immunoregulatory cytokines and RA-generating enzymes by LP DCs and macrophages (Mf). A, RNAwas isolated from FACS-
sorted CD11b2 LP DCs, CD11b+ LP DCs, CD11c+ LP Mf, CD11c2 LP Mf, or splenic (SPL) DCs or Mf, and expression of aldh1a1 and aldh1a2 was
analyzed by quantitative real-time PCR. Values are expressed relative to that of gapdh. Bars indicate means6 SEM from one of two independent experiments.
B, ALDH activity on FACS-sorted CD11b2 LP DCs, CD11b+ LP DCs, CD11c+ LP Mf, and CD11c2 LP Mf without (filled gray) or with (open black) the
addition of the DEAB inhibitor. MFI data from two independent experiments are summarized as means 6 SEM. ALDEFLUOR ΔMFI was calculated by
subtracting the MFI for DEAB-treated samples from the MFI for the corresponding non-DEAB-treated samples. C, RNA was isolated from FACS-sorted
CD11b2 LP DCs, CD11b+ LP DCs, CD11c+ LP Mf, CD11c2 LP Mf, or splenic (SPL) DCs or Mf, and expression of tgfb1, il6, and il10 was analyzed by
quantitative real-time PCR. Values are expressed relative to that of gapdh. Bars indicate means6 SEM from one of two independent experiments. D, FACS-
sorted CD11b2 LPDCs, CD11b+ LPDCs, CD11c+ LPMf, and CD11c2 LPMfwere cultured for 24 h, and supernatant was analyzed for IL-10 using ELISA.
Bars indicate means6 SEM from one of two independent experiments. E, Cells were isolated from the total small intestine of Vert-X mice and analyzed by
flow cytometry. Histograms are pregated on live cells and CD45+ and I-Ab+ and then into the indicated subsets based on CD11b, CD11c, CD103, and F4/80
expression as defined in Fig. 1. F, Data from two independent experiments are summarized as means 6 SEM. *p , 0.05.
Table I. Summary of intestinal APC subsets in C57BL/6 mice from Charles River Laboratories: phenotypeand cytokine/RA expression
Phenotype Cytokine/RA Expression
Major Subsets ofCD45+IAb+ LP Cells CD103 F4/80
Dendrites orVacuoles il6 il10 tgfb1 aldh1a1 aldh1a2
CD11c+CD11b2 CD103+F4/802 Dendrites 2 2 ++ 2 ++CD11c+CD11b+ CD103+F4/802 Dendrites + 2 ++ + ++
CD1032F4/80+ Vacuoles 2 +++ +++ + +CD11c2CD11b+ CD1032F4/80+ Vacuoles 2 +++ +++ ++ +
The Journal of Immunology 737
at Em
ory University H
ealth Sciences Library on January 15, 2013
http://jimm
unol.org/D
ownloaded from
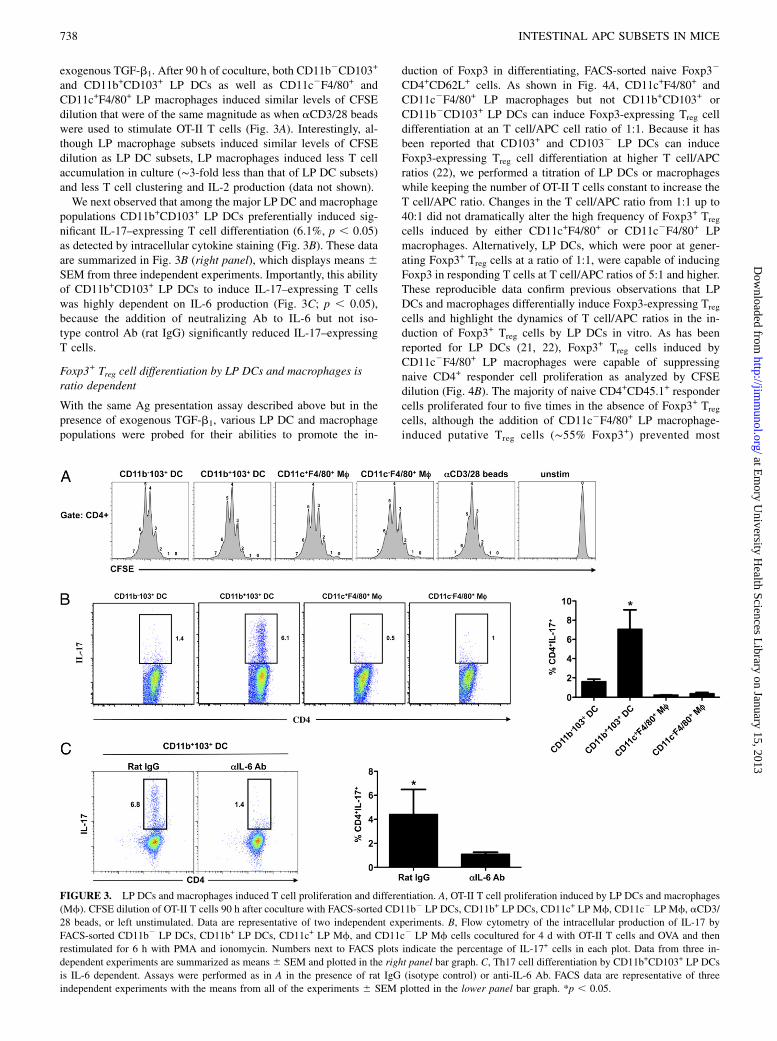
exogenous TGF-b1. After 90 h of coculture, both CD11b2CD103+
and CD11b+CD103+ LP DCs as well as CD11c2F4/80+ andCD11c+F4/80+ LP macrophages induced similar levels of CFSEdilution that were of the same magnitude as when aCD3/28 beadswere used to stimulate OT-II T cells (Fig. 3A). Interestingly, al-though LP macrophage subsets induced similar levels of CFSEdilution as LP DC subsets, LP macrophages induced less T cellaccumulation in culture (∼3-fold less than that of LP DC subsets)and less T cell clustering and IL-2 production (data not shown).We next observed that among the major LP DC and macrophage
populations CD11b+CD103+ LP DCs preferentially induced sig-nificant IL-17–expressing T cell differentiation (6.1%, p , 0.05)as detected by intracellular cytokine staining (Fig. 3B). These dataare summarized in Fig. 3B (right panel), which displays means 6SEM from three independent experiments. Importantly, this abilityof CD11b+CD103+ LP DCs to induce IL-17–expressing T cellswas highly dependent on IL-6 production (Fig. 3C; p , 0.05),because the addition of neutralizing Ab to IL-6 but not iso-type control Ab (rat IgG) significantly reduced IL-17–expressingT cells.
Foxp3+ Treg cell differentiation by LP DCs and macrophages isratio dependent
With the same Ag presentation assay described above but in thepresence of exogenous TGF-b1, various LP DC and macrophagepopulations were probed for their abilities to promote the in-
duction of Foxp3 in differentiating, FACS-sorted naive Foxp32
CD4+CD62L+ cells. As shown in Fig. 4A, CD11c+F4/80+ andCD11c2F4/80+ LP macrophages but not CD11b+CD103+ orCD11b2CD103+ LP DCs can induce Foxp3-expressing Treg celldifferentiation at an T cell/APC cell ratio of 1:1. Because it hasbeen reported that CD103+ and CD1032 LP DCs can induceFoxp3-expressing Treg cell differentiation at higher T cell/APCratios (22), we performed a titration of LP DCs or macrophageswhile keeping the number of OT-II T cells constant to increase theT cell/APC ratio. Changes in the T cell/APC ratio from 1:1 up to40:1 did not dramatically alter the high frequency of Foxp3+ Treg
cells induced by either CD11c+F4/80+ or CD11c2F4/80+ LPmacrophages. Alternatively, LP DCs, which were poor at gener-ating Foxp3+ Treg cells at a ratio of 1:1, were capable of inducingFoxp3 in responding T cells at T cell/APC ratios of 5:1 and higher.These reproducible data confirm previous observations that LPDCs and macrophages differentially induce Foxp3-expressing Treg
cells and highlight the dynamics of T cell/APC ratios in the in-duction of Foxp3+ Treg cells by LP DCs in vitro. As has beenreported for LP DCs (21, 22), Foxp3+ Treg cells induced byCD11c2F4/80+ LP macrophages were capable of suppressingnaive CD4+ responder cell proliferation as analyzed by CFSEdilution (Fig. 4B). The majority of naive CD4+CD45.1+ respondercells proliferated four to five times in the absence of Foxp3+ Treg
cells, although the addition of CD11c2F4/80+ LP macrophage-induced putative Treg cells (∼55% Foxp3+) prevented most
FIGURE 3. LP DCs and macrophages induced T cell proliferation and differentiation. A, OT-II T cell proliferation induced by LP DCs and macrophages
(Mf). CFSE dilution of OT-II T cells 90 h after coculture with FACS-sorted CD11b2 LP DCs, CD11b+ LP DCs, CD11c+ LP Mf, CD11c2 LP Mf, aCD3/
28 beads, or left unstimulated. Data are representative of two independent experiments. B, Flow cytometry of the intracellular production of IL-17 by
FACS-sorted CD11b2 LP DCs, CD11b+ LP DCs, CD11c+ LP Mf, and CD11c2 LP Mf cells cocultured for 4 d with OT-II T cells and OVA and then
restimulated for 6 h with PMA and ionomycin. Numbers next to FACS plots indicate the percentage of IL-17+ cells in each plot. Data from three in-
dependent experiments are summarized as means 6 SEM and plotted in the right panel bar graph. C, Th17 cell differentiation by CD11b+CD103+ LP DCs
is IL-6 dependent. Assays were performed as in A in the presence of rat IgG (isotype control) or anti-IL-6 Ab. FACS data are representative of three
independent experiments with the means from all of the experiments 6 SEM plotted in the lower panel bar graph. *p , 0.05.
738 INTESTINAL APC SUBSETS IN MICE
at Em
ory University H
ealth Sciences Library on January 15, 2013
http://jimm
unol.org/D
ownloaded from
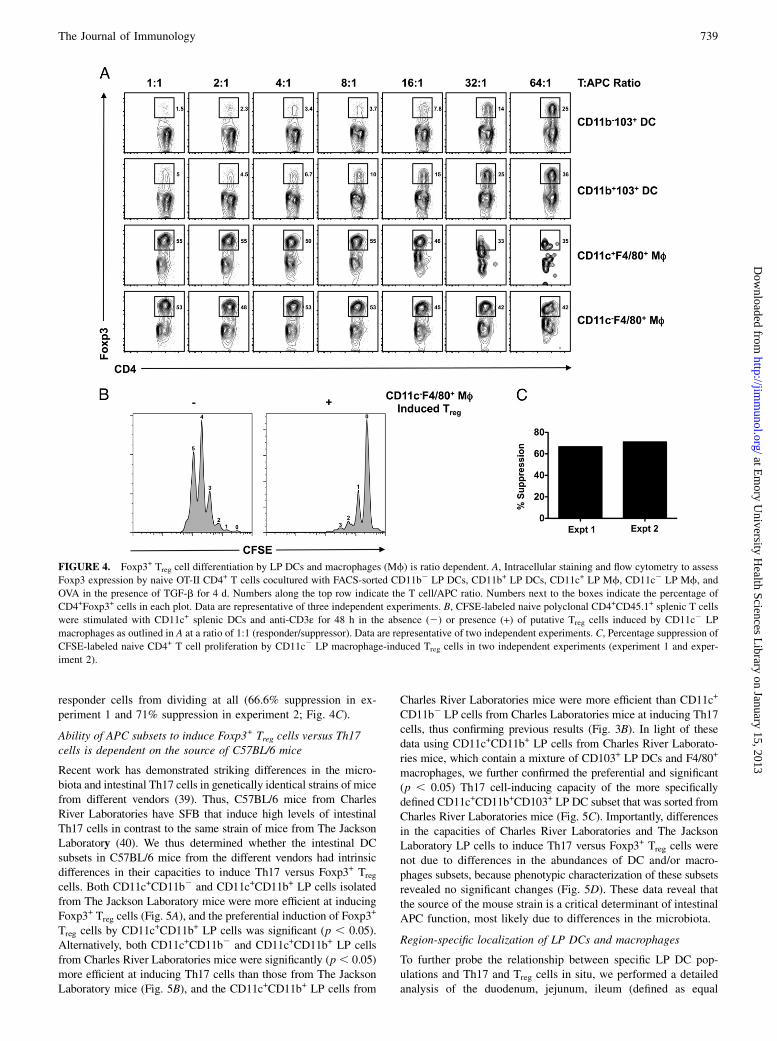
responder cells from dividing at all (66.6% suppression in ex-periment 1 and 71% suppression in experiment 2; Fig. 4C).
Ability of APC subsets to induce Foxp3+ Treg cells versus Th17cells is dependent on the source of C57BL/6 mice
Recent work has demonstrated striking differences in the micro-biota and intestinal Th17 cells in genetically identical strains of micefrom different vendors (39). Thus, C57BL/6 mice from CharlesRiver Laboratories have SFB that induce high levels of intestinalTh17 cells in contrast to the same strain of mice from The JacksonLaboratory (40). We thus determined whether the intestinal DCsubsets in C57BL/6 mice from the different vendors had intrinsicdifferences in their capacities to induce Th17 versus Foxp3+ Tregcells. Both CD11c+CD11b2 and CD11c+CD11b+ LP cells isolatedfrom The Jackson Laboratory mice were more efficient at inducingFoxp3+ Treg cells (Fig. 5A), and the preferential induction of Foxp3
+
Treg cells by CD11c+CD11b+ LP cells was significant (p , 0.05).Alternatively, both CD11c+CD11b2 and CD11c+CD11b+ LP cellsfrom Charles River Laboratories mice were significantly (p , 0.05)more efficient at inducing Th17 cells than those from The JacksonLaboratory mice (Fig. 5B), and the CD11c+CD11b+ LP cells from
Charles River Laboratories mice were more efficient than CD11c+
CD11b2 LP cells from Charles Laboratories mice at inducing Th17cells, thus confirming previous results (Fig. 3B). In light of thesedata using CD11c+CD11b+ LP cells from Charles River Laborato-ries mice, which contain a mixture of CD103+ LP DCs and F4/80+
macrophages, we further confirmed the preferential and significant(p , 0.05) Th17 cell-inducing capacity of the more specificallydefined CD11c+CD11b+CD103+ LP DC subset that was sorted fromCharles River Laboratories mice (Fig. 5C). Importantly, differencesin the capacities of Charles River Laboratories and The JacksonLaboratory LP cells to induce Th17 versus Foxp3+ Treg cells werenot due to differences in the abundances of DC and/or macro-phages subsets, because phenotypic characterization of these subsetsrevealed no significant changes (Fig. 5D). These data reveal thatthe source of the mouse strain is a critical determinant of intestinalAPC function, most likely due to differences in the microbiota.
Region-specific localization of LP DCs and macrophages
To further probe the relationship between specific LP DC pop-ulations and Th17 and Treg cells in situ, we performed a detailedanalysis of the duodenum, jejunum, ileum (defined as equal
FIGURE 4. Foxp3+ Treg cell differentiation by LP DCs and macrophages (Mf) is ratio dependent. A, Intracellular staining and flow cytometry to assess
Foxp3 expression by naive OT-II CD4+ T cells cocultured with FACS-sorted CD11b2 LP DCs, CD11b+ LP DCs, CD11c+ LP Mf, CD11c2 LP Mf, and
OVA in the presence of TGF-b for 4 d. Numbers along the top row indicate the T cell/APC ratio. Numbers next to the boxes indicate the percentage of
CD4+Foxp3+ cells in each plot. Data are representative of three independent experiments. B, CFSE-labeled naive polyclonal CD4+CD45.1+ splenic T cells
were stimulated with CD11c+ splenic DCs and anti-CD3ε for 48 h in the absence (2) or presence (+) of putative Treg cells induced by CD11c2 LP
macrophages as outlined in A at a ratio of 1:1 (responder/suppressor). Data are representative of two independent experiments. C, Percentage suppression of
CFSE-labeled naive CD4+ T cell proliferation by CD11c2 LP macrophage-induced Treg cells in two independent experiments (experiment 1 and exper-
iment 2).
The Journal of Immunology 739
at Em
ory University H
ealth Sciences Library on January 15, 2013
http://jimm
unol.org/D
ownloaded from
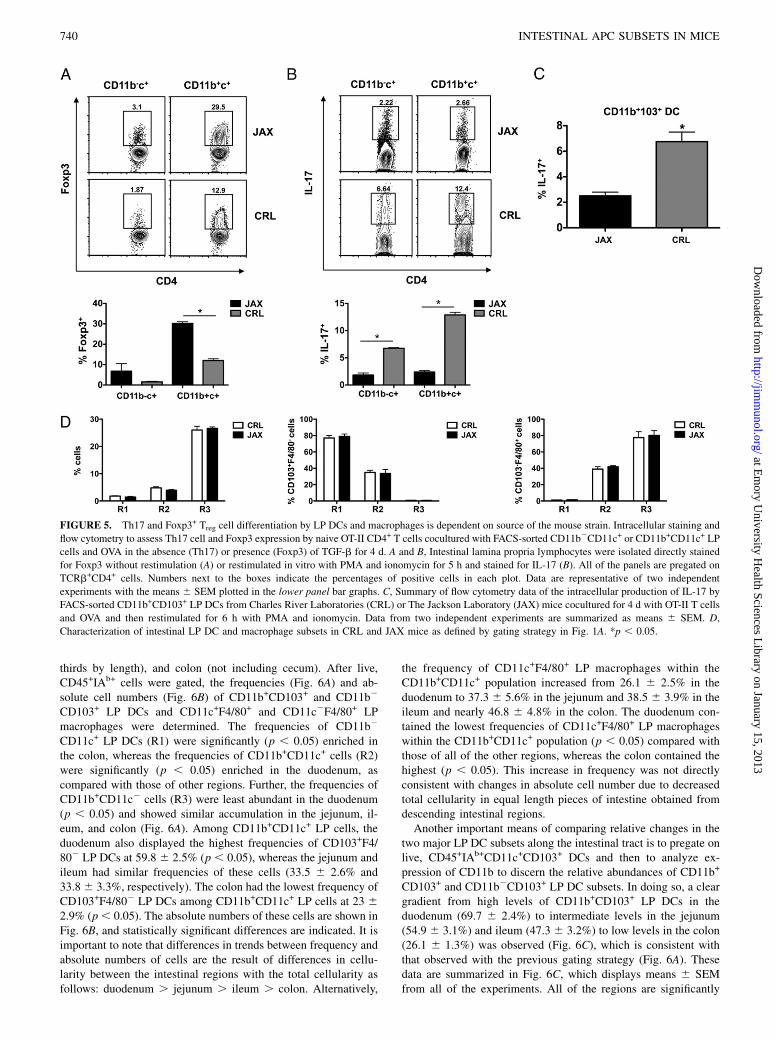
thirds by length), and colon (not including cecum). After live,CD45+IAb+ cells were gated, the frequencies (Fig. 6A) and ab-solute cell numbers (Fig. 6B) of CD11b+CD103+ and CD11b2
CD103+ LP DCs and CD11c+F4/80+ and CD11c2F4/80+ LPmacrophages were determined. The frequencies of CD11b2
CD11c+ LP DCs (R1) were significantly (p , 0.05) enriched inthe colon, whereas the frequencies of CD11b+CD11c+ cells (R2)were significantly (p , 0.05) enriched in the duodenum, ascompared with those of other regions. Further, the frequencies ofCD11b+CD11c2 cells (R3) were least abundant in the duodenum(p , 0.05) and showed similar accumulation in the jejunum, il-eum, and colon (Fig. 6A). Among CD11b+CD11c+ LP cells, theduodenum also displayed the highest frequencies of CD103+F4/802 LP DCs at 59.8 6 2.5% (p , 0.05), whereas the jejunum andileum had similar frequencies of these cells (33.5 6 2.6% and33.86 3.3%, respectively). The colon had the lowest frequency ofCD103+F4/802 LP DCs among CD11b+CD11c+ LP cells at 23 62.9% (p, 0.05). The absolute numbers of these cells are shown inFig. 6B, and statistically significant differences are indicated. It isimportant to note that differences in trends between frequency andabsolute numbers of cells are the result of differences in cellu-larity between the intestinal regions with the total cellularity asfollows: duodenum . jejunum . ileum . colon. Alternatively,
the frequency of CD11c+F4/80+ LP macrophages within theCD11b+CD11c+ population increased from 26.1 6 2.5% in theduodenum to 37.3 6 5.6% in the jejunum and 38.5 6 3.9% in theileum and nearly 46.8 6 4.8% in the colon. The duodenum con-tained the lowest frequencies of CD11c+F4/80+ LP macrophageswithin the CD11b+CD11c+ population (p , 0.05) compared withthose of all of the other regions, whereas the colon contained thehighest (p , 0.05). This increase in frequency was not directlyconsistent with changes in absolute cell number due to decreasedtotal cellularity in equal length pieces of intestine obtained fromdescending intestinal regions.Another important means of comparing relative changes in the
two major LP DC subsets along the intestinal tract is to pregate onlive, CD45+IAb+CD11c+CD103+ DCs and then to analyze ex-pression of CD11b to discern the relative abundances of CD11b+
CD103+ and CD11b2CD103+ LP DC subsets. In doing so, a cleargradient from high levels of CD11b+CD103+ LP DCs in theduodenum (69.7 6 2.4%) to intermediate levels in the jejunum(54.9 6 3.1%) and ileum (47.3 6 3.2%) to low levels in the colon(26.1 6 1.3%) was observed (Fig. 6C), which is consistent withthat observed with the previous gating strategy (Fig. 6A). Thesedata are summarized in Fig. 6C, which displays means 6 SEMfrom all of the experiments. All of the regions are significantly
FIGURE 5. Th17 and Foxp3+ Treg cell differentiation by LP DCs and macrophages is dependent on source of the mouse strain. Intracellular staining and
flow cytometry to assess Th17 cell and Foxp3 expression by naive OT-II CD4+ T cells cocultured with FACS-sorted CD11b2CD11c+ or CD11b+CD11c+ LP
cells and OVA in the absence (Th17) or presence (Foxp3) of TGF-b for 4 d. A and B, Intestinal lamina propria lymphocytes were isolated directly stained
for Foxp3 without restimulation (A) or restimulated in vitro with PMA and ionomycin for 5 h and stained for IL-17 (B). All of the panels are pregated on
TCRb+CD4+ cells. Numbers next to the boxes indicate the percentages of positive cells in each plot. Data are representative of two independent
experiments with the means 6 SEM plotted in the lower panel bar graphs. C, Summary of flow cytometry data of the intracellular production of IL-17 by
FACS-sorted CD11b+CD103+ LP DCs from Charles River Laboratories (CRL) or The Jackson Laboratory (JAX) mice cocultured for 4 d with OT-II T cells
and OVA and then restimulated for 6 h with PMA and ionomycin. Data from two independent experiments are summarized as means 6 SEM. D,
Characterization of intestinal LP DC and macrophage subsets in CRL and JAX mice as defined by gating strategy in Fig. 1A. *p , 0.05.
740 INTESTINAL APC SUBSETS IN MICE
at Em
ory University H
ealth Sciences Library on January 15, 2013
http://jimm
unol.org/D
ownloaded from
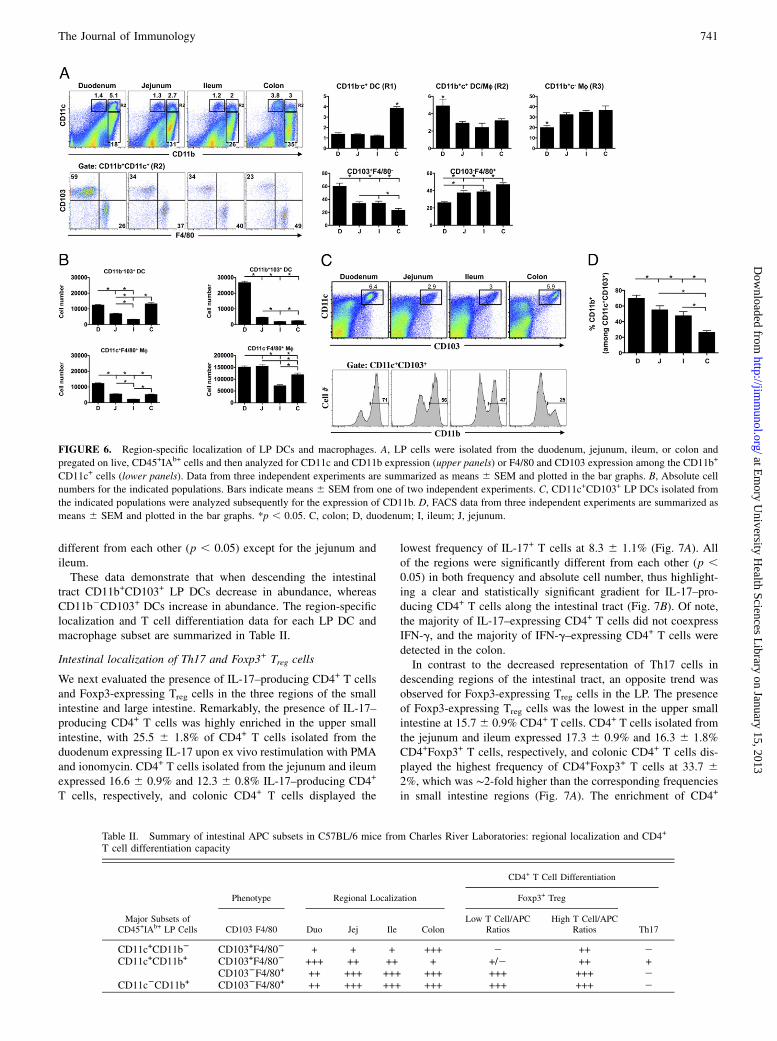
different from each other (p , 0.05) except for the jejunum andileum.These data demonstrate that when descending the intestinal
tract CD11b+CD103+ LP DCs decrease in abundance, whereasCD11b2CD103+ DCs increase in abundance. The region-specificlocalization and T cell differentiation data for each LP DC andmacrophage subset are summarized in Table II.
Intestinal localization of Th17 and Foxp3+ Treg cells
We next evaluated the presence of IL-17–producing CD4+ T cellsand Foxp3-expressing Treg cells in the three regions of the smallintestine and large intestine. Remarkably, the presence of IL-17–producing CD4+ T cells was highly enriched in the upper smallintestine, with 25.5 6 1.8% of CD4+ T cells isolated from theduodenum expressing IL-17 upon ex vivo restimulation with PMAand ionomycin. CD4+ T cells isolated from the jejunum and ileumexpressed 16.6 6 0.9% and 12.3 6 0.8% IL-17–producing CD4+
T cells, respectively, and colonic CD4+ T cells displayed the
lowest frequency of IL-17+ T cells at 8.3 6 1.1% (Fig. 7A). Allof the regions were significantly different from each other (p ,0.05) in both frequency and absolute cell number, thus highlight-ing a clear and statistically significant gradient for IL-17–pro-ducing CD4+ T cells along the intestinal tract (Fig. 7B). Of note,the majority of IL-17–expressing CD4+ T cells did not coexpressIFN-g, and the majority of IFN-g–expressing CD4+ T cells weredetected in the colon.In contrast to the decreased representation of Th17 cells in
descending regions of the intestinal tract, an opposite trend wasobserved for Foxp3-expressing Treg cells in the LP. The presenceof Foxp3-expressing Treg cells was the lowest in the upper smallintestine at 15.7 6 0.9% CD4+ T cells. CD4+ T cells isolated fromthe jejunum and ileum expressed 17.3 6 0.9% and 16.3 6 1.8%CD4+Foxp3+ T cells, respectively, and colonic CD4+ T cells dis-played the highest frequency of CD4+Foxp3+ T cells at 33.7 62%, which was ∼2-fold higher than the corresponding frequenciesin small intestine regions (Fig. 7A). The enrichment of CD4+
FIGURE 6. Region-specific localization of LP DCs and macrophages. A, LP cells were isolated from the duodenum, jejunum, ileum, or colon and
pregated on live, CD45+IAb+ cells and then analyzed for CD11c and CD11b expression (upper panels) or F4/80 and CD103 expression among the CD11b+
CD11c+ cells (lower panels). Data from three independent experiments are summarized as means 6 SEM and plotted in the bar graphs. B, Absolute cell
numbers for the indicated populations. Bars indicate means 6 SEM from one of two independent experiments. C, CD11c+CD103+ LP DCs isolated from
the indicated populations were analyzed subsequently for the expression of CD11b. D, FACS data from three independent experiments are summarized as
means 6 SEM and plotted in the bar graphs. *p , 0.05. C, colon; D, duodenum; I, ileum; J, jejunum.
Table II. Summary of intestinal APC subsets in C57BL/6 mice from Charles River Laboratories: regional localization and CD4+
T cell differentiation capacity
CD4+ T Cell Differentiation
Phenotype Regional Localization Foxp3+ Treg
Major Subsets ofCD45+IAb+ LP Cells CD103 F4/80 Duo Jej Ile Colon
Low T Cell/APCRatios
High T Cell/APCRatios Th17
CD11c+CD11b2 CD103+F4/802 + + + +++ 2 ++ 2CD11c+CD11b+ CD103+F4/802 +++ ++ ++ + +/2 ++ +
CD1032F4/80+ ++ +++ +++ +++ +++ +++ 2CD11c2CD11b+ CD1032F4/80+ ++ +++ +++ +++ +++ +++ 2
The Journal of Immunology 741
at Em
ory University H
ealth Sciences Library on January 15, 2013
http://jimm
unol.org/D
ownloaded from
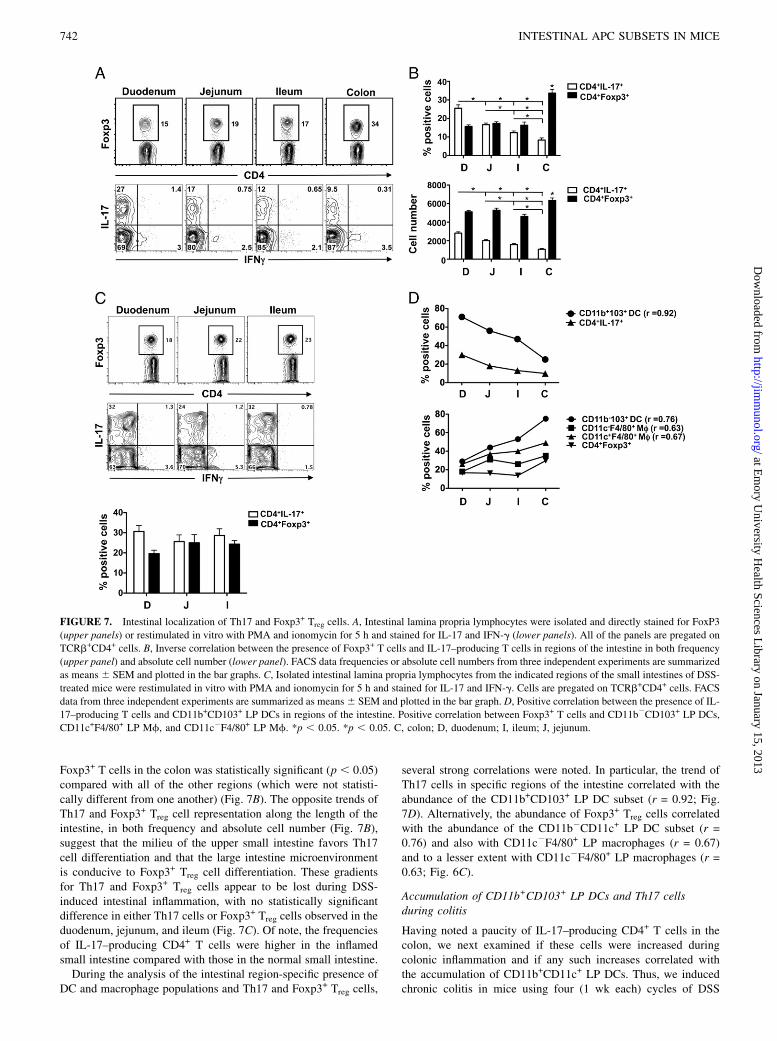
Foxp3+ T cells in the colon was statistically significant (p , 0.05)compared with all of the other regions (which were not statisti-cally different from one another) (Fig. 7B). The opposite trends ofTh17 and Foxp3+ Treg cell representation along the length of theintestine, in both frequency and absolute cell number (Fig. 7B),suggest that the milieu of the upper small intestine favors Th17cell differentiation and that the large intestine microenvironmentis conducive to Foxp3+ Treg cell differentiation. These gradientsfor Th17 and Foxp3+ Treg cells appear to be lost during DSS-induced intestinal inflammation, with no statistically significantdifference in either Th17 cells or Foxp3+ Treg cells observed in theduodenum, jejunum, and ileum (Fig. 7C). Of note, the frequenciesof IL-17–producing CD4+ T cells were higher in the inflamedsmall intestine compared with those in the normal small intestine.During the analysis of the intestinal region-specific presence of
DC and macrophage populations and Th17 and Foxp3+ Treg cells,
several strong correlations were noted. In particular, the trend ofTh17 cells in specific regions of the intestine correlated with theabundance of the CD11b+CD103+ LP DC subset (r = 0.92; Fig.7D). Alternatively, the abundance of Foxp3+ Treg cells correlatedwith the abundance of the CD11b2CD11c+ LP DC subset (r =0.76) and also with CD11c2F4/80+ LP macrophages (r = 0.67)and to a lesser extent with CD11c2F4/80+ LP macrophages (r =0.63; Fig. 6C).
Accumulation of CD11b+CD103+ LP DCs and Th17 cellsduring colitis
Having noted a paucity of IL-17–producing CD4+ T cells in thecolon, we next examined if these cells were increased duringcolonic inflammation and if any such increases correlated withthe accumulation of CD11b+CD11c+ LP DCs. Thus, we inducedchronic colitis in mice using four (1 wk each) cycles of DSS
FIGURE 7. Intestinal localization of Th17 and Foxp3+ Treg cells. A, Intestinal lamina propria lymphocytes were isolated and directly stained for FoxP3
(upper panels) or restimulated in vitro with PMA and ionomycin for 5 h and stained for IL-17 and IFN-g (lower panels). All of the panels are pregated on
TCRb+CD4+ cells. B, Inverse correlation between the presence of Foxp3+ T cells and IL-17–producing T cells in regions of the intestine in both frequency
(upper panel) and absolute cell number (lower panel). FACS data frequencies or absolute cell numbers from three independent experiments are summarized
as means6 SEM and plotted in the bar graphs. C, Isolated intestinal lamina propria lymphocytes from the indicated regions of the small intestines of DSS-
treated mice were restimulated in vitro with PMA and ionomycin for 5 h and stained for IL-17 and IFN-g. Cells are pregated on TCRb+CD4+ cells. FACS
data from three independent experiments are summarized as means6 SEM and plotted in the bar graph. D, Positive correlation between the presence of IL-
17–producing T cells and CD11b+CD103+ LP DCs in regions of the intestine. Positive correlation between Foxp3+ T cells and CD11b2CD103+ LP DCs,
CD11c+F4/80+ LP Mf, and CD11c2F4/80+ LP Mf. *p , 0.05. *p , 0.05. C, colon; D, duodenum; I, ileum; J, jejunum.
742 INTESTINAL APC SUBSETS IN MICE
at Em
ory University H
ealth Sciences Library on January 15, 2013
http://jimm
unol.org/D
ownloaded from
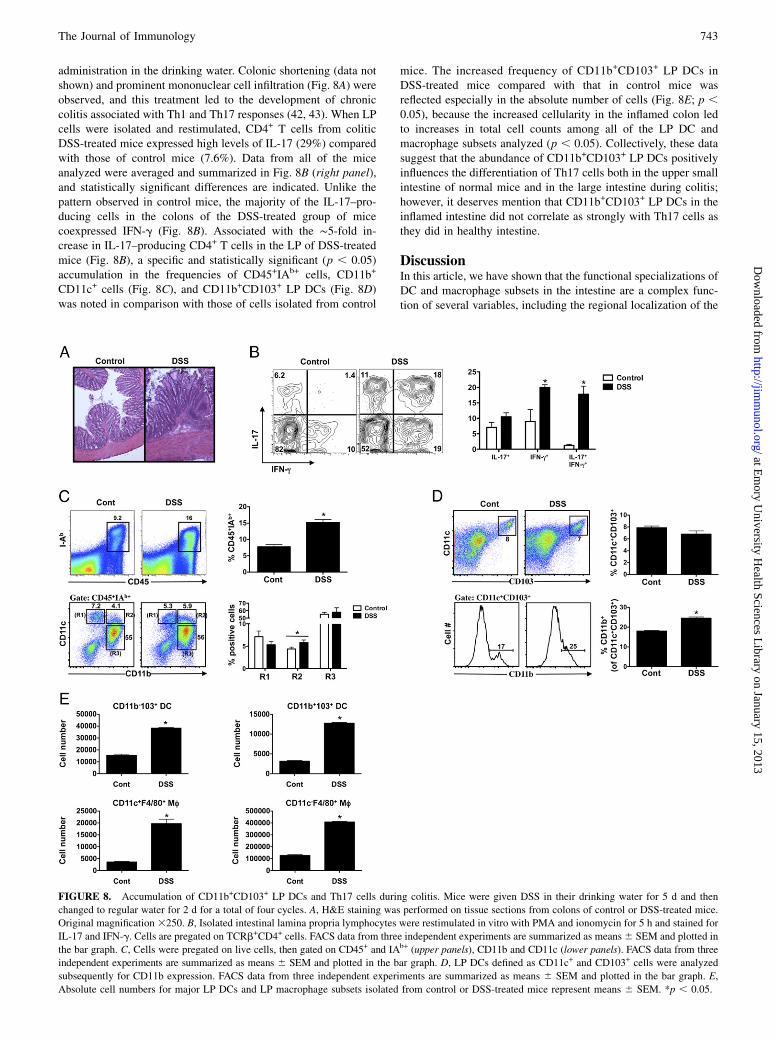
administration in the drinking water. Colonic shortening (data notshown) and prominent mononuclear cell infiltration (Fig. 8A) wereobserved, and this treatment led to the development of chroniccolitis associated with Th1 and Th17 responses (42, 43). When LPcells were isolated and restimulated, CD4+ T cells from coliticDSS-treated mice expressed high levels of IL-17 (29%) comparedwith those of control mice (7.6%). Data from all of the miceanalyzed were averaged and summarized in Fig. 8B (right panel),and statistically significant differences are indicated. Unlike thepattern observed in control mice, the majority of the IL-17–pro-ducing cells in the colons of the DSS-treated group of micecoexpressed IFN-g (Fig. 8B). Associated with the ∼5-fold in-crease in IL-17–producing CD4+ T cells in the LP of DSS-treatedmice (Fig. 8B), a specific and statistically significant (p , 0.05)accumulation in the frequencies of CD45+IAb+ cells, CD11b+
CD11c+ cells (Fig. 8C), and CD11b+CD103+ LP DCs (Fig. 8D)was noted in comparison with those of cells isolated from control
mice. The increased frequency of CD11b+CD103+ LP DCs inDSS-treated mice compared with that in control mice wasreflected especially in the absolute number of cells (Fig. 8E; p ,0.05), because the increased cellularity in the inflamed colon ledto increases in total cell counts among all of the LP DC andmacrophage subsets analyzed (p , 0.05). Collectively, these datasuggest that the abundance of CD11b+CD103+ LP DCs positivelyinfluences the differentiation of Th17 cells both in the upper smallintestine of normal mice and in the large intestine during colitis;however, it deserves mention that CD11b+CD103+ LP DCs in theinflamed intestine did not correlate as strongly with Th17 cells asthey did in healthy intestine.
DiscussionIn this article, we have shown that the functional specializations ofDC and macrophage subsets in the intestine are a complex func-tion of several variables, including the regional localization of the
FIGURE 8. Accumulation of CD11b+CD103+ LP DCs and Th17 cells during colitis. Mice were given DSS in their drinking water for 5 d and then
changed to regular water for 2 d for a total of four cycles. A, H&E staining was performed on tissue sections from colons of control or DSS-treated mice.
Original magnification 3250. B, Isolated intestinal lamina propria lymphocytes were restimulated in vitro with PMA and ionomycin for 5 h and stained for
IL-17 and IFN-g. Cells are pregated on TCRb+CD4+ cells. FACS data from three independent experiments are summarized as means6 SEM and plotted in
the bar graph. C, Cells were pregated on live cells, then gated on CD45+ and IAb+ (upper panels), CD11b and CD11c (lower panels). FACS data from three
independent experiments are summarized as means 6 SEM and plotted in the bar graph. D, LP DCs defined as CD11c+ and CD103+ cells were analyzed
subsequently for CD11b expression. FACS data from three independent experiments are summarized as means 6 SEM and plotted in the bar graph. E,
Absolute cell numbers for major LP DCs and LP macrophage subsets isolated from control or DSS-treated mice represent means 6 SEM. *p , 0.05.
The Journal of Immunology 743
at Em
ory University H
ealth Sciences Library on January 15, 2013
http://jimm
unol.org/D
ownloaded from
subsets, the T cell/APC ratio, and source of the mouse strains. Inorder to systematically characterize the DC and macrophagesubsets in the small and large intestine LP, we established a 10-color FACS panel to phenotypically identify five major subsetsof APCs: CD11c+CD11b2CD103+F4/802 and CD11c+CD11b+
CD103+F4/802 LP DCs, CD11c+CD11b+CD1032F4/80+ andCD11c2CD11b+CD1032F4/80+ LP macrophages, and CD11c2
CD11b2 cells (that may include B cells and other non-DC, non-macrophage APCs) as well as several rare subsets includingCD11c+CD11b+CD1032F4/802, CD11c+CD11b2CD1032F4/802,and CD11c2CD11b+CD1032F4/802 APCs.Intestinal F4/80+ macrophage subsets, regardless of CD11c
expression, were the major IL-10 producers in the LP and pro-moted the differentiation of inducible Foxp3+ Treg cells but notTh17 cells. Furthermore, all of the DC subsets could promoteFoxp3+ Treg cells, albeit less efficiently than the macrophages, andparticularly at higher T cell/APC ratios. The CD11b+CD103+ LPDCs from C57BL/6 mice from Charles River Laboratories effi-ciently induced the differentiation of Th17 cells. However, suchDCs from C57BL/6 mice from The Jackson Laboratory were notefficient inducers of Th17 cells, and in fact all of the DC subsetsfrom this strain were much more potent inducers of Foxp3+ Treg
cells.The CD103+ LP DC subsets displayed striking region-specific
localization along the intestine, with the presence of CD11b+
CD103+ LP DCs strongly correlating with the abundance of Th17cells in the healthy, upper small intestine and the inflamed largeintestine. Our results emphasize the complexities of the intestinalLP DC and macrophage network in terms of phenotypic charac-terization, regional localization, and unique functional propertiesand suggest that these cells may be targets for modulating Treg andTh17 cell responses in the intestine during health and disease.Recently, several studies have analyzed LP DCs and macro-
phages based on the expression of cell surface Ags that are wellappreciated to demarcate each cell population in other tissues (17,18, 21, 22, 45–47). We and others have relied upon CD11c as thebona fide marker of DCs and CD11b expression (in the absence ofCD11c) as a useful, although not specific, marker for LP macro-phages. In this article, it is demonstrated that CD11b and CD11ceach have limitations for identifying CD45+IAb+ LP DCs andmacrophages when used in the absence of CD103 and F4/80costaining. It has been argued that DCs and macrophages (ofthe LP and elsewhere) are not different cell types or lineages butrather a continuum of cells of the mononuclear phagocyte system(48). Although our data do not specifically address this issue, weoperationally define LP DCs as cells that are CD45+IAb+CD11c+
CD103+CD11b+F4/802 or CD45+IAb+CD11c+CD11b2F4/802
CD103+, protrude many dendrites, possess few phagocytic vacu-oles, and induce robust CD4+ T cell proliferation in vitro. In con-trast, we operationally define LP macrophages as cells that areCD45+IAb+CD11c2CD1032F4/80+ or CD45+IAb+CD11c+CD1032
F4/80+, protrude few dendrites, possess many phagocytic vacu-oles, and induce CFSE dilution of responding CD4+ T cell pro-liferation in vitro that is equivalent to that induced by LP DCs,albeit with less T cell clustering and overall expansion. Impor-tantly, several recent reports demonstrated that CX3CR1+ andCD103+ LP DCs are of distinct origins and perform separate roles,with the CD103+ subset performing classical DC functions (49–51).The functional capacity of LP DCs and macrophages in mod-
ulating CD4+ T cell differentiation has gained significant atten-tion recently. Several groups reported that LP (22, 25, 52) ormesenteric lymph node (MLN) (21, 23, 53, 54) DCs express RA-generating enzymes and can induce gut-homing molecules and the
in vitro differentiation of Foxp3+ Treg cells via RA. Furthermore,we demonstrated a potent role for LP macrophages at inducingFoxp3+ Treg cells via the RA pathway (16). In this article, wereveal several previously unappreciated complexities in de-termining the functions of intestinal APC subsets. Our data clearlyshow that the ability of intestinal DC and macrophage subsets toinduce Foxp3+ Treg versus Th17 cells is dependent on severalfactors, including: 1) the ratio of T cells to APCs, 2) the regionallocalization of in the intestine, and 3) the source of the mousestrain. With regard to the latter, our results indicate that DCsubsets from C57BL/6 mice from The Jackson Laboratory aremuch more efficient at inducing Foxp3+ Treg cells and less effi-cient at inducing Th17 cells than those from the same strain fromCharles River Laboratories. This is consistent with recent workfrom our laboratory in which we had observed robust induction ofFoxp3+ Treg cells and weak induction of Th17 cells by intestinalDCs obtained from The Jackson Laboratory mice (24). Recently,it has been established that specific bacterial species, especiallySFB, may preferentially drive Th17 cell differentiation in the in-testinal LP (39, 40, 55) and that SFB are absent in The JacksonLaboratory mice. Therefore, the relative absence of Th17 cells inthe LP of The Jackson Laboratory mice may be due to the lack ofCD11b+CD103+ LP DC stimulation by SFB or other Th17 cell-inducing factors. Thus, the differences observed between LP DCsubsets in Charles River Laboratories mice might be less strikingin The Jackson Laboratory mice and potentially other strains ofmice lacking Th17 cell-inducing bacteria/factors.With regard to the T cell/APC ratio, when LP DCs were reduced
in number relative to CD4+ T cells, such conditions permitted thedifferentiation of Foxp3+ Treg cells, although not as efficiently asCD11c+ and CD11c2F4/80+ LP macrophages that induced Foxp3+
Treg cells at all of the ratios tested. The exact factor(s) that accountfor this ratio-dependent induction of Foxp3+ Treg cells by LP DCsare not clear, but these data suggest that at ratios near 1:1 thereare DC-expressed cell surface molecules and/or cytokines thatare capable of preventing Foxp3 induction in responding CD4+
T cells. IL-6 is one candidate cytokine secreted by CD11b+
CD103+ LP DCs that may inhibit Foxp3 induction (56) at higherconcentrations and lose such an effect as it is diluted away withincreasing T cell/DC ratios. However, we did not observe robustIL-6 mRNA expression by CD11b+CD103+ LP DCs, suggestingthat other factors may play a role in this process as well. Anotherimportant difference between our culture conditions and thosereported previously (25) is that those studies supplemented cul-tures with exogenous IL-2, which is a known inducer of Foxp3+
Treg cells (57) and an inhibitor of Th17 cell differentiation (58). Itremains to be determined how well each of these in vitro cultureconditions mimics actual T cell/DC ratios and local concentrationsof TGF-b and IL-2 in the intestinal milieu. Additionally, althoughall of the LP DC and macrophage subsets can promote Foxp3+
Treg cell differentiation under certain conditions in vitro, whichof these populations/subsets are capable of inducing Foxp3+ Treg
cells in the LP in vivo remains unresolved. Beyond de novo in-duction of Foxp3 in responding T cells by LP APC subsets, it hasbeen demonstrated recently that IL-10–producing myeloid cells inthe intestinal LP are crucial for maintaining Foxp3 expression andsuppressor function in Treg cells in the CD45RBhi model of colitis(59). Therefore, LP DCs and macrophages may play a dual role inthe induction and maintenance of Foxp3 in CD4+ T cells.We have demonstrated in this article that CD11b+CD103+ LP
DCs from C57BL/6 mice from Charles River Laboratories ex-pressed il6 and tgfb1 as well as RA-generating enzymes and ef-ficiently induced the differentiation of Th17 cells in vitro. Thesedata are consistent with our original report (16) that CD11b+
744 INTESTINAL APC SUBSETS IN MICE
at Em
ory University H
ealth Sciences Library on January 15, 2013
http://jimm
unol.org/D
ownloaded from
CD11c+ LP DCs preferentially induced Th17 cells and furtherdefine the specific role for the CD103+ LP DC subsets in thisprocess. Without methods to specifically deplete CD11b+CD103+
LP DCs, however, the ability of this DC subset to induce Th17cell responses in vivo remains to be demonstrated formally. Addi-tional signals that condition CD11b+CD103+ LP DCs to efficientlygenerate Th17 cells are beginning to be defined and may involvesensing of bacterial components such as flagellin via TLR5.Uematsu et al. (17) recently reported that CD11b+CD11c+ LP DCsexpressed TLR5 and induced Th17 and Th1 cells when stimulatedwith flagellin. Interestingly, we did not detect robust levels of tlr5mRNA in CD11b+CD103+ LP DCs, and our analysis of TLR5-deficient mice revealed no detectable differences in Th17 cells inthe intestinal LP (data not shown). Additionally, it is appreciatednow that constitutive Th17 cell development in the LP (60) isindependent of the MyD88 and Trif pathways yet highly de-pendent on the bacterial microbiota (46). Thus, it is possible thatTLR5 detection of bacterial flagellin by CD11b+CD103+ LP DCsmay play a role in exacerbating Th17 cell responses during in-testinal inflammation but not in the homeostasis of natural Th17cells resident in the normal intestine.Although in vitro modeling of intestinal LP DC and macro-
phage functions is important, we also complimented our in vitroobservations with characterization of the regional distribution ofthese cells and Th17 and Foxp3+ Treg cells ex vivo. Although theentire small and large intestines drain to the MLNs, region-specific differences were noted in DCs, macrophages, and CD4+
T cells in the LP. In particular, CD11b+CD103+ LP DCs followeda gradient where they were enriched in the duodenum and rare inthe large intestine, a pattern that mimicked that of Th17 cells.Alternatively, CD11b2CD103+ LP DCs as well as CD11c+ andCD11c2F4/80+ LP macrophages followed an opposite gradientand were enriched in the large intestine where Foxp3+ Treg cellswere abundant. These data suggest that unique factors in the uppersmall intestine favor the differentiation and/or retention of Th17-inducing LP DCs, whereas the large intestinal milieu preferen-tially supports the differentiation and/or retention of Foxp3+ Treg
cell-inducing LP DCs and macrophages. Because Th17 cells maymediate antibacterial activities, it is possible that these cells areenriched in the relatively low bacterial load of the upper smallintestine to quickly screen for potentially pathogenic bacteria thatemigrate from the stomach. The vast number of commensal bac-teria in the large intestine may induce an immunoregulatory de-velopmental program that conditions DCs and/or macrophages togenerate Foxp3+ Treg cells that restrain immunoreactivity towardthe microbiota. Another potential explanation for the region-specific differences observed is that some “LP” DCs and/ormacrophages may reside in gut-associated lymphoid tissue suchas isolated lymphoid follicles. These structures are more abundantin the descending gastrointestinal tract (61) and could explain theabundance of CD11b2 LP DCs found in these regions. Alterna-tively, some of these “LP” DCs and/or macrophages may residewithin submucosal regions (49).The important issue of where steady-state LP T cells differentiate
in vivo remains incompletely understood. If differentiation were totake place primarily in the MLN as a result of LP DCs draining,then one would expect to find increased frequencies of Th17 cellsand Foxp3+ Treg cells in this locale, which is not observed (datanot shown). Thus, an alternative possibility is that, in the steadystate, Th17 and Foxp3+ Treg cell differentiation does not efficientlytake place in the MLN but rather in the LP of the intestine aftermigration of naive T cells to this site (62). Another possibility isthat T cells may initiate differentiation in the MLN and upregulatehoming receptors that will enhance migration to specific regions
of the intestine. In support of this, CCR6 has been demonstrated tobe an important homing receptor involved in the recruitment and/or retention of Th17 cells during inflammation (63) and in PPs(64) in normal mice. CCR6 does not appear to significantly affectthe presence of Th17 cells in the normal small intestine LP,however, so the enrichment of Th17 cells that we have observed inthe upper small intestine is not easily explainable by differentialhoming due to CCR6. It is possible that in the steady state Th17and Foxp3+ Treg cells differentiate in the LP under the influence ofregion-specific DC and macrophage subsets presenting Ag andthat during intestinal inflammation Th17 and Foxp3+ Treg cells andother effector T cells undergo more complete differentiation in theMLN due to increased LP DC trafficking to the MLN (65–68).When we induced chronic colitis in mice, an interesting change
in the composition of large intestine LP DCs and Th17 cells wasnoted. Not only did Th17 cells significantly increase in the diseasedtissue but CD11b+CD103+ LP DCs also did so. Thus, altered fre-quencies and functions of large intestine LP DCs during colitismay contribute to inflammation (69). Additionally, DSS-inducedcolitis altered the normal decreasing gradient of Th17 cells alongthe length of the small intestine and promoted high levels of Th17cells in the duodenum, jejunum, and ileum. Thus, increases inTh17 cells and/or CD11b+CD103+ LP DCs and loss of the typicalgradient of these cells may be involved in intestinal inflammation.These data are intriguing in light of the recent description of in-creased IL-17 levels in the colonic mucosa of patients withCrohn’s disease and ulcerative colitis and in mouse models ofcolitis (70). Whether IL-17 plays a protective (71, 72) or patho-genic (73) role in intestinal inflammation remains a complex issue,because it is secreted by several cell types and exhibits antimi-crobial activity (74). IL-23 is a key cytokine of the IL-12 familythat can be secreted by DCs (75) and induce IL-17 secretion byresponding CD4+ T lymphocytes. IL-23 is now documented asplaying a critical role in the pathogenesis of several autoimmunediseases (76), and il23r has been shown recently to be an in-flammatory bowel disease gene in adult (77) and pediatric (78)Crohn’s disease patients. Thus, LP DCs also may be a source ofIL-23 that drives Th17 cells during intestinal inflammation.In addition to the increased frequency and cell number of
CD11b+CD103+ LP DCs in the inflamed colon, the other APCsubsets also were increased numerically due to increased cellu-larity in inflamed tissue. Thus, it cannot be excluded that cellsother than CD11b+CD103+ LP DCs contribute to Th17 cell dif-ferentiation during intestinal inflammation. Additionally, intestinalmacrophages are well appreciated to contribute to the pathogen-esis of intestinal inflammation (37, 79, 80). Therefore, althoughintestinal macrophages appear to play an anti-inflammatory role inthe steady state, they can mediate proinflammatory functionsduring colitis. Whether such diverse functions are performed bydifferent subsets of macrophages or rather the plasticity of in-dividual cells is unclear; however, recent data suggest that aunique subset of TLR2+CCR2+CX3CR1int Ly-6ChiGr-1+ macro-phages secretes TNF-a and promotes intestinal inflammation(81). Another recent report suggested that E-cadherin+ DCs areinflammatory APCs that may contribute to the pathogenesis ofT cell-mediated colitis (82). Future studies should help to clarifywhether these inflammatory E-cadherin+ cells are DCs or mac-rophages.Overall, our data demonstrate that LP DCs and macrophages
play fundamentally important, yet distinct, roles in directing CD4+
T cell differentiation. Importantly, we show that the functionalspecializations of DC and macrophage subsets are dependent onthe T cell/APC ratio, their regional localization, and source of themouse strain from which they were isolated. Further clarifying the
The Journal of Immunology 745
at Em
ory University H
ealth Sciences Library on January 15, 2013
http://jimm
unol.org/D
ownloaded from
developmental and functional aspects of these and other LP DCand macrophage subsets along the length of the gastrointestinaltract during health and disease will likely contribute to a betterunderstanding of mucosal immune regulation, which may directefforts aimed at improving mucosal vaccination regimens andtherapeutic intervention for Crohn’s disease and ulcerative colitis.
AcknowledgmentsWe thank YouliangWang, Sommer Dunham, and Aaron Rae for cell sorting,
Brent Greene for H&E staining, and Ifor Williams for helpful discussions.
DisclosuresThe authors have no financial conflicts of interest.
References1. Banchereau, J., and R. M. Steinman. 1998. Dendritic cells and the control of
immunity. Nature 392: 245–252.2. Iwasaki, A., and R. Medzhitov. 2004. Toll-like receptor control of the adaptive
immune responses. Nat. Immunol. 5: 987–995.3. Kanneganti, T. D., M. Lamkanfi, and G. Nunez. 2007. Intracellular NOD-like
receptors in host defense and disease. Immunity 27: 549–559.4. Geijtenbeek, T. B., and S. I. Gringhuis. 2009. Signalling through C-type lectin
receptors: shaping immune responses. Nat. Rev. Immunol. 9: 465–479.5. Pulendran, B., K. Palucka, and J. Banchereau. 2001. Sensing pathogens and
tuning immune responses. Science 293: 253–256.6. Pulendran, B., H. Tang, and S. Manicassamy. 2010. Programming dendritic cells
to induce T(H)2 and tolerogenic responses. Nat. Immunol. 11: 647–655.7. Maldonado-Lopez, R., T. De Smedt, P. Michel, J. Godfroid, B. Pajak,
C. Heirman, K. Thielemans, O. Leo, J. Urbain, and M. Moser. 1999. CD8alpha+and CD8alpha- subclasses of dendritic cells direct the development of distinct Thelper cells in vivo. J. Exp. Med. 189: 587–592.
8. Pulendran, B., J. L. Smith, G. Caspary, K. Brasel, D. Pettit, E. Maraskovsky,and C. R. Maliszewski. 1999. Distinct dendritic cell subsets differentiallyregulate the class of immune response in vivo. Proc. Natl. Acad. Sci. USA 96:1036–1041.
9. Macpherson, A. J., and N. L. Harris. 2004. Interactions between commensalintestinal bacteria and the immune system. Nat. Rev. Immunol. 4: 478–485.
10. Junt, T., E. Scandella, and B. Ludewig. 2008. Form follows function: lymphoidtissue microarchitecture in antimicrobial immune defence. Nat. Rev. Immunol. 8:764–775.
11. Johansson, C., and B. L. Kelsall. 2005. Phenotype and function of intestinaldendritic cells. Semin. Immunol. 17: 284–294.
12. Sato, A., M. Hashiguchi, E. Toda, A. Iwasaki, S. Hachimura, andS. Kaminogawa. 2003. CD11b+ Peyer’s patch dendritic cells secrete IL-6 andinduce IgA secretion from naive B cells. J. Immunol. 171: 3684–3690.
13. Iwasaki, A., and B. L. Kelsall. 2001. Unique functions of CD11b+, CD8 alpha+,and double-negative Peyer’s patch dendritic cells. J. Immunol. 166: 4884–4890.
14. Rescigno, M., M. Urbano, B. Valzasina, M. Francolini, G. Rotta, R. Bonasio,F. Granucci, J. P. Kraehenbuhl, and P. Ricciardi-Castagnoli. 2001. Dendritic cellsexpress tight junction proteins and penetrate gut epithelial monolayers to samplebacteria. Nat. Immunol. 2: 361–367.
15. Niess, J. H., S. Brand, X. Gu, L. Landsman, S. Jung, B. A. McCormick,J. M. Vyas, M. Boes, H. L. Ploegh, J. G. Fox, et al. 2005. CX3CR1-mediateddendritic cell access to the intestinal lumen and bacterial clearance. Science 307:254–258.
16. Denning, T. L., Y. C. Wang, S. R. Patel, I. R. Williams, and B. Pulendran. 2007.Lamina propria macrophages and dendritic cells differentially induce regulatoryand interleukin 17-producing T cell responses. Nat. Immunol. 8: 1086–1094.
17. Uematsu, S., K. Fujimoto, M. H. Jang, B. G. Yang, Y. J. Jung, M. Nishiyama,S. Sato, T. Tsujimura, M. Yamamoto, Y. Yokota, et al. 2008. Regulation ofhumoral and cellular gut immunity by lamina propria dendritic cells expressingToll-like receptor 5. Nat. Immunol. 9: 769–776.
18. Johansson-Lindbom, B., M. Svensson, O. Pabst, C. Palmqvist, G. Marquez,R. Forster, and W. W. Agace. 2005. Functional specialization of gut CD103+dendritic cells in the regulation of tissue-selective T cell homing. J. Exp. Med.202: 1063–1073.
19. Mora, J. R., M. R. Bono, N. Manjunath, W. Weninger, L. L. Cavanagh,M. Rosemblatt, and U. H. Von Andrian. 2003. Selective imprinting of gut-homing T cells by Peyer’s patch dendritic cells. Nature 424: 88–93.
20. Mora, J. R., M. Iwata, B. Eksteen, S. Y. Song, T. Junt, B. Senman, K. L. Otipoby,A. Yokota, H. Takeuchi, P. Ricciardi-Castagnoli, et al. 2006. Generation of gut-homing IgA-secreting B cells by intestinal dendritic cells. Science 314: 1157–1160.
21. Coombes, J. L., K. R. Siddiqui, C. V. Arancibia-Carcamo, J. Hall, C. M. Sun,Y. Belkaid, and F. Powrie. 2007. A functionally specialized population of mu-cosal CD103+ DCs induces Foxp3+ regulatory T cells via a TGF-beta and ret-inoic acid-dependent mechanism. J. Exp. Med. 204: 1757–1764.
22. Sun, C. M., J. A. Hall, R. B. Blank, N. Bouladoux, M. Oukka, J. R. Mora, andY. Belkaid. 2007. Small intestine lamina propria dendritic cells promote de novogeneration of Foxp3 T reg cells via retinoic acid. J. Exp. Med. 204: 1775–1785.
23. Mucida, D., Y. Park, G. Kim, O. Turovskaya, I. Scott, M. Kronenberg, andH. Cheroutre. 2007. Reciprocal TH17 and regulatory T cell differentiation me-diated by retinoic acid. Science 317: 256–260.
24. Manicassamy, S., B. Reizis, R. Ravindran, H. Nakaya, R. M. Salazar-Gonzalez,Y. C. Wang, and B. Pulendran. 2010. Activation of beta-catenin in dendritic cellsregulates immunity versus tolerance in the intestine. Science 329: 849–853.
25. Hall, J. A., N. Bouladoux, C. M. Sun, E. A. Wohlfert, R. B. Blank, Q. Zhu,M. E. Grigg, J. A. Berzofsky, and Y. Belkaid. 2008. Commensal DNA limitsregulatory T cell conversion and is a natural adjuvant of intestinal immuneresponses. Immunity 29: 637–649.
26. Bilsborough, J., T. C. George, A. Norment, and J. L. Viney. 2003. MucosalCD8alpha+ DC, with a plasmacytoid phenotype, induce differentiation andsupport function of T cells with regulatory properties. Immunology 108: 481–492.
27. Kamada, N., T. Hisamatsu, S. Okamoto, T. Sato, K. Matsuoka, K. Arai, T. Nakai,A. Hasegawa, N. Inoue, N. Watanabe, et al. 2005. Abnormally differentiatedsubsets of intestinal macrophage play a key role in Th1-dominant chronic colitisthrough excess production of IL-12 and IL-23 in response to bacteria. J.Immunol. 175: 6900–6908.
28. Smythies, L. E., M. Sellers, R. H. Clements, M. Mosteller-Barnum, G. Meng,W. H. Benjamin, J. M. Orenstein, and P. D. Smith. 2005. Human intestinalmacrophages display profound inflammatory anergy despite avid phagocytic andbacteriocidal activity. J. Clin. Invest. 115: 66–75.
29. Smith, P. D., C. Ochsenbauer-Jambor, and L. E. Smythies. 2005. Intestinalmacrophages: unique effector cells of the innate immune system. Immunol. Rev.206: 149–159.
30. Hirotani, T., P. Y. Lee, H. Kuwata, M. Yamamoto, M. Matsumoto, I. Kawase,S. Akira, and K. Takeda. 2005. The nuclear IkappaB protein IkappaBNS se-lectively inhibits lipopolysaccharide-induced IL-6 production in macrophages ofthe colonic lamina propria. J. Immunol. 174: 3650–3657.
31. Smith, P. D., L. E. Smythies, M. Mosteller-Barnum, D. A. Sibley, M. W. Russell,M. Merger, M. T. Sellers, J. M. Orenstein, T. Shimada, M. F. Graham, andH. Kubagawa. 2001. Intestinal macrophages lack CD14 and CD89 and conse-quently are down-regulated for LPS- and IgA-mediated activities. J. Immunol.167: 2651–2656.
32. Kelsall, B. 2008. Recent progress in understanding the phenotype and functionof intestinal dendritic cells and macrophages. Mucosal Immunol. 1: 460–469.
33. Pavli, P., C. E. Woodhams, W. F. Doe, and D. A. Hume. 1990. Isolation andcharacterization of antigen-presenting dendritic cells from the mouse intestinallamina propria. Immunology 70: 40–47.
34. Pull, S. L., J. M. Doherty, J. C. Mills, J. I. Gordon, and T. S. Stappenbeck. 2005.Activated macrophages are an adaptive element of the colonic epithelial pro-genitor niche necessary for regenerative responses to injury. Proc. Natl. Acad.Sci. USA 102: 99–104.
35. Qualls, J. E., A. M. Kaplan, N. van Rooijen, and D. A. Cohen. 2006. Suppressionof experimental colitis by intestinal mononuclear phagocytes. J. Leukoc. Biol.80: 802–815.
36. Platt, A. M., and A. M. Mowat. 2008. Mucosal macrophages and the regulationof immune responses in the intestine. Immunol. Lett. 119: 22–31.
37. Schenk, M., A. Bouchon, F. Seibold, and C. Mueller. 2007. TREM-1–expressingintestinal macrophages crucially amplify chronic inflammation in experimentalcolitis and inflammatory bowel diseases. J. Clin. Invest. 117: 3097–3106.
38. Kamada, N., T. Hisamatsu, S. Okamoto, H. Chinen, T. Kobayashi, T. Sato,A. Sakuraba, M. T. Kitazume, A. Sugita, K. Koganei, et al. 2008. Unique CD14intestinal macrophages contribute to the pathogenesis of Crohn disease via IL-23/IFN-gamma axis. J. Clin. Invest. 118: 2269–2280.
39. Ivanov, I. I., Rde. L. Frutos, N. Manel, K. Yoshinaga, D. B. Rifkin, R. B. Sartor,B. B. Finlay, and D. R. Littman. 2008. Specific microbiota direct the differen-tiation of IL-17-producing T-helper cells in the mucosa of the small intestine.Cell Host Microbe 4: 337–349.
40. Ivanov, I. I., K. Atarashi, N. Manel, E. L. Brodie, T. Shima, U. Karaoz, D. Wei,K. C. Goldfarb, C. A. Santee, S. V. Lynch, et al. 2009. Induction of intestinalTh17 cells by segmented filamentous bacteria. Cell 139: 485–498.
41. Madan, R., F. Demircik, S. Surianarayanan, J. L. Allen, S. Divanovic,A. Trompette, N. Yogev, Y. Gu, M. Khodoun, D. Hildeman, et al. 2009. Non-redundant roles for B cell-derived IL-10 in immune counter-regulation. J.Immunol. 183: 2312–2320.
42. Yoshihara, K., T. Yajima, C. Kubo, and Y. Yoshikai. 2006. Role of interleukin 15in colitis induced by dextran sulphate sodium in mice. Gut 55: 334–341.
43. Takedatsu, H., K. S. Michelsen, B. Wei, C. J. Landers, L. S. Thomas, D. Dhall,J. Braun, and S. R. Targan. 2008. TL1A (TNFSF15) regulates the developmentof chronic colitis by modulating both T-helper 1 and T-helper 17 activation.Gastroenterology 135: 552–567.
44. Takada, Y., T. Hisamatsu, N. Kamada, M. T. Kitazume, H. Honda, Y. Oshima,R. Saito, T. Takayama, T. Kobayashi, H. Chinen, et al. 2010. Monocyte che-moattractant protein-1 contributes to gut homeostasis and intestinal in-flammation by composition of IL-10-producing regulatory macrophage subset. J.Immunol. 184: 2671–2676.
45. Monteleone, I., A. M. Platt, E. Jaensson, W. W. Agace, and A. M. Mowat. 2008.IL-10-dependent partial refractoriness to Toll-like receptor stimulation modu-lates gut mucosal dendritic cell function. Eur. J. Immunol. 38: 1533–1547.
46. Atarashi, K., J. Nishimura, T. Shima, Y. Umesaki, M. Yamamoto, M. Onoue,H. Yagita, N. Ishii, R. Evans, K. Honda, and K. Takeda. 2008. ATP drives laminapropria T(H)17 cell differentiation. Nature 455: 808–812.
47. Takenaka, S., E. Safroneeva, Z. Xing, and J. Gauldie. 2007. Dendritic cellsderived from murine colonic mucosa have unique functional and phenotypiccharacteristics. J. Immunol. 178: 7984–7993.
746 INTESTINAL APC SUBSETS IN MICE
at Em
ory University H
ealth Sciences Library on January 15, 2013
http://jimm
unol.org/D
ownloaded from
48. Hume, D. A. 2008. Macrophages as APC and the dendritic cell myth. J.Immunol. 181: 5829–5835.
49. Bogunovic, M., F. Ginhoux, J. Helft, L. Shang, D. Hashimoto, M. Greter, K. Liu,C. Jakubzick, M. A. Ingersoll, M. Leboeuf, et al. 2009. Origin of the laminapropria dendritic cell network. Immunity 31: 513–525.
50. Varol, C., A. Vallon-Eberhard, E. Elinav, T. Aychek, Y. Shapira, H. Luche,H. J. Fehling, W. D. Hardt, G. Shakhar, and S. Jung. 2009. Intestinal laminapropria dendritic cell subsets have different origin and functions. Immunity 31:502–512.
51. Schulz, O., E. Jaensson, E. K. Persson, X. Liu, T. Worbs, W. W. Agace, andO. Pabst. 2009. Intestinal CD103+, but not CX3CR1+, antigen sampling cellsmigrate in lymph and serve classical dendritic cell functions. J. Exp. Med. 206:3101–3114.
52. Jaensson, E., H. Uronen-Hansson, O. Pabst, B. Eksteen, J. Tian, J. L. Coombes,P. L. Berg, T. Davidsson, F. Powrie, B. Johansson-Lindbom, and W. W. Agace.2008. Small intestinal CD103+ dendritic cells display unique functional prop-erties that are conserved between mice and humans. J. Exp. Med. 205: 2139–2149.
53. Iwata, M., A. Hirakiyama, Y. Eshima, H. Kagechika, C. Kato, and S. Y. Song.2004. Retinoic acid imprints gut-homing specificity on T cells. Immunity 21:527–538.
54. Yamazaki, S., A. J. Bonito, R. Spisek, M. Dhodapkar, K. Inaba, andR. M. Steinman. 2007. Dendritic cells are specialized accessory cells along withTGF- for the differentiation of Foxp3+ CD4+ regulatory T cells from peripheralFoxp3 precursors. Blood 110: 4293–4302.
55. Gaboriau-Routhiau, V., S. Rakotobe, E. Lecuyer, I. Mulder, A. Lan,C. Bridonneau, V. Rochet, A. Pisi, M. De Paepe, G. Brandi, et al. 2009. The keyrole of segmented filamentous bacteria in the coordinated maturation of guthelper T cell responses. Immunity 31: 677–689.
56. Bettelli, E., Y. Carrier, W. Gao, T. Korn, T. B. Strom, M. Oukka, H. L. Weiner,and V. K. Kuchroo. 2006. Reciprocal developmental pathways for the generationof pathogenic effector TH17 and regulatory T cells. Nature 441: 235–238.
57. Shevach, E. M., R. A. DiPaolo, J. Andersson, D. M. Zhao, G. L. Stephens, andA. M. Thornton. 2006. The lifestyle of naturally occurring CD4+ CD25+ Foxp3+regulatory T cells. Immunol. Rev. 212: 60–73.
58. Laurence, A., C. M. Tato, T. S. Davidson, Y. Kanno, Z. Chen, Z. Yao, R. B. Blank,F. Meylan, R. Siegel, L. Hennighausen, et al. 2007. Interleukin-2 signaling viaSTAT5 constrains T helper 17 cell generation. Immunity 26: 371–381.
59. Murai, M., O. Turovskaya, G. Kim, R. Madan, C. L. Karp, H. Cheroutre, andM. Kronenberg. 2009. Interleukin 10 acts on regulatory T cells to maintainexpression of the transcription factor Foxp3 and suppressive function in micewith colitis. Nat. Immunol. 10: 1178–1184.
60. Ivanov, I. I., B. S. McKenzie, L. Zhou, C. E. Tadokoro, A. Lepelley, J. J. Lafaille,D. J. Cua, and D. R. Littman. 2006. The orphan nuclear receptor RORgammatdirects the differentiation program of proinflammatory IL-17+ T helper cells.Cell 126: 1121–1133.
61. Lorenz, R. G., D. D. Chaplin, K. G. McDonald, J. S. McDonough, andR. D. Newberry. 2003. Isolated lymphoid follicle formation is inducible anddependent upon lymphotoxin-sufficient B lymphocytes, lymphotoxin beta re-ceptor, and TNF receptor I function. J. Immunol. 170: 5475–5482.
62. Cose, S., C. Brammer, K. M. Khanna, D. Masopust, and L. Lefrancois. 2006.Evidence that a significant number of naive T cells enter non-lymphoid organs aspart of a normal migratory pathway. Eur. J. Immunol. 36: 1423–1433.
63. Yamazaki, T., X. O. Yang, Y. Chung, A. Fukunaga, R. Nurieva, B. Pappu,N. Martin-Orozco, H. S. Kang, L. Ma, A. D. Panopoulos, et al. 2008. CCR6regulates the migration of inflammatory and regulatory T cells. J. Immunol. 181:8391–8401.
64. Wang, C., S. G. Kang, J. Lee, Z. Sun, and C. H. Kim. 2009. The roles of CCR6 inmigration of Th17 cells and regulation of effector T-cell balance in the gut.Mucosal Immunol. 2: 173–183.
65. Jang, M. H., N. Sougawa, T. Tanaka, T. Hirata, T. Hiroi, K. Tohya, Z. Guo,E. Umemoto, Y. Ebisuno, B. G. Yang, et al. 2006. CCR7 is critically importantfor migration of dendritic cells in intestinal lamina propria to mesenteric lymphnodes. J. Immunol. 176: 803–810.
66. Huang, F. P., N. Platt, M. Wykes, J. R. Major, T. J. Powell, C. D. Jenkins, andG. G. MacPherson. 2000. A discrete subpopulation of dendritic cells transportsapoptotic intestinal epithelial cells to T cell areas of mesenteric lymph nodes. J.Exp. Med. 191: 435–444.
67. von Andrian, U. H., and T. R. Mempel. 2003. Homing and cellular traffic inlymph nodes. Nat. Rev. Immunol. 3: 867–878.
68. Randolph, G. J., J. Ochando, and S. Partida-Sanchez. 2008. Migration of den-dritic cell subsets and their precursors. Annu. Rev. Immunol. 26: 293–316.
69. Drakes, M. L., T. G. Blanchard, and S. J. Czinn. 2005. Colon lamina propriadendritic cells induce a proinflammatory cytokine response in lamina propriaT cells in the SCID mouse model of colitis. J. Leukoc. Biol. 78: 1291–1300.
70. Abraham, C., and J. Cho. 2009. Interleukin-23/Th17 pathways and inflammatorybowel disease. Inflamm. Bowel Dis. 15: 1090–1100.
71. O’Connor, W., Jr., M. Kamanaka, C. J. Booth, T. Town, S. Nakae, Y. Iwakura,J. K. Kolls, and R. A. Flavell. 2009. A protective function for interleukin 17A inT cell-mediated intestinal inflammation. Nat. Immunol. 10: 603–609.
72. Ogawa, A., A. Andoh, Y. Araki, T. Bamba, and Y. Fujiyama. 2004. Neutrali-zation of interleukin-17 aggravates dextran sulfate sodium-induced colitis inmice. Clin. Immunol. 110: 55–62.
73. Zhang, Z., M. Zheng, J. Bindas, P. Schwarzenberger, and J. K. Kolls. 2006.Critical role of IL-17 receptor signaling in acute TNBS-induced colitis. Inflamm.Bowel Dis. 12: 382–388.
74. Weaver, C. T., R. D. Hatton, P. R. Mangan, and L. E. Harrington. 2007. IL-17family cytokines and the expanding diversity of effector T cell lineages. Annu.Rev. Immunol. 25: 821–852.
75. Langrish, C. L., B. S. McKenzie, N. J. Wilson, R. de Waal Malefyt,R. A. Kastelein, and D. J. Cua. 2004. IL-12 and IL-23: master regulators ofinnate and adaptive immunity. Immunol. Rev. 202: 96–105.
76. Kastelein, R. A., C. A. Hunter, and D. J. Cua. 2007. Discovery and biology of IL-23 and IL-27: related but functionally distinct regulators of inflammation. Annu.Rev. Immunol. 25: 221–242.
77. Duerr, R. H., K. D. Taylor, S. R. Brant, J. D. Rioux, M. S. Silverberg, M. J. Daly,A. H. Steinhart, C. Abraham, M. Regueiro, A. Griffiths, et al. 2006. A genome-wide association study identifies IL23R as an inflammatory bowel disease gene.Science 314: 1461–1463.
78. Dubinsky, M. C., D. Wang, Y. Picornell, I. Wrobel, L. Katzir, A. Quiros,D. Dutridge, G. Wahbeh, G. Silber, R. Bahar, et al; Western Regional ResearchAlliance for Pediatric IBD. 2007. IL-23 receptor (IL-23R) gene protects againstpediatric Crohn’s disease. Inflamm. Bowel Dis. 13: 511–515.
79. Schenk, M., A. Bouchon, S. Birrer, M. Colonna, and C. Mueller. 2005. Mac-rophages expressing triggering receptor expressed on myeloid cells-1 are un-derrepresented in the human intestine. J. Immunol. 174: 517–524.
80. Schenk, M., and C. Mueller. 2007. Adaptations of intestinal macrophages to anantigen-rich environment. Semin. Immunol. 19: 84–93.
81. Platt, A. M., C. C. Bain, Y. Bordon, D. P. Sester, and A. M. Mowat. 2010. Anindependent subset of TLR expressing CCR2-dependent macrophages promotescolonic inflammation. J. Immunol. 184: 6843–6854.
82. Siddiqui, K. R., S. Laffont, and F. Powrie. 2010. E-cadherin marks a subset ofinflammatory dendritic cells that promote T cell-mediated colitis. Immunity 32:557–567.
The Journal of Immunology 747
at Em
ory University H
ealth Sciences Library on January 15, 2013
http://jimm
unol.org/D
ownloaded from


