Embed Size (px)
Citation preview

778 © 2011 Società Italiana di Nefrologia - ISSN 1121-8428
JN (2011; :06) 778-78924EPHROL
DOI:10.5301/JN.2011.6382
IntroductIon
End-stage renal disease (ESRD) among the elderly and in patients with diabetes is a major financial burden on the health care system in many developed countries (1). In Malaysia, diabetic nephropathy (DN) is the most common cause of ESRD among patients undergoing dialysis (2), and with the latest diabetes prevalence of 14.9% (3), will further increase the health care costs of treating DN.
AbstrAct
Background: Diabetic nephropathy (DN) is the most common cause of end-stage renal disease (ESRD) among type 2 diabetes mellitus patients (DM) in Malay-sia. This study used microarray analysis to determine the gene expression profiling in ethnic Malay patients with type 2 DM. Methods: A total of 312 patients were recruited; 25 were on dialysis due to ESRD, 128 were classified as normoalbuminuric, 93 as microalbuminuric and 66 as macroalbuminuric, based on urine albumin to crea-tinine ratio of <3.5, between 3.5 and 35 and ≥35 mg/mmol, respectively.Results: Microalbuminuria was associated with up- and down-regulation of 2,694 and 2,538 genes, re-spectively, while macroalbuminuria was associated with up-regulation of 2,520 genes and down-regula-tion of 2,920 genes. There was significant up-regula-tion of 1,135 genes and down-regulation of 908 genes in the ESRD samples. Thirty-seven significantly up-regulated genes and 40 down-regulated genes were commonly expressed in all 3 groups of patients with worsening of renal functions. Up-regulated genes included major histocompatibility complex (HLA-C), complement component 3a receptor 1 (C3AR1), solute carrier family 16, member 3 (SLC16A3) and solute car-
Gene expression profiling in ethnic Malays with type 2 diabetes mellitus, with and without diabetic nephropathy
ORIGINAL ARTICLE
1 Cardiovascular, Diabetes and Nutrition Research Centre, Institute for Medical Research, Kuala Lumpur - Malaysia
2 School of Medical Sciences, Universiti Sains Malaysia, Kota Bharu - Malaysia
3 Department of Medicine, Universiti Kebangsaan Malaysia, Kuala Lumpur - Malaysia
4 Penang Medical College, Malaysia, Penang - Malaysia5 Putrajaya Hospital, Putrajaya - Malaysia
Faradianna E. Lokman 1, Norhashimah A. Seman 1, Aziz al-Safi Ismail 2, Nor Azwany Yaacob 2, Norlaila Mustafa 3, Amir S.M. Khir 4, Zanariah Hussein 5, Wan Nazaimoon Wan Mohamud 1
rier family 9 (sodium/hydrogen exchanger) (SLC9A8). Consistently down-regulated genes included were bone morphogenetic phosphatase kinase (BMP2K), solute carrier family 12, member 1 (SLC12A1), solute carrier family 7 (SLC7A2), paternally expressed 10 (PEG10) and protein phosphatase 1 regulatory (inhibi-tor unit) (PPP1R1C). Conclusion: This study has identified several genes of interest, such as HLA-C, SLC16A3, SLC9A8, SLC12A1 and SLC7A2, that require verification of their roles as susceptibility genes for diabetic nephropathy in ethnic Malays with type 2 DM.
Key words: Diabetic nephropathy, Gene expression, Malay, Type 2 diabetes mellitus

779© 2011 Società Italiana di Nefrologia - ISSN 1121-8428
JN (2011; :06) 778-78924EPHROL
Individuals who had diabetes and developed progressive DN and/or ESRD were thought to have done so as a result of long-term chronic exposure to hyperglycemia (4). How-ever, there has been cumulative epidemiological evidence to suggest a role of genetic factors in the development and progression of DN (5, 6). Gene expression profiling on a genomic scale by microarray technology has become an important tool in uncovering the molecular basis of many biological processes (7). The method has been widely used in identifying genes that are up-regulated or down-regulated in DN patients, resulting in the identification of several new candidate disease susceptibility genes (8, 9). However, most of the studies carried out on the candidate genes associated with DN were completed largely in white (10), Korean (11) and Japanese (12) populations, as well as in animal models (13, 14). The objective of this current study was therefore to deter-mine the gene expression profiling in the Malay popula-tion with type 2 diabetes mellitus (DM), with or without renal impairment, using the microarray technology. The Malays belong to an ethnic group of Austronesians living predominantly in the Malay Peninsula and parts of Su-matra and Borneo Island, and in Malaysia, they make up about half of the total population.
subjects And methods
Subjects
Subjects were recruited from the university hospitals of Uni-versity Kebangsaan Malaysia and University Sains Malaysia, Putrajaya Hospital and Penang Medical College, Malaysia. Inclusion criteria for patient selection were ethnic Malay for at least 2 generations and having been diagnosed with type 2 DM for more than 6 years. After giving signed informed consent, participants underwent clinical and physical ex-aminations, and answered a set of health-related question-naires. The study was approved by the Medical Research Ethics Committee, Ministry of Health Malaysia and the re-spective ethics committees of each hospital.
Blood and urine collection
A total sample of 10 mL venous blood was drawn and trans-ferred into 2 ethylenediaminetetraacetic acid (EDTA) tubes. Blood samples were immediately transported at 4°C to the Institute for Medical Research or were processed on-site. Urine samples of about 10 to 20 mL were also collected from all patients except those with ESRD. The urine collect-
ed was aliquoted and kept frozen at −20°C until analyzed. The kidney status of subjects for both sexes was catego-rized based on urine albumin to creatinine ratio (ACR) as suggested by the American Diabetes Association (ADA) (15): normoalbuminuria (ACR <3.5 mg/mmol), microalbuminuria (ACR 3.5 to 35 mg/mmol) and macroalbuminuria (≥35 mg/mmol). No urine sample was collected from subjects who were on dialysis due to DN (ESRD).
RNA extraction and microarray analysis
The RNA was extracted from fresh blood using an RNA Extraction Kit (Qiagen, USA) according to the manufac-turer’s protocol, and quantified spectrophotometrically (Biophotometer Plus, Eppendorf, Germany). The 2-Cycle Eukaryotic Target Labeling Assay protocol was used for microarrays. Briefly, 100 ng of total RNA was required as the starting material to synthesize the complimenta-ry DNA (cDNA). T7-Oligo (dt) Promoter Primer was used in the second-strand cDNA synthesis to generate the double-stranded cDNA template containing T7 promoter sequences. After amplification and labeling using a bioti-nylated nucleotide analog/ribonucleotide mix in the sec-ond in vitro transcription (IVT) reaction, the labeled cRNA was cleaned, fragmented and hybridized to an Affymetrix GeneChip 1.0 ST array containing 28,869 transcripts. Mi-croarray hybridization was performed at 45°C with rota-tion for 16 hours (overnight) on an Affymetrix GeneChip Hybridization Oven (Affymetrix Inc., Santa Clara, CA, USA). The GeneChips were washed and stained on an Af-fymetrix Fluidics Station 450 (Affymetrix Inc., Santa Clara, CA, USA) then scanned on a GeneChip Scanner 3000 (Af-fymetrix Inc., Santa Clara, CA, USA).
Confirmation of array results by quantitative real-time polymerase chain reaction
HLA-C and BMP2K genes identified from the microarray analysis were selected for confirmation by quantitative real-time polymerase chain reaction (RT-PCR; Applied Biosystem 7300 Real-time PCR). The housekeeping gene used was human 18s rRNA. The sequences of oligonu-cleotide primer pairs and probes of selected genes were obtained from TaqMan (Applied Biosystem Inc., Foster City, CA, USA) (Tab. I). RNA was converted to cDNA by using an Advantaged RT-for-PCR kit (Clonetech, Moun-tain View, CA, USA). Amplification conditions used for RT-PCR were initiated at 50°C for 2 minutes and 95°C for 10 minutes, followed by 40 cycles at 95°C for 15 sec-onds and 60°C for 1 minutes.

780 © 2011 Società Italiana di Nefrologia - ISSN 1121-8428
Lokman et al: Diabetic nephropathy in Malays: gene profiles
Data analysis
Data analysis was carried out using the Partek Genomic Suite Software (St. Louis, MO, USA) and NettAfix (Affyme-trix Inc., Santa Clara, CA, USA). For the probe intensity values generated by the Affymetrix scanner, robust mul-tichip average (RMA) algorithm was used for normaliza-tion and statistical processing. Using the Partek Genomic software, 1-way analysis of variance (ANOVA) was per-formed to compare data between groups and to generate a list of differentially expressed genes. Only those genes
with p<0.05 and a false delivery rate (FDR) of less than 0.05 were considered.
results
A total of 312 Malay patients with type 2 DM agreed to par-ticipate in the study. Grouped according to their ACR status, there were 128 patients with normoalbuminuria, 93 patients with microalbuminuria and 66 patients with macroalbuminu-ria. Twenty-five patients were on dialysis due to DN (ESRD) (Tab. II). There was no age difference between the 4 groups,
TABLE I PRIMERS AND TAQMAN PROBE SEQUENCE
Gene Forward primer Reverse primer TaqMan probe Reporter
BMP2K5’-ACCTGAGGAGAGCC-TGTTGG-3’
5’-CTGATGTGGAGGG-TGCCATG-3’
5’-CCCTTCGGTGCCA-AGCCCTTCCAT-3’
FAM
HLA-C5’-CGGGAGACACAGA-AGTACAAGC-3’
5’GTCCTCGCTCTGGTTG-TAGTA-3’
5’-CGCAGGTTCCGCAG-GCTCACTCG-3’
FAM
Human 18s rRNA5’-GTTGATTAAGTCCC-TGCCCTTTG-3’
5’-AAGTTCGACCG-TCTTCTCAGC-3’
5’-ACACACCGCCCG-TCGCTACTACCG-3’
FAM
TABLE II BIOCHEMICAL PROFILES OF STUDY SUBJECTS
Normoalbuminuria Microalbuminuria Macroalbuminuria End-stage renal failure
Age, years 57 ± 9.7 57 ± 8.7 57 ± 10.5 57 ± 8.7
Number (male/female) 128 (52/76) 93 (60/33) 66 (39/27) 25 (11/14)
Disease duration, years 13 ± 6.4 16 ± 7.7 16 ± 7.1 16 ± 6.6
Systolic blood pressure, mm Hg 138 ± 21 144 ± 20 155 ± 31* 163 ± 34*
Diastolic blood pressure, mm Hg 76 ± 10 77 ± 11 79 ± 10 83 ± 14
HbA1c, % 6.8 ± 1.8 7.7 ± 2.0 8.6 ± 2.2 9.0 ± 2.3
Fasting glucose, mmol/L 7.4 ± 4.2 8.3 ± 6.3 9.4 ± 5.7 10.1 ± 3.2
*p<0.01, vs. normoalbuminuria.

781© 2011 Società Italiana di Nefrologia - ISSN 1121-8428
JN (2011; :06) 778-78924EPHROL
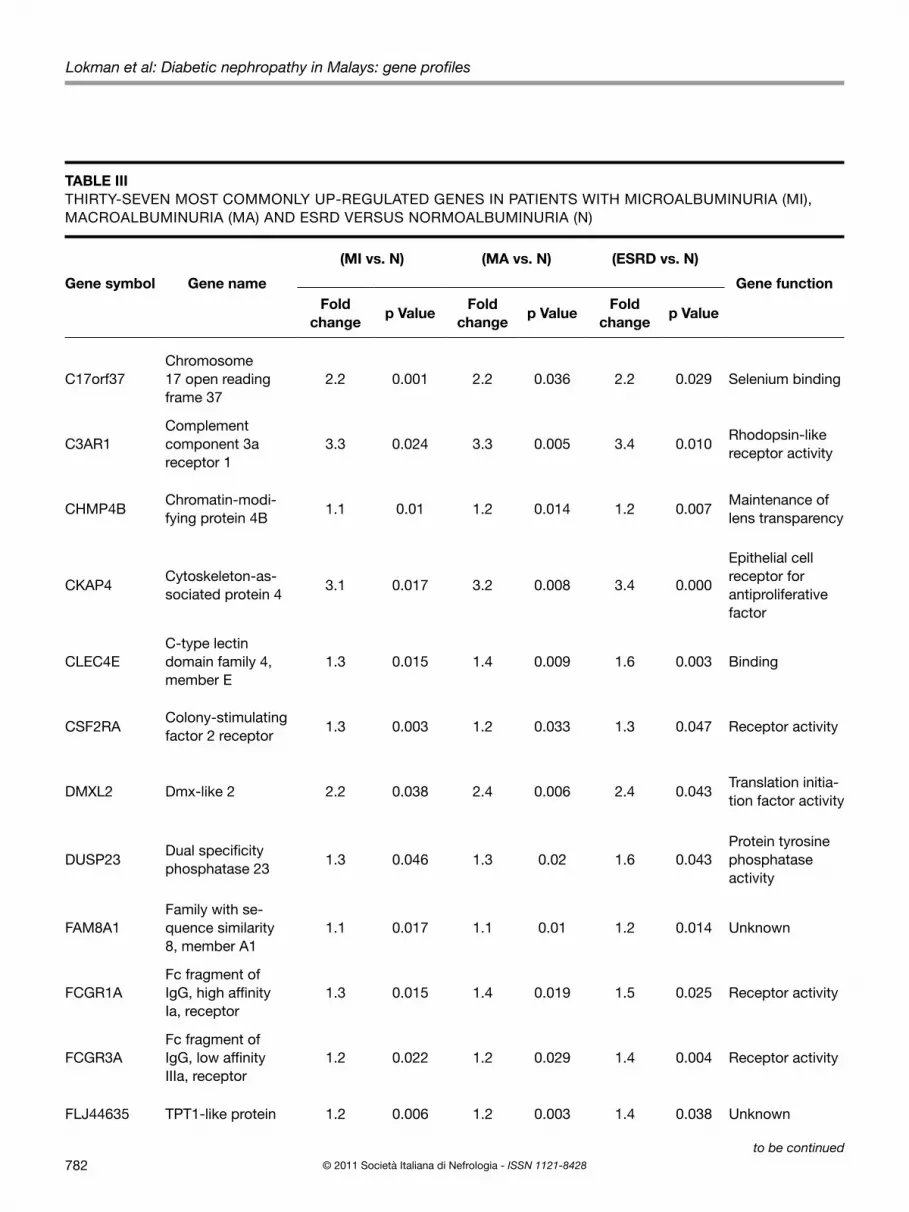
and although patients with renal impairment appeared to have a longer duration of diabetes, the mean was not signifi-cantly different from that of the normoalbuminuric patients.Using Partek Genomic Suite Software, a list of up- and down-regulated genes with >1.0-fold change was gener-ated. Results showed that microalbuminuria was associ-ated with the up- and down-regulation of 2,694 and 2,538 genes, respectively, while macroalbuminuria was associat-ed with up-regulation of 2,520 genes and down-regulation of 2,920 genes. A total of 1,135 genes were significantly up-regulated and 908 genes were significantly down-regu-lated in the ESRD samples.Compared with the gene expression data obtained from pa-tients with normoalbuminuria, a total of 37 significantly up-regulated genes (Tab. III) and 40 significantly down-regulat-ed genes (Tab. IV) were commonly expressed in all 3 groups of patients where some genes became either significantly more up- or down-regulated with worsening of renal func-tions. Among the significantly and consistently up-regulated genes were the major histocompatibility complex (HLA-C), complement component 3a receptor 1 (C3AR1), solute car-rier family 16, member 3 (SLC16A3) and solute carrier fam-ily 9 (sodium/hydrogen exchanger) (SLC9A8). Consistently down-regulated genes included bone morphogenetic phos-phatase kinase (BMP2K), solute carrier family 12, member 1
(SLC12A1), solute carrier family 7 (SLC7A2), paternally ex-pressed 10 (PEG10) and protein phosphatase 1 regulatory (inhibitor unit) (PPP1R1C). The validity and reliability of our microarray data was confirmed by RT-PCR where there was no difference in the gene expression patterns of HLA-C and BMP2K between the 2 methods (Fig. 1).
dIscussIon
Human leukocyte antigens (HLA) have been associated with increased risk of type 1 DM and microvascular dis-ease (16), including DN (4). Similarly in type 2 DM, there is now some evidence to support that ethnic variations in HLA, may contribute, in part, to the higher prevalence rates of diabetic renal disease seen in some populations (17, 18). While Pima Indians (19) and Nauruans (20) with type 2 DM were found to be associated with HLA-A2 and HLA-Bw22, respectively, Maori natives with type 2 DM and renal failure had increased HLA-B48 and HLA-B60 (21). In contrast, this present study found HLA-C to be significantly and consistently up-regulated in all patients with renal im-pairment. There is no doubt that more studies with larger sample sizes are needed to determine the importance and role of HLC-C as the susceptibility gene for DN in the Malay population.
Fig. 1 - Validation of microarray data by (RTPCR). RTPCR was used to validate expression ratios from the microarray hybrid-ization. Human 18srRNA was used as a housekeeping gene. Fold changes were obtained by calculating the ratio of the mean expression values from MI, MA and ESRD with N samples (p<0.01). BMP2K: Bone marrow phosphatase kinase 2; HLA: His-tocompatibility complex; ESRD = end-stage renal disease; HLA = histocompatibility complex; MA = macroalbuminuria; MI = microalbuminuria; N = normoalbuminuria.
782 © 2011 Società Italiana di Nefrologia - ISSN 1121-8428
Lokman et al: Diabetic nephropathy in Malays: gene profiles
TABLE III THIRTY-SEVEN MOST COMMONLY UP-REGULATED GENES IN PATIENTS WITH MICROALBUMINURIA (MI), MACROALBUMINURIA (MA) AND ESRD VERSUS NORMOALBUMINURIA (N)
Gene symbol Gene name
(MI vs. N) (MA vs. N) (ESRD vs. N)
Gene functionFold
changep Value
Fold change
p ValueFold
changep Value
C17orf37Chromosome 17 open reading frame 37
2.2 0.001 2.2 0.036 2.2 0.029 Selenium binding
C3AR1Complement component 3a receptor 1
3.3 0.024 3.3 0.005 3.4 0.010Rhodopsin-like receptor activity
CHMP4BChromatin-modi-fying protein 4B
1.1 0.01 1.2 0.014 1.2 0.007Maintenance of lens transparency
CKAP4Cytoskeleton-as-sociated protein 4
3.1 0.017 3.2 0.008 3.4 0.000
Epithelial cell receptor for antiproliferative factor
CLEC4EC-type lectin domain family 4, member E
1.3 0.015 1.4 0.009 1.6 0.003 Binding
CSF2RAColony-stimulating factor 2 receptor
1.3 0.003 1.2 0.033 1.3 0.047 Receptor activity
DMXL2 Dmx-like 2 2.2 0.038 2.4 0.006 2.4 0.043Translation initia-tion factor activity
DUSP23Dual specificity phosphatase 23
1.3 0.046 1.3 0.02 1.6 0.043Protein tyrosine phosphatase activity
FAM8A1Family with se-quence similarity 8, member A1
1.1 0.017 1.1 0.01 1.2 0.014 Unknown
FCGR1AFc fragment of IgG, high affinity Ia, receptor
1.3 0.015 1.4 0.019 1.5 0.025 Receptor activity
FCGR3AFc fragment of IgG, low affinity IIIa, receptor
1.2 0.022 1.2 0.029 1.4 0.004 Receptor activity
FLJ44635 TPT1-like protein 1.2 0.006 1.2 0.003 1.4 0.038 Unknown
to be continued

783© 2011 Società Italiana di Nefrologia - ISSN 1121-8428
JN (2011; :06) 778-78924EPHROL
GBP1 Guanylate binding protein 1 1.3 0.035 1.4 0.035 1.4 0.050 Nucleotide binding
GBP2Guanylate binding protein 2, interfe-ron-inducible
1.3 0.05 1.3 0.016 1.5 0.044 Nucleotide binding
GLIPR2GLI pathogenesis-related 2
1.3 0.009 1.3 0.013 1.3 0.050 Unknown
GPR125G protein-coupled receptor 125
1.3 0.006 1.5 0.006 1.5 0.019 Receptor activity
GPR77G protein-coupled receptor 77
1.3 0.004 1.3 0.003 1.3 0.030Rhodopsin-like receptor activity
HLA-CMajor histocom-patibility complex, class I, C
3.4 0.001 3.6 0.001 3.7 0.001MHC class I re-ceptor activity
HDCHistidine decarbo-xylase
2.1 0.04 2.1 0.013 2.2 0.018Histidine decarbo-xylase activity
IRAK3Interleukin-1 re-ceptor-associated kinase 3
1.2 0.007 1.4 0.004 1.3 0.022 Nucleotide binding
KLHL22Kelch-like 22 (Dro-sophila)
2.1 0.029 2.1 0.01 2.1 0.013 Protein binding
LMO2LIM domain only 2 (rhombotin-like 1)
1.1 0.015 1.1 0.027 1.1 0.010 Protein binding
LOC645018Hypothetical LOC645018
1.1 0.046 1.2 0.001 1.4 0.022Structural consti-tuent of ribosome
MYADMMyeloid-associa-ted differentiation marker
2.3 0.001 2.3 0.007 2.4 0.008Physiological role during myeloid differentiation
PGAM1Phosphoglycerate mutase 1 (brain)
2.2 0.007 2.2 0.024 2.3 0.022Bisphosphogly-cerate mutase activity
PGAM1Phosphoglycerate mutase 1 (brain)
2.2 0.008 2.2 0.029 2.3 0.025Bisphosphogly-cerate mutase activity
TABLE III CONTINUED
Gene symbol Gene name
(MI vs. N) (MA vs. N) (ESRD vs. N)
Gene functionFold
changep Value
Fold change
p ValueFold
changep Value
to be continued

784 © 2011 Società Italiana di Nefrologia - ISSN 1121-8428
Lokman et al: Diabetic nephropathy in Malays: gene profiles
PGAM4Phosphoglycerate mutase family member 4
2.2 0.007 2.2 0.005 2.2 0.010Bisphosphogly-cerate mutase activity
PTP4A3Protein tyrosine pho-sphatase type IVA, member 3
2.1 0.042 2.2 0.024 2.3 0.003Prenylated protein tyrosine phospha-tase activity
RBM15BRNA binding motif protein 15B
1.1 0.005 1.1 0.038 1.1 0.010 Nucleotide binding
SDCBPSyndecan-binding protein (syntenin)
1.1 0.008 1.2 0.013 1.2 0.037Interleukin-5 receptor binding
SDCCAG1Serologically defined colon cancer antigen 1
1.2 0.03 1.3 0.03 1.5 0.039 Unknown
SLC16A3Solute carrier family 16, member 3
2.3 0.021 2.3 0.007 2.5 0.013Transporter activity
SLC9A8Solute carrier family 9 (sodium/hydrogen exchanger)
2.2 0.032 2.2 0.015 2.3 0.033 Antiporter activity
SORT1 Sortilin 1 1.2 0.021 1.3 0.008 1.3 0.033 Receptor activity
SPATA6Spermatogenesis-associated 6
1.2 0.013 1.2 0.001 1.3 0.043Rab GTPase binding
SPTLC2Serine palmitoyltran-sferase, long chain base subunit 2
1.2 0.026 1.3 0.01 1.5 0.031Serine C-palmi-toyltransferase activity
TDRD7Tudor domain containing 7
1.2 0.016 1.3 0 1.2 0.043Nucleic acid binding
TPI1Triosephosphate isomerase 1
2.2 0.005 2.2 0.012 2.2 0.031Triose-phosphate isomerase activity
ESRD = end-stage renal disease.
TABLE III CONTINUED
Gene symbol Gene name
(MI vs. N) (MA vs. N) (ESRD vs. N)
Gene functionFold
changep Value
Fold change
p ValueFold
changep Value

785© 2011 Società Italiana di Nefrologia - ISSN 1121-8428
JN (2011; :06) 778-78924EPHROL
TABLE IV FORTY MOST COMMONLY DOWN-REGULATED GENES IN PATIENTS WITH MICROALBUMINURIA (MI), MACROAL-BUMINURIA (MA) AND ESRD VERSUS NORMOALBUMINURIA (N)
Gene symbol Gene name
(MI vs. N) (MA vs. N) (ESRD vs. N)
Gene functionFold
changep Value
Fold change
p ValueFold
changep Value
ALDH1B1Aldehyde dehydrogena-se 1 family, member B1
-2.1 0.006 -2.1 0.009 -2.1 0.01Aldehyde dehydroge-nase (NAD) activity
BEX5 BEX family member 5 -1.1 0.009 -1.2 0.001 -1.1 0.043Receptor-mediated si-gnaling and apoptosis
BMP2KBone morphogenetic phosphatase kinase 2
-2.9 0.001 -2.9 0.001 -3.2 0.001Skeletal development and patterning
BNIP1BCL2/adenovirus E1B 19kDa interacting protein 1
-3.1 0.034 -3.1 0 -3.6 0.022 Protein binding
C10orf122Chromosome 10 open reading frame 122
-1.1 0.002 -1.1 0.049 -1.1 0.046 Unknown
C10orf53Chromosome 10 open reading frame 53
-2.1 0.022 -2.1 0.022 -2.1 0.048 Unknown
C2orf66Chromosome 2 open reading frame 66
-1.1 0.003 -1.1 0.008 -1.2 0.019 Unknown
CCNYL3 Cyclin Y-like 3 -1.1 0.027 -1.1 0.038 -1.1 0.047Mediate phospho-rylation of cellular proteins
CDCA8Cell division cycle asso-ciated 8
-1.1 0.017 -1.1 0.021 -1.1 0.024 Protein binding
DEFB106A Defensin, beta 106A -1.1 0.036 -1.2 0.032 -1.3 0.018 Defense response
DPH2DPH2 homolog (S. cerevisiae)
-1.1 0.013 -1.1 0.001 -1.1 0.022Diphthamide biosyn-thesis
FAM135BFamily with sequence similarity 135, member B
-1.1 0.003 -1.1 0.031 -1.2 0.047 Unknown
FAM138AFamily with sequence similarity 138, member A
-1.1 0.033 -1.1 0.011 -1.1 0.024 Retina protein
FAM138FFamily with sequence similarity 138, member F
-1.1 0.04 -1.1 0.012 -1.1 0.047 Retina protein
FANCBFanconi anemia, com-plementation group B
-1.1 0.028 -1.2 0.048 -1.2 0.016Repair of DNA damage
FBXO16 F-box protein 16 -1.1 0.015 -1.2 0.015 -1.5 0.047 DNA binding
to be continued

786 © 2011 Società Italiana di Nefrologia - ISSN 1121-8428
Lokman et al: Diabetic nephropathy in Malays: gene profiles
FRMD7FERM domain contai-ning 7
-1.2 0.043 -1.3 0.013 -1.5 0.012 Binding
GPR103G protein-coupled receptor 103
-3.0 0.043 -3.2 0.017 -3.2 0.015Rhodopsin-like receptor activity
IGKV2-24Immunoglobulin kappa variable 2-24
-1.2 0.004 -1.6 0.001 -1.8 0.037 Unknown
IL1A Interleukin-1, alpha -1.1 0.049 -1.2 0.039 -1.4 0.019Signal transducer activity
KCNK2Potassium channel, subfamily K, member 2
-1.2 0.002 -1.2 0.014 -1.3 0.038 Ion channel activity
LARGE Like-glycosyltransferase -1.2 0.025 -1.3 0.01 -1.4 0.007Acetylglucosaminyl-transferase activity
LOC440742Hypothetical gene sup-ported by AK124614
-1.1 0.001 -1.1 0.008 -1.1 0.022 Unknown
LOC441931Putative G-protein coupled receptor
-1.0 0.018 -1.2 0.039 -1.3 0.036 Receptor activity
MGC26356Similar to zinc finger protein 595
-1.1 0.005 -1.1 0.019 -1.1 0.015DNA, metal ion and zinc ion binding
OR1S2Olfactory receptor, family 1, subfamily S, member 2
-1.2 0.004 -1.2 0.018 -1.2 0.025 Receptor activity
OR2T5Olfactory receptor, family 2, subfamily T, member 5
-1.1 0.031 -1.1 0.033 -1.2 0.009 Receptor activity
OR7G1Olfactory receptor, family 7, subfamily G, member 1
-1.1 0.004 -1.1 0.005 -1.1 0.027 Receptor activity
OR9A4Olfactory receptor, family 9, subfamily A, member 4
-1.1 0.006 -1.1 0.03 -1.4 0.043 Receptor activity
OR9G1Olfactory receptor, family 9, subfamily G, member 1
-1.1 0.005 -1.1 0.005 -1.1 0.022 Receptor activity
TABLE IV CONTINUED
Gene symbol Gene name
(MI vs. N) (MA vs. N) (ESRD vs. N)
Gene functionFold
changep Value
Fold change
p ValueFold
changep Value
to be continued

787© 2011 Società Italiana di Nefrologia - ISSN 1121-8428
JN (2011; :06) 778-78924EPHROL
Another group of differentially expressed genes identified in this study belongs to the solute-carrier gene (SLC) superfam-ily which encodes membrane-bound transporters that include passive transporters, symporters and antiporters, located in all cellular and organelle membranes (22). Mutation of these genes has been shown to be the cause of many human dis-eases (23). Polymorphisms in solute carrier family 12 member 3 (SLC12A3) have been associated with DN in Korean (24) and Japanese patients (25) with type 2 DM. In this present study, progression from normoalbuminuria to microalbuminuria or overt proteinuria and ESRD were associated with significant
up-regulation of SLC16A3 and SLC9A8 and down-regulation of SLC12A1 and SLC7A2. Further in-depth studies however are required to determine whether these could be candidate genes for DN susceptibility in the Malay population.On the other hand, despite the various limitations of this study, including the small sample size and the possibility of false-positive results due to multiple comparisons, our results were comparable to the findings by Guttula et al who studied genes in the peripheral blow cells of type 2 DM Asian Indians with DM (26). We also found significant down-regulation of PEG10 and PPP1R1C in all subjects with microalbuminuria,
OVGP1 Oviductal glycoprotein 1 -2.4 0.003 -2.5 0.007 -2.6 0.033 Catalytic activity
PEG10 Paternally expressed 10 -3.1 0.006 -3.2 0.001 -3.1 0.02 DNA binding
PPP1R1CProtein phosphatase 1, regulatory (inhibitor) subunit
-3.1 0.001 -3.1 0.038 -3.1 0.023Protein phosphatase inhibitor activity
RNASE9Ribonuclease, RNase A family, 9
-1.1 0.004 -1.1 0.014 -1.1 0.033 Nucleic acid binding
SLC12A1 Solute carrier family 12 -2.1 0.034 -2.1 0.012 -2.3 0.016 Transporter activity
SLC7A2 Solute carrier family 7 -2.1 0.014 -2.1 0.004 -2.1 0.021Basic amino acid transmembrane transporter activity
TTC39ATetratricopeptide repeat domain 39A
-1.1 0.009 -1.1 0.009 -1.1 0.036 Binding
TNIP3TNFAIP3 interacting protein 3
-2.1 0.013 -2.1 0.002 -2.2 0.005Regulation of immuni-ty and tissue homeo-stasis
ZNF23 Zinc finger protein 23 -1.1 0.002 -1.1 0.009 -1.1 0.007 Nucleic acid binding
ZNF354B Zinc finger protein 354B -1.0 0.003 -1.1 0.033 -1.1 0.007 DNA binding
ESRD = end-stage renal disease.
TABLE IV CONTINUED
Gene symbol Gene name
(MI vs. N) (MA vs. N) (ESRD vs. N)
Gene functionFold
changep Value
Fold change
p ValueFold
changep Value

788 © 2011 Società Italiana di Nefrologia - ISSN 1121-8428
Lokman et al: Diabetic nephropathy in Malays: gene profiles
macroalbuminuria or ESRD. The growth factor bone morpho-genetic protein 2 (BMP-2) was another gene that was found to be significantly down-regulated in our samples. BMP-2 has been shown to be down-regulated in the glomeruli from kidneys of patients with DN (8). Another significantly up-reg-ulated gene that may be worth further study was C3AR1. Ac-tivation of C3a anaphylatoxin through its G protein-coupled
receptor, C3aR, has been implicated as contributing to renal tubulointerstitial injury (27). Expression of C3AR1 was found to increase significantly in the kidneys of MRL/lpr lupus mice before the onset of renal disease, and it increased further as the disease progressed (13). There have been several genes proposed as good candi-dates for conferring susceptibility to DN. Among them were IGF-binding protein 1 (IGFBP1), carnosinase (CNDP1), apo-lipoprotein E (ApoE), angiotensin-converting enzyme (ACE) and superoxide dismutase 2 (SOD2) which were found to be significantly associated with DN in white (10, 28), Ko-rean (11) and Japanese populations (12). However, none of these genes were found to be significantly expressed in our cohort of Malay patients with type 2 DM. Type 2 DM is associated with insulin resistance, character-ized by reduced insulin-stimulated glucose transport activity in the skeletal muscle and adipose tissue (29). Several meta-bolic genes in various tissues have been proposed as con-tributing to the pathogenesis of insulin resistance, leading to development of type 2 DM and its complications including DN. As reported by Patti et al (30), there was a significant reduction in the expression of peroxisome proliferators-acti-vated receptor-γ coactivator 1-α and -β in the skeletal mus-cle of prediabetic and type 2 DM patients of Mexican-Amer-ican ethnicity. Further, by integrating the transcriptome data sets from studies of Mexican-American and white Swedish men (31), using human metabolic network reconstructions, insulin resistance and type 2 DM were shown to be associ-ated with several significantly differentially expressed me-tabolites from the tricarboxylic acid (TCA) cycle, oxidative
phosphorylation and lipid metabolism, as well as the highly connected reporter metabolites ATP/ADP and NAD+/NADH (32). These data would be particularly valuable in molecular and metabolic pathway studies, in particular, for identifica-tion of new therapeutic targets. One such good example has been the identification of peroxisome proliferator-activated receptors (PPARs) which are found expressed in various tis-sues such as adipose tissue, liver, heart as well as the kidney (33, 34). There is now increasing evidence to support the use of PPAR agonists not only as therapeutic agents for type 2 DM, obesity, hypertension, hyperlipidemia and atherosclero-sis, but also for DN (35). In conclusion, this study has identified several genes – in particular, HLA-C, SLC16A3, SLC9A8, SLC12A1 and SLC7A2 – with possible roles as susceptibility genes for DN in ethnic Malays with type 2 DM. There is no doubt that further research is needed to verify and confirm the clinical significance of these findings.
Acknowledgements
The authors wish to thank the Director General of Health Ma-laysia for his scientific comments during proposal writing and preparation of this manuscript as well as giving permission to publish these findings.
Financial support: This study, with code number 06-CAM-03, was
funded by the Ministry of Health, Malaysia.
Conflict of interest statement: None declared.
Address for correspondence: Wan Nazaimoon Wan Mohamud, PhDCardiovascular, Diabetes and Nutrition Research CentreInstitute for Medical ResearchJalan Pahang50588, Kuala Lumpur, [email protected]
references
1. Garella S. The costs of dialysis in the USA. Nephrol Dial Transplant. 1997;12(Suppl 1):10-21.
2. Hooi LS, Wong HS, Morad Z. Prevention of renal failure: The Malaysian experience. Kidney Int Suppl. 2005;94:S70-S74.
3. Institute for Public Health. The Third National Health and Mor-bidity Survey 2006. Vol. 2. Malaysia: Ministry of Health; 2008.
4. Freedman BI, Bostrom M, Daeihagh P, et al. Genetic fac-
tors in diabetic nephropathy. Clin J Am Soc Nephrol. 2007;2:1306-1316.
5. Krolewski AS, Waram JHR, Rand LI, et al. Epidemiologic approach to the etiology of type 1 diabetes mellitus and its complications. N Engl J Med. 1987;317:1390-1398.
6. Quinn M, Angelico MC, Warram JH, et al. Familial factors de-termine the development of diabetic nephropathy in patients with IDDM. Diabetologia. 1996;39(8):940-945.
7. Hoheisel JD. Microarray technology: beyond transcript profil-

789© 2011 Società Italiana di Nefrologia - ISSN 1121-8428
JN (2011; :06) 778-78924EPHROL
ing and genotype analysis. Nat Rev Genet. 2006;7:200-210.8. Baelde HJ, Eikmans M, Doran PP, et al. Gene expression pro-
filing in glomeruli from human kidneys with diabetic neph-ropathy. Am J Kidney Dis. 2004;43:636-650.
9. Conway BR, Martin R, McKnight AJ, Savage DA, Brady HR, Maxwell AP. Role of alpha-adducin DNA polymorphisms in the genetic predisposition to diabetic nephropathy. Nephrol Dial Transplant. 2004;19:2019-2024. Published online June 8, 2004.
10. Mollsten A, Marklund SL, Wessman M, et al. A functional
polymorphism in the manganese superoxide dismutase gene
and diabetic nephropathy. Diabetes. 2007;56:265-269.
11. Lee SJ, Choi MG, Kim DS, et al. Manganese superoxide dis-
mutase gene polymorphism (V16A) is associated with stages
of albuminuria in Korean type 2 diabetic patients. Metabo-
lism. 2006;55:1-7.12. Nomiyama T, Tanaka Y, Piao L, et al. The polymorphism of
manganese superoxide dismutase is associated with diabet-ic nephropathy in Japanese type 2 diabetic patients. J Hum Genet. 2003;48:138-141.
13. Bao L, Osawe I, Haas M, et al. Signaling through up-regulated C3a receptor is key to the development of experimental lupus nephritis. J Immunol. 2005;175:1947-1955.
14. Makino H, Miyamoto Y, Sawai K, et al. Altered gene expres-
sion related to glomerulogenesis and podocyte structure in
early diabetic nephropathy of db/db mice and its restoration
by pioglitazone. Diabetes. 2006;55:2747-2756.
15. Molitch ME, DeFronzo RA, Franz MJ, et al. American Dia-
betes Association. Nephropathy in diabetes [position state-
ment]. Diabetes Care. 2004;27(Suppl 1):s79-s83.
16. Barbosa J, Saner B. Do genetic factors play a role in the
pathogenesis of diabetic microangiopathy? Diabetologia.
1984;27:487-492.17. Pérez-Luque E, Malacara JM, Olivo-Díaz A, et al. Contribu-
tion of HLA class II genes to end stage renal disease in Mexi-can patients with type 2 diabetes mellitus. Hum Immunol. 2000;61:1031-1038.
18. Dyck R, Bohm C, Klomp H. Increased frequency of HLA A2/DR4 and A2/DR8 haplotypes in young Saskatchewan Ab-original people with diabetic end-stage renal disease. Am J Nephrol. 2003;23:178-185.
19. Williams RC, Knowler WC, Butler WJ, et al. HLA-A2 and type 2 (insulin independent) diabetes mellitus in Pima Indians: an association of allele frequency with age. Diabetologia. 1981;21:460-463.
20. Serjeantson SW, Owerbach D, Zimmet P. Genetics of diabetes in Nauru: effects of foreign admixture, HLA antigens and the in-sulin gene linked polymorphism. Diabetologia. 1983;25:13-17.
21. Dittimer I, Woodfield G, Simpson I. Non-insulin dependent diabetes mellitus in New Zealand Maori: a relationship with class I but not class II histocompatibility locus antigens. N Z Med J. 1998;111:294.
22. He L, Vasiliou K, Nebert DW. Analysis and update of the human solute carrier (SLC) gene superfamily. Hum Genom-
ics. 2009;3:195-206.23. Hediger MA, Romero MF, Peng JB, Rolfs A, Takanaga H, Bru-
ford EA. The ABCs of solute carriers: physiological, patholog-ical and therapeutic implications of human membrane trans-port proteins. Introduction. Pflugers Arch. 2004;447:465-468. Published online November 18, 2003.
24. Kim JH, Shin HD, Park BL, et al. SLC12A3 (solute carrier fam-ily 12 member (sodium/chloride 3) polymorphisms are asso-ciated with end-stage renal disease in diabetic nephropathy. Diabetes. 2006;55:843-848.
25. Nishiyama K, Tanaka Y, Nakajima K, et al. Polymorphism of the solute carrier family 12 (sodium/chloride transporters) member 3, SLC12A3, gene at exon 23 (+78G/A: Arg913Gln) is associated with elevation of urinary albumin excretion in Japanese patients with type 2 diabetes: a 10-year longitudi-nal study. Diabetologia. 2005;48:1335-1338.
26. Guttula SV, Rao AA, Sridhar GR, et al. Cluster analysis and phy-logenetic relationship in biomarker identification of type 2 diabe-tes and nephropathy. Int J Diabetes Dev Ctries. 2010;30:52-56.
27. Tang Z, Lu B, Hatch E, et al. C3a mediates epithelial-to-mes-enchymal transition in proteinuric nephropathy. J Am Soc Nephrol. 2009;20:593-603.
28. Mollsten A, Wessman M, Svensson M, et al. Glu298Asp and NOS4ab polymorphisms in diabetic nephropathy. Ann Med. 2006;38:522-528.
29. Petersen KF, Shulman GI. Cellular mechanism of insulin resis-tance in skeletal muscle. J R Soc Med. 2002;95(Suppl 42):8-13.
30. Patti ME, Butte AJ, Crunkhorn S, et al. Coordinated reduc-tion of genes of oxidative metabolism in humans with insulin resistance and diabetes: potential role of PGC1 and NRF1. Proc Natl Acad Sci U S A. 2003;100:8466-8471.
31. Mootha VK, Lindgren CM, Eriksson KF, et al. PGC-1 alpha-responsive genes involved in oxidative phosphorylation are coordinately downregulated in human diabetes. Nat Genet. 2003;34:267-273.
32. Zelezniak A, Pers TH, Soares S, Patti ME, Patil KR. Metabolic network topology reveals transcriptional regulatory signatures of type 2 diabetes. PLOS Comput Biol. 2010;6:e1000729.
33. Braissant O, Foufelle F, Scotto C, Dauca M, Wahli W. Differen-tial expression of peroxisome proliferator-activated receptors (PPARs): tissue distribution of PPAR-α, -β and -γ in adult rat. Endocrinology. 1996;137:354-366.
34. Mukherjee R, Jow L, Croston GE, Paterniti JR Jr. Identification, characterization, and tissue distribution of human peroxisome proliferator-activated receptor (PPAR) isoforms PPAR-γ2 ver-sus PPARγ1 and activation with retinoid X receptor agonists and antagonists. J Biol Chem. 1997;272:8071-8076.
35. Kume S, Uzu T, Isshiki K, Koya D. Peroxisome proliferator-activated receptors in diabetic nephropathy. PPAR Res. 2008;2008:879523. doi:10.1155/2008/879523.
Accepted: December 27, 2010


