Embed Size (px)
Citation preview
Geochemical processes controlling the groundwaterquality in lower Palar river basin, southern India
M Senthilkumar1 and L Elango
2,∗
1Central Ground Water Board, Chennai 600 090, India.2Department of Geology, Anna University, Chennai 600 025, India.
∗Corresponding author. e-mail: [email protected] [email protected]
Hydrogeochemical study of groundwater was carried out in a part of the lower Palar river basin, southernIndia to determine the geochemical processes controlling the groundwater quality. Thirty-nine ground-water samples were collected from the study area and analysed for pH, Eh, EC, Ca, Mg, Na, K, HCO3,CO3, Cl and SO4. The analysed parameters of the groundwater in the study area were found to be wellwithin the safe range in general with respect to the Bureau of Indian Standards for drinking water exceptfor few locations. The results of these analyses were used to identify the geochemical processes that aretaking place in this region. Cation exchange and silicate weathering are the important processes control-ling the major ion distribution of the study area. Mass balance reaction model NETPATH was used toassess the ion exchange processes. High concentration of Ca in groundwater of the study area is due tothe release of Ca by aquifer material and adsorption of Na due to ion exchange processes. Groundwaterof the study area is suitable for drinking and irrigation purposes except for few locations.
1. Introduction
Groundwater is the major source of fresh water,which is widely used for domestic, industrial andagricultural purposes in most parts of the world. Itis a replenishable resource and has inherent advan-tages over the surface water as it is comparativelypure, less evaporation loss, wide distribution, etc.The chemistry of groundwater is mainly controlledby the geochemical reactions that take place alongthe direction of flow. It is necessary to identifythese geochemical reactions in the aquifer in orderto assess the distribution of major ion chemistryof the region (Fisher and Mullican 1997; Rosen andJones 1998; Mohan et al. 2000; Satyanarayananet al. 2007; Reddy et al. 2010; Reddy and Kumar2010; Tirumalesh et al. 2010; Raju et al. 2011).Studying the seasonal and temporal variation ofvarious ions in groundwater helps to identify the
major processes controlling the composition ofgroundwater in a particular area (Laluraj andGopinath 2006; Raju 2006; Rao 2006; Andrade andStigter 2011; Rouxel et al. 2011). Apart from this,human activities such as contamination due to in-dustrial effluents, landfills, application of fertilizers,etc., may also play a role in influencing the ground-water composition (Mazari and MacKay 1993;Kumaresan and Riyazuddin 2006; Li et al. 2006;Al-Sabahi et al. 2009; Brindha et al. 2010; Aghazadehand Mogaddam 2011; Bakis and Tuncan 2011;Vijay et al. 2011; Brindha and Elango 2012).Knowledge on groundwater quality of any area isessential for managing and sustaining the resourcefor various uses. With this motive, several re-searchers around the globe have given importanceto groundwater quality (Gowd 2005; Ozcan et al.2007; Arumugam and Elangovan 2009; Raju et al.2009; Belkhiri et al. 2010; Dar et al. 2011). This
Keywords. Hydrogeochemistry; ion exchange; silicate weathering; NETPATH; geochemical model.
J. Earth Syst. Sci. 122, No. 2, April 2013, pp. 419–432c© Indian Academy of Sciences 419
420 M Senthilkumar and L Elango
study was carried out in a part of the lower Palarriver basin, southern India with the objectivesof determining the hydrogeochemical nature ofthe groundwater in this region, to identify thegeochemical processes responsible for the presentstatus of groundwater quality and to assess thesuitability of groundwater for drinking and irriga-tional purposes. This region is mainly dependentupon groundwater for irrigation, domestic anddrinking needs and the groundwater quality ofthis area for the above-mentioned purposes havenot been identified earlier.
2. Study area
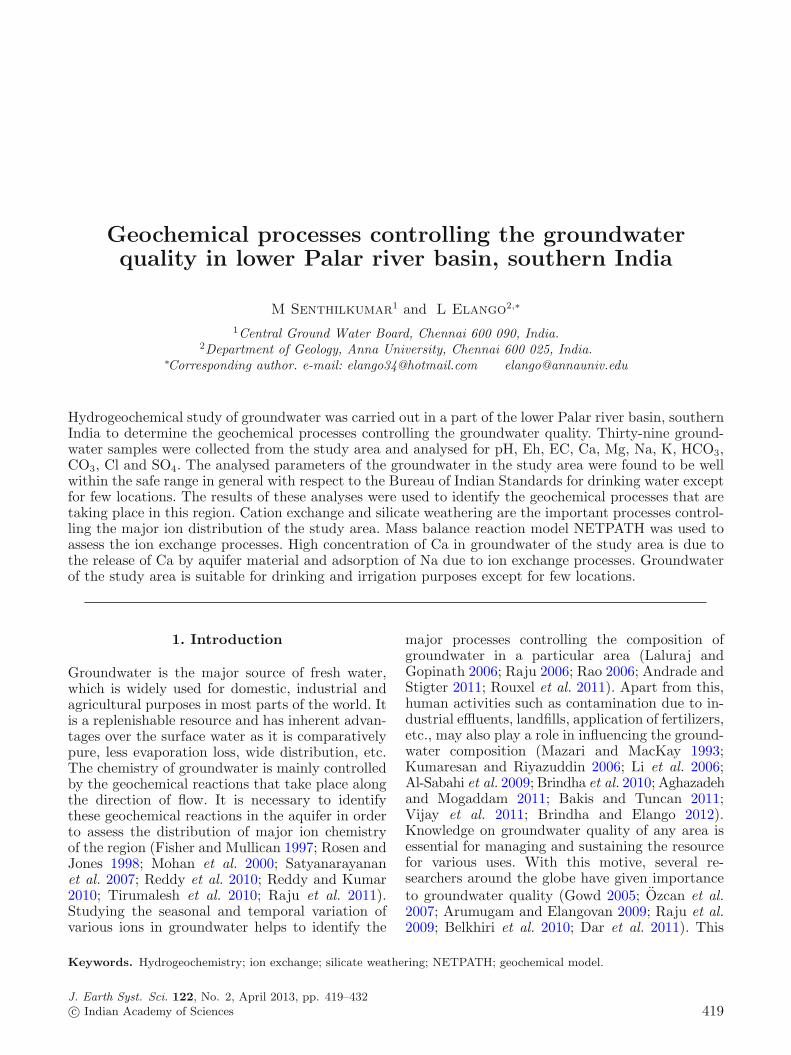
A part of the lower Palar river basin, Tamil Nadu,India was considered for this study. It is located75 km south of Chennai (formerly Madras) and cov-ers an area of 392 km2 (figure 1). The eastern sideof this area is bounded by the Bay of Bengal. Thisarea enjoys sub-tropical monsoon climate withJanuary and February as the dry periods, Marchto May as summer period, followed by the mon-soon period. The maximum temperature in thisarea is about 42◦C during the months of May and
June and the minimum temperature is about 21◦Crecorded during the months of December and Jan-uary. The southwest monsoon (June–September),the northeast monsoon (October–December) andthe transition period contribute 40%, 51% and 9%respectively, of the total annual rainfall (1167 mm/year) in the study area. This area is more or lessbisected into two halves by the Palar river whichis a seasonal river and flows during the monthsof November, December and January. Numerousreservoirs are present in the depressed parts of theundulating topography of the study area.
3. Hydrogeology
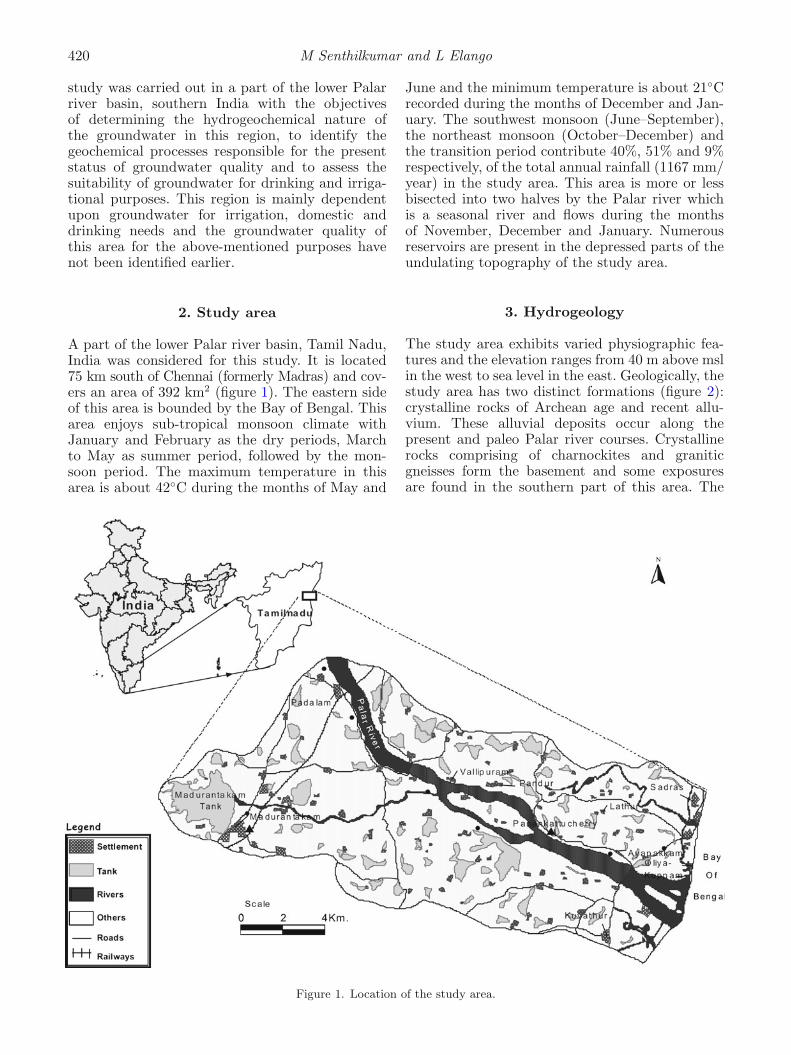
The study area exhibits varied physiographic fea-tures and the elevation ranges from 40 m above mslin the west to sea level in the east. Geologically, thestudy area has two distinct formations (figure 2):crystalline rocks of Archean age and recent allu-vium. These alluvial deposits occur along thepresent and paleo Palar river courses. Crystallinerocks comprising of charnockites and graniticgneisses form the basement and some exposuresare found in the southern part of this area. The
Figure 1. Location of the study area.
Geochemical processes controlling the groundwater quality 421
Figure 2. Geology of the study area.
alluvium and weathered crystalline charnockitesfunction as an aquifer system. The alluvium con-sists of sand and interlaying clay lenses. Alluviumoccasionally contains calcite and dolomite in theform of evaporates. The clays are characterisedby montmorillonite, kaolinite and illite. Ground-water occurs in unconfined condition in both thealluvial and underlying weathered rocks. Alluviumoccurring in the upper part is characterised bysand, gravel and sandy clay, with the thicknessranging from 1 m at the northern and southernboundaries to 30 m along the river. The hydraulicconductivity of this alluvium ranges from 20 to68 m/day and the specific yield value ranges from0.037 to 0.18 which are derived from pumping testcarried out in the alluvial deposits (PWD 2000).The lower layer is characterised by weathered crys-talline rocks. The thickness of the weathered layervaries from 0 to 7 m. The hydraulic conductiv-ity of this layer ranges from 0.5 to 12 m/day, andtransmissivity varies from 10 to 80 m2/day (PWD2000).
4. Methodology
4.1 Sampling and analysis
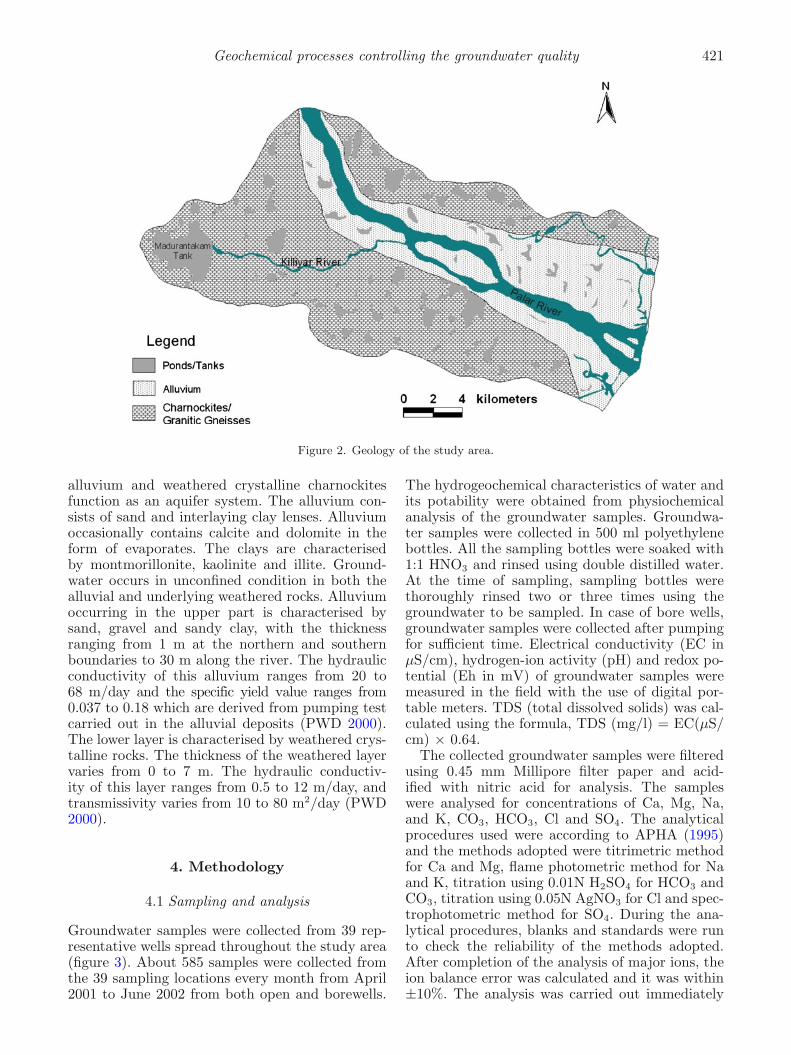
Groundwater samples were collected from 39 rep-resentative wells spread throughout the study area(figure 3). About 585 samples were collected fromthe 39 sampling locations every month from April2001 to June 2002 from both open and borewells.
The hydrogeochemical characteristics of water andits potability were obtained from physiochemicalanalysis of the groundwater samples. Groundwa-ter samples were collected in 500 ml polyethylenebottles. All the sampling bottles were soaked with1:1 HNO3 and rinsed using double distilled water.At the time of sampling, sampling bottles werethoroughly rinsed two or three times using thegroundwater to be sampled. In case of bore wells,groundwater samples were collected after pumpingfor sufficient time. Electrical conductivity (EC inμS/cm), hydrogen-ion activity (pH) and redox po-tential (Eh in mV) of groundwater samples weremeasured in the field with the use of digital por-table meters. TDS (total dissolved solids) was cal-culated using the formula, TDS (mg/l) = EC(μS/cm) × 0.64.
The collected groundwater samples were filteredusing 0.45 mm Millipore filter paper and acid-ified with nitric acid for analysis. The sampleswere analysed for concentrations of Ca, Mg, Na,and K, CO3, HCO3, Cl and SO4. The analyticalprocedures used were according to APHA (1995)and the methods adopted were titrimetric methodfor Ca and Mg, flame photometric method for Naand K, titration using 0.01N H2SO4 for HCO3 andCO3, titration using 0.05N AgNO3 for Cl and spec-trophotometric method for SO4. During the ana-lytical procedures, blanks and standards were runto check the reliability of the methods adopted.After completion of the analysis of major ions, theion balance error was calculated and it was within±10%. The analysis was carried out immediately
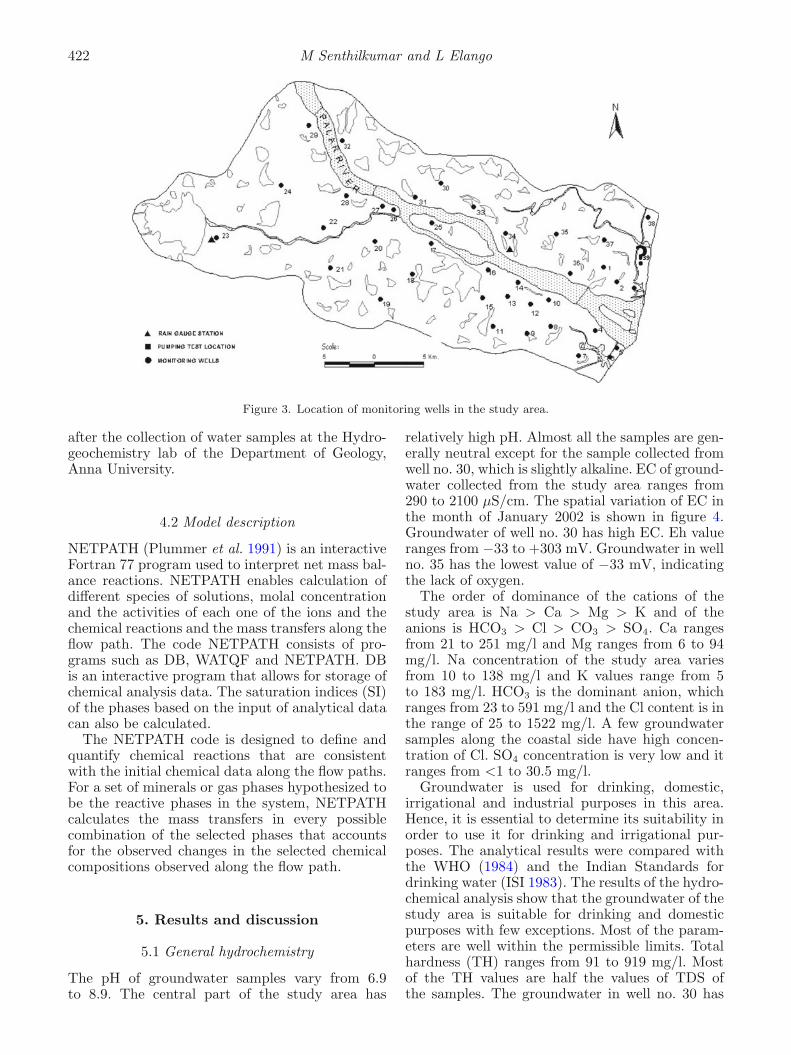
422 M Senthilkumar and L Elango
Figure 3. Location of monitoring wells in the study area.
after the collection of water samples at the Hydro-geochemistry lab of the Department of Geology,Anna University.
4.2 Model description
NETPATH (Plummer et al. 1991) is an interactiveFortran 77 program used to interpret net mass bal-ance reactions. NETPATH enables calculation ofdifferent species of solutions, molal concentrationand the activities of each one of the ions and thechemical reactions and the mass transfers along theflow path. The code NETPATH consists of pro-grams such as DB, WATQF and NETPATH. DBis an interactive program that allows for storage ofchemical analysis data. The saturation indices (SI)of the phases based on the input of analytical datacan also be calculated.
The NETPATH code is designed to define andquantify chemical reactions that are consistentwith the initial chemical data along the flow paths.For a set of minerals or gas phases hypothesized tobe the reactive phases in the system, NETPATHcalculates the mass transfers in every possiblecombination of the selected phases that accountsfor the observed changes in the selected chemicalcompositions observed along the flow path.
5. Results and discussion
5.1 General hydrochemistry
The pH of groundwater samples vary from 6.9to 8.9. The central part of the study area has
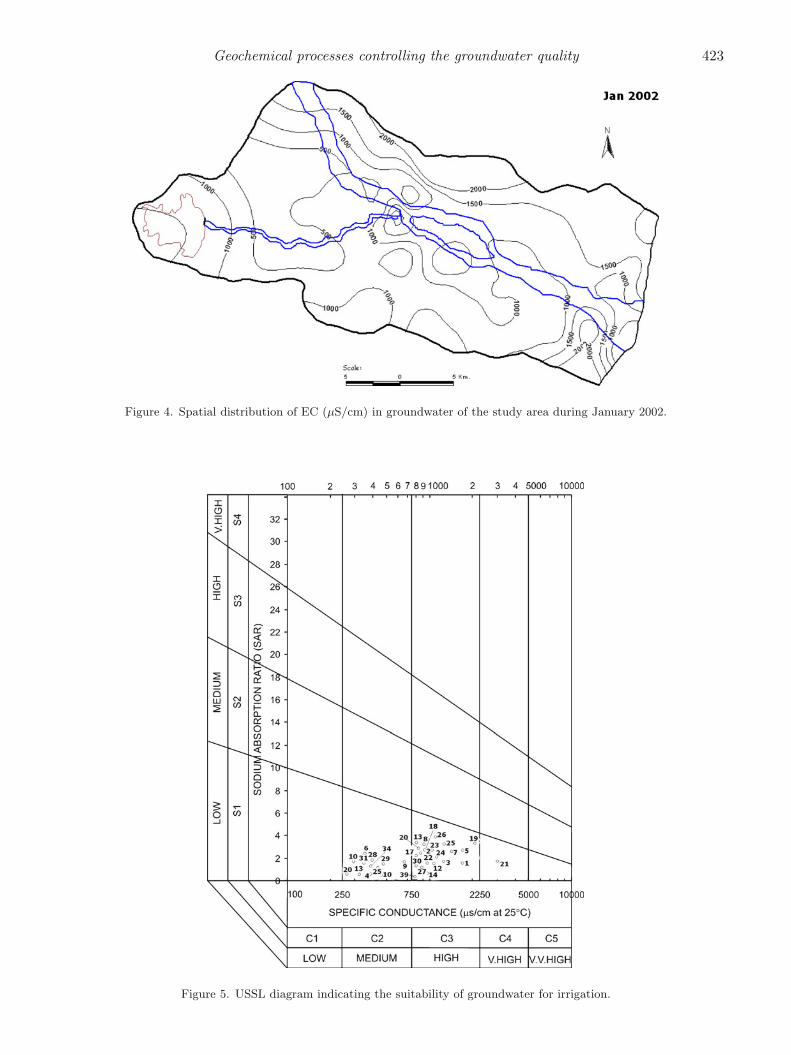
relatively high pH. Almost all the samples are gen-erally neutral except for the sample collected fromwell no. 30, which is slightly alkaline. EC of ground-water collected from the study area ranges from290 to 2100 μS/cm. The spatial variation of EC inthe month of January 2002 is shown in figure 4.Groundwater of well no. 30 has high EC. Eh valueranges from −33 to +303 mV. Groundwater in wellno. 35 has the lowest value of −33 mV, indicatingthe lack of oxygen.
The order of dominance of the cations of thestudy area is Na > Ca > Mg > K and of theanions is HCO3 > Cl > CO3 > SO4. Ca rangesfrom 21 to 251 mg/l and Mg ranges from 6 to 94mg/l. Na concentration of the study area variesfrom 10 to 138 mg/l and K values range from 5to 183 mg/l. HCO3 is the dominant anion, whichranges from 23 to 591 mg/l and the Cl content is inthe range of 25 to 1522 mg/l. A few groundwatersamples along the coastal side have high concen-tration of Cl. SO4 concentration is very low and itranges from <1 to 30.5 mg/l.
Groundwater is used for drinking, domestic,irrigational and industrial purposes in this area.Hence, it is essential to determine its suitability inorder to use it for drinking and irrigational pur-poses. The analytical results were compared withthe WHO (1984) and the Indian Standards fordrinking water (ISI 1983). The results of the hydro-chemical analysis show that the groundwater of thestudy area is suitable for drinking and domesticpurposes with few exceptions. Most of the param-eters are well within the permissible limits. Totalhardness (TH) ranges from 91 to 919 mg/l. Mostof the TH values are half the values of TDS ofthe samples. The groundwater in well no. 30 has
Geochemical processes controlling the groundwater quality 423
Figure 4. Spatial distribution of EC (μS/cm) in groundwater of the study area during January 2002.
Figure 5. USSL diagram indicating the suitability of groundwater for irrigation.
424 M Senthilkumar and L Elango
the maximum value of TH of 919 mg/l. TH of thegroundwater samples vary between hard to mod-erate with few samples located in well nos. 5, 30,36 and 17 falling under the very hard category.Hardness has no known adverse effect on health,but it prevents formation of lather with soap. Italso increases the boiling point of water. The TDSand EC values exceed permissible limit in somesites of the study area. The Cl concentration inthe groundwater samples of the study area is wellwithin the safe range except in few locations such
as well nos. 30, 5 and 29 where it exceeds thepermissible limit.
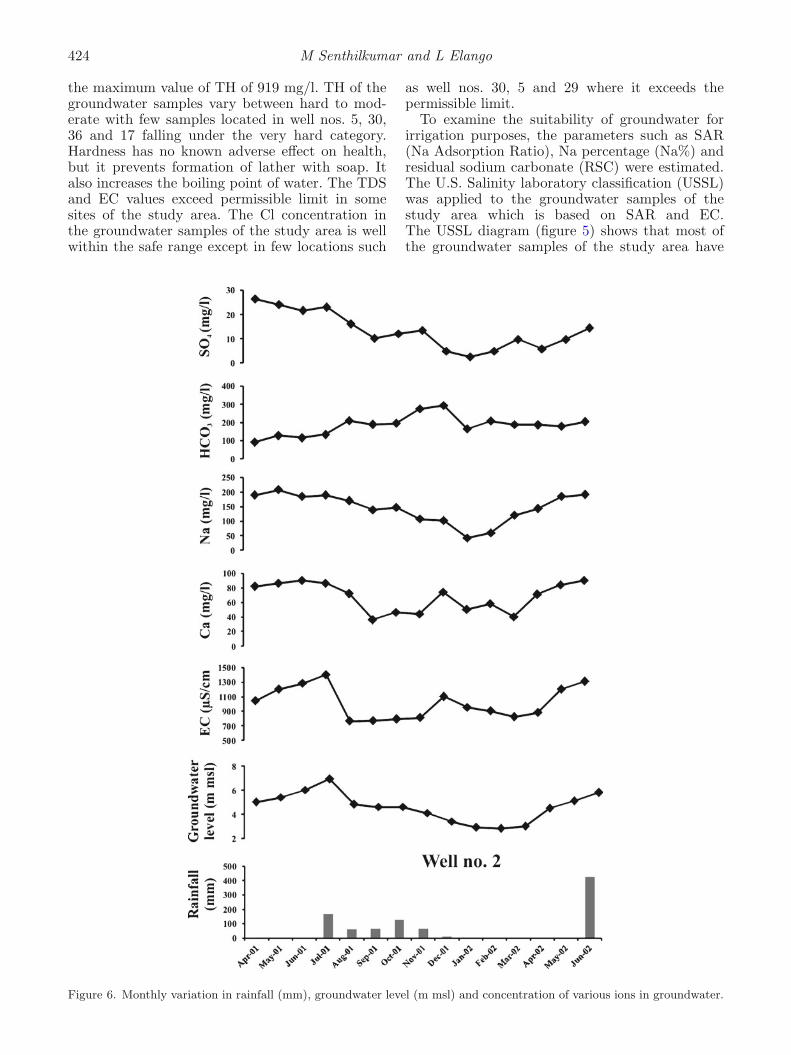
To examine the suitability of groundwater forirrigation purposes, the parameters such as SAR(Na Adsorption Ratio), Na percentage (Na%) andresidual sodium carbonate (RSC) were estimated.The U.S. Salinity laboratory classification (USSL)was applied to the groundwater samples of thestudy area which is based on SAR and EC.The USSL diagram (figure 5) shows that most ofthe groundwater samples of the study area have
Figure 6. Monthly variation in rainfall (mm), groundwater level (m msl) and concentration of various ions in groundwater.
Geochemical processes controlling the groundwater quality 425
Figure 7. Piper trilinear diagram indicating the groundwater type.
426 M Senthilkumar and L Elango
high salinity and low Na content (C3-S1) and fewsamples have medium salinity and low Na ionexchange (C2-S1). Groundwater of both the cate-gories C2-S1 and C3-S1 can be used for irrigationon almost all soils, with a little danger of develop-ment of harmful level of exchangeable Na in the C3-S1 category. Only one groundwater sample location(well no. 30) of the study area falls in the categoryof very high salinity and low Na content (C4-S1).The Na% in the study area ranges from 9% to 67%.As per the BIS standards, maximum of 60% Na isrecommended for irrigation purposes. Out of the39 groundwater samples, eight groundwater sam-ples have Na percentage higher than the prescribedlimit for irrigation.
Most of the groundwater samples of the studyarea have RSC values ranging from safe to mod-erate class. A high value of RSC in groundwaterleads to increase in the adsorption of Na on soil(Eaton 1950). Groundwaters of these classes aresuitable for irrigation. Few groundwater samples ofthe study area have RSC values above 4.5 meq/l.
Monthly variations (figure 6) of groundwater ionicconcentration of this area indicate that rainfallis the major source for variations in groundwaterchemistry. In many of the wells the concentrationof ions is found to increase immediately after therise in groundwater level. This is due to the flush-ing of salts deposited due to evaporation in the
upper zones during the preceding dry season asreported by Elango (1992).
5.2 Hydrochemical facies
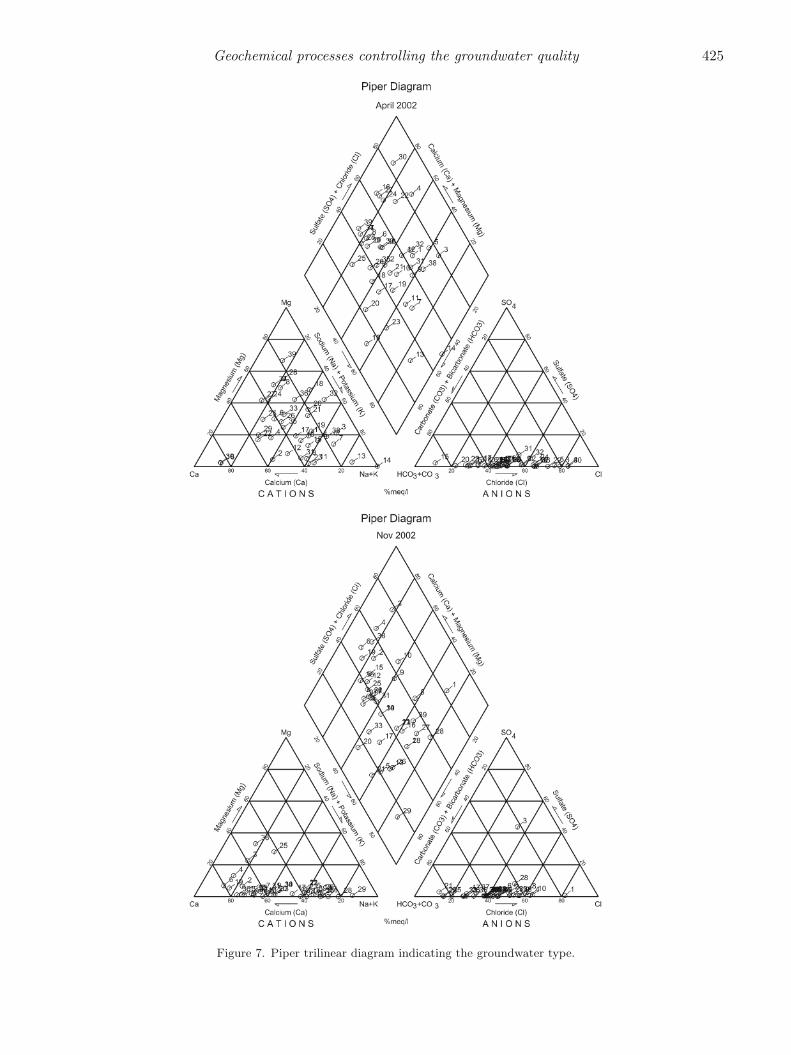
Piper trilinear plot prepared with the hydrochem-ical results of groundwater collected during April2002 and November 2002 apparently illustrates dis-tinct hydrochemical facies (figure 7). Four hydro-chemical facies have been identified based on themajor ion chemistry of the groundwater of thisarea, of which (i) Ca–Mg–HCO3, and (ii) Na–K–HCO3 are the major facies. Few groundwatersamples of the coastal area show Na–Cl faciesduring the summer period (April). But thesesamples gradually get diluted to Ca–Mg–HCO3 orNa–K–HCO3 facies with the monsoon.
5.3 Geochemical processes
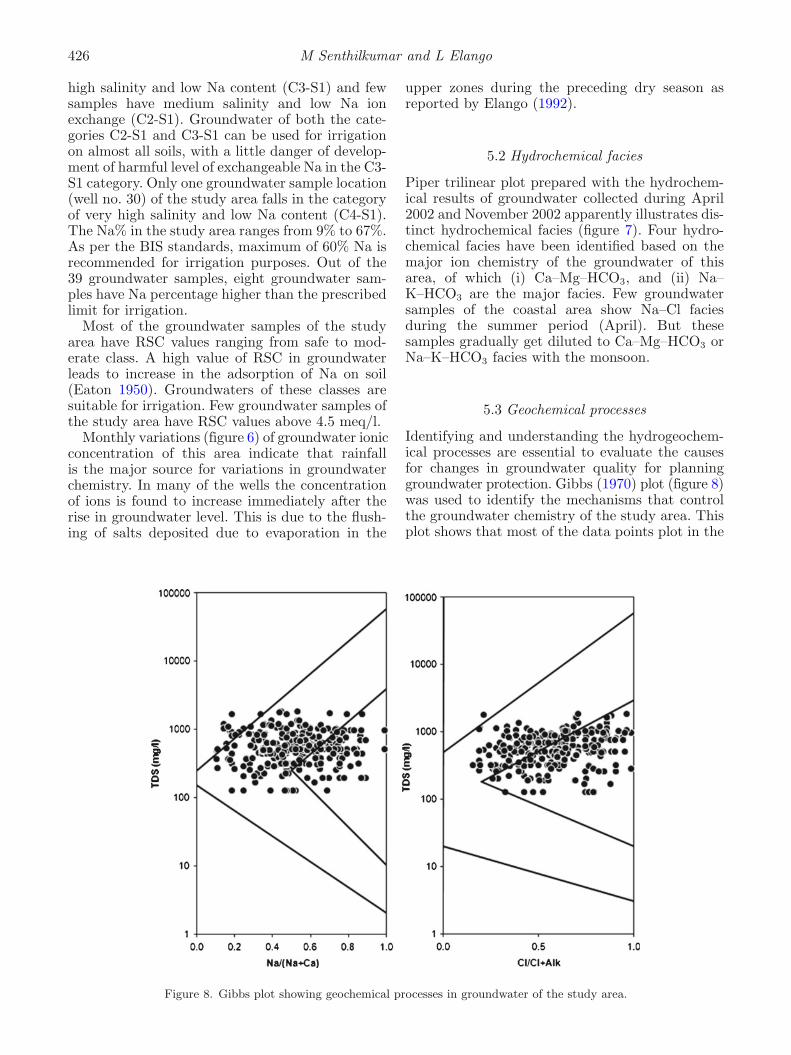
Identifying and understanding the hydrogeochem-ical processes are essential to evaluate the causesfor changes in groundwater quality for planninggroundwater protection. Gibbs (1970) plot (figure 8)was used to identify the mechanisms that controlthe groundwater chemistry of the study area. Thisplot shows that most of the data points plot in the
Figure 8. Gibbs plot showing geochemical processes in groundwater of the study area.
Geochemical processes controlling the groundwater quality 427
rock dominance zone except a few in the evapora-tion zone which indicate that interaction betweenaquifer material and water is the major processcontrolling the groundwater chemistry of this area.
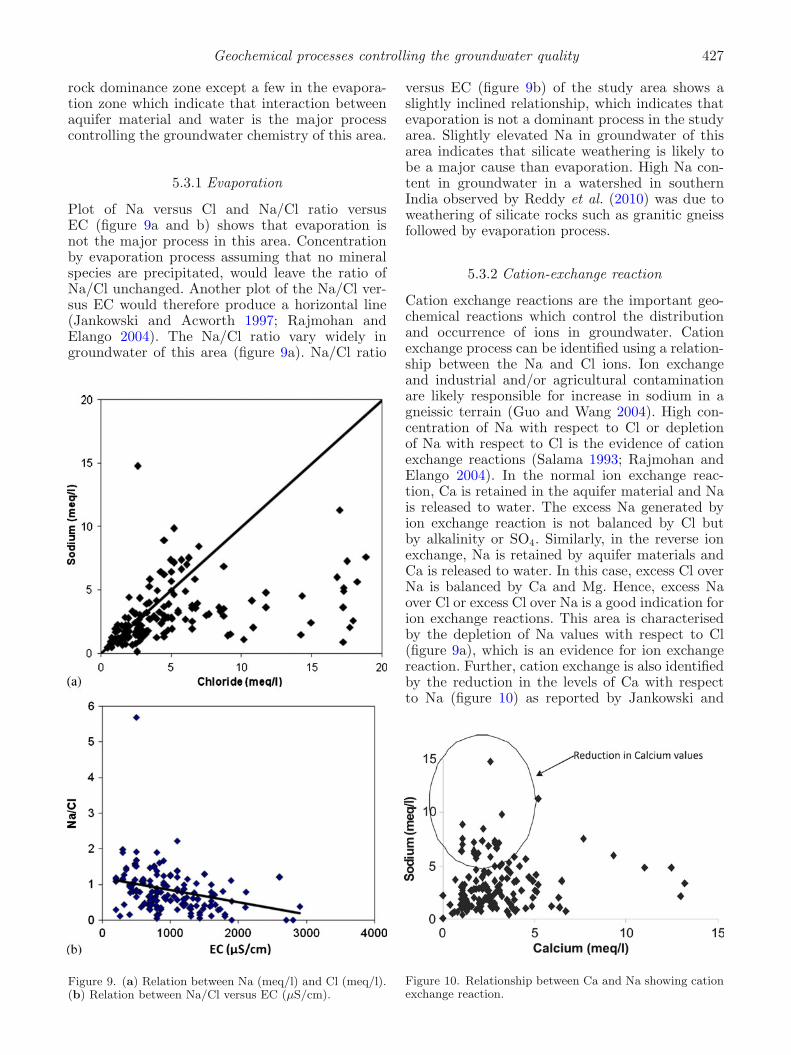
5.3.1 Evaporation
Plot of Na versus Cl and Na/Cl ratio versusEC (figure 9a and b) shows that evaporation isnot the major process in this area. Concentrationby evaporation process assuming that no mineralspecies are precipitated, would leave the ratio ofNa/Cl unchanged. Another plot of the Na/Cl ver-sus EC would therefore produce a horizontal line(Jankowski and Acworth 1997; Rajmohan andElango 2004). The Na/Cl ratio vary widely ingroundwater of this area (figure 9a). Na/Cl ratio
Figure 9. (a) Relation between Na (meq/l) and Cl (meq/l).(b) Relation between Na/Cl versus EC (μS/cm).
versus EC (figure 9b) of the study area shows aslightly inclined relationship, which indicates thatevaporation is not a dominant process in the studyarea. Slightly elevated Na in groundwater of thisarea indicates that silicate weathering is likely tobe a major cause than evaporation. High Na con-tent in groundwater in a watershed in southernIndia observed by Reddy et al. (2010) was due toweathering of silicate rocks such as granitic gneissfollowed by evaporation process.
5.3.2 Cation-exchange reaction
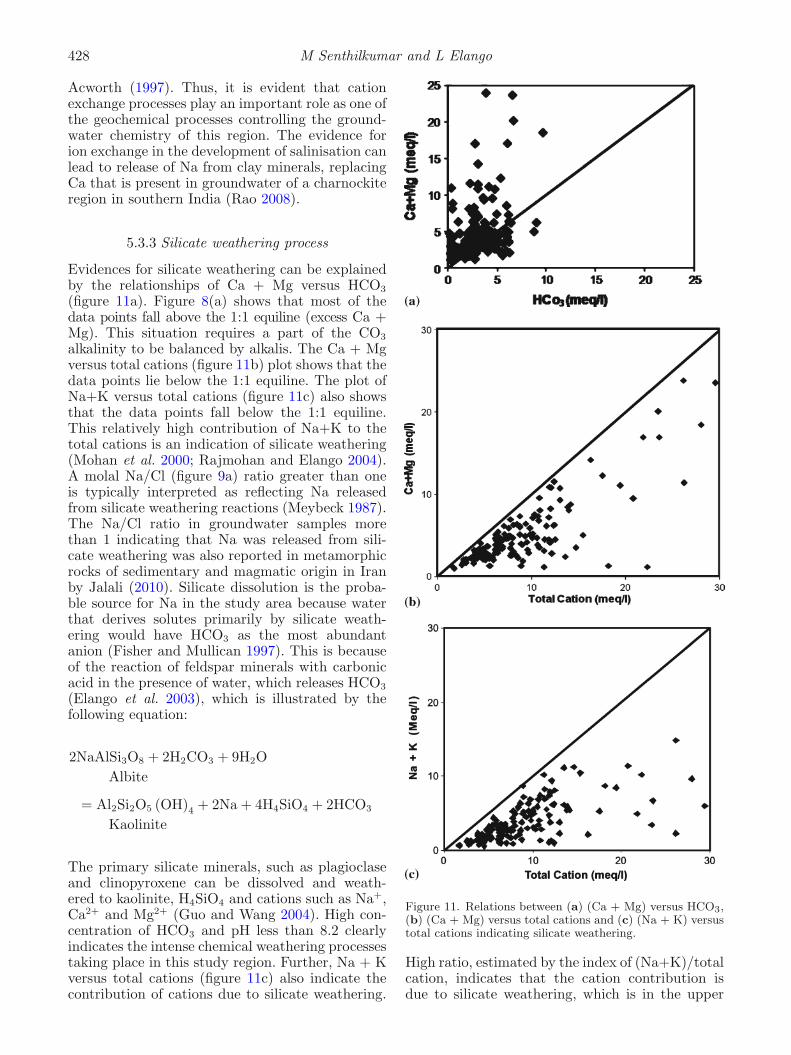
Cation exchange reactions are the important geo-chemical reactions which control the distributionand occurrence of ions in groundwater. Cationexchange process can be identified using a relation-ship between the Na and Cl ions. Ion exchangeand industrial and/or agricultural contaminationare likely responsible for increase in sodium in agneissic terrain (Guo and Wang 2004). High con-centration of Na with respect to Cl or depletionof Na with respect to Cl is the evidence of cationexchange reactions (Salama 1993; Rajmohan andElango 2004). In the normal ion exchange reac-tion, Ca is retained in the aquifer material and Nais released to water. The excess Na generated byion exchange reaction is not balanced by Cl butby alkalinity or SO4. Similarly, in the reverse ionexchange, Na is retained by aquifer materials andCa is released to water. In this case, excess Cl overNa is balanced by Ca and Mg. Hence, excess Naover Cl or excess Cl over Na is a good indication forion exchange reactions. This area is characterisedby the depletion of Na values with respect to Cl(figure 9a), which is an evidence for ion exchangereaction. Further, cation exchange is also identifiedby the reduction in the levels of Ca with respectto Na (figure 10) as reported by Jankowski and
Figure 10. Relationship between Ca and Na showing cationexchange reaction.
428 M Senthilkumar and L Elango
Acworth (1997). Thus, it is evident that cationexchange processes play an important role as one ofthe geochemical processes controlling the ground-water chemistry of this region. The evidence forion exchange in the development of salinisation canlead to release of Na from clay minerals, replacingCa that is present in groundwater of a charnockiteregion in southern India (Rao 2008).
5.3.3 Silicate weathering process
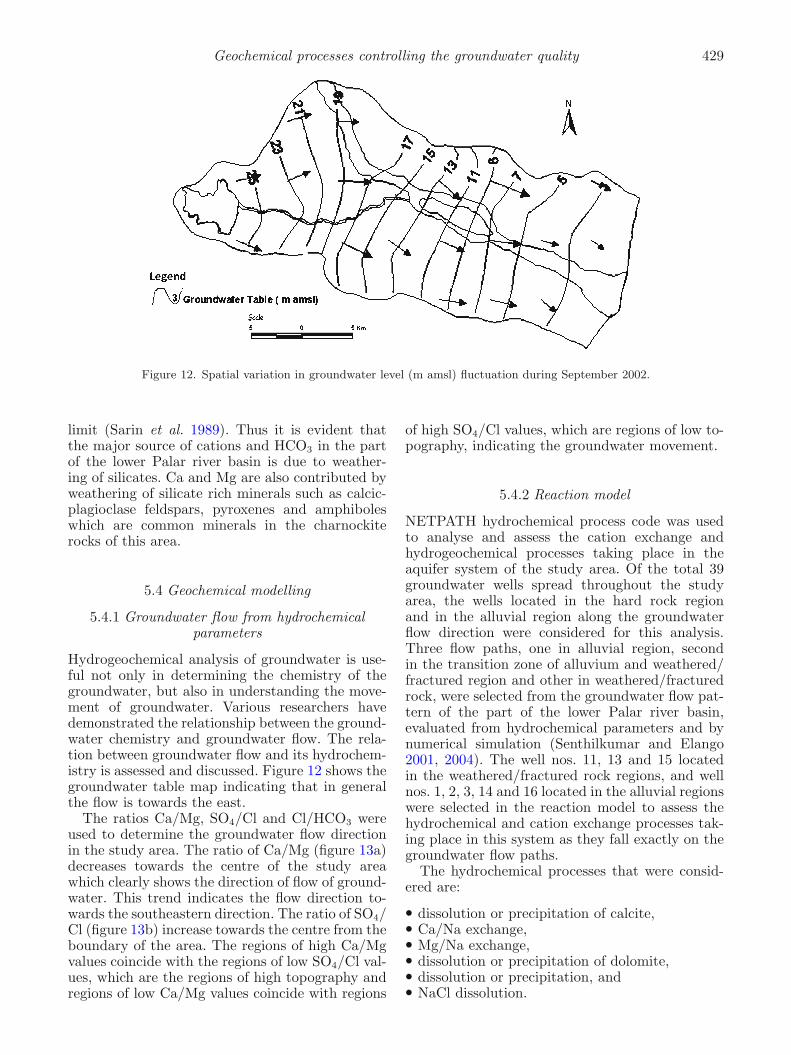
Evidences for silicate weathering can be explainedby the relationships of Ca + Mg versus HCO3
(figure 11a). Figure 8(a) shows that most of thedata points fall above the 1:1 equiline (excess Ca +Mg). This situation requires a part of the CO3
alkalinity to be balanced by alkalis. The Ca + Mgversus total cations (figure 11b) plot shows that thedata points lie below the 1:1 equiline. The plot ofNa+K versus total cations (figure 11c) also showsthat the data points fall below the 1:1 equiline.This relatively high contribution of Na+K to thetotal cations is an indication of silicate weathering(Mohan et al. 2000; Rajmohan and Elango 2004).A molal Na/Cl (figure 9a) ratio greater than oneis typically interpreted as reflecting Na releasedfrom silicate weathering reactions (Meybeck 1987).The Na/Cl ratio in groundwater samples morethan 1 indicating that Na was released from sili-cate weathering was also reported in metamorphicrocks of sedimentary and magmatic origin in Iranby Jalali (2010). Silicate dissolution is the proba-ble source for Na in the study area because waterthat derives solutes primarily by silicate weath-ering would have HCO3 as the most abundantanion (Fisher and Mullican 1997). This is becauseof the reaction of feldspar minerals with carbonicacid in the presence of water, which releases HCO3
(Elango et al. 2003), which is illustrated by thefollowing equation:
2NaAlSi3O8 + 2H2CO3 + 9H2OAlbite
= Al2Si2O5 (OH)4 + 2Na + 4H4SiO4 + 2HCO3
Kaolinite
The primary silicate minerals, such as plagioclaseand clinopyroxene can be dissolved and weath-ered to kaolinite, H4SiO4 and cations such as Na+,Ca2+ and Mg2+ (Guo and Wang 2004). High con-centration of HCO3 and pH less than 8.2 clearlyindicates the intense chemical weathering processestaking place in this study region. Further, Na + Kversus total cations (figure 11c) also indicate thecontribution of cations due to silicate weathering.
Figure 11. Relations between (a) (Ca + Mg) versus HCO3,(b) (Ca + Mg) versus total cations and (c) (Na + K) versustotal cations indicating silicate weathering.
High ratio, estimated by the index of (Na+K)/totalcation, indicates that the cation contribution isdue to silicate weathering, which is in the upper
Geochemical processes controlling the groundwater quality 429
Figure 12. Spatial variation in groundwater level (m amsl) fluctuation during September 2002.
limit (Sarin et al. 1989). Thus it is evident thatthe major source of cations and HCO3 in the partof the lower Palar river basin is due to weather-ing of silicates. Ca and Mg are also contributed byweathering of silicate rich minerals such as calcic-plagioclase feldspars, pyroxenes and amphiboleswhich are common minerals in the charnockiterocks of this area.
5.4 Geochemical modelling
5.4.1 Groundwater flow from hydrochemicalparameters
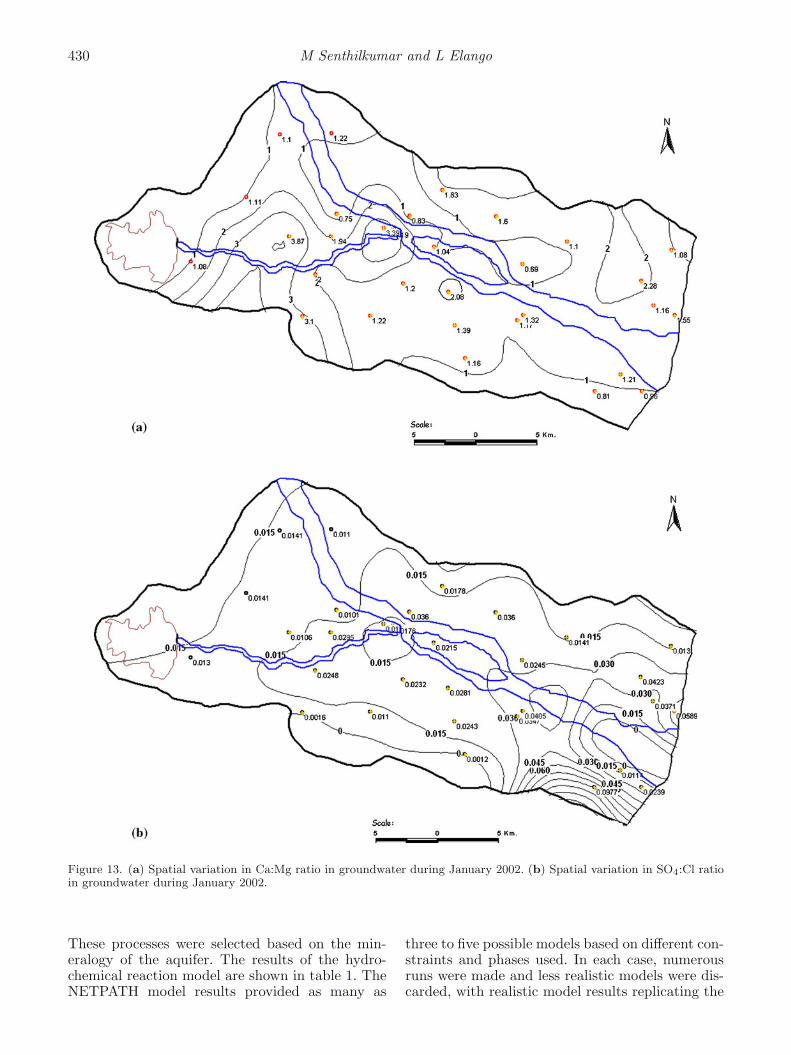
Hydrogeochemical analysis of groundwater is use-ful not only in determining the chemistry of thegroundwater, but also in understanding the move-ment of groundwater. Various researchers havedemonstrated the relationship between the ground-water chemistry and groundwater flow. The rela-tion between groundwater flow and its hydrochem-istry is assessed and discussed. Figure 12 shows thegroundwater table map indicating that in generalthe flow is towards the east.
The ratios Ca/Mg, SO4/Cl and Cl/HCO3 wereused to determine the groundwater flow directionin the study area. The ratio of Ca/Mg (figure 13a)decreases towards the centre of the study areawhich clearly shows the direction of flow of ground-water. This trend indicates the flow direction to-wards the southeastern direction. The ratio of SO4/Cl (figure 13b) increase towards the centre from theboundary of the area. The regions of high Ca/Mgvalues coincide with the regions of low SO4/Cl val-ues, which are the regions of high topography andregions of low Ca/Mg values coincide with regions
of high SO4/Cl values, which are regions of low to-pography, indicating the groundwater movement.
5.4.2 Reaction model
NETPATH hydrochemical process code was usedto analyse and assess the cation exchange andhydrogeochemical processes taking place in theaquifer system of the study area. Of the total 39groundwater wells spread throughout the studyarea, the wells located in the hard rock regionand in the alluvial region along the groundwaterflow direction were considered for this analysis.Three flow paths, one in alluvial region, secondin the transition zone of alluvium and weathered/fractured region and other in weathered/fracturedrock, were selected from the groundwater flow pat-tern of the part of the lower Palar river basin,evaluated from hydrochemical parameters and bynumerical simulation (Senthilkumar and Elango2001, 2004). The well nos. 11, 13 and 15 locatedin the weathered/fractured rock regions, and wellnos. 1, 2, 3, 14 and 16 located in the alluvial regionswere selected in the reaction model to assess thehydrochemical and cation exchange processes tak-ing place in this system as they fall exactly on thegroundwater flow paths.
The hydrochemical processes that were consid-ered are:
• dissolution or precipitation of calcite,• Ca/Na exchange,• Mg/Na exchange,• dissolution or precipitation of dolomite,• dissolution or precipitation, and• NaCl dissolution.
430 M Senthilkumar and L Elango
Figure 13. (a) Spatial variation in Ca:Mg ratio in groundwater during January 2002. (b) Spatial variation in SO4:Cl ratioin groundwater during January 2002.
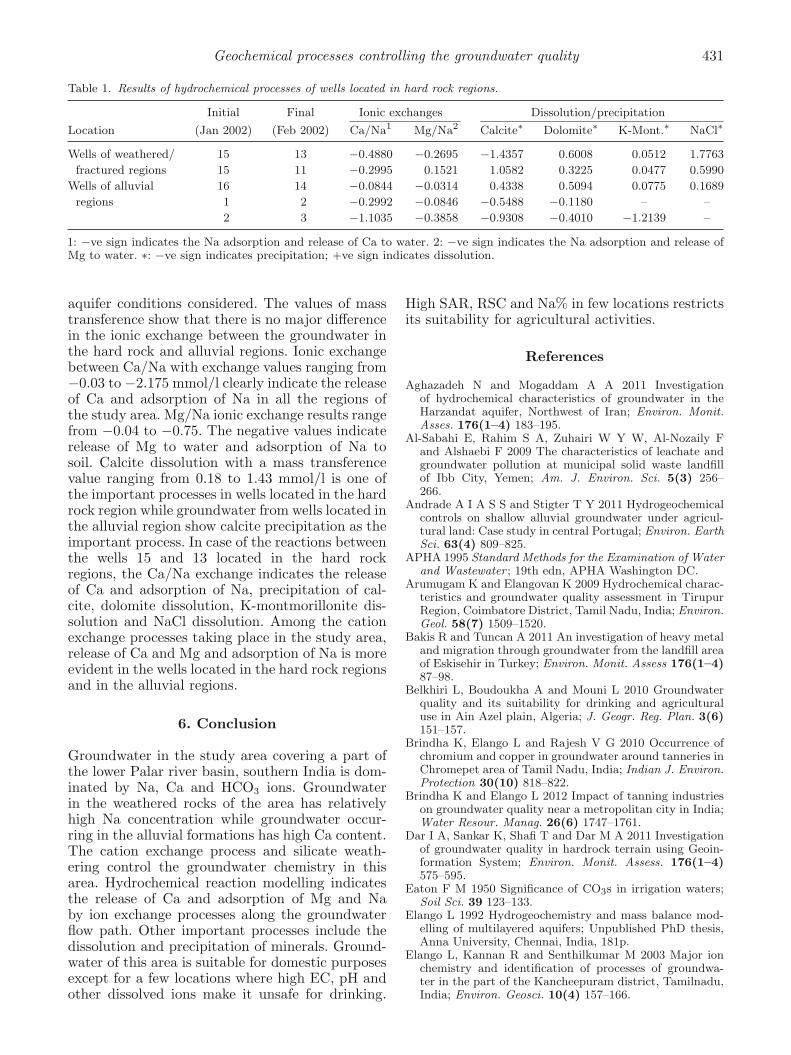
These processes were selected based on the min-eralogy of the aquifer. The results of the hydro-chemical reaction model are shown in table 1. TheNETPATH model results provided as many as
three to five possible models based on different con-straints and phases used. In each case, numerousruns were made and less realistic models were dis-carded, with realistic model results replicating the
Geochemical processes controlling the groundwater quality 431
Table 1. Results of hydrochemical processes of wells located in hard rock regions.
Initial Final Ionic exchanges Dissolution/precipitation
Location (Jan 2002) (Feb 2002) Ca/Na1 Mg/Na2 Calcite∗ Dolomite∗ K-Mont.∗ NaCl∗
Wells of weathered/ 15 13 −0.4880 −0.2695 −1.4357 0.6008 0.0512 1.7763
fractured regions 15 11 −0.2995 0.1521 1.0582 0.3225 0.0477 0.5990
Wells of alluvial 16 14 −0.0844 −0.0314 0.4338 0.5094 0.0775 0.1689
regions 1 2 −0.2992 −0.0846 −0.5488 −0.1180 – –
2 3 −1.1035 −0.3858 −0.9308 −0.4010 −1.2139 –
1: −ve sign indicates the Na adsorption and release of Ca to water. 2: −ve sign indicates the Na adsorption and release ofMg to water. ∗: −ve sign indicates precipitation; +ve sign indicates dissolution.
aquifer conditions considered. The values of masstransference show that there is no major differencein the ionic exchange between the groundwater inthe hard rock and alluvial regions. Ionic exchangebetween Ca/Na with exchange values ranging from−0.03 to −2.175 mmol/l clearly indicate the releaseof Ca and adsorption of Na in all the regions ofthe study area. Mg/Na ionic exchange results rangefrom −0.04 to −0.75. The negative values indicaterelease of Mg to water and adsorption of Na tosoil. Calcite dissolution with a mass transferencevalue ranging from 0.18 to 1.43 mmol/l is one ofthe important processes in wells located in the hardrock region while groundwater from wells located inthe alluvial region show calcite precipitation as theimportant process. In case of the reactions betweenthe wells 15 and 13 located in the hard rockregions, the Ca/Na exchange indicates the releaseof Ca and adsorption of Na, precipitation of cal-cite, dolomite dissolution, K-montmorillonite dis-solution and NaCl dissolution. Among the cationexchange processes taking place in the study area,release of Ca and Mg and adsorption of Na is moreevident in the wells located in the hard rock regionsand in the alluvial regions.
6. Conclusion
Groundwater in the study area covering a part ofthe lower Palar river basin, southern India is dom-inated by Na, Ca and HCO3 ions. Groundwaterin the weathered rocks of the area has relativelyhigh Na concentration while groundwater occur-ring in the alluvial formations has high Ca content.The cation exchange process and silicate weath-ering control the groundwater chemistry in thisarea. Hydrochemical reaction modelling indicatesthe release of Ca and adsorption of Mg and Naby ion exchange processes along the groundwaterflow path. Other important processes include thedissolution and precipitation of minerals. Ground-water of this area is suitable for domestic purposesexcept for a few locations where high EC, pH andother dissolved ions make it unsafe for drinking.
High SAR, RSC and Na% in few locations restrictsits suitability for agricultural activities.
References
Aghazadeh N and Mogaddam A A 2011 Investigationof hydrochemical characteristics of groundwater in theHarzandat aquifer, Northwest of Iran; Environ. Monit.Asses. 176(1–4) 183–195.
Al-Sabahi E, Rahim S A, Zuhairi W Y W, Al-Nozaily Fand Alshaebi F 2009 The characteristics of leachate andgroundwater pollution at municipal solid waste landfillof Ibb City, Yemen; Am. J. Environ. Sci. 5(3) 256–266.
Andrade A I A S S and Stigter T Y 2011 Hydrogeochemicalcontrols on shallow alluvial groundwater under agricul-tural land: Case study in central Portugal; Environ. EarthSci. 63(4) 809–825.
APHA 1995 Standard Methods for the Examination of Waterand Wastewater ; 19th edn, APHA Washington DC.
Arumugam K and Elangovan K 2009 Hydrochemical charac-teristics and groundwater quality assessment in TirupurRegion, Coimbatore District, Tamil Nadu, India; Environ.Geol. 58(7) 1509–1520.
Bakis R and Tuncan A 2011 An investigation of heavy metaland migration through groundwater from the landfill areaof Eskisehir in Turkey; Environ. Monit. Assess 176(1–4)87–98.
Belkhiri L, Boudoukha A and Mouni L 2010 Groundwaterquality and its suitability for drinking and agriculturaluse in Ain Azel plain, Algeria; J. Geogr. Reg. Plan. 3(6)151–157.
Brindha K, Elango L and Rajesh V G 2010 Occurrence ofchromium and copper in groundwater around tanneries inChromepet area of Tamil Nadu, India; Indian J. Environ.Protection 30(10) 818–822.
Brindha K and Elango L 2012 Impact of tanning industrieson groundwater quality near a metropolitan city in India;Water Resour. Manag. 26(6) 1747–1761.
Dar I A, Sankar K, Shafi T and Dar M A 2011 Investigationof groundwater quality in hardrock terrain using Geoin-formation System; Environ. Monit. Assess. 176(1–4)575–595.
Eaton F M 1950 Significance of CO3s in irrigation waters;Soil Sci. 39 123–133.
Elango L 1992 Hydrogeochemistry and mass balance mod-elling of multilayered aquifers; Unpublished PhD thesis,Anna University, Chennai, India, 181p.
Elango L, Kannan R and Senthilkumar M 2003 Major ionchemistry and identification of processes of groundwa-ter in the part of the Kancheepuram district, Tamilnadu,India; Environ. Geosci. 10(4) 157–166.
432 M Senthilkumar and L Elango
Fisher R S and Mullican III W F 1997 Hydrochemical evo-lution of Na–SO4 and Na–Cl groundwater beneath thenorthern Chihuahuan desert, Trans-Pecos, Texas, USA;Hydrogeol. J. 5(2) 4–16.
Gibbs R J 1970 Mechanisms controlling worlds water chem-istry; Science 170 1088–1090.
Gowd S S 2005 Assessment of groundwater quality for drink-ing and irrigation purposes: A case study of Peddavankawatershed, Anantapur District, Andhra Pradesh, India;Environ. Geol. 48 702–712.
Guo H and Wang Y 2004 Hydrogeochemical processes inshallow quaternary aquifers from the northern part of theDatong Basin, China; Appl. Geochem. 19(1) 19–27.
ISI (Indian Standards Institution) 1983 Indian Standardspecification for drinking water, IS 10500.
Jalali M 2010 Groundwater geochemistry in the Alisadr,Hamadan, western Iran; Environ. Monit. Assess.166(1–4) 359–369.
Jankowski J and Acworth R I 1997 Impact of debris-flowdeposits on hydrogeochemical processes and the devel-opment of dryland salinity in the Yass River catchment,New South Wales, Australia; Hydrogeol. J. 5(4) 71–88.
Kumaresan M and Riyazuddin P 2006 Major ion chemistryof environmental samples around sub-urban of Chennaicity; Curr. Sci. 91(12) 1668–1677.
Laluraj C M and Gopinath G 2006 Assessment on seasonalvariation of groundwater quality of phreatic aquifers – Ariver basin system; Environ. Monit. Assess. 117 45–57.
Li X D, Masuda H, Kusakabe M, Yanagisawa F and ZengH A 2006 Degradation of groundwater quality due toanthropogenic sulfur and nitrogen contamination in theSichuan Basin, China; Geochem. J. 40 309–332.
Mazari M and MacKay D M 1993 Potential for groundwa-ter contamination in Mexico City; Environ. Sci. Technol.27(5) 794–802.
Meybeck M 1987 Global chemical weathering of surficialrocks estimated from river dissolved loads; Am. J. Sci.287 401–428.
Mohan R, Singh A K, Tripathi J K and Chowdhary G C 2000Hydrochemistry and quality assessment of groundwater inNaini industrial area, Allahabad district, Uttar Pradesh;J. Geol. Soc. India 55 77–89.
Ozcan H, Ekinci H, Baba A, Kavdır Y, Yuksel O and Yigini Y 2007 Assessment of the water quality of Troia forthe multipurpose usages; Environ. Monit. Assess. 130389–402.
Plummer L N, Prestemon E C and Parkhurst D L 1991 Aninteractive code (NETPATH) for modeling net geochem-ical reactions along a flow path: US Geological SurveyWater Resources Investigations Report 91–4087, 227p.
PWD (Public Works Department) 2000 Groundwater per-spectives: A profile of Kancheepuram district, TamilNadu: Tamil Nadu Public Works Department.
Rajmohan N and Elango L 2004 Identification and evolutionof hydrogeochemical processes in an area of the Palar andCheyyar River Basin, Southern India; Environ. Geol. 4647–61.
Raju N R 2006 Seasonal evaluation of hydro-geochemicalparameters using correlation and regression analysis;Curr. Sci. 91(6) 820–826.
Raju N J, Ram P and Dey S 2009 Groundwater quality inthe Lower Varuna River Basin, Varanasi District, UttarPradesh; J. Geol. Soc. India 73 178–192.
Raju N J, Shukla U K and Ram P 2011 Hydrogeochemistryfor the assessment of groundwater quality in Varanasi: Afast-urbanizing center in Uttar Pradesh, India; Environ.Monit. Assess. 173 279–300.
Rao N S 2006 Seasonal variation of groundwater quality in apart of Guntur District, Andhra Pradesh, India; Environ.Geol. 49 413–429.
Rao N S 2008 Factors controlling the salinity in groundwa-ter in parts of Guntur district, Andhra Pradesh, India;Environ. Monit. Assess. 138(1–3) 327–341.
Reddy A G S and Kumar K N 2010 Identification of thehydrogeochemical processes in groundwater using majorion chemistry: A case study of Penna–Chitravathi riverbasins in southern India; Environ. Monit. Assess. 170365–382.
Reddy A G S, Reddy D V, Rao P N and Prasad K M2010 Hydrogeochemical characterization of fluoride richgroundwater of Wailapalli watershed, Nalgonda district,Andhra Pradesh, India; Environ. Monit. Assess. 171561–577.
Rosen M and Jones S 1998 Controls on the chemicalcomposition of groundwater from alluvial aquifers inthe Wanaka and Wakatipu basins, central Otago, NewZealand; Hydrogeol. J. 6 264–281.
Rouxel M, Molenat J, Ruiz L, Legout C, Faucheux M andGascuel-Odoux C 2011 Seasonal and spatial variation ingroundwater quality along the hillslope of an agriculturalresearch catchment (Western France); Hydrol. Process.25(6) 831–841.
Salama R B 1993 The chemical evolution of groundwater in afirst-order catchment and the process of salt accumulationin the soil profile; J. Hydrol. 143 233–258.
Sarin M M, Krishnaswamy S, Dilli K, Somayajulu B L Kand Moore W S 1989 Major ion chemistry of the Ganga-Brahmaputra river system: Weathering processes andfluxes to the Bay of Bengal; Geochim. Cosmochim. Acta53 997–1009.
Satyanarayanan M, Balaram V, Hussin M S A, JemailiM A R A, Rao T G, Mathur R, Dasaram B and RameshS L 2007 Assessment of groundwater quality in a struc-turally deformed granitic terrain in Hyderabad, India;Environ. Monit. Assess. 131 117–127.
Senthilkumar M and Elango L 2001 Numerical simulationof groundwater flow regime in a Part of the Lower PalarRiver Basin, southern India; In: Modelling in Hydroge-ology (eds) Elango L and Jayakumar R, Allied Publ.270p.
Senthilkumar M and Elango L 2004 Three-dimensionalmathematical model to simulate groundwater flow in thelower Palar River basin, southern India; Hydrogeol. J.12(4) 197–208.
Tirumalesh K, Shivanna K, Sriraman A K and Tyagi A K2010 Assessment of quality and geochemical processesoccurring in groundwaters near central air condition-ing plant site in Trombay, Maharashtra, India; Environ.Monit. Assess. 163(1–4) 171–184.
Vijay R, Khobragade P and Mohapatra P K 2011 Assess-ment of groundwater quality in Puri City, India: Animpact of anthropogenic activities; Environ. Monit.Assess. 177(1–4) 409–418.
WHO (World Health Organisation) 1984 Guidelines fordrinking water quality; VI, Recommendation, WorldHealth Organisation, Geneva, 130p.
MS received 1 September 2011; revised 28 September 2012; accepted 7 October 2012