Embed Size (px)
Citation preview

Growing incomes, growing people in nineteenth-century Tasmania1
Kris Inwood, University of Guelph Hamish Maxwell-Stewart, University of Tasmania, Deborah Oxley, University of Oxford Jim Stankovich, University of Tasmania
The earliest measures of well-being for Europeans born in the Pacific region are heights and wages in Tasmania. Evidence of rising stature in middle decades of the nineteenth-century survives multiple checks for measurement, compositional and selection bias. The challenge to health and stature seen in other settler societies (the ‘antebellum paradox’) is not visible here. We sketch an interpretation for the simultaneous rise of Tasmanian stature and per capita GDP based on relatively slow population growth and urbanization, a decline in food cost per family member available from a worker’s wage, and early recognition of the importance of public health.
Keywords: Stature, standard of living, growth, inequality, Australia, Tasmania, prisons, public health, nutrition, anthropometric, World War One, selection bias JEL Codes: J1, J33, N15, N35
1 The authors thank participants at the 2014 Asia Pacific Economic and Business History conference, 2014 Social Science History conference and the 2014 Heights and Economic Development Workshop at the Australian National University. Helpful comments from Bernard Harris, Rebecca Kippen, David Merrett, Stephen Morgan, Evan Roberts, Martin Shanahan, Richard Steckel and the editor and referees of this journal are gratefully acknowledged. Trudy Cowley and Chelsea Jack provide invaluable research assistance. Funding support came from the Australian Research Council under grant DP140102231, the Social Sciences and Humanities Research Council of Canada under grant SRG #41020092342 and the University of Tasmania.
INTRODUCTION
Emigration from Europe during the nineteenth century typically was a move to a
‘healthier’ environment in which food was relatively and often absolutely less expensive,
fuel and building materials were more abundant, population densities were lower and
industrialization less advanced. British expansion into Australasia was no exception, as
was recognized from its earliest days.
‘The class of inhabitants that have been born in the colony affords a remarkable exception to the moral and physical character of their parents: they are generally tall in person, and slender in their limbs; of fair complexion, and small features. They are capable of undergoing more fatigue, and are less exhausted by labour than native Europeans …’2
A recent theme in the literature, however, points to interruptions in the colonial
success story in many parts of the world. Industrialisation, urbanisation, the inflow of
people and disease, the outflow of foodstuffs and other exports, constituted a series of
factors each with the capacity to affect human welfare and growth. Early industrialization
in the United States, for example, contributed to a decline in the stature of Americans
born from the 1820s to the 1840s3 and again later in the century.4 Similar patterns are
observed in Canada and to some extent in South Africa and New Zealand.5 Neither is
there evidence of increasing stature in Argentina, Peru or before the 1870s in Brazil.6
Stagnation or decline of stature even in the healthiest of nineteenth-century
2 Bigge, Report of the Commissioner, p.81. 3 Haines, Craig and Weiss, The short and the dead; Komlos, Anomalies in economic history; Steckel, Stature and living standards. 4 Maloney and Carson, Living standards in Black and White; Steckel and Haurin, Health and nutrition in the American Midwest; Zehetmayer, The postbellum continuation. 5 Cranfield and Inwood, The great transformation; Inwood and Masakure, Poverty and physical well-being; Inwood, Oxley and Roberts, Was New Zealand the land. 6 Baten, Pelger and Twrdek, The anthropometric history of Argentina; Salvatore, Heights, nutrition, and well-being in Argentina.

environments is generally thought to reflect adverse pressures on health and nutrition that
would have offset the positive effect of rising incomes. The immigrant-receiving
countries are of particular interest because at the beginning of the nineteenth century
populations were small and industrialization less advanced, and yet their economies grew
quickly with robust urbanization – exactly the kind of environment that might generate
stresses on personal health.7 Large cities emerged from an early date and grew fast
enough to strain rudimentary public health infrastructure. High rates of internal mobility,
the arrival of large numbers of immigrants and slowly increasing population density
facilitated the circulation of disease and occasional epidemics of respiratory or diarrheal
infection. Moreover, the emergence of mining camps in some places, the advance of
factory production, and an articulation of social classes signaled increasing inequality and
the possibility that important subgroups in society would experience congested living
conditions, child labour, inadequate nutrition or other influences limiting their realization
of physical growth potential.8 The benefits of aggressive public health investment and
advancing medical science, which would have such a dramatic impact in the twentieth
century, were not yet available.9 Many of these regions exported food reflecting its
relatively low price in local markets, and yet inevitably there was upward pressure on
prices as a declining cost of long-distance transportation opened up alternative outlets for
producers.
The Australian story remains uncertain. Data from military recruits cast a shadow
over the working man’s paradise, suggesting stature fell from the 1880s to mid 1890s,
7 Haines, Growing incomes, shrinking people. 8 Steckel, Stature and the standard of living. 9 Easterlin, Growth Triumphant; Floud et al, The Changing Body.

after which it resumed its upward trajectory despite ongoing economic depression.10
Whitwell, De Souza and Nicholas argue that the interruption reflects a combination of
urban disamenities – especially increases in the disease environment – and an earlier than
expected stagnation in wages dated in the 1880s. Shlomowitz considers several sources
of data and argues the need for more work.11 Most evidence has been drawn from
military recruiting during the early twentieth century. There is limited evidence of any
kind for cohorts born before 1870 and for individual colonies within Australia.
This paper and that by Meinzer in this issue deploys data on prisoners rather than
soldiers.12 We focus on Tasmania, a colony with markedly different characteristics than
any of the mainland Australian colonies. In Tasmania incomes rose and population
expanded, but growth and structural change were slower than elsewhere, urbanisation
was milder and the disease environment perhaps more benign.13 Tasmania offers the
example of a new Europe without conspicuous adversity. What would happen to stature
in such an environment? If stature did change, this was likely to implicate overall levels
of economic growth, wages, exogenous price shocks and public health. By using prison
data, we are also able to contribute to the recent debate on an old topic: selection bias in
height samples.
Our analysis considers locally-born men descended from European and other
immigrants because systematic evidence for the indigenous population is limited.14
Similarly, we focus on men because sample size is larger. We attempt to cast a
10 Whitwell, de Souza and Nicholas, Height, health and economic growth; Whitewell and Nicholas, Weight and welfare; Cranfield and Inwood, A tale of two armies. 11 Shlomowitz, Did the mean height of Australian-born men. 12 Meinzer, The West Australian convicts. 13 Butlin and Sinclair, Australian Gross Domestic Product; Sinclair, Annual Estimates. 14 Nicholas, Gregory and Kimberley, The welfare of indigenous.

particularly skeptical eye on the Tasmanian evidence because of the apparent contrast
with other settler colonies and a persisting uneasiness in the literature with samples
selected by a process of imprisonment.
Of course, all historical sources are selective in some way. We are troubled only
if the relationship between the imprisoned population and the rest of society changes over
time. Bodenhorn, Guinnane and Mroz have argued that there is reason to be concerned
about consistency over the business cycle, with economic downturn pushing taller, more
successful workers into crime.15 This potentially matters a great deal. Large cross-
sectional variation in stature within most populations implies that even a small change in
selection might have substantial consequences.
Our first goal, therefore, is to consider potential challenges to the data. Next we
undertake a multivariate assessment that controls for possible confounding effects and
confirms that Tasmanians released from prison born from the 1840s to the 1880s
experienced a substantial increase in stature. A full causal analysis of the stature increase
is beyond the scope of this paper, however we identify alternate hypotheses and the ways
in which each explanation might contribute to a new narrative of Tasmanian history. A
final section of the paper offers concluding comments.
THE DATA
We have extracted the data from reports of discharged prisoners that were
published in the Tasmanian Police Gazette between 1865 and 1924. The Gazette was a
15 Bodenhorn, Guinnane and Mroz, Caveat Lector.

government newspaper that circulated widely throughout Tasmania and nearby
colonies.16 Publication of the prisoner descriptions may have been motivated by concerns
about the recidivist tendencies of an aging former convict population (59,000 male and
13,000 female convicts transported to Tasmania in the period 1803-1853). There may
also have been a desire to keep track of the children and grandchildren of convicts. It is
worth noting that police gazettes in colonies receiving no transportees, for example New
Zealand, had a similar practice. Either the publication of detail about prisoners was
independent of the convict system or New Zealand simply followed the practice of larger
and older colonies. Certainly the colonial state was habituated into detailed record
keeping.
Whereas most post-gold rush mainland colonies were shaped by progressive
legislation that extended the vote and reduced the working day for skilled tradesman,
Tasmania was an exception. It retained a restrictive franchise; this was particularly true of
the upper house, which was dominated by a small landed elite. Aggressive Master and
Servants Acts were introduced in 1837 and 1854 and were supported by other public
order legislation used to prosecute vagrants, particularly former transported convicts and
other more mobile elements of the population.17
Tabulated returns of discharged prisoners first appeared in the Tasmanian Police
Gazette in 1865. Each table included the prisoner’s name, age, place of birth, ship of
arrival, height, hair colour, distinguishing physical features, date of trial, offence, length
of sentence and place and date of discharge (Figure 1). Recorded ages range from five to
103. The returns include those released after serving sentences varying from one hour to 16 Tasmania, Police Gazettes. 17 Quinlan, Australia, 1788-1902: A Working Man’s Paradise.

life. The tables document offenders tried at all levels of the court system. As the range
of sentences might suggest the offences for which they were tried varied from the petty
(vagrancy, trespass etc) to murder. The most minor offences are under-represented
because their sentences tended to be non-custodial eg a monetary fine rather than time in
prison. Comparison of prison admission totals for years where data was provided in the
annually produced statistics of the colony suggest that the discharges reported in the
Police Gazette tables represented about half of the colonial total.
Insert Figure 1 here
The tabulated discharge data were discontinued in June 1910 although the Tasmanian
Police Gazette continued to circulate information on prisoners as they were convicted.
Thus the data collected to mid-1910 describe discharges from prison and data from
subsequent years describe convictions. The discharge and conviction data are similar
except that the latter include many men awarded non-custodial sentences. Until we can
assess the two series more carefully, we do not pool them.
The Gazette information distinguishes those who were born in the colony from
those born elsewhere, and those who freely migrated to Tasmania as opposed to those
who had been transported as convicts (Table 1). We attempt to identify individuals who
were incarcerated more than once. In the absence of a unique identification number, we
link records for individuals with the same name, place of birth, year of birth plus or
minus three years and additional information recorded in the Gazette such as descriptions
of tattoos, injuries and ship of arrival. Beginning in 1895 the linking becomes easier

because the Gazette provides an internal reference to the most recent issue in which the
individual appeared. The semi-automatic linkage process identifies 26,664 distinct
individuals among 39,109 discharge and conviction records (Table 2). As these figures
suggest, a substantial proportion of the records describe individuals with multiple
offending histories.
Insert Figure 2 here
Insert Table 1 here
Insert Table 2 here
Our first examination of the stature of Tasmanian-born adult males by year of
birth (Figure 2) suggests a considerable gain from a trough in the 1840s through to the
early 1880s followed by a partial and temporary reversal later that decade. There is no
sign of a decline from the 1870s to the 1880s, as has been reported for First World War
soldiers in Victoria and nationally.18 Of course there is no reason to expect Tasmania to
follow the pattern of other Australian colonies. Convict transportation uniquely shaped
Tasmania. It received 42 percent of all those transported to Australia, and convicts were
a larger share of the pre-1850 population than elsewhere. Another unusual circumstance
was the Victorian gold rush of 1851, which triggered a decade of net population loss. It is
estimated that 30,000 of the 72,000 former convicts transported to the colony left, the
majority departing for the Australian mainland after the news of the discovery of gold.
Whereas the post-gold rush mainland colonies were shaped by progressive legislation
18 Whitewell and Nicholas, Weight and welfare; Cranfield and Inwood, A tale of two armies.

that extended the vote and reduced the working day for skilled tradesman, Tasmania
retained a restrictive franchise.19 Aggressive Master and Servants Acts in 1837 and 1854
allowed custodial sentences twice the length of similar legislation in England and Wales
for workers who broke employment agreements.20
Given the many differences between Tasmania and the other colonies, we should
not be surprised if there is a different experience of stature. And yet, as with the reading
of any historical source, we need to check that our initial impression is not influenced by
inaccuracies or inconsistencies in the recording of information, or changes in the
composition of the population of convicted felons. One example arises from the
likelihood that during hard times a broader section of the population is likely to end up
before the courts, linking together economic hardship, crime rate and stature.21 Taller
men who have generally more favourable labour market options might be more likely to
engage in crime and to be imprisoned during recessions than at other periods. We need
to consider such possibilities in order to demonstrate that the relationship between the
inmates whose descriptions were circulated and the wider population remained
reasonably consistent over time.
The accuracy of recorded heights is the most basic concern. We have so far failed
to locate instructions for recording heights of Tasmanian prisoners. Of course official
stipulations provide limited comfort, as we would not know if rules were always
followed. Were all prisoners measured with their shoes off? Was the same equipment
used, or were the convicted merely lined up against a wall and their height estimated?
Were drunks and those arrested on a Saturday night for being violent measured with the
19 Boyce, Van Diemen’s Land; Breen, Contested Places. 20 Quinlan, Trade unionism and industrial action. 21 Bodenhorn, Guinnane and Mroz, Caveat Lector.

same accuracy as more compliant inmates? All of these questions are potentially
pertinent.
Information on the physical characteristics of prisoners, including their height,
typically was collected at one of four possible times: a) on arrest, b) on conviction, c) on
admission to an institution, d) on discharge. From 1865 to June 1910 the data that we
have used in this study are described as having been taken on discharge. From June 1910
to December 1924 they were recorded on conviction. Of course, while discharge data
provided an opportunity for prisoners to sober up or calm down, there is no guarantee that
prison officials did not merely copy across the height recorded on entry and supply this to
the compilers of the Gazette.
We examine these issues more closely by comparing the heights recorded for
prisoners with known multiple conviction histories (roughly one-quarter of all prisoners).
If someone’s stature was reported more than once, we can examine whether or not the
detail was identical on each occasion. Providing an independent measurement was taken
on each occasion, this gives an indication of the variability and hence accuracy of
measurement.
This feature allows us to identify the extent to which the height recorded for one
conviction differed from that of a previous Police Gazette entry (limited to entries in
which the prisoner was aged between 21 and 40 years). The results reveal significant
uniformity in measurement practice. The stature of 64 percent of adult male prisoners
and 67 percent of adult females was recorded as being exactly the same as in the person’s
previous record. Additionally 15 percent of male and 11 percent of female terminal
heights differed by half an inch or less (in other words within the bounds of what might
be expected from rounding). Even with accurate measurement some variation in
individual stature is to be expected. Individuals are at their tallest in the morning but tend
to shrink during the day due to the compression of the fibrous discs of cartilage that
separate the vertebrae. Depending on the times in the day in which measurements are
taken, variations of up to an inch should be expected.22 In fact, the mean difference
between matched pairs was 0.04 of an inches with a small positive skewing (perhaps
because a few prisoners thought to be 21 years old were in in fact younger and still
growing). Only one in ten of the records differed by more than half an inch, and there
was no evidence of systematic over- or under-recording.
Insert Table 3 here
Admittedly, the height of prisoners convicted of being idle, drunk and disorderly
displayed slightly greater variation than for other convictions (Table 3). And yet, even in
this category, more than three quarters of all measurements differed by less than a half of
an inch from the previous measurement. We conclude that there is nothing to suggest
different institutional measuring practices and standards distorted the heights of prisoners
recorded in the Tasmanian Police Gazette. Nor is there evidence that height recording
was wildly imprecise. Indeed, some variation in reported heights is comforting because it
confirms that prison officials did not merely copy the last recorded entry for a prisoner
rather than measuring anew.
22 Krishan and Vij, Diurnal Variation of Stature.

COMPOSITIONAL CONSISTENCY AND REPRESENTATIVENESS
It is useful to situate Police Gazette reports of discharge and conviction within the
context of the colony as a whole. Accordingly we report in Figure 3 information on
conviction rates from the published annual statistical account of Tasmania. The number
of convictions per 1000 varied substantially over the period 1867–1922; it fell from a
plateau in the early 1880s to a low in the late 1890s before recovering. Given a
conventional understanding of the colony’s business cycle,23 it would appear that
economic depression coincided with a reduction in prosecution and conviction rather than
increasing it, as observed elsewhere.24 Of course, the problems associated with inferring
underlying crime rates from conviction data are well established.25 Changes in conviction
rates are a poor guide to underlying offending. Nevertheless, to the extent the movement
of prosecutions are likely to reflect fluctuations in crime, it is noteworthy that crime
appears not to have increased during the late-century economic downturn.
Insert Figure 3 here
Another potential complication arises if prisoners born in rural areas were taller,
and the rural-born share of prisoners changed over time. First World War soldiers born in
Hobart and Launceston were two centimeters shorter than other Tasmanians (controlling
23 Butlin and Sinclair, Australian Gross Domestic Product; Sinclair, Annual Estimates. 24 Bodenhorn, Guinnane and Mroz, Caveat Lector. 25 Pepper and Petrie, Measurement Problems in Criminal Justice Research.

for other possible influences).26 For most prisoners, we cannot examine directly the rural-
urban differential because the gazettes do not report birthplace within Tasmania.
Fortunately, we are able to obtain information about birth location and the occupation of
the father for a small number of adolescent prisoners by finding their birth registrations.
The prisoners linked to birth registration were 13-20 years old at conviction and born in
Tasmania. ~557 were born in the 1840s and 1850s, 626 born 1860s, 308 born 1870s, 340
born 1880s, 709 born 1890s. For this sub-sample we can control for birth location and
social class (via father’s occupation) in order identify the secular trend more precisely.
We report in Table 4 a series of OLS regressions that identify mean stature,
separately for men and women aged 13-20, born before 1865 and after 1880, after
controlling for the influence of age, birth location and father’s occupation for men and
women. The constant term reported in Table 4 confirms that even in the presence of
these controls stature at 18 years increased by 1.5 inches from earlier- to later-born
cohorts. Indeed, stature increased at all ages (comparing the constant term with
successive year-specific effects in the two periods). The stature increase appears to be
especially large for women although it varies a great deal by age reflecting, no doubt, the
small sample size for women. A shift upward in the adolescent growth curve, of course,
is consistent with the increase in adult stature.
Insert Table 4 here
Insert Table 5 here
26 Cranfield and Inwood, A tale of two armies, Table 8.

The linked records also shed light on the extent to which location of the court
might proxy for place of birth. For this purpose we ignore the higher courts, which
would have drawn from across the island. The cross-tabulation of court location with
birth location in Table 5 indicates that roughly three-quarters of those convicted in rural
courts were born in rural areas. A smaller proportion, 55%-60%, of prisoners convicted
in Hobart and Launceston were born in urban areas. Clearly, there was more rural-to-
urban migration than vice-versa. Some of those who migrated from rural areas are likely
to have done so as children and therefore spent part of their growing years under the
influence of urban conditions. It is also possible that those who migrated from rural areas
were shorter, on average, than those who stayed behind. Generally, however, the linked
data supports the identification of birth location using location of the court. Those
convicted in rural courts were consistently taller (not shown). Of more immediate
interest, over the decades stature increased for both groups implying that we be confident
of a long-run stature increase regardless of a changing rural proportion.
A similar question about the potential effect of recomposition arises with any
stature differential between subgroups. The personal information available for prisoners
is limited, however we do know that a substantial minority (23 percent) of prisoners were
convicted multiple times (Table 2). If offenders with a multiple conviction history were
taller or shorter than those with only one conviction, this might distort the analysis.
Again, as with birth location, we examine known recidivists separately from other
prisoners. And again, both groups experienced a rise in stature. A similar result emerges
from a consideration of prisoners tried in different kinds of courts and convicted of
different kinds of crime. All distinguishable subgroups increased in stature (not shown,

available on request from the authors). The proportions of convictions in the various
categories fluctuated, and the fluctuations may have been partly endogenous to wider
economic process. Nevertheless, an upward trend in all of the underlying series confirms
that the Tasmanian stature increase is not simply a misleading byproduct of shifting
selection bias or demographic recomposition.
MULTIVARIATE ASSESSMENT OF COMPOSITIONAL CHANGE
We now know that the stature of prisoners differed by court type and location,
type of crime and whether or not the individual is a recidivist. Accordingly, we must
control for compositional shifts that influence the trajectory of observed stature.
Similarly, we need some assurance that fluctuations in crime rate or in reporting by the
Police Gazette do not distort our understanding of stature change by changing the mix of
prisoners. We consider these influences jointly in a simple multivariate regression
reported in Table 6.
Insert table 6 here
We consider all men in 5-year birth cohorts between 19 years and 60 years with
age-specific dummy variables to adjust for those who might still be growing at ages 19-
22 or shrinking aged 50-60. We estimate separately on men identified in the pre-1910
discharges and post-1910 convictions because the inclusion of many non-custodial
sentences in the latter signals a different selection of the population. Separate terms in

the regression capture the compositional and selection influences identified above. The
omitted categories, reflected in the constant term, are birth 1845-49 for discharge data
and 1900-1904 for conviction data, age 23-49, tried in Hobart, only one conviction, and
crimes against property.
All estimated coefficients are of potential interest although we especially wish to
determine if the evidence of stature increase is statistically significant after controlling for
various correlates. The evidence of Table 6 confirms that the choice of court and location
of the trial mattered. Those brought before the courts in the countryside were half an inch
taller than defendants in Hobart or Launceston. The evidence of Tables 4, 5 and 6
confirms that among prisoners, as among soldiers, rural men were taller, presumably
because as rural children they were less exposed to disease and had access to food at a
lower relative price. There is no easy way to assess if this rural effect might be
reinforced by labour market sorting of taller men to work in the countryside. Work in the
countryside undoubtedly rewarded workers who were tall, strong and experienced in rural
employment.27 The empirical significance of this effect is more challenging to establish.
We examine higher courts (the Supreme Court and Quarter Sessions) separately
since they were empowered to try more serious cases involving defendants drawn from
across the colony (and probably across a wider class spectrum). Compared with those
tried in police and magistrates’ courts in Hobart, those convicted in higher courts were
two-thirds of an inch taller. More ‘white-collar crimes’ – forgery, offences against the
currency, and those relating to carrying out laws – were associated with taller offenders –
presumably because the literacy requirement restricted entry to those who grew up in the
kind of household that had resources to cover the cost of education. Contemporary 27 Meredith and Oxley, Contracting convicts.
criminology similarly reflected upon the superior social status and stature of forgers.28 At
the other extreme, the rough and rowdy convicted of offenses against good order were
relatively short. The conviction data, while not identical, hints at class distinctions.
The coefficients for recidivists on the whole take a negative sign but the effects
are small and insignificant, with one exception: Launceston. There, repeat offenders
discharged from prison were nearly three-quarters of an inch shorter than other inmates.
Where short individuals in Launceston more discriminated against in employment
markets, turning to crime instead?29 Alternately, police may have picked on short
individuals—as stature is correlated with socio–economic status this might reflect a wider
heavy–handed attitude to the policing of the poor in Launceston. Another possibility is
that childhood deprivation had life long consequences and that those raised in poverty
remained poor, and as such, were more likely to offend. Most obviously, urban
populations are typically shorter and more policed, creating the appearance of short
recidivists, at least in one town. Our data at present do not allow us to discriminate
among these hypotheses. Importantly, although we remain agnostic on interpretation of
the associations between height and the likelihood of offending, height and recidivism,
and height and type of crime, we see no evidence that these associations undermine our
assessment of an overall stature increase.30
Finally, we also consider if rising stature might be a product of the declining
proportion of convictions reported in the Gazette or the declining incidence of conviction
in Tasmanian society. The degree of under–representation of convictions recorded in the
Tasmanian Police Gazette makes little difference, as is apparent from the small and
28 Goring, The English Convict (1913) 29 Bodenhorn, Guinnane and Mroz, Caveat Lector. 30 Bodenhorn, Moehling, and Price, Short criminals.

statistically insignificant coefficient on the recording rate. We conclude that recording
changes, while worrisome in principle, had no impact on the reported mean height of
Tasmanian born male prisoners.
We do see, however, an inverse association between the annual conviction rate for
the colony as a whole and the heights of prisoners. Total convictions ranged between 20
and 50 per thousand of the population. When conviction rates rose by 10 per 1000 per
annum, the mean height of adult prisoners recorded in the Gazette dropped by one-tenth
of an inch. This runs contrary to an hypothesis of labour market behavior that sees taller
men driven into crime at the same time as crime rates increased.31 The conviction rate
was associated with a decrease in mean height, rather than a rise, and depression drove
the crime rate down, not up. One possible explanation is that economic hardship pressed
hardest on the poor, thus increasing rather than decreasing the proportion of short men
among those committing crimes. It is also possible that what we observe is the outcome
of what might be termed a Casablanca effect—‘round up the usual suspects’. According
to this alternate interpretation, rises in the conviction rate reflect crackdowns on
offending that targeted the less well off. In offering this observation we challenge, in
effect, the presumption that a conviction rate may be taken as proxy for the crime rate.
The Tasmanian evidence is unlikely to surprise a criminologist. Recent work on
crime in nineteenth–century contexts has explored the difference between persistent and
serious offending (categories that are often confused in popular perceptions of criminals).
Many of the repeat offenders in Tasmania were convicted of public order offences, such
as vagrancy, indecent behavior and gambling, which in total account for 68% of all
31 Bodenhorn, Guinnane and Mroz, Caveat Lector.
convictions 1876-1909.32 Many of these convictions led to fines rather than a custodial
sentence and therefore do not appear in the Police Gazette. Custodial sentences for public
order offending accounts 28 per cent of all convictions reported in the Gazette and a large
majority of charges awarded to recidivists.
In Tasmania, as elsewhere, persistent offenders accounted for most offending,
although they were rarely convicted of serious offences. Historians of crime have
identified these repeat offenders as drawn disproportionately from marginalized groups
that were vulnerable to prosecution for offences such as vagrancy. It seems likely that
this was happening in Tasmania as well, and if so we should not be surprised that the
Tasmanian recidivists were comparatively short. They also tend to be well-known to the
police. Serious offenders, by contrast, were often casual offenders in the sense that they
are less likely to have a previous record of conviction. Because of the nature of the
crimes these men were more likely to be tried in higher courts and be sentenced to longer
sentences.33 Our data reveal that they are also likely to be taller.
The patterns identified through multivariate estimation are of individual interest
and should attract additional research. Our immediate objective, however, is to assess
whether or not the impression of rising stature survives the control for other influences.
This directs attention to the birth cohorts in Table 6. As is evident from the size and
significance of these co-efficients, they point to an unambiguous upward trend in stature.
Stature increased with notable gains in the early 1850s, more gradually across 1865-75,
with further progress in 1880-84, with plateaus in between. Stature in each of these
quinquennia was greater than the benchmark 1845-1849 group by a margin that was
32 Tasmania, The Statistics of Tasmania, various years 1876-1909. 33 Godfrey, Cox and Farrall, Criminal Lives.

statistically significant. Then, from 1885-89, heights trend downwards, precipitously in
1890-94 (although it should be noted that sample size also plummets for this birth
cohort). The conviction data follow a similar although less clearly delineated pattern.
Prior to 1875 the conviction data are sparse and the coefficients volatile: afterwards, they
track the shape of the discharge data and extend it into the early 20th century. The
depression years 1890-94 stunted significantly, by more than half an inch, before the
upward trajectory in stature resumed. The dramatic reversal of stature in the 1890s is
not immediately relevant to the argument of this paper but it clearly invites further.
Thus, the observation of a stature increase in Tasmania, only interrupted by the
depression, survives the controls for possible complications in the data.
STATURE INCREASE IN THE NARRATIVE OF TASMANIAN DEVELOPMENT
We have taken some care to investigate the accuracy and consistency of our data.
While it is not possible to assess fully every potential problem, there seems little risk that
compositional change or selection bias misleadingly created the appearance of stature
increase. Multivariate adjustment for changing composition has little effect because most
components of the population moved together. Admittedly, there was considerable
inequality. Rural men were taller than those in Hobart and Launceston. A similar rural-
urban pattern is observed among World War One soldiers.34 Men convicted repeatedly
and those convicted of offences against public order were consistently shorter, although
those convicted of offenses against good order converged toward those convicted of
crimes against person and property. 34 Cranfield and Inwood, A tale of two armies.

Insert Figure 4 here
We derive Figure 4 by adapting the multivariate regression above to consider individual
years of birth rather than 5-year cohorts. At least 150 observations underpin each of the
annual estimates. This permits a finer grain in the trend line. We then compute a five-
year trailing average: so, for example, the figure for 1850 reflects the weighted (by
number of cases) average for boys born in the previous five years. The underlying logic is
that children born from 1846-1850 will be influenced (in varying degree) by conditions
prevailing in 1850. The moving average for stature, after controlling for compositional
and selection influences in Figure 4 reveals a wavering but persistent increase in stature
from the mid 1840s until the late 1870s in the discharge data (and, in the conviction data,
for another few years) for an overall gain in excess of one inch.
The economy was also growing. Figure 4 presents Tasmanian annual real GDP
per capita, from Sinclair.35 From a trough in 1858 with an average of £33 per capita,
Tasmanian GDP rose to a peak of £61 per capita in 1889 – a near doubling of income. It
has long been recognized that while per capita income and stature are likely to move
together in the long term this has not necessarily been so over shorter periods.36 Here,
there is a surprisingly close fit. Annual real GDP per capita explains 41% of the variation
in Tasmanian stature on a moving average basis and 12% using annual average stature
(combining, for the moment, conviction and discharge data into one series). Remarkably,
if we turn from annual averages to individual heights, income still explains 5% of the
35 Sinclair, Annual Estimates. 36 Steckel, Height and Per Capita Income; Steckel, Biological Measures.

variation. We derive this result by substituting real GDP pc for the birth year dummies in
our regression model. While space precludes a thorough investigation of this relationship,
rising income clearly was associated with the realization of biological dividends.
Other settler colonies, as noted in the introduction, have seen some divergence
between the trajectories of per capita income and stature. And yet, Tasmanian families
during the middle decades of the nineteenth century apparently shared in the benefits of
economic growth and improved their living conditions in ways that facilitated a rise in
stature. We turn to the evidence of working class wages and food costs in order to
understand more clearly how families were able to translate aggregate economic change
into individual welfare improvement.
In Figure 5 we report long-run series of wages and the prices of various foodstuffs
in Hobart. These data extend the series published by Meredith and Oxley.37 Rural
communities in Tasmania had easy access to field grains, fish, rabbit, wallaby and other
animal protein, thanks to a benign climate and extensive tracts of both forest and well-
watered cultivable land. Unfortunately, in the absence of systematic records, we can say
little about informal food harvesting by rural families. Fortunately, we are able to
examine wages and food prices for urban-dwellers.
Insert Figure 5 here
Insert Figure 6 here
The price evidence suggests that from the 1840s to the 1860s in Hobart mutton
37 Meredith and Oxley, Contracting convicts; Tasmania, The Statistics of Tasmania, various years 1824-1910.

became modestly less affordable relative to wages. Bread, on the other hand, became
significantly more affordable. If demand elasticities were large enough to influence the
patterns of consumption, over time Tasmanians would have tended to sacrifice mutton in
favour of bread, and hence protein in favour of carbohydrates. Admittedly, there is no
evidence that consumption was sufficiently sensitive to relative prices. If consumption
did respond to relative price change, substituting wheat for meat would have increased
total calories and decreased protein.
In Figure 6 we broaden the evidence to consider the cost of a basic food ration,
relative to the daily wage. The food ration includes tea, sugar, salt, soap, bread and meat
for a family of six. Our family includes one adult receiving a full ration, another adult and
an older child receiving 0.75 of a ration, and three younger children who have half of the
full ration. The ratio of food costs to wage income would have been lower for any
families in which more than one person worked. We assume the carpenter worked 6 days
per week for 11 months of the year. The line in Figure 6 would shift down for every year
if the family were smaller and shift up if work was not available full time year round.
The ratio of food cost relative to wages declined in an irregular but persisting
fashion from the 1840s to 1880s indicating that food was becoming more affordable
during the entire period of stature increase. Admittedly, protein was becoming more
rather than less costly. The decline in family food cost relative to wage would be even
more decisive if we took into account the decline in family size in this period. The
Tasmanian census does not provide direct evidence of family size, however some
reduction is indicated by decline in the number of Tasmanians divided by the number of

dwellings on the island from 7.4 in 1840 to 5.3 in 1880.38 Hatton and his coauthors argue
that falling fertility made available more resources for individual children and thereby
contributed to the rise of stature in Britain.39 A similar process may have been at work in
Tasmania.
The declining cost of food relative to wages helps to explain why Tasmania was
able to translate GDP growth into stature gains through the middle decades of the
nineteenth century. Not surprisingly after 1880, when food cost relative to wage no
longer was declining, and the growth of GDP lost its momentum, stature was no longer
rising.
Another likely influence on stature is the disease and public health environment.
The Tasmanian climate is mild in both winter and summer. Relatively short spells of hot
weather probably limited the duration of fast food spoilage and accompanying dysentery.
Inevitably, however, a number of disease-related influences compromised the physical
growth of children, including poor maternal nutrition (and maternal health more
generally), limited breast-feeding, exposure to bacteria from unsafe water and food and
airborne contagion because of crowded conditions. For the most part we direct lack
evidence of these factors although indirect evidence of overcrowding is provided by the
number of people per dwelling (mentioned above as likely evidence of fertility decline).
Another indirect indicator is infant mortality, since circumstances compromising physical
growth also affected infant mortality.40
Rebecca Kippen has documented a significant decline in infant mortality during
the 1850s; she attributes this change to an abatement of outbreaks of epidemic disease
38 Tasmania, Census and Statistics of Tasmania. 39 Hatton and Martin, Fertilify decline; Bailey, Hatton and Inwood, Health, height and the household. 40 Kippen, Death in Tasmania; Sadetskaya, Infant mortality decline.

and an amelioration of infant death among the children of convict mothers.41 These same
influences may well have contributed to the initial upturn in Tasmanian stature for men
born in the late 1840s and 1850s. Kippen further observes that infant mortality stabilized
at the end of the 1850s and did not decline further for another three decades. Thus, while
the infant mortality analysis helps to explain an initial rise in stature, the longer-term
increase in stature must reflect a broader range of influences. In order to understand why
a short-term and perhaps even cyclical recovery in stature turned into a pronounced four
decade-long trend, we need to consider the broader circumstances of social and economic
development in Tasmania.
Tasmania developed relatively early in the European experience of Australasia
because of its role as a prison colony. Growth occurred, principally as a result of new
inputs of coerced labour. Economic effort was channeled into agricultural, pastoral and
extractive endeavours mainly aimed at the export market, and not towards industrial
production. The ability to allocate convict workers directly to rural districts constrained
the pressures for urbanisation felt elsewhere across Australia. Then, in 1851, the
discovery of gold on the mainland wrought havoc. It drained away all free and some not-
so-free labour. The population contracted, convict women’s wages went up as they
substituted for absent men, and eventually some farmland was retired from production.42
Gold fever also extinguished any remaining ‘dread’ exercised by penal transportation on
the British imagination.
Following the abolition of transportation in 1853, however, the growth of
Tasmania slowed. From 1851 to 1891, Tasmania’s population roughly doubled, whereas
41 Kippen, Death in Tasmania, chapter 6; Kippen, The convict nursery. 42 Meredith & Oxley, ‘Contracting convicts’.

New South Wales increased five-fold and Victoria roughly ten-fold. Indeed, public
authorities at the time reported that Tasmania experienced a net loss of population
through migration during the 1870s and 1880s. The urban share of Tasmania diminished
over this period; by 1891 towns and cities with more than 5000 people accounted for
more than half of the Victorian population, almost as much in New South Wales, but only
one-third of Tasmania’s population.
To the extent that fast population growth especially in cities created a threat to
public health, Tasmania escaped the most severe pressures plaguing other colonial
environments such as nearby Victoria.43 It may have helped as well that from an early
date Tasmanian public intellectuals engaged in vigorous debate about community
health.44 By the end of the century the colony’s chief statistician argued that good habits
of the people and local medical knowledge made significant contributions to Tasmanian
health.45
CONCLUSION
Tasmanians born in the 1870s and 1880s were considerably taller than their
parents born in the 1840s and 1850s. Evidence for the rise in stature is robust to controls
for compositional change and selection effects associated with the use of prison data.
There are legitimate concerns with the use of prison data, but used carefully they provide
helpful insight into the changing health of the population. Our study offers no support for
the potential complication that economic depression increases crime and stature. Instead,
43 Merrett, Economic growth and well-being; Sinclair, Economic growth and well-being: Melbourne. 44 Kippen, The convict nursery. 45 Petrow, Sanitory forum.
when the economy turned down, so too did the conviction rate and average stature. We
detect no indication that only some sectors of society shared in the stature gain or that we
are being misled by inaccuracy or perverse selection bias. Admittedly, there is evidence
of inequalities in stature among different subgroups of the population.
The Tasmanian experience of rising stature was unlike other nineteenth–century
settler societies. Of course, economic expansion everywhere brought more resources that
potentially might be available for public health investments or improving child nutrition.
And yet, in Tasmania, the challenges to health from industrialization and urbanization in
nineteenth-century conditions did not overwhelm the positive effects of growth.
One element in the explanation arises from circumstances encouraging a decline
in infant mortality, such as the cessation of epidemic disease and improved infant care in
the convict nursery in the 1850s. Another helpful circumstance was the falling price of
bread. Taking into account the full cost of a basic ration, which includes imported as well
as exportable items, food became more affordable relative to wages during the period of
rising stature. An apparent decline in family size reinforced the trend for the daily wage
of a tradesman to become an increasingly comfortable way to meet family needs.
An underlying favourable circumstance may be simply that population growth
and urbanization in Tasmania did not overwhelm public health authorities to the same
extent as in faster-growing settler colonies. We are not yet in a position to know how
much explanatory weight to put on a local Tasmanian tradition of sensitivity to public
health as opposed to more muted challenges reflecting slow population growth and
urbanization. This trade-off is difficult to assess for several reasons, including a lack of
stature evidence for people born in the other colonies during the middle decades of the

nineteenth century.
To summarize, height rose because GDP per capita increased, public health
improved especially in the 1850s and cost of a basic food basket diminished relative to
wages. The slow pace of population growth and urbanization, a reduction in over-
crowding, and strong local awareness of the importance of basic public health
safeguarded these benefits. Formal testing is needed to identify the precise importance of
diverse influences for particular decades and over the entire period. Nevertheless, the
Tasmanian evidence already allows us to say that adverse health pressures accompanying
economic growth (the ‘antebellum paradox’) were a contingent rather than universal
tendency. In the right circumstances, substantial improvement in stature and physical
well-being might be realized in a growing, nineteenth-century settler society.
References:
Bailey, R., Hatton, T., and Inwood, K. (2015) Health, Height and the Household at the Turn of the 20th Century. Economic History Review, forthcoming. Baten, J., Pelger, I., Twrdek, L. (2009) The anthropometric history of Argentina, Brazil and Peru during the 19th and early 20th century. Economics and Human Biology, 7: 319-333. Bigge, J. (1822) Report of the Commissioner of inquiry, on the State of Agriculture and Trade in the Colony of New South Wales. London: Parliament of Great Britain Sessional Paper 1823:136. Bodenhorn, H., Guinnane, T., Mroz, T. (2014), Caveat Lector: Sample Selection in Historical Heights and the Interpretation of Early Industrializing Economies. National Bureau of Economic Research Working Paper 19955. Bodenhorn, H., Moehling, C., Price, G.N. (2012) Short Criminals: Stature and Crime in Early America. Journal of Law & Economics, 55. Boyce, J. (2008) Van Diemen’s Land (Melbourne: Black).

Breen, S. (2001) Contested Places: Tasmania's Northern Districts from Ancient Times to 1900 (Hobart: Centre for Tasmanian Historical Studies, University of Tasmania). Butlin, N. (1985) Australian National Accounts 1788-1983 (Canberra: Source Papers in Economic History 6). Butlin, N. and Sinclair, W. (1986) Australian Gross Domestic Product 1788- 1860: Estimates, Sources and Methods. Australian Economic History Review, 26: 126-147. Cranfield, J., and Inwood, K. (2007) The great transformation: A long-run perspective on physical well-being in Canada. Economics and Human Biology, 5: 204-28. Cranfield, J., and Inwood, K. (2015) A tale of two armies: Australian and Canadian soldiers in World War One. Australian Economic History Review 55 (n2). Easterlin, R. (1996) Growth Triumphant: The Twenty-First Century in Historical Perspective (Ann Arbor: University of Michigan Press). Floud, R., Fogel, R. W., Harris, B., and Hong, S. C. (2011) The Changing Body: Health, Nutrition, and Human Development in the Western World since 1700 (Cambridge: Cambridge University Press). Godfrey, B., Cox, D. and Farrall, S. (2007) Criminal Lives: Family Life Employment and Offending (Oxford: Oxford University Press). Haines, M. R. (2004) Growing incomes, shrinking people: Can economic development be hazardous to your health? Social Science History, 28: 249-270. Haines, M. R., Craig, L. A., and Weiss, T. (2003) The short and the dead: Nutrition, mortality and the ‘Antebellum Puzzle’ in the United States. Journal of Economic History, 63: 382-413. Hatton, T. and Martin, R. (2010) Fertility decline and the heights of children in Britain, 1886-1938. Explorations in Economic History, 47: 505-519. Inwood, K. and Masakure, O. (2013) Poverty and physical well-being among the coloured population in South Africa. Economic History of Developing Regions 28: 56-82. Inwood, K., Oxley, L., Roberts, E. (2012) Was New Zealand the land of milk and honey? New evidence on New Zealand living standards. Australian Economic History Review 50: 262-283. Kippen, R. (2002) Death in Tasmania: Using Civil Death Registers To Measure Nineteenth-century Cause-specific Mortality. Ph.D. thesis, Australian National University.

Kippen, R. (2010) The convict nursery at the Cascades Female Factory, Hobart. Chainletter, Newsletter of the Founders and Survivors Project, 5: 5–8. Komlos, J. (1996) Anomalies in economic history: Toward a resolution of the ‘Antebellum Puzzle’. Journal of Economic History, 56: 202-14. Krishan, K. and Vij, K. (2007), Diurnal Variation of Stature in Three Adults and One Child, Anthropologist, 9 (2): 113–117. Maloney, T.N. and Carson, S.A. (2008) Living standards in Black and White: Evidence from the heights of Ohio Prison inmates, 1829-1913. Economics & Human Biology: 237-251. Meinzer, N. (2015) The Western Australian convicts. Australian Economic History Review, 55 (n2). Meredith, D., Oxley, D. (2004) Contracting convicts: the convict labour market in van diemen’s land 1840–1857. Australian Economic History Review 45: 45-72. Merrett, D. (1977) Economic growth and well-being: Melbourne 1870-1914: A Comment. Economic Record, 53: 262-268. Nicholas, S., ed. (1988) Convict Workers: Reinterpreting Australia’s Past (Melbourne: Cambridge University Press). Nicholas, S., Gregory, R., Kimberley, S. (1998), The welfare of indigenous and white Australians, 1890-1955. In: J. Baten and J. Komlos, eds., The Biological Standard of Living in Comparative Perspective (Franz Steiner Verlag), 35-54. Pepper, J. and Petrie, C., (Eds) (2003) Measurement Problems in Criminal Justice Research (Washington: The National Academies Press). Petrow, S. (2013) Sanitory forum: The Royal Society of Tasmania and public health reform, 1853-1911. Papers and Proceedings of the Royal Society of Tasmania 147: 1-10. Quinlan, M. (1986) Trade Unionism and Industrial Action in Tasmania 1830-1850. Tasmanian Historical Research Association: Papers and Proceedings, 3: 8–31. Quinlan M. (2004) Australia, 1788 - 1902: A Workingman`s Paradise? in D. Hay and P. Craven ed., Masters, Servants, and Magistrates in Britain and the Empire, 1562 – 1955 (North Carolina: University of North Carolina Press), 219 – 250. Sadetskaya, K. (2015) Infant mortality decline and its socioeconomic correlates in New Zealand, 1873-1940. Australian Economic History Review 55 (n2).

Salvatore, R.D. (2007) Heights, nutrition, and well-being in Argentina, ca. 1850–1950: Preliminary Results. Revista de Historia Económica, 25: 53-85. Shlomowitz, R. (2007) Did the mean height of Australian-born men decline in the late nineteenth century? A Comment. Economics and Human Biology, 5: 484-8. Sinclair, W.A. (1975) Economic growth and well-being: Melbourne 1870-1914. Economic Record, 51: 153-173. Sinclair, W.A. (2009) Annual Estimates of Gross Domestic Product Australian Colonies/States 1861-1976/77 (Melbourne: Monash University); http://arrow.monash.edu.au/hdl/1959.1/88855. Steckel, R.H. (1983) Height and Per Capita Income. Historical Methods, 16: 1–7. Steckel, R.H. (1992) Stature and Living Standards in the United States. R. Gallman and J.J. Wallis eds. Economic Growth and Standards of Living before the Civil War (Chicago: University of Chicago Press, 1992), 265-308. Steckel, R.H. (1995) Stature and the standard of living. Journal of Economic Literature, 33: 1903-4190. Steckel, R.H. (2008). Biological Measures of the Standard of Living. Journal of Economic Perspectives, 22: 129-152. Steckel, R.H., and Haurin, D. R. (1994) Health and nutrition in the American Midwest: Evidence from the height of National Guardsmen, 1850-1910. In: J. Komlos ed. Stature, Living Standards and Economic Development (Chicago: University of Chicago Press), 117-128. Tasmania, Census, various years 1851-1911. Tasmania, Police Gazettes, various years 1865-1924 (known as Reports of Crime 1865-1883). Tasmania, The Statistics of Tasmania, various years 1824-1910. Whitwell, G., Nicholas, S., de Souza, C., (1997). Height, health and economic growth in Australia, 1860–1940. In: R.H. Steckel and R.H. Floud, eds., Health and Welfare During Industrialization (National Bureau of Economic Research, Chicago and London), 379–421.
Zehetmayer, M. (2011) The postbellum continuation of the antebellum puzzle: stature in the US, 1847–1894. European Review of Economic History, 15: 313-327.

Figure 1 Excerpt from the Police Gazette, 4 February 1892

Figure 2: Five-year moving average of stature by year of birth, Tasmanian-born prisoners aged 21-50
Source: Tasmanian Police Gazettes 1865-1910. Notes: First offence is used for multiple offenders. The prisoner series are case-weighted five-year moving averages of stature for Tasmanian-born male offenders aged between 21-50 inclusive.
65.50
65.75
66.00
66.25
66.50
66.75
67.00
67.25
67.50
67.75
68.00 1843
1846
1849
1852
1855
1858
1861
1864
1867
1870
1873
1876
1879
1882
1885
1888
1891
1894
1897
1900
inches
Discharge data
Conviction data


Figure 4: Moving Average of Stature by Year of Birth Adjusted for Compositional and Selection Influences for Tasmanians born 1840-1910
Source: Sinclair, Annual Estimates, TSOURCE, p8ff and TGDP1.xls, column K. This GDP series incorporates Sinclair’s reworking of Butlin’s estimates for 1804-1860. Notes: We adapt the multivariate regression reported in Table 5 by specifying individual years of birth rather than 5-year cohorts. The five-year moving averages are weighted by number of cases; the figure reports values with 150 or more cases. Implicitly, the figure represents the omitted category from the regression: men tried in Hobart for first offence, a crime against property, aged 23-49 years.
65.5
66
66.5
67
67.5
68
25
30
35
40
45
50
55
60
65
70
1820 1830 1840 1850 1860 1870 1880 1890 1900 1910 1920 1930 1940
inches
£ per capita
Tasmanian GDP p.c. (constant prices)
Discharge data: 5yr case-‐weighted trailing moving average Conviction data: 5yr case-‐weighted trailing moving average

Source: Meredith and Oxley, Contracting Convicts; Tasmania, Statistics of Tasmania.
0.5
1.0
1.5
2.0
2.5
3.0
1840 1850 1860 1870 1880 1890 1900
Figure 5: Index (1840s=1) of mutton price, bread price and wages of a carpenter, Hobart
1840-‐1910
mutton price bread price wage

Source: Meredith and Oxley, Contracting Convicts; Tasmania, Census and Statistics of Tasmania. Notes: We assume a family of six in which one adult receives a full ration, a second adult and an older child each receive 0.75 of a full ration, and the three remaining children receive half a ration.
0.30
0.35
0.40
0.45
0.50
0.55
0.60
0.65
0.70
0.75
0.80
1840 1850 1860 1870 1880 1890 1900
Figure 6: Cost of a basic family food ration relative to a carpenter's wage, Hobart 1840-‐1910
ration cost/wage


Table 2: Number of convictions recorded in the Police Gazette for Tasmanian-‐born offenders
Number of recorded
convictions
Native born males
Percent of all convictions
Native born
Females
Percent of all Convictions
1 8006 76.55 1772 77.04
2 1305 12.48 258 11.22
3 472 4.51 89 3.87
4 222 2.12 45 1.96
5 122 1.17 24 1.04
6 80 0.76 17 0.74
7 51 0.49 8 0.35
8 47 0.45 14 0.61
9 27 0.26 6 0.26
10 18 0.17 6 0.26
>10 91 0.87 91 3.89
10458 100.00 2300 100.00


Table 4: Estimated stature of prisoners linked to birth registrations Born 1845-‐1865 Born 1880-‐1899 Co-‐efficient t-‐stat Co-‐efficient t-‐stat MALES constant 65.04 136 66.50 243 13 years -‐9.34 -‐13.9 -‐11.23 -‐22.17 14 years -‐7.41 -‐11.98 -‐7.24 -‐15.22 15 years -‐4.78 -‐7.74 -‐6.23 -‐14.11 16 years -‐3.72 -‐6.87 -‐2.69 -‐6.97 17 years -‐0.16 -‐0.31 -‐1.08 -‐3.21 18 years 19 years 0.96 1.81 0.36 1.04 20 years 1.57 2.74 0.65 1.9 farmer -‐0.25 -‐0.57 -‐0.80 -‐2.71 tradesman -‐0.02 -‐0.06 -‐0.08 -‐0.33 prop-‐clerical 0.23 0.43 -‐0.16 -‐0.32 born Hobart -‐0.30 -‐0.88 -‐0.46 -‐1.82 born Launceston 0.51 1.1 -‐0.14 -‐0.46 N 557 871 Adj. r-‐squared 0.50 0.53 FEMALES constant 59.17 100 62.45 77 13 years -‐5.17 -‐4.53 -‐3.92 -‐1.24 14 years -‐2.07 -‐1.73 -‐7.14 -‐4.52 15 years -‐1.68 -‐1.08 -‐0.29 -‐0.24 16 years 1.14 1.43 -‐0.04 -‐0.04 17 years -‐0.95 -‐1.41 0.01 0.01 18 years 19 years 2.02 2.89 0.20 0.22 20 years 1.82 2.26 1.29 1.48 farmer 1.07 1.55 0.99 0.93 tradesman 0.10 0.19 1.47 2.43 prop-‐clerical 0.97 0.94 3.46 2.01 born Hobart 0.22 0.41 -‐1.15 -‐1.28 born Launceston -‐0.13 -‐0.17 -‐0.47 -‐0.59 N 289 130 Adj. r-‐squared 0.14 0.19 Notes: We link prisoners aged 13-‐20 years in the Police Gazette to their birth registrations. Omitted categories for the estimation are 18 year old labourers born outside of Hobart and Launceston.
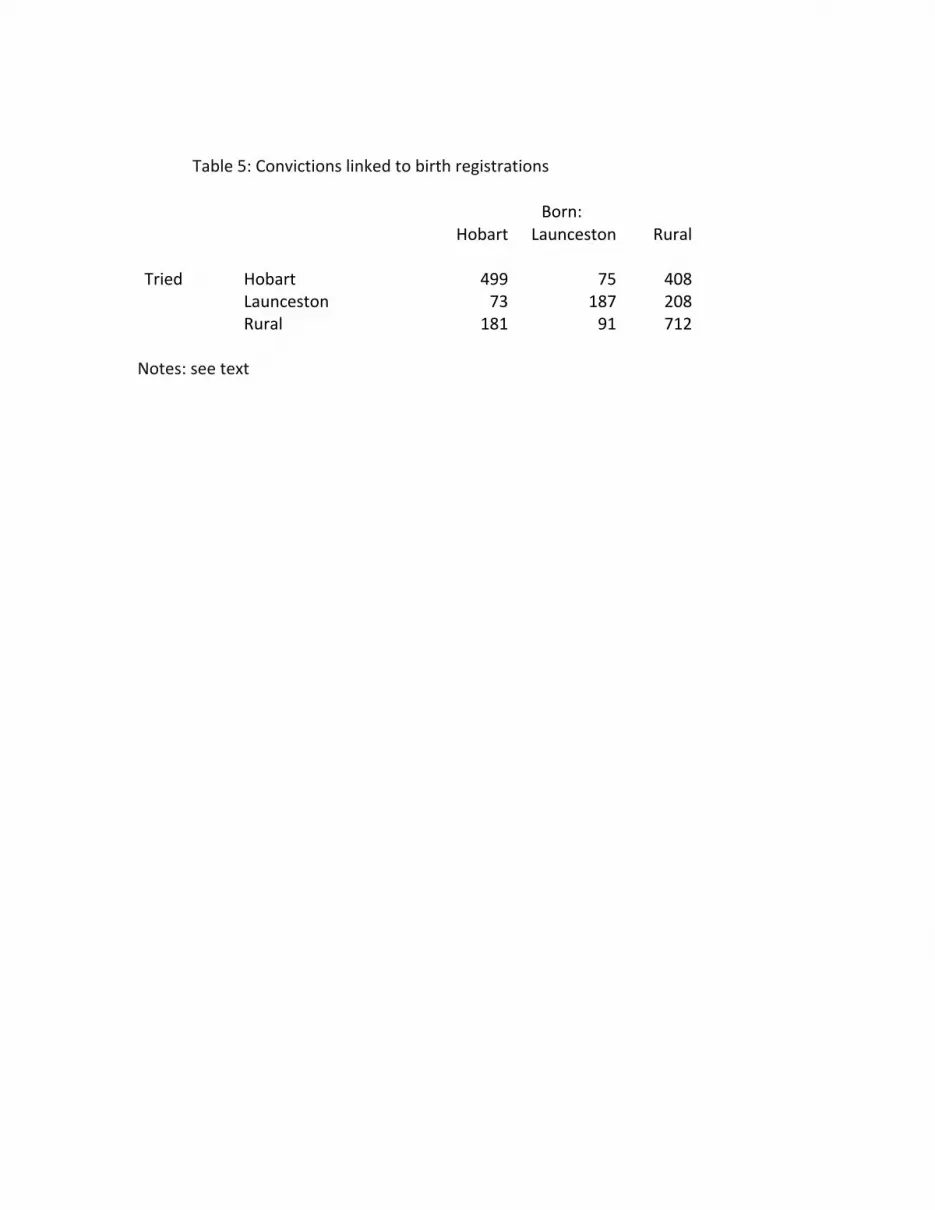
Table 5: Convictions linked to birth registrations
Born:
Hobart Launceston Rural
Tried Hobart 499 75 408
Launceston 73 187 208
Rural 181 91 712
Notes: see text

Table 6: Multivariate Description of Stature
Discharges 1865-‐1910
Convictions 1910-‐1924
coefficient t-‐stat coefficient t-‐stat
constant 66.11*** 149.29 67.21*** 49.75
Born before 1840 0.18 0.58
Born 1840-‐44 0.63** 2.10 Born 1850-‐54 0.56*** 2.48 0.02 0.02
Born 1855-‐59 0.50** 2.32 -0.58 -0.74
Born 1860-‐64 0.52** 2.26 0.16 0.26
Born 1865-‐69 0.70*** 2.81 -0.57 -1.24
Born 1870-‐74 0.90*** 3.33 -0.21 -0.53
Born 1875-‐79 0.84*** 2.68 -0.46 -1.24
Born 1880-‐84 0.95*** 2.88 -0.32 -0.94
Born 1885-‐89 0.49 1.32 -0.29 -0.89
Born 1890-‐94 -0.64 -0.89 -0.56** -2.05
Born 1895-‐99 -0.26 -0.95
Gazette % all convictions 0.02 1.13 0.03 0.61
Convictions per 1000 of the population -0.01 -1.16 0.00 -0.01
Tried Launceston 0.07 0.42 -0.38* -1.68
Tried Country court 0.51*** 3.80 0.52*** 3.30
Tried Supreme Court or Quarter Session 0.65*** 3.33
Recidivist Hobart -0.05 -0.29 -0.36 -1.42
Recidivist Launceston -0.79*** -3.63 0.06 0.17
Recidivist Country Court -0.10 -0.63 -0.21 -1.02
Recidivist Supreme Court or Quarter Session 0.07 0.24
Offences against the person 0.14 1.06 0.64*** 4.49
Offences against person and property -0.13 -0.36 -0.04 -0.10
Forgery and offences against the currency 0.68** 2.06 0.48 0.75
Offences against good order -0.37*** -2.74 0.03 0.15
Offences relating to carrying out laws 0.70* 1.86 -0.44 -0.57
Offences relating to revenue -0.41 -0.42 1.13** 2.26
Offences against public welfare -0.14 -0.95 0.54 0.55
Unclassified offences -0.30 -1.42 0.48 1.13
Age 19 years -0.80*** -4.55 -0.89*** -3.33
Age 20 years -0.56*** -3.16 -0.17 -0.62
Age 21 years -0.04 -0.24 -0.38 -1.48
Age 22 years -0.11 -0.62 0.33 1.27
Age 50-‐60 years -0.04 -0.12 -0.46 -0.93
N 3256 1928 Adjusted R2 0.04 0.05
* significant at p =< 0.10 ** significant at p =< 0.05 *** significant at p =< 0.01
Dependent variable = height in inches Omitted category
• tried Hobart, first offence, crime against property, aged 23-49 • Discharge data: born 1845-49 • Convictions data: born 1900-05
Note. Conviction data does not identify type of court, only location