Embed Size (px)
Citation preview
INTERNATIONAL FERTILIZER DEVELOPMENT CENTER PO BOX 2040 | MUSCLE SHOALS, AL 35662 | USA
Accelerating Farm Incomes (AFI) Baseline Report
BUILDING SUSTAINABLE SOIL HEALTH, MARKETS AND PRODUCTIVITY IN TELANGANA STATE, INDIA
April 2020

AFI Baseline Report i
Table of Contents
Abstract ......................................................................................................................................... iii
Executive Summary ...................................................................................................................... 1
Context ...................................................................................................................................... 1 Approach ................................................................................................................................... 2 Results and Discussion ............................................................................................................. 2
I Background ............................................................................................................................. 6 The Walmart Foundation Initiative ........................................................................................... 7 Baseline Survey ........................................................................................................................ 8
II Approach ................................................................................................................................. 9
Sample Survey and Methodology ............................................................................................. 9 Scrutiny and Analysis ............................................................................................................. 13
III Profile of the Sample Villages .............................................................................................. 14 Rural and Peri-Urban .............................................................................................................. 14
Natural Resources ................................................................................................................... 15 Livestock ................................................................................................................................. 17
Agricultural Input Use ............................................................................................................ 18 Access to Markets ................................................................................................................... 20
IV Anatomy of Agriculture: Dynamics and Drivers ............................................................... 21 Crop Profiles ........................................................................................................................... 23
Land Preparation and Sowing ................................................................................................. 25 Input Use ................................................................................................................................. 26
Seed ................................................................................................................................... 26 Water ................................................................................................................................. 28 Fertilizers .......................................................................................................................... 29
Pesticides........................................................................................................................... 31 Labor ................................................................................................................................. 33
Credit................................................................................................................................. 35 Produce Marketing .................................................................................................................. 37
Crop Production Costs and Returns ........................................................................................ 39 Livestock Composition and Income ....................................................................................... 46
V Accelerating Farm Incomes: Potential and Constraints ................................................... 48
Yield Gap Analysis ................................................................................................................. 48 Factors Influencing Yield Variations ...................................................................................... 51
VI Summary and Way Forward ............................................................................................... 53
References .................................................................................................................................... 57
Appendices ................................................................................................................................... 59 Questionnaire .......................................................................................................................... 79

AFI Baseline Report ii
Acronyms
% AI Area Under Irrigation
AFI Accelerating Farm Income
AFS Average Farm Size
CSR Corporate Social Responsibility
DAP Diammonium Phosphate
FGDs Focus Groups Discussions
FPO Farmer Producer Organization
FYM Farmyard Manure
GAPs Good Agricultural Practices
GoI Government of India
HH Household
HYV High-Yielding Variety
IFDC International Fertilizer Development Center
KII Key Informant Interview
LNRMI Livelihoods and Natural Resource Management Institute
MANAGE National Institute of Agricultural Extension Management
PUA Peri-Urban Agriculture
SPSS Statistical Package for Social Sciences
SSP Single Superphosphate
STW Shallow Tubewell
TSP Triple Superphosphate
VIF Variance Inflation Factor

AFI Baseline Report iii
Abstract
The baseline assessment of Accelerating Farm Incomes aims to understand existing socio-
economic conditions of the farm families, crop practices, cropping systems, access to resources,
and market systems. This assessment provides insights into the potential to enhance farm incomes
and the constraints that need to be dealt with in the selected districts. Apart from providing some
insights to facilitate appropriate interventions, it provides a good set of indicators which form the
basis for monitoring and evaluation in future.

AFI Baseline Report 1
Accelerating Farm Incomes (AFI) Baseline Report
Building Sustainable Soil Health, Markets, and Productivity In Telangana State, India
Executive Summary
Context
The Government of India (GoI) aims to double farmers’ income during the next five years through
various policies and strategies along with innovative technologies. A number of strategies are
identified to promote sustainable intensification in terms of improving soil quality, applying
integrated nutrient management, strengthening extension network, improving quality of livestock,
promoting horticulture, etc. While most of these strategies are directed toward sustainable
intensification, they are also likely to improve viability of agriculture. Apart from the government,
private sector, private-public partnerships, and corporate social responsibility (CSR) initiatives are
being encouraged in this direction.
The Walmart Foundation awarded the International Fertilizer Development Center (IFDC) a
development project titled “Accelerating Farm Incomes (AFI): Building Sustainable Soil Health,
Markets, and Productivity in Telangana State, India. This AFI project has a 34-month intervention
strategy starting in October 1, 2019. It is designed to strengthen and reorient agricultural
production systems in the peri-urban agriculture (PUA) and rural areas of the Telangana State,
India. The AFI project is being implemented in three districts of Telangana State – Mahabubnagar,
Medak, and Rangareddy. The project aims to directly and indirectly enhance the productivity of
90,000 farmers by 25% and income by U.S. $200 per year. Directly the project would cover 30,000
farming households. It will contribute substantially to technology diffusion, capacity building, and
micro-enterprise development. The project is expected to achieve an immediate impact on
improved yields and increased farmer income through improved resource use efficiency and
linking farmers with markets.
Emphasis is on dissemination of good agricultural practices (GAPs), including improved
technologies, to PUA farmers. The diffusion of improved technologies requires attention to both
demand- and supply-side issues – to create farmer awareness and improve knowledge of the use
and benefits of GAPs and technology (a precursor to demand growth) and concurrently to stimulate
entrepreneurial investment in agro-input and quality product supply.
A baseline survey is required to understand the current demographic situation and socio-economic
conditions of the farm families, including current agriculture production and soil fertility
management practices, and cropping systems, as well as market requirements and existing gaps.

AFI Baseline Report 2
The baseline assessment will help identify appropriate interventions and forms the basis for
monitoring and evaluation. The baseline data will be used to measure project impacts as defined
by the results indicators, such as increased yields of selected crops, gross/net margins of farmers,
increasing area under GAPs (use of good quality seed, balanced doses of fertilizers, and
micronutrients, irrigation management, maintaining proper spacing in crop plantation, etc.),
number of farmers reached by the project, and increased use of balanced fertilizers and soil
amendments (micronutrients and organic soil amendments). The baseline will also help identify
the existing market infrastructure and avenues in the project locations, number of markets/bazaars,
trade organizations, farmer producer organizations (FPOs), supermarkets, etc. The focus will be
on tracing the value chain for rice, vegetable crops, maize, and pulses.
Approach
For the purpose of the baseline survey, 1.3% of the targeted 30,000 households, i.e., 397
households, were covered in the three sample districts as per their respective size (number of
farming households). As per the share of farm households, one mandal (sub-district) each in
Rangareddy and Medak and two in Mahabubnagar were selected. In each mandal, villages were
selected using the criteria of distance from the town/marketplace. The sample villages represent
closest, farthest, and mid-reach locations (to markets). A sample of 33 households was covered in
each village, keeping 10% leverage for poor responses. Accordingly, the sample size in
Rangareddy district worked out to be 132,165 in Mahabubnagar and 100 in Medak. The sample is
drawn in proportion to the actual distribution of farm-size classes in the sample villages to
represent small, marginal, medium, and large farmers.
Both qualitative and quantitative data were collected. Qualitative data were collected at the
community and village levels. Qualitative methods, such as focus group discussions (FGDs), key
informant interviews (KIIs), etc., were used to capture the perceptions pertaining to GAPs at the
community level (FGDs) and with local (mandal) officials, extension workers, etc. (KIIs). The
analysis was carried out at two levels – village/community level and household level – for various
economic (farm size) groups in order to understand differences in performance. Qualitative
assessment was used to complement as well as validate the quantitative analysis. Descriptive
statistics were used to assess the yield gaps of various crops. Multiple regression analysis was used
to identify the factors responsible for the existing yield gaps among the farmers. Production
function analysis also helped to understand the resource allocation efficiencies.
Results and Discussion
The analysis helped in understanding the context, status, potential, and constraints for improving
farm incomes in the selected districts. The following is a summary of some of the important aspects
in this regard. These may be taken as pointers for designing the future interventions.
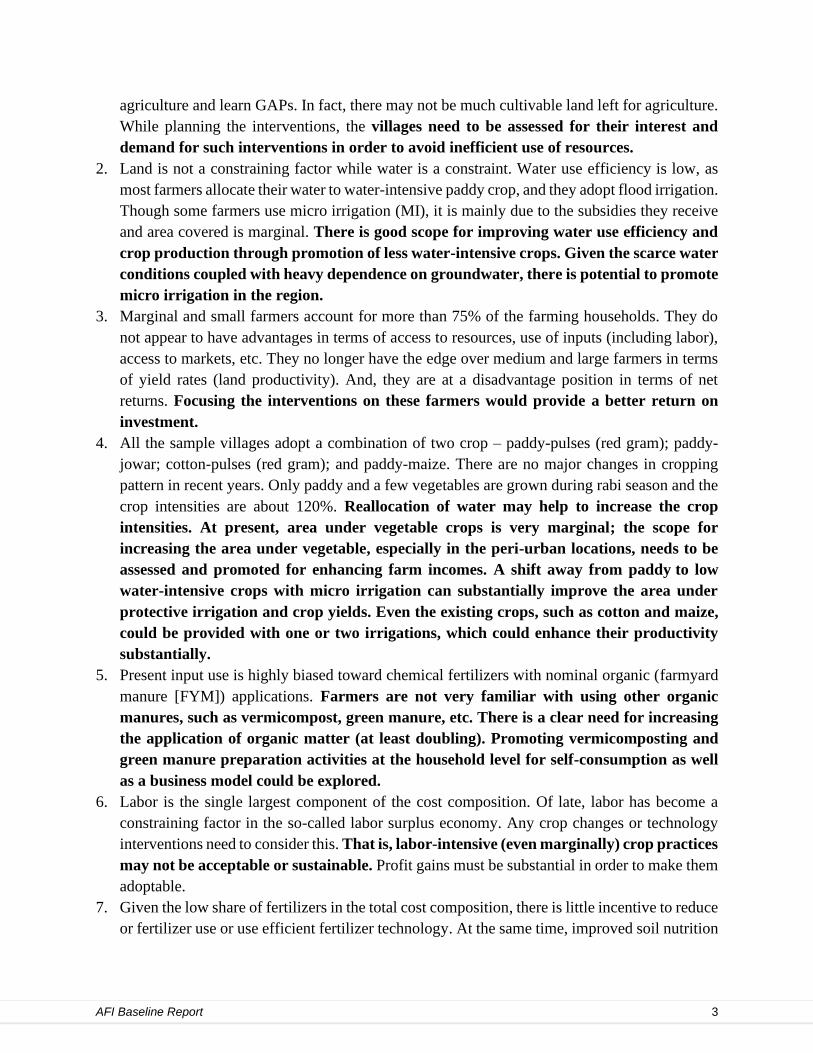
1. Some of the peri-urban villages are fast becoming urban in nature, as agriculture is no longer
a priority. Farmers are more interested in non-farm avenues and unlikely to continue
AFI Baseline Report 3
agriculture and learn GAPs. In fact, there may not be much cultivable land left for agriculture.
While planning the interventions, the villages need to be assessed for their interest and
demand for such interventions in order to avoid inefficient use of resources.
2. Land is not a constraining factor while water is a constraint. Water use efficiency is low, as
most farmers allocate their water to water-intensive paddy crop, and they adopt flood irrigation.
Though some farmers use micro irrigation (MI), it is mainly due to the subsidies they receive
and area covered is marginal. There is good scope for improving water use efficiency and
crop production through promotion of less water-intensive crops. Given the scarce water
conditions coupled with heavy dependence on groundwater, there is potential to promote
micro irrigation in the region.
3. Marginal and small farmers account for more than 75% of the farming households. They do
not appear to have advantages in terms of access to resources, use of inputs (including labor),
access to markets, etc. They no longer have the edge over medium and large farmers in terms
of yield rates (land productivity). And, they are at a disadvantage position in terms of net
returns. Focusing the interventions on these farmers would provide a better return on
investment.
4. All the sample villages adopt a combination of two crop – paddy-pulses (red gram); paddy-
jowar; cotton-pulses (red gram); and paddy-maize. There are no major changes in cropping
pattern in recent years. Only paddy and a few vegetables are grown during rabi season and the
crop intensities are about 120%. Reallocation of water may help to increase the crop
intensities. At present, area under vegetable crops is very marginal; the scope for
increasing the area under vegetable, especially in the peri-urban locations, needs to be
assessed and promoted for enhancing farm incomes. A shift away from paddy to low
water-intensive crops with micro irrigation can substantially improve the area under
protective irrigation and crop yields. Even the existing crops, such as cotton and maize,
could be provided with one or two irrigations, which could enhance their productivity
substantially.
5. Present input use is highly biased toward chemical fertilizers with nominal organic (farmyard
manure [FYM]) applications. Farmers are not very familiar with using other organic
manures, such as vermicompost, green manure, etc. There is a clear need for increasing
the application of organic matter (at least doubling). Promoting vermicomposting and
green manure preparation activities at the household level for self-consumption as well
as a business model could be explored.
6. Labor is the single largest component of the cost composition. Of late, labor has become a
constraining factor in the so-called labor surplus economy. Any crop changes or technology
interventions need to consider this. That is, labor-intensive (even marginally) crop practices
may not be acceptable or sustainable. Profit gains must be substantial in order to make them
adoptable.
7. Given the low share of fertilizers in the total cost composition, there is little incentive to reduce
or fertilizer use or use efficient fertilizer technology. At the same time, improved soil nutrition

AFI Baseline Report 4
management could enhance productivity of some crops, such as cotton. Building awareness
among farmers might help adoption of GAPs in this regard.
8. At the aggregate level, maize is the most profitable crop but is not grown everywhere.
Constraints for expanding the area under maize need to be explored. However, blanket
crop shifts may not be sustainable, as observed in the case of paddy and cotton in
Mahabubnagar. While cotton is more profitable than paddy in all other locations, they are equal
in Mahabubnagar.
9. Access to markets in the sample villages continue to be traditional (high dependence on traders
and middlemen). Farmers neither use nor are aware of e-markets nor are they linked directly
to urban markets or supermarkets. There are no FPOs functioning in the region. In the absence
of evolved market systems, it is difficult to promote new crops, such as vegetables.
Establishing better market linkages with improved price realization is critical for
improving farm incomes.
10. The yield gap analysis indicates that there are wide variations in yields of various crops. These
variations could be observed within the village, between the villages, and between the districts.
This points to the potential for increasing the yield rates in the given agroecological and
technological context. Bridging the yield gaps through adoption of GAPs in the present
crop systems could result in a 9% increase in household income from agriculture. This
can be further increased by reallocating the area under crops. Reallocating more area to
cotton from other crops or reallocating the water from paddy (by reducing the area
under paddy) to other crops could further increase the net gains. Gains from the latter
(reallocating water) may increase the gains from the cotton crop as well.
11. There are wide variations in adoption of some of the GAPs across the farm households,
villages, and districts. Low rates of GAP adoption and/or wide variations in adoption
across farmers indicates the potential for reducing the yield gaps.
12. Factors explaining the variations in yield rates suggest that better soil nutrition and pest
management practices could help enhance yields and incomes in crops such as cotton. Overall,
there is potential for improving input management for enhanced crop performance. GAPs need
to focus on soil nutrition and pest management practices. At the same time, labor and
water are the main constraints and, hence, adoption of labor- and water-saving methods
and approaches would be acceptable to the farming communities.
13. Apart from crop production, livestock rearing is a potential source of household income. In
some of the sample villages, the share of livestock income in the total household income is as
high as 20%. Identifying the potential and constraints for increasing the share of livestock in
household income in the other villages could be a viable proposition. Increasing livestock
holdings has the dual benefits of increasing the availability of FYM (organic matter) and
providing regular cash income at the household and village levels. Besides, small farmers
appear to gain more from livestock rearing.
14. Analysis of labor contribution in crop production confirms the “feminization of agriculture”
argument, as women’s labor account for two-thirds of total labor use in crop production. Also,

AFI Baseline Report 5
some of the villages have substantial number of women farmers. Women farmers/workers
face different problems when compared to their male counterparts and, hence, their
needs are expected to be different. Understanding their requirements and providing
exclusive support (training and technologies) to them is critical for improving their
conditions.
The baseline assessment provides insights into the status and context of the three sample districts.
Crop production in the sample villages is driven by resource and market constraints with little or
no support from extension services. As a result, resource allocation inefficiencies and
unsustainable farm practices are widespread. There is potential to increase farm income through
better allocation of resources, enhancing input productivities, and greater price realization. Water
use efficiency could be improved by shifting to low water-intensive crops and water-saving
techniques (micro irrigation). This could be achieved within the existing cropping pattern and/or
introducing new crop/farming systems that are acceptable and profitable to the farmers. Livestock
farming is a viable complementary livelihood activity, which requires water, fodder, and market
support. Labor availability appears to be a major constraint in these villages and, hence, any new
intervention must take this into account. Improving access to markets and creating value chains
need a broader policy push. Promotion of FPOs and other direct marketing arrangements at the
village or cluster level could be prioritized. This would incentivize farmers to shift to non-
traditional crops, such as vegetables, that are less water-intensive and more remunerative.

AFI Baseline Report 6
I Background
Agrarian distress is attributed to increasing costs in the absence of a matching rise in output prices.
Crop productivity increases that are coming at the cost of higher input (chemical) use (costs) and
soil mining (degradation) are recorded year after year. It is estimated that 70% of the cultivable
land in India faces degradation in one form or the other. Unsustainable intensification practices,
such as mono cropping, chemically intensive farming, inefficient input use practices (including
water), are degrading the soils. Also, the absence of good agricultural practices (GAPs), market
infrastructure, awareness and capacities, etc., are making farming unviable. Levels of organic
carbon in soil are dropping across the country, making soils more vulnerable to erosion. Not only
are these excesses and imbalances reducing the productivity and life of soils, they are also resulting
in harmful residues in the food and vegetables. This, in turn, adversely impacts human and
livestock health and increases the burden of health costs.
Large parts of India are deficient in two or more critical nutrients. In the past, farmers would plow
the stalks left standing on the field after the harvest (green manure), cow dung, etc., back into the
soil. This ensured that nutrients taken out of the soil were replenished. High-yielding varieties
(HYV) of crops introduced through the green revolution have prompted imbalanced chemical
fertilizer use. Farmers today use more and more chemical fertilizers, such as nitrogen (urea),
potassium, and phosphorus, and very little organic manure, such as FYM and compost. Further,
fertilizers are applied without understanding the available soil nutrients. Over the years, such
imbalanced application of chemical inputs has damaged the soils although yield rates were
maintained at an increasing cost (increasing quantities of fertilizer application). As a result, 2% of
India’s total geographical area (6.98 million hectares [ha]) has turned acidic and another 6.7
million ha has become saline (MANAGE, 2017; 2018). These soils are increasingly incapable of
supporting agriculture. This calls for good soil nutrient management practices.
In order to increase crop intensity, farmers burn their fields to clear stalks left standing after the
harvest to plant the next crop. Availability of FYM has declined due to mechanization and
unfavorable economics of livestock rearing. That is, agriculture intensification has converted
grazing lands into crop lands and only large farmers can afford keeping livestock. Also, with
increasing fuel shortage, dung is used as fuel. As a result, application of FYM has fallen to less
than 5 metric tons per hectare (mt/ha) against the recommended 5-10 mt/ha (MANAGE, 2017).
The adverse impacts of such practices are widely recognized. Policymakers have identified that
farm viability could be increased through sustainable farm practices. Widespread use of flood
irrigation in dry regions has resulted in limited access to irrigation and low productivities. Market
distortions, in the form of minimum support prices that are biased in favor of irrigated crops, are
leading to inefficient allocation of resources.
AFI Baseline Report 7
The Government of India (GoI) aims to double farmers’ income during the next five years through
various policies and strategies along with innovative technologies (Chand, 2017). A number of
strategies have been identified to promote sustainable intensification in terms of improving soil
quality, integrated nutrient management, strengthening extension network, improving quality of
livestock, promoting horticulture, technology adoption, awareness, and capacity building at the
village level. While most of these strategies are directed toward sustainable intensification, they
are also likely to improve viability of agriculture through promotion of GAPs. Aside from the
government intervention, private sector, private-public partnerships, and CSR initiatives are being
encouraged in this direction.
The Walmart Foundation Initiative
The Walmart Foundation awarded the International Fertilizer Development Center (IFDC) a
development project titled “Accelerating Farm Incomes (AFI): Building Sustainable Soil Health,
Markets, and Productivity in Telangana State, India. This AFI project is a 34-month intervention
starting on October 1, 2019. It is designed to strengthen and reorient agricultural production
systems in the peri-urban agriculture (PUA) and rural areas of the Telangana State in India. The
AFI project will be implemented in three districts of Telangana State – Mahabubnagar, Medak,
and Rangareddy. The project aims to directly and indirectly enhance productivity of 90,000
farmers by 25% and income by U.S. $200 per year. Directly, the project would cover 30,000
farming households. It will contribute substantially to technology diffusion, capacity building, and
micro-enterprise development. Each component is crucial for sustainability of agriculture
production systems. The project is expected to achieve an immediate impact on improved yields
and increased farmer income through improved resource use efficiency and linking farmers with
markets. AFI will focus on the following key issues for improving crop productivity in Telangana:
1. Increase productivity by expanding farmer knowledge of best production practices.
2. Ensure application of appropriate technologies (seed, fertilizers, crop protection practices, and
products) to suit Telangana's marginal soils (with low nitrogen and phosphorus levels), which
have severe nutrient deficiencies in semi-arid/rainfed conditions.
3. Create access to viable marketing pathways and sustainable opportunities for farmers to sell
their produce and optimize their income.
Emphasis will be on dissemination of GAPs, including improved technologies, to PUA farmers.
The diffusion of improved technologies requires attention to both demand and supply side issues
– to create farmer awareness and improve knowledge of the use and benefits of GAPs and
technology (a precursor to demand growth) and concurrently to stimulate entrepreneurial
investment in agro-input and quality product supply to afford access. The implementation strategy
involves focusing on and strengthening the following areas:
• Incorporating peri-urban agriculture as part of the poverty alleviation process.
• Assisting the targeted peri-urban poor in marketing of agricultural products.

AFI Baseline Report 8
• Providing training and advisory services for capacity building as part of the community
empowerment process.
• Delivering specific, adaptable technology transfer toward improving the use of quality seeds,
irrigation efficiency, and fertilizer management for three commodity groups, depending on the
cropping pattern in the selected districts – rice-maize, rice-pulse, and rice-vegetable – based
on climate-smart and resilient approaches, such as:
o Improving nutrient use efficiency in rice-vegetable-based cropping systems.
o Enhancing secondary and micronutrient uptake in cereal-based cropping systems,
including maize, vegetables, and pulses.
o Improving fertilizer and water use efficiency in semi-arid agriculture systems.
• Providing commercial orientation to peri-urban agriculture in Telangana State through the
involvement of smallholder farmers, particularly by encouraging women and youth
involvement in such initiatives.
• Recognizing the growth and demand for horticultural products (vegetables) in the metropolis
of Telangana State and the potential for export opportunities with the international airport,
PUA-related interventions will help smallholders access sustainable farming and income
opportunities.
The project will strengthen inter- and intra-partner relationships with participating resource-poor
farmers, private sector extension agents, agricultural input suppliers, and output buyers in the
project areas and beyond. A system of forward and backward linkages will be established to
achieve the goal of the project. The project will improve the technical capacity of private sector
extension agents as well as resource-poor farmers toward the effective use of technologies.
Sustainable partnerships also will be developed through participatory learning processes, such as
workshops, training, field days, field visits, farmer visits, and other innovative knowledge
dissemination forums, such as web-based platforms.
Baseline Survey
A baseline survey is required to understand the current socio-economic conditions of the farm
families, current agriculture and soil fertility management practices, cropping systems, and
understand the market requirements and gaps for the crops grown such as rice, cotton, jowar,
pulses, maize, and other crops. Baseline assessment will help identify appropriate interventions
and forms the basis for monitoring and evaluation. The findings of the baseline study will be used
to determine baseline values for key project indicators, as well as to inform the design of project
activities and areas of emphasis. The baseline will be used to measure project impacts as defined
by the results indicators, such as increased yields of selected crops, gross/net margins of farmers,
increasing area under GAPs (use of good quality seed, balanced doses of fertilizers, and
micronutrients, maintaining proper spacing in crop planting, etc.), number of farmers covered by
the project, and increased use of balanced fertilizers and soil amendments (micronutrients and
organic soil amendments). The baseline will also help identify the existing market infrastructure

AFI Baseline Report 9
and avenues in the project locations, number of markets/bazaars, trade organizations, FPOs,
supermarkets, etc. The focus will be on tracing of value chain for rice, cotton, red gram, jowar,
maize and pulses.
The report is organized into six sections. The following section presents the approach to the
baseline survey, explaining the sample survey methodology and sampling details. Section III
discusses the profile of the sample villages, which is based on the qualitative research and analysis.
Section IV, based on the quantitative data, examines the anatomy of agriculture in rural and peri-
urban context in the sample villages. Section V looks at the potential and constraints for
accelerating farm incomes in the sample villages going by the yield variations and farming
practices. And Section VI summarizes the analysis and presents the way forward for accelerating
farm incomes.
II Approach
Sample Survey and Methodology
The project interventions are targeted to cover 30,000 farmers (beneficiary households). There are
more than 1,400 villages covered under 73 mandals (sub-districts) in the three project districts
(Table 1). The average size of the villages in the project districts is less than 300 cultivating
households. In order to cover 30,000 farmers, the project interventions would need to cover 24
mandals and 471 villages (Table 2). Farm population is used as criteria for distributing the mandal
among the three sample districts. That is, the number of mandals in each district is distributed
according to the respective share of the district in terms of farm households. As per the secondary
data, 35% of the 24 mandals fall in Rangareddy district, 40% in Mahabubnagar, and 25% in Medak
(Table 2).
Table 1. Demographic Features of the Selected (Project) Districts
District No. of Rural
HHs Total Rural Population
No. of Mandals
No. of Villages
No. of Cultivating HHs
HH Size
Medak 141,715 [25] 708,574 20 378 99,200 (262) 5
Rangareddy 205,222 [35] 1,026,114 27 497 143,655 (289) 5
Mahabubnagar 235,714 [40] 1,178,574 26 559 165,000 (295) 5
Telangana State 5,169,029 21,395,009 584 9,834 3,618,320 (368) 4
Note: Figures in ‘[]’ are proportion of rural households to total of three project districts.
Figures in ‘()’ are the number of cultivating HHs per village.

AFI Baseline Report 10
Table 2. Project Intervention Scale and Baseline Sample Coverage
District
Project Intervention Scale Baseline Sample Coverage
No. of Farming HH
Total Rural
Population No. of
Mandals No. of
Villages
No. of Sample Mandals
No. of Sample Villages
No. of Sample
HHs
Medak 7,500 [25] 37,500 6 132 1 3 100
Rangareddy 10,500 [35] 52,500 8 129 1 4 132
Mahabubnagar 12,000 [40] 60,000 10 210 2 5 165
Total 30,000 [100] 150,000 24 471 4 12 397
Note: Figures in ‘[]’ are proportion of rural households to total of three project districts.
Figures in ‘()’ are the number of cultivating HH per village.
For the purpose of the baseline survey, it is proposed to cover at least 1.3% of the targeted 30,000
households, i.e., 397 households. These 397 households are distributed among the three sample
districts as per their respective size (number of farming households). Accordingly, the sample size
works out to be 132 in Rangareddy district, 165 in Mahabubnagar, and 100 in Medak. Using the
small (minimum) sample principle of 30 minimum sample households in each village, it is
proposed to cover 12 villages from the three districts. This minimum sample ensures scientific and
robust assessments. Depending upon the size of the sample in each district, the 12 villages are
selected from four mandals. As per the share of farm households, one mandal each in Rangareddy
and Medak and two mandals in Mahabubnagar were selected. In each mandal, villages were
selected using the criteria of distance from the town/marketplace. The sample villages represent
closest, farthest, and mid-reach locations (to markets). A sample of 33 households is covered in
each village, keeping 10% leverage for poor responses. The sample is drawn in proportion to the
actual distribution of farm size classes in the sample villages to represent small, marginal, medium,
and large farmers (Table 3). In total, the sample covered 45% of marginal farmers, followed by
32% small, 17% medium, and 6% large farmers. Medak and Rangareddy districts have a greater
proportion of small and marginal farmers. In some mandals, there were no large farmers in the
sample or at all, while in some there were absentee large farmers (Gajulapeta).

AFI Baseline Report 11
Table 3. Baseline Survey: Household Sample Details
Sample District/ Mandal/Village
No. of Sample Farmers Total Sample HH Marginal Small Medium Large
Medak 79 (1,070) 13 (179) 6 (88) 1 (12) 99 (1,349)
Manoharabad** 79 (1,070) 13 (179) 6 (88) 1 (12) 99 (1,349)
Lingareddipet 26 (266) 4 (44) 3 (27) 0 (0) 33 (337)
Jeedipally 28 (323) 4 (46) 1 (15) 0 (0) 33 (384)
Kallakal 25 (481) 5 (89) 2 (46) 1 (12) 33 (628)
Rangareddy 69 (451) 36 (194) 20 (127) 8 (46) 133 (818)
Farooqnagar+++ 69 (451) 36 (194) 20 (127) 8 (46) 133 (818)
Gantlavelli 19 (60) 8 (27) 4 (12) 2 (6) 33 (105)
Chattanpalle 12 (25) 14 (30) 5 (10) 2 (4) 33 (69)
Mogalagidda 20 (145) 6 (42) 5 (36) 2 (16) 33 (239)
Bhemaram 18 (221) 8 (95) 6 (69) 2 (20) 34 (405)
Mahabubnagar 31 (1,394) 77 (3,448) 43 (1,199) 15 (498) 166 (6,539)
Mahabubnagar (Rural) 19 (1,194) 59 (3,148) 17 (884) 5 (373) 100 (5,592)
Zainallipur+ 4 (40) 20 (180) 6 (50) 3 (30) 33 (300)
Gajulapeta++ 7 (565) 20 (1555) 6 (481) 0 (226)@ 33 (2,827)
Kotakadira 8 (589) 19 (1413) 5 (353) 2 (117) 34 (2,472)
Krishna* (Hindupur) 12 (200) 18 (300) 26 (315) 10 (125) 66 (940)
Mudumal 10 (180) 15 (270) 7 (115) 1 (25) 33 (590)
Chegunta 2 (20) 3 (30) 19 (200) 9 (100) 33 (350)
All 179 (2,915)
[45]
126 (3,821)
[32]
69 (1,414)
[17]
24 (556)
[6]
397 (8,706)
[100]
Note: Figures in ‘()’ are actual number of households i.e., population. Figures in ‘[]’ are relative share i.e., % in the
sample.
*Formerly Maganoor Mandal; **Formerly Toopran Mandal; +Formerly Hanwada Mandal; ++Formerly Addakal
Mandal; +++Formerly Mahabubnagar District; @Absentee Land Owners/Non-Cultivating HH.
Both qualitative and quantitative data were collected. Qualitative data were collected at the
community and village levels. Qualitative methods like focus group discussions (FGDs), key
informant interviews (KIIs), etc., were used to capture the perceptions pertaining to GAPs at the
community level (FGDs) and with local (mandal) officials, extension workers, etc. (KIIs)
(Photo 1).

AFI Baseline Report 12
Photo 1. Focus Group Discussions in the Village and KIIs at the Mandal Office
Photo 2. Piloting of Questionnaire and Visits to Field
Quantitative data were collected at the household level using a structured questionnaire. The
household questionnaire had two components (see Appendix: Questionnaire): a socio-economic
component, including demographic data, income and expenditure of farmers, farmer willingness
and ability to pay for quality inputs, and current marketing practices, and a technical component,
including cropping patterns/systems, agro-input use, yields, soil and crop nutrient management
knowledge and practices, and agricultural production practices, market structure, etc., for the

AFI Baseline Report 13
selected crops. The questionnaire was piloted prior to its finalization (Photo 2). Based on the pilot
and feedback from the pilot visit to the village, the questionnaire was modified and finalized.
To carry out the survey, a group was chosen; 15 enumerators for data collection at the household
level were identified and formed into teams under team coordinators. The entire group was given
training on the questionnaire (Photo 3). Data were entered on smartphones using the data entry
format. The data manager provided the data entry format on smartphone and gave training on data
entry. Enumerators were formed into teams to cover each district simultaneously.
Photo 3. Training Session for the Investigators
Scrutiny and Analysis
Data collection was monitored by the field coordinators for quality assurance as well as to clarify
any issues. Data collected on the smartphone app was transferred directly to the data manager
through a server on a daily basis. Data was later transferred to the Excel format. The data manager
checked the data for any inconsistencies, missing data, outliers, etc., and provided the feedback to
the respective enumerators on a daily basis. Once all the data was collected, a thorough checking
and cleaning of data was carried out using Excel prior to the analysis. In the process, the data was
cross-verified using different responses of the farmer within the questionnaire. Tabulation formats
were prepared and tabulation was carried out accordingly. The analysis was primarily based on the
cross-tabulation of data and graphic presentations. The analysis was carried out for various
economic (farm size) groups in order to understand differences in performance. Qualitative
assessment was used to complement as well as validate the quantitative analysis. Descriptive
statistics were used to assess the yield gaps of various crops. Production functions were estimated
using multiple regression analysis using SPSS software to identify the factors responsible for the
existing yield gaps among the farmers. Production function analysis also helped to understand the
resource allocation efficiencies.
AFI Baseline Report 14
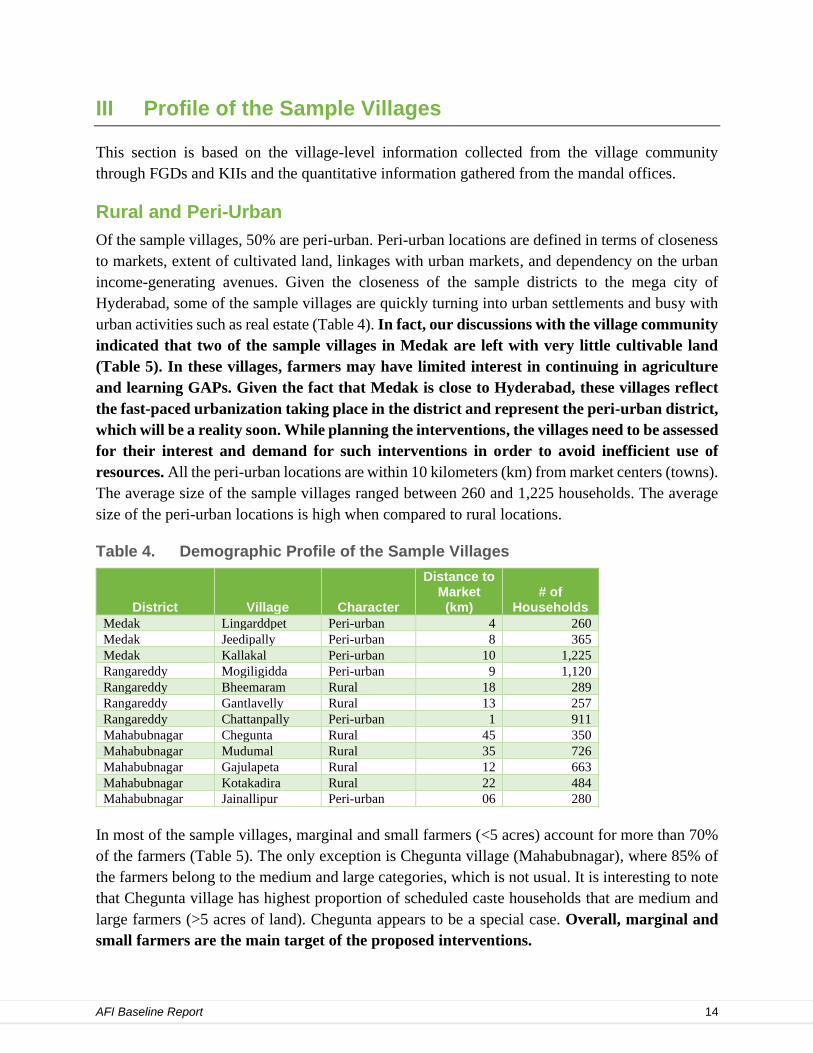
III Profile of the Sample Villages
This section is based on the village-level information collected from the village community
through FGDs and KIIs and the quantitative information gathered from the mandal offices.
Rural and Peri-Urban
Of the sample villages, 50% are peri-urban. Peri-urban locations are defined in terms of closeness
to markets, extent of cultivated land, linkages with urban markets, and dependency on the urban
income-generating avenues. Given the closeness of the sample districts to the mega city of
Hyderabad, some of the sample villages are quickly turning into urban settlements and busy with
urban activities such as real estate (Table 4). In fact, our discussions with the village community
indicated that two of the sample villages in Medak are left with very little cultivable land
(Table 5). In these villages, farmers may have limited interest in continuing in agriculture
and learning GAPs. Given the fact that Medak is close to Hyderabad, these villages reflect
the fast-paced urbanization taking place in the district and represent the peri-urban district,
which will be a reality soon. While planning the interventions, the villages need to be assessed
for their interest and demand for such interventions in order to avoid inefficient use of
resources. All the peri-urban locations are within 10 kilometers (km) from market centers (towns).
The average size of the sample villages ranged between 260 and 1,225 households. The average
size of the peri-urban locations is high when compared to rural locations.
Table 4. Demographic Profile of the Sample Villages
District Village Character
Distance to Market
(km) # of
Households
Medak Lingarddpet Peri-urban 4 260
Medak Jeedipally Peri-urban 8 365
Medak Kallakal Peri-urban 10 1,225
Rangareddy Mogiligidda Peri-urban 9 1,120
Rangareddy Bheemaram Rural 18 289
Rangareddy Gantlavelly Rural 13 257
Rangareddy Chattanpally Peri-urban 1 911
Mahabubnagar Chegunta Rural 45 350
Mahabubnagar Mudumal Rural 35 726
Mahabubnagar Gajulapeta Rural 12 663
Mahabubnagar Kotakadira Rural 22 484
Mahabubnagar Jainallipur Peri-urban 06 280
In most of the sample villages, marginal and small farmers (<5 acres) account for more than 70%
of the farmers (Table 5). The only exception is Chegunta village (Mahabubnagar), where 85% of
the farmers belong to the medium and large categories, which is not usual. It is interesting to note
that Chegunta village has highest proportion of scheduled caste households that are medium and
large farmers (>5 acres of land). Chegunta appears to be a special case. Overall, marginal and
small farmers are the main target of the proposed interventions.

AFI Baseline Report 15
Table 5. Economic Classification of the Households in the Sample Villages
Village
Marginal Small Medium Large All
(%) (no.)
Kallakal 77 14 7 2 628
Jeedipally 84 12 4 0 384
Lingareddipet 79 13 8 0 337
Medak 79 13 7 1 1,314
Gantlavelli 57 26 11 6 105
Mogalagidda 61 18 15 7 239
Bhemaram 55 23 17 5 405
Chattanpalle 36 43 14 6 69
Rangareddy 55 24 16 6 818
Chegunta 6 9 57 29 350
Gajulapeta 20 55 17 8 2,827
Mudumal 31 46 19 4 590
Kotakadira 24 57 14 5 2,472
Zainallpur 13 60 17 10 300
Mahabubnagar 21 53 18 8 6,539
All (no.) 2,915 3,821 1,414 556 8,706
Natural Resources
Access to natural resources, such as land and water, is critical for enhancing farm incomes. All of
the sample villages except two have more than 500 acres of land, ranging from 76 to 6,492 acres.
Mahabubnagar villages have larger cultivated lands, followed by Rangareddy and Medak villages
(Table 6). More detailed information on land and water resources is presented in Table A1. The
majority of the households own their land. Only in Chattanpalle of Rangareddy district, 77% of
the households do not own their own land. The proportion of households that do not own land is
less than 10% in majority of the sample villages. Given the semi-arid nature with about 800 mm
rainfall, irrigation plays an important role in crop production. All of the sample villages are
dependent on groundwater or stream water (lift irrigation), as only one village (Mudumal) has a
canal as a source of irrigation. Availability of irrigation varies widely across the sample villages.
Sample villages in Medak have the highest proportion of irrigation (58%), and Rangareddy
villages have about 10% of area irrigated on average. One of the sample villages (Chegunta) in
Mahabubnagar had the lowest area under irrigation (2%), while Mudumal had the highest area
under irrigation (71%). The high proportion of area under irrigation in Mudumal village is due to
the availability of canal waters, accounting for 60% of the irrigated area in the village. All other
sample villages depend on bore wells or streams, which are dependent on rainfall and, hence, face
uncertain agrarian conditions. Crop failures are common. Income from livestock is also a major
source in most of the sample villages. All of the sample districts depend on migrant labor (nearby
towns) to supplement agricultural income. Mahabubnagar has the high incidence of migration1 to
1 Migration in Mahabubnagar villages ranges between 40% and 50% of the total working population. In recent years,
the extent of migration has decreased due to the advent of irrigation (Korra, 2011).

AFI Baseline Report 16
far off places, such as Mumbai. Mahabubnagar is known for out-migration for quite some time.
Perhaps due to this, the sample villages in Mahabubnagar had higher proportion of women farmers
(Table 6). These villages may need to focus on women farmers as well. Women farmers face
different problems when compared to their male counterparts, and hence their needs are
expected to be different. Understanding their requirements and providing exclusive support
(training) to them is critical for improving their conditions.
Table 6. Status of Agriculture in the Sample Villages
Village Name
Total Cultivated
Land (acres)
Landless Households
(%)
Area Irrigated
(%) Source of Irrigation
Groundwater (%)
Canal (%)
Women Farmers
(%)
Lingarddpet 104 7 58 Bore wells 100 0 3
Jeedipally 76 6 58 Bore wells 100 0 1
Kallakal 502 24 57 Bore wells 100 0 1
Mogiligidda 1,849 18 8 Bore wells 100 0 1
Bheemaram 1,191 7 7 Bore wells 100 0 2
Gantlavelli 585 16 9 Bore wells 100 0 6
Chattanpally 436 77 22 Bore wells 100 0 0
Chegunta 3,565 14 2 Bore wells 100 0 9
Mudumal 6,492 10 71 Canal/well 40 60 8
Gajulapeta 2,276 6 9 Bore wells 100 0 8
Kotakadira 2,500 10 48 Bore wells 100 0 8
Jainallipur 870 9 51 Bore wells 100 0 7
Source: Mandal revenue offices of the respective mandals.
Access to land and water determines the nature, diversity, and intensity of cropping pattern. In all
of the sample villages, both kharif and rabi crops are grown (Table 7). While five crops are sown
during kharif, three crops are sown during rabi season. In the case of Chegunta village
(Mahabubnagar) where only 2% of the area is under irrigation, only one rabi crop is grown (white
jowar). Lack of access to irrigation in Chegunta may explain the dominance of scheduled caste
community with large land holdings. In Medak and Rangareddy sample villages, even a summer
crop is grown (fodder). Farmers give first preference to paddy when they have access to water.
Maize, cotton, and jowar are second preference crops, followed by pulses and vegetables. Despite
the high potential for vegetable crops, especially in peri-urban villages, farmers are not very
familiar with growing vegetables. However, they have started trying vegetable crops. With
some support regarding awareness, technologies, and market connectivity, the potential for
growing vegetable crops would expand. In Chegunta, paddy is the last preference. In all the
sample villages, paddy, cotton, pulses (red gram), maize, and vegetables are the most preferred
crops during kharif season. Paddy is the first preference during rabi in the majority (seven) of the
sample villages. Pulses, vegetables, and fodder are the next preferred crops during rabi. Only
fodder is grown during summer months. Over the last five years, not many changes have been
observed in the cropping pattern of the sample villages. While paddy and fodder crops are constant,
the combination of other crops (maize , jowar, cotton, pulses, and vegetables) keep changing. Only
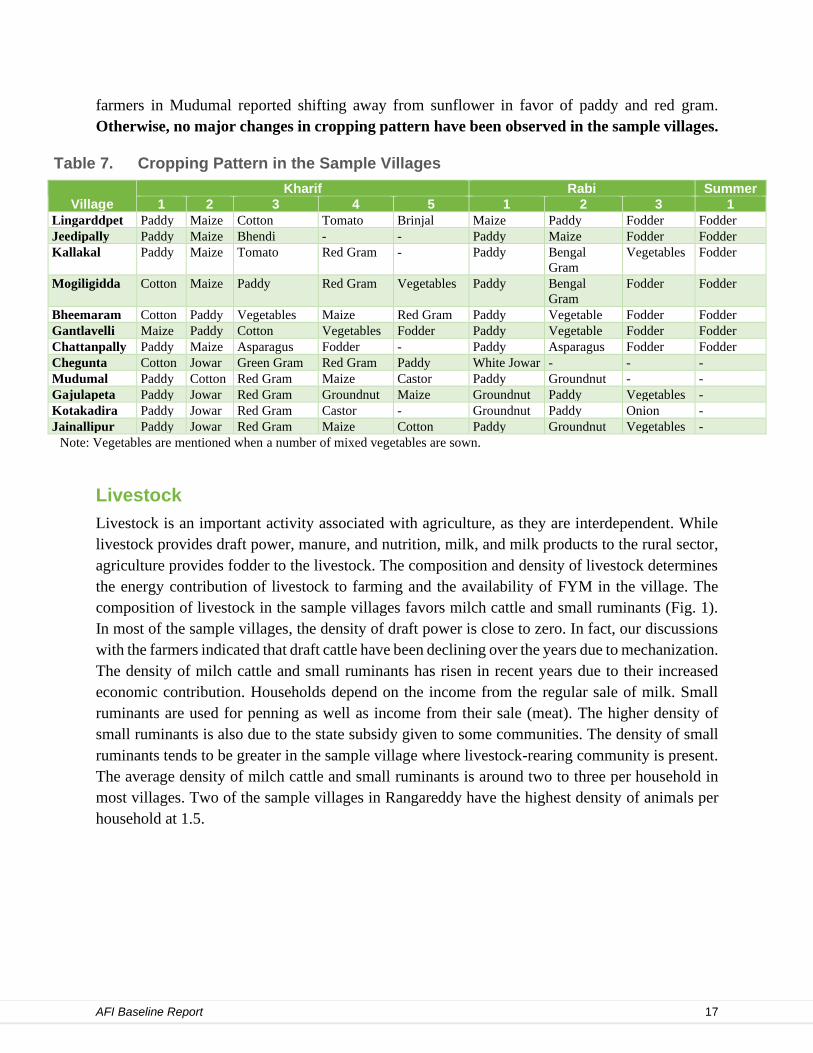
AFI Baseline Report 17
farmers in Mudumal reported shifting away from sunflower in favor of paddy and red gram.
Otherwise, no major changes in cropping pattern have been observed in the sample villages.
Table 7. Cropping Pattern in the Sample Villages
Village
Kharif Rabi Summer
1 2 3 4 5 1 2 3 1
Lingarddpet Paddy Maize Cotton Tomato Brinjal Maize Paddy Fodder Fodder
Jeedipally Paddy Maize Bhendi - - Paddy Maize Fodder Fodder
Kallakal Paddy Maize Tomato Red Gram - Paddy Bengal
Gram
Vegetables Fodder
Mogiligidda Cotton Maize Paddy Red Gram Vegetables Paddy Bengal
Gram
Fodder Fodder
Bheemaram Cotton Paddy Vegetables Maize Red Gram Paddy Vegetable Fodder Fodder
Gantlavelli Maize Paddy Cotton Vegetables Fodder Paddy Vegetable Fodder Fodder
Chattanpally Paddy Maize Asparagus Fodder - Paddy Asparagus Fodder Fodder
Chegunta Cotton Jowar Green Gram Red Gram Paddy White Jowar - - -
Mudumal Paddy Cotton Red Gram Maize Castor Paddy Groundnut - -
Gajulapeta Paddy Jowar Red Gram Groundnut Maize Groundnut Paddy Vegetables -
Kotakadira Paddy Jowar Red Gram Castor - Groundnut Paddy Onion -
Jainallipur Paddy Jowar Red Gram Maize Cotton Paddy Groundnut Vegetables -
Note: Vegetables are mentioned when a number of mixed vegetables are sown.
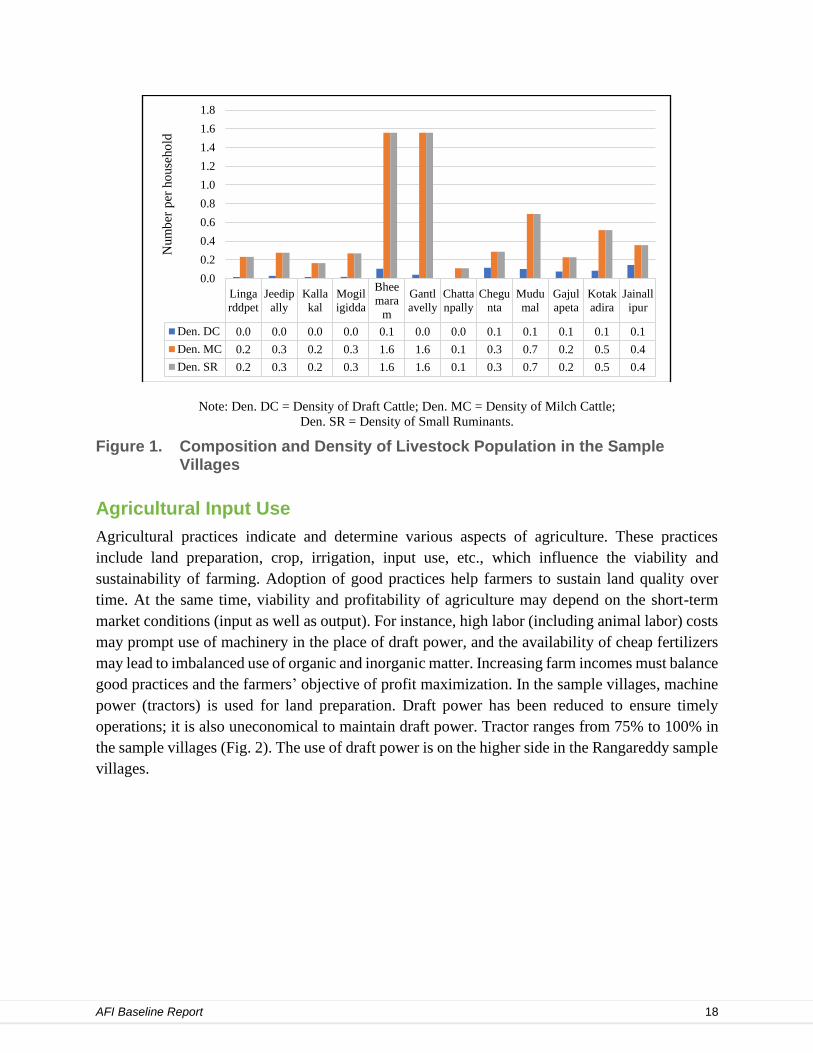
Livestock
Livestock is an important activity associated with agriculture, as they are interdependent. While
livestock provides draft power, manure, and nutrition, milk, and milk products to the rural sector,
agriculture provides fodder to the livestock. The composition and density of livestock determines
the energy contribution of livestock to farming and the availability of FYM in the village. The
composition of livestock in the sample villages favors milch cattle and small ruminants (Fig. 1).
In most of the sample villages, the density of draft power is close to zero. In fact, our discussions
with the farmers indicated that draft cattle have been declining over the years due to mechanization.
The density of milch cattle and small ruminants has risen in recent years due to their increased
economic contribution. Households depend on the income from the regular sale of milk. Small
ruminants are used for penning as well as income from their sale (meat). The higher density of
small ruminants is also due to the state subsidy given to some communities. The density of small
ruminants tends to be greater in the sample village where livestock-rearing community is present.
The average density of milch cattle and small ruminants is around two to three per household in
most villages. Two of the sample villages in Rangareddy have the highest density of animals per
household at 1.5.
AFI Baseline Report 18
Note: Den. DC = Density of Draft Cattle; Den. MC = Density of Milch Cattle;
Den. SR = Density of Small Ruminants.
Figure 1. Composition and Density of Livestock Population in the Sample Villages
Agricultural Input Use
Agricultural practices indicate and determine various aspects of agriculture. These practices
include land preparation, crop, irrigation, input use, etc., which influence the viability and
sustainability of farming. Adoption of good practices help farmers to sustain land quality over
time. At the same time, viability and profitability of agriculture may depend on the short-term
market conditions (input as well as output). For instance, high labor (including animal labor) costs
may prompt use of machinery in the place of draft power, and the availability of cheap fertilizers
may lead to imbalanced use of organic and inorganic matter. Increasing farm incomes must balance
good practices and the farmers’ objective of profit maximization. In the sample villages, machine
power (tractors) is used for land preparation. Draft power has been reduced to ensure timely
operations; it is also uneconomical to maintain draft power. Tractor ranges from 75% to 100% in
the sample villages (Fig. 2). The use of draft power is on the higher side in the Rangareddy sample
villages.
Linga
rddpet
Jeedip
ally
Kalla
kal
Mogil
igidda
Bhee
mara
m
Gantl
avelly
Chatta
npally
Chegu
nta
Mudu
mal
Gajul
apeta
Kotak
adira
Jainall
ipur
Den. DC 0.0 0.0 0.0 0.0 0.1 0.0 0.0 0.1 0.1 0.1 0.1 0.1
Den. MC 0.2 0.3 0.2 0.3 1.6 1.6 0.1 0.3 0.7 0.2 0.5 0.4
Den. SR 0.2 0.3 0.2 0.3 1.6 1.6 0.1 0.3 0.7 0.2 0.5 0.4
0.0
0.2
0.4
0.6
0.8
1.0
1.2
1.4
1.6
1.8
Num
ber
per
ho
use
ho
ld

AFI Baseline Report 19
Figure 2. Use of Draft and Machine Power in the Sample Village
The decline in draft power is compensated by the increased number of milch cattle and small
ruminants. About 47% of the farmers use FYM, or penning, though the proportions vary across
sample villages (Fig. 3). Mahabubnagar has the highest proportion of farmers using FYM,
followed by Rangareddy (27%) sample villages, while only 7% of Medak farmers use FYM. All
of the farmers use chemical fertilizers and pesticides. They do not use either vermicompost or
organic pesticides, such as neem oil. Very few farmers in the sample villages (<1%) use micro
irrigation (Fig. 3). Adoption of micro irrigation is seen only in Rangareddy district sample villages
and two sample villages of Mahabubnagar. At the aggregate level, the adoption level is just 1%.
Given the water scarcity coupled with heavy dependence on groundwater, there is much
potential to promote micro irrigation in the sample region. Even the limited adoption of micro
irrigation is due to the subsidies and promotion of drip irrigation in the horticulture programs.
Despite the promotional activities, adoption of drip irrigation is marginal and the area under
horticulture (fruit) crops is very limited, e.g., only 40 acres of mango gardens are reported in
Mahabubnagar district (Jainallipur).
85 90 95
80 75 75
90 90 95 95 90100
15 10 5
20 25 25
10 10 5 5 100
0
10
20
30
40
50
60
70
80
90
100
% o
f use
Mechinary DraftMachinery

AFI Baseline Report 20
Figure 3. Use of FYM and Adoption of Micro Irrigation in the Sample Villages
Access to Markets
Input and output markets are instrumental in ensuring crop yields and incomes. Access to quality
inputs at reasonable prices and the correct advice on application of appropriate inputs helps in
protecting the crops at reasonable costs, and access to product markets ensures getting the right
price for the produce. Access to information and markets is necessary for enhancing farm incomes.
Farmers in only one-third of the sample villages reported that they rely on an agricultural extension
network for information and advice on input use, while in others they take the advice of input
dealers or make their own decisions. Going by the previous experience, the dependence on input
dealers has lessened substantially in the region (Uday et. al., 2020). This may be attributed to the
improved extension services in Telangana in the recent years. However, in all the villages, farmers
buy all their inputs from the dealers, as there are no other avenues like FPOs to buy their inputs.
Of late, some of the FPOs in India are actively involved in input business (Reddy et al., 2019).
However, in the case of output, farmers in 10 out of 12 villages sell their produce to middlemen.
Farmers in only two villages take their produce to the agriculture markets. These two villages
(Chegunta and Mudumal in Mahabubnagar district) are the farthest from the markets. Perhaps
middlemen avoid traveling to distant places for buying their produce to cut transportation costs.
Farmers have reported that selling in agricultural markets involves a lot additional costs, such as
transportation, labor, commission, etc. They also do not receive prompt payment. Lately, the state
government is trying to streamline the process to encourage farmers to bring their produce to the
markets.
Kalla
kal
Jeedi
pally
Linga
rddpe
t
Meda
k
Gantl
avell
y
Mogi
ligidd
a
Bhee
mara
m
Chatt
anpal
ly
Rang
aRed
dy
Cheg
unta
Gajul
apeta
Mudu
mal
Kota
kadir
a
Jainal
lipur
Maha
bubn
agar
ALL
% Farmers using FYM 5 9 8 7 46 11 45 5 27 33 16 61 46 78 28 47
% Farmers using MI 0.0 0.0 0.0 0.0 4.6 1.1 4.5 1.9 1.5 0.0 0.0 0.6 0.0 2.4 1 1
0
10
20
30
40
50
60
70
80
90
% o
f F
arm
ers

AFI Baseline Report 21
IV Anatomy of Agriculture: Dynamics and Drivers
This section discusses on the household-level information pertaining to various aspects of farming,
such as technical aspects (land preparation, irrigation methods, input use, etc.), economic aspects
(returns to agriculture and allied activities), social aspects (differences between economic groups),
and markets (access and constraints of input and output markets). Most of these practices and the
associated impacts largely depend on the economic status or farm size of the household. Economic
status is also determined by the nature of house as well as other facilities (Tables A2 to A5). About
60% of the households own cement houses. All of the houses have electricity, while about 60% of
the houses have tap water connections. Medak has the highest proportion of households with tap
connections (78%), Rangareddy villages have the lowest proportion of households with tap
connections (54%), and 63% of the houses in Mahabubnagar have tap connections (Table A2).
More than 90% of the households use private toilets, with 100% of households in Rangareddy
villages and about 90% in Medak and Mahabubnagar (Table A3). Households possess agriculture
implements and other household assets (Tables A4 and A5). Awareness about nutrition is low, as
only 44% of the households reported awareness about nutrition (Table A6).
Agricultural practices differ across farm size class and economic status, as some of the practices
like crop choices, input use, energy use, access to credit, etc., depend on the ability of the
household to adopt. The larger the farm size, the greater the possibility of adopting GAPs. These
variations can be observed within and between the villages. Similarly, households’ ability to adopt
GAPs is also linked to access to irrigation, since irrigation enhances the land and labor
productivity. As mentioned previously, marginal and small farmers account for more than 70% of
the sample households.
Given the objective of accelerating the farm and allied sector income of the households, it is
important to assess the present contribution of various sectors to household income. Income from
agriculture (crop production) contributes less than 50% in the majority (nine out of 12) of the
sample villages. Contribution of agriculture ranges between 24% to 77% (Table 8). Medak has the
lowest contribution (33.6%), followed by Rangareddy (39.7%) and Mahabubnagar (53.5%). Peri-
urban villages have the lowest contribution from agriculture. When livestock is added, the
contribution is above 40% in the majority of the villages. In all of the peri-urban villages, the share
of employment income is as much as or higher than agriculture. The contribution of welfare
programs is also substantial in number of villages, ranging between 9% and 18.5%. The
contribution of welfare is higher in rural locations due to the farmer-based programs, such as Rytu
Bhandu.2 Within the rural areas, the contribution of agriculture varies widely, indicating the
potential for increasing the incomes from crop and livestock production. On the other hand, the
low contribution of agriculture in some villages indicates that it may not receive much of farmers’
attention given its limited contribution to household income. There is a need to understand the
2 Under this program, each farmer gets a cash transfer of Rs. 10,000 per acre per year.

AFI Baseline Report 22
constraints and contributing factors responsible for the poor contribution of crop and livestock
production.
Table 8. Income by Source in the Sample Villages (%)
Village Agriculture Livestock & Poultry Employment Business Pension
Government Welfare
Programs Others*
Kallakal 24.2 14.3 42.7 5.3 2.3 9.4 1.8
Jeedipally 33.4 10.2 41.6 4.4 3.7 6.4 0.4
Lingareddipet 45.4 3.0 34.9 0.0 3.8 10.2 2.6
Medak 33.6 9.6 40.0 3.4 3.2 8.6 1.6
Gantlavelli 26.2 21.0 26.2 7.8 4.1 9.3 5.4
Mogalagidda 54.5 19.4 10.0 0.0 6.7 9.3 0.0
Bhemaram 39.7 6.1 23.8 10.2 5.6 13.3 1.3
Chattanpalle 36.6 10.4 23.9 9.7 3.8 15.2 0.3
Rangareddy 39.7 14.3 20.8 6.8 5.0 11.9 1.6
Chegunta 76.8 0.6 1.6 0.0 1.6 19.5 0.0
Gajulapeta 36.8 6.8 22.0 6.5 4.6 17.7 5.8
Mudumal 63.0 0.2 5.9 1.9 6.0 22.9 0.0
Kotakadira 37.9 2.9 28.8 6.5 3.5 19.0 1.3
Zainallpur 33.6 2.1 40.2 0.0 2.4 14.3 7.3
Mahabubnagar 53.5 2.1 17.8 2.3 3.1 18.5 2.6
Note: * Includes village services carpentry, barber, washer men, etc.
While the contribution of agriculture to household income is associated with farm size, it is not
influenced by the proportion of area under irrigation. Mahabubnagar has a higher average farm
size (4.64 acres) with a low proportion of area under irrigation (39.4%) when compared to Medak
and Rangareddy districts (Table 9). The lower proportion of irrigation in Mahabubnagar is
reflected in low cropping intensity. In fact, Chegunta village in Mahabubnagar district has the
highest contribution from agriculture as well as highest household income. While it has highest
average farm size (AFS), it has the lowest proportion of area under irrigation (% AI). Households
in the community revealed that though they grow only one rainfed crop (cotton, jowar, or red
gram), they receive a good income due to higher market prices for cotton and red gram coupled
with good yields. Households in villages using irrigation grow mostly paddy. Also, because
groundwater is the main source of irrigation and is dependent on local rainfall and recharge, access
to irrigation is not guaranteed all the time.
The low share of agricultural income in Medak villages could be because the share of income from
employment is as high as 40%, due to its 100% peri-urban characteristics. In Rangareddy,
employment and livestock contribute substantially. In the context of peri-urban locations, unless
income from crop production increases substantially, households tend to neglect agriculture as a
secondary source of income. Average household income is higher for large farmers in
Mahabubnagar and Rangareddy districts, while small farmers have higher incomes in Medak
district (Fig. 4). This could be due to their involvement in the labor (wage incomes) in the nearby
urban markets.

AFI Baseline Report 23
Table 9. Average Farm Size (acres) and Percentage of Area Irrigated of Sample Households by Economic Group
Village
Marginal Small Medium Large All
AFS % AI AFS % AI AFS % AI AFS % AI AFS % AI CI
Kallakal 1.42 45.6 3.80 90.0 5.43 49.0 10.50 57.1 2.30 52.9 107
Jeedipally 1.18 79.0 3.50 100.0 6.00 100.0 0 0 1.61 82.2 130
Lingareddipet 1.19 81.5 3.76 75.0 6.50 52.2 0 0 1.83 78.9 122
Medak 1.24 69.4 3.47 88.5 5.27 60.5 6.00 57.1 1.79 71.3 118
Gantlavelli 1.59 52.7 4.13 55.0 6.63 58.3 11.50 22.7 3.41 52.1 138
Mogalagidda 1.52 65.0 3.81 70.8 6.35 66.4 12.01 100.0 3.31 68.4 135
Bhemaram 1.69 22.2 3.91 30.8 7.32 17.2 15.50 21.6 4.02 23.3 107
Chattanpalle 1.93 30.8 3.73 67.9 8.30 92.5 12.00 68.2 4.20 57.3 109
Rangareddy 1.65 44.3 3.76 57.2 6.32 56.5 11.44 53.1 3.50 50.1 121
Chegunta 2.07 0.0 4.40 0.0 6.33 5.3 16.22 0.0 8.59 03.0 101
Gajulapeta 1.37 42.9 3.22 38.3 6.42 43.3 0 0 3.41 40.2 117
Mudumal 1.66 25.0 3.37 42.2 7.37 69.0 12.00 100.0 4.31 47.1 126
Kotakadira 1.74 50.0 3.54 60.2 7.14 100.0 11.10 100.0 4.11 66.2 108
Zainallpur 1.70 0.0 3.35 41.7 6.32 50.0 12.55 100.0 4.20 40.4 127
Mahabubnagar 1.65 30.0 3.27 43.6 6.01 39.6 14.07 35.7 4.64 39.4 113
All 1.47 53.1 3.43 52.2 6.04 45.9 12.81 42.7 3.55 50.9 116
Note: AFS= Average Farm Size; % AI= Percentage of Area Irrigated; CI= Cropping Intensity.
Figure 4. Average Household Income of Sample Households by Socio-Economic Groups (in Rs./HH)
Crop Profiles
On average, farmers grow one to two crops in all the sample villages, though a few medium and
large farmers grow three crops (Table A7). Major crops grown in the region are paddy, cotton,
0
100000
200000
300000
400000
500000
600000
700000
800000
Rs.
per
Hou
seh
old
Marginal Small Medium Large All

AFI Baseline Report 24
jowar, red gram, maize and castor.3 Paddy accounts for 37% of the gross area, followed by cotton
(24.4), jowar (19%), red gram (7.6%), maize (4.9%), and castor (2.4%) (Table 10). Paddy is the
only crop grown in all the sample villages. Jowar and red gram are the most popular crops after
paddy in the sample villages. Maize and castor are grown in few villages. Medak and Rangareddy
villages grow mainly paddy and jowar; Mahabubnagar villages grow paddy and cotton. Very few
villages in Medak and Rangareddy districts grow vegetable and fruit crops and that is on a very
limited area of about 20 acres (Table A2). Paddy is grown under irrigated conditions in kharif as
well as rabi (depending on the availability of water) in all the villages, and other crops are grown
under rainfed conditions in kharif (June-October). The main source of irrigation is bore wells and
stream water (Table A8). Vegetables and fodder are also grown in rabi although limited. There are
no differences in cropping patterns across farm-size classes. The cropping pattern indicates that
the limited water resources available are allocated to paddy, which may be an inefficient allocation
of resources. Also, all of the farmers use flood irrigation, and there is no practice of micro irrigation
in the sample villages. The same water could be reallocated to irrigated dry crops, such as cotton,
vegetables, etc., on larger area and achieve a higher output (ACIAR, 2015). For instance, in
Chegunta village, farmers allocate more than 80% of their area to cotton and derive the highest
average household income. This clearly indicates the scope for reallocating water to increase
farm income through choosing appropriate crops and methods of irrigation. Shifting away
from paddy4 to low water-intensive crops with micro irrigation can substantially improve
the area under protective irrigation crop yield. Even the existing crops like cotton, maize,
etc., could be provided with one or two irrigations, which would enhance their productivity
substantially.
Table 10. Area under Crops in the Sample Villages during Kharif and Rabi (%)
District
Crops
Paddy Cotton Jowar Red
Gram Maize Castor
Kallakal 45.8 0 35.9 6.8 11.1 0
Jeedipally 75.9 0 13.4 1.9 7.2 0
Lingareddipet 71.5 1.2 18.9 2.6 0 0
Medak 65.0 0.4 22.4 3.7 5.6 0
Gantlavelli 39.4 0 6.8 0 42.9 0
Mogalagidda 57.0 20.0 13.5 3.6 0 0
Bhemaram 19.4 21.2 51.0 2.0 0 0
Chattanpalle 26 2.0 55 2.0 0 0
Rangareddy 34.7 11.1 32.4 1.9 10.6 0
Chegunta 1.6 81.3 1.4 15.7 0 0
Gajulapeta 34.5 13.7 18.4 15.8 0 4.1
Mudumal 46.9 42.1 0 11.0 0 0
Kotakadira 64.3 0 5.4 10.5 0 18.2
3 Vegetable are grown on a very small scale among the sample households; hence, vegetable are not a major crop.
Vegetables account for less than 1% of area. In the qualitative research, farmers did mention vegetable crops during
summer under wells. In our sample households, a total area of 15 acres was under vegetable crops, including seven
varieties. Vegetables are grown only in three villages of Medak and three villages of Rangareddy. 4 Micro irrigation can be used even on paddy (personal communication with Dr. Yashpal Singh Sheharawat).

AFI Baseline Report 25
District
Crops
Paddy Cotton Jowar Red
Gram Maize Castor
Zainallpur 33.1 3.8 40.3 5.2 6.9 6.4
Mahabubnagar 30.2 38.8 10.6 12.1 1.2 4.4
All 36.6 24.4 19.3 7.6 4.9 2.4
Land Preparation and Sowing
Land preparation is the starting point for adopting GAPs at the farm level. Understanding the soil
quality and identifying the appropriate methods of cultivation is critical for achieving better yields
and incomes. Soil testing in Telangana State is a recent phenomenon and has yet to become popular
with the farmers. Across the sample villages, 1-5% of the sample farmers have had their soils
tested in 11 out of the 12 sample villages (Table A10). These tests were carried out by the
government extension services. Farmers in only four villages have reported adopting the
recommended practices. Even in these villages, only 1-2% of the farmers have reported adopting
the practices. This indicates poor awareness about the importance of soil testing and adopting
the recommendations. Farming in these villages could be improved through better soil
management practices.
All three sources of energy (human, animal, and machine) are used in land preparation by all of
the sample farmers. Almost 100% of the households use tractors in plowing the land, while 54%
of the households use human energy and 35% use animal power5 (Table 11). The peri-urban district
of Medak uses less animal and human power. Rangareddy district uses greater human power (62%)
while Mahabubnagar uses more of animal power (44%) when compared to other districts. This
clearly indicates the declining importance of draft animals in land preparation, more so among the
marginal and small farmers when compared to medium and large farmers (Table 11). Only medium
and large farmers are able to maintain the draft power. In the case of sowing, dependence on
machine power is very limited, as most of the farmers use human and draft power (Table 12). Only
in the case of paddy transplanting do a few farmers use machine power. For all other rainfed and
irrigated dry crops (cotton, jowar, etc.), direct or inline sowing is used.
5 Some villages reported 0% use of draft power during our qualitative research.

AFI Baseline Report 26
Table 11. Land Preparation during Kharif (Percentage of Farmers using Manual/ Animal/Machinery)
Village Marginal Small Medium Large All
Man Ani Mach Man Ani Mach Man Ani Mach Man Ani Mach Man Ani Mach
Kallakal 36 12 96 80 100 100 100 50 100 100 0 0 48 27 97
Jeedipally 50 32 100 50 50 100 0 0 100 0 0 0 48 33 100
Lingareddipet 52 15 96 25 0 100 0 0 100 0 0 0 45 12 97
Medak 46 20 98 54 54 100 40 20 100 100 0 0 47 24 98
Gantlavelli 84 21 100 38 25 100 75 25 100 0 0 100 67 21 100
Mogalagidda 55 45 95 67 33 100 80 80 100 100 100 100 64 52 97
Bhemaram 61 56 100 88 63 100 50 17 100 50 50 100 65 50 100
Chattanpalle 62 0 100 50 7 93 60 0 100 0 0 100 53 3 97
Rangareddy 66 33 99 58 28 97 65 30 100 38 0 100 62 31 99
Chegunta 50 100 100 100 100 100 32 53 95 56 78 100 45 67 97
Gajulapeta 29 29 100 60 40 95 67 50 83 0 0 0 55 39 94
Mudumal 13 25 100 60 20 100 67 67 100 100 100 100 52 36 100
Kotakadira 50 38 100 28 17 100 80 40 100 100 50 100 45 27 100
Zainallpur 80 100 100 65 40 100 33 50 100 0 0 100 58 48 100
Mahabubnagar 40 47 100 55 33 99 49 53 96 57 64 100 51 44 98
All 53 29 98 56 34 98 53 44 97 52 52 100 54 35 98
Note: Man = Manual; Ani = Animal; Mach = machine.
Table 12. Planting Method (Percentage of Farmers using Manual/Animal)
Village
In Line Transplanting
Season Crop Area Irrigation % of
Farmers Season Crop Area Irrigation % of
Farmers
Kallakal Kharif Jowar 24.3 No 100 Kharif Paddy 30.1 Yes 100
Jeedipally Kharif Paddy 2 No 8 Kharif Paddy 49.3 Yes 92
Lingareddipet Kharif Paddy 1.5 No 4 Kharif Paddy 85.6 Yes 96
Gantlavelli Kharif Maize 53.5 No 100 Kharif Paddy 0 Yes 0
Mogalagidda Kharif Paddy 5.28 Yes 5 Kharif Paddy 41.1 Yes 95
Bhemaram Kharif Jowar 71.7 No 100 Kharif Paddy 18.8 Yes 100
Chattanpalle Kharif Jowar 67.8 No 100 Kharif Paddy 30 Yes 100
Chegunta Kharif Cotton 236.8 No 100 Kharif Paddy 0 No 0
Gajulapeta Kharif Jowar 18.9 No 100 Kharif Paddy 31.3 Yes 100
Mudumal Kharif Paddy 6 Yes 17 Kharif Paddy 57.3 Yes 83
Kotakadira Kharif Paddy 0.45 No 5 Kharif Paddy 77.6 Yes 95
Zainallpur Kharif Paddy 5.1 Yes 20 Kharif Paddy 24.0 Yes 80
Note: In line and direct sowing are the same. Random method is not in use.
Input Use
Seed
Hybrid, HYV, and local seeds are used by the sample farmers in all the villages. Most of the
farmers use hybrid and HYV seeds. At the aggregate level, 98% of the sample farmers use hybrid
or HYV seeds, while only 16% of the farmers use local seed (Fig. 5). The highest proportion of
Rangareddy district farmers (87%) use hybrid seeds, followed by Medak (55%) and

AFI Baseline Report 27
Mahabubnagar (42%). In fact, the majority of Mahabubnagar farmers use HYV seeds (52%). Use
of local seed is also greater in Mahabubnagar. There are wide variations in the adoption of hybrid
and HYV seeds across the sample villages. Use of local seeds ranges between 3% in Medak district
(Jeedipally and Lingareddipet) and 49% in Mahabubnagar district (Jainallipur). Local seed is used
mostly in the case of jowar, followed by red gram, maize, and paddy; no local seed is used in the
case of cotton (Table A11). There is not much variation in the quantity of seed used across the
villages, ranging from 27 to 31 kg/acre for paddy and 1.25 to 1.5 kg/acre for cotton (Table 13).
The seed quantity could be on the higher side due to a lack of awareness. The cost of seed also
does not vary much, indicating that sample farmers do not face any price discrimination across the
villages. However, farmers pay a relatively higher price for hybrid seeds, followed by HYV and
local seeds. Farmers purchase the seeds from the local dealers.
Figure 5. Percentage of Households using Hybrid, HYV, and Local Seeds
Kal
lak
al
Jee
dip
ally
Lin
gar
edd
ipet
Me
dak
Ga
ntla
vell
i
Mo
gal
agi
dda
Bhe
mar
am
Cha
ttan
pall
e
Ran
gar
edd
y
Che
gun
ta
Gaj
ula
pet
a
Mu
du
mal
Kot
aka
dira
Zai
nall
pur
Ma
hab
oob
nag
ar
AL
L
Hybrid seed 46 52 67 55 82 94 82 91 87 49 39 36 39 46 42 60
HYV seed 64 52 33 50 12 12 15 9 12 52 36 70 55 46 52 38
Local seed 21 3 3 9 27 6 12 3 12 15 33 6 12 49 23 16
0
10
20
30
40
50
60
70
80
90
100
% o
f H
ouse
ho
lds

AFI Baseline Report 28
Table 13. Use of HYV, Hybrid, and Local Seed per Acre
Village
HYV Hybrid Local
Seaso
n
Cro
p
Qu
an
tity
(kg
)
Co
st
(Rs
.)
Seaso
n
Cro
p
Qu
an
tity
(kg
)
Co
st
(Rs
.)
Seaso
n
Cro
p
Qu
an
tity
(kg
)
Co
st
(Rs
.)
Kallakal Kharif Paddy 28 850 Kharif Paddy 30 1050 Kharif Paddy 25 700
Jeedipally Kharif Paddy 30 900 Kharif Paddy 25 800 Kharif Paddy 25 700
Lingareddipet Kharif Paddy 31 1000 Kharif Paddy 30 1070 0 0 0 0
Medak 30 920 28 930 0 0 25 700
Gantlavelli Kharif Paddy 30 900 Kharif Paddy 28 950 Kharif Paddy 26 700
Mogalagidda Kharif Paddy 30 900 Kharif Paddy 30 1080 0 0 0 0
Bhemaram Kharif Paddy 30 875 Kharif Paddy 27 900 0 0 0 0
Chattanpalle Kharif Paddy 26 800 Kharif Paddy 29 1030 Kharif Paddy 30 800
Rangareddy 24 880 28 975 0 0 28 750
Chegunta Kharif Cotton 1.50 2400 Kharif Cotton 1.25 2450 0 0 0 0
Gajulapeta Kharif Paddy 31 1005 Kharif Paddy 28 950 0 0 0 0
Mudumal Kharif Paddy 26 860 Kharif Paddy 27 875 0 0 0 0
Kotakadira Kharif Paddy 27 850 Kharif Paddy 27 890 Kharif Paddy 25 700
Zainallpur Kharif Paddy 28 850 Kharif Paddy 26 800 Kharif Paddy 30 800
Mahabubnagar -- -- -- -- 28 750
Water
As discussed previously, access to irrigation water ranges between 30% and 70% of the area across
the three sample districts and varies widely among the sample villages (2%6 to 80%) (Table 9).
Cropwise details of irrigation are presented in Table 14. While 90% of paddy area is under
irrigation, other crops are only partially irrigated, as the other crops are low water-intensive crops.
Only maize is irrigated 100% in three sample villages and maize needs three to four irrigations.
Though the area under maize is less, 52% of it is irrigated at the aggregated level. In the case of
red gram, jowar, and cotton, 15-21% of their area is irrigated. Flood irrigation method is the most
popular, as very few villages have micro irrigation systems. Though none of the sample households
reported using micro irrigation, the drip method of irrigation is used in all the sample villages of
Rangareddy, though on a limited scale. The drip method is used for fruit crops, such as mango,
lemon, etc., for which drip systems are provided with the subsidy from the horticulture
development program of the central government.
6 This is based on qualitative research, as none of the sample households reported area under irrigation.

AFI Baseline Report 29
Table 14. Proportion of Irrigated Area by Crops in the Sample Villages
Village Paddy Cotton Red Gram Jowar Maize
Kallakal 95.0 0 47.8 27.5 100.0
Jeedipally 98.7 0 0.0 73.2 100.0
Lingareddipet 63.4 0.0 44.4 39.0 0
Medak 83.3 0.0 39.3 40.0 100.0
Gantlavelli 98.5 0 0 5.9 32.4
Mogalagidda 100.0 57.5 0.0 31.5 0
Bhemaram 87.0 0.0 90.9 5.6 0
Chattanpalle 100.0 0.0 20.0 19.9 0
Rangareddy 97.6 24.2 31.5 14.0 32.4
Chegunta 0.0 3.9 0.0 0.0 0
Gajulapeta 93.8 0.0 15.5 14.6 0
Mudumal 82.2 50.2 21.4 0 0
Kotakadira 98.5 0 63.2 0.0 0
Zainallpur 100.0 0.0 46.7 29.4 100.0
Mahabubnagar 90.9 13.9 18.4 22.2 100.0
Total 90.5 15.4 20.9 20.6 52.4
Fertilizers
Farmers purchase fertilizers from the dealers and merchants (Fig. 6). The majority of the farmers
pay in cash, and thus, there is no credit obligations for most farmers. Credit obligations can often
lead to a compromise in quality. Farmers use mainly five types of inorganic fertilizers – urea,
diammonium phosphate (DAP), single superphosphate (SSP), triple superphosphate (TSP), and
muriate of potash (MOP). At the aggregate level, farmers use more than 0.94 mt/ha of chemical
fertilizers, which is double that of the recommended dose. Among the districts, the average
usage ranges between 1.35 mt/ha in Medak and to 0.8 mt/ha in Mahabubnagar (Table 15). Fertilizer
use is higher in the irrigated villages, where paddy is grown. Though it is expected that commercial
crops such as cotton are more fertilizer intensive, cotton is grown mostly under rainfed conditions
(kharif) in the sample villages. Fertilizer consumption across size classes does not much. In
most cases, however, medium and large farmers tend to use more fertilizer per acre when compared
to marginal and small farmers (Table 16). Due to the use of irrigation mainly for paddy, the
consumption of fertilizer is higher on paddy compared to other crops (Tables A12 to A16). As far
as organic matter is concerned, farmers in the sample villages use only FYM. They use about
4.4 mt/ha of FYM at the aggregate level (Table 16) against the recommended quantity of
11-22.5 mt/ha (MANAGE, 2017). Medak district villages use highest quantity (4.95 mt/ha) of
FYM, followed by Mahabubnagar (4.45 mt/ha) and Rangareddy (3.75 mt/ha) (Table 17). This is
despite the fact that Rangareddy has a higher density of livestock compared to Medak. FYM is
used mainly on kharif crops of paddy, maize, and cotton. Sample farmers are not using any
other organic manure, such as vermicomposting, green manure, or biochar.7 There is a clear
7 Green manure is ploughing of the standing crops, usually done in the case of leguminous crops. Biochar is burning
stubble in the field.

AFI Baseline Report 30
need for increasing the application of organic matter (at least doubling). Promoting
vermicomposting, green manure, etc., should be explored.
Figure 6. Source of Fertilizers (Percentage of Farmers Buying)
Table 15. Use of Chemical Fertilizers in the Sample Villages (in mt/ha for All Crops and All Seasons)
Villages
Urea DAP SSP TSP MOP
Quantity Cost (Rs.) Quantity
Cost (Rs.) Quantity
Cost (Rs.) Quantity
Cost (Rs.) Quantity
Cost (Rs.)
Kallakal 0.43 1,255 0.24 2,635 0.07 667 0.29 1,989 0.12 819
Jeedipally 0.81 2,349 0.21 2,041 0.17 750 0.26 1,738 0.18 1,359
Lingareddipet 0.41 1,167 0.38 4,075 0.00 0 0.19 1,383 0.09 783
Medak 0.53 1,548 0.28 2,971 0.14 722 0.25 1,740 0.15 1,066
Gantlavelli 0.24 608 0.20 1,776 0.00 0 0.12 925 0.13 1,250
Mogalagidda 0.42 1,011 0.21 1,919 0.00 0 0.14 945 0.14 1,172
Bhemaram 0.21 532 0.18 1,746 0.16 619 0.12 759 0.11 1,041
Chattanpalle 0.23 663 0.15 1,551 0.00 0 0.11 800 0.10 753
Rangareddy 0.28 720 0.19 1,762 0.16 619 0.13 885 0.12 1,095
Chegunta 0.19 529 0.18 1,918 0.07 393 0.12 785 0.09 468
Gajulapeta 0.23 880 0.19 1,815 0.12 650 0.10 769 0.12 887
Mudumal 0.26 733 0.21 2,024 0.08 272 0.14 658 0.13 800
Kotakadira 0.32 766 0.22 1,964 0.08 306 0.13 766 0.12 1,064
Zainallpur 0.31 787 0.21 2,080 0.10 438 0.16 908 0.12 919
Mahabubnagar 0.26 744 0.20 1,963 0.09 404 0.13 770 0.12 850
All 0.33 918 0.21 2,111 0.11 490 0.16 1,020 0.13 984
0
20
40
60
80
100
120
% o
f F
arm
ers
% of HH buying fertilizer from merchants % of HH buying fertilizer from dealers

AFI Baseline Report 31
Table 16. Total Fertilizer Use per Acer across Size Classes (in mt/ha)
Villages Marginal Small Medium Large All
Kallakal 0.51 0.56 0.52 0.54 0.52
Jeedipally 0.59 0.53 0.56 0.00 0.58
Lingareddipet 0.50 0.62 0.53 0.00 0.52
Medak 0.53 0.58 0.53 0.54 0.54
Gantlavelli 0.45 0.58 0.44 0.41 0.49
Mogalagidda 0.43 0.55 0.56 0.53 0.50
Bhemaram 0.44 0.47 0.40 0.45 0.44
Chattanpalle 0.39 0.45 0.34 0.54 0.42
Rangareddy 0.43 0.52 0.43 0.49 0.46
Chegunta 0.48 0.52 0.58 0.55 0.56
Gajulapeta 0.42 0.43 0.46 0.00 0.43
Mudumal 0.48 0.49 0.55 0.56 0.51
Kotakadira 0.56 0.63 0.50 0.60 0.59
Zainallpur 0.43 0.53 0.46 0.51 0.50
Mahabubnagar 0.48 0.51 0.53 0.55 0.51
All 0.49 0.52 0.49 0.51 0.50
Table 17. Use of Organic Fertilizers (in mt/ha)
Village
Animal (FYM)
Season Crop Quantity (mt/ha) Cost (Rs.)
Kallakal Kharif Paddy 4.34 2,028
Jeedipally Kharif Paddy 5.94 2,754
Lingareddipet Kharif Paddy 5.04 2,200
Medak Kharif Paddy 5.11 2,330
Gantlavelli Kharif Paddy 5.96 1,678
Mogalagidda Kharif Paddy 3.47 1,345
Bhemaram Kharif Paddy 3.51 1,077
Chattanpalle Kharif Paddy 3.26 1,031
Rangareddy Kharif Paddy 3.76 1,220
Chegunta Kharif Paddy 3.06 1,190
Gajulapeta Kharif Paddy 5.56 2,061
Mudumal Kharif Paddy 3.94 1,297
Kotakadira Kharif Paddy 5.90 1,818
Zainallpur Kharif Paddy 3.11 1,472
Mahabubnagar Kharif Paddy 4.46 1,652
All Kharif Paddy 4.41 1,709
Pesticides
Pests and diseases are the second important factor, after natural factors like rainfall, droughts,
floods, etc., that influence crop yields and profit margins. Paddy, cotton, and maize crops are
affected by pests and diseases in the sample villages. Major pests and diseases are listed in
Table 17. While incidence is common in all the villages, the intensity of pests and diseases is

AFI Baseline Report 32
critical in affecting the crop yields. In Rangareddy sample villages, 71% of the farmers reported
bad and very bad infestation. In Medak, 45% of the sample farmers reported bad and very bad
infestation, followed by 42% in Mahabubnagar district. In three sample villages of Rangareddy
district, paddy, cotton, and maize have been very badly affected in the majority of the cases
(Table 18). Only Chegunta village in Mahabubnagar has the lowest proportion (26%) of farmers
badly affected. At the aggregate level, farmers use 0.7 liters (L) of liquid and 0.56 kg of powder
pesticides (Table 19). Though there is not much variation across sample villages, Mahabubnagar
has the highest usage, followed by Medak and Rangareddy. Despite the fact that Rangareddy
sample villages have a high level of infestation, the use of pesticide is low. The infestation is high
due to lower application of pesticides. Across the size classes, large and medium farmers tend
to use more pesticides per acre compared marginal and small farmers.
Table 18. Incidence of Pests and Diseases in the Sample Villages
Village
Pests Diseases Level of Infestation
(% of HHs)
Season Crop Name Season Crop Name Slight Bad Very Bad
Kallakal Kharif Paddy
(I)
Stem borer,
brown plat
hopper
Kharif Paddy Sheath blight,
brown spot
59 38 3
Jeedipally Kharif Paddy
(I)
Stem borer,
brown plat
hopper
Kharif Paddy Sheath blight,
brown spot
47 53 0
Lingareddipet Kharif Paddy
(I)
Stem borer,
brown plat
hopper
Kharif Paddy Sheath blight,
brown spot
59 39 2
Medak 55 43 2
Gantlavelli Kharif Maize Fall armyworm Kharif Maize Leaf spot 32 60 8
Mogalagidda Kharif Paddy
(I)
Stem borer,
brown plat
hopper
Kharif Paddy Sheath blight,
blast
44 0 56
Bhemaram Kharif Cotton Sucking pest,
pink boll worm
Kharif Cotton Fusarium
wilt,
Cercospora
leaf spot
19 43 38
Chattanpalle Kharif Paddy
(I)
Stem borer,
brown plat
hopper
Kharif Paddy 25 30 45
Rangareddy 30 36 35
Chegunta Kharif Cotton Pink boll worm,
borers, sucking
pest
Kharif Cotton Fusarium
wilt,
Verticillium
wilt,
Cercospora
wilt
74
26
0
Gajulapeta Kharif Paddy
(I)
Stem borer,
hispa, BPH
Kharif Paddy Sheath blight,
Brow spot
55
35
10
Mudumal Kharif Paddy
(I)
Stem borer,
hispa, BPH
Kharif Paddy Sheath blight,
brown spot
59
41
0

AFI Baseline Report 33
Village
Pests Diseases Level of Infestation
(% of HHs)
Season Crop Name Season Crop Name Slight Bad Very Bad
Kotakadira
Kharif Paddy
(I)
Stem borer,
hispa, BPH
Kharif Paddy Sheath blight,
brown spot
48
44
7
Zainallpur
Kharif Jowar Stem borer,
Shoot fly
Kharif Jowar Wilt 52
44
4
Mahabubnagar 59 38 4
Total 51 39 11
Note: Irrigation status in parentheses: (I).
Table 19. Use of Pesticides in the Sample Villages (Quantity/Acre)
Village
Marginal Farmers
Small Farmers
Medium Farmers
Large Farmers All
Pe
sti
cid
es
(L)
Pe
sti
cid
es
(kg
)
Pe
sti
cid
es
(L)
Pe
sti
cid
es
(kg
)
Pe
sti
cid
es
(L)
Pe
sti
cid
es
(kg
)
Pe
sti
cid
es
(L)
Pe
sti
cid
es
(kg
)
Pe
sti
cid
es
(L)
Pe
sti
cid
es
(kg
)
Kallakal 0.68 0.42 0.63 0.18 0.75 0.77 0.92 0.68 0.46
Jeedipally 0.76 0.50 0.33 0.75 0.50 0.63 0 0 0.71 0.58
Lingareddipet 0.85 0.38 0.50 0.18 0.88 0 0 0.79 0.32
Medak 0.78 0.44 0.55 0.37 0.75 0.63 0.77 0.92 0.74 0.47
Gantlavelli 0.53 0 0.19 0.44 0.60 0 1.03 0 0.57 0.44
Mogalagidda 0.63 0.72 0.65 0.65 1.08 0 0.17 0.77 0.69 0.70
Bhemaram 0.59 0.45 0.28 0 0.47 0.75 1.14 0 0.49 0.60
Chattanpalle 0.67 0.55 0.45 0.33 0.23 0 0.48 0.91 0.47 0.59
Rangareddy 0.60 0.60 0.40 0.52 0.56 0.75 0.66 0.84 0.53 0.62
Chegunta 0.73 0.50 0.89 0.22 0.70 0.70 0.75 0.80 0.72 0.67
Gajulapeta 0.75 0 0.78 0.40 0.44 0.68 0.40
Mudumal 0.76 0 0.99 0.70 0.41 0.54 0.75 0.50 0.78 0.63
Kotakadira 0.85 0 0.89 0.66 0.31 0.56 0.27 0.84 0.58
Zainallpur 1.00 0 0.77 0.60 0.50 0.60 0.40 0.76 0.47
Mahabubnagar 0.81 0.50 0.86 0.54 0.58 0.63 0.72 0.62 0.76 0.58
All 0.75 0.49 0.72 0.51 0.59 0.64 0.70 0.70 0.70 0.56
Note: Pesticides included with units per liter include Monocrotophos, Corazen, Chlorpyriphos, Confidor, etc.
Pesticides with units in kilograms include Acephate, Tricyclazole, Granules, etc.
Labor
Labor has become one of the most scarce inputs for agriculture in recent years, especially after the
introduction of the employment guarantee program (MGNERG). Labor became not only scarce
but also expensive. This is more so in the peri-urban locations, where alternative employment
avenues are available along with better wages. Availability of labor has become a constraint in the
case of harvesting commercial crops, such as cotton. In our sample villages, labor use per acre is
about 35 days in most of the villages (Table 20). Only in villages such as Chegunta, where cotton
is the main crop, is labor usage more than 40 days. The contribution of women accounts for
two-thirds of the labor use. This is uniform across the sample villages and size classes. This
supports the argument for “feminization of agriculture.” In the case of labor use across farm

AFI Baseline Report 34
size classes, medium and large farmers seem to be using more labor per acre. It is widely
believed that marginal and small farmers use more labor than medium and large farmers due to the
availability of family labor. Though marginal and small farmers use more family labor, the share
of family labor in total labor use is only about 40% (Table 21). This indicates that the dependence
of marginal and small farmers on hired labor is higher. As a result, the increasing costs of labor
forces marginal and small farmers to reduce their labor inputs (Reddy, et. al., 2005). Medium and
large farmers have ability to employ more labor. In the case of marginal and small farmers, the
higher wages in the non-farm sector coupled with their natural preference for urban employment,
family labor is decreasing in farm activities. A detailed account of operation-wise labor use is
provided in Table A17.
Table 20. Total Labor Use per Acre (Days) across Size Classes in the Sample Villages
Village Marginal Small Medium Large All
Men Women Men Women Men Women Men Women Men Women Kallakal 10.3 21.1 14.0 26.3 12.9 18.3 13.0 23.0 11.2 21.8 Jeedipally 12.9 19.4 14.1 22.7 16.8 23.5 0 0 13.2 20.0 Lingareddipet 11.0 24.3 16.5 27.5 10.5 25.8 0 0 11.9 25.1 Medak 11.4 21.6 15.0 26.0 12.2 23.2 13.0 23.0 12.0 22.4 Gantlavelli 11.8 22.7 15.5 25.7 18.2 32.4 15.3 24.2 14.0 25.0 Mogalagidda 11.7 23.2 13.3 26.2 10.7 23.1 12.1 20.7 12.1 23.9 Bhemaram 11.9 25.4 10.9 22.5 11.7 20.4 12.1 21.1 11.6 22.9 Chattanpalle 10.1 22.6 11.6 18.3 16.4 28.2 13.5 29.9 12.5 22.8 Rangareddy 11.6 23.5 12.8 22.9 13.9 25.1 13.1 23.9 12.5 23.7 Chegunta 12.5 32.1 9.6 19.6 14.0 28.2 13.2 31.1 13.4 28.8 Gajulapeta 11.8 20.9 12.4 25.1 11.2 18.8 0 0 12.1 23.5 Mudumal 11.8 18.8 11.1 19.7 10.6 21.0 17.1 22.6 11.2 20.0 Kotakadira 13.5 22.9 11.7 21.3 11.3 19.3 14.7 25.6 12.3 21.7 Zainallpur 9.6 24.4 15.2 19.6 8.6 21.3 13.4 22.6 13.1 20.8 Mahabubnagar 11.9 22.3 12.9 21.7 11.7 23.4 13.5 28.4 12.5 22.9 All 11.5 22.5 13.1 22.6 12.6 24.1 13.3 26.0 12.4 23.1
Note: Labor includes land preparation, seeding, fertilizer application, weeding, irrigation, harvesting, and post-
harvest activities.

AFI Baseline Report 35
Table 21. Family Labor Use per Acre (Days) across Size Classes in the Sample Villages
Village
Marginal Small Medium Large All
Men Women Men Women Men Women Men Women Men Women
Kallakal 7.1 7.8 8.8 4.4 6.7 7.5 1.7 1.5 7.2 7.1
Jeedipally 6.7 8.5 6.8 5.4 4.7 5.5 0 0 6.6 8.0
Lingareddipet 6.1 7.7 10.5 8.6 4.7 4.8 0 0 6.7 7.5
Medak 6.6 8.0 9.0 6.3 5.3 5.7 1.7 1.5 6.9 7.5
Gantlavelli 5.1 7.3 9.7 9.8 3.7 7.1 1.1 0.4 6.0 7.5
Mogalagidda 7.9 7.3 6.8 6.2 5.6 9.8 5.8 3.9 7.1 7.0
Bhemaram 6.2 9.1 7.3 8.5 5.3 6.0 3.8 2.0 6.0 7.3
Chattanpalle 6.2 4.4 6.0 3.0 4.9 3.5 3.0 4.9 5.5 3.7
Rangareddy 6.4 7.3 7.3 6.5 5.0 6.2 3.5 2.8 6.2 6.4
Chegunta 7.3 7.8 6.8 5.1 4.5 6.0 2.0 0.5 4.0 4.2
Gajulapeta 6.0 7.6 7.3 6.9 3.4 2.9 0 0 6.5 6.4
Mudumal 7.1 5.5 6.3 5.2 3.6 3.3 3.5 1.5 5.4 4.5
Kotakadira 5.8 5.3 6.2 4.5 3.2 1.9 1.9 0.7 5.4 4.1
Zainallpur 6.9 7.0 8.5 8.2 4.6 4.3 2.0 2.6 7.0 6.9
Mahabubnagar 6.5 6.3 7.3 6.6 4.1 4.3 2.1 1.0 5.8 5.4
All 6.5 7.5 7.5 6.5 4.5 5.2 2.8 1.9 6.2 6.3
Credit
Credit is an important factor that influences crop yields. Timely use of inputs depends on the
availability of cash/credit with the farmers. While a number of earlier studies have shown that
farmers dependence on credit is quite high in Telangana (LNRMI, 2010), our sample villages
indicate a less severe situation. Overall, only 33% of the sample farmers have debt (Table 22). Of
the three sample districts, Mahabubnagar has the highest proportion (56%) of farmers with debt,
while Medak and Rangareddy districts have 16% and 17%, respectively. The average household
debt ranges between Rs. 28,333 in Kallakal (Medak) and Rs. 135,040 in Chegunta
(Mahabubnagar). The higher household debt could be due to the fact that in Chegunta more than
80% of the area is under cotton, which is highly input intensive (including labor). While large
farmers reported debt only in Mahabubnagar, a greater proportion of medium-size farmers have
debt. The amount of debt is also higher among medium-size farmers. Banks are the main source
of loans, as farmers take loans from money lenders in only two villages of Medak (Table 23).
Money lenders charge highest rate of interest, while banks charge around 10% in most cases.
Almost all of the sample farmers take loans for 12 months, i.e., agriculture loans. In all cases,
outstanding loans are less than the actual debt, since farmers repay the loans on a regular basis.
The debt-to-income ratio indicates the actual debt burden, which is the highest in Rangareddy
district (52%), followed by Mahabubnagar district (43%) and Medak (21%). This is reasonable
given that the debts are taken at a low interest rate from the institutional sources. The low debt
burden is mainly due to the welfare measures provided by the state government in recent years.
Most important among them is the cash transfer of Rs. 10,000 per acre per year toward input costs
to the farmers (started in 2018-19). Money is transferred directly to the farmers’ bank accounts

AFI Baseline Report 36
before the start of kharif season (Rs. 5,000) and before rabi season (Rs. 5,000). Other programs
include old-age pensions (Rs. 2,000 per month to all people above 60 years of age) and cash
support toward the marriage of a female child. These programs have reduced the cash dependence
of farmers.
Table 22. Average Debt (Rs./HH)
Village Marginal Small Medium Large All
Kallakal 28,750 (8) 25,000 (1) 0 0 28,333 (9)
Jeedipally 65,000 (2) 0 100,000 (1) 0 76,667 (3)
Lingareddipet 20,000 (1) 80,000 (3) 0 0 65,000 (4)
Medak 34,545 (11)
[14%]
66,250 (4)
[11%]
100,000 (1)
[16%]
0
(0)
46,563 (16)
[16%]
Gantlavelli 25,833 (6) 65,000 (2) 65,000 (1) 0 38,889 (9)
Mogalagidda 0 90,000 (2) 200,000 (1) 0 126,667 (3)
Bhemaram 59,667 (3) 80,000 (3) 206,667 (3) 0 115,444 (9)
Chattanpalle 0 100,000 (1) 200,000 (1) 0 150,000 (2)
Rangareddy 37,111 (9)
[13%]
81,250 (8)
[22%]
180,833 (6)
[30%]
0
(0)
89,957 (23)
[17%]
Chegunta 75,000 (2) 100,000 (1) 125,375 (16) 186,667 (6) 135,040 (25)
Gajulapeta 80,000 (1) 59,545 (11) 72,500 (4) 0 64,063 (16)
Mudumal 30,000 (4) 56,500 (8) 100,833 (6) 0 65,389 (18)
Kotakadira 25,000 (7) 89,750 (8) 45,000 (2) 200,000 (2) 72,789 (19)
Zainallpur 25,000 (3) 86,857 (7) 90,000 (3) 50,000 (1) 71,643 (14)
Mahabubnagar
35,294 (17)
[55%]
72,371 (35)
[45%]
105,194 (31)
[72%]
174,444 (9)
[60%]
86,565 (92)
[56%]
In () number of household taken loan and [%] are respective percentage of total sample farmers.
Table 23. Credit Details of Sample Households (Average per HH)
Village Source of
Credit
Loan Amount
(Rs.) Period
(months) Rate of Interest Outstanding
Debt/ Income Ratio
Kallakal Bank 28,333 12 10 19,222 11
Jeedipally Money lenders 76,667 12 36 50,000 30
Lingareddipet Money lenders 65,000 12 17 53,750 38
Medak Bank 46,563 12 17 33,625 21
Gantlavelli Bank 38,889 13 11 40,778 25
Mogalagidda Bank 126,667 14 8 116,667 64
Bhemaram Bank 115,444 11 3 115,889 76
Chattanpalle Bank 150,000 12 13 145,000 75
Rangareddy Bank 89,957 12 4 89,130 52
Chegunta Bank 135,040 12 10 109,640 36
Gajulapeta Bank 64,063 11 10 61,313 45
Mudumal Bank 65,389 10 14 64,722 52
Kotakadira Bank 72,789 11 12 62,579 46
Zainallpur Bank 71,643 12 11 64,500 34
Mahabubnagar Bank 86,565 11 11 75,859 43
All Bank 82,275 11 11 73,031 43

AFI Baseline Report 37
Produce Marketing
Marketing of produce in terms of distance, price information, sources, and time of sale can make
or break the fortunes of farmers. Sample villages vary widely in terms of distance from the markets,
ranging between 3 and 34 kilometers (km) (Fig. 7). These variations are observed even within the
sample districts. Within Mahabubnagar district, the distances vary between 6 and 34 km, while in
other districts the maximum distance is 18 km. Farmers in the Mahabubnagar sample villages
could be at a disadvantage. Despite the differences in distance, neighboring farmers are the main
source of market information, with more than 80% of the farmers depending on neighbors for
market information (Fig. 8). Retailer is the second main source of information. In Rangareddy
sample villages, 58% of the sample farmers also rely on retailers; in Medak 27% of the farmers
depend on wholesalers. Community groups also provide information to 38% of the households in
Rangareddy. It appears that villages in Rangareddy district rely on multiple sources of
market information compared to other districts. There are no FPOs in the sample villages.
Though there are agriculture markets and in two of the sample villages farmers reported
taking their produce to these markets (as revealed in our qualitative research), none of our
sample farmers have used them.
Figure 7. Distance from the Market
1413
5
11
8
11
18
3
10
32
11
34
17
6
20
14
0
5
10
15
20
25
30
35
40
Kil
om
eter
s

AFI Baseline Report 38
Figure 8. Source of Market Information (% HH)
Irrespective of the source of information and the distance from the market, the majority of the
farmers sell their produce to middlemen. Interestingly, the preference for middlemen seems to be
high even in the villages close to the markets (Fig. 9). This may be due to the convenience of
selling within the village. Only in Rangareddy did more than 40% of the sample farmers also sell
their produce to retailers in the nearby town. Most of the farmers sell their produce immediately
after harvesting (cotton) or after preliminary processing (paddy, red gram, jowar, and maize). Both
of these cases may be considered sales immediately after harvesting (Fig. 10). Less than 5% of the
farmers wait for higher price; these are large- and medium-size farmers.
Note: Figures do not add up to 100%, since some farmers do not sell their produce.
Figure 9. Output Sales to Different Market Sources (% HH)
Kalla
kal
Jeedip
ally
Linga
reddip
et
Meda
k
Total
Gantl
avelli
Moga
lagidd
a
Bhem
aram
Chatt
anpall
e
Ranga
reddy
Total
Cheg
unta
Gajul
apeta
Mudu
mal
Kotak
adira
Zainal
lpur
Maha
boobn
agar
Total
Grand
Total
Community group 6.1 9.1 9.1 8.1 39.4 36.4 44.1 32.4 38.1 12.1 18.2 9.1 0 6.1 9.1 18.6
Neighbour 90.9 78.8 78.8 82.8 78.8 84.8 94.1 91.2 87.3 90.9 78.8 75.8 66.7 87.9 80 83.2
Retailer 12.1 18.2 9.1 13.1 45.5 57.6 67.6 61.8 58.2 15.2 18.2 18.2 33.3 15.2 20 31.2
Wholesaler 27.3 33.3 21.2 27.3 6.1 0 8.8 8.8 6 15.2 15.2 6.1 6.1 15.2 11.5 13.6
Cell phone 9.1 9.1 12.1 10.1 21.2 30.3 17.6 29.4 24.6 9.1 6.1 12.1 6.1 9.1 8.5 14.3
App. based 0 0 0 0 0 3 0 0 0.7 0 0 0 0 0 0 0.3
others 6.1 3 9.1 6.1 15.2 6.1 2.9 0 6 3 6.1 0 9.1 9.1 5.5 5.8
0
10
20
30
40
50
60
70
80
90
100
% o
f H
H
Kallaka
l
Jeedipa
lly
Lingare
ddipet
Medak
Total
Gantlav
elli
Mogala
gidda
Bhemar
am
Chattan
palle
Rangar
eddy
Total
Chegun
ta
Gajulap
eta
Mudum
al
Kotaka
dira
Zainall
pur
Mahab
oobnag
ar Total
Grand
Total
Middle-man 51.5 51.5 48.5 50.5 42.4 48.5 52.9 38.2 45.5 48.5 39.4 48.5 42.4 54.5 46.7 47.2
Retailer 6.1 3 0 3 30.3 54.5 41.2 38.2 41 0 12.1 9.1 24.2 6.1 10.3 18.8
Wholesaler 21.2 24.2 12.1 19.2 3 24.2 20.6 5.9 13.4 9.1 18.2 9.1 9.1 12.1 11.5 14.1
0
10
20
30
40
50
60
% o
f H
H

AFI Baseline Report 39
Figure 10. Time of Sale
Crop Production Costs and Returns
Farmers’ ultimate objective is to maximize profits. As a first step in that direction, farmers aim to
increase the yields in a given biophysical context. All of the agricultural practices discussed in the
preceding sections help achieve that objective. But given the variations in practices, crop
productivities vary between farmers, villages, and districts. These variations may not translate into
net incomes, as the returns on input use may vary depending on the efficiency of their use. In the
event of inefficient allocation of inputs, higher yields may not translate into higher net returns, i.e.,
increase in crop yields may come at higher cost. Prices do not differ much within the village, given
that majority of the farmers sell to a single source; however, prices do vary across the villages.
Costs vary across the villages and districts for all the crops. Cotton has the highest cost per acre
(Table 25) followed by paddy (Table 24), red gram (Table 26), jowar (Table 27), and maize (Table
28). In terms of relative costs, human labor accounts for more than 50% of the total costs for all
the crops. Only in Mahabubnagar was the share of labor less than 50% for cotton, jowar, and maize
crops, though it was the single largest component. The share of labor is higher for paddy compared
to cotton and other crops. Labor costs range between 41% and 66% across the sample villages and
crops. Animal and machine labor is the second largest cost component, followed by fertilizers,
seeds, and pesticides. Across the size classes, marginal and small farmers use higher amounts of
labor when compared to medium and large farmers universally (Table 29). Medium and large
farmers tend to spend more for fertilizers and pesticides, though in some cases small farmers spend
equally. This pattern is more or less same for all the crops. Labor has become single largest
component of total cost. Labor requirements be considered when introducing GAPs. Labor
Kallak
al
Jeedipa
lly
Lingar
eddipet
Medak
Total
Gantla
velli
Mogal
agidda
Bhema
ram
Chatta
npalle
Rangar
eddy
Total
Chegu
nta
Gajula
peta
Mudu
mal
Kotaka
dira
Zainall
pur
Mahab
oobnag
ar
Total
Grand
Total
Need money 6.1 3 9.1 6.1 0 0 0 0 0 12.1 9.1 12.1 9.1 3 9.1 5.3
High price 6.1 6.1 0 4 3 3 0 0 1.5 6.1 0 3 3 12.1 4.8 3.5
After processing 60.6 48.5 33.3 47.5 18.2 24.2 17.6 29.4 22.4 54.5 57.6 39.4 33.3 48.5 46.7 38.7
After harvest 27.3 42.4 57.6 42.4 78.8 72.7 82.4 70.6 76.1 27.3 33.3 45.5 54.5 36.4 39.4 52.5
0%
10%
20%
30%
40%
50%
60%
70%
80%
90%
100%%
of
HH

AFI Baseline Report 40
constraint is one of the main reasons for the failure of system of rice intensification (SRI) paddy
in the region (Reddy and Reddy, 2007).
Table 24. Cost of Production and Relative Share (%) of Costs (Rs. per Acre) of Paddy
Village
Land
Preparation* Seeds Labor FYM Fertilizer Pesticide
Total
Cost
Kallakal 2,699 (13.7) 1,250 (6.4) 11,703 (59.6) 382 (1.9) 2,950 (15.0) 657 (3.3) 19,642
Jeedipally 2,556 (13.3) 1,295 (6.8) 12,628 (65.9) 226 (1.2) 1,396 (7.3) 1,061 (5.5) 19,162
Lingareddipet 2,650 (11.3) 1,253 (5.4) 14,721 (62.9) 614 (2.6) 3,172 (13.5) 1,006 (4.3) 23,417
Medak 2,631 (12.6) 1,267 (6.1) 13,160 (63.0) 416 (2.0) 2,499 (12.0) 928 (4.4) 20,900
Gantlavelli 2,599 (14.5) 1,354 (7.6) 11,205 (62.5) 347 (1.9) 2,361 (13.2) 59 (0.3) 17,926
Mogalagidda 2,985 (13.8) 1,317 (6.1) 13,798 (63.7) 609 (2.8) 2,333 (10.8) 624 (2.9) 21,667
Bhemaram 2,017 (12.8) 1,024 (6.5) 10,155 (64.2) 324 (2.1) 1,927 (12.2) 369 (2.3) 15,817
Chattanpalle 3,088 (18.5) 1,412 (8.4) 9,071 (54.3) 804 (4.8) 1,898 (11.4) 438 (2.6) 16,711
Rangareddy 2,702 (14.6) 1,290 (7.0) 11,400 (61.8) 514 (2.8) 2,178 (11.8) 370 (2.0) 18,454
Chegunta 3,452 (18.6) 1,786 (9.6) 10,298 (55.5) 0 (0.0) 1,833 (9.9) 1,190 (6.4) 18,560
Gajulapeta 2,932 (20.0) 930 (6.3) 7,069 (48.2) 331 (2.3) 2,434 (16.6) 955 (6.5) 14,651
Mudumal 3,952 (19.8) 1,686 (8.4) 8,895 (44.5) 385 (1.9) 3,550 (17.8) 1,529 (7.6) 19,997
Kotakadira 2,461 (16.6) 1,105 (7.4) 8,295 (55.8) 357 (2.4) 2,032 (13.7) 616 (4.1) 14,866
Zainallpur 2,505 (15.6) 1,299 (8.1) 8,152 (50.8) 701 (4.4) 2,896 (18.1) 480 (3.0) 16,033
Mahabubnagar 2,942 (18.1) 1,243 (7.6) 8,159 (50.1) 409 (2.5) 2,621 (16.1) 895 (5.5) 16,269
All 2,756 (14.9) 1,267 (6.8) 10,936 (59.0) 448 (2.4) 2,424 (13.1) 718 (3.9) 18,550
Note: Land preparation includes animal and machine labor.
Figures in parentheses are the relative share in %.
Table 25. Cost of Production and Relative Share (%) of Costs (Rs. per Acre) of Cotton
Village
Land
Preparation* Seeds Labor FYM Fertilizer Pesticide
Total
Cost
Lingareddipet 4,762 (19.2) 1,714 (6.9) 13,512 (54.5) 286 (1.2) 2,143 (8.6) 2,381 (9.6) 24,798
Medak 4,762 (19.2) 1,714 (6.9) 13,512 (54.5) 286 (1.2) 2,143 (8.6) 2,381 (9.6) 24,798
Mogalagidda 3,969 (13.9) 1,635 (5.7) 18,146 (63.3) 406 (1.4) 3,938 (13.7) 560 (2.0) 28,653
Bhemaram 4,376 (14.2) 3,071 (9.9) 17,649 (57.2) 512 (1.7) 4,164 (13.5) 1,100 (3.6) 30,872
Chattanpalle 6,125 (19.8) 1,492 (4.8) 18,688 (60.3) 1,333 (4.3) 2,543 (8.2) 808 (2.6) 30,988
Rangareddy 4,369 (14.5) 2,401 (8.0) 17,922 (59.6) 540 (1.8) 3,944 (13.1) 873 (2.9) 30,050
Chegunta 5,804 (21.5) 2,911 (10.8) 11,514 (42.7) 281 (1.0) 3,870 (14.4) 2,568 (9.5) 26,948
Gajulapeta 3,583 (13.5) 1,452 (5.5) 17,065 (64.4) 667 (2.5) 3,176 (12.0) 561 (2.1) 26,503
Mudumal 5,761 (19.1) 2,212 (7.3) 14,193 (47.1) 352 (1.2) 5,096 (16.9) 2,494 (8.3) 30,108
Zainallpur 3,500 (12.5) 2,745 (9.8) 15,864 (56.6) 1,273 (4.5) 3,109 (11.1) 1,527 (5.5) 28,018
Mahabubnagar 5,509 (19.7) 2,511 (9.0) 13,096 (46.7) 368 (1.3) 4,242 (15.1) 2,320 (8.3) 28,045
All 5,185 (18.1) 2,470 (8.6) 14,487 (50.7) 412 (1.4) 4,119 (14.4) 1,907 (6.7) 28,579
Note: Land preparation includes animal and machine labor.
Figures in parentheses are the relative share in %.

AFI Baseline Report 41
Table 26. Cost of Production and Relative Share (%) of Costs Rs. per Acre of Red Gram
Village
Land
Preparation* Seeds Labor FYM Fertilizer Pesticide
Total
Cost
Kallakal 2,433 (13.1) 864 (4.6) 11,426 (61.5) 606 (3.3) 2,682 (14.4) 576 (3.1) 18,588
Jeedipally 3,167 (17.8) 1,363 (7.7) 9,896 (55.7) 200 (1.1) 2,392 (13.5) 750 (4.2) 17,767
Lingareddipet 2,721 (14.7) 1,085 (5.8) 12,039 (64.9) 95 (0.5) 1,665 (9.0) 943 (5.1) 18,547
Medak 2,645 (14.4) 1,015 (5.5) 11,315 (61.4) 393 (2.1) 2,352 (12.8) 708 (3.8) 18,427
Mogalagidda 2,906 (21.9) 669 (5.0) 6,688 (50.3) 0 (0.0) 2,477 (18.6) 557 (4.2) 13,295
Bhemaram 4,037 (28.2) 631 (4.4) 5,895 (41.2) 238 (1.7) 3,315 (23.2) 181 (1.3) 14,297
Chattanpalle 2,883 (19.3) 1,253 (8.4) 6,188 (41.4) 385 (2.6) 3,240 (21.7) 981 (6.6) 14,929
Rangareddy 3,384 (23.8) 819 (5.8) 6,205 (43.7) 212 (1.5) 3,054 (21.5) 517 (3.6) 14,191
Chegunta 4,413 (22.8) 2,053 (10.6) 6,799 (35.2) 125 (0.6) 4,332 (22.4) 1,605 (8.3) 19,326
Gajulapeta 2,808 (15.9) 1,024 (5.8) 10,622 (60.0) 362 (2.0) 2,221 (12.6) 655 (3.7) 17,693
Mudumal 3,639 (23.3) 912 (5.8) 7,996 (51.2) 0 (0.0) 2,272 (14.6) 786 (5.0) 15,605
Kotakadira 2,639 (18.8) 689 (4.9) 7,678 (54.7) 500 (3.6) 1,642 (11.7) 897 (6.4) 14,045
Zainallpur 2,187 (12.8) 701 (4.1) 9,182 (53.7) 331 (1.9) 3,984 (23.3) 719 (4.2) 17,104
Mahabubnagar 3,300 (19.0) 1,221 (7.0) 8,606 (49.5) 243 (1.4) 3,029 (17.4) 980 (5.6) 17,380
All 3,190 (18.5) 1,137 (6.6) 8,823 (51.3) 267 (1.5) 2,908 (16.9) 876 (5.1) 17,200
Note: Land preparation includes animal and machine labor.
Figures in parentheses are the relative shares in %.
Table 27. Cost of Production and Relative Share (%) of Costs (Rs. per Acre) of Jowar
Village
Land
Preparation* Seeds Labor FYM Fertilizer Pesticide
Total
Cost
Kallakal 1,774 (16.6) 421 (3.9) 6,630 (62.0) 147 (1.4) 1,401 (13.1) 316 (3.0) 10,690
Jeedipally 2,899 (23.0) 723 (5.7) 6,451 (51.2) 199 (1.6) 2,234 (17.7) 84 (0.7) 12,589
Lingareddipet 2,254 (21.5) 263 (2.5) 5,391 (51.4) 437 (4.2) 1,482 (14.1) 661 (6.3) 10,489
Medak 2,203 (19.8) 455 (4.1) 6,233 (56.0) 243 (2.2) 1,641 (14.7) 353 (3.2) 11,128
Gantlavelli 1,800 (21.8) 415 (5.0) 4,600 (55.6) 0 (0.0) 1,454 (17.6) 0 (0.0) 8,269
Mogalagidda 1,892 (20.0) 622 (6.6) 4,104 (43.3) 225 (2.4) 2,602 (27.5) 34 (0.4) 9,478
Bhemaram 1,291 (11.2) 994 (8.7) 6,991 (60.9) 312 (2.7) 1,639 (14.3) 260 (2.3) 11,487
Chattanpalle 1,909 (19.7) 917 (9.5) 4,549 (46.9) 301 (3.1) 1,668 (17.2) 346 (3.6) 9,691
Rangareddy 1,647 (15.9) 883 (8.5) 5,496 (53.2) 280 (2.7) 1,779 (17.2) 249 (2.4) 10,334
Chegunta 1,565 (16.4) 154 (1.6) 5,010 (52.3) 0 (0.0) 2,149 (22.4) 695 (7.3) 9,573
Gajulapeta 2,367 (20.7) 496 (4.3) 6,176 (54.0) 624 (5.5) 1,558 (13.6) 208 (1.8) 11,429
Kotakadira 2,250 (17.9) 369 (2.9) 7,688 (61.1) 0 (0.0) 1,844 (14.6) 438 (3.5) 12,588
Zainallpur 1,576 (15.2) 475 (4.6) 5,838 (56.4) 281 (2.7) 1,869 (18.1) 311 (3.0) 10,350
Mahabubnagar 1,783 (16.7) 457 (4.3) 5,966 (56.0) 325 (3.0) 1,816 (17.0) 316 (3.0) 10,662
All 1,856 (17.4) 640 (6.0) 5,847 (54.8) 280 (2.6) 1,745 (16.4) 299 (2.8) 10,668
Note: Land preparation includes animal and machine labor.
Figures in parentheses are the relative share in %.

AFI Baseline Report 42
Table 28. Cost of Production and Relative Share (%) of Costs (Rs. per Acre) of Maize
Village
Land
Preparation* Seeds Labor FYM Fertilizer Pesticide
Total
Cost
Kallakal 4,500 (29.5) 1,500 (9.8) 6,833 (44.8) 0 (0.0) 2,408 (15.8) 0 (0.0) 15,242
Jeedipally 2,611 (19.1) 567 (4.1) 7,872 (57.4) 0 (0.0) 2,656 (19.4) 0 (0.0) 13,706
Medak 3,367 (23.5) 940 (6.6) 7,457 (52.1) 0 (0.0) 2,557 (17.9) 0 (0.0) 14,320
Gantlavelli 3,191 (22.2) 1,233 (8.6) 7,455 (51.9) 195 (1.4) 2,153 (15.0) 150 (1.0) 14,377
Rangareddy 3,191 (22.2) 1,233 (8.6) 7,455 (51.9) 195 (1.4) 2,153 (15.0) 150 (1.0) 14,377
Zainallpur 3,100 (17.3) 1,550 (8.7) 8,350 (46.6) 0 (0.0) 3,900 (21.8) 1,000 (5.6) 17,900
Mahabubnagar 3,100 (17.3) 1,550 (8.7) 8,350 (46.6) 0 (0.0) 3,900 (21.8) 1,000 (5.6) 17,900
All 3,217 (22.2) 1,196 (8.3) 7,484 (51.7) 158 (1.1) 2,274 (15.7) 153 (1.1) 14,481
Note: Land preparation includes animal and machine labor.
Figures in parentheses are the relative share in %.
Table 29. Relative Shares of Costs across Size Classes (All Crops)
Village
% of Labor Costs % of Fertilizer & Pesticide Costs
Marginal Small Medium Large ALL Marginal Small Medium Large All
Kallakal 60.0 57.1 52.8 50.1 58.8 18.1 28.6 23.1 21.5 19.6
Jeedipally 58.0 54.3 54.1 0 57.4 15.7 27.2 24.6 0 17.1
Lingareddipet 59.1 59.3 53.4 0 58.8 17.2 25.6 16.6 0 17.6
Medak 59.0 56.9 53.3 50.1 58.3 16.9 27.1 21.6 21.5 18.1
Gantlavelli 52.5 60.3 57.6 56.2 55.2 13.3 17.2 12.0 25.7 14.2
Mogalagidda 59.4 58.8 56.7 52.6 58.5 15.5 15.0 14.0 16.4 15.2
Bhemaram 59.4 58.1 50.0 50.8 56.9 11.2 22.9 12.8 33.8 15.0
Chattanpalle 53.9 52.5 52.0 48.3 52.7 17.1 11.5 19.3 18.7 17.3
Rangareddy 56.5 56.5 53.7 52.0 55.8 14.1 17.0 15.3 23.6 15.4
Chegunta 52.2 55.0 49.2 43.5 48.3 15.5 26.8 19.0 31.1 26.6
Gajulapeta 57.0 53.8 49.8 0 53.8 13.4 27.6 20.1 0 20.1
Mudumal 55.6 55.9 47.2 54.0 53.4 19.7 30.4 21.1 21.1 23.3
Kotakadira 59.6 56.0 48.7 48.3 55.3 14.7 24.7 17.6 25.1 18.4
Zainallpur 59.4 54.5 49.2 47.3 53.8 9.8 21.6 20.3 28.6 19.4
Mahabubnagar 57.4 55.0 48.8 45.5 52.9 15.0 26.7 19.7 29.2 21.6
All 57.8 55.6 50.5 47.9 55.2 15.5 23.9 18.6 26.9 18.6
Yields rates and prices vary across the villages. Variations are greater in the case of jowar and
cotton (Table 30). In the case of paddy, Mahabubnagar villages reported high yields, followed by
Rangareddy and Medak. In the case of paddy price, Medak and Mahabubnagar farmers receive a
better price compared to those in Rangareddy. In the case of cotton, Rangareddy and
Mahabubnagar have similar yields and prices, while Medak has only one village with cotton.
Mahabubnagar reported a higher price for red gram with a lower yield when compared to Medak
and Rangareddy. These variations are reflected in the net returns of the crops (Figs. 11 to 15). Net

AFI Baseline Report 43
returns are substantial in the case of paddy, cotton, red gram, and maize. Jowar has very low
returns. In fact, some villages have reported negative returns. Mahabubnagar has reported higher
returns for paddy, cotton, and maize, while Rangareddy has reported higher net returns for red
gram. While there is no difference in net return between paddy and cotton in Mahabubnagar,
cotton is more profitable than paddy in Rangareddy villages. This needs to be taken into
account when looking at crop shifts.
Table 30. Yield Rates (Quintals/Acre) and Prices (Rs./Quintal) of Important Crops
Village Paddy Price Cotton Price Red
Gram Price Jowar Price Maize Price
Kallakal 19 1,445 0 0 5 3,777 11 2,021 17 1,808
Jeedipally 15 1,423 0 0 7 3,089 8 0 8 1,988
Lingareddipet 14 1,700 10 3,221 5 3,764 7 2,108 0 0
Medak 15 1,520 10 3,221 5 2,957 9 2,056 14 0
Gantlavelli 18 1,116 0 0 0 0 5 3,125 9 1,917
Mogalagidda 18 1,381 9 4,460 4 4,770 9 2,286 0 0
Bhemaram 15 1,384 6 5,657 4 4,344 6 1,791 0 0
Chattanpalle 15 1,387 4 5,641 7 3,638 7 2,152 0 0
Rangareddy 17 1,305 7 5,158 5 4,199 7 1,994 9 0
Chegunta 16 1,667 7 5,202 4 5,665 7 0 0 0
Gajulapeta 16 1,147 7 5,112 5 4,484 3 5,357 0 0
Mudumal 23 1,581 9 5,053 4 5,018 0 0 0 0
Kotakadira 14 1,502 0 0 4 5,727 4 2,288 0 0
Zainallpur 16 1,584 7 4,620 4 5,567 5 3,214 4 1,650
Mahabubnagar 18 1,501 7 5,168 4 5,530 5 2,978 4 0
All 17 1,468 7 5,138 4 4,346 7 2,395 9 0
Figure 11. Gross and Net Incomes per Acre for Paddy (in Rs.)
Kallak
al
Jeedipa
lly
Lingare
ddipet
Medak
Total
Gantla
velli
Mogala
gidda
Bhema
ram
Chatta
npalle
Rangar
eddy
Total
Chegu
nta
Gajula
peta
Mudu
mal
Kotaka
dira
Zainall
pur
Mahab
oobnag
ar
Total
Total
output Value 26006 24199 27205 25836 20090 23482 19376 19414 20884 26667 19502 28464 24036 23762 24009 23488
Input Costs 19642 19162 23417 20900 17926 21667 15817 16711 18454 18560 14651 19997 14866 16033 16269 18550
Net income 6364 5037 3788 4936 2164 1815 3559 2703 2430 8107 4851 8467 9170 7729 7740 4938
0
5000
10000
15000
20000
25000
30000
Rs.
/ac
re
output Value Input Costs Net income

AFI Baseline Report 44
Figure 12. Gross and Net Incomes per Acre for Cotton (in Rs.)
Figure 13. Gross and Net Incomes per Acre for Red Gram (in Rs.)
KallakalJeedipa
llyLingareddipet
MedakTotal
Gantlavelli
Mogalagidda
Bhemaram
Chattanpalle
RangareddyTotal
Chegunta
Gajulapeta
Mudumal
Kotakadira
Zainallpur
Mahaboobnagar Total
Total
output Value 32214 32214 33897 35641 36667 35073 36933 32206 34865 33727 35662 35453
Input Costs 24798 24798 28653 32427 30988 30892 26948 27392 30108 28018 28136 28579
Net income 7416 7416 5244 3214 5679 4181 9985 4814 4757 5709 7526 6874
0
5000
10000
15000
20000
25000
30000
35000
40000R
s. /
acre
Kallaka
l
Jeedipal
ly
Lingare
ddipet
Medak
Total
Gantlav
elli
Mogala
gidda
Bhemar
am
Chattan
palle
Rangare
ddy
Total
Chegun
ta
Gajulap
eta
Mudum
al
Kotaka
dira
Zainallp
ur
Mahabo
obnagar
Total
Total
output Value 2112 21625 22585 20698 19078 21721 21825 20996 22659 22419 20073 22908 22266 22121 21729
Input Costs 18588 17767 18547 18427 13299 14297 14929 14192 19326 17693 15605 14045 17104 17380 17200
Net income 4071 3858 4038 2271 5779 7424 6896 6804 3333 4726 4468 8863 5162 4741 4529
0
5000
10000
15000
20000
25000
Rs.
/ a
cre

AFI Baseline Report 45
Figure 14. Gross and Net Incomes per Acre for Jowar (in Rs.)
Figure 15. Gross and Net Incomes per Acre for Maize (in Rs.)
Farm size productivity has been a leading issue in Indian agriculture for quite some time. A number
of studies in the 1970s and 1980s have shown that farm productivity is inversely related to farm
size. The reasons include use of family labor, high input use, better supervision, etc. This has led
to the conclusions that small farms are more efficient and help increase agriculture production,
which favors land distribution rather than land consolidation. This relationship, however, started
weakening in the later decades (Reddy, 1993). Moreover, net income rather than gross income or
physical yield started showing positive tendencies. Our farm size assessment has shown that
medium and large farmers have higher net returns to agriculture when compared to marginal and
Kallaka
l
Jeedipal
ly
Lingare
ddipet
Medak
Total
Gantlav
elli
Mogala
gidda
Bhemar
am
Chattan
palle
Rangar
eddy
Total
Chegun
ta
Gajulap
eta
Mudum
al
Kotaka
dira
Zainall
pur
Mahabo
obnagar
Total
Total
output Value 12125 12650 12335 12500 11429 10746 12914 11966 10713 9150 12855 11911 11974
Input Costs 11779 9992 11064 7113 8100 12336 10272 10779 11429 12588 10776 11116 10987
Net income 346 2658 1271 5387 3329 -1590 2642 1187 0 -716 0 -3438 2079 795 987
-6000
-4000
-2000
0
2000
4000
6000
8000
10000
12000
14000R
s. /
acre
Kallakal Jeedipally Gantlavelli Zainallipur
output value 21700 19884 19174 28050
Inputcosts 15242 13706 14377 17900
Net Income 6458 6179 4797 10150
0
5000
10000
15000
20000
25000
30000
Rs.
/ac
re
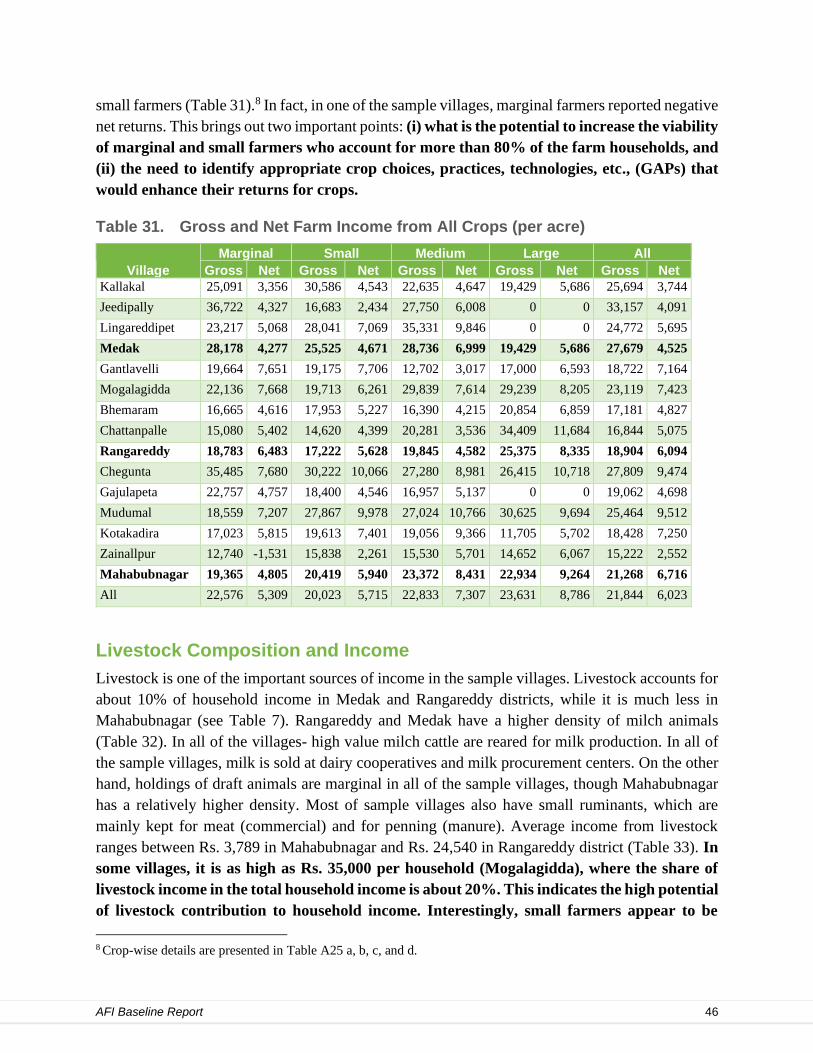
AFI Baseline Report 46
small farmers (Table 31).8 In fact, in one of the sample villages, marginal farmers reported negative
net returns. This brings out two important points: (i) what is the potential to increase the viability
of marginal and small farmers who account for more than 80% of the farm households, and
(ii) the need to identify appropriate crop choices, practices, technologies, etc., (GAPs) that
would enhance their returns for crops.
Table 31. Gross and Net Farm Income from All Crops (per acre)
Village
Marginal Small Medium Large All
Gross Net Gross Net Gross Net Gross Net Gross Net
Kallakal 25,091 3,356 30,586 4,543 22,635 4,647 19,429 5,686 25,694 3,744
Jeedipally 36,722 4,327 16,683 2,434 27,750 6,008 0 0 33,157 4,091
Lingareddipet 23,217 5,068 28,041 7,069 35,331 9,846 0 0 24,772 5,695
Medak 28,178 4,277 25,525 4,671 28,736 6,999 19,429 5,686 27,679 4,525
Gantlavelli 19,664 7,651 19,175 7,706 12,702 3,017 17,000 6,593 18,722 7,164
Mogalagidda 22,136 7,668 19,713 6,261 29,839 7,614 29,239 8,205 23,119 7,423
Bhemaram 16,665 4,616 17,953 5,227 16,390 4,215 20,854 6,859 17,181 4,827
Chattanpalle 15,080 5,402 14,620 4,399 20,281 3,536 34,409 11,684 16,844 5,075
Rangareddy 18,783 6,483 17,222 5,628 19,845 4,582 25,375 8,335 18,904 6,094
Chegunta 35,485 7,680 30,222 10,066 27,280 8,981 26,415 10,718 27,809 9,474
Gajulapeta 22,757 4,757 18,400 4,546 16,957 5,137 0 0 19,062 4,698
Mudumal 18,559 7,207 27,867 9,978 27,024 10,766 30,625 9,694 25,464 9,512
Kotakadira 17,023 5,815 19,613 7,401 19,056 9,366 11,705 5,702 18,428 7,250
Zainallpur 12,740 -1,531 15,838 2,261 15,530 5,701 14,652 6,067 15,222 2,552
Mahabubnagar 19,365 4,805 20,419 5,940 23,372 8,431 22,934 9,264 21,268 6,716
All 22,576 5,309 20,023 5,715 22,833 7,307 23,631 8,786 21,844 6,023
Livestock Composition and Income
Livestock is one of the important sources of income in the sample villages. Livestock accounts for
about 10% of household income in Medak and Rangareddy districts, while it is much less in
Mahabubnagar (see Table 7). Rangareddy and Medak have a higher density of milch animals
(Table 32). In all of the villages- high value milch cattle are reared for milk production. In all of
the sample villages, milk is sold at dairy cooperatives and milk procurement centers. On the other
hand, holdings of draft animals are marginal in all of the sample villages, though Mahabubnagar
has a relatively higher density. Most of sample villages also have small ruminants, which are
mainly kept for meat (commercial) and for penning (manure). Average income from livestock
ranges between Rs. 3,789 in Mahabubnagar and Rs. 24,540 in Rangareddy district (Table 33). In
some villages, it is as high as Rs. 35,000 per household (Mogalagidda), where the share of
livestock income in the total household income is about 20%. This indicates the high potential
of livestock contribution to household income. Interestingly, small farmers appear to be
8 Crop-wise details are presented in Table A25 a, b, c, and d.

AFI Baseline Report 47
doing better in terms of livestock income. Enhancing household incomes through livestock
rearing could be an important option, especially for marginal and small farmers. Increasing
livestock holdings has the dual benefit of increasing the availability of FYM (organic matter)
at the household and village levels.
Table 32. Livestock Holdings and Composition in the Sample Villages (Number and Present Value)
Village
Milch Cattle Draft Cattle Small
Ruminants Poultry Pigs
No. Value No. Value No. Value No. Value No. Value
Kallakal 86 2,436,000 2 75,000 235 832,500 5 1,500 0 0
Jeedipally 52 1,690,000 4 120,000 1 3,000 18 4,800 0 0
Lingareddipet 15 441,000 0 0 32 102,000 27 5,850 0 0
Medak 153 4,567,000 6 195,000 268 937,500 50 12,150 0 0
Gantlavelli 67 5,356,000 2 160,000 31 610,000 4 1,200 0 0
Mogalagidda 143 7,702,500 6 400,000 39 456,000 20 5,000 3 15,000
Bhemaram 25 1,070,000 4 220,000 122 686,000 20 5,050 0 0
Chattanpalle 76 5,995,000 0 0 34 750,000 0 0 0 0
Rangareddy 311 20,123,500 12 780,000 226 2,502,000 44 11,250 3 15,000
Chegunta 5 88,000 10 255,000 0 0 0 0 0 0
Gajulapeta 15 263,000 0 0 268 1,756,000 26 3,900 0 0
Mudumal 8 98,000 8 117,500 2 12,000 64 19,200 0 0
Kotakadira 14 353,000 5 125,000 95 400,000 21 4,200 5 6,000
Zainallpur 14 328,000 19 498,000 49 280,000 32 8,200 0 0
Mahabubnagar 56 1,130,000 42 995,500 414 2,448,000 143 35,500 5 6,000
All 520 25,820,500 60 1,970,500 908 5,887,500 237 58,900 8 21,000

AFI Baseline Report 48
Table 33. Livestock Income (Rs./HH)
Village Marginal Small Medium Large All
Kallakal 880 146,600 30,000 0 24,697
Jeedipally 19,107 6,250 0 0 16,970
Lingareddipet 3,704 1,500 18,000 0 4,303
Medak 8,213 58,769 19,200 0 15,323
Gantlavelli 12,611 60,750 80,250 30,000 33,533
Mogalagidda 19,140 91,733 32,640 40,000 35,648
Bhemaram 6,111 2,250 27,333 12,500 9,324
Chattanpalle 0 37,343 28,200 0 20,115
Rangareddy 10,463 43,811 39,460 23,571 24,540
Chegunta 0 0 3,158 0 1,818
Gajulapeta 4,000 11,000 8,333 0 9,030
Mudumal 0 0 556 0 152
Kotakadira 1,875 5,900 0 5,000 3,976
Zainallpur 2,200 4,500 3,333 5,000 3,970
Mahabubnagar 1,800 5,476 3,000 1,429 3,789
V Accelerating Farm Incomes: Potential and Constraints
Accelerating farm incomes and meeting the national objective of doubling farm incomes will
involve various changes in crop profiles (pattern), agricultural practices (good and improved) to
suit biophysical attributes of the region and resilience against climate risks, better access to markets
and prices, etc. While the proposed project interventions plan to address these issues, this is an
attempt is made to identify any potential to improve the situation (enhancing incomes) in the given
context (current practices), i.e., whether there are variations in performance among the farmers
and where is the gap in performance.
Yield Gap Analysis
Yield gap is assessed by comparing the maximum and minimum yield rates of sample farmers.
The yield gap gives an idea the existing potential to increase the yield rates (incomes) in the given
context without any structural changes, such as new crops, new cultivars, new crop practices, etc.
In other words, existing yield differences are due to the adoption or non-adoption of existing
practices by all the farmers, because of one or more constraints. Understanding the reasons for the
yield gaps is the first step to accelerating farm income.
The descriptive statistics of the yield rates of four important crops (paddy, cotton, red gram, and
jowar)9 have shown wide intra- and inter-village variations in yield rates (Tables A18 to A22),
9 Maize was not included in the analysis, as it is not grown in all the villages.

AFI Baseline Report 49
which indicate the potential for achieving higher yield rates in the given agroecological context.
These four crops account for about 90% of the average farm size of the household. Given the high
intra-village variations in yield rates, inter-village variations across the 12 sample villages are used
(which are moderate) to assess the yield gap. The difference between minimum and maximum
yields among the 12 sample villages is the yield gap. Yield gap could be calculated using different
indicators, such as average, median, or mode, or standardized approaches, i.e., difference between
minimum and these measures. While each approach has its merits and demerits, the min-max
approach is chosen just to indicate the potential. Among the sample villages, the yield gap ranges
between 3 and 4 quintals, i.e., yields can be improved from 3 to 4 quintals per acre with better or
more efficient input use (Table 34). The gains from the yield improvement at the household level
are calculated using the price and area under each crop. Net gains are calculated by deducting the
cost of production. Cropwise net gains range between Rs. 537 for jowar and Rs 3,514 for
cotton (Table 34). Total net gain at the household level is Rs. 6,475. This accounts for 9% of
the household income from agriculture. This can be further increased by reallocating the
area under crops. Reallocating more area to cotton from other crops or reallocating the
water from paddy (by reducing the area under paddy) increases the net gains. Gains from
the latter (reallocating water) may increase the gains from cotton crop as well.
Table 34. Yield Gaps for the Selected Crops between the Sample Districts
Yield per Acre (in quintals) Paddy Cotton Red
Gram Jowar Total
Average 16 7 5 5 --
Maximum 18 10 7 6 --
Minimum 14 6 4 2 --
Median 17 7 5 5 --
Yield gap 4 4 3 4 --
Average price (Rs./quintals) 1,468 5,138 4,346 2,395 --
Income gain (Rs./ acre) 5,872 20,552 13,038 9,580 --
Average area under the crop in the household (acres)# 1.3 0.9 0.3 0.7 3.2
Net income gain per household (Rs.) after deducting the
costs
1,603
(7,633)
3,514
(18,477)
821
(13,038)
537
(6,706)
6,475
(45,854)
Net gain as % of HH income from agriculture 2 (10) 5 (24) 1 (17) 1 (9) 9 (60)
Note: Figures in parentheses are gross gain.
#Given the average farm size of the household is 3.55 acres, area under these 4 crops account for 90% of the area.

AFI Baseline Report 50
Figure 16. Some Indicators of Good Agricultural Practices
Assessing and understanding the constraints for reducing the yield gap is critical. Though such
assessment is beyond the scope of this baseline study, an attempt was made to assess the constraints
in terms of variations in the indicators of some GAPs. Four indicators of GAPs include the– use
of purchased seeds, use of organic fertilizers, following integrated pest management practices, and
use of micronutrients. Availability of credit for crop production is an enabling factor and, hence,
credit is also a part of GAPs. Use of purchased seeds is close to 100% due to the predominance of
hybrid and HYV variety crops (Fig. 16). Purchased seeds are the only choice, since a farmers using
their own seeds does not work in the case of hybrid and HYV cultivars. Good quality seeds are
expected to help achieve potential yields, but getting quality seeds is not fully guaranteed. This is
more so in the case of commercial crops, such as cotton. While crop failure due to use of poor
quality seeds is rare, it occurs regularly in commercial crops, such as cotton, chilis, and groundnut.
Indian soils are low in carbon content, and hence, application of higher quantities of organic
manure is highly recommended (MANAGE, 2017). Similarly, micronutrient deficiencies are also
high in the Indian soils, including Telangana. While 56% of farmers use FYM along with chemical
fertilizers, only 5% of the farmers apply micronutrients at the aggregate level. Across the villages,
the use of FYM ranges between 42% (Mudumal) in Mahabubnagar district and 64% in Medak and
Rangareddy districts. The quantity of FYM use is much less than recommended. At the same time,
chemical fertilizer use is much higher than the recommended quantity, resulting in imbalanced
fertilizer use. None of the farmers apply micronutrients in three of the 12 sample villages (one
village in each sample district) (Fig. 16). And only 20% of the farmers have adopted integrated
pest management practices at the aggregate level, ranging between 0% (Gantlavelli) and 36%
(Chegunta and Lingareddipet). This clearly indicates that there are wide variations in the
adoption of GAPs despite the fact that 100% of the farmers avail credit toward crop
Kalla
kal
Jeedi
pally
Ling
aredd
ipet
Med
ak
Total
Gantl
avelli
Mog
alagi
dda
Bhe
mara
m
Chatt
anpal
le
Rang
aredd
y
Total
Cheg
unta
Gajul
apeta
Mud
umal
Kota
kadir
a
Zain
allpu
r
Mah
aboo
bnag
ar
Total
Total
% of HH using purchase seeds 100 100 100 100 97 100 97.1 100 98.5 97 93.9 100 90.9 87.9 93.9 97
% of HH following IPM 30.3 33.3 36.4 33.3 0 3 23.5 8.8 9 36.4 15.2 3 12.1 33.3 20 19.6
% of HH using organic fertilizers 51.5 63.6 63.6 59.6 54.5 63.6 58.8 61.8 59.7 39.4 51.5 42.4 60.6 60.6 50.9 56
% of HH using micro nutrient fert. 12.1 0 3 5.1 0 6.1 2.9 2.9 3 9.1 0 6.1 6.1 9.1 6.1 4.8
% of HH receiving credit for crop
production30.3 15.2 12.1 19.2 33.3 15.2 32.4 8.8 22.4 69.7 60.6 54.5 60.6 48.5 58.8 36.7
0
20
40
60
80
100
120
% o
f H
H

AFI Baseline Report 51
production. Poor rates of GAP adoption and/or wide variations in adoption of GAPs across
farmers could be a possible explanation for the yield gaps.
Factors Influencing Yield Variations
In order to find clear explanation for the yield gaps, multiple regression analysis is used. For this,
yields per acre (dependent variable) of three important crops (paddy, cotton, and red gram) are
regressed against various explanatory variables. All the important inputs (factors of production)
along with other determinants, such as peri-urban, village, and district differences, are included as
dummy variables. The following crop wise specifications are used.
𝑃𝑦𝑖 = 𝑓(𝐹𝑆, 𝐿𝑎𝑏𝑈, 𝐼𝑟𝑟𝑖𝐷; 𝐹𝑒𝑟𝑡𝑈, 𝐹𝑌𝑀𝑈, 𝑃𝑒𝑠𝑡𝑈, 𝑀𝑒𝑐ℎ𝑈; 𝑃𝑈𝐷; 𝐷𝑖𝑠𝐷; 𝑉𝑖𝑙𝐷) + 𝑈𝑖 (1)
𝑃𝐶𝑖 = 𝑓(𝐹𝑆, 𝐿𝑎𝑏𝑈, 𝐼𝑟𝑟𝑖𝐷; 𝐹𝑒𝑟𝑡𝑈, 𝐹𝑌𝑀𝑈, 𝑃𝑒𝑠𝑡𝑈, 𝑀𝑒𝑐ℎ𝑈; 𝑃𝑈𝐷; 𝐷𝑖𝑠𝐷; 𝑉𝑖𝑙𝐷) + 𝑈𝑖 (2)
𝑃𝑅𝐺𝑖 = 𝑓(𝐹𝑆, 𝐿𝑎𝑏𝑈, 𝐼𝑟𝑟𝑖𝐷; 𝐹𝑒𝑟𝑡𝑈, 𝐹𝑌𝑀𝑈, 𝑃𝑒𝑠𝑡𝑈, 𝑀𝑒𝑐ℎ𝑈; 𝑃𝑈𝐷; 𝐷𝑖𝑠𝐷; 𝑉𝑖𝑙𝐷) + 𝑈𝑖 (3)
Where:
𝑃𝑦𝑖 = Paddy yield in quintals per acre for the ith farmer
𝑃𝑐𝑖 = Cotton yield in quintals per acre for the ith farmer
𝑃𝑅𝐺𝑖 = Redgram yield in quintals per acre for the ith farmer
FS = Farm size in acres
IrriD = Irrigation dummy (Yes=1 and No= 0)
LabU = Labor use in man days / acre
FertU = Fertilizer use in quintals per acre
FYMU = Farm Yard Manure Use per acre in quintals
PestU = Pesticide use per acre in kg/L
MechU = Machine use per acre in hours
PUD = Peri-urban dummy (peri-urban=1; Rural=0)
DisD = District dummy (Medak=1; Rangareddy=2; Mahabubnagar=3)
VilD = Village dummy (1 to 12).
𝑈𝑖 = Random term
While all the input variables are theoretically expected to be positively associated with the
dependent variables (yield rate), the relationship between the dummy variables and yield rates
need to be explored in the absence of theoretical expectations. In the case of pesticides, the quantity
used has to be separated by kilograms (solids) and liters (liquids). This could have reduced the
impact on the yields. Least squares method is used to estimate the specifications. The number of
combinations and permutations were tried and only best fits, in terms of a number of variables
significant and explanatory power of the specifications, are discussed here while the other
estimates are presented in Tables A23-A25. Linear and log-linear functions were also tried. Linear
estimates were retained, as the log-log formulations were not found to be efficient, especially in
terms of a number of significant variables. Moreover, log-linear formulations are not possible in
the case of cotton and red gram due to the presence of zero values in the case of some inputs. In

AFI Baseline Report 52
the case of paddy, double log formulations have performed better in terms of explanatory power
(R2) but none of the variables turned out to be significant and thus were not retained. Multi-
collinearity problem was addressed using VIF statistic, i.e., retaining the specifications with <2
VIF value. The regressions were estimated using the SPSS package. The estimates of the selected
specifications are presented in Table 35.
Table 35. Regression Results (Dependent Variable: Yield per Acre)
Independent
Variable
Paddy Cotton Red Gram
Coefficient t value Coefficient t value Coefficient t value
(Constant) 9.262* 4.047 4.631* 3.547 3.138* 2.932
Farm Size --- --- -0.159* -2.392 -0.286 -1.433
Fertilizer Use 0.557 0.922 0.731*** 1.677 --- ---
Labor use 0.109** 2.299 --- --- --- ---
Pesticide use (kgs) -0.938 -0.625 2.462* 2.626 --- ---
Pesticide use (ltrs) --- --- 0.788*** 1.595 1.572** 2.104
Irrigation Dummy 2.300*** 1.790 --- --- -1.761** -2.316
Village Dummy 0.058 1.410 1.068 1.193 --- ---
District Dummy --- --- -0.418 -1.129 1.054* 2.271
N 253 84 60
R Square 0.04 0.17 0.23
VIF <1.1 <1.58 <1.20
Note: *; **, and *** indicate levels of significance at 1%, 5%, and 10-11%, respectively.
At the outset, the regression estimates are not very encouraging though they provide some pointers.
The explanatory power of the specifications often tend to be low when using household-level data.
In the present case, the explanatory power turned out to be very low for paddy crop. This is despite
paddy having highest number of observations. Though log-log formulations have provided higher
explanatory power (>70%), none of the variables turned out to be significant. All the variables
have shown theoretically expected signs for all the three crops, except the irrigation variable in the
case of red gram. Labor use and irrigation variables turned out to be significant with positive sign.
The importance of irrigation for paddy crop need not be over emphasized. Labor use is also
positively associated with paddy yield, indicating that there is a possibility of increasing labor use
in paddy cultivation. This could be due the labor shortages in the villages, especially after the
introduction of employment programs, and the cost of labor. Fertilizer and pesticide use turned out
be positive and significant in the case of cotton crop. This indicates that better soil nutrition and
pest management practices could help enhance cotton yields and incomes. There is an inverse
relationship between farm size and cotton yield, indicating that marginal and small farmers are
doing better than medium and large farmers. This, however, does not mean that marginal and small
farmers make more profits. The absence of such an inverse relationship in the case of the other
two crops clearly shows that the relationship is not universal, as it holds good only in one out
of three crops. In the case of red gram, pesticide use also turned out be positive and significant,
indicating the role of pest management in the case of red gram as well. The irrigation variable
turned out to be negative, which is difficult to explain. Perhaps this could be interpreted as the

AFI Baseline Report 53
need for irrigation is not that crucial in the case of red gram, which grows during kharif season. In
the event of reallocation of water (by reducing area under paddy), red gram need not be a priority.
District dummy turned out significant, which reflects the inter-district variations in red gram
yields. Overall, the regression estimates indicate the potential for improving input management for
enhanced crop performance. The GAPs need to focus on soil nutrition and pest management
practices. Reallocation of water to other crops needs to be better understood.
VI Summary and Way Forward
The main purpose of the baseline study is to provide guidance on the proposed interventions or
GAPs for accelerating the farm incomes in the sample districts and form the basis for monitoring
and evaluation of the project interventions. The baseline study was carried out in the three program
districts of Mahabubnagar, Medak, and Rangareddy districts. From these districts, 12 villages were
selected, representing peri-urban and rural locations. The number of villages selected from each
district was based on the size of the target population (farming households). Accordingly, three
villages from Medak, four villages from Rangareddy, and five villages from Mahabubnagar were
selected. Of these, six villages each represent peri-urban and rural contexts. A sample of 33
households from each village was selected proportionately to the distribution of farm-size class in
the village. Altogether, a sample of 397 farm households was selected, which is 1.3% of the total
target population of the program (30,000). Both qualitative and quantitative research techniques
were used to elicit information at the village/community and household levels. Yield gaps and
factors influencing the variations in yields across households were analyzed in order to attain a
deeper understanding of the potential and constraints for accelerating farm incomes.
The analysis helped in understanding the context, status, potential, and constraints for improving
farm incomes in the selected districts. The following summarizes some of the important aspects in
this regard. These should be taken into consideration when designing future interventions.
1. Some of the peri-urban villages are fast becoming urban in nature, as agriculture is no longer
a priority. Farmers are more interested in non-farm avenues and unlikely to continue
agriculture and learn good agriculture practices. In fact, there may not be much cultivable land
left for agriculture. While planning the interventions, the villages need to be assessed for their
interest in and demand for such interventions in order to avoid inefficient use of resources.
2. Land is not a constraining factor, while water is a constraint. Water use efficiency is low, since
most farmers allocate their water to water-intensive paddy and adopt flood irrigation. Though
some farmers use micro irrigation, it is mainly due to the subsidies they receive and the area
covered is marginal. There is good scope for improving water use efficiency and crop
production through promotion of less water-intensive crops. Given the water scarcity
coupled with a heavy dependence on groundwater, there is potential to promote micro
irrigation in the sample region.
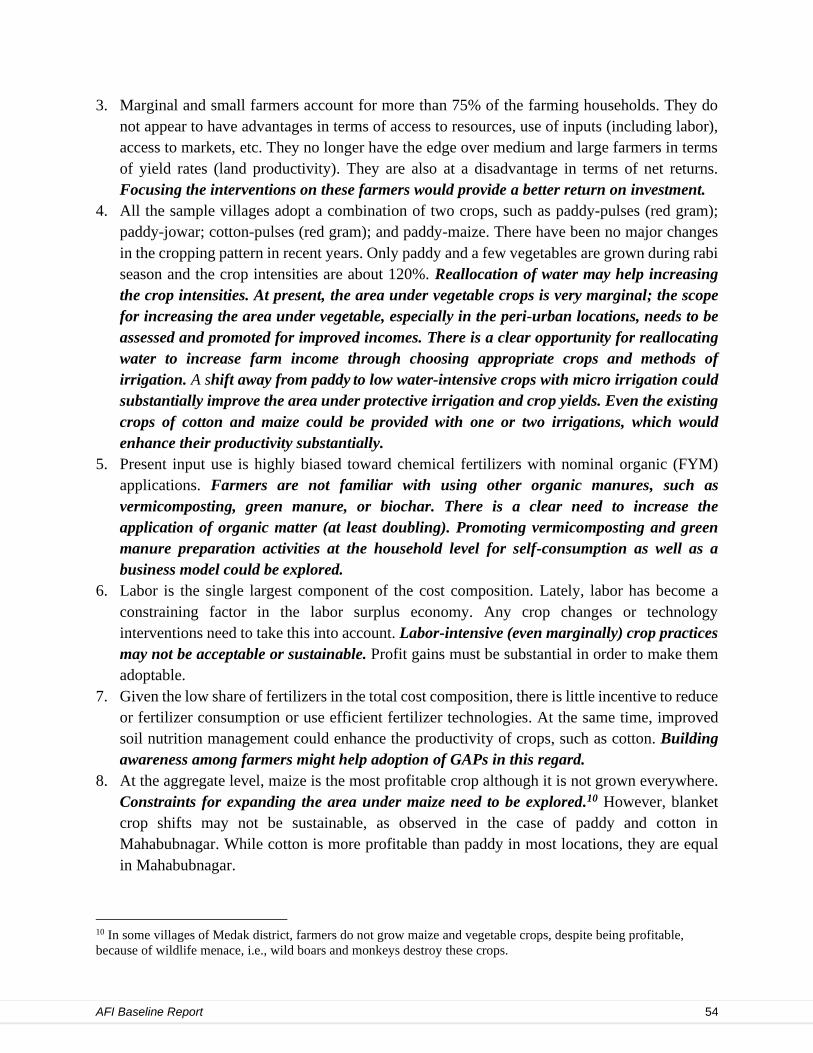
AFI Baseline Report 54
3. Marginal and small farmers account for more than 75% of the farming households. They do
not appear to have advantages in terms of access to resources, use of inputs (including labor),
access to markets, etc. They no longer have the edge over medium and large farmers in terms
of yield rates (land productivity). They are also at a disadvantage in terms of net returns.
Focusing the interventions on these farmers would provide a better return on investment.
4. All the sample villages adopt a combination of two crops, such as paddy-pulses (red gram);
paddy-jowar; cotton-pulses (red gram); and paddy-maize. There have been no major changes
in the cropping pattern in recent years. Only paddy and a few vegetables are grown during rabi
season and the crop intensities are about 120%. Reallocation of water may help increasing
the crop intensities. At present, the area under vegetable crops is very marginal; the scope
for increasing the area under vegetable, especially in the peri-urban locations, needs to be
assessed and promoted for improved incomes. There is a clear opportunity for reallocating
water to increase farm income through choosing appropriate crops and methods of
irrigation. A shift away from paddy to low water-intensive crops with micro irrigation could
substantially improve the area under protective irrigation and crop yields. Even the existing
crops of cotton and maize could be provided with one or two irrigations, which would
enhance their productivity substantially.
5. Present input use is highly biased toward chemical fertilizers with nominal organic (FYM)
applications. Farmers are not familiar with using other organic manures, such as
vermicomposting, green manure, or biochar. There is a clear need to increase the
application of organic matter (at least doubling). Promoting vermicomposting and green
manure preparation activities at the household level for self-consumption as well as a
business model could be explored.
6. Labor is the single largest component of the cost composition. Lately, labor has become a
constraining factor in the labor surplus economy. Any crop changes or technology
interventions need to take this into account. Labor-intensive (even marginally) crop practices
may not be acceptable or sustainable. Profit gains must be substantial in order to make them
adoptable.
7. Given the low share of fertilizers in the total cost composition, there is little incentive to reduce
or fertilizer consumption or use efficient fertilizer technologies. At the same time, improved
soil nutrition management could enhance the productivity of crops, such as cotton. Building
awareness among farmers might help adoption of GAPs in this regard.
8. At the aggregate level, maize is the most profitable crop although it is not grown everywhere.
Constraints for expanding the area under maize need to be explored.10 However, blanket
crop shifts may not be sustainable, as observed in the case of paddy and cotton in
Mahabubnagar. While cotton is more profitable than paddy in most locations, they are equal
in Mahabubnagar.
10 In some villages of Medak district, farmers do not grow maize and vegetable crops, despite being profitable,
because of wildlife menace, i.e., wild boars and monkeys destroy these crops.

AFI Baseline Report 55
9. Access to markets in the sample villages continues to be traditional (high dependence on
traders and middlemen). Very few farmers use public market yards for good reason. Farmers
neither use nor are aware of e-markets or linked directly to urban markets/supermarkets. There
are no FPOs functioning in the region. In the absence of evolved market systems it is difficult
to promote new crops, such as vegetables. Establishing better market linkages with improved
price realization is critical for improving farm incomes.
10. The yield gap analysis indicates that there are wide variations in yields of different crops. These
variations could be observed within the village, among the villages, and among the districts.
This points to the potential for increasing the yield rates in the given agroecology and
technological context. Bridging the yield gaps through adoption of GAPs in the present crop
systems could result in a 9% increase in household income from agriculture. This can be
further increased by reallocating the area under crops. Reallocating more area to cotton
from other crops or reallocating the water from paddy (by reducing the area under paddy)
to other crops could further increase the net gains. Gains from the latter (reallocating water)
may increase the gains from cotton crops as well.
11. There are wide variations in adoption of some GAPs across the farm households, villages, and
districts. Low rates of GAP adoption and/or wide variations in the adoption of GAPs across
farmers indicate the potential for reducing the yield gaps through building awareness and
capacities.
12. Factors explaining the variations in yield rates suggest that better soil nutrition and pest
management practices could help enhance yields and incomes from crops like cotton. Overall,
there is potential for improving input management for enhanced crop performance. GAPs need
to focus on soil nutrition and pest management practices. At the same time, labor and water
are the main constraints and, hence, adoption of labor- and water-saving methods11 and
approaches would be acceptable to the farming communities.
13. Apart from crop production, livestock rearing is a potential source of income. In some of the
sample villages, the share of livestock income in total household income is as high as 20%.
Identifying the potential and constraints for increasing the share of livestock in the other
villages could be a viable proposition. Increasing livestock holdings has the dual benefits of
increasing the availability of farmyard manure (organic matter) and providing regular cash
flow at the household and village levels. Small farmers also appear to gain more from
livestock rearing.
14. Analysis of labor contribution in crop production confirms the “feminization of agriculture”
argument, as women labor account for two-thirds of total labor use in crop production. Some
of the villages also have substantial number of women farmers. Women farmers/workers face
different problems when compared to their male counterparts, and hence, their needs are
11 Water-saving micro irrigation systems (drip and sprinkler) are capital intensive, and marginal and small farmers
need financial support or institutional arrangement (group ownership) need to be implemented to overcome the
financial constraints.

AFI Baseline Report 56
expected to be different. Understanding their requirements and providing exclusive support
(training and technologies) to them is critical for improving their conditions.
This baseline assessment provides insights into the status and context of the three sample districts.
Further, it provides the baseline information on a set of indicators for the purpose of monitoring
and evaluation of the interventions in the future. Crop production in the sample villages is driven
by resource and market constraints, with little or no support from extension services. As a result,
resource allocation inefficiencies and unsustainable farm practices are widespread. There is
potential to increase farm income through better allocation of resources, enhancing input
productivities and greater price realization. Improving water use efficiency through shifting to low
water-intensive crops, and water-saving techniques (micro irrigation). This could be achieved
within the existing cropping pattern and/or by introducing new crop/farming systems that are
acceptable and profitable to the farmers. Livestock farming is a viable complementary livelihood
activity, which requires water, fodder, and market support. Labor availability appears to be a major
constraint in these villages, and hence, any new intervention must take this into account. Improving
access to markets and creating value chains need a broader policy push. Promotion of FPOs and
other direct marketing arrangements at the village or cluster level could be prioritized. This would
incentivize farmers to shift to non-traditional crops, such as vegetables, that are less water intensive
and more remunerative.

AFI Baseline Report 57
References
ACIAR (2015) Developing Multi-Scale Adaptation Strategies for Farming Communities in
Cambodia, Lao PDR, Bangladesh and India, Project Report, Australian Centre for
International Agriculture Research, Canberra, Australia.
Chand Ramesh (2017) “Doubling of Farmers Income: Strategy and Prospects,” Indian Journal of
Agriculture Economics, 72(1), Jan-Mar.
Korra, Vijay (2011) “Nature and Characteristics of Seasonal Labour Migration: A Case Study in
Mahabubnagar District of Andhra Pradesh”, Indian Journal of Labour Economics, Vol. 54,
No.3, pp. 527-544, July-September.
LNRMI (2010) Adapting to Climate Variability in Semi-arid Regions: A Study Using
Sustainable Rural Livelihoods Framework, project report, Livelihoods and Natural
Resource Management Institute, Hyderabad.
MANAGE (2017) Impact Study of Soil Health Management and Soil Health Card Scheme, Report
Submitted to the Department of Agriculture Cooperation and Farmer’s Welfare, Ministry
of Agriculture, Government of India, National Institute of Agricultural Extension
Management (MANAGE), Hyderabad.
MANAGE. (2018) Evaluation Study of Krishi Paramparagath Krishi Vikas Yojana (PKVY)
Programme, Report Submitted to the Department of Agriculture Cooperation and Farmer’s
Welfare, Ministry of Agriculture, Government of India, National Institute of Agricultural
Extension Management (MANAGE), Hyderabad.
Reddy V. Ratna (1993) “New Technology in Agriculture and Changing Size – Productivity
Relationships: A Study of Andhra Pradesh,” Indian Journal of Agricultural Economics,
Vol. XLVIII, No. 4, October-December.
Reddy V. Ratna and P. Prudhvikar Reddy (2007) “Increasing Costs in Agriculture: Agrarian Crisis
and Rural Labour in India” (jointly), The Indian Journal of Labour Economics, 50(2),
April-June.
Reddy V. Ratna, T. Chiranjeevi (2016) “The Changing Face of Rainfed Agriculture: Need for
Integration of Science, Policy and Institutions,” In C. Ramasamy and K.R. Ashok (eds),
Vicissitudes of Agriculture in the Fast Growing Indian Economy: Challenges, Strategies
and the Way Forward, Academic Foundation in Association with the Indian Society of
Agricultural Economics, Mumbai.
Reddy V. Ratna, P. Prudhvikar Reddy, M. Srinivasa Reddy and DSR Raju (2005) “Water Use
Efficiency: A Study of System of Rice Intensification (SRI) Adoption in Andhra Pradesh,”
Indian Journal Of Agricultural Economics, 60(3), July-September.
Reddy V. Ratna, T. Chiranjeevi and Geoff Syme (2019) Inclusive Sustainable Intensification of
Agriculture in West Bengal, India: Policy and Institutional Approaches, International
Journal of Agricultural Sustainability. https://doi.org/10.1080/14735903.2019.1698489
Uday Nidumolu, Ravindra Adusumilli, Chiranjeevi Tallapragada, Christian Roth, Zvi Hochman,
G Sreenivas, D Raji Reddy, V Ratna Reddy (2020) “Enhancing Adaptive Capacity to

AFI Baseline Report 58
Manage Climate Risk in Agriculture through Community Led Climate Information Centres
(CLICs),” Climate and Development (forthcoming).
https://doi.org/10.1080/17565529.2020.1746230
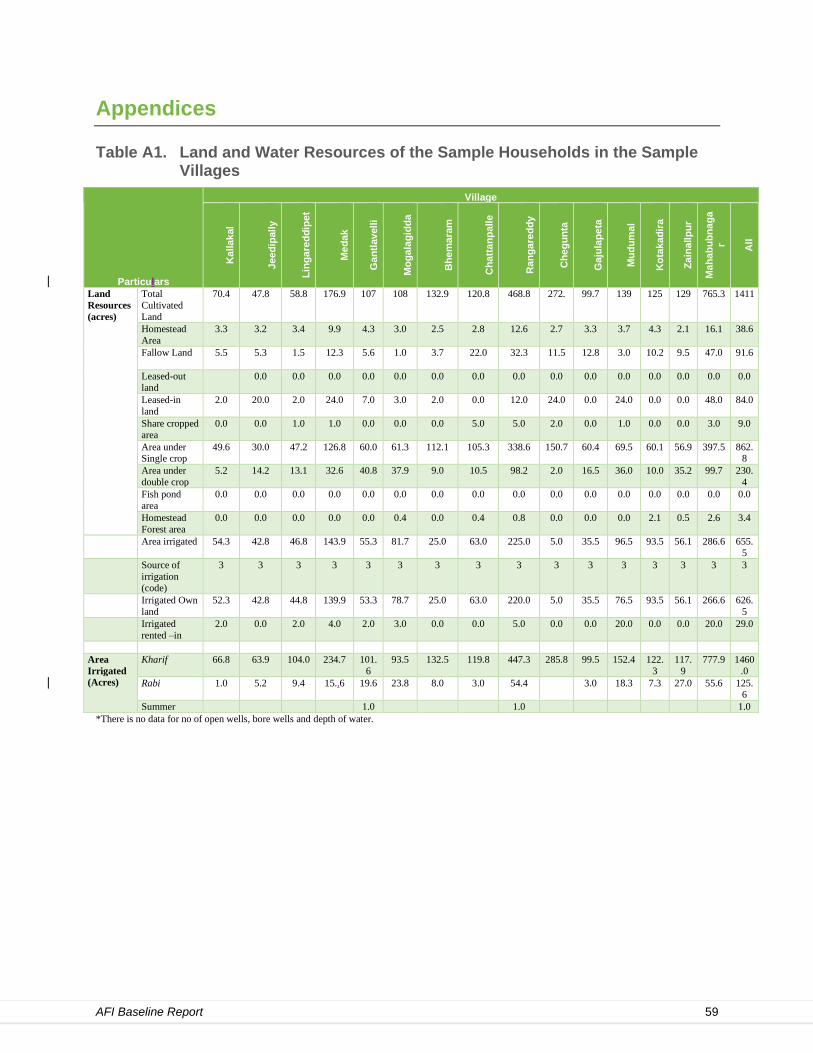
AFI Baseline Report 59
Appendices
Table A1. Land and Water Resources of the Sample Households in the Sample Villages
Particulars
Village
Ka
lla
kal
Je
ed
ipally
Lin
ga
red
dip
et
Me
da
k
Ga
ntl
av
elli
Mo
ga
lag
idd
a
Bh
em
ara
m
Ch
att
an
pa
lle
Ra
ng
are
dd
y
Ch
eg
un
ta
Ga
jula
pe
ta
Mu
du
ma
l
Ko
tak
ad
ira
Za
ina
llp
ur
Ma
ha
bu
bn
ag
a
r All
Land
Resources
(acres)
Total
Cultivated
Land
70.4 47.8 58.8 176.9 107 108 132.9 120.8 468.8 272. 99.7 139 125 129 765.3 1411
Homestead
Area
3.3
3.2 3.4 9.9 4.3 3.0 2.5 2.8 12.6 2.7 3.3 3.7 4.3 2.1 16.1 38.6
Fallow Land 5.5
5.3 1.5 12.3 5.6 1.0 3.7 22.0 32.3 11.5 12.8 3.0 10.2 9.5 47.0 91.6
Leased-out
land
0.0 0.0 0.0 0.0 0.0 0.0 0.0 0.0 0.0 0.0 0.0 0.0 0.0 0.0 0.0
Leased-in
land
2.0
20.0 2.0 24.0 7.0 3.0 2.0 0.0 12.0 24.0 0.0 24.0 0.0 0.0 48.0 84.0
Share cropped
area
0.0
0.0 1.0 1.0 0.0 0.0 0.0 5.0 5.0 2.0 0.0 1.0 0.0 0.0 3.0 9.0
Area under Single crop
49.6
30.0 47.2 126.8 60.0 61.3 112.1 105.3 338.6 150.7 60.4 69.5 60.1 56.9 397.5 862.8
Area under
double crop
5.2
14.2 13.1 32.6 40.8 37.9 9.0 10.5 98.2 2.0 16.5 36.0 10.0 35.2 99.7 230.
4
Fish pond
area
0.0
0.0 0.0 0.0 0.0 0.0 0.0 0.0 0.0 0.0 0.0 0.0 0.0 0.0 0.0 0.0
Homestead
Forest area
0.0
0.0 0.0 0.0 0.0 0.4 0.0 0.4 0.8 0.0 0.0 0.0 2.1 0.5 2.6 3.4
Area irrigated 54.3
42.8 46.8 143.9 55.3 81.7 25.0 63.0 225.0 5.0 35.5 96.5 93.5 56.1 286.6 655.
5
Source of
irrigation
(code)
3
3 3 3 3 3 3 3 3 3 3 3 3 3 3 3
Irrigated Own
land
52.3 42.8 44.8 139.9 53.3 78.7 25.0 63.0 220.0 5.0 35.5 76.5 93.5 56.1 266.6 626.
5
Irrigated
rented –in
2.0
0.0 2.0 4.0 2.0 3.0 0.0 0.0 5.0 0.0 0.0 20.0 0.0 0.0 20.0 29.0
Area
Irrigated
(Acres)
Kharif 66.8
63.9 104.0 234.7 101.
6
93.5 132.5 119.8 447.3 285.8 99.5 152.4 122.
3
117.
9
777.9 1460
.0
Rabi 1.0
5.2 9.4 15.,6 19.6 23.8 8.0 3.0 54.4 3.0 18.3 7.3 27.0 55.6 125.6
Summer 1.0 1.0 1.0
*There is no data for no of open wells, bore wells and depth of water.

AFI Baseline Report 60
Table A2. Type of House and Household Amenities
Village % of HH with
cement house
% of HH with
electricity
% of HH having tap
water at home
Average value of
house (Rs.)
Kallakal 57.6 100 75.8 543030
Jeedipally 60.6 100 72.7 502727
Lingareddipet 60.6 100 84.8 435152
Medak 59.6 100 77.8 493636
Gantlavelli 45.5 100 75.8 588182
Mogalagidda 48.5 100 45.5 767576
Bhemaram 55.9 100 55.9 626471
Chattanpalle 94.1 100 38.2 1396324
Rangareddy 61.2 100 53.7 847127
Chegunta 60.6 100 63.6 323636
Gajulapeta 48.5 100 66.7 256818
Mudumal 48.5 100 66.7 283182
Kotakadira 72.7 100 66.7 363485
Zainallpur 57.6 100 42.4 420000
Mahabubnagar 57.6 100 61.2 329424
All 59.3 100 62.8 544573
*No data for cement roof and cement floor.
Table A3. Movable Assets per Household: Present Value(in Rs. Average/HH Radio, TV, Automobile, Vehicles, Bicycles, Machines, Mobiles, Chairs, Tables, Refrigerator)
Village Marginal Small Medium Large All
Kallakal 49560 183440 84500 100800 73515
Jeedipally 75946 97700 571400 0 93597
Lingareddipet 47931 109225 31800 0 54383
Medak 58246 134223 160800 100800 73832
Gantlavelli 37747 184863 56275 42650 75955
Mogalagidda 52953 48917 10160 55350 45880
Bhemaram 30669 44144 51608 584650 70122
Chattanpalle 91104 121650 211700 753450 160378
Rangareddy 50181 106351 82203 359025 88489
Chegunta 61450 71433 39529 85822 56383
Gajulapeta 41943 32673 71150 0 41635
Mudumal 48900 22373 43556 90600 36648
Kotakadira 51669 30964 99300 70300 48721
Zainallpur 79660 42285 46967 123600 53727
Mahabubnagar 53978 34295 52183 89343 47423
All 54398 65440 68519 183643 67818

AFI Baseline Report 61
Table A4. Assets-Agriculture Implements: Present Value (in RS. Average/HH)
Village Marginal Small Medium Large All
Kallakal 43200 60000 0 0 41818
Jeedipally 78464 140000 75000 0 85818
Lingareddipet 37722 360250 533000 0 106833
Medak 53694 177000 228200 0 78157
Gantlavelli 40263 21625 25000 50000 34485
Mogalagidda 8250 17833 13000 30000 12030
Bhemaram 2500 3125 83333 107500 23088
Chattanpalle 5769 44429 44000 62500 30647
Rangareddy 15000 25750 44250 62500 25090
Chegunta 2750 0 42526 259000 95288
Gajulapeta 0 45575 90417 0 44061
Mudumal 16063 10800 54556 0 23682
Kotakadira 34125 10056 124000 64250 36439
Zainallpur 400 15600 274167 170000 69667
Mahabubnagar 13633 20612 91256 199964 53827
All 31969 38356 87607 143457 50204
Table A5. Sanitation and Hygiene Status
Village
% HH hand
washing
% HH using
private toilet
% HH using
shared toilet
% HH using public toilet
Material used for hand wash by
majority HHs
Type of toilet used by
majority of HHs
Kallakal 93.9 87.9 12.1 0.0 Soap Indian
Jeedipally 93.9 87.9 12.1 0.0 Soap Indian
Lingareddipet 84.8 87.9 12.1 0.0 Soap Indian
Medak 90.9 87.9 12.1 0.0
Gantlavelli 90.9 100.0 0.0 0.0 Soap Indian
Mogalagidda 93.9 97.0 0.0 3.0 Soap Indian
Bhemaram 91.2 100.0 0.0 0.0 Soap Indian
Chattanpalle 100.0 100.0 0.0 0.0 Soap Indian
Rangareddy 94.0 99.3 0.0 0.7
Chegunta 75.8 87.9 9.1 3.0 Soap Indian
Gajulapeta 72.7 87.9 12.1 0.0 Soap Indian
Mudumal 78.8 93.9 6.1 0.0 Soap Indian
Kotakadira 78.8 90.9 9.1 0.0 Soap Indian
Zainallpur 90.9 87.9 12.1 0.0 Soap Indian
Mahabubnagar 79.4 89.7 9.7 0.6
All 87.2 92.5 7.0 0.5

AFI Baseline Report 62
Table A6. Awareness about Nutrition and Consumption of Nutritious Food
Village
Average consumption (kg/no./L) per week
% H
H
Kn
ow
led
ge
ab
ou
t
nu
trit
ion
Meat
(kg
)
Fis
h (
kg
)
Eg
gs (
no
.)
Pu
lse
s (
kg
)
Milk (
L)
Veg
eta
ble
s
(kg
)
Fru
its (
kg
)
Kallakal 45.5 1.1 0.8 9.2 1.1 4.6 5.7 1.8
Jeedipally 30.3 1.2 0.5 10.0 1.0 3.9 5.6 1.7
Lingareddipet 18.2 1.0 0.6 9.2 0.9 3.7 5.5 1.2
Medak 31.3 1.1 0.6 9.4 1.0 4.0 5.6 1.5
Gantlavelli 57.6 0.7 0.1 6.2 1.0 3.6 3.1 1.4
Mogalagidda 75.8 0.8 0.0 6.7 0.8 4.7 3.0 1.4
Bhemaram 85.3 0.5 0.0 4.6 0.8 2.8 2.9 1.2
Chattanpalle 85.3 0.7 0.0 5.7 0.6 5.3 2.8 1.5
Rangareddy 76.1 0.7 0.0 5.8 0.8 4.1 3.0 1.4
Chegunta 39.4 0.6 0.4 5.0 1.4 4.3 6.1 1.6
Gajulapeta 15.2 1.4 0.9 7.8 1.2 4.0 5.5 1.3
Mudumal 21.2 1.0 1.5 8.2 1.2 3.7 5.8 1.6
Kotakadira 33.3 1.4 0.9 8.4 1.2 3.9 5.5 1.8
Zainallpur 27.3 1.0 0.6 7.5 1.4 3.9 6.0 1.8
Mahabubnagar 27.3 1.1 0.9 7.4 1.3 4.0 5.8 1.6
All 44.7 0.9 0.5 7.4 1.0 4.0 4.8 1.5
Table A7. Average Number of Crops grown by the Sample Households
Village Marginal Small Medium Large All
Kallakal 2 2 2 1 2
Jeedipally 1 1 2 0 1
Lingareddipet 1 2 4 0 2
Medak 1 2 3 1 2
Gantlavelli 2 3 2 3 2
Mogalagidda 2 4 2 3 2
Bhemaram 2 2 3 4 2
Chattanpalle 1 2 3 3 2
Rangareddy 2 3 2 3 2
Chegunta 1 1 1 2 1
Gajulapeta 1 2 2 0 2
Mudumal 1 1 2 2 1
Kotakadira 1 1 1 1 1
Zainallpur 2 2 2 3 2
Mahabubnagar 1 2 2 2 1
All 1 2 2 2 2

AFI Baseline Report 63
Table A8. Number of Farmers Growing and Area under Vegetable and Fruit Crops among the Sample Households
Village
Vegetable Crops Fruit Crops
No. of Farmers Area in Acres
No. of Farmers Area in Acres
Jeedipally 2 (0.6) 1.1 0 0
Kallakal 1(0.1) 0.1 0 0
Lingareddipet 6 (0.8) 4.5 0 0
Medak 9 (0.6) 5.7 0 0
Chattanpalle 5 (0.6) 3.0 0 0
Gantlavelli 9 (0.6) 5.3 1 (2) 2
Mogalagidda 3 (0.4) 1.2 0 0
Bhemaram 0 0 1 (3) 3
Rangareddy 17 (0.6) 9.5 2 (2.5) 2.5
All 26 (0.6) 15.2 2 (2.5) 5
Note= Figures in brackets are average area per farmer.
Table A9. Cropwise Irrigation Details (Total)
Village Crop Season Source (GW/
surface) Method (Drip/
sprinkler/ Flood)
Kallakal Paddy kharif 4 1
Jeedipally Paddy kharif 4 1
Lingareddipet Paddy kharif 4 1
Gantlavelli Paddy kharif 4 1
Mogalagidda Paddy kharif 3 1
Bhemaram Paddy kharif 3 1
Chattanpalle Paddy kharif 3 1
Gajulapeta Paddy kharif 4 1
Mudumal Paddy kharif 4 1
Kotakadira Paddy kharif 4 1
Zainallpur Paddy kharif 4 1
Note: Use codes Source code: 1= canal; 2= Deep Tube Well; 3= Shallow Tube Well; 4= LLP;
Method: 1= Flood; 2= drip; 3= Sprinkler.

AFI Baseline Report 64
Table A10. Percentage of Farmers Testing Soils and Adopting the Recommended Practices
Village Tested Adopted
Kallakal 0 0
Jeedipally 3 0
Lingareddipet 4 0
Medak 2 0
Gantlavelli 2 0
Mogalagidda 1 1
Bhemaram 2 0
Chattanpalle 3 0
Rangareddy 2 0.3
Chegunta 5 2
Gajulapeta 3 1
Mudumal 1 0
Kotakadira 4 0
Zainallpur 1 1
Mahabubnagar 3 1
Table A11. Cropwise Coverage of HYV and Hybrid Seeds (% of Farmers Using)
Village
Paddy Cotton Jowar Red Gram Maize
HY
V
Hyb
rid
Lo
cal
HY
V
Hyb
rid
Lo
cal
HY
V
Hyb
rid
Lo
cal
HY
V
Hyb
rid
Lo
cal
HY
V
Hyb
rid
Lo
cal
Kallakal 71 19 10 0 0 0 20 70 10 29 14 57 50 46 5
Jeedipally 50 46 4 0 0 0 33 67 0 50 50 0 50 50 0
Lingareddipet 39 62 0 100 0 0 14 71 14 33 33 33 0 0 0
Medak 52 44 4 100 0 0 22 70 9 33 25 42 50 47 3
Gantlavelli 13 58 29 0 0 0 0 67 33 0 0 0 4 88 8
Mogalagidda 13 87 0 0 100 0 0 0 100 33 67 0 0 0 0
Bhemaram 17 83 0 0 100 0 20 40 40 0 100 0 0 0 0
Chattanpalle 7 87 7 0 100 0 0 100 0 0 100 0 0 0 0
Rangareddy 12 77 11 0 100 0 13 47 40 13 88 0 4 88 8
Chegunta 75 25 0 55 45 0 0 50 50 0 64 36 0 0 0
Gajulapeta 57 43 0 20 80 0 0 20 80 25 42 33 0 0 0
Mudumal 75 8 17 76 24 0 0 0 0 43 43 14 0 0 0
Kotakadira 59 32 9 0 0 0 0 33 67 33 67 0 0 0 0
Zainallpur 27 55 18 0 100 0 25 0 75 50 25 25 60 40 0
Mahabubnagar 57 33 10 59 41 0 15 12 73 24 49 27 60 40 0
All 39 52 8 41 59 0 17 41 42 25 49 26 40 56 4

AFI Baseline Report 65
Table A12. Source of Fertilizers and Mode of Payment
Village
% of HH Buying
Fertilizer from
Merchants
% of HH Buying
Fertilizer from Dealers
% of HH Buying with
Cash
% of HH Receiving Advisory Services
% HH with Membership in a Group
Kallakal 69.7 3.0 97.0 0.0 0.0
Jeedipally 90.9 3.0 97.0 0.0 0.0
Lingareddipet 87.9 0.0 100.0 0.0 0.0
Medak 82.8 2.0 98.0 0.0 0.0
Gantlavelli 6.1 93.9 100.0 9.1 0.0
Mogalagidda 6.1 93.9 100.0 3.0 0.0
Bhemaram 0.0 100.0 100.0 0.0 0.0
Chattanpalle 5.9 94.1 100.0 0.0 0.0
Rangareddy 4.5 95.5 100.0 3.0 0.0
Chegunta 97.0 0.0 97.0 12.1 3.0
Gajulapeta 90.9 3.0 100.0 0.0 12.1
Mudumal 81.8 3.0 90.9 6.1 0.0
Kotakadira 78.8 3.0 93.9 0.0 0.0
Zainallpur 97.0 3.0 100.0 6.1 0.0
Mahabubnagar 89.1 2.4 96.4 4.8 3.0
All 59.0 33.7 98.0 3.0 1.3
Table A13. Use of Fertilizers (per acre): Paddy Crop (Kharif Season)
Villages
Urea DAP SSP TSP MOP
Qu
an
tity
(Qt)
Co
st
(Rs
.)
Qu
an
tity
(Qt)
Co
st
(Rs
.)
Qu
an
tity
(Qt)
Co
st
(Rs
.)
Qu
an
tity
(Qt)
Co
st
(Rs
.)
Qu
an
tity
(Qt)
Co
st
(Rs
.)
Kallakal 1.63 1292 1.31 3085 0.75 750 0.94 1481 0.55 783
Jeedipally 1.63 1085 1.37 3478 0 0 1.28 2000 0.84 1422
Lingareddipet 1.76 1229 1.23 2612 0.75 750 1.00 1600 0.33 667
Medak 1.68 1201 1.30 3019 0 0 1.06 1680 0.66 1063
Gantlavelli 1.14 588 1.23 2347 0 0 0.53 932
Mogalagidda 1.66 899 1.10 2376 0 0 0.53 753 0.17 320
Bhemaram 1.21 671 1.21 2690 1.00 900 0.58 1092 0.17 333
Chattanpalle 0.94 646 0.70 1640 1.00 900 0.50 800 0.61 1354
Rangareddy 1.27 709 1.07 2253 0 0 0.54 890 0.46 1012
Chegunta 0 0 0 0 0.25 500 0 0 0 0
Gajulapeta 1.38 852 0.84 1635 0 0 0.29 582 0.54 930
Mudumal 1.67 1035 0.91 2155 0.34 306 0.54 975 0.61 1275
Kotakadira 1.50 881 1.15 2570 0.25 250 0.63 729 0.48 1073
Zainallpur 1.74 844 1.22 2042 0.29 340 0.38 700 0.37 671
Mahabubnagar 1.54 892 1.04 2163 0.53 537 0.50 712 0.51 1039
All 1.50 943 1.14 2510 0.75 750 0.69 1065 0.55 1042

AFI Baseline Report 66
Table A14. Use of Fertilizers (per acre): Cotton Crop
Village Marginal Small Medium Large All
Lingareddipet 0 0 2.0 0 2.0
Medak 0 0 2.0 0 2.0
Mogalagidda 2.1 1.8 1.7 2.9 2.0
Bhemaram 1.9 2.2 2.8 2.8 2.4
Chattanpalle 0 2.3 0 0 2.3
Rangareddy 2.0 2.1 2.3 2.8 2.2
Chegunta 2.2 2.3 2.5 2.4 2.4
Gajulapeta 1.1 2.8 1.7 0 1.9
Mudumal 2.7 2.0 2.5 2.5 2.3
Zainallpur 0 0 2.5 0 2.5
Mahabubnagar 2.1 2.1 2.5 2.4 2.3
Total 2.1 2.1 2.4 2.5 2.3
Table A15. Use of Fertilizers (per acre): Red Gram Crop
Villages
Urea DAP SSP TSP MOP
Qu
an
tity
(Qt)
Co
st
(Rs
.)
Qu
an
tity
(Qt)
Co
st
(Rs
.)
Qu
an
tity
(Qt)
Co
st
(Rs
.)
Qu
an
tity
(Qt)
Co
st
(Rs
.)
Qu
an
tity
(Qt)
Co
st
(Rs
.)
Kallakal 1.01 658 1.08 2454 0 0 1.33 1333 0 0
Jeedipally 0.5 350 0.92 2200 0 0 0 0 0 0
Lingareddipet 1.25 965 1.00 2150 0 0 0 0 0 0
Medak 1.26 915 1.03 2325 0 0 1.33 1333 0 0
Gantlavelli 0 0 0 0 0 0 0 0 0 0
Mogalagidda 0.89 576 1.04 2425 0 0 0.79 787 0 0
Bhemaram 1.17 727 1.00 2325 0 0 0 0 0 0
Chattanpalle 1.00 600 0.75 1800 0 0 0 0 0 0
Rangareddy 1.05 655 0.95 2218 0 0 0.79 787 0 0
Chegunta 0.74 491 0.70 1764 0 0 0.53 600 0 0
Gajulapeta 0.90 565 0.85 1862 0.80 800 0.83 833 0 0
Mudumal 0.52 331 0.47 1269 0 0 0.25 250 1.0 900
Kotakadira 1.04 493 0.75 1767 0 0 0.25 250 0 0
Zainallpur 1.17 513 1.04 2313 0.50 500 0.58 583 0.8 725
Mahabubnagar 0.81 487 0.75 1764 0.65 650 0.55 573 0.8 783
All 0.86 536 0.83 1928 0.65 650 0.73 751 0.8 783

AFI Baseline Report 67
Table A16. Use of Fertilizers (per acre). Jowar crop
Village Marginal Small Medium Large All
Kallakal 0.8 1.1 1.4 1.1
Jeedipally 1.3 0 0 0 1.3
Lingareddipet 0.9 1.1 1.7 0 1.2
Medak 1.1 1.1 1.6 0 1.2
Gantlavelli 1.0 0.8 1.1 1.0
Mogalagidda 0.8 0.9 1.1 1.3 1.0
Bhemaram 1.2 1.5 0.5 1.5 1.1
Chattanpalle 0.7 1.2 1.5 1.2 1.2
Rangareddy 1.1 1.1 0.9 1.3 1.1
Chegunta 0 0 1.5 1.0 1.3
Gajulapeta 0 1.3 0 0 1.3
Kotakadira 0 1.2 0 0 1.2
Zainallpur 1.0 1.2 0.9 1.5 1.1
Mahabubnagar 1.0 1.2 1.0 1.3 1.2
All 1.1 1.2 1.1 1.3 1.2
Table A17. Allocation of labor by activity (average per household)
Village
La
nd
Pre
pa
rati
o
n
Se
ed
ing
/
Tra
ns
pla
n
tin
g
Fe
rtil
ize
r
Ap
pli
ca
tio
n
We
ed
ing
Irri
ga
tio
n
Pe
sti
cid
e
Harv
es
tin
g
Po
st-
Harv
es
t
Ta
sk
s*
M W M W M W M W M W M W M W M W
Kallakal 2.2 1.0 3.1 7.0 2.1 1.3 1.9 7.5 25.9 4.8 1.4 0.8 4.3 6.6 2.8 2.5
Jeedipally 1.9 0.9 2.1 5.3 2.1 1.3 1.8 6.4 29.3 4.6 1.8 1.0 4.1 10.0 2.4 1.9
Lingareddipet 2.4 1.0 2.7 9.4 2.4 1.6 2.3 10.2 30.0 3.4 2.1 1.1 3.8 8.6 3.3 3.1
Medak 2.2 1.0 2.7 7.3 2.2 1.4 2.0 8.1 28.4 4.3 1.8 0.9 4.1 8.3 2.8 2.5
Gantlavelli 1.5 0.6 2.0 8.1 2.4 0.7 1.8 10.2 10.4 1.8 1.9 0.2 3.0 4.1 2.4 1.8
Mogalagidda 1.2 0.6 2.8 10.0 2.8 1.3 2.0 10.6 10.8 0.7 1.7 0.7 8.4 17.0 3.5 2.0
Bhemaram 1.3 0.4 1.5 7.5 2.0 1.6 1.3 12.9 3.5 0.2 1.2 0.7 2.5 13.0 1.9 2.7
Chattanpalle 1.2 0.3 1.0 8.9 2.4 1.6 0.8 15.0 12.0 0.3 1.5 0.8 2.2 14.8 1.2 1.7
Rangareddy 1.3 0.5 1.9 8.7 2.4 1.3 1.5 12.1 9.2 0.8 1.6 0.6 4.2 12.4 2.3 2.1
Chegunta 2.6 1.7 3.6 12.0 5.2 2.7 3.7 17.6 1.2 0.6 4.5 1.0 5.8 15.6 3.5 1.3
Gajulapeta 2.0 0.9 2.1 5.6 2.3 1.2 1.4 9.2 17.8 0.9 1.7 0.5 3.6 6.4 2.7 1.2
Mudumal 3.3 1.7 2.2 15.0 3.8 1.9 2.8 14.5 10.6 0.8 3.7 1.0 3.1 21.6 2.5 0.9
Kotakadira 2.3 1.4 2.7 9.5 3.3 1.0 2.6 12.0 27.8 2.9 2.3 0.4 3.5 6.5 2.6 1.6
Zainallpur 1.9 0.9 2.4 5.4 2.5 1.7 1.8 7.7 19.1 0.7 1.3 0.7 3.6 6.7 2.9 2.1
Mahabubnagar 2.4 1.3 2.6 9.2 3.4 1.7 2.4 11.9 15.4 1.1 2.6 0.7 3.9 11.0 2.9 1.4
Total 1.9 0.9 2.3 8.5 2.7 1.5 2.0 11.1 16.0 1.7 2.0 0.7 4.1 10.9 2.6 2.0
Note: M= Male; W= Women; * Post-harvest tasks include threshing, cleaning, drying, parboiling, husking, sorting,
grading, packing, transporting, and storage work.

AFI Baseline Report 68
Table A18. Descriptive Statistics of Yield Rates of Paddy in the Sample Villages
Village Mean Median Maximum Minimum Mode SD
Kallakal 17.3 20.0 22.7 8.0 20.0 3.9
Jeedipally 16.7 18.0 25.0 0.7 20.0 5.5
Lingareddipet 15.9 16.0 22.5 0.4 20.0 4.8
Medak 16.6 18.0 25.0 0.4 20.0 4.8
Bhemaram 14.4 15.0 22.5 4.7 20.0 5.5
Chattanpalle 14.3 15.0 25.0 4.0 10.0 6.7
Gantlavelli 17.5 18.0 28.0 5.3 20.0 5.2
Mogalagidda 17.0 16.7 28.0 3.0 20.0 5.9
Rangareddy 16.3 16.7 28.0 3.0 20 5.8
Chegunta 15.6 15.6 15.6 15.6 15.6 0
Gajulapeta 16.7 17.5 26.7 5.0 17.5 6.7
Kotakadira 15.7 17.6 24.0 4.0 17.5 6.1
Mudumal 18.2 19.5 26.3 6.7 21.0 4.9
Zainallpur 14.8 15.0 27.5 5.9 7.5 5.9
Mahabubnagar 16.2 17.5 27.5 4.0 17.5 5.9
All 16.4 17.5 28.0 0.4 20.0 5.5
Table A19. Descriptive Statistics of Yield Rates of Cotton in the Sample Villages
Village Mean Median Maximum Minimum Mode SD
Kallakal 7 7 15 3 10 3
Jeedipally 6 6 8 4 4 1
Lingareddipet 7 7 13 2 7 3
Medak 7 7 7 7 7 .
Bhemaram 7 7 15 2 10 3
Chattanpalle 10 10 10 10 10 .
Gantlavelli 10 10 10 10 10 .
Mogalagidda 6 6 10 3 5 2
Rangareddy 7 7 10 3 3 5
Chegunta 8 8 13 5 5 3
Gajulapeta 7 7 13 3 5 2
Kotakadira 7 7 15 2 10 3
Mudumal 7 7 15 3 10 3
Zainallpur 6 6 8 4 4 1
Mahabubnagar 7 7 13 2 7 3
All 7 7 7 7 7 .

AFI Baseline Report 69
Table A20. Descriptive Statistics of Yield Rates of Red Gram in the Sample Villages
Village Mean Median Maximum Minimum Mode SD
Kallakal 7 5 15 3 3 5
Jeedipally 7 7 7 7 7 0
Lingareddipet 6 6 8 4 4 2
Medak 7 6 15 3 4 4
Bhemaram 4 4 5 3 3 1
Chattanpalle 5 4 8 4 4 2
Gantlavelli 7 7 8 6 6 1
Mogalagidda 5 5 8 3 4 2
Rangareddy 4 5 6 1 5 2
Chegunta 5 3 10 2 3 2
Gajulapeta 4 3 7 1 3 2
Kotakadira 4 4 5 3 3 1
Mudumal 4 4 7 3 3 2
Zainallpur 4 4 10 1 3 2
Mahabubnagar 5 4 15 1 3 3
All 7 5 15 3 3 5
Table A21. Descriptive Statistics of Yield Rates of Jowar in the Sample Villages
Village Mean Median Maximum Minimum Mode SD
Kallakal 6 5 9 3 5 2
Jeedipally 5 5 7 3 4 2
Lingareddipet 6 6 11 3 5 2
Medak 6 5 11 3 5 2
Bhemaram 4 4 5 4 4 1
Chattanpalle 5 5 6 4 6 1
Gantlavelli 6 6 10 2 6 2
Mogalagidda 6 6 8 3 5 1
Rangareddy 6 6 10 2 4 2
Chegunta 3 3 3 3 3 0
Gajulapeta 2 2 5 1 2 1
Kotakadira 4 4 5 3 3 1
Mudumal 4 4 6 1 5 1
Zainallpur 4 4 6 1 5 1
Mahabubnagar 5 5 11 1 5 2
All 6 5 9 3 5 2

AFI Baseline Report 70
Table A22. Descriptive Statistics of Yield Rates of Maize in the Sample Villages
Village Mean Median Maximum Minimum Mode SD
Kallakal 12 12 13 10 10 2
Jeedipally 10 10 10 9 9 1
Medak 11 10 13 9 10 2
Gantlavelli 10 11 15 3 10 3
Rangareddy 10 11 15 3 10 3
Zainallpur 17 17 17 17 17 5.9
Mahabubnagar 17 17 17 17 17 5.9
All 11 10 17 3 10 3

AFI Baseline Report 71
Table A 23. Regression Estimates for Paddy Crop
Model
Unstandardized Coefficients
Standardized Coefficients
t Sig. B Std. Error Beta
1 (Constant) 9.257 2.335 3.965 0.000
Farm Size 0.022 0.183 0.008 0.122 0.903
fertilizers 0.567 0.609 0.059 0.931 0.353
Labor 0.107 0.048 0.143 2.246 0.026
Manure -0.008 0.026 -0.021 -0.319 0.750
Pesticides kg -0.887 1.517 -0.037 -0.584 0.559
Pesticides ltrs 0.130 0.845 0.010 0.153 0.878
Irrigation dummy 2.345 1.335 0.116 1.756 0.080
Village Dummy 0.055 0.045 0.086 1.229 0.220
2 (Constant) 9.263 2.329 3.977 0.000
fertilizers 0.563 0.607 0.058 0.929 0.354
Labor 0.107 0.048 0.143 2.248 0.025
Manure -0.009 0.026 -0.021 -0.330 0.741
Pesticides kg -0.890 1.514 -0.037 -0.588 0.557
Pesticides ltrs 0.131 0.843 0.010 0.156 0.876
Irrigation dummy 2.376 1.308 0.118 1.816 0.071
Village Dummy 0.057 0.042 0.089 1.380 0.169
3 (Constant) 9.317 2.299 4.052 0.000
fertilizers 0.560 0.605 0.058 0.926 0.356
Labor days 0.107 0.048 0.143 2.250 0.025
Manure -0.008 0.026 -0.020 -0.317 0.752
Pesticides kg -0.908 1.506 -0.038 -0.603 0.547
Irrigation dummy 2.365 1.304 0.117 1.814 0.071
Village Dummy 0.058 0.041 0.090 1.402 0.162
4 (Constant) 9.262 2.289 4.047 0.000
fertilizers 0.557 0.604 0.058 0.922 0.357
Labor days 0.109 0.047 0.145 2.299 0.022
Pesticides kg -0.938 1.500 -0.039 -0.625 0.532
Irrigation dummy 2.300 1.285 0.114 1.790 0.075
Village Dummy 0.058 0.041 0.090 1.410 0.160
Model Summary(b)
Model R R
Square Adjusted R
Square Std. Error of the Estimate
Durbin-Watson
1 0.203 0.041 0.010 5.439 1.794 2 0.203 0.041 0.014 5.428 3 0.202 0.041 0.018 5.417 4 0.201 0.041 0.021 5.407

AFI Baseline Report 72
Table A 24. Regression Estimates for Cotton Crop
Coefficients(a)
Model
Unstandardized Coefficients
Standardized Coefficients
t Sig.
Collinearity Statistics
B Std.
Error Beta Tolerance VIF
1 (Constant) 4.052 1.741 2.327 0.023
Irrigation dummy 0.704 0.771 0.100 0.912 0.365 0.928 1.077
Farm Size -0.167 0.069 -0.300 -2.414 0.018 0.717 1.395
Manure 0.004 0.017 0.027 0.250 0.803 0.936 1.068
Labor 0.018 0.033 0.067 0.554 0.581 0.763 1.311
Fertilizers 0.657 0.455 0.163 1.444 0.153 0.875 1.143
Pesticides (kg) 2.493 0.957 0.315 2.604 0.011 0.760 1.315
Pesticides (L) 0.761 0.508 0.168 1.498 0.139 0.884 1.131
Village_Code 0.854 0.934 0.121 0.915 0.363 0.633 1.579
District_Code -0.315 0.395 -0.112 -0.798 0.428 0.567 1.762
2 (Constant) 4.086 1.725 2.368 0.020
Crop_irrigation 0.692 0.765 0.098 0.904 0.369 0.932 1.073
Farm size -0.168 0.068 -0.303 -2.465 0.016 0.724 1.382
Labor 0.019 0.032 0.070 0.587 0.559 0.771 1.297
Fertilizers 0.641 0.448 0.159 1.432 0.156 0.893 1.120
Pesticides (kg) 2.480 0.950 0.313 2.610 0.011 0.763 1.311
Pesticides (L) 0.768 0.504 0.169 1.522 0.132 0.887 1.128
Village_code 0.840 0.926 0.119 0.906 0.368 0.636 1.573
District_code -0.311 0.393 -0.110 -0.793 0.430 0.568 1.760
3 (Constant) 4.739 1.313 3.609 0.001
Irrigation dummy 0.669 0.761 0.095 0.880 0.382 0.934 1.071
Farm size -0.161 0.067 -0.290 -2.408 0.018 0.751 1.331
Fertilizers 0.683 0.440 0.169 1.555 0.124 0.917 1.090
Pesticides (kg) 2.531 0.942 0.319 2.687 0.009 0.769 1.300
Pesticides (L) 0.814 0.496 0.180 1.642 0.105 0.909 1.100
Village_code 0.896 0.917 0.127 0.977 0.332 0.643 1.556
District_code -0.380 0.373 -0.134 -1.017 0.312 0.623 1.605
4 (Constant) 4.631 1.305 3.547 0.001
Farm size -0.159 0.067 -0.287 -2.392 0.019 0.752 1.330
Fertilizers 0.731 0.436 0.181 1.677 0.098 0.931 1.074
Pesticides (kg) 2.462 0.937 0.311 2.626 0.010 0.774 1.291
Pesticides (L) 0.788 0.494 0.174 1.595 0.115 0.913 1.096
Village_code 1.068 0.895 0.151 1.193 0.236 0.673 1.485
District_code -0.418 0.370 -0.148 -1.129 0.262 0.632 1.583
5 (Constant) 4.600 1.307 3.519 0.001
Farm size -0.143 0.065 -0.258 -2.194 0.031 0.789 1.267
Fertilizers 0.685 0.435 0.170 1.575 0.119 0.939 1.065
Pesticides (kg) 2.533 0.937 0.320 2.704 0.008 0.778 1.285
Pesticides (L) 0.787 0.495 0.173 1.589 0.116 0.913 1.096
Village_code 0.531 0.759 0.075 0.699 0.487 0.939 1.065
6 (Constant) 5.144 1.047 4.912 0.000
Farm size -0.152 0.063 -0.274 -2.397 0.019 0.825 1.213
Fertilizers 0.721 0.430 0.178 1.676 0.098 0.953 1.050
Pesticides (kg) 2.563 0.933 0.324 2.748 0.007 0.780 1.283
Fertilizers (L) 0.829 0.490 0.183 1.691 0.095 0.926 1.080

AFI Baseline Report 73
a
Dependent Variable: Cotton yield
Model Summary(b)
Model R R Square Adjusted R
Square Std. Error of the Estimate
Durbin-Watson
1 0.422 0.178 0.078 2.464 2.119 2 0.421 0.177 0.090 2.448 3 0.417 0.174 0.098 2.437 4 0.407 0.165 0.100 2.434 5 0.389 0.151 0.097 2.438 6 0.382 0.146 0.103 2.430

AFI Baseline Report 74
Table A 25. Regression Estimates for Red Gram Crop
Coefficients(a)
Model
Unstandardized Coefficients
Standardized
Coefficients
t Sig.
Collinearity Statistics
B Std. Error Beta
Tolerance VIF
1 (Constant) 2.883 1.283 2.247 0.029
Farm Size -0.231 0.202 -0.146 -1.143 0.258 0.847 1.181
Fertilizers 0.381 0.350 0.130 1.089 0.281 0.979 1.022
Pesticides (L) 1.199 0.806 0.199 1.487 0.143 0.774 1.292
Pesticides (kg) -1.750 1.423 -0.164 -1.230 0.224 0.783 1.276
Irrigation dummy -1.821 0.760 -0.304 -2.395 0.020 0.862 1.160
District_code 1.022 0.463 0.286 2.209 0.032 0.830 1.205
2 (Constant) 3.549 1.129 3.143 0.003
Farm size -0.253 0.202 -0.160 -1.256 0.215 0.855 1.169
Pesticides (L) 1.226 0.807 0.204 1.519 0.135 0.775 1.291
Pesticides (kg) -1.585 1.417 -0.148 -1.118 0.268 0.793 1.262
Irrigation dummy -1.833 0.761 -0.306 -2.407 0.020 0.863 1.159
District_code 1.031 0.463 0.288 2.226 0.030 0.830 1.205
3 (Constant) 3.138 1.070 2.932 0.005
Farm size -0.286 0.200 -0.181 -1.433 0.157 0.874 1.144
Pesticides (L) 1.572 0.747 0.261 2.104 0.040 0.908 1.101
Irrigation dummy -1.761 0.760 -0.294 -2.316 0.024 0.869 1.151
District_code 1.054 0.464 0.295 2.271 0.027 0.832 1.202
a Dependent Variable: Yield
Model Summary(b)
Model R R
Square Adjusted R Square
Std. Error of the Estimate
Durbin-
Watson
1 0.514 0.264 0.181 2.253 2.211
2 0.498 0.248 0.178 2.257
3 0.480 0.230 0.174 2.262

AFI Baseline Report 75
Table A26. Cropwise Yields (Value and Cost of Cultivation with Different Indicators of Sample Households by Economic Groups)
Crop: a (paddy)
Village
MF SF Medium Large All
Ou
tpu
t
Va
lue
Inp
ut
Co
sts
Ne
t In
co
me
Yie
ld
Ou
tpu
t V
alu
e
Inp
ut
Co
sts
Ne
t In
co
me
Yie
ld
Ou
tpu
t
Va
lue
Inp
ut
Co
sts
Ne
t In
co
me
Yie
ld
Ou
tpu
t
Va
lue
Inp
ut
Co
sts
Ne
t In
co
me
Yie
ld
Ou
tpu
t
Va
lue
Inp
ut
Co
sts
Ne
t In
co
me
Yie
ld
Kallakal 23890 18266 5624 18 30586 22439 8148 16 26383 20794 5589 15 26006 19642 6364 18
Jeedipally 24895 19548 5347 17 19071 16112 2959 12 27750 21743 6008 20 24199 19162 5037 17
Lingareddipet 25421 22972 2449 15 32487 25258 7229 19 35331 24658 10673 19 27205 23417 3788 16
Medak 24861 20581 4280 17 27964 21482 6482 16 31199 22963 8236 19 25836 20900 4936 17
Gantlavelli 20713 22162 -1449 15 21725 15194 6531 19 12702 10433 2269 19 25200 21400 3800 21 20090 17926 2164 18
Mogalagidda 20021 19959 62 15 25932 25753 179 18 29839 23601 6238 21 29787 18081 11706 18 23482 21667 1815 17
Bhemaram 16799 19200 -2401 13 16883 11746 5137 12 25179 15465 9714 17 20854 13995 6859 18 19376 15817 3559 14
Chattanpalle 21800 14993 6807 10 16243 13271 2972 16 25158 24021 1137 13 19414 16711 2703 14
Rangareddy 19721 20369 -648 14 19836 15944 3892 17 23831 19156 4675 18 24174 16868 7306 19 20884 18454 2430 16
Chegunta 0 26667 18560 8107 16 0 26667 18560 8107 16
Gajulapeta 22556 10097 12459 17 20130 15484 4646 17 17325 13914 3411 15 19502 14651 4851 17
Mudumal 16565 14836 1729 14 30366 19093 11273 18 30544 23928 6616 21 30625 20931 9694 19 28464 19997 8467 18
Kotakadira 24713 21310 3403 17 24721 14455 10266 16 21141 9714 11427 14 24705 14538 10167 13 24036 14866 9170 16
Zainallpur 0 22259 17089 5170 14 27500 10419 17081 21 27152 15146 12006 13 23762 16033 7729 15
Mahabubnagar 22077 17859 4218 17 24232 16291 7941 16 23349 15434 7915 17 26868 16060 10808 14 24009 16269 7740 16
Total 22883 20271 2612 16 23414 17019 6395 17 24580 18086 6494 18 25670 16419 9251 17 23488 18550 4938 16
Maximum marginal farmers are not sold the crop they kept for food.

AFI Baseline Report 76
Crop: b (cotton)
Village
MF SF Medium Large All
Ou
tpu
t
Va
lue
Inp
ut
Co
sts
Ne
t In
co
me
Yie
ld
Ou
tpu
t
Va
lue
Inp
ut
Co
sts
Ne
t In
co
me
Yie
ld
Ou
tpu
t
Va
lue
Inp
ut
Co
sts
Ne
t In
co
me
Yie
ld
Ou
tpu
t V
alu
e
Inp
ut
Co
sts
Ne
t In
co
me
Yie
ld
Ou
tpu
t
Va
lue
Inp
ut
Co
sts
Ne
t In
co
me
Yie
ld
Kallakal
Jeedipally
Lingareddipet 32214 24798 7416 10.0 32214 24798 7416 10.0
Medak 32214 24798 7416 10.0 32214 24798 7416 10.0
Gantlavelli 0
Mogalagidda 33971 26753 7218 8.6 30796 28499 2297 5.1 39700 34813 4887 8.8 37100 30556 6544 9.9 33897 28653 5244 7.6
Bhemaram 31121 25551 5570 5.7 34792 29788 5004 6.9 39438 36529 2909 7.2 40685 35198 5487 5.0 35641 32427 3214 6.3
Chattanpalle 0 36667 30988 5679 6.5 36667 30988 5679 6.5
Rangareddy 32546 26152 6394 7.1 33877 31872 2005 6.2 39503 36100 3403 7.6 39490 33650 5840 6.6 35073 30892 4181 6.8
Chegunta 35485 27804 7681 7.5 32000 24074 7926 10.0 37297 27565 9732 7.2 37624 26161 11463 6.2 36933 26948 9985 7.1
Gajulapeta 30000 25690 4310 5.3 30533 28425 2108 6.5 36083 25395 10688 7.0 0 32206 27392 4814 6.3
Mudumal 30245 26290 3955 4.7 34570 26732 7838 8.6 37063 34811 2252 6.5 35625 26681 8944 6.3 34865 30108 4757 6.9
Kotakadira 0
Zainallpur 33727 28018 5709 7.3 33727 28018 5709 7.3
Mahabubnagar 31494 26518 4976 5.6 33369 27041 6328 8.5 37027 29609 7418 7.0 37424 26213 11211 6.2 35662 28136 7526 6.9
All 32020 26335 5685 6.3 33597 27937 5660 7.5 37172 30214 6958 7.2 37901 27929 9972 6.3 35453 28579 6874 6.9

AFI Baseline Report 77
Crop: c (red gram)
Village
MF SF Medium Large All O
utp
ut
Va
lue
Inp
ut
Co
sts
Ne
t In
co
me
Yie
ld
Ou
tpu
t V
alu
e
Inp
ut
Co
sts
Ne
t In
co
me
Yie
ld
Ou
tpu
t V
alu
e
Inp
ut
Co
sts
Ne
t In
co
me
Yie
ld
Ou
tpu
t
Va
lue
Inp
ut
Co
sts
Ne
t In
co
me
Yie
ld
Ou
tpu
t
Va
lue
Inp
ut
Co
sts
Ne
t In
co
me
Yie
ld
Kallakal 21010 18645 2365 6 21622 18300 3322 5 2112 18588 4071 6
Jeedipally 21625 17767 3858 7 0 21625 17767 3858 7
Lingareddipet 22622 18160 4462 6 22511 19321 3190 6 22585 18547 4038 6
Medak 20394 18342 2052 7 22066 18811 3255 5 20698 18427 2271 7
Gantlavelli 0
Mogalagidda 17323 13031 4292 3 20833 13567 7266 5 0 19078 13299 5779 4
Bhemaram 20412 13033 7379 6 0 24338 16825 7513 4 21721 14297 7424 5
Chattanpalle 22651 15550 7101 6 21000 14308 6692 6 0 21825 14929 6896 6
Rangareddy 17323 13031 4292 3 21077 13796 7281 6 21000 14308 6692 6 24338 16825 7513 4 20996 14192 6804 5
Chegunta 0 19213 18994 219 3 27485 19790 7695 5 22659 19326 3333 4
Gajulapeta 23974 14250 9724 6 22225 18854 3371 4 19500 17567 1933 3 22419 17693 4726 5
Mudumal 19231 13374 5857 6 20023 15576 4447 3 20992 17879 3113 3 20073 15605 4468 4
Kotakadira 23639 14006 9633 4 20714 14161 6553 3 22908 14045 8863 4
Zainallpur 20100 15520 4580 3 22989 17983 5006 5 21538 15175 6363 3 22266 17104 5162 4
Mahabubnagar 21747 14170 7577 6 22261 17388 4873 4 19852 17968 1884 3 27485 19790 7695 5 22121 17380 4741 4
Total 20709 16446 4263 6 22056 16763 5293 4 20224 17837 2387 4 26960 19296 7664 5 21729 17200 4529 5

AFI Baseline Report 78
Crop: d (Jowar)
Village
MF SF Medium Large All
GVO IC NI Yi GVO IC NI Yi GVO IC NI Yi GVO IC NI Yi GVO IC NI Yi
Kallakal 13365 10614 2751 6 12125 11779 346 5 11780 9660 2120 5 12125 11779 346 6
Jeedipally 13783 12589 1194 5 0 0 5
Lingareddipet 12039 10685 1354 6 12650 9992 2658 6 10511 9512 999 5 12650 9992 2658 6
Medak 13148 11257 1891 6 12335 11064 1271 5 11357 9611 1746 5 12335 11064 1271 6
Gantlavelli 11700 8575 3125 4 12500 7113 5387 5 0 11250 9120 2130 4 12500 7113 5387 4
Mogalagidda 12237 9688 2549 5 11429 8100 3329 5 12120 9450 2670 4 11840 9630 2210 6 11429 8100 3329 5
Bhemaram 10982 11336 -354 6 10746 12336 -1590 6 11192 11992 -800 6 12069 8161 3908 5 10746 12336 -1590 6
Chattanpalle 11895 8228 3667 5 12914 10272 2642 6 11109 11387 -278 6 12773 10998 1775 6 12914 10272 2642 6
Rangareddy 11581 9828 1753 5 11966 10779 1187 6 11252 11496 -244 6 12129 9511 2618 5 11966 10779 1187 6
Chegunta 0 0 11850 9065 2785 3 12273 10082 2191 3 0 3
Gajulapeta 0 10713 11429 -716 2 10713 11429 -716 2
Mudumal 0 0 0
Kotakadira 0 9150 12588 -3438 4 9150 12588 -3438 4
Zainallpur 11536 9030 2506 4 12855 10776 2079 4 10444 9711 733 3 14550 10692 3858 5 12855 10776 2079 4
Mahabubnagar 11536 9030 2506 4 11911 11116 795 4 10678 9603 1075 3 13411 10387 3024 4 11911 11116 795 4
Total 12430 10569 1861 6 11974 10987 987 5 11087 10600 487 5 12449 9730 2719 5 11974 10987 987 5

AFI Baseline Report 79
Questionnaire
Accelerating Farm Incomes (AFI): Building Sustainable Soil Health,
Markets and Productivity in Telangana State, India
Funded by: Walmart Foundation Implemented by: International Fertilizer Development Center (IFDC)
Baseline Survey of Sample Households in AFI Project Area
Questionnaire No. _________
Time of Interview Start: _________ Date of Interview _____/_____/_____
dd mm yy
Interviewer’s Name: ______________________________________________
A. Name of the Farmer and Farm Location
A1. Farmer’s Name____________________________ A2. Father’s Name
_____________________
A3. Village ______________________________ A4. Mandal
____________________________
A5. District _________________ A6. Cell
Phone:
B. Information about the Household
B1. Total members in household: _________

AFI Baseline Report 80
B2. Household Composition, Education and Employment
Relationship
to Farmer (Code)
Gender
(M=1; F=2)
Age Education
(years)
Marital
Status
(Married=1;
Single=2;
Widow=3)
Provides
Labor
On-
Farm
(Y=1,
N=2)
Involved in
Off-Farm
Employment
(Y=1,
N=2)
Type of
activity
(Dairying=1;
Sheep/Goat
rearing=2;
Poultry=3;
Other=4
(specify):
Non-Farm Employment
Y=1;
N=2
Months
Per
Year
Type of
Occupation
(Service=1;
Business=2;
Other=3
(specify):
Head
Relationship with the Head (Code): Head=1, Spouse of Head=2, Son=3,Daughter=4,father,
Mother=6,Other=7 (specify):
M= Male; F= Female; Y= Yes; N= No.
B3. Please provide information of your household income by source
Income Source Rupees (Annual)
Farming (Crops)
Farming (Livestock)
Farming (Poultry)
Farming (Fisheries)
Business
Salary/Wages
Rental of land or property
Pension
Remittance
Assistance of relatives
Govt. Welfare Programs
Other (Specify)
B4. What type of family is in the household (please)? B4.1 Joint B4.2 Single
B5. What is the distance from the house to a paved road? (Kms.): ____________
B6. What is the distance from the house to the nearest agriculture inputs market? (Kms.): _____

AFI Baseline Report 81
B6.1. What is the distance from the house to the nearest agriculture output market? (Kms.): _____
C. Farm Size, Land Tenure, and Crop Production
C1. Please describe your household land ownership (in acres):
C1.1. Cultivable Land: _______ C1.2. Homestead Area: ________C1.3. Fallow Land
______
C1.4. Lease-Out Area _______C1.5. Fish Pond Area _____C1.6. Homestead Forest Area:
_____
C2. What was your total net cultivated area in 2018-19 (Acres)? ___________
C2.1. Irrigated Area: _______ C2.2 Source of Irrigation= (1= canal; 2= Tank; 3= Groundwater
(Dugwell, Shallow Tube Well, Deep Tubewell); 4= Lift Irrigation; 5= Other Sources (specify)
: )
C3. Among it, what area (Acres): C3.1 Owned (irrigated: _______; Un-irrigated: _______)
C3.2. Leased-in (irrigated: _______; Un-irrigated: _______)
C3.3. Shared Cropped (irrigated: _______; Un-irrigated: _______)
C3.4. Area under 1. Single crops: _______; 2. Double/Inter crops: _______
C4. Have you ever tested your soil for crop production (please)? Yes No
C4.1. If No, why? -------------------------------------------------------------------------------------
C4.2. If Yes, do you follow the fertilizer use recommendation based on your soil test (please)?
Yes No
C5. Do you use Poly House for crop production (please)? Yes No
C5.1 If Yes, what was the area cultivated under Poly House (Acres)? _________
C6. Please provide information on your crop production that was harvested in 2018-19
Crop*
Season
(Kharif= 1;
Rabi=2;
Summer=3)
Irrigation
(Y=1; N=2)
Cultivated Area
(Acres)
Total Production
(Qtls.)
*Please list all crops cultivated by the household in 2018-19

AFI Baseline Report 82
D. Methods of Land Preparation
D1. Please provide information on method of land preparation for crop production in 2018-
19.
Method
Area
(Acres)
No. of
Ploughings
Hired/Owned
(1=Hired;
2=Owned)
Total Rental Cost
Human, Animal
and Machines (in
Rs.)
K R S K R S K R S K R S
Manually
operations
(By hand: spade,
hand plough,
etc.)
Animal
Machine
K= Kharif; R= Rabi; S=Summer
E. Planting Method
E1. Please provide information on Planting Method you practiced for crop production in
2018-19
Crop
Season
(K=1;
R=2
S=3)
Area
Irrigation
(Y=1;
N=2)
In
Line Random
Direct
Seeding Transplanting
(please )

AFI Baseline Report 83
F. Use of Fertilizer, Seed, Irrigation, and Crop Protection Products
F1. Please provide information on use of Chemical Fertilizer for crop production in 2018-19
Crop S I
Fertilizer Products Purchased
Urea DAP SSP Potash Complex
(NPK)
Qty.
(Qtls.)
Cost
(Rs.)
Qty.
(Qtls.)
Cost
(Rs.)
Qty.
(Qtls.)
Cost
(Rs.)
Qty.
(Qtls.)
Cost
(Rs.)
Qty.
(Qtls.)
Cost
(Rs.)
Note: S= Season: Kharif=1; Rabi=2; Summer=3; I= Irrigated: Yes=1; N=2

AFI Baseline Report 84
F2. What is your source of fertilizer purchase (please)? F2.1 Marchant F2.2 Dealer
F2.3 Local Fertilizer Shops F2.4 Other (specify): ________________
F3. How do you purchase fertilizer (please)? F3.1 Cash F3.2 Credit F3.3 Other ______
F4. Do you use any micronutrient fertilizers in your crop production (please): Yes No
F4.1 If Yes. Please provide details (provide names and Quantities):
F5. What is your source of seed (please)? F5.1 Own saved seed F5.2 Purchased F5.3
Other___
F6. Please provide information on seed/seedling for crop production in 2018-19
Crop S I
Seed Variety Purchase of
Seedling Cost on
Seed/seedling
treatment
(Rs.)
HYV Hybrid Local
Total
Cost
(Rs.)
Variety
(Local=1;
Improved=2
; Hybrid=3)
Qty.
(Kg.)
Cost
(Rs.)
Qty.
(Kg)
Cost
(Rs.)
Qty.
(Kg.)
Cost
(Rs.)
Note: S= Season: Kharif=1; Rabi=2; Summer=3; I= Irrigated: Yes=1; N=2
F7. Do you follow integrated pest management (IPM) practices in crop management (please)?
Yes No
F7.1 If no, why? ----------------------------------------------------------------------------------------------

AFI Baseline Report 85
F8. Please provide information on the use of Organic/Natural Fertilizers for crop production in
2018-19
Crop S I
Organic Fertilizer Quantity in Qtls. and Cost in Rs.
Animal
Manure
Green
Manure
Vermi-
compost
Residue
Retention
(Straw)
Biochar Other
(Specify)
Qty Cost Qty Cost Qty Cost Qty Cost Qty Cost Name Qty Cost
Note: S= Season: Kharif=1; Rabi=2; Summer=3; I= Irrigated: Yes=1; N=2
F9.What is your source and method of irrigation (please)? F9.1 Canal F9.2 STW
F9.3 DTW F9.4 LLP (Lift Irrigation) F9.5 Indigenous (local streams, ponds etc.,)
F9.6 Micro-Irrigation (Drip, sprinkler irrigation)
F10. Please provide information on irrigation for crop production in 2018-19?
Crop
Seaso
n
(Code
)
Area
(Acres)
Sourc
e
(code)
No. of
Irrigat
ions
Method of
irrigation
(1=Flooding; 2=
Drip; 3= Sprinkler)
Total Cost of
Irrigation (Rs.)*
Note: Season (Code): Kharif=1; Rabi=2; Summer=3; Source code: 1= Canal; 2=Tank; 2=
Shallow Tube Well; 3= Deep Tube Well; 4= LLP (Lift Irrigation from local streams,
ponds etc.,)
* If the cost of irrigation paid in kind then please convert it to Rs.

AFI Baseline Report 86
G. Pests and Diseases Attack
G1. Did your crop affect by pests or diseases in 2018 (please)? Yes No
G2. If Yes, please provide the following information
Crop S I Name of Pests
(Insects)
Name of
Diseases
Level of Infestation (please )
Slight=1 Bad=2 Very
Bad=3
Note: S=Season: Kharif=1; Rabi=2; Summer=3; I= Irrigated: Yes=1; N=2
G3. Please provide information on the use of Chemical and Organic Pesticides for crop protection in 2018-19
Crop S I
Pesticide Products Purchased
Chemical Based (used Pesticides
Method/Practice) Organic Farming /Natural Farming/Practice
Crop 1
(……………….)
Crop 2
(…………….)
Crop 3
(…………….)
Crop 1
(…………….)
Crop2
(……….……..)
Crop3
(……………...)
Qty.
(Kg /Lts)
Cost
(Rs.)
Qty.
(Kg
/Lts)
Cost
(Rs.)
Qty.
(Kg
/Lts)
Cost
(Rs.)
Qty (Kg
/Lts)
Cost
(Rs.)
Qty.
(Kg /Lts)
Cost
(Rs.)
Qty.
(Kg
/Lts)
Cost
(Rs.)
Note: S=Season: Kharif=1; Rabi=2; Summer; I= Irrigated: Yes=1; N=2
Please provide the names in brackets while entering; Kg= Kilograms; L= Liters
H. Inter-Culture Operation
H1. What are the inter-culture operations you follow for your crop production (please)?
H1.1. Watering H1.2. Earthen up H1.3. Weeding H1.4. Mulching
H1.5. Pest and Disease Management H1.6. Fertilizer Top Dressing
J. Use of Agricultural Credit
J1. Have you received any credit or loan for agricultural production in 2018-19 (please)? Yes
No

AFI Baseline Report 87
J2. If Yes, please provide the following information.
Source of
Credit
Loan Amount
(in Rs.)
Loan Period
(Months)
Annual Interest
Rate (%)
Loan outstanding
(in Rs.)
K. Agriculture Advisory Support
K1. Do you receive any technical advisory support for crop production (please )? Yes No
K2. If Yes, please mention the source of advisory support: ______________________________
L. Animal Ownership
L1. Please provide the information on Animal Ownership in 2018-19
Type of
Animal Number
Present Value (in Rs.)
Type of Animal
(Young Stock) Number
Present Value (in Rs.)
Cows Lambs
Goats Ducks
Chickens Other (specify):
Bullocks Other (specify):
Buffaloes Other (specify):
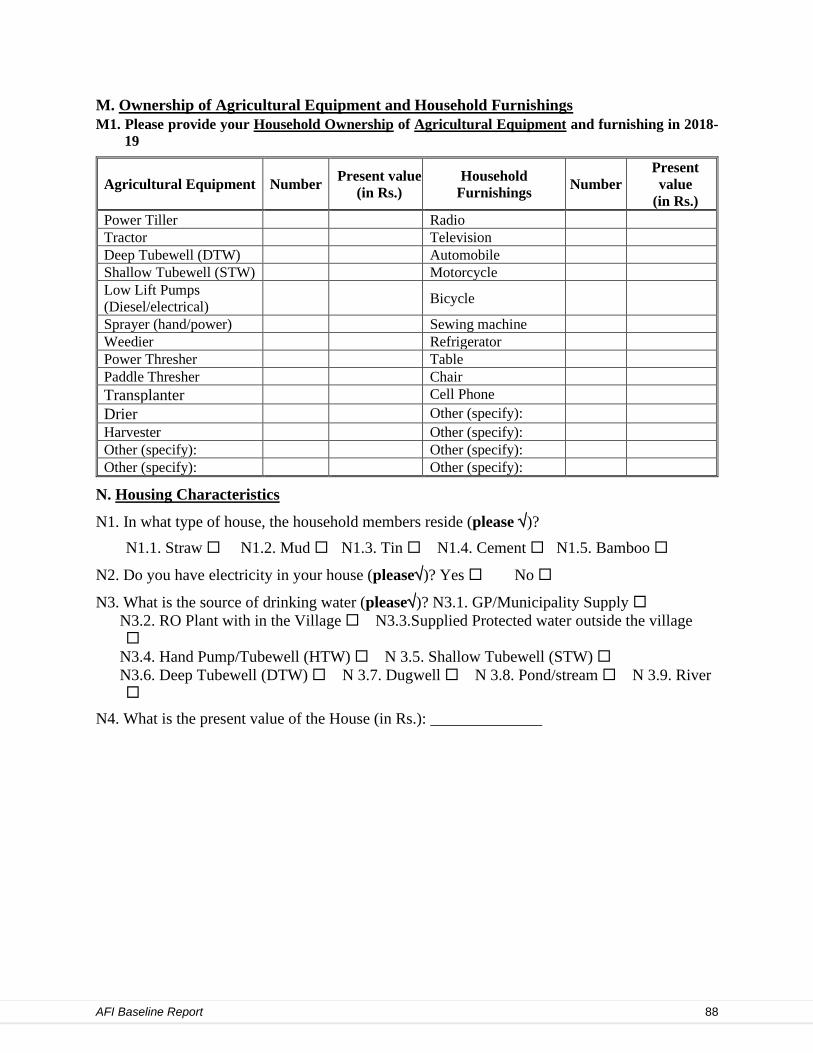
AFI Baseline Report 88
M. Ownership of Agricultural Equipment and Household Furnishings
M1. Please provide your Household Ownership of Agricultural Equipment and furnishing in 2018-
19
Agricultural Equipment Number Present value
(in Rs.)
Household
Furnishings Number
Present
value
(in Rs.)
Power Tiller Radio
Tractor Television
Deep Tubewell (DTW) Automobile
Shallow Tubewell (STW) Motorcycle
Low Lift Pumps
(Diesel/electrical) Bicycle
Sprayer (hand/power) Sewing machine
Weedier Refrigerator
Power Thresher Table
Paddle Thresher Chair
Transplanter Cell Phone
Drier Other (specify):
Harvester Other (specify):
Other (specify): Other (specify):
Other (specify): Other (specify):
N. Housing Characteristics
N1. In what type of house, the household members reside (please )?
N1.1. Straw N1.2. Mud N1.3. Tin N1.4. Cement N1.5. Bamboo
N2. Do you have electricity in your house (please)? Yes No
N3. What is the source of drinking water (please)? N3.1. GP/Municipality Supply
N3.2. RO Plant with in the Village N3.3.Supplied Protected water outside the village
N3.4. Hand Pump/Tubewell (HTW) N 3.5. Shallow Tubewell (STW)
N3.6. Deep Tubewell (DTW) N 3.7. Dugwell N 3.8. Pond/stream N 3.9. River
N4. What is the present value of the House (in Rs.): ______________
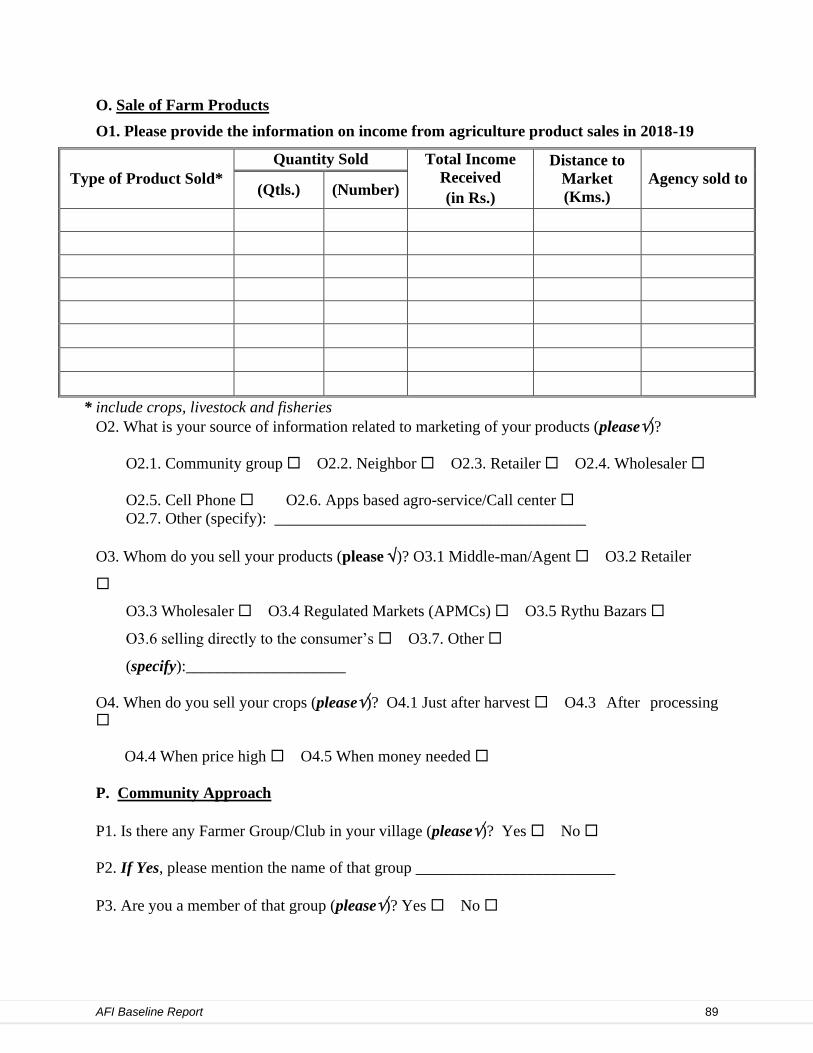
AFI Baseline Report 89
O. Sale of Farm Products
O1. Please provide the information on income from agriculture product sales in 2018-19
Type of Product Sold*
Quantity Sold Total Income
Received
(in Rs.)
Distance to
Market
(Kms.)
Agency sold to (Qtls.) (Number)
* include crops, livestock and fisheries
O2. What is your source of information related to marketing of your products (please)?
O2.1. Community group O2.2. Neighbor O2.3. Retailer O2.4. Wholesaler
O2.5. Cell Phone O2.6. Apps based agro-service/Call center
O2.7. Other (specify): _______________________________________
O3. Whom do you sell your products (please )? O3.1 Middle-man/Agent O3.2 Retailer
O3.3 Wholesaler O3.4 Regulated Markets (APMCs) O3.5 Rythu Bazars
O3.6 selling directly to the consumer’s O3.7. Other
(specify):____________________
O4. When do you sell your crops (please)? O4.1 Just after harvest O4.3 After processing
O4.4 When price high O4.5 When money needed
P. Community Approach
P1. Is there any Farmer Group/Club in your village (please)? Yes No
P2. If Yes, please mention the name of that group _________________________
P3. Are you a member of that group (please)? Yes No

AFI Baseline Report 90
Q. Nutrition and Hygiene
Q1. Do you have any knowledge on nutrition in food which you are taking in your family?
Yes No , If Yes, source of information: ________________
Q2. Please provide the following information on food items which your family consuming per
week.
Q2.1 Meat (kg.):_____; Q2.2. Fish (kg.):_____;Q2.3.Egg (Number):_____; Q2.4 Pulses
(kg.):______ Q2.5. Milk (Liter):________; Q2.5. Vegetable (kg.):_______; Q2.6. Fruits
(kg.):_______
Q3. What do you use for hand washing in your household? ________________
Q4. Is the toilet you use (Please): private (one household), shared (more than one household) or
public?
Q5. What kind of Toilet does your household use? Please explain: ________________

AFI Baseline Report 91
R. Use of Household and Hired Labor
R1. What was the wage of labor/day/person (in Rs.) in 2018-19? R1.1. Man ________ R1.2.
Woman _______
R2. Please provide the Labor Information for Crop that was harvested in 2018-19
Crop
Land
Preparatio
n
Seeding/
Transplanting
Fertilizer
Application Weeding Irrigation Pesticide Harvesting
Post-
Harvest
Tasks*
Men Women Men Women Men Women Men Women Men Women Men Women Men Women Men Women
Household/Family Labor Days
Hired Labor Days
*Post-harvest tasks include threshing, cleaning, drying, parboiling, husking, sorting, grading, packing,
transporting, and storage work etc.,
Note: Labor Day: 8 hours per day
Time of Interview End: _________ Data checking and verification by:
______________________________ Date: _____/_____/____
(Name) dd mm yy