Embed Size (px)
Citation preview

1
Growth hormone (GH)/STAT5 signaling during the growth period in 1
liver of mice overexpressing GH 2
3
Martinez Carolina S1, Piazza Verónica G
1, Díaz María E
1, Boparai Ravneet 4
K2, Arum Oge
2, Ramírez María C
3, González Lorena
1, Becú-Villalobos 5
Damasia3, Bartke Andrzej
2, Turyn Daniel
1, Miquet Johanna G
1, Sotelo Ana 6
I1* 7
8
1Instituto de Química y Fisicoquímica Biológicas (UBA-CONICET), Universidad de 9
Buenos Aires, Facultad de Farmacia y Bioquímica, Junín 956, 1113, Buenos Aires, 10
Argentina. 2Department of Geriatrics (A.B.), School of Medicine, Southern Illinois 11
University, Springfield, Illinois.3Instituto de Biología y Medicina Experimental 12
(CONICET), Vuelta de Obligado 2490, Buenos Aires, Argentina 13
14
Running title: GH-signaling in growing GH-overexpressing mice 15
Key words: GH signaling; STAT5; GH-overexpressing mice; growth; liver 16
17
*: Corresponding author (A.I. Sotelo): Tel. +5411 4964-8290/8291; fax: + 5411 4962-18
5457. 19
E-mail address: [email protected]. 20
21
Support for these studies was provided by UBA, CONICET, and ANPCYT (Argentina) 22
to DT and AIS and by NIH grant to AB. 23
Page 1 of 39 Accepted Preprint first posted on 17 February 2015 as Manuscript JME-14-0262
Copyright © 2015 by the Society for Endocrinology.

2
There is no conflict of interest that could be perceived as prejudicing the 1
impartiality of the research reported. 2
3
ABSTRACT 4
Growth hormone (GH)/STAT5 signaling is desensitized in liver of adult 5
transgenic mice overexpressing GH; however, these animals present greater body size. 6
To assess if the STAT5 pathway is active during the growth period in liver of these 7
animals, and how signaling modulators participate in this process, growing transgenic 8
mice and normal siblings were evaluated. STAT5 does not respond to an acute GH-9
stimulus but presents higher basal phosphorylation in liver of growing GH-10
overexpressing mice. GH receptor and positive modulators GR and HNF1 display 11
greater abundance in transgenic animals, supporting STAT5 activity. Negative 12
modulators CIS and PTP1B are increased in GH-overexpressing mice. Suppressors 13
SOCS2 and SOCS3 exhibit higher mRNA levels in transgenic mice but lower protein 14
content, suggesting they are being actively degraded. Therefore, STAT5 signaling is 15
increased in liver of GH-transgenic mice during the growth period, with a balance 16
between positive and negative effectors resulting in an accelerated but controlled 17
growth. 18
19
20
21
22
Page 2 of 39

3
1
1. INTRODUCTION 2
Growth hormone (GH) is involved in the promotion of skeletal growth and in a 3
variety of metabolic functions; its actions are accomplished both directly and indirectly 4
by the induction of insulin-like growth factor 1 (IGF1). Liver is a primary target organ for 5
GH and the major site of production of circulating IGF1, the principal mediator of the 6
somatotropic function. GH binding to a growth hormone receptor (GHR) dimer leads to 7
cross-activation of receptor-associated tyrosine-kinase JAK2, which phosphorylates GHR 8
on multiple intracellular tyrosine residues (Brooks and Waters 2010; Sedek, et al. 2014). 9
These residues become anchoring sites for several signaling mediators, among which 10
signal transducer and activator of transcription 5b (STAT5b) plays a major role in GH 11
action. GH-dependent STAT5 activation is essential for postnatal body growth, in line 12
with its participation in GH-induced IGF1 gene transcription in the liver (Barclay, et al. 13
2010; Rotwein 2012; Woelfle, et al. 2003). 14
Down-regulation or termination of the signal is attained by blockade or remotion of 15
phosphotyrosines at the GHR-activated complex (Lanning and Carter-Su 2006). Protein 16
tyrosine phosphatases (PTPs), like PTP1B, PTPH1 and the cytosolic SH2 containing 17
protein-tyrosine phosphatases (SHP) 1 and 2, interact with GHR, JAK2 and nuclear 18
tyrosine-phosphorylated STAT5b in a GH-dependent manner (Flores-Morales, et al. 19
2006; Lanning and Carter-Su 2006; Pilecka, et al. 2007). In addition, GH induces the 20
expression of suppressors of cytokine signaling (SOCS)/cytokine-induced suppressor 21
(CIS) proteins, CIS, SOCS1, SOC2 and SOCS3 via the STAT5 pathway, albeit with 22
different kinetics (Adams, et al. 1998; Tollet-Egnell, et al. 1999). SOCS1 and 3 inhibit 23
JAK2 kinase activity, while CIS and SOCS2 bind to phosphotyrosine residues on the 24
carboxy-terminus of GHR, thus interfering with recruitment of signaling mediators. 25
Moreover, these suppressors drive signaling complexes to proteasome degradation (Kile, 26
Page 3 of 39

4
et al. 2002; Linossi and Nicholson 2012). In the liver, SOCS2 expression is also induced 1
by the fasting-induced hormone, fibroblast growth factor 21 (FGF21), resulting in the 2
inhibition of STAT5 (Inagaki, et al. 2008). The influence of FGF21 on body growth is 3
evident in transgenic mice overexpressing this factor, which exhibit reduced growth, 4
whereas targeted-disruption of FGF21 blunts food-restriction impairment of growth 5
(Inagaki et al. 2008; Kubicky, et al. 2012). Another protein involved in the regulation of 6
STAT5 activity is BCL6, a strong transcriptional repressor that binds to DNA motifs 7
distinct but overlapping with those of STAT5, thus preventing its action. In liver, BCL6 8
binds preferentially to female-specific GH-regulated genes, precluding their transcription 9
(Zhang, et al. 2012). 10
Several transcription factors modulate STAT5 binding to DNA, including the 11
glucocorticoid receptor (GR) and the hepatocyte nuclear factor 1 α (HNF1α). Liver-12
specific inactivation of these positive modulators is associated with reduced somatic 13
growth in mice (Engblom, et al. 2007; Lin, et al. 2008; Tronche, et al. 2004). GR is a 14
STAT5 coactivator in the liver (Engblom et al. 2007; Tronche et al. 2004), whereas 15
HNF1α regulates GR expression to control postnatal body growth, indirectly 16
modulating STAT5 (Lin et al. 2008). 17
Rodents present two phases of rapid growth. The first is independent of GH and 18
occurs immediately after birth. The second is GH-dependent and begins soon after the 19
second week of life (Liu and LeRoith 1999; Lupu, et al. 2001; Tang, et al. 2005), 20
denoting the transition of the autocrine/paracrine control of growth to the central 21
regulation (Hyatt, et al. 2004). In accordance, transgenic mice overexpressing GH exhibit 22
accelerated growth from the third week of age, in spite of having high circulating GH 23
levels since birth (Mathews, et al. 1988; McGrane, et al. 1990). As a result, they achieve 24
greater adult body size than control mice. At adulthood, these animals present GH-25
Page 4 of 39
5
induced STAT5-signaling desensitization in the liver, as it does not become 1
phosphorylated upon an acute GH-stimulus. Moreover, basal levels of hepatic STAT5 2
phosphorylation in adult transgenic mice are comparable to those of normal animals 3
(Gonzalez, et al. 2002; Miquet, et al. 2004; Sotelo, et al. 2008). It is therefore the aim of 4
the present work to study if this pathway is activated differentially at earlier ages, i.e., 5
during the GH-dependent phase of growth. For this purpose, three ages were selected, 6
one before and one after the growth burst (2 and 4-week-old animals, respectively) and 7
the young adult (9-week-old control). The current work presents an in vivo study of 8
STAT5-mediated GH-signaling in liver of growing GH-overexpressing mice, since this 9
pathway is directly related to IGF1 induction and longitudinal body growth. Results will 10
contribute to understanding how the organism adapts to an excess of a hormone. 11
12
13
2. MATERIALS AND METHODS 14
2.1. Animals 15
Transgenic PEPCK-bGH mice containing the bGH gene fused to control 16
sequences of the rat phosphoenolpyruvate carboxykinase (PEPCK) gene were derived 17
from animals kindly provided by Dr. Thomas E. Wagner and Jeung S. Yun (Ohio 18
University, Athens, OH). Hemizygous transgenic mice were produced by mating 19
transgenic males with normal C57BL/6 X C3H F1 hybrid females purchased from the 20
Jackson Laboratory (Bar Harbor, ME). Normal siblings of transgenic mice were used as 21
controls. The mice were housed three to five per cage in a room with controlled light 22
(12 h light per day) and temperature (22 ± 2 C). The animals had free access to food 23
(Rodent Laboratory Chow 5001; not autoclaved; 23.4% protein, 4.5% fat, 5.8% crude 24
fiber; LabDiet, PMI Feeds, Inc., St. Louis, MO, USA) and tap water. 25
Page 5 of 39

6
Three cohorts of animals were used. The first one was used to determine body 1
growth at different age points. The second was used for GH-stimulation studies, while 2
the third was used to determine content of GH-signaling mediators as well as tibial 3
length. In these last two cohorts, animals were 14, 28 and 63 days of age (referred to as 4
2, 4 and 9 weeks old). For GH-stimulation studies, female mice received 5 µg oGH per 5
gram of body weight (ovine GH, obtained through the National Hormone and Pituitary 6
Program, NIDDK, NIH, USA) or saline solution by intraperitoneal administration 7.5 7
minutes before necropsy. Animals were killed by cervical dislocation under isofluorane 8
anesthesia, and livers were removed and stored at -80º C until use. 9
The appropriateness of the experimental procedure, the required number of 10
animals used, and the method of acquisition were in compliance with federal and local 11
laws and institutional regulations. Experiments were approved by SIU Laboratory 12
Animal Care Committee. 13
14
2.2. Liver solubilization and immunoblotting 15
Liver solubilization, CIS immunoprecipitation and preparation of samples for 16
immunoblotting (IB) have been previously described (Martinez, et al. 2013). For IB, 17
each lane was loaded with 40 µg of protein from whole tissue solubilizates. After 18
blotting and blocking of PVDF membranes, they were incubated overnight at 4°C with 19
antibodies anti-BCL6 1:1.000 (αBCL6; C-19, No. 368), anti-CIS 1:200 (αCIS; N-20
19,No. 1529), anti-FGF21 1:1.000 (αFGF21; V-16, No. 16842), anti-GR 1:300 (αGR; 21
M-20, No. 1004), anti-HNF1 1:300 (αHNF1; H-205, No. 8986), anti-MUP 1:2.000 22
(αMUP, FL-180, No. 66976), anti-SOCS2 1:600 (αSOCS2; H-74,No. 9022), anti-23
SOCS3 1:300 (αSOCS3; H-103, No. 9023), anti-STAT5 1:10.000 (αSTAT5; C-17, No. 24
835), purchased from Santa Cruz Biotechnology Laboratories (Santa Cruz, CA, USA); 25
Page 6 of 39

7
anti-SHP1 1:1000 (αPTP1C/SHP1, No. 610126), anti-SHP2 1:1000 (αPTP1D/SHP2, 1
No. 610622), obtained from BD Transduction Laboratories (Franklin Lakes, NJ, USA); 2
anti-phospho-STAT5a/b (Y694/Y699) 1:1.000 (αpSTAT5a/b, No.05-495), anti-PTP1B 3
1:2.500 (αPTP1B, No. 07-088), purchased from Millipore Corporation (Billerica, MA, 4
USA); or antibody anti-GHR anti serum (αGHR) 1:1000, generously provided by Dr. 5
S.J. Frank (Zhang, et al. 2001). Immunoreactive proteins were revealed by enhanced 6
chemiluminescence (ECL-Plus, Amersham, GE Healthcare LifeSciences) using 7
hyperfilm ECL (GE Healthcare LifeSciences), and band intensities were quantified 8
using Gel-Pro Analyzer software (Media Cybernetics, Silver Spring, MD, USA). 9
Antibody dilutions were selected based on previous reports, or according to 10
recommendations of the providers; in each case, the bands to be quantified fell within 11
the linear range of the method. 12
Immunoblotting experiments were designed to compare three variables in 13
parallel: age, genotype and stimuli or age, genotype and sex. Each experimental set 14
contained different individuals; thus, n, the number of individuals assayed per group, 15
also represents the number of experiments. Average of values obtained for 9-week-old 16
male mice was used as reference (100% value). Results are presented as mean ± 17
standard error (SEM) of the number of samples indicated. 18
19
2.3. Protein loading control 20
Protein loading control could not be performed by immunoblotting detection of 21
standard proteins in the liver for this GH-overexpressing mouse model. Actin exhibited 22
age and genotype-dependent variation in hepatic protein abundance, whereas tubulin 23
content did not show uniformity between genotypes (Supplementary Figure 1A) 24
(Martinez et al. 2013; Miquet, et al. 2013). Therefore, the following determinations 25
Page 7 of 39

8
were routinely performed. Prior to immunoblotting (IB), homogeneity of sample 1
preparation was assessed by SDS-PAGE followed by Coomassie blue staining. During 2
IB, Ponceau staining was used to evaluate goodness of electrotransference (Torre, et al. 3
2011). After immunoblotting experiments, protein loading control was performed by 4
Coomassie blue staining (CBS) of the PVDF membranes (Welinder and Ekblad 2011). 5
6
2.4. Real-time reverse transcriptase PCR 7
Total hepatic RNA was extracted using the phenol chloroform method. cDNA 8
was obtained using iScript cDNA synthesis kit (Bio-Rad), and the relative expression of 9
the genes was analyzed by quantitative RT-PCR (qRT-PCR) as previously described 10
(Ramirez, et al. 2010). Table 1 shows the sequence of the primer sets used, obtained 11
from Invitrogen. 12
This method was also used for genotyping transgenic mice, since they cannot be 13
distinguished from their normal siblings by size at 2 weeks of age. The sequences used 14
to determine the expression of the transgene are described in Table 1. 15
16
2.5. Statistical analysis 17
Statistical analysis was performed using the GraphPad Prism statistical program 18
by GraphPad Software, Inc. (San Diego, CA, USA). Data were first analyzed by one-19
way ANOVA followed by Bonferroni to evaluate stimuli or sex differences. Since no 20
significant differences were found for protein or mRNA content between sexes for 21
every age and genotype analyzed, results were presented in separate bar charts for each 22
sex. Subsequently, data were analyzed by two-way ANOVA and Bonferroni post test to 23
assess differences by age and genotype. Data were considered statistically significant if 24
P < 0.05. 25
Page 8 of 39
9
1
3. RESULTS 2
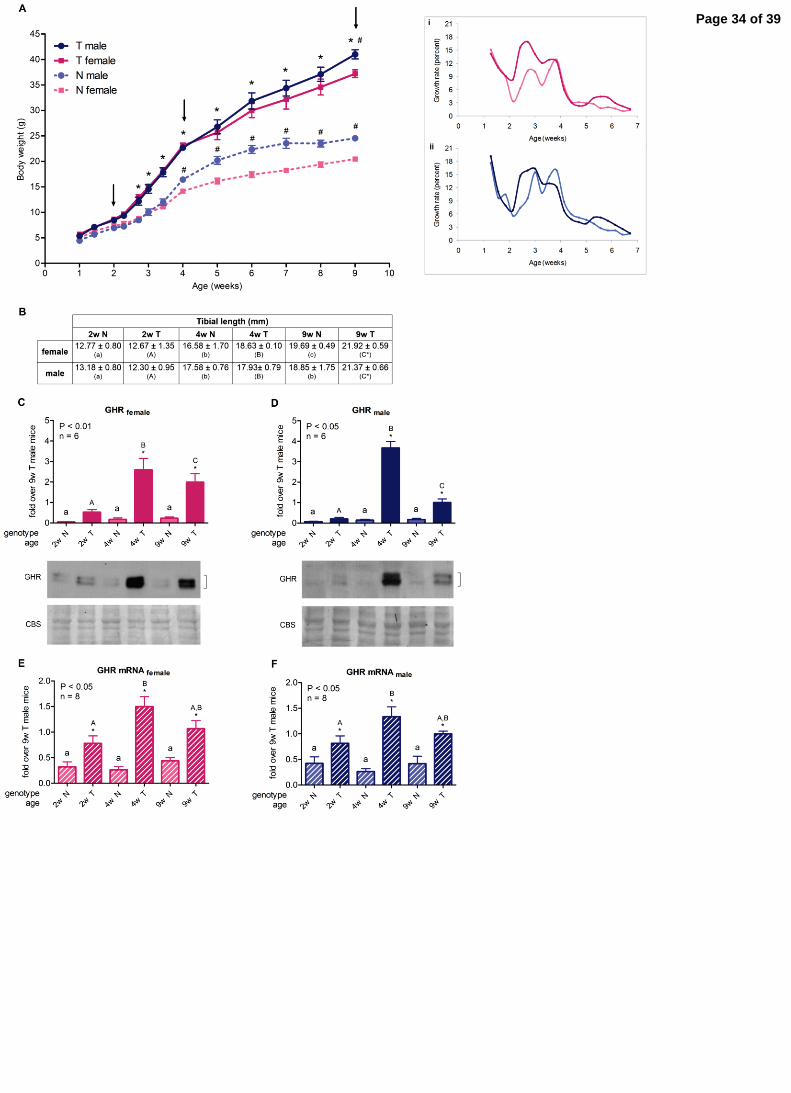
3.1. Body growth 3
Body weight was determined and the expected two phases of rapid growth were 4
observed, separated by a small pause between days 14 and 16. Male mice exhibited 5
higher body weight than females. In normal mice, this difference was detected 6
beginning at the fourth week of age; while, in transgenic animals, the difference 7
between sexes was less pronounced. Transgenic mice weight was significantly different 8
from that of non-transgenic siblings starting at day 19 (Fig. 1A). When growth rate was 9
assessed, more noticeable differences were observed between 2 and 3 weeks of age 10
(Fig. 1A inserts). 11
In order to evaluate GH signaling in liver at different growth periods, 12
representative ages were chosen: two weeks (2w), when animals of both genotypes still 13
exhibit the same body weight; four weeks (4w), when transgenic mice display greater 14
body size than normal siblings; and nine weeks (9w), young adults, which were 15
considered as reference. The selected ages are shown with arrows in Fig. 1A. For the 16
selected ages, tibial length was determined. The extension of the tibias increased with 17
age both for normal and transgenic mice, but the increase was larger for GH-18
overexpressing animals. When tibial length was assessed by genotype, greater values 19
were obtained for 9-week-old transgenic mice compared to controls (Fig. 1B). 20
21
3.2. GHR gene expression and protein abundance 22
GH binding to its receptor is the first step in GH signaling events. It is already 23
established that GH induces GHR expression in liver and, accordingly, it is augmented in 24
GH-transgenic adult animals (Gonzalez, et al. 2007; Miquet et al. 2004). GHR levels 25
Page 9 of 39

10
have also been reported to increase with age (Maes, et al. 1983; Martinez et al. 2013; 1
Mathews, et al. 1989). Moreover, it has been proposed that the magnitude of GH 2
responsiveness correlates with GHR expression (Jiang, et al. 2007). Therefore, it was of 3
interest to determine its content in growing GH-overexpressing mice. 4
Transgenic animals presented significantly higher GHR protein abundance than 5
normal siblings since the fourth week of age (Fig. 1C-D). For GH-overexpressing mice, 6
values did not exhibit a gradual increase with age, but presented a maximum at 4 weeks 7
in both sexes (Fig. 1C-D). To detect if there was any age difference in normal animals, 8
samples had to be assessed separately, since high GHR content in transgenic mice 9
concealed results. Non-transgenic littermates exhibited an age-dependent profile similar 10
to that in GH-overexpressing animals, although the rise at 4 weeks was not as pronounced 11
(Supplementary Figures 1A-B). Ghr mRNA expression was higher for transgenic animals 12
at every age studied, indicating the high protein content these mice exhibit correlates with 13
elevated receptor gene expression in these animals (Fig. 1E-F). 14
15
3.3. STAT5 activation 16
3.3.1 STAT5 phosphorylation upon an exogenous stimulus 17
To study GH sensitivity during the growth period, animals received a GH 18
stimulus or saline for 7.5 minutes, after which livers were collected and solubilized. 19
Tyrosine-phosphorylation of STAT5 proteins was determined by immunoblotting with a 20
specific antibody against the activating residue in STAT5 a and b (pSTAT5). Assays 21
were restricted to female mice to assess age and genotype simultaneously. Normal mice 22
responded at every age studied, exhibiting maximal STAT5 phosphorylation levels at 2 23
weeks of age, and declining thereafter (Fig. 2A). On the other hand, transgenic mice did 24
not respond to the stimulus at any age. Since we have already assessed GH response to 25
Page 10 of 39

11
an exogenous stimulus in non-transgenic growing mice and found no sex difference at 1
any age (Martinez et al., 2013), and taking in account that GH secretion is not sexually 2
dimorphic in transgenic mice (presented in section 3.6), we would expect GH 3
desensitization at every age in GH-transgenic male mice as well. For this reason, and 4
due to the high number of animals required, we preferred not to carry out the 5
experiment in male mice. 6
7
3.3.2 Endogenous STAT5 activation 8
In normal mice, basal STAT5 phosphorylation levels displayed an increasing 9
trend with age. GH-transgenic mice exhibited a different age-dependent pattern, 10
presenting comparable pSTAT5 levels for 2- and 9-week-old animals and a two-fold 11
increase at 4 weeks. When genotype difference was analyzed, GH-overexpressing 12
growing mice achieved higher basal phosphorylation levels than control siblings (Fig. 13
2B-C). At 9-weeks of age, pSTAT5 did not exhibit difference by genotype for female 14
mice, while transgenic males presented lower levels than their controls. This can be 15
attributed to comparable pSTAT5 levels observed in transgenic animals for both sexes, 16
whereas normal male mice exhibited greater levels than females, in accordance with 17
recent observations (Miquet et al. 2013). 18
There is a slight discrepancy between basal STAT5 phosphorylation levels in Fig. 19
2A and 2B, this may be due to the masking of the non-stimulated signal in Fig. 2A, 20
since the intensity of the endogenous signal is much weaker than that of the stimulated 21
one. 22
23
3.3.3 STAT5 protein content and phosphorylation/protein content relation 24
Page 11 of 39

12
When STAT5a/b protein content was assayed, 2-week-old mice exhibited the 1
highest values, with greater levels in normal animals, whereas 4- and 9-week-old mice 2
presented similar abundance in both genotypes (Fig. 2E-F). 3
GH-induced STAT5 phosphorylation values were related to STAT5 protein 4
abundance. STAT5 protein content was determined for non-stimulated mice only (results 5
not shown), since phosphorylated STAT5 migrates differentially in electrophoresis, 6
yielding an unexpected increase in immunoblotting intensity that may distort the results 7
(Martinez et al. 2013; Thangavel and Shapiro 2007). For saline-treated mice and for GH-8
stimulated transgenic animals, transformed values closely resembled the original ones, 9
whereas for GH-stimulated normal mice, similar results were obtained at every age 10
studied, indicating that the pronounced GH-induced activation in 2-week-old mice is due 11
to higher protein content at that age (Fig. 2D). 12
13
3.3.4 IGF1: downstream endogenous STAT5 activation 14
To further address this pathway, the hepatic expression of IGF1, a STAT5-15
mediated GH-induced gene and the principal mediator of GH action on somatic growth, 16
was evaluated. Transgenic mice exhibited increased hepatic IGF1 gene expression at 17
every age studied compared to normal controls (Fig. 2E-F). Consistent with STAT5 18
basal phosphorylation levels, during the growth period there was an age-dependent 19
increase in IGF1 transcription levels in transgenic animals. However, 4- and 9-week-old 20
GH-overexpressing mice exhibited comparable transcript levels, despite the different 21
STAT5 phosphorylation levels they present. Furthermore, in adult mice, IGF1 transcript 22
expression does not seem to correlate with STAT5 phosphorylation status. 23
24
3.4. Phosphatase protein content 25
Page 12 of 39

13
GH signaling is limited by dephosphorylation of activated mediators by specific 1
phosphatases. Hepatic content of these enzymes was assayed, and no significant age, 2
sex, or genotype differences were found for SHP1 and SHP2 proteins (Fig. 3A-D). On 3
the other hand, transgenic mice presented higher PTP1B levels compared to normal 4
siblings at every age studied, with a maximum at 4 weeks for both sexes (Fig. 3E-F). 5
Since we had previously reported age differences in PTP1B levels in normal mice for 6
another strain, samples from non-transgenic animals were run separately to assess age 7
differences. Maximal PTP1B abundance was found at 2 weeks of age and declined 8
thereafter (Supplementary Figure 1C-D), in agreement with previous observations 9
(Martinez et al. 2013). 10
11
3.5. SOCS protein content and gene expression 12
CIS, SOCS2 and SOCS3 are suppressors of cytokine signaling induced by GH in 13
the liver; therefore, their hepatic content and gene expression were evaluated in growing 14
GH-overexpressing mice by immunoblotting and quantitative RT-PCR, respectively. 15
Transgenic mice had increased liver CIS expression at every age studied 16
compared to normal siblings, both for protein and mRNA content (Fig. 4A-D). For 17
protein abundance, highest CIS levels were observed in 4-week-old GH-overexpressing 18
animals. In normal mice, CIS content was almost undetectable when samples were run 19
next to those of transgenic animals; therefore, they were assessed separately. Non-20
transgenic 2-week-old animals exhibited higher CIS levels, while 4- and 9-week-old 21
animals had similar abundance (Supplementary Figure 1E-F) in accordance with 22
previous observations in another mouse strain (Martinez et al. 2013). When assessed by 23
age, Cis mRNA content was higher at 2 weeks and similar at 4 and 9 weeks both in 24
Page 13 of 39

14
normal and transgenic mice, closely resembling the protein profile in normal mice 1
(shown in Supp. 1E-F). Differences were less pronounced in transgenic female animals. 2
SOCS3 protein content was lower in transgenic mice than in normal animals at 3
every age studied. Normal mice presented an age-dependent pattern, with lower values 4
at 2 weeks, which gradually increased to achieve adult values. Transgenic mice, on the 5
contrary, presented almost undetectable levels of the suppressor at every age evaluated 6
(Fig. 5A-B). Hepatic SOCS2 protein content displayed a similar pattern; normal mice 7
exhibited a gradual increase with age, whereas transgenic animals exhibited uniform 8
values that were lower than those of 2-week-old normal animals (Fig. 5C-D). Since 9
SOCS3 and SOCS2 are induced by GH, like CIS, their protein content in transgenic 10
mice would have been expected to be higher or at least the same as in normal animals, 11
rather than lower. To elucidate this controversy, SOCS3 and SOCS2 gene expression 12
was assessed. Socs3 mRNA hepatic content was numerically higher in GH-13
overexpressing animals than in normal siblings at every age studied, genotype statistical 14
significance was achieved for 9-week-old animals. Moreover, Socs3 mRNA content 15
exhibited an age-dependent increment for both genotypes (Fig. 5E-F). Socs2 mRNA 16
expression was also higher in GH-overexpressing animals than in control siblings at 17
every age studied. However, whereas hepatic Socs2 mRNA content displayed a 18
declining tendency as a function of age for normal animals, GH-transgenic mice 19
presented a different scenario, with higher values at 2 weeks of age, compared to 4-20
week-old animals or the young adult (Fig. 5G-H). 21
22
3.6. STAT5 modulators abundance 23
Hepatic STAT5 activity is also inhibited by FGF21 and BCL6. FGF21 protein 24
content did not vary with age in normal mice of both sexes, while it was high in 2-25
Page 14 of 39

15
week-old transgenic animals and declined thereafter, attaining normal animal levels 1
(Fig. 6A-B). BCL6 displayed a trend to increasing levels during the growth period in 2
both normal and transgenic mice, with statistical significance for GH-overexpressing 3
males only. Moreover, transgenic animals exhibited numerically higher BCL6 levels 4
than their normal siblings at 4 and 9 weeks of age (Fig. 6C-D). 5
BCL6 has been reported to be suppressed by growth hormone (Chen, et al. 2009; 6
Meyer, et al. 2009). In GH-transgenic mice the hormone is produced in extrapituitary 7
tissues; thus, secretion in these animals is not centrally regulated, rendering a 8
continuous pattern of circulating GH. Therefore, the GH-secretory status of these 9
animals was assessed by determination of an indirect marker, the major urinary proteins 10
(MUPs). MUP expression and secretion are regulated by the intermittent secretion of 11
GH and can be used as pulsatility markers of the somatotropic axis. MUPs were 12
detected only in normal mice of 4 and 9 weeks of age, after the onset of puberty, with 13
higher levels in males than in females, as expected (Fig. 6E). These results are 14
consistent with the continuous GH secretory pattern of transgenic mice. 15
STAT5 activity is positively modulated in the liver by glucocorticoid receptor 16
(GR) and hepatic nuclear factor 1 (HNF1). Normal and transgenic mice displayed a 17
similar age-related GR pattern: low levels at 2 weeks, maximal values at 4 weeks and 18
slightly lower levels in adulthood (Fig. 6F-G). From the fourth week onward, GH-19
overexpressing mice exhibited higher content than non-transgenic siblings in female 20
mice. For HNF1, the same age profile was observed (Fig. 6H-I). Transgenic mice had 21
higher levels at every age, which achieved significant difference at 4 weeks. 22
23
24
4. DISCUSSION 25
Page 15 of 39

16
Previous reports from our laboratory revealed the inability of adult GH-1
overexpressing giant mice to respond to a GH stimulus, both in different tissues and in 2
different GH-transgenic lines. Moreover, basal STAT5 phosphorylation in those GH-3
overexpressing adults was not higher than in their non-transgenic littermates, although 4
these animals have greatly elevated circulating GH levels (Gonzalez et al. 2002; Miquet 5
et al. 2004; Sotelo et al. 2008). Current results show GH-induced STAT5 insensitivity at 6
every age studied in GH-transgenic mice. However, there is an age-dependent variation 7
for basal STAT5 activation, which is higher during the growth hormone-dependent phase 8
of growth, suggesting this pathway is involved in the accelerated growth these mice 9
exhibit. After this initial finding, the next goal was to elucidate the contribution of 10
different modulators of the GH-STAT5 signaling pathway in order to dissect the 11
mechanisms that might account for differences between normal and transgenic mice 12
involved in the regulation of this pathway during the growth period. 13
Growth hormone receptor levels are low during fetal and early postnatal periods, 14
probably contributing to the lack of GH influence on somatic growth in the perinatal 15
stage (Jiang et al. 2007). GH itself up-regulates GHR expression in the liver (Gonzalez et 16
al. 2007; Iida, et al. 2004; Maiter, et al. 1988), in fact, GHR has been shown to be 17
induced by GH through STAT5 signaling in cattle (Jiang et al. 2007). In growing GH-18
overexpressing mice, GHR expression is slightly higher than in normal littermates at 2 19
weeks of age, but it is markedly increased at the fourth week of age, when these animals 20
can be distinguished from their control siblings by their increased body size, coinciding 21
with maximal STAT5 endogenous phosphorylation. However, although adult transgenic 22
mice exhibit higher GHR abundance than controls, they do not have greater pSTAT5 23
levels, suggesting the existence of mechanisms that attenuate GH signaling in transgenic 24
adults. 25
Page 16 of 39

17
Negative regulation of GH-signaling may be achieved by different effectors. Fast-1
acting mechanisms include recruitment of protein tyrosine-phosphatases involved in the 2
recycling of STATs proteins (Kornfeld, et al. 2008); in particular, PTP1B, SHP1 and 3
SHP2 have been related to STAT5. SHP1 and SHP2 presented no significant age- or 4
genotype-related differences, whereas PTP1B content was elevated in transgenic mice at 5
all ages, suggesting this phosphatase may participate in GH-insensitivity by rapidly 6
dephosphorylating activated substrates. 7
Other negative modulators of the GH-STAT5 pathway are the transcriptional 8
feedback regulators, the suppressors of cytokine signaling, which are induced as early 9
response genes. CIS was overexpressed in GH-transgenic animals and presented an age-10
dependent profile, suggesting this suppressor contributes to the mitigation of GH action 11
at every age in GH-overexpression conditions. In fact, CIS has been regarded as the only 12
factor down-regulating STAT5-mediated GH-signaling under continuous exposure to the 13
hormone (Thangavel and Shapiro 2007). Like GHR, CIS reached higher levels at 4 weeks 14
of age coinciding with the higher basal STAT5 phosphorylation found in transgenic 15
animals. This is not unexpected, since CIS has also been shown to be induced through 16
STAT5 (Verdier, et al. 1998). Moreover, the parallel between the GH-induced age-17
variation for CIS and GHR is in line with CIS-mediated internalization of the receptor to 18
limit GH-induced signaling (Landsman and Waxman 2005). In contrast, the hepatic 19
protein content of the negative regulators SOCS3 and SOCS2 was lower in transgenic 20
mice compared to normal siblings at every age studied. This behavior, although 21
surprising since these suppressors are induced by GH, is in agreement with our previous 22
observations in GH-overexpressing adult animals (Gonzalez et al. 2002; Miquet et al. 23
2004; Sotelo et al. 2008). SOCS2 was shown to bind to SOCS1 and SOCS3 and to target 24
them for proteosomal degradation, therefore putting an end to the SOCS termination 25
Page 17 of 39

18
signal and allowing the resensitization of the JAK2/STAT5 pathway (Croker, et al. 2008; 1
Flores-Morales et al. 2006; Piessevaux, et al. 2006; Tannahill, et al. 2005). When Socs3 2
and Socs2 mRNA levels were analyzed, higher expression was found in transgenic 3
animals for both genes, indicating these suppressors are being effectively induced by the 4
elevated GH levels. Therefore, even when Socs3 and Socs2 gene transcription is 5
increased in transgenic mice, the protein content of these suppressors is decreased, 6
suggesting they are being actively degraded, probably as a consequence of their own 7
negative regulation. Moreover, SOCS2 has been shown to be a key regulator of GHR 8
sensitivity, as it is part of an ubiquitin ligase complex that regulates growth hormone 9
receptor levels (Vesterlund, et al. 2011). 10
Additionally, STAT5 activity is inhibited in the liver by FGF21 and BCL6. FGF21 11
is a hepatic hormone involved in energy homeostasis, it is induced by fasting and may 12
participate in liver GH-activated STAT5-signaling down-regulation caused by food 13
deprivation (Inagaki et al. 2008; Kliewer and Mangelsdorf 2010; Kubicky et al. 2012). 14
Moreover, FGF21 expression has also been reported to be induced by GH through 15
STAT5 in that tissue, indicative of the existence of another negative feedback loop to 16
restrain GH-STAT5 signaling (Yu, et al. 2012). Our results in transgenic mice showed 17
higher levels at 2 weeks of age, which do not coincide with the maximal basal STAT5 18
phosphorylation found at 4 weeks. However, FGF21 was proposed to inhibit STAT5 19
activation by promotion of SOCS2 expression (Inagaki et al. 2008), and the elevated 20
levels of FGF21 in 2-week-old transgenic mice correlate with high values of Socs2 21
mRNA found at that age. In accordance, STAT5 phosphorylation is low in 2-week-old 22
transgenic animals, despite the high STAT5 protein content these mice present. 23
BCL6 is a strong transcriptional repressor of STAT5 activity, and in turn, STAT5 is 24
a repressor of Bcl6 expression. Complete suppression of Bcl6 is achieved in female rat 25
Page 18 of 39
19
liver, related to the permanent low activation of STAT5 found in this sex, whereas male 1
interpulse STAT5 deactivation, may be permissive to BCL6 expression (Chen et al. 2009; 2
Meyer et al. 2009; Zhang et al. 2012). In mice, this dimorphism is not as pronounced 3
(Meyer et al. 2009). Transgenic animals exhibit continuous GH levels in both sexes; 4
however, BCL6 levels are higher than those of non-transgenic controls. Moreover, Bcl6 5
mRNA levels were reported to increase after puberty only in male rats (Meyer et al. 6
2009), in contrast to our observations of a moderate increase with age in both sexes and 7
genotypes. Altogether, these results suggest that BCL6 becomes involved in GH-8
signaling after sexual maturation in GH-overexpressing mice, in an attempt to reduce the 9
female-specific expression of genes promoted by STAT5 that would predominate in these 10
animals due to the continuous GH profile. 11
Glucocorticoid receptor (GR) acts in synergism with STAT5 in liver to induce the 12
expression of GH-responsive genes related to body growth (Engblom et al. 2007; 13
Tronche et al. 2004). GR protein content displayed an age-dependent pattern with a 14
maximum at 4 weeks for both genotypes, suggesting its active participation in the 15
growth phenomenon. However, this pattern was not observed in another mouse strain, 16
the Swiss-Webster (Martinez et al, unpublished observations). Hepatocyte nuclear 17
factor 1α (HNF1α) is another transcription factor required for postnatal growth, which 18
regulates GR transcription activity, indirectly mediating STAT5 action (Lee, et al. 1998; 19
Lin et al. 2008). In liver of growing mice, HNF1α had the same age-related profile as 20
GR, with increased levels in transgenic mice as well. HNF1α is not directly regulated by 21
GH; however, GH triggers a network of transcription factors that culminates in HNF1α 22
activation, which has been reported in several species (Eleswarapu and Jiang 2005; 23
Lahuna, et al. 2000; Rastegar, et al. 2000). 24
Page 19 of 39

20
The relevance of hepatic GHR/STAT5 signaling in body growth has been 1
questioned (Kaplan and Cohen 2007; Klover and Hennighausen 2007). Moreover, 2
recent evidence points to the involvement of this signaling pathway in lipid metabolism 3
in this organ (Barclay, et al. 2011; Fan, et al. 2009; Mueller, et al. 2011). However, 4
these effects do not need to be mutually exclusive, and there is strong support for the 5
implication of the GH/GHR/STAT5/IGF1 axis in liver in somatic growth. Studies with 6
hepatic deletion of STAT5, GR or HNF1 show the interrelation of these three factors in 7
the growth outcome (Engblom et al. 2007; Lin et al. 2008; Mueller, et al. 2012; Tronche 8
et al. 2004). Moreover, liver STAT5 deletion in GH-overexpressing mice abolished the 9
giant phenotype of the latter (Friedbichler, et al. 2012); JAK2 hepatic deletion is also 10
associated with reduced size (Shi, et al. 2012). Liver specific deletion of the GHR in 11
mice yielded animals with diminished adult body weight and length (List, et al. 2014). 12
Results presented here indicate that GH participates in the molecular mechanisms that 13
regulate the second phase of rapid growth before the manifestation of growth changes, 14
i.e., before the third week of life, suggesting the intracellular machinery is set in action 15
before growth. Our results are in agreement with the initial characterization of GH-16
transgenic models, in which hepatic IGF1 was shown to be up-regulated as early as the 17
second week of life (Mathews et al. 1988). These authors had also observed the 18
persistency of high IGF1 levels at adulthood in that GH-overexpression model (Mt-bGH 19
mice) and concluded animals were already maximally stimulated. More recently, IGF1 20
has been reported not to be a predictable marker of GH function in mice (Bielohuby, et 21
al. 2011), which may account for the lack of correlation we found between basal STAT5 22
phosphorylation levels and IGF1 induction in adult animals. 23
24
Page 20 of 39

21
In summary, even though the principal GH signaling pathway STAT5 is 1
desensitized in the liver of GH-overexpressing mice, it is basally active during the growth 2
period and may be involved in the augmented growth these mice exhibit. Accompanying 3
this higher basal STAT5 activation, there is a change in GH-signaling modulators directly 4
or indirectly regulated by the hormone through the same pathway. Thus, GHR and 5
coactivators GR and HNF1, as well as negative regulators such as CIS and PTP1B, are 6
up-regulated in GH-transgenic mice, especially during the GH-dependent phase of 7
growth. SOCS2 and SOCS3, on the contrary, present lower protein levels in GH-8
overexpressing mice than in non-transgenic littermates; however, their gene expression 9
was up-regulated in these animals, suggesting they are involved in active degradation to 10
modulate GH signal. Thus, STAT5 signaling is enhanced during the growth period in 11
GH-overexpressing mice liver, when transgenic mice exhibit accelerated growth, 12
revealing a counterbalance between up-regulation of positive and negative modulators 13
that later in life seem to restrain basal STAT5 activation and to bring it close to normal 14
levels. Moreover, the up-regulation of negative modulators of STAT5 activation may 15
account for the lack of sensitivity towards the GH-exogenous stimulus found for these 16
GH-overexpressing mice at every age studied. 17
18
19
20
Acknowledgements 21
We thank Dr. S.J. Frank for anti-GHR antibody. DT, AIS, JGM, LG and DVB are 22
Career Investigators of CONICET, the National Council for Scientific and Technological 23
Research; CSM, VGP, MED and MCR were supported by a fellowship from CONICET. 24
Support for these studies was provided by UBA (B811 and20020100100631), CONICET 25
(PIP 427), and ANPCYT (PICT 38247 and PICT 0398) (Argentina) to DT and AIS and 26
Page 21 of 39

22
by the National Institute of Aging (grant numbers AG019899, AG031736) to AB. We 1
thank Michal Masternak, Feiya Wang, Adam Spong, Reyhan Westbrook, Cristal Hill and 2
Yiming Fang for their laboratory assistance. 3
4
5
6
Page 22 of 39

23
1
REFERENCES 2
3
Adams TE, Hansen JA, Starr R, Nicola NA, Hilton DJ & Billestrup N 1998 Growth 4
hormone preferentially induces the rapid, transient expression of SOCS-3, a novel 5
inhibitor of cytokine receptor signaling. J Biol Chem 273 1285-1287. 6
Barclay JL, Kerr LM, Arthur L, Rowland JE, Nelson CN, Ishikawa M, d'Aniello EM, 7
White M, Noakes PG & Waters MJ 2010 In vivo targeting of the growth hormone 8
receptor (GHR) Box1 sequence demonstrates that the GHR does not signal exclusively 9
through JAK2. Mol Endocrinol 24 204-217. 10
Barclay JL, Nelson CN, Ishikawa M, Murray LA, Kerr LM, McPhee TR, Powell EE & 11
Waters MJ 2011 GH-dependent STAT5 signaling plays an important role in hepatic 12
lipid metabolism. Endocrinology 152 181-192. 13
Bielohuby M, Schaab M, Kummann M, Sawitzky M, Gebhardt R, Binder G, Frystyk J, 14
Bjerre M, Hoeflich A, Kratzsch J, et al. 2011 Serum IGF-I is not a reliable 15
pharmacodynamic marker of exogenous growth hormone activity in mice. 16
Endocrinology 152 4764-4776. 17
Brooks AJ & Waters MJ 2010 The growth hormone receptor: mechanism of activation 18
and clinical implications. Nat Rev Endocrinol 6 515-525. 19
Croker BA, Kiu H & Nicholson SE 2008 SOCS regulation of the JAK/STAT signalling 20
pathway. Semin Cell Dev Biol 19 414-422. 21
Chen Y, Lin G, Huo JS, Barney D, Wang Z, Livshiz T, States DJ, Qin ZS & Schwartz J 22
2009 Computational and functional analysis of growth hormone (GH)-regulated genes 23
identifies the transcriptional repressor B-cell lymphoma 6 (Bc16) as a participant in 24
GH-regulated transcription. Endocrinology 150 3645-3654. 25
Eleswarapu S & Jiang H 2005 Growth hormone regulates the expression of hepatocyte 26
nuclear factor-3 gamma and other liver-enriched transcription factors in the bovine 27
liver. J Endocrinol 184 95-105. 28
Engblom D, Kornfeld JW, Schwake L, Tronche F, Reimann A, Beug H, Hennighausen 29
L, Moriggl R & Schutz G 2007 Direct glucocorticoid receptor-Stat5 interaction in 30
hepatocytes controls body size and maturation-related gene expression. Genes Dev 21 31
1157-1162. 32
Fan Y, Menon RK, Cohen P, Hwang D, Clemens T, DiGirolamo DJ, Kopchick JJ, Le 33
Roith D, Trucco M & Sperling MA 2009 Liver-specific deletion of the growth hormone 34
receptor reveals essential role of growth hormone signaling in hepatic lipid metabolism. 35
J Biol Chem 284 19937-19944. 36
Flores-Morales A, Greenhalgh CJ, Norstedt G & Rico-Bautista E 2006 Negative 37
regulation of growth hormone receptor signaling. Mol Endocrinol 20 241-253. 38
Friedbichler K, Themanns M, Mueller KM, Schlederer M, Kornfeld JW, Terracciano 39
LM, Kozlov AV, Haindl S, Kenner L, Kolbe T, et al. 2012 Growth-hormone-induced 40
signal transducer and activator of transcription 5 signaling causes gigantism, 41
inflammation, and premature death but protects mice from aggressive liver cancer. 42
Hepatology 55 941-952. 43
Gonzalez L, Curto LM, Miquet JG, Bartke A, Turyn D & Sotelo AI 2007 Differential 44
regulation of membrane associated-growth hormone binding protein (MA-GHBP) and 45
growth hormone receptor (GHR) expression by growth hormone (GH) in mouse liver. 46
Growth Horm IGF Res 17 104-112. 47
Page 23 of 39

24
Gonzalez L, Miquet JG, Sotelo AI, Bartke A & Turyn D 2002 Cytokine-inducible SH2 1
protein up-regulation is associated with desensitization of GH signaling in GHRH-2
transgenic mice. Endocrinology 143 386-394. 3
Hyatt MA, Walker DA, Stephenson T & Symonds ME 2004 Ontogeny and nutritional 4
manipulation of the hepatic prolactin-growth hormone-insulin-like growth factor axis in 5
the ovine fetus and in neonate and juvenile sheep. Proc Nutr Soc 63 127-135. 6
Iida K, Del Rincon JP, Kim DS, Itoh E, Nass R, Coschigano KT, Kopchick JJ & 7
Thorner MO 2004 Tissue-specific regulation of growth hormone (GH) receptor and 8
insulin-like growth factor-I gene expression in the pituitary and liver of GH-deficient 9
(lit/lit) mice and transgenic mice that overexpress bovine GH (bGH) or a bGH 10
antagonist. Endocrinology 145 1564-1570. 11
Inagaki T, Lin VY, Goetz R, Mohammadi M, Mangelsdorf DJ & Kliewer SA 2008 12
Inhibition of growth hormone signaling by the fasting-induced hormone FGF21. Cell 13
Metab 8 77-83. 14
Jiang H, Wang Y, Wu M, Gu Z, Frank SJ & Torres-Diaz R 2007 Growth hormone 15
stimulates hepatic expression of bovine growth hormone receptor messenger ribonucleic 16
acid through signal transducer and activator of transcription 5 activation of a major 17
growth hormone receptor gene promoter. Endocrinology 148 3307-3315. 18
Kaplan SA & Cohen P 2007 The somatomedin hypothesis 2007: 50 years later. J Clin 19
Endocrinol Metab 92 4529-4535. 20
Kile BT, Schulman BA, Alexander WS, Nicola NA, Martin HM & Hilton DJ 2002 The 21
SOCS box: a tale of destruction and degradation. Trends Biochem Sci 27 235-241. 22
Kliewer SA & Mangelsdorf DJ 2010 Fibroblast growth factor 21: from pharmacology 23
to physiology. Am J Clin Nutr 91 254S-257S. 24
Klover P & Hennighausen L 2007 Postnatal body growth is dependent on the 25
transcription factors signal transducers and activators of transcription 5a/b in muscle: a 26
role for autocrine/paracrine insulin-like growth factor I. Endocrinology 148 1489-1497. 27
Kornfeld JW, Grebien F, Kerenyi MA, Friedbichler K, Kovacic B, Zankl B, Hoelbl A, 28
Nivarti H, Beug H, Sexl V, et al. 2008 The different functions of Stat5 and chromatin 29
alteration through Stat5 proteins. Front Biosci 13 6237-6254. 30
Kubicky RA, Wu S, Kharitonenkov A & De Luca F 2012 Role of fibroblast growth 31
factor 21 (FGF21) in undernutrition-related attenuation of growth in mice. 32
Endocrinology 153 2287-2295. 33
Lahuna O, Rastegar M, Maiter D, Thissen JP, Lemaigre FP & Rousseau GG 2000 34
Involvement of STAT5 (signal transducer and activator of transcription 5) and HNF-4 35
(hepatocyte nuclear factor 4) in the transcriptional control of the hnf6 gene by growth 36
hormone. Mol Endocrinol 14 285-294. 37
Landsman T & Waxman DJ 2005 Role of the cytokine-induced SH2 domain-containing 38
protein CIS in growth hormone receptor internalization. J Biol Chem 280 37471-37480. 39
Lanning NJ & Carter-Su C 2006 Recent advances in growth hormone signaling. Rev 40
Endocr Metab Disord 7 225-235. 41
Lee YH, Sauer B & Gonzalez FJ 1998 Laron dwarfism and non-insulin-dependent 42
diabetes mellitus in the Hnf-1alpha knockout mouse. Mol Cell Biol 18 3059-3068. 43
Lin WY, Hu YJ & Lee YH 2008 Hepatocyte nuclear factor-1alpha regulates 44
glucocorticoid receptor expression to control postnatal body growth. Am J Physiol 45
Gastrointest Liver Physiol 295 G542-551. 46
Linossi EM & Nicholson SE 2012 The SOCS box-adapting proteins for ubiquitination 47
and proteasomal degradation. IUBMB Life 64 316-323. 48
List EO, Berryman DE, Funk K, Jara A, Kelder B, Wang F, Stout MB, Zhi X, Sun L, 49
White TA, et al. 2014 Liver-specific GH receptor gene disrupted (LiGHRKO) mice 50
Page 24 of 39

25
have decreased endocrine IGF-1, increased local IGF-1 as well as altered body size, 1
body composition and adipokine profiles. Endocrinology en20132086. 2
Liu JL & LeRoith D 1999 Insulin-like growth factor I is essential for postnatal growth 3
in response to growth hormone. Endocrinology 140 5178-5184. 4
Lupu F, Terwilliger JD, Lee K, Segre GV & Efstratiadis A 2001 Roles of growth 5
hormone and insulin-like growth factor 1 in mouse postnatal growth. Dev Biol 229 141-6
162. 7
Maes M, De Hertogh R, Watrin-Granger P & Ketelslegers JM 1983 Ontogeny of liver 8
somatotropic and lactogenic binding sites in male and female rats. Endocrinology 113 9
1325-1332. 10
Maiter D, Underwood LE, Maes M, Davenport ML & Ketelslegers JM 1988 Different 11
effects of intermittent and continuous growth hormone (GH) administration on serum 12
somatomedin-C/insulin-like growth factor I and liver GH receptors in 13
hypophysectomized rats. Endocrinology 123 1053-1059. 14
Martinez CS, Piazza VG, Ratner LD, Matos MN, Gonzalez L, Rulli SB, Miquet JG & 15
Sotelo AI 2013 Growth hormone STAT5-mediated signaling and its modulation in mice 16
liver during the growth period. Growth Horm IGF Res 23 19-28. 17
Mathews LS, Enberg B & Norstedt G 1989 Regulation of rat growth hormone receptor 18
gene expression. J Biol Chem 264 9905-9910. 19
Mathews LS, Hammer RE, Brinster RL & Palmiter RD 1988 Expression of insulin-like 20
growth factor I in transgenic mice with elevated levels of growth hormone is correlated 21
with growth. Endocrinology 123 433-437. 22
McGrane MM, Yun JS, Moorman AF, Lamers WH, Hendrick GK, Arafah BM, Park 23
EA, Wagner TE & Hanson RW 1990 Metabolic effects of developmental, tissue-, and 24
cell-specific expression of a chimeric phosphoenolpyruvate carboxykinase 25
(GTP)/bovine growth hormone gene in transgenic mice. J Biol Chem 265 22371-22379. 26
Meyer RD, Laz EV, Su T & Waxman DJ 2009 Male-specific hepatic Bcl6: growth 27
hormone-induced block of transcription elongation in females and binding to target 28
genes inversely coordinated with STAT5. Mol Endocrinol 23 1914-1926. 29
Miquet JG, Freund T, Martinez CS, Gonzalez L, Diaz ME, Micucci GP, Zotta E, 30
Boparai RK, Bartke A, Turyn D, et al. 2013 Hepatocellular alterations and 31
dysregulation of oncogenic pathways in the liver of transgenic mice overexpressing 32
growth hormone. Cell Cycle 12. 33
Miquet JG, Sotelo AI, Bartke A & Turyn D 2004 Suppression of growth hormone (GH) 34
Janus tyrosine kinase 2/signal transducer and activator of transcription 5 signaling 35
pathway in transgenic mice overexpressing bovine GH. Endocrinology 145 2824-2832. 36
Mueller KM, Kornfeld JW, Friedbichler K, Blaas L, Egger G, Esterbauer H, Hasselblatt 37
P, Schlederer M, Haindl S, Wagner KU, et al. 2011 Impairment of hepatic growth 38
hormone and glucocorticoid receptor signaling causes steatosis and hepatocellular 39
carcinoma in mice. Hepatology 54 1398-1409. 40
Mueller KM, Themanns M, Friedbichler K, Kornfeld JW, Esterbauer H, Tuckermann JP 41
& Moriggl R 2012 Hepatic growth hormone and glucocorticoid receptor signaling in 42
body growth, steatosis and metabolic liver cancer development. Mol Cell Endocrinol 43
361 1-11. 44
Piessevaux J, Lavens D, Montoye T, Wauman J, Catteeuw D, Vandekerckhove J, 45
Belsham D, Peelman F & Tavernier J 2006 Functional cross-modulation between SOCS 46
proteins can stimulate cytokine signaling. J Biol Chem 281 32953-32966. 47
Pilecka I, Patrignani C, Pescini R, Curchod ML, Perrin D, Xue Y, Yasenchak J, Clark 48
A, Magnone MC, Zaratin P, et al. 2007 Protein-tyrosine phosphatase H1 controls 49
Page 25 of 39

26
growth hormone receptor signaling and systemic growth. J Biol Chem 282 35405-1
35415. 2
Ramirez MC, Luque GM, Ornstein AM & Becu-Villalobos D 2010 Differential 3
neonatal testosterone imprinting of GH-dependent liver proteins and genes in female 4
mice. J Endocrinol 207 301-308. 5
Rastegar M, Lemaigre FP & Rousseau GG 2000 Control of gene expression by growth 6
hormone in liver: key role of a network of transcription factors. Mol Cell Endocrinol 7
164 1-4. 8
Rotwein P 2012 Mapping the growth hormone--Stat5b--IGF-I transcriptional circuit. 9
Trends Endocrinol Metab 23 186-193. 10
Sedek M, van der Velden LM & Strous GJ 2014 Multimeric growth hormone receptor 11
complexes serve as signaling platforms. J Biol Chem 289 65-73. 12
Shi SY, Martin RG, Duncan RE, Choi D, Lu SY, Schroer SA, Cai EP, Luk CT, 13
Hopperton KE, Domenichiello AF, et al. 2012 Hepatocyte-specific deletion of Janus 14
kinase 2 (JAK2) protects against diet-induced steatohepatitis and glucose intolerance. J 15
Biol Chem 287 10277-10288. 16
Sotelo AI, Miquet JG, Gonzalez L, Bartke A & Turyn D 2008 Vitamin D3 cannot revert 17
desensitization of growth hormone (GH)-induced STAT5-signaling in GH-18
overexpressing mice non-calcemic tissues. Growth Horm IGF Res 18 148-156. 19
Tang Z, Yu R, Lu Y, Parlow AF & Liu JL 2005 Age-dependent onset of liver-specific 20
IGF-I gene deficiency and its persistence in old age: implications for postnatal growth 21
and insulin resistance in LID mice. Am J Physiol Endocrinol Metab 289 E288-295. 22
Tannahill GM, Elliott J, Barry AC, Hibbert L, Cacalano NA & Johnston JA 2005 23
SOCS2 can enhance interleukin-2 (IL-2) and IL-3 signaling by accelerating SOCS3 24
degradation. Mol Cell Biol 25 9115-9126. 25
Thangavel C & Shapiro BH 2007 A molecular basis for the sexually dimorphic 26
response to growth hormone. Endocrinology 148 2894-2903. 27
Tollet-Egnell P, Flores-Morales A, Stavreus-Evers A, Sahlin L & Norstedt G 1999 28
Growth hormone regulation of SOCS-2, SOCS-3, and CIS messenger ribonucleic acid 29
expression in the rat. Endocrinology 140 3693-3704. 30
Torre C, Benhamouche S, Mitchell C, Godard C, Veber P, Letourneur F, Cagnard N, 31
Jacques S, Finzi L, Perret C, et al. 2011 The transforming growth factor-alpha and 32
cyclin D1 genes are direct targets of beta-catenin signaling in hepatocyte proliferation. J 33
Hepatol 55 86-95. 34
Tronche F, Opherk C, Moriggl R, Kellendonk C, Reimann A, Schwake L, Reichardt 35
HM, Stangl K, Gau D, Hoeflich A, et al. 2004 Glucocorticoid receptor function in 36
hepatocytes is essential to promote postnatal body growth. Genes Dev 18 492-497. 37
Verdier F, Rabionet R, Gouilleux F, Beisenherz-Huss C, Varlet P, Muller O, Mayeux P, 38
Lacombe C, Gisselbrecht S & Chretien S 1998 A sequence of the CIS gene promoter 39
interacts preferentially with two associated STAT5A dimers: a distinct biochemical 40
difference between STAT5A and STAT5B. Mol Cell Biol 18 5852-5860. 41
Vesterlund M, Zadjali F, Persson T, Nielsen ML, Kessler BM, Norstedt G & Flores-42
Morales A 2011 The SOCS2 ubiquitin ligase complex regulates growth hormone 43
receptor levels. PLoS One 6 e25358. 44
Welinder C & Ekblad L 2011 Coomassie staining as loading control in Western blot 45
analysis. J Proteome Res 10 1416-1419. 46
Woelfle J, Billiard J & Rotwein P 2003 Acute control of insulin-like growth factor-I 47
gene transcription by growth hormone through Stat5b. J Biol Chem 278 22696-22702. 48
Page 26 of 39

27
Yu J, Zhao L, Wang A, Eleswarapu S, Ge X, Chen D & Jiang H 2012 Growth hormone 1
stimulates transcription of the fibroblast growth factor 21 gene in the liver through the 2
signal transducer and activator of transcription 5. Endocrinology 153 750-758. 3
Zhang Y, Guan R, Jiang J, Kopchick JJ, Black RA, Baumann G & Frank SJ 2001 4
Growth hormone (GH)-induced dimerization inhibits phorbol ester-stimulated GH 5
receptor proteolysis. J Biol Chem 276 24565-24573. 6
Zhang Y, Laz EV & Waxman DJ 2012 Dynamic, sex-differential STAT5 and BCL6 7
binding to sex-biased, growth hormone-regulated genes in adult mouse liver. Mol Cell 8
Biol 32 880-896. 9
10
11
12
13
14
15
16
17
18
19
20
21
22
23
24
25
26
27
28
29
30
Page 27 of 39

28
LEGEND TO TABLE: 1
2
Table 1. Primer sequences used for gene expression assays. 3
4
LEGENDS TO FIGURES: 5
6
Fig. 1. Body growth and GHR hepatic expression in growing GH-transgenic mice and 7
normal littermates.A. Body weight of GH-overexpressing mice and normal littermates; 8
inserts: Body growth rate in female mice (i) and male mice (ii). B. Tibial length of GH-9
overexpressing mice and normal littermates. C. GHR hepatic protein content in female 10
mice; D. GHR hepatic protein content in male mice; E. GHR mRNA hepatic expression 11
in female mice; F. GHR mRNA hepatic expression in male mice. 12
Body weight and tibial length were assessed for transgenic (T) and normal (N) female 13
and male mice. Body growth rate was estimated as percent of body weight increment 14
every two days. Data are the mean ± SEM of 10 (A) or 7 (B) samples per group, each 15
one representing a different animal. Asterisks indicate significant difference between 16
GH-overexpressing animals and their corresponding non-transgenic age-control, 17
number signs indicate significant difference between females and males of the same 18
genotype. Arrows indicate selected working ages. Different letters denote significant 19
difference by age; small letters correspond to normal mice and capital letters to 20
transgenic animals. 21
To determine protein abundance, equal amounts of solubilized liver protein were 22
assessed by immunoblotting. Coomassie blue staining (CBS) of PVDF membrane is 23
shown.Bands were quantified by scanning densitometry. To determine gene expression, 24
mRNA was assessed by qRT-PCR from total RNA extracts. Values were expressed as 25
Page 28 of 39

29
the fold increase over 9-week-old transgenic male mice. Data are the mean ± SEM of 1
the indicated n number of samples per group, each one representing a different animal. 2
Different letters denote significant difference by age; small letters correspond to normal 3
mice and capital letters to transgenic animals. Asterisks indicate significant difference 4
between GH-overexpressing animals and their corresponding non-transgenic age 5
controls. Square brackets show the quantified bands. 6
7
Fig. 2. STAT5 signaling in liver of growing GH-overexpressing mice and normal 8
littermates. A. GH-induced STAT5-tyrosine phosphorylation in female mice; B. Basal 9
STAT5-tyrosine phosphorylation in female mice; C. Basal STAT5-tyrosine 10
phosphorylation in male mice; D. Tyrosine phosphorylation/protein content relation for 11
GH-induced STAT5 phosphorylation; E. STAT5 protein abundance in female mice; F. 12
STAT5 protein abundance in male mice; G. IGF1 mRNA hepatic expression in female 13
mice; H. IGF1 mRNA hepatic expression in male mice. 14
Equal amounts of solubilized tissue were analyzed by immunoblotting; Coomassie blue 15
staining (CBS) of PVDF membrane is shown. mRNA was assessed by qRT-PCR from 16
total RNA extracts. Results were expressed as the fold increase over the mean value 17
measured for GH-stimulated 9-week-old normal female mice (A,D) or as the fold 18
increase over 9-week-old transgenic male mice (B-H). Data are the mean ± SEM of the 19
indicated n number of samples per group, each one representing a different animal. 20
Different letters denote significant difference by age; small letters correspond to normal 21
mice and capital letters to transgenic animals. Asterisks indicate significant difference 22
between GH-overexpressing animals and their corresponding non-transgenic age 23
controls. 24
25
Page 29 of 39

30
Fig. 3. Phosphatase protein abundance in liver of growing GH-overexpressing mice and 1
normal littermates. A. SHP1 content in female mice; B. SHP1 content in male mice; C. 2
SHP2 content in female mice; D. SHP2 content in male mice; E. PTP1B content in 3
female mice; F. PTP1B content in male mice. 4
Immunoblotting quantification was expressed as the fold increase over 9-week-old 5
transgenic male mice. Data are the mean ± SEM of the indicated n number of samples 6
per group, each one representing a different animal. Different letters denote significant 7
difference by age: small letters correspond to normal mice and capital letters to 8
transgenic animals; asterisks indicate significant difference by genotype. ns stands for 9
non-significant. Arrows indicate the quantified bands. 10
11
Fig. 4. CIS expression in liver of growing GH-overexpressing mice and normal 12
littermates. A. CIS protein content in female mice; B. CIS protein content in male mice; 13
C. CIS mRNA expression in female mice; D. CIS mRNA expression in male mice. 14
To determine protein abundance, CIS required immunoprecipitation to enrich 15
preparation prior to immunoblotting assays; mRNA was assessed by qRT-PCR. Results 16
were expressed as the fold increase over 9-week-old transgenic male mice. Data are the 17
mean ± SEM of the indicated n number of samples per group, each one representing a 18
different animal. Different letters denote significant difference by age; small letters 19
correspond to normal mice and capital letters to transgenic animals. Asterisks indicate 20
significant difference by genotype. 21
22
Fig. 5. SOCS expression in liver of growing GH-overexpressing mice and normal 23
littermates. A. SOCS3 protein content in female mice; B. SOCS3 protein content in 24
male mice; C. SOCS2 protein content in female mice; D. SOCS2 protein content in 25
Page 30 of 39

31
male mice; E. SOCS3 mRNA expression in female mice; F. SOCS3 mRNA expression 1
in male mice; G. SOCS2 mRNA expression in female mice; H. SOCS2 mRNA 2
expression in male mice. 3
To determine protein abundance, equal amounts of solubilized liver protein were 4
analyzed by immunoblotting. Coomassie blue staining (CBS) of PVDF membrane is 5
shown.Bands obtained were quantified by scanning densitometry. mRNA was assessed 6
by qRT-PCR from total RNA extracts. Results were expressed as the fold increase over 7
9-week-old normal (A,B) or transgenic (C-H) female and male mice. Data are the mean 8
± SEM of the indicated n number of samples per group, each one representing a 9
different animal. Different letters denote significant difference by age; small letters 10
correspond to normal mice and capital letters to transgenic animals. Asterisks indicate 11
significant difference by genotype. Square brackets indicate the quantified bands. 12
13
Fig. 6. STAT5 modulators protein abundance in liver of growing GH-overexpressing 14
mice and normal littermates. A. FGF21 content in female mice; B. FGF21 content in 15
male mice; C. BCL6 content in female mice; D. BCL6 content in male mice. E. 16
Representative immunoblot for MUPs protein content. F. GR content in female mice; G. 17
GR content in male mice; H. HNF1 content in female mice; I. HNF1 content in male 18
mice. 19
Immunoblotting quantification was expressed as the fold increase over 9-week-old 20
transgenic male mice. Data are the mean ± SEM of the indicated n number of samples 21
per group, each one representing a different animal. Different letters denote significant 22
difference by age; small letters correspond to normal mice and capital letters to 23
transgenic animals. Asterisks indicate significant difference between GH-24
Page 31 of 39
32
overexpressing animals and their corresponding non-transgenic age controls. Arrows 1
indicate the quantified bands. 2
3
Supplementary Fig. 1. Loading controls for immunoblotting and GHR, CIS and PTP1B 4
abundance in liver of growing normal siblings.A. Loading controls for immunoblotting. 5
B. GHR protein content in normal female mice; C. GHR protein content in normal male 6
mice; D. CIS protein content in normal female mice; E. CIS protein content in normal 7
male mice; F. PTP1B protein content in normal female mice; G. PTP1B protein content 8
in normal male mice. 9
For protein loading control (A), representative immunoblots (IB) and stainings are 10
shown: actin IB (panel 1), tubulin IB (panel 2), Coomasie blue staining of SDS-PAGE 11
(gel) (panel 3), Ponceau S staining of PVDF membrane prior IB (panel 4) and 12
Coomassie Blue staining of PVDF membrane after IB (panel 5). 13
Immunoblotting quantification was expressed as the fold increase over 9-week-old 14
normal male mice (B-G). Data are the mean ± SEM of the indicated n number of 15
samples per group, each one representing a different animal. Different letters denote 16
significant difference by age. 17
18
Page 32 of 39

Gene Primers Sequence (5’→3’) Genbank
Accesion Number
bGH forward GGGCAGATCCTCAAGCAGAC NM_180996.1
reverse GAAGCAGGAGAGCAGACCG
Cis forward TGCATAGCCAAGACGTTCTC NM_009895.3
reverse GTGGGTGCTGTCTCGAACTA
Cyclophilin A forward GCGTCTCCTTCGAGCTGTT NM_008907.1
reverse AAGTCACCACCCTGGCAC
Ghr forward CCAACTCGCCTCTACACC NM_010284.2
reverse GGGAAAGGACTACACCACCTG
Igf1 forward CTGAGCTGGTGGATGCTCTT NM_010512.4
reverse CACTCATCCACAATGCCTGT
Socs2 forward TGTGAGTCCCAACCTAGTGC NM_007706.4
reverse GTAGAAGGGAGGCAGCTGTT
Socs3 forward CTAGGTGAGGAGTGGTGGCT NM_007707.3
reverse CTGCGAGGTTTCATTAGCTG
Page 33 of 39
Page 34 of 39

Page 35 of 39

Page 36 of 39

Page 37 of 39

Page 38 of 39

Page 39 of 39


