Embed Size (px)
Citation preview
www.ap.com
T E C H N O T E A p p l i c a t i o n a n d T e c h n i c a l S u p p o r t f o r A u d i o P r e c i s i o n U s e r s
TN143
HEADPHONE
ELECTROACOUSTIC MEASUREMENTS
by Joe Begin
About This Technote
An AP Application Note published in 2016 [1] contains a
high-level overview of the key electroacoustic measure-
ments used to characterize the audio quality of head-
phones and earphones intended for listening to music and
other full-band audio program material. Users who are less
familiar with headphone test or who want more background
information might want to start with that document.
In this Technote, we provide a more detailed discussion on
the choice of test equipment for headphone testing, as well
as detailed instructions on how to conduct the tests with
APx audio analyzers.
Industry Standards
Ideally, standards represent consensus among industry ex-
perts concerning measurement conditions and recom-
mended practices that will help to ensure that devices are
tested in a meaningful and repeatable way. As such, it is
best to follow industry standards when conducting perfor-
mance measurements, or to at least use them as a guide-
line.
In terms of test fixtures used in testing headphones and
earphones, the most important standards are Parts 1, 4
and 7 of the IEC 60318 series, titled Electroacoustics –
Simulators of the Human Head and Ear [2, 3, 4]. Part 1
specifies an ear simulator for the measurement of on-the-
ear and around-the-ear earphones; Part 4 specifies an oc-
cluded-ear simulator for measuring earphones coupled to
the ear by means of ear inserts; and Part 7 specifies a
Head and Torso Simulator (HATS).
In terms of test procedures, the key international standard
covering measurements is IEC 60268-7, Sound system
equipment, Part 7: Headphones and earphones [6]. This
Technote will focus on the following electroacoustic
measurements covered by this standard that are most
likely to be of interest:
• Characteristic voltage
• Frequency response
• Crosstalk attenuation
• Amplitude nonlinearity
• Electrical impedance
Concerning sound attenuation, IEC 60268-7 specifies that
measurements should be conducted according to the
ISO 4869 standard for hearing protectors. This topic is cov-
ered in a separate Technote [7] on measuring the perfor-
mance of headphones with Active Noise Cancellation (ANC).
Another important standard in headphone testing is
EN50332 [8], which covers the maximum permissible
sound pressure level that can be generated by headphones
and earphones used with portable music players. This topic
is also covered in a separate Technote [9].
Equipment for Headphone Testing
In addition to an audio analyzer, due to the close coupling
of headphones and earphones to the ear, a special acous-
tic test fixture is required for testing headphones, as well as
some additional accessories. These are discussed sepa-
rately below.
Acoustic Test Fixtures
When testing headphones and earphones, acoustic test fix-
tures serve three primary functions:
1. They incorporate measurement microphones to sense
the sound signals generated by the headphones.
2. The microphones may be embedded in ear simulators
– small cavities which simulate the acoustic imped-
ance of a typical human ear, to properly load the ear-
phones acoustically.
2 TN143 | Headphone Electroacoustic Measurements
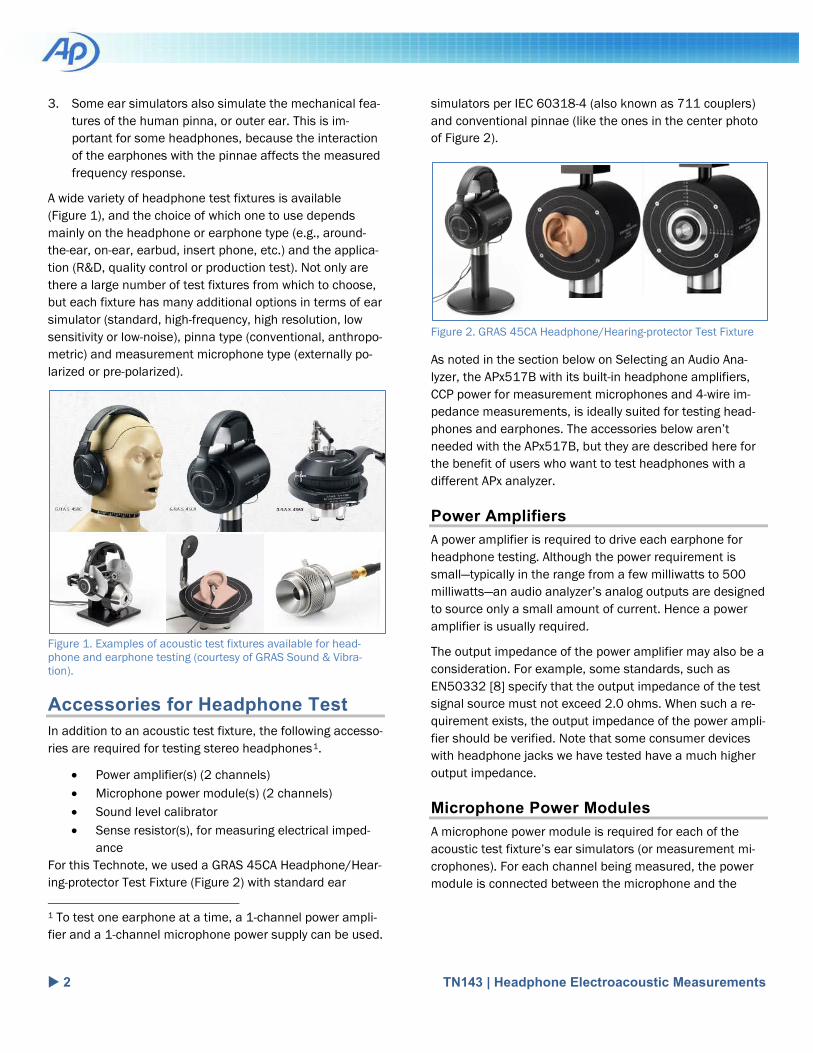
3. Some ear simulators also simulate the mechanical fea-
tures of the human pinna, or outer ear. This is im-
portant for some headphones, because the interaction
of the earphones with the pinnae affects the measured
frequency response.
A wide variety of headphone test fixtures is available
(Figure 1), and the choice of which one to use depends
mainly on the headphone or earphone type (e.g., around-
the-ear, on-ear, earbud, insert phone, etc.) and the applica-
tion (R&D, quality control or production test). Not only are
there a large number of test fixtures from which to choose,
but each fixture has many additional options in terms of ear
simulator (standard, high-frequency, high resolution, low
sensitivity or low-noise), pinna type (conventional, anthropo-
metric) and measurement microphone type (externally po-
larized or pre-polarized).
Figure 1. Examples of acoustic test fixtures available for head-phone and earphone testing (courtesy of GRAS Sound & Vibra-tion).
Accessories for Headphone Test
In addition to an acoustic test fixture, the following accesso-
ries are required for testing stereo headphones1.
• Power amplifier(s) (2 channels)
• Microphone power module(s) (2 channels)
• Sound level calibrator
• Sense resistor(s), for measuring electrical imped-
ance
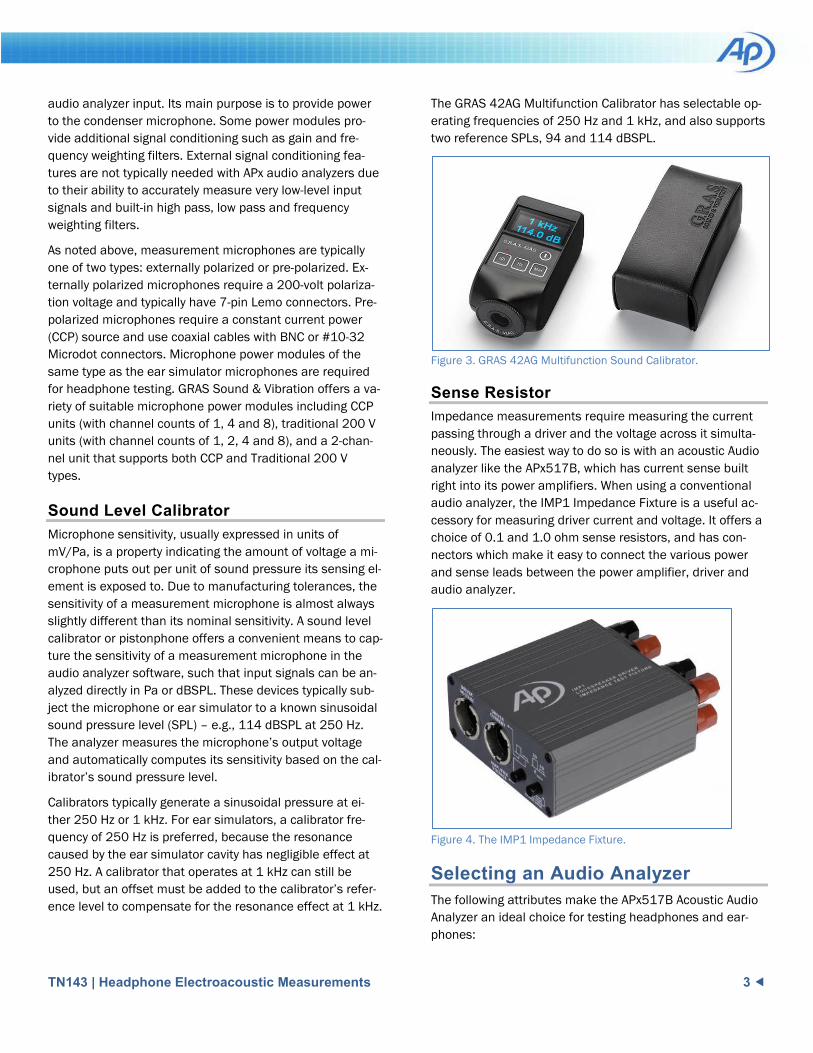
For this Technote, we used a GRAS 45CA Headphone/Hear-
ing-protector Test Fixture (Figure 2) with standard ear
1 To test one earphone at a time, a 1-channel power ampli-
fier and a 1-channel microphone power supply can be used.
simulators per IEC 60318-4 (also known as 711 couplers)
and conventional pinnae (like the ones in the center photo
of Figure 2).
Figure 2. GRAS 45CA Headphone/Hearing-protector Test Fixture
As noted in the section below on Selecting an Audio Ana-
lyzer, the APx517B with its built-in headphone amplifiers,
CCP power for measurement microphones and 4-wire im-
pedance measurements, is ideally suited for testing head-
phones and earphones. The accessories below aren’t
needed with the APx517B, but they are described here for
the benefit of users who want to test headphones with a
different APx analyzer.
Power Amplifiers
A power amplifier is required to drive each earphone for
headphone testing. Although the power requirement is
small—typically in the range from a few milliwatts to 500
milliwatts—an audio analyzer’s analog outputs are designed
to source only a small amount of current. Hence a power
amplifier is usually required.
The output impedance of the power amplifier may also be a
consideration. For example, some standards, such as
EN50332 [8] specify that the output impedance of the test
signal source must not exceed 2.0 ohms. When such a re-
quirement exists, the output impedance of the power ampli-
fier should be verified. Note that some consumer devices
with headphone jacks we have tested have a much higher
output impedance.
Microphone Power Modules
A microphone power module is required for each of the
acoustic test fixture’s ear simulators (or measurement mi-
crophones). For each channel being measured, the power
module is connected between the microphone and the
TN143 | Headphone Electroacoustic Measurements 3
audio analyzer input. Its main purpose is to provide power
to the condenser microphone. Some power modules pro-
vide additional signal conditioning such as gain and fre-
quency weighting filters. External signal conditioning fea-
tures are not typically needed with APx audio analyzers due
to their ability to accurately measure very low-level input
signals and built-in high pass, low pass and frequency
weighting filters.
As noted above, measurement microphones are typically
one of two types: externally polarized or pre-polarized. Ex-
ternally polarized microphones require a 200-volt polariza-
tion voltage and typically have 7-pin Lemo connectors. Pre-
polarized microphones require a constant current power
(CCP) source and use coaxial cables with BNC or #10-32
Microdot connectors. Microphone power modules of the
same type as the ear simulator microphones are required
for headphone testing. GRAS Sound & Vibration offers a va-
riety of suitable microphone power modules including CCP
units (with channel counts of 1, 4 and 8), traditional 200 V
units (with channel counts of 1, 2, 4 and 8), and a 2-chan-
nel unit that supports both CCP and Traditional 200 V
types.
Sound Level Calibrator
Microphone sensitivity, usually expressed in units of
mV/Pa, is a property indicating the amount of voltage a mi-
crophone puts out per unit of sound pressure its sensing el-
ement is exposed to. Due to manufacturing tolerances, the
sensitivity of a measurement microphone is almost always
slightly different than its nominal sensitivity. A sound level
calibrator or pistonphone offers a convenient means to cap-
ture the sensitivity of a measurement microphone in the
audio analyzer software, such that input signals can be an-
alyzed directly in Pa or dBSPL. These devices typically sub-
ject the microphone or ear simulator to a known sinusoidal
sound pressure level (SPL) – e.g., 114 dBSPL at 250 Hz.
The analyzer measures the microphone’s output voltage
and automatically computes its sensitivity based on the cal-
ibrator’s sound pressure level.
Calibrators typically generate a sinusoidal pressure at ei-
ther 250 Hz or 1 kHz. For ear simulators, a calibrator fre-
quency of 250 Hz is preferred, because the resonance
caused by the ear simulator cavity has negligible effect at
250 Hz. A calibrator that operates at 1 kHz can still be
used, but an offset must be added to the calibrator’s refer-
ence level to compensate for the resonance effect at 1 kHz.
The GRAS 42AG Multifunction Calibrator has selectable op-
erating frequencies of 250 Hz and 1 kHz, and also supports
two reference SPLs, 94 and 114 dBSPL.
Figure 3. GRAS 42AG Multifunction Sound Calibrator.
Sense Resistor
Impedance measurements require measuring the current
passing through a driver and the voltage across it simulta-
neously. The easiest way to do so is with an acoustic Audio
analyzer like the APx517B, which has current sense built
right into its power amplifiers. When using a conventional
audio analyzer, the IMP1 Impedance Fixture is a useful ac-
cessory for measuring driver current and voltage. It offers a
choice of 0.1 and 1.0 ohm sense resistors, and has con-
nectors which make it easy to connect the various power
and sense leads between the power amplifier, driver and
audio analyzer.
Figure 4. The IMP1 Impedance Fixture.
Selecting an Audio Analyzer
The following attributes make the APx517B Acoustic Audio
Analyzer an ideal choice for testing headphones and ear-
phones:
4 TN143 | Headphone Electroacoustic Measurements
• 2-channel precision headphone amplifier with
standard headphone jack connector.
• 2 analog input channels with CCP power and TEDS
support for pre-polarized measurement micro-
phones (or ear simulators).
• Built-in current sense with 4-wire impedance meas-
urements.
• Support for one optional digital audio IO module,
(e.g., Bluetooth®, PDM, PDM 16, DSIO, DIO, HDMI,
etc.).
Aside from the APx517B, virtually any audio analyzer in the
APx family, when equipped with the right accessories, can
be used to test headphones and earphones. For testing an-
alog stereo headphones, an audio analyzer with at least
two analog output channels and two analog input channels
is required. While the APx515 meets this requirement, us-
ers who also need to test audio quality over digital inter-
faces such as Bluetooth, PDM, I2S/TDM, or HDMI might
want to consider either an APx517B, or a modular 2-chan-
nel audio analyzer like the APx525, or the higher perfor-
mance APx555. And those needing higher analog channel
counts for other applications might consider the APx526 (2
output channels x 4 input channels), the APx 582 (2 out x 8
in), the APx585 (8 out x 8 in) or the APx586 (8 out x 16 in).
For headphone applications involving a single earphone,
the APx511 Hearing Instrument Analyzer could also be a
compelling choice. Its single output channel incorporates a
unity gain power amplifier, and its single analog input chan-
nel supports CCP microphone power.
For those using an analyzer other than the APx517B, the
APx1701 Transducer Test Interface is also a very useful ac-
cessory for headphone testing. It has two laboratory grade
power amplifiers with built-in current sense resistors, sup-
port for two CCP microphones (with or without TEDS), as
well as support for two phantom-powered microphones. It
comes with ISO 17025 accredited calibration and is fully in-
tegrated with the APx500 audio analyzer software.
Conducting the Measurements
Next, we’ll describe the practical aspects of conducting the
headphone measurements using an APx517B Acoustic Au-
dio Analyzer and a GRAS 45CA-6 Headphone/Hearing-Pro-
tector Test Fixture equipped with CCP type IEC 60318-4 ear
simulators and standard pinna simulators. The measure-
ments shown in this Technote are for a set of around-the-
ear (ATE) stereo headphones that are popular in the profes-
sional broadcast industry.
Connections
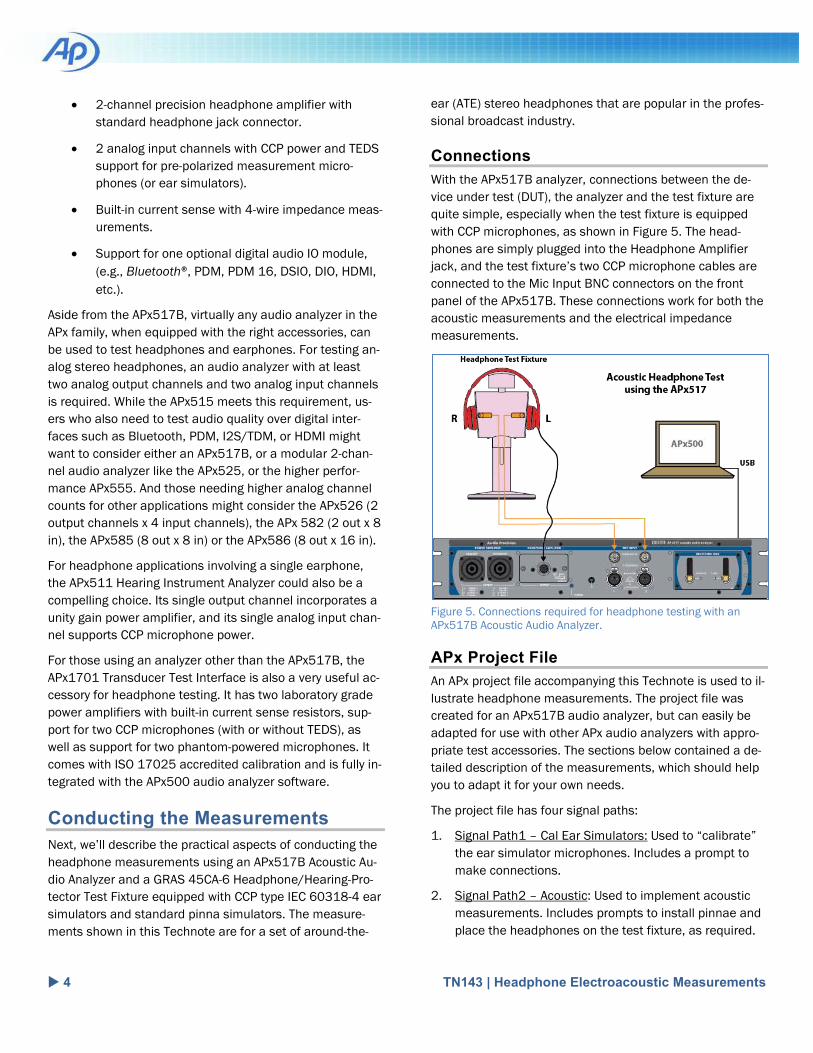
With the APx517B analyzer, connections between the de-
vice under test (DUT), the analyzer and the test fixture are
quite simple, especially when the test fixture is equipped
with CCP microphones, as shown in Figure 5. The head-
phones are simply plugged into the Headphone Amplifier
jack, and the test fixture’s two CCP microphone cables are
connected to the Mic Input BNC connectors on the front
panel of the APx517B. These connections work for both the
acoustic measurements and the electrical impedance
measurements.
Figure 5. Connections required for headphone testing with an APx517B Acoustic Audio Analyzer.
APx Project File
An APx project file accompanying this Technote is used to il-
lustrate headphone measurements. The project file was
created for an APx517B audio analyzer, but can easily be
adapted for use with other APx audio analyzers with appro-
priate test accessories. The sections below contained a de-
tailed description of the measurements, which should help
you to adapt it for your own needs.
The project file has four signal paths:
1. Signal Path1 – Cal Ear Simulators: Used to “calibrate”
the ear simulator microphones. Includes a prompt to
make connections.
2. Signal Path2 – Acoustic: Used to implement acoustic
measurements. Includes prompts to install pinnae and
place the headphones on the test fixture, as required.
TN143 | Headphone Electroacoustic Measurements 5
3. Signal Path3 – Impedance-L: Impedance measurement
of the left earphone.
4. Signal Path4 – Impedance-R: Impedance measurement
of the right earphone.
The project file has five sequences. A sequence in APx is a
collection of checked items – signal paths, measurements,
results and sequence steps. Once a sequence is selected,
the Run Sequence button at the top of the Navigator will
run all the checked measurements—including checked se-
quence steps—in all checked signal paths and accumulate
checked results into a report. If the report checkbox is
checked, the report is opened at the end of the sequence.
The first sequence, named Cal & Regulate, is configured to
“calibrate” the ear simulators and then use a regulation
process to find the Characteristic Voltage. The second se-
quence is configured to run the remaining acoustic meas-
urements, and the third and fourth sequences are config-
ured to run the electrical impedance measurements. The
fifth sequence, named “Sequence – All”, first prompts the
operator for the Device ID, runs all the measurements and
sequence steps in the previous four sequences and then
opens the test report. The following sections provide detail
on how the sequences are implemented.
Ear Simulator Calibration
Prior to conducting acoustic measurements, the ear simula-
tor microphones must be “calibrated”. This is not a true cal-
ibration per se, but rather the process of entering the mi-
crophone sensitivities such that the input signals can be
scaled properly to Pa or dBSPL. In the APx software, this is
accomplished using Acoustic Input mode, invoked by
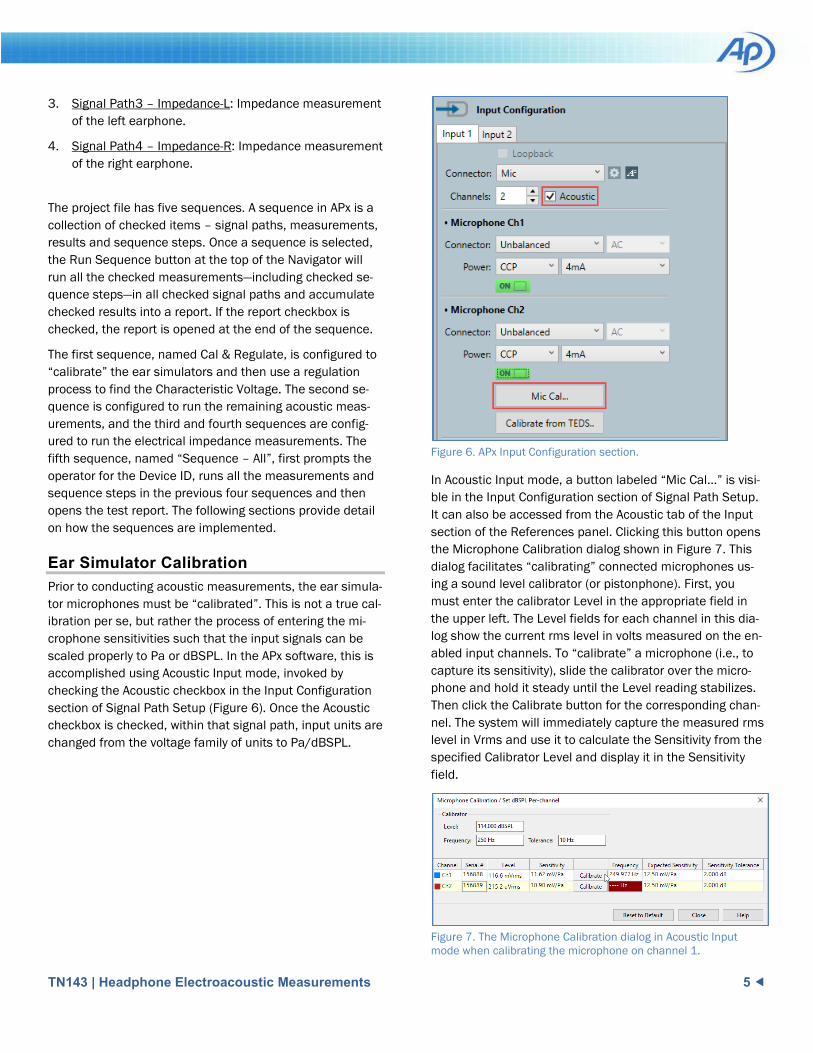
checking the Acoustic checkbox in the Input Configuration
section of Signal Path Setup (Figure 6). Once the Acoustic
checkbox is checked, within that signal path, input units are
changed from the voltage family of units to Pa/dBSPL.
Figure 6. APx Input Configuration section.
In Acoustic Input mode, a button labeled “Mic Cal…” is visi-
ble in the Input Configuration section of Signal Path Setup.
It can also be accessed from the Acoustic tab of the Input
section of the References panel. Clicking this button opens
the Microphone Calibration dialog shown in Figure 7. This
dialog facilitates “calibrating” connected microphones us-
ing a sound level calibrator (or pistonphone). First, you
must enter the calibrator Level in the appropriate field in
the upper left. The Level fields for each channel in this dia-
log show the current rms level in volts measured on the en-
abled input channels. To “calibrate” a microphone (i.e., to
capture its sensitivity), slide the calibrator over the micro-
phone and hold it steady until the Level reading stabilizes.
Then click the Calibrate button for the corresponding chan-
nel. The system will immediately capture the measured rms
level in Vrms and use it to calculate the Sensitivity from the
specified Calibrator Level and display it in the Sensitivity
field.
Figure 7. The Microphone Calibration dialog in Acoustic Input mode when calibrating the microphone on channel 1.

6 TN143 | Headphone Electroacoustic Measurements
Optional fields in the Microphone Calibration dialog can be
used to specify the nominal frequency of the calibrator and
a frequency tolerance value. If the measured frequency dif-
fers from the nominal frequency by more than the specified
tolerance, the Frequency field is highlighted in red, as
shown for Ch2 in Figure 7. Optional fields for each micro-
phone channel can also be used to specify the Serial Num-
ber, the Expected Sensitivity and the Sensitivity Tolerance.
Once the Calibrate button has been clicked, the Sensitivity
field will be highlighted in red if the difference between the
measured and expected sensitivity exceeds the Sensitivity
Tolerance.
In addition to the manual process described above, the
“calibration” process for each channel can be implemented
via a Prompt Sequence Step in the Signal Path Setup meas-
urement. Simply add a Prompt step, configure its Message
to Operator field, check the Set dBSPL checkbox, and se-
lect the desired channel, as shown in Figure 8.
The sequence step in Figure 8, when executed, displays the
prompt shown in Figure 9. In this case, a photograph has
been added to the Appearance tab of the prompt for clarity.
Note: If the Calibrator Frequency and Expected Sensitivity
fields in Figure 7 are populated, out-of-tolerance values in
the prompt will be highlighted in red, and will cause the
measurement to fail in the sequence.
Note: The APx517B CCP microphone inputs are TEDS capable. If
the ear simulator has CCP microphone preamplifiers that are pro-
grammed with TEDS, the APx software can read each micro-
phone’s sensitivity (and other key information) directly from a chip
inside the preamplifier and assign the sensitivity to the appropri-
ate channel. This can be done manually, or via a sequence step.
Sequence steps for this purpose are included in the accompany-
ing project file, but are unchecked.
Figure 8. Configuring a Prompt step in Signal Path Setup to "cali-brate" the left ear simulator (on Channel 1).
Figure 9. Prompt sequence step with Set dBSPL checkbox checked.
TN143 | Headphone Electroacoustic Measurements 7
Characteristic Voltage
Once the ear simulator microphones have been “cali-
brated”, we can conduct acoustic measurements.
IEC 60268-7 defines the Characteristic Voltage as the volt-
age of a sinusoidal signal at 500 Hz, which, when applied
to the earphone on a coupler or ear simulator, produces a
sound pressure level of 94 dBSPL. This voltage is found
through a regulation process, which can be implemented in
APx using the Auto Set Gen Level feature. To use the fea-
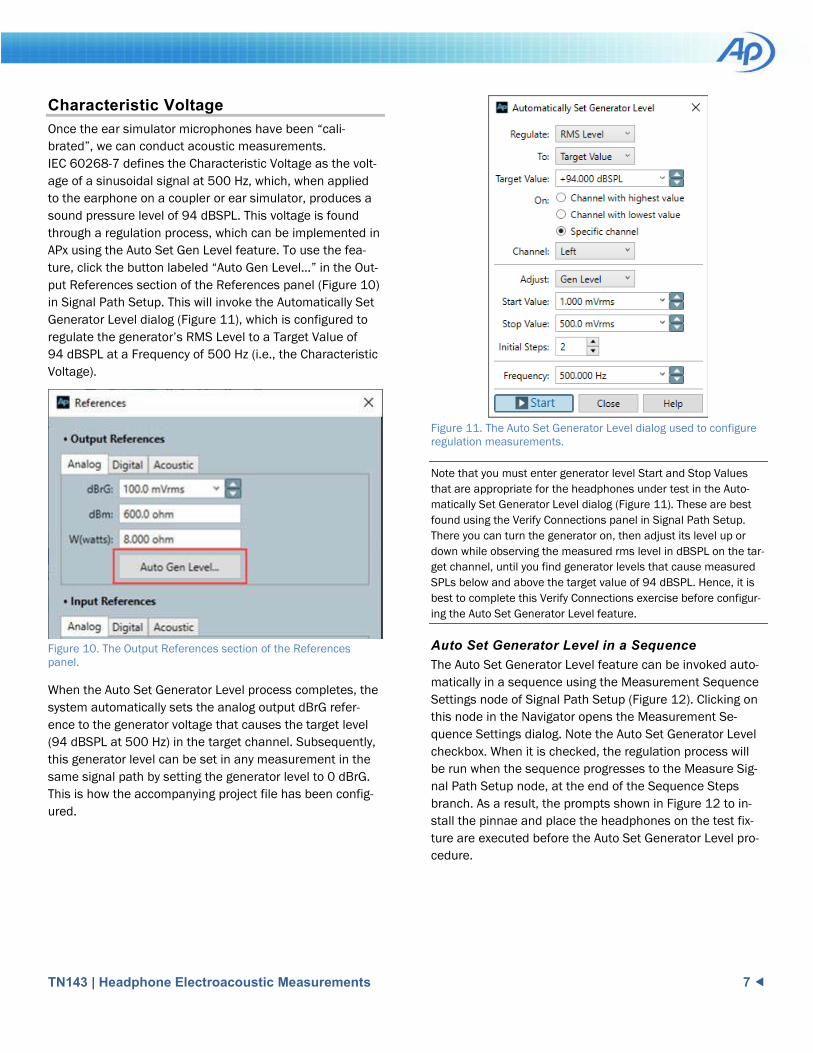
ture, click the button labeled “Auto Gen Level…” in the Out-
put References section of the References panel (Figure 10)
in Signal Path Setup. This will invoke the Automatically Set
Generator Level dialog (Figure 11), which is configured to
regulate the generator’s RMS Level to a Target Value of
94 dBSPL at a Frequency of 500 Hz (i.e., the Characteristic
Voltage).
Figure 10. The Output References section of the References panel.
When the Auto Set Generator Level process completes, the
system automatically sets the analog output dBrG refer-
ence to the generator voltage that causes the target level
(94 dBSPL at 500 Hz) in the target channel. Subsequently,
this generator level can be set in any measurement in the
same signal path by setting the generator level to 0 dBrG.
This is how the accompanying project file has been config-
ured.
Figure 11. The Auto Set Generator Level dialog used to configure regulation measurements.
Note that you must enter generator level Start and Stop Values
that are appropriate for the headphones under test in the Auto-
matically Set Generator Level dialog (Figure 11). These are best
found using the Verify Connections panel in Signal Path Setup.
There you can turn the generator on, then adjust its level up or
down while observing the measured rms level in dBSPL on the tar-
get channel, until you find generator levels that cause measured
SPLs below and above the target value of 94 dBSPL. Hence, it is
best to complete this Verify Connections exercise before configur-
ing the Auto Set Generator Level feature.
Auto Set Generator Level in a Sequence
The Auto Set Generator Level feature can be invoked auto-
matically in a sequence using the Measurement Sequence
Settings node of Signal Path Setup (Figure 12). Clicking on
this node in the Navigator opens the Measurement Se-
quence Settings dialog. Note the Auto Set Generator Level
checkbox. When it is checked, the regulation process will
be run when the sequence progresses to the Measure Sig-
nal Path Setup node, at the end of the Sequence Steps
branch. As a result, the prompts shown in Figure 12 to in-
stall the pinnae and place the headphones on the test fix-
ture are executed before the Auto Set Generator Level pro-
cedure.
8 TN143 | Headphone Electroacoustic Measurements
Figure 12. The Measurement Sequence Settings node of Signal Path Setup.
Copying References between Signal Paths
Note also the Copy References From dropdown control in
Figure 12, which has been set to “Signal Path1 – Cal Ear
Simulators”. This instructs the system to copy all references
from Signal Path1 – Cal Ear Simulators to the current signal
path (Signal Path2 – Acoustic). This enables the micro-
phone sensitivities and generator dBrG reference voltage to
be propagated from one signal path to another.
Frequency Response & THD
Harmonic distortion is one form of amplitude nonlinearity.
The Acoustic Response and Continuous Sweep measure-
ments in APx both use the log-swept sine or “chirp” meas-
urement technique, which enables simultaneous measure-
ment of frequency response and total harmonic distortion
(THD). As the name implies, Acoustic Response is intended
for acoustic measurements, with features such as averag-
ing multiple sweeps to improve signal-to-noise ratio, and a
Level and Distortion result which shows RMS Level, THD
Level and second (H2) and third (H3) harmonic distortion
product levels on one graph. Acoustic Response also ena-
bles windowing the impulse response for quasi-anechoic
loudspeaker measurements, but this feature is not needed
for headphone testing on ear simulators.
The Continuous Sweep measurement is intended for elec-
tronic audio measurements, but we’ve included it in the
project file because it has a built-in capability to make
crosstalk measurements. It offers high-speed and high-ac-
curacy modes. In the high-speed mode, the chirp signal in
channel 2 is delayed relative to channel 1, enabling cross-
talk to be measured in one sweep. In the high-accuracy
mode, a separate sweep is conducted for each measure-
ment channel with the generator disabled for the opposite
channel.
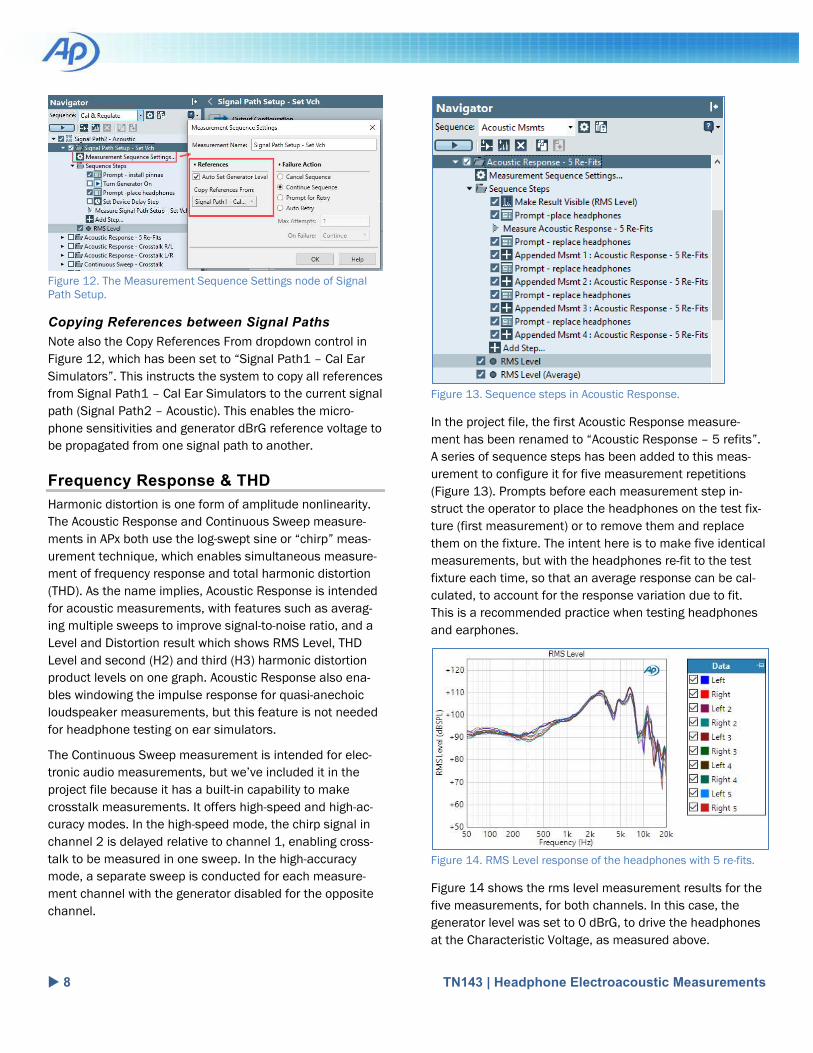
Figure 13. Sequence steps in Acoustic Response.
In the project file, the first Acoustic Response measure-
ment has been renamed to “Acoustic Response – 5 refits”.
A series of sequence steps has been added to this meas-
urement to configure it for five measurement repetitions
(Figure 13). Prompts before each measurement step in-
struct the operator to place the headphones on the test fix-
ture (first measurement) or to remove them and replace
them on the fixture. The intent here is to make five identical
measurements, but with the headphones re-fit to the test
fixture each time, so that an average response can be cal-
culated, to account for the response variation due to fit.
This is a recommended practice when testing headphones
and earphones.
Figure 14. RMS Level response of the headphones with 5 re-fits.
Figure 14 shows the rms level measurement results for the
five measurements, for both channels. In this case, the
generator level was set to 0 dBrG, to drive the headphones
at the Characteristic Voltage, as measured above.
TN143 | Headphone Electroacoustic Measurements 9
APx Derived Results
There are many “derived results” in the APx software that
can be used to perform math operations on measured
data, to help you gain insights into a product’s perfor-
mance. Some of these are illustrated below. In APx, derived
result graphs are denoted by an fx icon.
Figure 15 shows a Power Average result derived from the
five data sets in Figure 14, to calculate the response of the
left and right earphones averaged over five re-fit opera-
tions. This allows us to more easily see the difference in re-
sponse between the left and right earphones, while ac-
counting for the variation due to fit.
Figure 15. Response of the left and right earphones averaged over five re-fits.
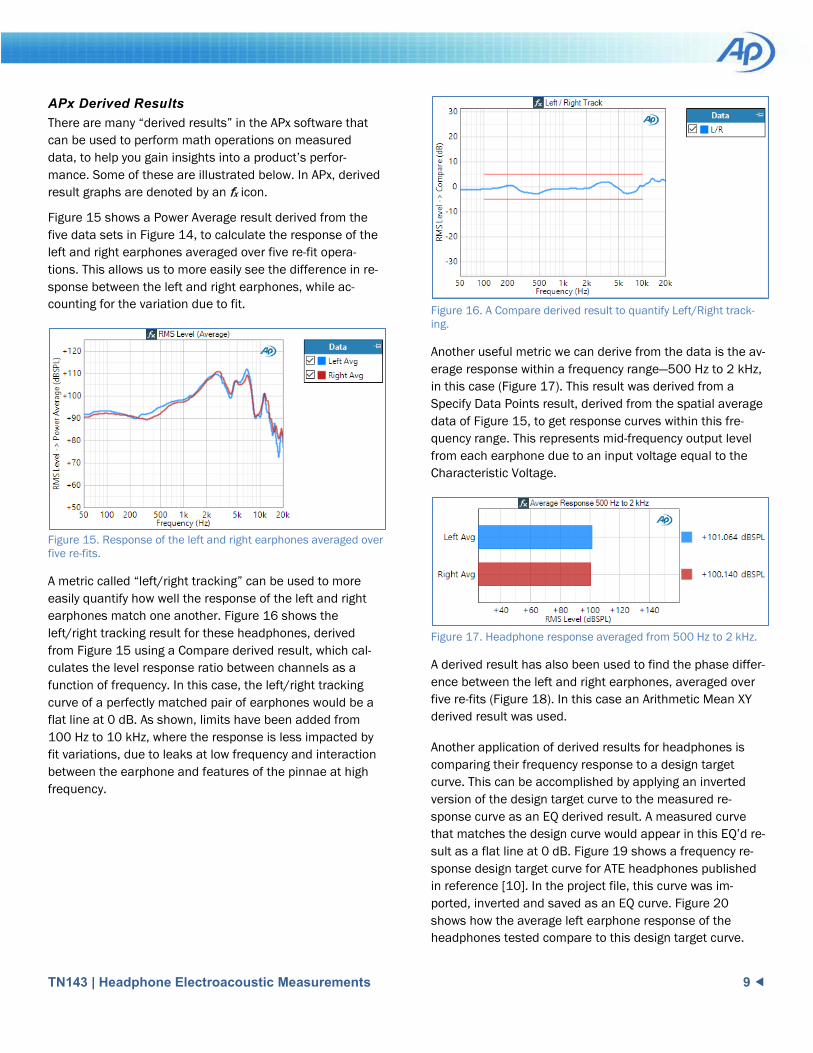
A metric called “left/right tracking” can be used to more
easily quantify how well the response of the left and right
earphones match one another. Figure 16 shows the
left/right tracking result for these headphones, derived
from Figure 15 using a Compare derived result, which cal-
culates the level response ratio between channels as a
function of frequency. In this case, the left/right tracking
curve of a perfectly matched pair of earphones would be a
flat line at 0 dB. As shown, limits have been added from
100 Hz to 10 kHz, where the response is less impacted by
fit variations, due to leaks at low frequency and interaction
between the earphone and features of the pinnae at high
frequency.
Figure 16. A Compare derived result to quantify Left/Right track-ing.
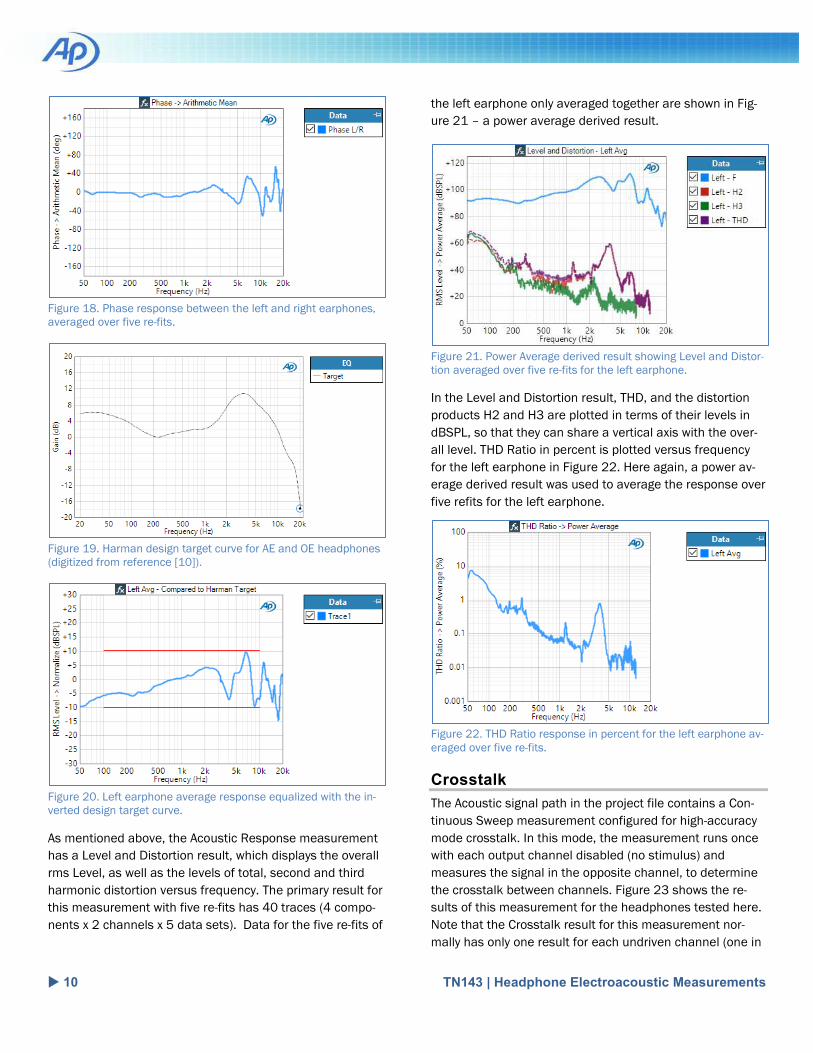
Another useful metric we can derive from the data is the av-
erage response within a frequency range—500 Hz to 2 kHz,
in this case (Figure 17). This result was derived from a
Specify Data Points result, derived from the spatial average
data of Figure 15, to get response curves within this fre-
quency range. This represents mid-frequency output level
from each earphone due to an input voltage equal to the
Characteristic Voltage.
Figure 17. Headphone response averaged from 500 Hz to 2 kHz.
A derived result has also been used to find the phase differ-
ence between the left and right earphones, averaged over
five re-fits (Figure 18). In this case an Arithmetic Mean XY
derived result was used.
Another application of derived results for headphones is
comparing their frequency response to a design target
curve. This can be accomplished by applying an inverted
version of the design target curve to the measured re-
sponse curve as an EQ derived result. A measured curve
that matches the design curve would appear in this EQ’d re-
sult as a flat line at 0 dB. Figure 19 shows a frequency re-
sponse design target curve for ATE headphones published
in reference [10]. In the project file, this curve was im-
ported, inverted and saved as an EQ curve. Figure 20
shows how the average left earphone response of the
headphones tested compare to this design target curve.
10 TN143 | Headphone Electroacoustic Measurements
Figure 18. Phase response between the left and right earphones, averaged over five re-fits.
Figure 19. Harman design target curve for AE and OE headphones (digitized from reference [10]).
Figure 20. Left earphone average response equalized with the in-verted design target curve.
As mentioned above, the Acoustic Response measurement
has a Level and Distortion result, which displays the overall
rms Level, as well as the levels of total, second and third
harmonic distortion versus frequency. The primary result for
this measurement with five re-fits has 40 traces (4 compo-
nents x 2 channels x 5 data sets). Data for the five re-fits of
the left earphone only averaged together are shown in Fig-
ure 21 – a power average derived result.
Figure 21. Power Average derived result showing Level and Distor-tion averaged over five re-fits for the left earphone.
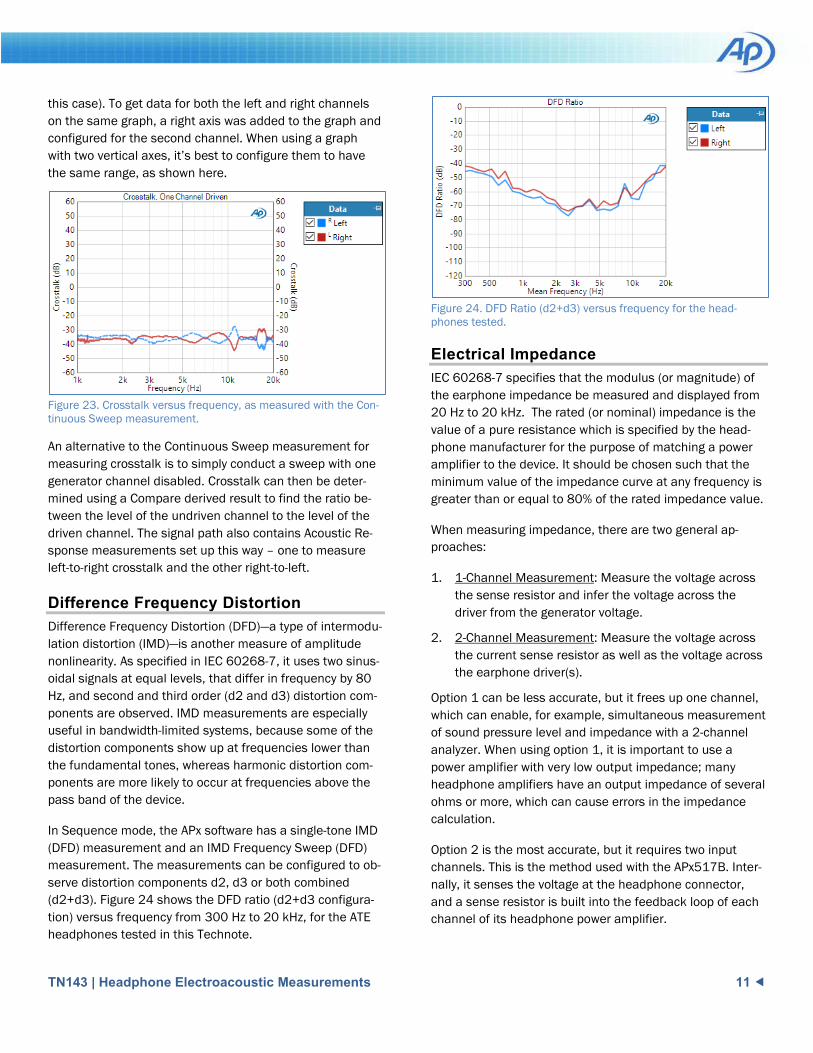
In the Level and Distortion result, THD, and the distortion
products H2 and H3 are plotted in terms of their levels in
dBSPL, so that they can share a vertical axis with the over-
all level. THD Ratio in percent is plotted versus frequency
for the left earphone in Figure 22. Here again, a power av-
erage derived result was used to average the response over
five refits for the left earphone.
Figure 22. THD Ratio response in percent for the left earphone av-eraged over five re-fits.
Crosstalk
The Acoustic signal path in the project file contains a Con-
tinuous Sweep measurement configured for high-accuracy
mode crosstalk. In this mode, the measurement runs once
with each output channel disabled (no stimulus) and
measures the signal in the opposite channel, to determine
the crosstalk between channels. Figure 23 shows the re-
sults of this measurement for the headphones tested here.
Note that the Crosstalk result for this measurement nor-
mally has only one result for each undriven channel (one in
TN143 | Headphone Electroacoustic Measurements 11
this case). To get data for both the left and right channels
on the same graph, a right axis was added to the graph and
configured for the second channel. When using a graph
with two vertical axes, it’s best to configure them to have
the same range, as shown here.
Figure 23. Crosstalk versus frequency, as measured with the Con-tinuous Sweep measurement.
An alternative to the Continuous Sweep measurement for
measuring crosstalk is to simply conduct a sweep with one
generator channel disabled. Crosstalk can then be deter-
mined using a Compare derived result to find the ratio be-
tween the level of the undriven channel to the level of the
driven channel. The signal path also contains Acoustic Re-
sponse measurements set up this way – one to measure
left-to-right crosstalk and the other right-to-left.
Difference Frequency Distortion
Difference Frequency Distortion (DFD)—a type of intermodu-
lation distortion (IMD)—is another measure of amplitude
nonlinearity. As specified in IEC 60268-7, it uses two sinus-
oidal signals at equal levels, that differ in frequency by 80
Hz, and second and third order (d2 and d3) distortion com-
ponents are observed. IMD measurements are especially
useful in bandwidth-limited systems, because some of the
distortion components show up at frequencies lower than
the fundamental tones, whereas harmonic distortion com-
ponents are more likely to occur at frequencies above the
pass band of the device.
In Sequence mode, the APx software has a single-tone IMD
(DFD) measurement and an IMD Frequency Sweep (DFD)
measurement. The measurements can be configured to ob-
serve distortion components d2, d3 or both combined
(d2+d3). Figure 24 shows the DFD ratio (d2+d3 configura-
tion) versus frequency from 300 Hz to 20 kHz, for the ATE
headphones tested in this Technote.
Figure 24. DFD Ratio (d2+d3) versus frequency for the head-phones tested.
Electrical Impedance
IEC 60268-7 specifies that the modulus (or magnitude) of
the earphone impedance be measured and displayed from
20 Hz to 20 kHz. The rated (or nominal) impedance is the
value of a pure resistance which is specified by the head-
phone manufacturer for the purpose of matching a power
amplifier to the device. It should be chosen such that the
minimum value of the impedance curve at any frequency is
greater than or equal to 80% of the rated impedance value.
When measuring impedance, there are two general ap-
proaches:
1. 1-Channel Measurement: Measure the voltage across
the sense resistor and infer the voltage across the
driver from the generator voltage.
2. 2-Channel Measurement: Measure the voltage across
the current sense resistor as well as the voltage across
the earphone driver(s).
Option 1 can be less accurate, but it frees up one channel,
which can enable, for example, simultaneous measurement
of sound pressure level and impedance with a 2-channel
analyzer. When using option 1, it is important to use a
power amplifier with very low output impedance; many
headphone amplifiers have an output impedance of several
ohms or more, which can cause errors in the impedance
calculation.
Option 2 is the most accurate, but it requires two input
channels. This is the method used with the APx517B. Inter-
nally, it senses the voltage at the headphone connector,
and a sense resistor is built into the feedback loop of each
channel of its headphone power amplifier.
12 TN143 | Headphone Electroacoustic Measurements
Another consideration is that in most headphones, the left
and right earphones typically have a common ground con-
nection. It’s therefore important to isolate each earphone
when measuring impedance, to ensure accuracy. The
APx517 takes care of this by only enabling impedance
measurements of one side per signal path.
In the APx project file, two signal paths have been added for
impedance measurements – one for the left earphone and
one for the right. Each signal path includes one instance of
the Impedance/Thiele-Small measurement. This is another
convenient feature of the APx517B: When conducting im-
pedance measurements with the headphone amplifier, you
can select the Left or Right earphone for impedance meas-
urements, and the system will disconnect the opposite
headphone during the measurement. This is important be-
cause the left and right earphones typically share a com-
mon ground, and one earphone should be removed from
the circuit for accurate measurements.
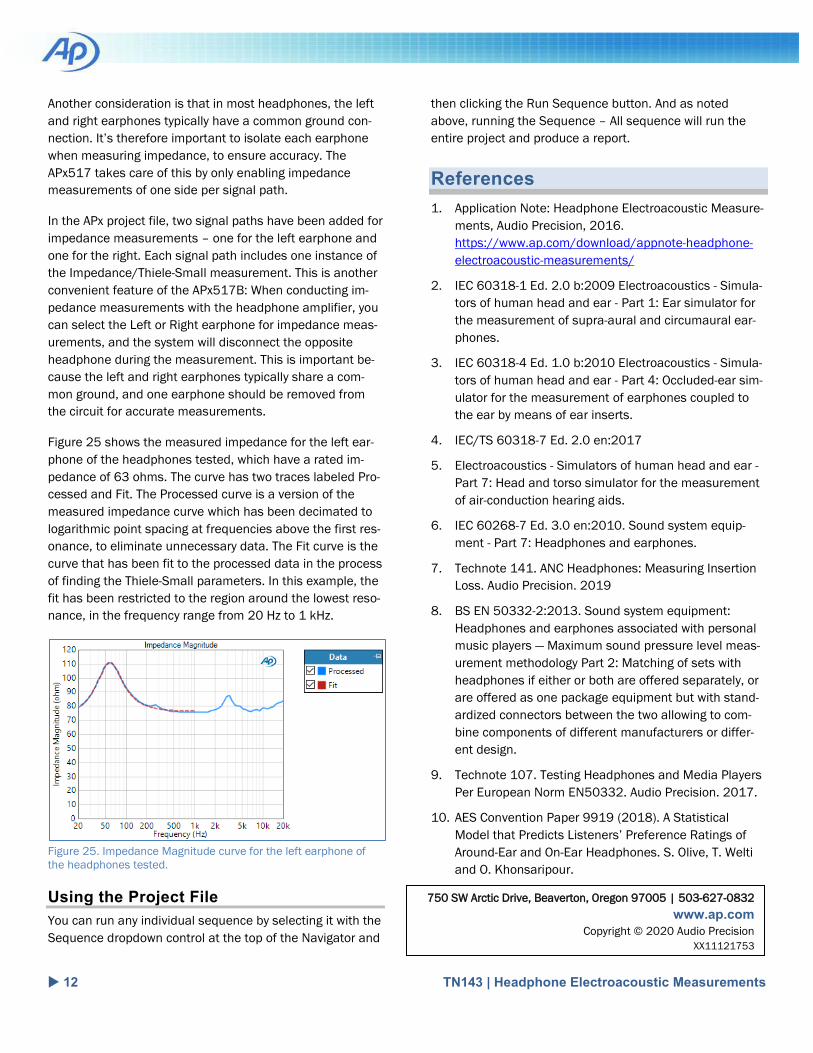
Figure 25 shows the measured impedance for the left ear-
phone of the headphones tested, which have a rated im-
pedance of 63 ohms. The curve has two traces labeled Pro-
cessed and Fit. The Processed curve is a version of the
measured impedance curve which has been decimated to
logarithmic point spacing at frequencies above the first res-
onance, to eliminate unnecessary data. The Fit curve is the
curve that has been fit to the processed data in the process
of finding the Thiele-Small parameters. In this example, the
fit has been restricted to the region around the lowest reso-
nance, in the frequency range from 20 Hz to 1 kHz.
Figure 25. Impedance Magnitude curve for the left earphone of the headphones tested.
Using the Project File
You can run any individual sequence by selecting it with the
Sequence dropdown control at the top of the Navigator and
then clicking the Run Sequence button. And as noted
above, running the Sequence – All sequence will run the
entire project and produce a report.
References
1. Application Note: Headphone Electroacoustic Measure-
ments, Audio Precision, 2016.
https://www.ap.com/download/appnote-headphone-
electroacoustic-measurements/
2. IEC 60318-1 Ed. 2.0 b:2009 Electroacoustics - Simula-
tors of human head and ear - Part 1: Ear simulator for
the measurement of supra-aural and circumaural ear-
phones.
3. IEC 60318-4 Ed. 1.0 b:2010 Electroacoustics - Simula-
tors of human head and ear - Part 4: Occluded-ear sim-
ulator for the measurement of earphones coupled to
the ear by means of ear inserts.
4. IEC/TS 60318-7 Ed. 2.0 en:2017
5. Electroacoustics - Simulators of human head and ear -
Part 7: Head and torso simulator for the measurement
of air-conduction hearing aids.
6. IEC 60268-7 Ed. 3.0 en:2010. Sound system equip-
ment - Part 7: Headphones and earphones.
7. Technote 141. ANC Headphones: Measuring Insertion
Loss. Audio Precision. 2019
8. BS EN 50332-2:2013. Sound system equipment:
Headphones and earphones associated with personal
music players — Maximum sound pressure level meas-
urement methodology Part 2: Matching of sets with
headphones if either or both are offered separately, or
are offered as one package equipment but with stand-
ardized connectors between the two allowing to com-
bine components of different manufacturers or differ-
ent design.
9. Technote 107. Testing Headphones and Media Players
Per European Norm EN50332. Audio Precision. 2017.
10. AES Convention Paper 9919 (2018). A Statistical
Model that Predicts Listeners’ Preference Ratings of
Around-Ear and On-Ear Headphones. S. Olive, T. Welti
and O. Khonsaripour.
750 SW Arctic Drive, Beaverton, Oregon 97005 | 503-627-0832
www.ap.com
Copyright © 2020 Audio Precision XX11121753