Embed Size (px)
Citation preview

Cross-Country Comparisons
Health Service Utilization in the FormerSoviet Union: Evidence from EightCountriesDina Balabanova, Martin McKee, Joceline Pomerleau,Richard Rose, and Christian Haerpfer
Background. In the past decade, the countries that emerged from the Soviet Unionhave experiencedmajor changes in the inherited Sovietmodel of health care, which wascentrally planned and provided universal, free access to basic care. The underlyingprinciple of universality remains, but coexists with new funding and delivery systemsand growing out-of-pocket payments.Objective. To examine patterns and determinants of health care utilization, the extentof payment for health care, and the settings in which care is obtained in Armenia,Belarus, Georgia, Kazakhstan, Kyrgyzstan, Moldova, Russia, and Ukraine.Methods. Data were derived from cross-sectional surveys, representative of adultsaged 18 and over in each country, conducted in 2001. Multistage random sample of18,428 individuals, stratified by region and area, was obtained. Instrument containedextensive data on demographic, economic, and social characteristics, administered face-to-face. The analysis explored the health seeking behavior of users and nonusers (thosereporting an episode of illness but not consulting).Results. In the preceding year, over half of all respondents visited a medical profes-sional, ranging from 65.7 percent in Belarus to 24.4 percent in Georgia, mostly at localprimary care facilities. Of those reporting an illness, 20.7 percent of all did not consultalthough they felt they should have done so, varying from 9.4 percent in Belarus to 42.4percent in Armenia and 49 percent in Georgia.The main reason for not seeking care was lack of money to pay for treatment
(45.2 percent), self-treatment with home-produced remedies (32.9 percent), and pur-chase of nonprescribed medicine (21.8 percent). There are marked differencesbetween countries; unaffordability was a particularly common factor in Armenia,Georgia, and Moldova (78 percent, 70 percent, 54 percent), and much lower in Belarusand Russia.In Georgia and Armenia, 65 percent and 56 percent of those who had consulted paid
out-of-pocket, in the form of money, gifts, or both; these figures were 8 percent and 19percent in Belarus and Russia respectively and 31.2 percent overall.The probability of not consulting a health professional when seriously ill was sig-
nificantly higher among those over age 65, and with lower education. Use of health carewas markedly lower among those with fewer household assets or a shortage of money,and those dissatisfied with their material resources, factors that explained some of theeffects of age. A lack of social support (formal and informal) decreases further theprobability of not consulting, adding to the consequences of poor financial status.
1927

The probability of seeking care for common conditions varies widely among coun-tries (persistent fever: 56 percent in Belarus; 16 percent in Armenia) and home rem-edies, alcohol, and direct purchase of pharmaceuticals are commonly used. Informalcoping strategies, such as use of connections (36.7 percent) or offering money to healthprofessionals (28.5 percent) are seen as acceptable.Conclusions. This article provides the first comparative assessment of inequalities inaccess to health care in multiple countries of the former Soviet Union, using rigorousmethodology. The emergingmodel across the region is extremely diverse. Some countries(Belarus, Russia) have managed to maintain access for most people, while in others thesituation is near collapse (Armenia, Georgia). Access ismost problematic in health systemscharacterized by high levels of payment for care and a breakdown of gate-keeping, al-though these are seen in countries facing major problems such as economic collapse and,in some, a legacy of civil war. There are substantial inequalities within each country andeven where access remains adequate there are concerns about its sustainability.
KeyWords. Utilization, access, Soviet Union, inequalities, out-of-pocket payments
A decade after the transition from communism, health systems in the countriesthat emerged from the Soviet Union have moved, at different speeds, awayfrom the Soviet model of health care. The Soviet system sought to achieveuniversal, free access to basic health services, centrally planned according tostrict norms with the goal of delivering services of uniform quality in all partsof the Soviet Union. Although it made considerable progress toward this goal,in reality, it was never fully achieved. Thus, in 1987, there were more thantwice as many physicians per thousand population (5.7 versus 2.7) in Georgiathan in Tajikistan, and infant mortality varied five-fold among the 15 republics,
We are grateful to all members of the LLH Study teams who participated in the coordination andorganization of data collection for this working paper. The LLHProject is funded by the EuropeanCommunity under the FP5 horizontal programme ‘‘Confirming the International Role of Com-munity Research’’ (INCO2-Copernicus; Contract No: ICA2-2000–10031, Project No: ICA2-1999–10074). However, the European Community cannot accept any responsibility for anyinformation provided or views expressed. Dina Balabanova and Martin McKee are members ofthe U.K. Department for International Development’s (DFID) Health Systems DevelopmentProgramme, within the framework of which these particular analyses were undertaken. TheDFIDsupports policies, programs, and projects to promote international development. The DFID pro-vided funds for this study as part of that objective but the views and opinions expressed are those ofthe authors alone.
Address correspondence to Dina Balabanova, London School of Hygiene and TropicalMedicine,Keppel St., London WC1E 7HT, U.K. Martin McKee and Joceline Pomerleau are also with theLondon School of Hygiene and Tropical Medicine. Richard Rose is with the Centre for the Studyof Public Policy, University of Strathclyde, Livingstone,Glasgow, U.K. Christian Haerpfer is withthe Institute for Advanced Studies, Vienna, Austria.
1928 HSR: Health Services Research 39:6, Part II (December 2004)
from 11.3 per 1,000 births in Latvia to 56.4 in Turkmenistan (Rowland andTelyukov 1991). In addition, although the Soviet health care system was oftenseen asmonolithic, therewere several parallel systems run by otherministries, forexample, for the defense forces and KGB, although they were relatively unim-portant numerically, with the Ministry of Health in Moscow responsible for 96percent of hospital beds and 94 percent of ambulatory care in the U.S.S.R. in thelate 1980s (Peoples Economy of the U.S.S.R. in 1989 1999). However there was somediversity among facilities under the control of the Ministry of Health, with thoseattached to major enterprises, such as factories, often receiving considerable sub-sidies from their associated enterprise while facilities for the Communist Partyelite in Moscow, also under the control of a section of the Ministry of Health,received substantially higher levels of funding. Finally, in part reflecting difficul-ties in communications and supply, individual accounts by health professionalssuggest that facilities were often less well developed in isolated rural areas, es-pecially in the far north where populations were nomadic, although despite theenormous problems involved, some basic services were always maintained inthese areas. Yet, in most respects, a physician moving from one part of theU.S.S.R. to another would be familiar with the overall operation of the system.
The events that accompanied the break up of the Soviet Union made itinevitable that this system would change, for two reasons. First, in manycountries there was a widespread rejection of the Soviet model, with its sym-bolic association with the communist system. Second, in many countries, theeconomic collapse caused by the disruption of production and trading rela-tionships and, in some cases, civil disorder, exacerbated by a widespreadbreak down in the power of the state, meant that government revenues wereno longer able to sustain the inherited system (Shishkin 1999).
The systems that have emerged vary considerably although all countrieshave formally retained the principle of universal access to care. Changes havebeen both planned and unplanned. Planned changes include a move to morepluralistic systems of both funding and delivery. New systems of funding haveincluded shifts to health insurance and expansion of out-of-pocket payments(Field 1999). Planned reforms of health care delivery include decentralizationof the organization of the system.
However, in many countries it is the unplanned changes that have beenmore important in shaping the new system. They include a substantial in-crease in informal payments in some countries (Lewis 2002) and a breakdownof existing systems for health system governance.
While there is extensive anecdotal evidence that access to care has suf-fered in this region, some small-scale studies indicating how particular groups,
Health Service Utilization in the Former Soviet Union 1929

such as those with chronic diseases, have suffered considerably (Hopkinsonet al. 2004; Telishevska, Chenet, and McKee 2001). Secondary analysis ofsurvey data revealed that 0.6 percent of households in Kyrgyzstan and 3.9percent in Ukraine faced catastrophic expenditure due to health costs in oneyear (Xu et al. 2003), and a recent study in Tajikistan documents large in-equalities in access to care related to affordability (Falkingham 2004). How-ever, there is, to our knowledge, no systematic research comparing howchanges in different ex-Soviet countries have affected access to health care.This study begins to fill this gap by examining patterns of health system uti-lization in eight former Soviet Union countries, exploring the socioeconomicdeterminants of utilization and the extent of payment for health care, lookingin detail at those who, despite illness, do not have access health care.
OBJECTIVE
The objective of this article is to assess the extent to which universal access tocare has been maintained in eight of the countries that emerged from theU.S.S.R. It is part of a larger study on living conditions, lifestyle, and health(LLH), undertaken within the European Union’s Copernicus program. Thestudy included surveys in eight of the fifteen newly independent states: Arme-nia, Belarus, Georgia, Kazakhstan, Kyrgyzstan, Moldova, Russia, and Ukraine(Institute for Advanced Studies 2003). Of the remaining countries, three (Es-tonia, Latvia, and Lithuania) are now members of the European Union and inthe other four (Azerbaijan, Tajikistan, Turkmenistan, and Uzbekistan) surveyresearch is extremely difficult and we were unable to identify local partners.
In this article we examine the health-seeking behavior of two groups ofpeople. The first are those who consult a health care provider (regardless ofwhether they have had experienced an illness), looking at the situations in whichthey consult, where, whether they pay for these services, and their views onwhenit is appropriate to seek care. The second group are those who, despite expe-riencing illness, did not consult, even though they felt they should have done so.
METHODS
In the autumn of 2001 quantitative cross-sectional surveys were conducted ineight countries (Armenia, Belarus, Georgia, Kazakhstan, Kyrgyzstan, Mold-ova, Russia, and Ukraine) by local organizations with expertise in surveyresearch, and using standardized methods (Living Conditions, Lifestyle andHealth Project n.d.). The methods have been described in detail elsewhere
1930 HSR: Health Services Research 39:6, Part II (December 2004)

(Pomerleau et al. 2003). In brief, each survey sought to include representativesamples of the national adult population aged 18 years and older, although afew small regions had to be excluded because of geographic inaccessibility,sociopolitical situation or prevailingmilitary actions: Abkhazhia andOsetia inGeorgia, the Trans-Dniester region and municipality of Bender in Moldova,and the Chechen and Ingush republics and the autonomous districts located inthe far north of the Russian Federation.
Samples were selected using multistage random sampling with stratifi-cation by region and area. Within each primary sampling unit, householdswere selected using standardized random route procedures, except in Arme-nia where random sampling from household lists was used. Within eachhousehold the adult with the nearest birthday was selected for interview.
It was decided to include at least 2,000 respondents in each country, butto boost this number to 4,000 in the Russian Federation, and to 2,500 inUkraine to reflect the larger and more regionally diverse populations in thosecountries. The combined dataset contained valid data on health-seekingbehavior for 18,428 individuals.
The first draft of the questionnaire was developed in consultation withcountry representatives from pre-existing surveys conducted in other transitioncountries and from the New Russia Barometer surveys (Post-Communist Ba-rometer Surveys n.d.) adjusted to the national context. It was developed in Eng-lish, translated into appropriate national languages, back translated to checkconsistency, and piloted in each country. The questionnaire covered a widerange of issues related to living conditions, lifestyle, and health, supplementedby an extensive battery of questions on sociodemographic and economiccharacteristics, experience of and attitudes to political transition, psychosocialcharacteristics, and social networks and support. This article utilizes responsesto questions on decisions to seek care, the circumstances of obtaining care, andcoping strategies substituting for formal treatment in the health system.
The questionnairewas administered by trained interviewers using face-to-face interviews conducted in respondents’ homes. Statistical analysis was un-dertaken using the Statistical Package for the Social Sciences (SPSS Inc. 2003).
RESULTS
Utilization Rates
In the preceding 12 months, in the sample as a whole, 52 percent of respond-ents visited a medical doctor, 5 percent visited a medical assistant ( feldsher),and 44 percent did not visit any health professional. When weighted for the
Health Service Utilization in the Former Soviet Union 1931

differing populations of the countries, the corresponding figures for them as aregional grouping are 61.1 percent, 4.3 percent, and 34.7 percent, respective-ly. However, the probability of attending a health professional in the previousyear varied widely across countries, ranging from 65.7 percent in Belarus to24.4 percent in Georgia (Figure 1).
Affordability and Access to Care
The first step in interpreting these figures is to separate those who did or didnot experience an episode of illness that they felt justified in consulting a healthprofessional. Overall, of those reporting an illness they felt justified seekingattention, 20.7 percent did not do so. The probability of not seeking attentionwhen it seemed justified varied greatly among countries (Figure 2). Only 9.4percent did not seek care in Belarus while the corresponding figures were 42.4percent in Armenia and 49 percent in Georgia.
The reasons cited for not seeking care, including alternative strategies tocope with the illness, among those who reported being ill but not obtainingcare (n5 2,478), were explored in more detail. Of respondents, 77.8 percentcited one reason, and 21.8 percent two or more reasons for not consulting.The most important reason for not seeking care was lack of money to pay fortreatment, at 45.2 percent. Reporting self-treating with home-produced
0%10%20%30%40%50%60%70%80%90%
100%B
elar
us
Rus
sia
Ukr
aine
Mol
dova
Kaz
akhs
tan
Kyr
gyzs
tan
Arm
enia
Geo
rgia
yes, a doctor yes, a medical attendant (feldsher ) no
Did you attend a health professional in the preceding 12 months?
Figure 1: Probability of Consulting a Health Care Professional in thePreceding Twelve Months, by Country
1932 HSR: Health Services Research 39:6, Part II (December 2004)

remedies was 32.9 percent and about a fifth (21.8 percent) purchasedmedicinedirectly from a pharmacist, without obtaining a doctor’s prescription. Reasonssuch as long waiting times to see a health professional (8.8 percent), or lackof trust in the health system in general or health professionals in particular(7.7 percent) were less common reasons for not consulting.
These aggregate results mask dramatic differences between countries(Table 1). The countries appear to fall into three groups. The first consists ofArmenia, Georgia, and Moldova, where unaffordability was particularlycommon, with 77.5 percent, 70 percent, and 53.6 percent, respectively, ofthose ill reporting being unable to afford to attend a skilled health worker. InBelarus, and Russia, few of those reporting having been ill said that they hadbeen unable to afford care. Kazakhstan and Ukraine occupied intermediatepositions, with about one in three people reporting illness unable to affordcare. In most countries the combined percentage of those reporting not seek-ing care but instead either self-treating or buying something from a pharmacistwas similar, with the precise division between the two options varying; theexceptions were Belarus and Kyrgyzstan, where these options were rarelyused.
Another perspective on the relationship between health and expend-iture can be obtained by asking whether the household had to do withoutnecessary medical services or drugs in the previous year because of afford-ability. If the figures from Table 1 concerning not seeking treatment because
0%10%20%30%40%50%60%70%80%90%100%
Geo
rgia
Arm
enia
Kaz
akhs
tan
Ukr
aine
Mol
dova
Kyr
gyzs
tan
Rus
sia
Bel
arus
Consulted Did not consult
Figure 2: Probability of Consulting a Health Care Professional (Physician orFeldsher) in the Preceding Twelve Months, by Country (of Those Reportingan Illness They Felt Justified Attendance)
Health Service Utilization in the Former Soviet Union 1933

Tab
le1:
Percentagesof
ThoseRep
ortingIllnessNot
SeekingCareforDifferentReasons
NoMoney
toPay
Self-Treatment
BoughtMedicine
from
aPharm
acist
NoTrustin
Staff
Qualifi
cation
VisitTakesToo
MuchTim
eOther
%N
%N
%N
%N
%N
%N
Arm
enia
77.5%
366
24.2%
114
10.0%
475.1%
241.5%
73.2%
15Geo
rgia
70.0%
332
10.3%
4925
.1%
119
1.1%
52.7%
133.2%
15Moldov
a53
.6%
127
38.8%
9221
.9%
525.1%
122.5%
63.4%
8Kazakhstan
34.8%
9243
.9%
116
31.8%
848.3%
2211
.0%
296.1%
16Ukraine
33.9%
118
39.7%
137
20.9%
7214
.2%
4910
.4%
3611
.6%
40Kyrgyzstan
26.4%
4316
.7%
6516
.7%
27–
–16
.7%
1110
0.0%
6Russia
11.0%
4246
.9%
177
26.8%
101
14.1%
5321
.0%
7917
.2%
65Belarus
0.7%
147
.4%
6528
.5%
3910
.9%
1520
.4%
2814
.6%
20
Note:Eachindividua
lcan
cite
morethan
onereason
fornot
seekingcare.
1934 HSR: Health Services Research 39:6, Part II (December 2004)

of inability to pay are comparedwith the percentages reporting that they neverhave to do without medical care or drugs (Table 2), then there is a generallyconsistent inverse relationship.
Another perspective can be gained by looking at respondents’ experi-ences in their most recent consultations. Overall, 31.2 percent of those whohad consulted paid out-of-pocket, whether in the form ofmoney, gifts, or both.In 3.6 percent of cases a fee was paid, but by the employer, and 65 percentmade no contribution. However, the figures vary widely among countries. Asexpected, the highest probability of making an out-of-pocket payment or a giftwas in Georgia and Armenia (65 percent and 56 percent, respectively), withthe lowest in Belarus and Russia, at 8 percent and 19 percent respectively(Figure 3). Among those who reported the value of the payment or gift, themedian amount was US$6.30.
Determinants of Utilization
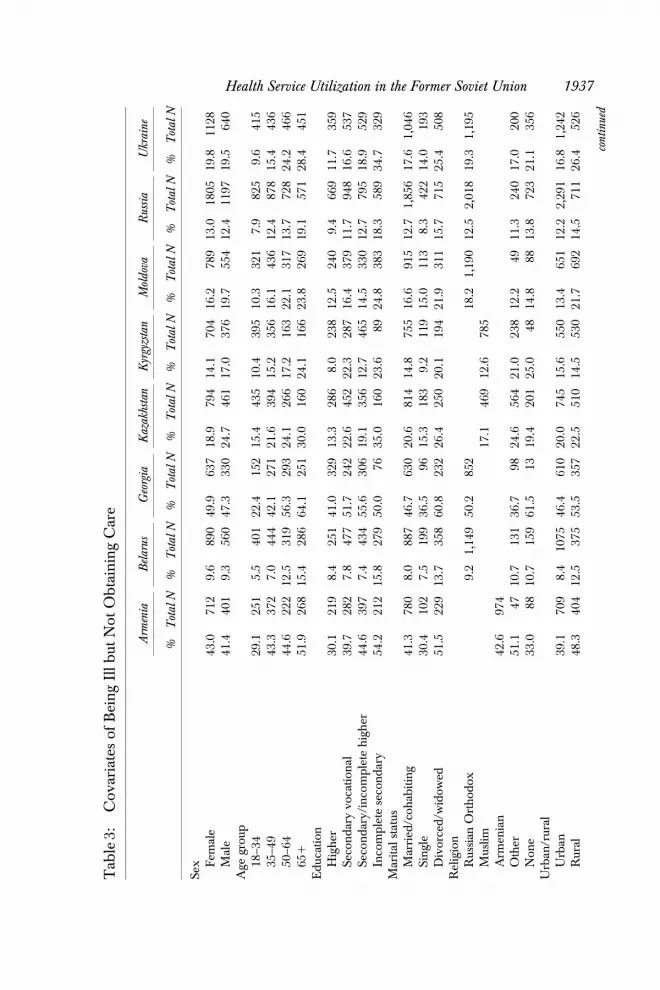
Those who report being ill but do not consult are of particular interest. Tounderstand their characteristics better, the analysis examined how the prob-ability of not consultingwhen ill varied with a range of covariates thatmight beexpected to exert an influence on health-seeking behavior (Table 3). Theprobability of not consulting was highest among those over age 65, those withlower educational attainment, or who were single, in all countries. In mostcountries those living in rural areas were less likely to obtain care when ill,although the relative difference between those in urban and rural settingsvaried. There is also a clear relationship with material status, with the prob-
Table 2: In the Previous Year Did Your Household Have to Do withoutMedical Services or Drugs (%)?
Medical Services Drugs
Constantly Sometimes Never Not Applicable Constantly Sometimes Never Not Applicable
Armenia 38.0 29.6 16.5 16.0 31.6 36.5 21.7 10.3Belarus 4.5 22.6 67.2 5.7 7.4 30.6 56.3 5.7Georgia 10.9 62.1 14.0 13.1 7.9 66.1 16.0 10.0Kazakhstan 12.9 36.7 40.9 9.6 15.2 37.7 40.7 6.5Kyrgyzstan 17.4 51.0 21.6 10.1 19.9 53.3 20.8 6.0Moldova 17.4 55.8 19.3 7.5 17.5 56.3 19.9 6.3Russia 11.3 27.4 53.4 8.0 16.8 32.0 45.5 5.7Ukraine 25.3 37.3 29.2 8.2 27.4 37.9 28.5 6.2
Health Service Utilization in the Former Soviet Union 1935

ability of consulting when ill increasing as the number of key household assetsincreased. The probability of consulting also increased with subjective meas-ures of well-being, such as satisfaction with income and material living con-ditions. These subjective measures have, elsewhere, been found to correlatebetter with health-related behavior than more ‘‘objective’’ measures of in-come, a finding that is unsurprising given the widespread informal economyand nonmonetary transactions in this region (Falkingham and Kanji 2000).
It is also plausible that health-seeking behavior will be influenced byfactors related to what has become termed broadly as social capital, includingthe extent of social support available to the individual. There is some evidencethat utilization is less among those with the least social support, for example,those who do not participate in organizations. Perceptions of freedomof choice or control over one’s life have less marked relationships withutilization.
Clearly, many of these variables are interrelated. Consequently theirinfluence was explored further by means of logistic regression, using SPSS.The dependent variable was the probability of not consulting a health pro-fessional among those reporting having been seriously ill. As no obvious dif-ferences among countries were seen in the univariate analyses, at least in termsof the nature of relationship between potential explanatory variables andhealth-seeking behavior, an aggregated dataset was used. Independent var-iables to be entered into the model were selected from among the variableslisted in Table 3, in the light of the univariate relationships exhibited, and ofevidence from literature on the determinants of health-seeking behavior. They
0
10
20
30
40
50
60
70
Belarus Russia Ukraine Kazakh-stan
Kyrgyzstan Moldova Armenia Georgia
% p
ayin
g
Figure 3: Percentage Paying Informally orMaking a Gift duringMost RecentConsultation, by Country
1936 HSR: Health Services Research 39:6, Part II (December 2004)
Tab
le3:
Cov
ariatesof
BeingIllb
utNot
ObtainingCare
Arm
enia
Belarus
Georgia
Kazakhstan
Kyrgyzstan
Moldova
Russia
Ukraine
%Total
N%
Total
N%
Total
N%
Total
N%
Total
N%
Total
N%
Total
N%
Total
N
Sex Fem
ale
43.0
712
9.6
890
49.9
637
18.9
794
14.1
704
16.2
789
13.0
1805
19.8
1128
Male
41.4
401
9.3
560
47.3
330
24.7
461
17.0
376
19.7
554
12.4
1197
19.5
640
Age
grou
p18
–34
29.1
251
5.5
401
22.4
152
15.4
435
10.4
395
10.3
321
7.9
825
9.6
415
35–4
943
.337
27.0
444
42.1
271
21.6
394
15.2
356
16.1
436
12.4
878
15.4
436
50–6
444
.622
212
.531
956
.329
324
.126
617
.216
322
.131
713
.772
824
.246
665
151
.926
815
.428
664
.125
130
.016
024
.116
623
.826
919
.157
128
.445
1Education
Higher
30.1
219
8.4
251
41.0
329
13.3
286
8.0
238
12.5
240
9.4
669
11.7
359
Secondaryvo
cation
al39
.728
27.8
477
51.7
242
22.6
452
22.3
287
16.4
379
11.7
948
16.6
537
Secondary/incomplete
higher
44.6
397
7.4
434
55.6
306
19.1
356
12.7
465
14.5
330
12.7
795
18.9
529
Incomplete
secondary
54.2
212
15.8
279
50.0
7635
.016
023
.689
24.8
383
18.3
589
34.7
329
Marital
status
Married
/coh
abiting
41.3
780
8.0
887
46.7
630
20.6
814
14.8
755
16.6
915
12.7
1,85
617
.61,04
6Single
30.4
102
7.5
199
36.5
9615
.318
39.2
119
15.0
113
8.3
422
14.0
193
Divorced/w
idow
ed51
.522
913
.735
860
.823
226
.425
020
.119
421
.931
115
.771
525
.450
8Religion
Russian
Orthod
ox9.2
1,14
950
.285
218
.21,19
012
.52,01
819
.31,19
5Muslim
17.1
469
12.6
785
Arm
enian
42.6
974
Other
51.1
4710
.713
136
.798
24.6
564
21.0
238
12.2
4911
.324
017
.020
0Non
e33
.088
10.7
159
61.5
1319
.420
125
.048
14.8
8813
.872
321
.135
6Urban
/rural
Urban
39.1
709
8.4
1075
46.4
610
20.0
745
15.6
550
13.4
651
12.2
2,29
116
.81,24
2Rural
48.3
404
12.5
375
53.5
357
22.5
510
14.5
530
21.7
692
14.5
711
26.4
526
continued
Health Service Utilization in the Former Soviet Union 1937

Tab
le3.
Continued
Arm
enia
Belarus
Georgia
Kazakhstan
Kyrgyzstan
Moldova
Russia
Ukraine
%Total
N%
Total
N%
Total
N%
Total
N%
Total
N%
Total
N%
Total
N%
Total
N
Possessionof
assets
5assets
19.8
101
6.5
387
20.5
8312
.821
910
.511
49.4
128
8.6
765
10.8
268
4assets
27.5
153
5.8
326
35.6
101
17.3
226
3.5
113
8.7
184
9.2
588
11.9
268
3assets
40.0
235
11.4
352
44.0
150
22.4
339
15.3
216
13.0
284
13.5
680
16.4
428
2assets
48.8
248
10.3
214
49.2
197
23.0
296
16.6
223
17.4
276
14.6
561
21.1
383
1assets
44.8
221
15.5
8453
.725
730
.611
119
.523
121
.619
018
.625
829
.728
3Noassets
61.4
153
21.4
5666
.916
636
.050
17.6
182
31.3
252
30.4
112
47.2
53Materialliv
ingconditions
Mon
eyen
ough
fordurab
les/luxu
ries
3.6
286.4
313
24.6
6912
.827
47.2
181
11.6
138
6.6
693
9.9
181
Mon
eyen
ough
fornutritio
n/basicitem
s31
.948
69.7
969
42.5
433
18.8
780
15.1
642
15.4
805
12.9
1867
15.9
1002
Mon
eynot
enou
gheven
fornutrition
53.4
581
11.1
126
59.6
441
44.4
180
21.2
245
25.9
367
22.1
403
28.8
541
Self-assessed
finan
cial
status
Verygo
od/goo
d11
.127
9.7
134
15.0
2012
.418
67.4
204
7.6
925.9
239
9.7
72Average
31.0
393
7.1
900
37.8
299
18.5
736
14.3
588
14.3
615
10.8
1682
14.9
685
Bad
49.4
419
12.8
328
55.1
432
30.2
291
20.3
236
21.6
449
16.3
876
20.0
654
Verybad
51.5
266
18.6
5957
.919
548
.635
28.6
4926
.216
821
.618
530
.532
8Freed
omof
choice
&control
over
life
High
41.8
576
9.2
741
40.1
464
18.5
627
15.2
659
16.0
582
10.5
1361
18.4
636
Med
ium
42.4
347
9.5
440
59.7
283
19.4
377
14.0
136
15.0
386
12.8
938
19.2
579
Low
46.9
128
7.5
160
52.8
127
32.1
190
15.4
208
20.2
208
16.0
487
21.3
380
Mem
bership
inorganizations
Yes
31.1
746.2
503
37.5
4810
.322
310
.616
111
.528
77.3
763
12.5
313
No
43.2
1,03
911
.294
649
.691
723
.41,03
215
.991
919
.31,05
614
.62,23
321
.21,45
3Su
pportscore
Exten
sive
30.7
231
7.3
586
2817
512
.340
711
.545
311
.429
88.7
971
12.4
468
Goo
d37
.726
85.7
209
41.5
130
20.9
254
15.9
138
15.3
249
11.2
492
18.0
256
Some
48.9
229
11.3
151
57.1
112
32.3
167
15.3
137
16.0
237
13.2
423
24.2
219
Non
e53
.126
213
.621
360
.628
433
.520
319
.020
025
.631
619
.351
424
.940
5TOTAL
42.4
2,00
09.5
2,00
049
2,02
221
.02,00
015
.12,00
017
.72,00
012
.84,00
619
.72,40
0
1938 HSR: Health Services Research 39:6, Part II (December 2004)

were then grouped logically into several broad categories: sociodemographic(sex, age, education, and marital status); financial status (financial resources,number of assets, self-assessed financial status); and social support systems(a composite index of freedom of choice and control over life, membership inorganizations, and a composite index of social support). The composite in-dices were taken from an earlier study using this dataset, looking at responsesto transition. Each block was then entered stepwise, with forward selectionaccording to likelihood ratio. Threemodels were created entering one to threeblocks of variables. The results are shown in Table 4.
In the model containing sociodemographic variables, the probability ofnot seeking care increased with age, with those over age 65 being more thanthree times more likely not to seek care compared to those under age 35.Education was also important, with lower use among those with lower ed-ucation. Gender and marital status were not independently important. Whenfinancial factors were added to the model, the influence of age was reduced.Use of health care was markedly lower among those with fewer assets orshortage of money.
The third model added area of residence, confirming the relative ad-vantage of those in urban areas who, after taking sociodemographic and eco-nomic factors into account, were 20 percent more likely to obtain care. Theaddition of variables related to social support increase explanatory powerfurther, although also reducing the influence of age and financial status. For-mal social support, defined as membership in organizations of any kind, is animportant determinant of seeking care, as is the composite index of socialsupport, while control over one’s life was not important.
Care Settings
In the Soviet system, primary care was provided in two types of facilities:primary health care facilities, which were policlinics in urban areas and healthposts in rural settings, each covering specified catchment areas, and in occu-pational facilities, for those employed in specific sectors of the economy. In sixcountries,more than 60 percent of those respondents who had received care inthe previous year experienced their most recent contact with a health pro-fessional in one of these settings, with most contacts taking place in their localfacilities (Figure 4). The exceptions were Armenia (53 percent) and Georgia(41 percent). In both of these countries, where as it was shown in Figure 1 theoverall probability of consulting was lowest, the explanation seems to be amuch lower use of district facilities.
Health Service Utilization in the Former Soviet Union 1939

Tab
le4:
OddsRatiosof
BeingIlla
ndObtainingCare:
AllCou
ntries(O
nly
VariablesInclud
edin
theMod
elSh
own
Block
1:Sociodem
ographic
Blocks1&
2:Financial
Status
Blocks1,
2,&
3:Urban/Rural
Block
1,2,
3,&
4:Su
pportSystem
s
Oddsratio
95%
CI
Oddsratio
95%
CI
Oddsratio
95%
CI
Oddsratio
95%
CI
Sex Fem
ale
1.00
1.00
1.00
Male
1.14
1.04
–1.26
1.13
1.03
–1.25
1.18
1.05
–1.32
po0.01
p50.01
4po
0.01
Age
grou
p18
–34
1.00
1.00
1.00
1.00
35–4
91.85
1.61
–2.12
1.48
1.28
–1.71
1.48
1.28
–1.71
1.5
1.28
–1.76
50–6
42.49
2.16
–2.86
1.75
1.51
–2.04
1.82
1.56
–2.11
1.6
1.35
–1.9
651
3.18
2.73
–3.69
1.83
1.57
–2.13
1.98
1.69
–2.33
1.72
1.43
–2.06
po0.00
1po
0.00
1p50.04
5po
0.00
1Education
Higher
1.00
Secondaryvo
catio
nal
1.33
1.16
–1.52
Secondary/incomplete
higher
1.55
1.35
–1.77
Incomplete
secondary
1.50
1.29
–1.74
po0.00
1Assets
5assets
1.00
1.00
1.00
4assets
1.09
0.88
–1.33
1.06
0.86
–1.3
0.96
0.78
–1.23
3assets
1.47
1.22
–1.76
1.43
1.18
–1.72
1.31
1.07
–1.62
2assets
1.66
1.38
–2.01
1.62
1.34
–1.96
1.37
1.11
–1.69
1assets
2.16
1.78
–2.64
2.02
1.65
–2.47
1.61
1.28
–2.02
Noassets
2.92
2.35
–3.61
2.66
2.13
–3.31
2.16
1.68
–2.77
po0.00
1po
0.00
1po
0.00
1
1940 HSR: Health Services Research 39:6, Part II (December 2004)

Wealth
Mon
eyen
ough
fordurab
les/luxu
ries
1.00
1.00
1.00
Mon
eyen
ough
fornutrition
/basic
items
1.30
1.07
–1.57
1.29
1.06
–1.56
1.28
1.03
–1.59
Mon
eynot
enou
gheven
fornutritio
n2.35
1.88
–2.94
2.32
1.85
–2.9
2.26
1.76
–2.9
po0.00
1po
0.00
1po
0.00
1Se
lf-assessedfin
ancial
status
Verygo
od/goo
d1.00
1.00
1.00
Average
1.32
1.02
–1.70
1.34
1.03
–1.73
1.17
0.89
–1.54
Bad
1.69
1.29
–2.21
1.77
1.35
–2.31
1.54
1.15
–2.05
Verybad
2.01
1.50
–2.68
2.14
1.6–
2.86
1.85
1.35
–2.55
po0.00
1po
0.00
1po
0.00
1Urban
/rural
Rural
1.00
1.00
Urban
1.22
1.10
–1.36
1.18
1.05
–1.33
po0.00
1Mem
bership
inorganizations
Yes
1.00
No
2.21
1.86
–2.62
po0.00
1Su
pportscore
Exten
sive
1.00
Goo
d1.44
1.22
–1.68
Some
1.69
1.44
–1.99
Non
e1.77
1.52
–2.05
po0.00
1
Health Service Utilization in the Former Soviet Union 1941

In Georgia, the lower use of district primary care facilities is, to someextent, counterbalanced by a much higher use of private facilities, with 16percent of last contacts in this sector, compared with a maximum of 6 percent(Kazakhstan) in the other countries.
Utilization in Different Hypothetical Scenarios
The analyses so far have looked at actual behavior in relation to episodes ofillness, with the nature of the illness undefined (of necessity, given the vastrange of possible conditions and the difficulty of categorizing them for anal-ysis). Another way to assess experience of obtaining care (combining infor-mation that respondents will have obtained from their own experiences andthose of friends and relations) is to ask what they would do when faced with arange of common health conditions. The situations in which formal medicaladvice ismost likely to be sought include fever lastingmore than three days (38percent), abdominal pain (24 percent), and chest pain (18 percent). Self-treat-ment, including use of home remedies and alcohol, is especially common incases of cough or diarrhea, but is widely used for all complaints. Purchase ofpharmaceuticals without prescription is also common, especially for head-ache, bad cough, and diarrhea.
Differences between countries were explored in more detail by focusingonly on the three conditions perceived to be most likely to justify seekingcare (chest pains, abdominal pains, fever lasting more than three days). The
0
10
20
30
40
50
60
70
Belarus Moldova Russia Kazakhstan Kyrgyzstan Ukraine Armenia Georgia
medical post/local policlinic hospital/specialized facilityoccupational facility private facilitypatient's home
Figure 4: Location of Most Recent Encounter with a Health Professional
1942 HSR: Health Services Research 39:6, Part II (December 2004)

probability of seeking care varies widely among countries.Whereas in Belarus56 percent would consult with a health professional where there was a pro-longed fever, only 16 percent would do so in Armenia (Figure 5).
Health-seeking behavior was explored further by asking what someoneshould do if theywere in need of urgent hospitalization but were told that therewas a waiting list of several months. The most frequently mentioned course ofaction was using informal mechanisms, such as use of connections (36.7 per-cent) or offering health professionals money (28.5 percent). More transparentstrategies such as seeking to persuade hospital staff or lodging a complaintscoredmuch lower on the list. Another 7.8 percent would turn to alternative ortraditional healers and 15.2 percent believed there was nothing they could do.The percentage of those saying they would pay or use connections varied(Figure 6) but there was no clear pattern, so that the figures were similar inBelarus and Georgia, despite very different access to care in the two countriesas shown by responses to earlier questions.
DISCUSSION
The creation of the Soviet health care system was, by any standards, a re-markable achievement. Prior to the liberation of the serfs in 1861, health carein rural Russia was virtually nonexistent. The situation began to change in
0
10
20
30
40
50
60
Belarus Kyrgyzstan Moldova Russia Kazakhstan Ukraine Georgia Armenia
Per
cent
age
Fever for more than 3 days Abdominal pain Chest pains
Figure 5: Would You Consult a Health Professional in the Case of . . . ?
Health Service Utilization in the Former Soviet Union 1943

1864 when Czar Alexander II initiated a system of local government, theZemstvos, with responsibility for, among other things, health (Krug 1976). Yetwhile these entities achieved much, by the end of the nineteenth century thesituation in many remote areas remained dire, as described eloquently bycommentators such as Anton Chekhov (1987).
The Bolsheviks placed a high priority on health, initially emphasizingprevention in the face of widespread epidemics of typhus following the civilwar.Over time the Soviet government built up awidespread network of healthfacilities and, while the quality of care was always better in cities than in ruralareas (Davis 1979), it didmanage to deliver universal access to basic care to anextremely dispersed population (Field 1957). Yet by the 1980s the weaknessesin the system were already apparent (Field 2002). The failing Soviet economycould not provide the increasingly technical model of health care emerging inthe West (Prager 1987). Yet while access to modern, technically sophisticatedhealth care varied, the system still managed to provide at least basic care to all,an achievement that, in many of the newly independent states, would notsurvive the break-up of the Soviet Union.
This article provides the first detailed comparative assessment of accessto health care in a majority of the former Soviet republics. Its strength is its useof standardized questionnaires administered simultaneously, with large sam-ples in eight countries, several of which have been the subject of virtually
0
5
10
15
20
25
30
35
40
45
50
Georgia Belarus Russia Kazakhstan Armenia Moldova Ukraine Kyrgyzstan
offer money
use connections
Per
cent
age
Figure 6: What Would You Do if You Needed Hospitalization but WereTold There Was a Long Waiting Time?
1944 HSR: Health Services Research 39:6, Part II (December 2004)

no such research until now. The samples appear largely representative ofnational populations in terms of common demographic variables, althoughthere does seem to be a slight underrepresentation of men in Armenia andUkraine, of the urban population in Armenia, and of the rural population inKyrgyzstan; and the oldest age groups are slightly overrepresented in Arme-nia,Moldova, andUkraine. However, these deviations areminor and unlikelyto affect the results significantly. Yet we must also be aware that comparisonswith official data may be limited by the failure of some country data to fullycapture posttransition migration and other factors (Badurashvili et al. 2001)and we cannot exclude the possibility that, as with all surveys in the formerSoviet Union, we will havemissed groups living on themargins of society whoare especially difficult to reach. Consequently it is plausible that these findingsunderestimate the scale of problems that exist.
Its weaknesses are common to all population-based surveys of healthcare utilization. To fully understand the process of seeking health care it isnecessary to have detailed information on pretreatment health status as well asutilization. Furthermore, given the many factors other than simply healthstatus that influence whether an individual will seek care for a particular con-dition, it is important to supplement quantitative data with qualitative re-search. Such research is being undertaken as part of the larger project withinwhich these surveys were undertaken and will be reported subsequently. An-other weakness is the use of 12-month recall periods, necessitated by the needto identify adequate numbers of people reporting illness in each country.Ideally, the samples would have been much larger and would have focusedon a period of only four weeks. Another limitation is that respondents definedwhether an episode of illness justified seeking health care; although in a surveythis is the only feasible approach, clearly the criteria used will be shaped byexpectations and experiences. Unsurprisingly, the probability of having anepisode of illness that met these self-defined criteria varied, and in the waysthat would be expected, with 48 percent of the Georgian sample so respond-ing, compared with 73 percent of the Belarusian sample. It is, of course,impossible to say whether respondents from Belarus are therefore overusingservices or Georgians are underusing them; it is, however, clear that thethreshold for considering seeking care varies, with the barrier highest in thecountries where the system seems to be functioning least well. This also im-plies that, as with the challenge of including hard to reach populations, thefindings underestimate the scale of the problem where the situation is worst.However, the inclusion of questions about the hypothetical circumstances inwhich it is appropriate to seek care to some extent overcomes this limitation.
Health Service Utilization in the Former Soviet Union 1945

The surveys also are not sufficiently large to yield meaningful subnationalresults. For example, the implementation of health insurance has variedamong regions in Russia (Twigg 1999) and it is highly likely that similardifferences exist elsewhere.
The data confirm the impression that, while some countries have man-aged to maintain access to some form of care for most people, in others thesituation is near to collapsing. In Belarus, a country that has undergone verylittle economic reform and has retained many features of the Soviet system(Karnitski 1997), albeit in a situation of sustained economic decline and in-creasing isolation, health services remain affordable for virtually everyone.Two-thirds of households stated that they never had to do without health carebecause of cost, and this is in a country where the threshold for seeking care ismuch lower than in other countries. In contrast, in Georgia, a country that hassuffered a civil war andwhere the government is not in control of some regions(Gamkredlidze et al. 2003), only 14 percent of households report never havingto do without care because of cost. Access to care also seems to have remainedgenerally affordable in Russia, by far the largest and wealthiest of the countriesincluded. The pattern of affordability of drugs is similar to that of access tocare. Problems are less frequent in Russia and Belarus, but few households inArmenia, Georgia, Kyrgyzstan, or Moldova are entirely free of problems.
When the aggregate figures are broken down according to the charac-teristics of respondents it is apparent that there are substantial inequalities ineach country. Thus, in Georgia and Armenia, among those in the group withfewest household assets, about two-thirds of respondents had not sought caredespite being ill because they could not afford it. While the multivariate anal-ysis confirms how, taking account of other variables, those with fewest re-sources are most disadvantaged, it also shows that financial resources are notthe only factor and others, such as social support systems, play a role, an issuethat will be returned to later.
In most countries the referral system appears to have remained intact,with most people receiving care in their local or workplace primary carefacility. The exception is Georgia, where a relatively high proportion of themost recent visits have been in hospitals. This provides further evidence of thebreakdown of the Georgian health system (Gamkredlidze et al. 2003). Thisimpression receives more support from the question on paying for care, withtwo-thirds of Georgian respondents paying or making a gift during their mostrecent consultation. Once again, the lowest figure is in Belarus, at fewer than10 percent. Other work has shown that the phenomenon of informal paymentis extremely complex,with its nature varying according to context (Balabanova
1946 HSR: Health Services Research 39:6, Part II (December 2004)

and McKee 2002). Consequently, it is not possible to understand fully what ishappening from a survey such as this. Instead, there is a need formore detailedqualitative and quantitative research on this subject. It is also of interest to notethat, despite the considerable variation in the frequency of paying in differentcountries, when faced with a hypothetical situation of being unable to obtainnecessary treatment, the proportion of respondents saying they would eitherpay or use connections is relatively similar. Earlier work in Russia has shownthe importance of using connections to obtain health care, especially amongthe higher socioeconomic groups, although the situation is not entirely clear-cut, as some less well-off families benefit by having a family member who is,for example, a driver for a senior doctor (Brown and Rusinova 1997). Thissocial stratification is also apparent in the present study. While 25 percent ofthose with insufficient resources for nutrition would use connections, 53 per-cent of those with sufficient resources for luxuries would do so. As might beexpected, those who are members of organizations are more likely to say theywould use connections than those who are not (44 percent versus 35 percent).Unsurprisingly, there is also a difference in the proportion of respondentswho would pay, although the gap is narrower, at 24 percent and 40 percent,respectively.
The former Soviet Union is, with sub-Saharan Africa, one of only twomajor regions where life expectancy is currently declining (McMichael et al.2004). The Soviet health system, despite its many weaknesses, did achievebasic universal coverage. While some of the Soviet Union’s successor coun-tries, such as the three Baltic republics (not included in this study) are nowexperiencing sustained economic growth and falling mortality, elsewhere thesituation has deteriorated considerably and the prospects for the future arepoor, with the situation especially adverse in the Caucasus republics (Armenia[Hovhannisyan et al. 2001] and Georgia [Gamkredlidze et al. 2003]). Yet evenwhere the system still seems to be functioning, as in Belarus, there are nogrounds for complacency. While recognizing the need for caution in inter-preting economic statistics in this region, Belarus’s gross national product percapita has fallen by almost two-thirds in a decade; it seems unlikely that itssocial protection systems can be sustained in the medium term. In Russia,where there has been a relatively successful (at least compared with other post-Soviet republics) transition to health insurance, some vulnerable groups re-main without coverage (Balabanova, Falkingham, and McKee 2003). Vari-ations in access to health care received little attention during the Soviet period(Tkatchenko, McKee, and Tsouros 2000) and, posttransition, there has stillbeen relatively little research on how different groups have fared in the face of
Health Service Utilization in the Former Soviet Union 1947

the changes to health systems in this region, with the notable exception ofRussia (Field and Twigg 2000). Yet many of these countries face similarproblems and there is room for shared learning. This study seeks to facilitatethis process.
REFERENCES
Badurashvili, I.,M.McKee, G. Tsuladze, F.Mesle, J. Vallin, andV. Shkolnikov. 2001.‘‘Where There Are No Data: What Has Happened to Life Expectancy in Geor-gia since 1990?’’ Public Health 115: 394–400.
Balabanova, D., J. Falkingham, and M. McKee. 2003. ‘‘Winners and Losers: TheExpansion of Insurance Coverage in Russia in the 1990s.’’ American Journal ofPublic Health 93: 2124–30.
Balabanova, D., and M. McKee. 2002. ‘‘Understanding Informal Payments for HealthCare: The Example of Bulgaria.’’ Health Policy 62: 243–73.
Brown, J. V., and N. L. Rusinova. 1997. ‘‘Russian Medical Care in the 1990s: A User’sPerspective.’’ Social Science Medicine 45: 1265–76.
Chekhov, A. P. 1987. The Island: A Journey to Sakhalin. London: Pimlico.Davis, C. 1979. The Economics of the Soviet Health System. Cambridge, U.K.: Cambridge
University Press.Falkingham, J. 2004. ‘‘Poverty, Out-of-Pocket Payments and Access to Health Care:
Evidence from Tajikistan.’’ Social Science Medicine 58: 247–58.Falkingham, J., and S. Kanji. 2000. ‘‘Measuring Poverty in Russia: A Critical Review.’’
DFID working paper (available through [email protected]).Field, M. G. 1957. Doctor and Patient in Soviet Russia. Cambridge, MA: Harvard Uni-
versity Press.——————. 1999. ‘‘Reflections on A Painful Transition: From Socialized to Insurance
Medicine in Russia.’’ Croatian Medical Journal 40: 202–9.——————. 2002. ‘‘The Soviet Legacy: The Past as Prologue.’’ InHealth Care in Central Asia,
edited by M. McKee, J. Healy, and J. Falkingham, pp. 67–75. Buckingham:Open University Press.
Field, M. G., and J. L. Twigg. 2000. Russia’s Torn Safety Nets: Health and Social WelfareDuring the Transition. New York: St. Martin’s Press.
Gamkredlidze, A., R. Atun, G. Gotsadze, and L. MacLehose. 2002.Health Care Systemsin Transition: Georgia. Copenhagen: European Observatory on Health CareSystems.
Hopkinson, B., D. Balabanova, M. McKee, and J. Kutzin. 2004. ‘‘The Human Per-spective on Health Care Reform: Coping with Diabetes in Kyrgyzstan.’’ Inter-national Journal of Health Planning Management 19: 43–61.
Hovhannisyan, S. G., E. Tragakes, S. Lessof, H. Aslanian, and A. Mkrtchyan. 2001.Health Care Systems in Transition: Armenia. Copenhagen: European Observatoryon Health Care Systems.
Institute forAdvanced Studies. 2003.EU-Copernikus Project Living Conditions Lifestyle andHealth. Vienna: Institute for Advanced Studies. Available at: http://www.llh.at.
1948 HSR: Health Services Research 39:6, Part II (December 2004)

Karnitski, G. 1997. Health Care Systems in Transition: Belarus. Copenhagen: EuropeanObservatory on Health Care Systems.
Krug, P. 1976. ‘‘The Debate over the Delivery of Health Care in Rural Russia: TheMoscow Zemstvo, 1864–1878.’’ Bulletin of the History of Medicine 50: 226–41.
Lewis, M. 2002. ‘‘Informal Health Payments in Central and Eastern Europe and theFormer Soviet Union: Issues, Trends and Policy Implications.’’ In Funding HealthCare, European Observatory on Health Care Systems Series, edited by E. Mossialos,A.Dixon, J. Figueras, and J. Kutzin, pp. 184–205. Buckingham:OpenUniversityPress.
Living Conditions, Lifestyle and Health Project. Available at http://www.llh.at/llh_partners_start.html [accessed December 14, 2003].
McMichael, A. J., M. McKee, V. Shkolnikov, and V. Valkonen. 2004. ‘‘MortalityTrends and Setbacks: Global Convergence——or Divergence?’’ Lancet 363(9415): 1155–9.
Peoples Economy of the USSR in 1989. 1990. Moscow: Finances and Statistics Publishers.Pomerleau., J., M. McKee, R. Rose, D. Balabanova, and A. Gilmore. 2003. ‘‘Living
Conditions Lifestyles andHealth.’’Work Package no. 26 (working paper no. 10):Comparative health report. Available at: http://www.llh.at [accessed July 16,2003].
Post-Communist Barometer Surveys. Glasgow: Centre for the Study of Public Policy, Uni-versity of Strathclyde. Available at: http://www.cspp.strath.ac.uk.
Prager, K. M. 1987. ‘‘Soviet Health Care’s Critical Condition.’’ The Wall Street Journal,29 January, p. 28.
Rowland, D., and A. V. Telyukov. 1991. ‘‘Soviet Health Care from Two Perspectives.’’Health Affairs (Millwood) 10 (3): 71–86.
Shishkin, S. 1999. ‘‘Problems of Transition from Tax-Based System of Health CareFinance to Mandatory Health Insurance Model in Russia.’’ Croatian MedicalJournal 40: 195–201.
SPSS Inc. 2003. SPSS 12.0 for Windows. Chicago: SPSS Inc.Telishevska, M., L. Chenet, and M. McKee. 2001. ‘‘Towards an Understanding of the
High Death Rate among Young People with Diabetes in Ukraine.’’ DiabetesMedicine 18: 3–9.
Tkatchenko, E., M. McKee, and A. D. Tsouros. 2000. ‘‘Public Health in Russia: TheView from the Inside.’’ Health Policy Planning 15: 164–9.
Twigg, J. L. 1999. ‘‘Regional Variation in Russian Medical Insurance: Lessons fromMoscow and Nizhny Novgorod.’’ Health Place 5: 235–45.
Xu, K., D. B. Evans, K. Kawabata, R. Zeramdini, J. Klavus, and C. J. Murray. 2003.‘‘Household Catastrophic Health Expenditure: A Multicountry Analysis.’’ Lan-cet 362: 111–7.
Health Service Utilization in the Former Soviet Union 1949

1950


