Embed Size (px)
Citation preview

i n t e r n a t i o n a l j o u r n a l o f h y d r o g e n e n e r g y 3 5 ( 2 0 1 0 ) 1 2 1 2 5 – 1 2 1 3 3
Avai lab le a t www.sc iencedi rec t .com
j ourna l homepage : www.e lsev ier . com/ loca te /he
High power fuel cell simulator based on artificialneural network
Abraham U. Chavez-Ramırez c, Roberto Munoz-Guerrero c, S.M. Duron-Torres d,M. Ferraro b, G. Brunaccini b, F. Sergi b, V. Antonucci b, L.G. Arriaga a,*a Centro de Investigacion y Desarrollo Tecnologico en Electroquımica S.C., Parque Tecnologico Queretaro, Sanfandila,
Pedro Escobedo, Queretaro, Mexicob CNR-ITAE, Via Salita S. Lucia sopra Contesse 5-98126 Messina, Italyc Departamento de Ingenierıa Electrica, CINVESTAV-IPN. Av. Instituto Politecnico Nacional No. 2508, D.F. CP 07360, Mexicod Unidad Academica de Ciencias Quımicas, Universidad Autonoma de Zacatecas, Campus Siglo XXI, Edif. 6, Mexico
a r t i c l e i n f o
Article history:
Received 7 April 2009
Received in revised form
17 July 2009
Accepted 14 September 2009
Available online 24 October 2009
Keywords:
Artificial neural network (ANN)
Polymeric electrolyte membrane fuel
cell (PEMFC)
Backpropagation (BP)
Modeling
* Corresponding author. Tel.: þ52 4422116069E-mail address: [email protected] (L.G
0360-3199/$ – see front matter ª 2009 Profesdoi:10.1016/j.ijhydene.2009.09.071
a b s t r a c t
Artificial Neural Network (ANN) has become a powerful modeling tool for predicting the
performance of complex systems with no well-known variable relationships due to the
inherent properties. A commercial Polymeric Electrolyte Membrane fuel cell (PEMFC) stack
(5 kW) was modeled successfully using this tool, increasing the number of test into the 7
inputs – 2 outputs-dimensional spaces in the shortest time, acquiring only a small amount
of experimental data. Some parameters could not be measured easily on the real system in
experimental tests; however, by receiving the data from PEMFC, the ANN could be trained
to learn the internal relationships that govern this system, and predict its behavior without
any physical equations. Confident accuracy was achieved in this work making possible to
import this tool to complex systems and applications.
ª 2009 Professor T. Nejat Veziroglu. Published by Elsevier Ltd. All rights reserved.
1. Introduction analytical voltage versus current density correlation. Semi-
A fuel cell is an electrochemical device which converts
chemical energy into electrical and thermal energy; Polymer
Electrolyte Membrane Fuel Cell (PEMFC) has become popular
as power source due of its environmental friendliness and
high efficiency. Several models have been proposed to simu-
late this kind of fuel cell systems based in physicochemical
phenomena. Analytical models are an adequate tool to
understand the effect of basic variables on fuel cell perfor-
mance. Many simplifying assumptions are made concerning
variable profiles within the cell to develop an approximate
; fax: þ52 4422116008.. Arriaga).sor T. Nejat Veziroglu. Pu
empirical models allow designers and engineers to predict the
fuel cell performance as a function of different operating
conditions (such as pressure, temperature or fuel concentra-
tion) using simple empirical equations. Mechanistic models
are transport models using differential and algebraic equa-
tions whose derivation is based in the electrochemistry and
physics governing the phenomena taking place in the cell
[1,2]. These models demand high level of knowledge of the
process parameters and even though many assumptions
must be made in order to simplify them, unfortunately several
of these models are not accurate enough. Nevertheless it is
blished by Elsevier Ltd. All rights reserved.

Fig. 1 – A multi-layer perceptron artificial neural network.
Table 1 – Current stack, and gas flows combinations forthe ANN learning set.
i n t e r n a t i o n a l j o u r n a l o f h y d r o g e n e n e r g y 3 5 ( 2 0 1 0 ) 1 2 1 2 5 – 1 2 1 3 312126
possible to achieve performance modeling using black-box
models. These models are based on a set of measurable input
parameters as current, mass flows, temperature and water
flow and they predict the behavior of interesting output
parameters such as voltage, and water out temperature. This
paper describes the development of an alternative modeling
proposal for PEMFC system based on Artificial Neural Network
(ANN). Few works of this kind have been reported, Arrigada et
al. [3] applied ANN as a modeling tool for evaluation of solid
oxide fuel cell performance; Wong-Yong Lee et al. [4] trained
ANN models to fit experimental data obtained in a 300 cm2
single cell in H2/air operation using Nafion 115 and Nafion
1135 membrane electrolytes. The models take into account
not only the current density but also the process variations,
such as the gas pressure, temperature, humidity, and utili-
zation to cover operating processes which are important
factors in determining the real performance of fuel cells. Jemei
et al. [5] proposed a model of PEMFC system of 500 W under
12 V using four inputs (stack current, stack temperature, H2
and O2 mass flows) and stack voltage as output. El-Sharkh et
al. [6] design a control neural network based on active and
reactive power output from a fuel cell power plant; previous
work of Shaoduan Ou et al. [7] utilizes a hybrid model
Fig. 2 – NUVERA 5 kW PEM stack, test station and control–
acquisition module.
(physical and ANN based) for voltage prediction in Direct
Methanol Fuel Cell system; Ogaji et al. [8] made an evaluation
of ANN based modeling of SOFC taken pressure, current
density, fuel and oxidant stoichiometry and anode and
cathode temperatures as inputs and voltage, power, temper-
ature and efficiency as outputs; Xiao-Juan Wu et al. [9]
developed a non-linear offline solid oxide fuel cell model
based in radial basis function neural network; and recently
Saengrung et al. [10] investigated the performance prediction
of commercial PEM fuel cell (1.2 kW), comparing the use of
Radial Basis Function (RBF) and Backpropagation (BP) neural
networks. Hatti et al. [12] designed a dynamic neural
controller model based with the Quasi-Newton–Levemberg–
Marquardt control algorithm based in the manipulation of
hydrogen flow in order to reach de active power demand. Bao
et al. [9] developed a model to obtain the desired transient
performance of air stoichiometric ratio, cathode inlet
CURRENT STOICH. 10 A 30 A 60 A 90 A 110 A
H2 flow 1.0 5.00 14.00 28.00 42.00 52.00
N2 flow 1.0 1.85 5.18 10.37 15.55 19.26
Air flow 1.0 8.30 25.00 50.00 75.00 92.00
H2 flow 1.2 6.00 16.80 33.60 50.40 62.40
N2 flow 1.2 2.22 6.22 12.44 18.66 23.11
Air flow 1.2 9.96 30.00 60.00 90.00 110.40
H2 flow 1.4 7.00 19.60 39.20 58.80 72.80
N2 flow 1.4 2.59 7.26 14.52 21.77 26.96
Air flow 1.4 11.62 35.00 70.00 105.00 128.80
H2 flow 1.6 8.00 22.40 44.80 67.20 83.20
N2 flow 1.6 2.96 8.29 16.59 24.88 30.81
Air flow 1.6 13.28 40.00 80.00 120.00 147.20
H2 flow 1.8 9.00 25.20 50.40 75.60 93.60
N2 flow 1.8 3.33 9.33 18.66 28.00 34.66
Air flow 1.8 14.94 45.00 90.00 135.00 165.60
H2 flow 2.0 10.00 28.00 56.00 84.00 104.00
N2 flow 2.0 3.70 10.37 20.74 31.11 38.52
Air flow 2.0 16.60 50.00 100.00 150.00 184.00

Table 2 – Input and output variables and ranges after discrimination and separation accordance.
Input variables Ranges Output variables Ranges
1 I Stack/electronic load [8.37, 109.94] A Stack voltage [33.58, 44.00] V
2 Air mass flow [10.52, 100.72] slpm Temp cathode out [34.39, 74.03]�C
3 Hydrogen mass flow [4.86, 60] slpm
4 Nitrogen mass flow [�0.87, 40.05] slpm
5 Cathode water injection [0.1, 12.37] L/min
6 Temp anode in [29.63, 57.77] �C
7 Temp H2O bulk [40.14, 58.88] �C
i n t e r n a t i o n a l j o u r n a l o f h y d r o g e n e n e r g y 3 5 ( 2 0 1 0 ) 1 2 1 2 5 – 1 2 1 3 3 12127
pressure, and pressure difference between the anode and the
cathode based on linearization of the nonlinear dynamic
model by linear quadratic Gaussian (LQG) algorithm for set-
point tracking, and a model-predictive controller (MPC) with
an on-line neural network identifier is also designed to
improve robustness.
This work uses state-of-art ANN-based modeling for
a more powerful commercial PEMFC (5 kW) system NUVERA
Power Flow �. Because of the high power demands, temper-
ature management was an important issue, so that a Cathode
Water Injection (CWI) system (which had not yet been
considered in previous studies) was integrated to the model
that was also scaled to a more complete set of input variables
and two outputs described below, which was expected to
achieve a high level of accuracy.
2. PEM fuel cell system
Because of its design and operation mode the PEM fuel cell
system has become a main alternative energy source. It
consist in a solid polymeric membrane which acts as elec-
trolyte and two platinum porous catalyst electrodes coupled
on both sides of the membrane. Cell assembly could be
mechanical or pneumatically.
The device in this study was a NUVERA Power Flow � 5 kW
PEM fuel cell stack consisting of 50 cells each with 500 cm2 of
geometric area, this system works with a CWI system that
Fig. 3 – Stack current settled by the test station and stack vo
dissipated heat and humidified the cathode side by mixing air
stream and water steam [13]. The the stack was installed with
the following main features: appropriate flow rate (air
150 slpm, H2 55 slpm, N2 20 slpm), pressure (1 atm) and
temperature oxidant and fuel control feeding (preheating
anode value 75 �C); appropriate water flow rate (w9 L/min),
pressure and temperature (w70 �C) control CWI feed; and an
electronic load and cell voltage monitor system (>0.6 V). The
system was able to communicate with the user trough
a graphic LabVIEW interface built for the control and moni-
toring program developed by ITAE personnel.
3. Artificial neural networks
Modern non-linear modeling methods as Artificial Neural
Networks have been used in many engineering applications
such as control systems, pattern recognition and modeling
complex process transformations. Input and output data have
to be supplied to the network so that it can be trained by using
an algorithm that can adjust its internal weights and biases.
That multilayer networks are universal tools capable of
approximating any measurable function to any desired degree
of accuracy. This paper specifies the data acquisition process
and ANN’s design for a simulation module of a 5 kW PEMFC
stack.
An ANN is inspired on the biological model; it can be
regarded as a black box able to give certain output data as
ltage monitored by the monitoring and control system.
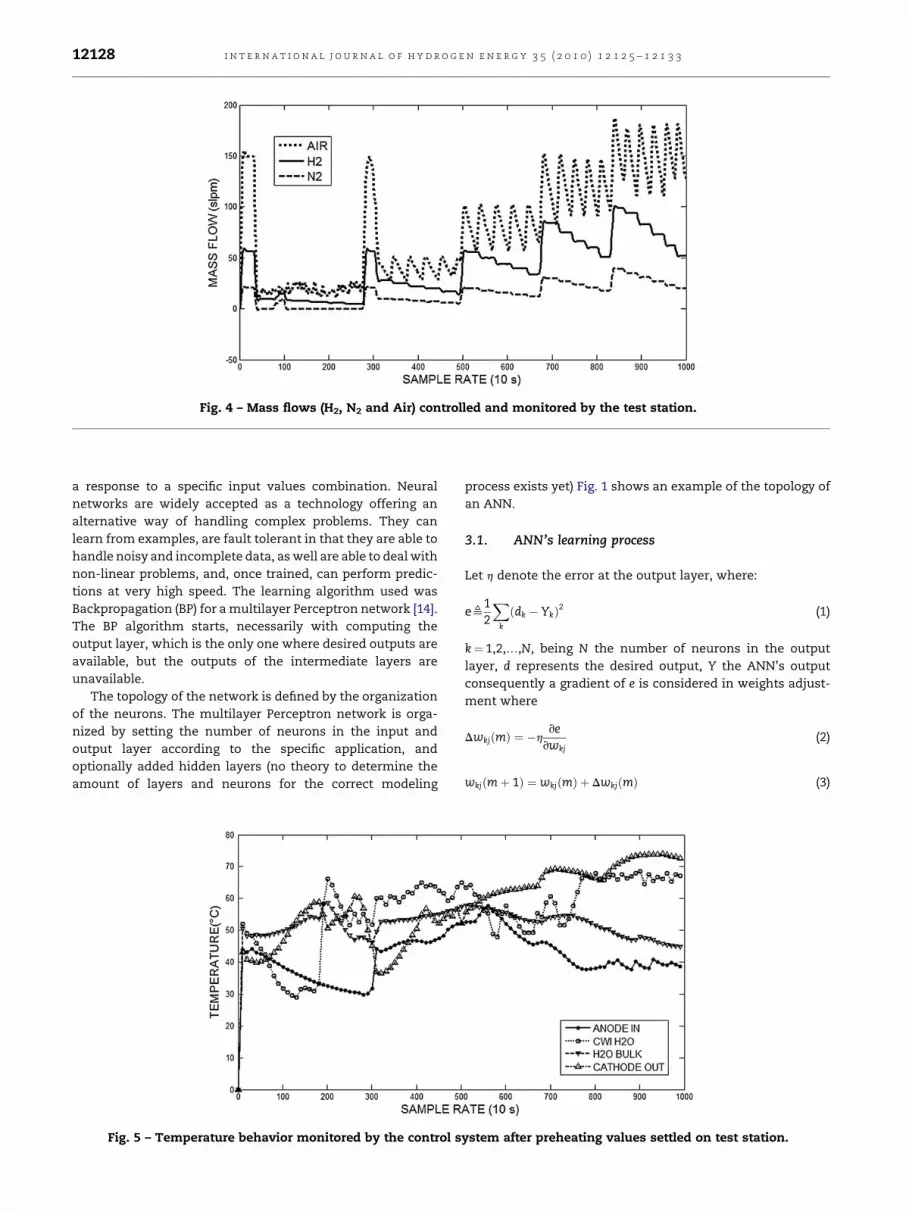
Fig. 4 – Mass flows (H2, N2 and Air) controlled and monitored by the test station.
i n t e r n a t i o n a l j o u r n a l o f h y d r o g e n e n e r g y 3 5 ( 2 0 1 0 ) 1 2 1 2 5 – 1 2 1 3 312128
a response to a specific input values combination. Neural
networks are widely accepted as a technology offering an
alternative way of handling complex problems. They can
learn from examples, are fault tolerant in that they are able to
handle noisy and incomplete data, as well are able to deal with
non-linear problems, and, once trained, can perform predic-
tions at very high speed. The learning algorithm used was
Backpropagation (BP) for a multilayer Perceptron network [14].
The BP algorithm starts, necessarily with computing the
output layer, which is the only one where desired outputs are
available, but the outputs of the intermediate layers are
unavailable.
The topology of the network is defined by the organization
of the neurons. The multilayer Perceptron network is orga-
nized by setting the number of neurons in the input and
output layer according to the specific application, and
optionally added hidden layers (no theory to determine the
amount of layers and neurons for the correct modeling
Fig. 5 – Temperature behavior monitored by the control s
process exists yet) Fig. 1 shows an example of the topology of
an ANN.
3.1. ANN’s learning process
Let h denote the error at the output layer, where:
eb12
Xk
ðdk � YkÞ2 (1)
k¼ 1,2,.,N, being N the number of neurons in the output
layer, d represents the desired output, Y the ANN’s output
consequently a gradient of e is considered in weights adjust-
ment where
DwkjðmÞ ¼ �hve
vwkj(2)
wkjðmþ 1Þ ¼ wkjðmÞ þ DwkjðmÞ (3)
ystem after preheating values settled on test station.

Fig. 6 – ANN’s optimized architecture. 7 input variables, two hidden layers with the same logistic sigmoid transfer functions
and output layer with tangential sigmoid function.
i n t e r n a t i o n a l j o u r n a l o f h y d r o g e n e n e r g y 3 5 ( 2 0 1 0 ) 1 2 1 2 5 – 1 2 1 3 3 12129
The learning rate h makes possible to adjust speed and accu-
racy and the minus (�) sign indicates a downhill direction
towards a minimum, from the Perceptron definition each
neuron receives the numerical information from the input
nodes, internally processes it, and gives out an output, the
processing is done in two stages, each unit input is weighted
and added, and the output is:
zk ¼X
k
wkjxj (4)
the result is used as the argument of a linear or non-linear
activation function fN, for the model proposed in this paper
logistic sigmoid activation function were used for hidden
layers, and tangential sigmoid function for the output layer.
This choice results from various test carried out with different
activation functions on each layer pursuing and error goal of
0.001.
yk ¼ fNðzkÞ (5)
Back-propagating to the rth hidden layer, we still have, as
before:
DwjiðmÞ ¼ �hv3
vwjiyiðr� 1Þ (6)
v3
vwji¼ �h
"v3
vyjðrÞ
vyj
vzj
#yiðr� 1Þ (7)
v3
vyjðrÞ¼X
k
v3
vzkðrþ 1Þ
"v
vyjðrÞX
m
wkm ðrþ 1ÞymðrÞ#
(8)
where the addition over k is performed over the neurons of
the next (the rþ 1) layer that connect to Yj (r), whereas
addition over m is over all inputs to each k’th neuron of the
(rþ 1) layer. Initialization of wji(0) is accomplished by setting
each weight to a low random value selected from a pool of
random numbers. To accelerate the convergence in learning
process, the Levenverg–Marquardt algorithm is used;
however special care must be taken to avoid the overfitting
phenomena.
4. Modeling PEMFC system by ANN
4.1. Data acquisition process
Modeling is usually done with complex models based on the
knowledge of physicochemical phenomena. These models
only depends on the current, temperature, partial pressures
and gas stoichiometries to determine the stack voltage, some
parameters such as the water management are not taken
into account. Due this limitation, black-box models such as
ANNs are adopted in order to consider real measured
parameters for a powerful modeling system. Before design
the network, one must choose the appropriate network
inputs, in order to achieve this, one must understand the
process and how each variable affects the performance of
the PEMFC outputs, this task is usually done by electro-
chemical experts. Once the fewest dominant variables are
recognized the training process could start, nevertheless is
important that training patterns are well distributed

Fig. 7 – Rates of correlation of every output variable (a)
voltage and (b) temperature cathode out by linear
regression for training.
Fig. 8 – Rates of correlation of every output variable (a)
voltage and (b) temperature cathode out by linear
regression for testing.
i n t e r n a t i o n a l j o u r n a l o f h y d r o g e n e n e r g y 3 5 ( 2 0 1 0 ) 1 2 1 2 5 – 1 2 1 3 312130
throughout the operation range and exposed to a normali-
zation process in order to accelerate the performance
prediction.
From the test station and monitor module (see fig. 2), data
were obtained from the stack. Due to the high number of
operating variables, a complete experimental database of
PEMFC system under different operating conditions is diffi-
cult to obtain, no model has been able to accomplish yet. In
our model three main parameters were varied: H2 and N2 gas
mixture stoichiometry, air stoichiometry and stack current
(Table 1), however more acting variables were observed in
order to cover a seven well distributed input space (see Table
2). A monitoring and control LabVIEW� based system
designed under NUVERA considerations was developed for
acquisition and control of mass flows, stack voltage, current,
pressure and temperature, besides cooling parameters as
water temperature and flow initialization settings, This
LabVIEW� based system is capable to monitor every cell
tension, temperatures in cathode and anode Inputs and
outputs, and to control the pump used for water injection
flow.
The test station is used for the experimental validation of
the neural model and considers electronic loads, mass flow
and pressure sensors and actuators, control and monitor
software, besides preheating modules for PEMFC’s anode and
cathode and AC/DC controllers. Experimental database was
obtained setting the anode preheating values on the test
station in the range of 75–80 �C.

Table 3 – Best linear fit for training, testing and validationprocesses.
Process Voltage bestlinear fit
Temp. cathodeout bestlinear fit
Training R¼ 1.0041 Tþ 0.0000 R¼ 1.0227 T� 0.0204
Testing R¼ 0.9871 Tþ 0.0210 R¼ 0.9791 Tþ 0.0188
Validation R¼ 1.0149 T� 0.0150 R¼ 1.0677 T� 0.0595
i n t e r n a t i o n a l j o u r n a l o f h y d r o g e n e n e r g y 3 5 ( 2 0 1 0 ) 1 2 1 2 5 – 1 2 1 3 3 12131
The data structure was fine-tuned for the best running
process of the ANN simulator system and it is described
below in Table 2. The ANN model is integrated with 7 input
neurons for evaluating the stack voltage and cathode
temperature (outputs) considering a set of different oper-
ating conditions. A simple discrimination process was done
Fig. 9 – Correlation rates for validation patterns of every
output variable (a) voltage and (b) temperature cathode out.
on the basis of several test carried. Once this point is
considered a pass band filter (low frequency cut of 0.05 Hz to
high frequency cut to 1 Hz) was applied in order to attenuate
the effects of quick changes in stoichiometry to reestablish
the stack when voltage of any of the fifty cells dropped under
0.5 V. The next step was the database division in training
data, testing data and validation data, from a total of 1000
accurate measures, half were used to train the network, and
the remainder divided in the same amount for testing and
validation however this last set was doped with noisy values
in the range of [0.85, 1.07] equivalent to 22% of input values
variation in order to size the robustness of the model [6]. The
input and output variables for the ANN’s learning and
function were normalized to be within a [�1, 1], this process
was necessary for the better convergence of the neural
model however minimum and maximum values of the
training data were used for testing and validating data.
Figs. 3–5 show behavior of every variable during the
acquisition time before being separated to input and output
variables.
5. Results and discussion
As mentioned before the ANN training was realized trying
several architectures, training algorithms and transfer
functions, in order to reach the error goal¼ 0.001, the 7-6-
10-2 architecture (Fig. 6) brings fast and very accurate
approach to the intelligent simulation system. Both hidden
layers use logistic sigmoid transfer function, the output
layer gives the simulated values using tangential sigmoid
transfer function. ANN’s backpropagation Levenverg Mar-
quardt algorithm has been proved experimentally and is
the more suitable method according to literature [10,11,14].
After comparing several architectures, the ANN learned
considerably fast to reach the error goal, linear regression of
every output and every set (training, testing and validation)
was calculated in order to observe correlation between
experimental data and simulated data from the ANN model.
Observing in the training session, a minimum correlation rate
of R¼ 0.975 (Fig. 7a) was gotten from the voltage variable, the
other output (Cathode temperature out) presents better
correlation (Fig. 7b), indicating the success of training, in order
to verify that the adequate training is necessary to propagate
some testing patterns, this process shows an excellent
behavior as it seen in Fig. 8, again minimum correlation rate
was reached for the voltage variable R¼ 0.973 (fig. 8a). These
results make us to trust in the best ANN performance to
simulate, however it is necessary to test them by using
another set of experimental data doped with a noise matrix in
the range described above. In addition to correlation rate, the
best fitting lines obtained for the three processes are described
in Table 3.
A sequence of incremental current steps from 10 to 110 A
and several stoichiometry gas combinations were propagated
trough the neural model in order to observe and compare the
simulated results against experimental data. Excellent
modeling performance of the neural network simulator can be
observed in Fig. 9 where validation patterns doped with noisy
data have shown excellent fitness to real data; again the first

Fig. 10 – Stack voltage behavior comparison between real and simulated sequences.
i n t e r n a t i o n a l j o u r n a l o f h y d r o g e n e n e r g y 3 5 ( 2 0 1 0 ) 1 2 1 2 5 – 1 2 1 3 312132
variable (Fig. 9a) shows the minimum rate value of 0.961 (0.014
below training correlation), the second variable (Fig. 9b)
presents again acceptable performance in this process,
however in order to illustrate the prediction accuracy of the
modeling tool, Figs. 10 and 11 represent the sequence of real
and simulated output data voltage and temperature when the
mentioned input sequence is propagated through the
network.
As steps in the current increase, voltage drops gradu-
ally. In the experimental range, however, even though
variations up to 22% were induced into the neural model,
the tendency follows the same that real data which
establish the robustness of the network. The same
phenomena occurs in the temperature output, which again
as long as the power demand increases its slope increase,
this oscillating naturalness is caused by the compensating
Fig. 11 – Cathode out temperature betw
effect of the CWI system. However, again, the neural model
follows in a narrow way the behavior of experimental
sequence and in order to set numerically this performance,
it is necessary to calculate the simulation error.
The error associated to each distribution was calculated by
the Mean Square Error (MSE).
MSE ¼ 1n
Xn
i¼1
ðA� TÞ2 (9)
where A represents the simulated data vector for every
output parameter and T the real experimental values
taken from the stack. For every output value in the vali-
dation set, the errors obtained from comparing real values
versus simulated data were: Stack Voltage¼ 0.9815 V
(9.4%), Cathode Out Temperature¼ 2.2177 �C (5.6%).
een real and simulated sequences.

i n t e r n a t i o n a l j o u r n a l o f h y d r o g e n e n e r g y 3 5 ( 2 0 1 0 ) 1 2 1 2 5 – 1 2 1 3 3 12133
6. Conclusions
Modeling is an important tool dedicated to the study of the
systems and observation of them under several applications
in order to optimize their performance saving time and
resources. When modeling is done by using experimental data
which cover N�M dimensional space, excellent performance
prediction could be achieved by artificial neural networks due
to their capabilities of learning, adapting and tolerating a lack
of information. Modeling of a NUVERA 5 kW stack was
developed using ANNs as alternative approach to model a fuel
cell system when physical variables relationship is not well
known. The Artificial neural network designed in this work
shows excellent accuracy in modeling and prediction for this
particular 5 kW performance, considering a 7 input 2 output
dimensional space the maximum error gotten from every
output parameter was a 9.4% in the stack voltage prediction
and a 5.6% from the Cathode Temperature Out. Confidence
and robustness were achieved by introducing noise to exper-
imental data. Previous papers based on similar techniques do
not consider such amount of parameters, they also promote
scaling of this kind of modeling techniques to high power
systems, however this scaling is not simply. This study illus-
trate the temperature behavior of high power PEMFC and the
interaction of a CWI system. Such work will be more helpful to
model more complex systems and PEMFC applications simply
by introducing this black box FC model.
Acknowledgements
This work was supported by a grant from the Istituto di Tec-
nologie Avanzate per l’Energia (CNR-ITAE) A. Chavez grate-
fully acknowledges a scholarship from CONACYT, Mexico.
L.G. Arriaga and S. Duron are grateful to the Mexican Council
for Science and Technology (Conacyt, Fomix-Zacatecas 81728)
for financial support.
r e f e r e n c e s
[1] Oliveira VB, Falcao DS, Rangel CM, Pinto AMFR. Acomparative study of approaches to direct methanol fuel
cells modeling. International Journal of Hydrogen Energy2007;32:415–24.
[2] Bıyıko glu Atilla. Review of proton exchange membrane fuelcell models. International Journal of Hydrogen Energy 2005;30:1181–212.
[3] Arrigada J, Olausson P, selimovic A. Artificial neural networksimulator for SOFC performance prediction. Journal of PowerSources 2002;112:54–60.
[4] Lee Won-Yong, Park Gu-Gon, Yang Tae-Hyun, Yoon Young-Gi, Kim Chang-Soo. Empirical modeling of polymerelectrolyte membrane fuel cell performance using artificialneural networks. International Journal of Hydrogen Energy2004;29:961–6.
[5] Jemie S, Hissel D, Pera MC, Kauffman JM. On-board fuelcell power supply modeling on the basis of NNmethodology. Journal of Power Sources 2003;124:479–86.
[6] El-Sharkh MY, Rahman A, Alam MS. Neural networksbased control of active and reactive power of stand alonePEM fuel cell power plant. Journal of Power Sources 2004;135:88–94.
[7] Ou Shaoduan, Luke EK. A hybrid neural network modelfor PEM fuel cells. Journal of Power Sources 2005;140:319–30.
[8] Ogaji SOT, Singh R, Pilidis P, diacakis M. Modeling fuel cellusing artificial intelligence. Journal of Power Sources 2006;154:192–7.
[9] Bao Cheng, Ouyang Minggao, Yi Baolian. Modeling andcontrol of air stream and hydrogen flow with recirculation ina PEM fuel cell systemdII. Linear and adaptive nonlinearcontrol. International Journal of Hydrogen Energy 2006;31:1897–913.
[10] Wu Xiao-Juan, Zhu Xin-Jian, Chao Guang-Yi, Tu Heng-Yong. Modeling a SOFC stack based on GA-RBF neuralnetwork identification. Journal of Power Sources 2007;167:145–50.
[11] Saengrung A, Abtahi A, Zilouchian A. Neural network modelfor a commercial PEM fuel cell system. Journal of PowerSources 2007;172:749–59.
[12] Hatti Mustapha, Tioursi Mustapha. Dynamic neuralnetwork controller model of PEM fuel cell system.International Journal of Hydrogen Energy 2009;34:5015–21.
[13] Olga Poleyova. Accelerated testing methodology of fuelcell stacks. In: second annual international symposiumfuel cells durability and performance. Miami Florida USA;2006.
[14] Graupe D. Principles of artificial neural networks. 2ndedition, Advanced Series on Circuits and Systems, WorldScientific, Publishing Co., Singapore 2007.