Embed Size (px)
Citation preview
High Resolution Measurement of Cerebral Blood Flow Using Intravascular Tracer Bolus Passages. Part 11: Experimental Comparison and Preliminary Results. Leif IZlstergaard, Alma Gregory Sorensen, Kenneth K. Kwong, Robert M. Weisskoff, Carsten Gyldensted, Bruce R. Rosen
This report evaluates several methods to map relative cere- bral blood flow (rCBF) by applying both parametric and non- parametric techniques to deconvolve high resolution dynamic MRI measurements of paramagnetic bolus passages with noninvasively determined arterial inputs. We found a nonpara- metric (singular value decomposition (SVD)) deconvolution technique produced the most robust results, giving mean gray:white flow ratio of 2.7 2 0.5 (SEM) in six normal volun- teers, in excellent agreement with recent PET literature values for age-matched subjects. Similar results were obtained by using a model-dependent approach that assumes an expo- nential residue function, but not for a Gaussian-shaped resi- due function or for either Fourier or regularization-based model-independent approaches. Pilot studies of our CBF mapping techniques in patients with tumor, stroke, and mi- graine aura demonstrated that these techniques can be readily used on data routinely acquired by using current echo planar imaging technology. By using these techniques, the authors visualized important regional hemodynamic changes not detectable with rCBV mapping algorithms. Key words: cerebral blood flow (CBF); dynamic magnetic res- onance imaging (MRI); humans; susceptibility contrast.
INTRODUCTION
Techniques to measure cerebral blood flow (CBF) are important to use the full potential of MRI. We have previously analyzed the theoretical basis of determining CB F by deconvolution of cerebral concentration time curves with arterial input functions determined nonin- vasively from image data (1). Two main categories of approaches to determine CBF using dynamic MR imag- ing of nondiffusible contrast agents were analyzed. In the first, model-dependent approach, an empirical analytical expression is chosen to describe vascular retention of contrast agent. In the second, model-independent ap-
MRM 36~726-736 (1996) From the MGH-NMR Center, Massachusetts General Hospital, Department of Radiology, Harvard Medical School, Charlestown, Massachusetts, and Department of Neuroradiology (L.O., C.G.) and PET-Center (L.0.), Arhus University Hospital, Arhus, Denmark. Address correspondence to: Leif (astergaard, M.D., M.S., Department of Neuroradiology, Arhus Kommunehospital, Nsrrebrogade 44, DK-8000 Arhus, Denmark. Received July 27, 1995; revised January 31, 1996; accepted May 13, 1996. This work was supported by The Ssster and Verner Lippert Foundation, The Michael Herman Nielsen Memorial Foundation, The Lykfeldt Foundation, The Carl and Ellen Hertz Foundation, The Danish Research Academy (J.nr. S940197), and The Danish Medical Research Council (12-1634-1, 1993); and by Public Health Service Grants R01-CA40303 and R01-HL39810, the Whiiaker Foundation R01 -CA66072 and PO1 -CA48729, and The Radiolog- ical Society of North America Research and Education Fund (A.G.S.).
Copyright 0 1996 by Williams & Wilkins All rights of reproduction in any form reserved.
0740-31 94/96 $3.00
proach, CBF and the vascular retention of tracer are determined by nonparametric deconvolution. Our results indicated that CBF values determined with model-de- pendent approaches may be in error if the vascular re- tention of tracer is systematically different among differ- ent areas of the brain. The analysis of model independent approaches indicated that nonparametric deconvolution using singular value decomposition (SVD) reproduces flow reasonably independent of the underlying vascular structure, even at the modest signal-to-noise ratio (SNR) obtainable with single-shot echo planar imaging (EPI).
In this study, model-dependent approaches that used two different residue functions are compared in human data to evaluate the possible use of simple analytical expressions to measure blood flow in normal brain. We then compare relative CBF (rCBF) values obtained with these model-dependent approaches with those obtained by using three model-independent approaches (Fourier transform, regularization and SVD) in six normal volun- teers. Gray:white ratios for each technique are compared to values obtained from the literature, and measured rCBF SNR is compared with predictions based on our previous Monte Carlo modeling (1). Finally, we describe preliminary experience with model-dependent and mod- el-independent determinations of CBF in pathologies with states of altered hemodynamics, and compare our CBF maps to maps of rCBV (2, 3) obtained by using simple numerical integration and/or gamma-variate fit- ting.
THEORY
A detailed discussion of our approach to the estimation of cerebral blood flow from measurement of nondiffus- able tracers is presented in Part I of this report (1). In brief, the concentration C,,,( t ) of intravascular contrast agent within a given volume of interest (VOI) can be written
CVOI(~) = Ft j: CA4fKt - 4dT t11
where Ft is tissue flow and R(t) is the vascular residue function, describing the fraction of tracer still present in the vascular bed of the VOI at time t after injection of a unit impulse of tracer in its feeding vessel. Equation [I] is the central equation in our approach to determine flow using nondiffusible tracers, as it states that the initial height of the deconvolved concentration time curve equals the flow, Ft. However, Eq. [I] is not straightfor-
726

CBF Measurement II 727
ward to solve for F, because R(t) is an unknown function dependent on local vascular structure. In Part I of this report (I), we analyzed several approaches to deconvolve Eq. [I] given the characteristic physiology of the brain, and both the temporal resolution and SNR of typical dynamic susceptibility contrast imaging using EPI.
In the first, model-dependent approach, an analytical expression with limited free parameters is chosen to empirically describe the vascular structure. In our previ- ous study (I), we discussed possible analytical forms of R(t). This approach was shown to only yield absolute flow if the actual underlying residue function was suffi- ciently described by the applied model. Our simulations, however, indicated that this approach still may yield reasonable relative flow values if the shape of the residue function is relatively uniform across the brain even if the assumed model is not well-matched by the true residue function. However, in the presence of pathological and altered hemodynamics where the shape of the residue function may vary, this approach may lead to significant errors even in measurements of relative flow.
In a second, model-independent approach, nonpara- metric deconvolution is performed to simultaneously de- termine R(t) and F , in Eq. [I]. We investigated several approaches to performing nonparametric deconvolution. We found the Fourier transform (FT) and regularization approaches yielded fitted flow values biased by vascular structure and volume (1). However, one deconvolution approach, singular value decomposition (SVD), was demonstrated to be capable of determining absolute as well as relative flow with good accuracy, independent of the underlying vascular structure and volume (I), and at raw image SNR levels equivalent to those obtainable by using current clinical protocols.
MATERIALS AND METHODS Subjects
To evaluate the efficacy of both model-dependent and model-independent deconvolution based CBF measure- ment using dynamic susceptibliy contrast EPI, we first eva hated their performance on data obtained from six normal volunteers (aged 29 ? 4 years) participating in clinical testing of a dysprosium based high susceptibility paramagnetic chelate, Sprodiamide (Dy-DTPA-BMA) (Nycomed Inc., Princeton, NJ, and Nycomed Imaging AS, Oslo, Norway) (4). Because of the larger magnetic mo- ment of dysprosium, these data sets had high intrinsic contrast to noise ratio (CNR), and were thus an ideal data set for the quantitative comparison of the different de- convolution techniques under optimal conditions. Con- trast agent (0.2 mmol/kg) was delivered by a prototype MRI[ compatible power-injector (Medrad Inc., Pittsburgh, PA) at a rate of 5 ml/s in an antecubital vein. Written informed consent was obtained from each subject before the study. The study protocol was approved by our hos- pitals’ Subcommittee on Human Studies (SHS).
TO evaluate the ability of the most promising tech- niques to map CBF under more realistic clinical condi- tions, preliminary clinical results were obtained from four patients having functional MRI studies according to
our routine cerebral hemodynamic protocol (5). For these studies, an FDA approved Gd-based contrast agent was used (Magnevist, Berlex). All subjects received 0.2 mmol/kg contrast agent, again delivered by the Medrad power-injector at a rate of 5 ml/s in an antecubital vein, following informed consent, using a study protocol ap- proved by our hospitals’ SHS.
MRI Protocol
Single-shot images were obtained by using a GE Signa 1.5 Tesla imager retrofitted for EPI capabilities (Instascan, Advanced NMR Systems, Wilmington, MA). Spin echo EPI was performed using TR = 1000 ms (normal volun- teers) or TR = 1500 ms (clinical patients), with TE = 75 ms. A 256 X 128 acqusition matrix was used with a 40 X 20 cm FOV, leading to a pixel size of 1.6 X 1.6 mm. The slice thickness 5 mm and (in multislice experiments) the gap between slices was 1 mm.
Arterial Input and Tissue Tracer Concentration
We used susceptibility contrast arising from compart- mentalization of the paramagnetic contrast agent to de- termine tissue and arterial tracer levels (6). We assumed a linear relationship (7, 8) between paramagnetic contrast agent concentration and the change in transverse relax- ation rate R,, to determine tissue and arterial tracer time concentration curves C(t):
where S(0) and S(t) are the signal intensities at the base- line and time t, respectively. Note that we assumed TI to be unaltered during the bolus injection. The arterial con- centration was determined in each subject from pixels around large vessels (typically the middle cerebral artery (MCA)) showing early, large (3-10 times that of gray and white matter) increase in R, after contrast injection. In our calculations, we typically used the average of 5-10 pixels to yield a good representation of the arterial input. This method has previously been demonstrated to closely reflect actual, arterial levels for the susceptibility contrast agents used in this study when imaged using EPI techniques (9). To demonstrate relative arterial and tis- sue signal changes, Fig. 1 shows the calculated concen- tration time curves for three pixels situated around the MCA along with three selected areas of the brain in a patient with a primary glial tumor of the brain.
To avoid systematic errors in absolute flow rates due to (i) inaccurate quantitation of paramagnetic tracer concen- tration from susceptibility contrast in the vicinity of ves- sels and (ii) the exact microvascular hematocrit, we did not attempt to quantify arterial and tissue concentrations (Eq. [I]) in absolute units. Instead, we assumed that mi- crovascular hematocrit is constant across the brain (10) and used normal white matter as an internal standard in our measurements. White matter is known to have a fairly constant, age-independent flow of of 22 rn1/100 ml/min (11).
Because simulations performed in Part I of this report (1) showed a tendency for fitted flow values determined

0stergaard et al.
1 -
0.5 -
I
A r t e r y Tumor Gray Matter White Matter
0 10 20 30 40 50
Time in seconds
FIG. 1. Concentration time curves after bolus injection of a Gd- based contrast agent into a tumor patient. (The tumor showed no enhancement.) Three pixels were placed in the MCA. Note the large amplitude and narrower arterial signal relative to t h e tissue signal.
by our technique to be underestimated if tracer arrival in the tissue was delayed relative to the arterial input, we compared tracer arrival differences in different areas of the brain in several multislice experiments. Also, our theoretical considerations implied that dispersion of the arterial input function in vessels between the site of measurement and the tissue may lead to errors in flow estimates. We consequently further analyzed differences in the timing and shape of the arterial input when deter- mined at different locations along branches of large ar- teries.
Deconvolution Techniques
Model-Dependent Approaches. To investigate the possi- bility of using analytical expressions to describe the res- idue function of cerebral tissue, we evaluated two func- tional forms. We first chose a single exponential:
R(t, MTT) = e-r;i;T?; [31
Linear combinations of exponentials have been dis- cussed by different authors to be a reasonable approxi- mation to a general residue function model (12). At the SNR associated with pixel-by-pixel deconvolution of dy- namic MRI data, our previous Monte Carlo simulations (1) suggested that introducing more than one exponential did not improve our accuracy in determining CBF. We used general nonlinear least squared minimization to solve for the parameters Ft and mean transit time (MTT)
(13). To qualitatively evaluate other potential shapes of the residue function, we also chose to model the residue function as the decreasing portion of a Gaussian. The Gaussian was chosen ad hoc to represent curve shapes in between the two extreme models of (i) the vasculature as a single, well-mixed compartment (exponential) and (ii) the vascxlature as a number of capillaries with equal tracer transit times and "plug flow" in parallel (box- shaped residue function). Model-Independent Deconvolution. The theory and ratio- nale of several model-independent deconvolution ap- proaches is described in Part I of this study (I). We performed a detailed statistical analysis of two main ap- proaches: An algebraic approach, where Eq. [I] is refor- mulated as a matrix equation, and a transform approach, which used the convolution theorem for the FT. In the former c:ategory, we analyzed two possible approaches: SVD and regularization. Our statistical analysis of these nonparametric deconvolution techniques showed that SVD (13) allows estimation of flow reasonably indepen- dent of the underlying vascular structure and volume even at low SNR (1).
In this study, we again evaluated the use of these three model-independent deconvolution techniques on data from the normal volunteers. Based on the simulation studies and clinical results, we only applied the SVD in subsequent data analysis.
In using the algebraic deconvolution approaches (SVD and regularization), the convolution matrix was opti- mized to account for the rapid changes in arterial and residue function curves encountered in bolus passage experiments in the brain (1). For the SVD, elimination of diagonal elements in the diagonalized matrix was opti- mized according to Monte Carlo simulations described in Part I of this study (1). At the SNR typical of the data presented here, a cut-off level of 15-20% of the maxi- mum value in the diagonalized matrix was used. The deconvolution was performed over the range of measure- ments where the arterial input values exceeded the noise level [usually about 15 s) (14). For the regularization approach, a choice of the regularization term equal in size to the maximum of the arterial concentration time curve value was used at the SNR associated with pixel by pixel deconvolution in these examinations. For the FT approach, optimization of the free parameter [strength of the automated Wiener filter) was optimized according to ref. 15.
For both model-dependent and model-independent techniques, deconvolution was performed after the ap- plication of a 3 x 3 uniform smoothing kernel to our raw image data. Maps of rCBF are displayed; as mentioned above, no attempt was made to normalize the data to the actual contrast agent concentration to map absolute flow for these studies. However, since both flow and volume [CBV) maps are normalized to the same input curve for each study, the ratio of CBVICBF maps is an absolute measure of the MTT in seconds. We therefore measured and mapped MTT as a means of assessing disturbances in the relationship between CBF and CBV.
For all techniques, the maximum point on the decon- volved response curve was chosen to be the flow. Ideally, the flow would be the initial point, but due to possible

CBF Measurement I1 729
delays and dispersion of the bolus at the tissue, the maximum of the response curve may be slightly delayed.
Comparison with Monte Carlo Simulation Results
In our earlier Monte Carlo modeling (11, we analyzed the possibility of determining flow by using model-depen- dent and model-independent approaches. We deter- mined the standard deviation of the flow estimates ob- tainable under various physiological conditions and SNRs using model-dependent as well as model-indepen- dent approaches. To validate our clinical data and thus the general conclusion concerning the feasibility of de- termining flow by using our technique, we compared the noise level on our calculated flow maps to the level predicted by our simulations. To find structures with uniform flow rates, we chose regions of interest (ROIs) in the deep gray nuclei and adjacent white matter. For these regions, we calculated the ratio of the standard deviation to the determined flow to obtain a measure of the obtain- able SNR in calculated flow maps by using our technique in humans. To compare these results with simulated values, we compared this noise level to that determined from Monte Carlo simulations at the same SNR, assuming a gray and white matter flow of 60 and 20 m1/100 mll min, respectively, a gray:white CBV ratio of 2 , and that gray and white matter residue functions both were expo- nen tials.
RESULTS
Figure 2 shows the results of model-independent pixel- by-pixel deconvolution of the concentration time curve with an arterial input obtained from the MCA in one of
FIG. 2. CBF maps calculated by using (A) a model-dependent (exponential residue model) approach, nonparametric (model-in- dependent) deconvolution approaches, (B) singular value decom- position, (C) regularization, and (D) FT in a normal volunteer. The pixels with very high values correspond to large vessels displaying a concentration time curve similar to that of the arterial input.
the normal volunteers. Deconvolution was performed by using a model-dependent approach (exponentiaI residue model) [Fig. 2A) and nonparametric deconvolution (model-independent) by using SVD (Fig. ZB), regulariza- tion (Fig. 2C) and FT (Fig. 2D). Note that the calculated rCBF map that used a single exponential residue model looks very similar to the map obtained with the model- independent SVD approach. The model-independent de- convolution that used regularization shows very high flow in gray matter. This is in agreement with our previ- ous simulations that showed a tendency for the regular- ization approach to overestimate flow in areas with high vascular volume (1). The FT flow map shows poorer gray:white matter contrast than the other approaches. This is again in agreement with our previous simula- tions. This approach was shown to produce flow values heavily dependent on vascular volume and structure (I). The variation in fitted flow values between different areas thus may reflect differences in flow, volume, or underlying residue function. This trend was found to be valid in all six volunteers. The FT and regularization approaches were thus excluded in our further analysis.
Table 1 shows the glnhal gray:white matter CBF ratios determined in the six normal volunteers by using model- dependent (exponential and Gaussian residue models] and model-dependent (SVU) deconvolution. Tissue was segmented into gray and white matter based on CBV maps and anatomical images.
The model-dependent deconvolution that used expo- nential and Gaussian residue models yielded very differ- ent flow ratios for the six volunteers, differing in some cases by a factor of 2. Average gray:white flow ratio was 1.82 t 0.07 for the Gaussian residue model compared with 2.6 1 i- 0.18 for the exponential. To compare the fit of Eq. [I] to the time concentration curve for the two choices of residue models in each individual pixel, we compared the overall chi-square of the two fits for all six subjects. This showed on the average a 15% higher chi- square in the case of the Gaussian, indicating that a Gaussian residue model gave poorer fit to the actual data than the exponential residue model. Of these two possi- ble residue models, the latter thus seemed to yield a better approximation to the underlying true residue func- tion.
Comparing the flow ratios obtained with the two mod- el-dependent deconvolutions with those obtained with the model-independent SVD approach, the mean gray: white flow ratio of 2.61 2 0.18 found by using an expo- nential residue model was in good agreement with 2.75 I 0.11 obtained by using the SVD (Table I). The SVD approach yielded average MTTs of 3.19 I 0.93 s (SEM) foe white matter and 2.62 2 U.60 s for gray matter. Also, the calculated values of flows that used the two techniques were in reasonable agreement (results not shown), indicating that the exponential and SVD should yield the same absolute flow rates when properly nor- malized against the arterial input concentration. We will discuss the obtained CBF ratios in greater detail below.
Table 2 shows a comparison of the predicted and ex- perimentally determined ratios between noise and signal in the flow images calculated in the six volunteers. The SNR used in the Monte Carlo simulations was 10. based
730 0stergaard et al.
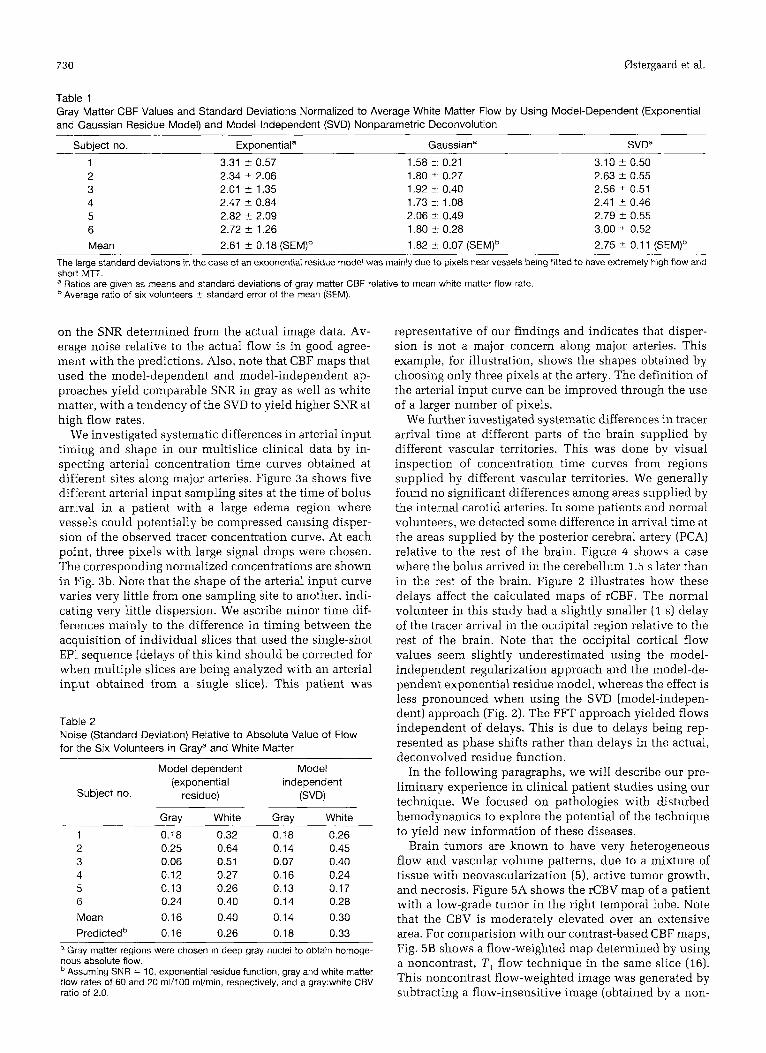
Table 1 Gray Matter CBF Values and Standard Deviations Normalized to Average White Matter Flow by Using Model-Dependent (Exponential and Gaussian Residue Model) and Model-Independent (SVD) Nonpararnetric Deconvolution -
Subject no. Exponential" Gaussian" SVDa
1 3.31 ? 0.57 1.58 i: 0.21 3.10 f 0.50 2 2.34 5 2.06 1.80 2: 0.27 2.63 5 0.55 3 2.01 r 1.35 1.92 i: 0.40 2.56 2 0.51 4 2.47 ? 0.84 1.73 i: 1.08 2.41 5 0.46 5 2.82 2 2.09 2.06 i: 0.49 2.79 f 0.55 6 2.72 2 1.26 1.80 i: 0.28 3.00 f 0.52 Mean 2.61 f 0.18 (SEM)b 1.82 5: 0.07 (SEM)b 2.75 f 0.1 1 (SEM)b
The large standard deviations in the case of an exponential residue model was mainly due to pixels near vessels being fitted to have extremely high flow and shott MTF. a Ratios are given as means and standard deviations of gray matter CBF relative to mean white matter flow rate.
Average ratio of six volunteers 5 standard error of the mean (SEM).
on the SNR determined from the actual image data. Av- erage noise relative to the actual flow is in good agree- ment with the predictions. Also, note that CBF maps that used the model-dependent and model-independent ap- proaches yield comparable SNR in gray as well as white matter, with a tendency of the SVD to yield higher SNR at high flow rates.
We investigated systematic differences in arterial input timing and shape in our multislice clinical data by in- specting arterial concentration time curves obtained at different sites along major arteries. Figure 3a shows five different arterial input sampling sites at the time of bolus arrival in a patient with a large edema region where vessels could potentially be compressed causing disper- sion of the observed tracer concentration curve. At each point, three pixels with large signal drops were chosen. The corresponding normalized concentrations are shown in Fig. 3b. Note that the shape of the arterial input curve varies very little from one sampling site to another, indi- cating very little dispersion. We ascribe minor time dif- fermces mainly to the difference in timing between the acquisition of individual slices that used the single-shot EP1 sequence (delays of this kind should be corrected for when multiple slices are being analyzed with an arterial input obtained from a single slice). This patient was
Table 2 Noise (Standard Deviation) Relative to Absolute Value of Flow for the Six Volunteers in Graya and White Matter
Model dependent Model (exponential independent
residue) (SVD) Subject no.
Gray White Gray White 1 0.18 0.32 0.18 0.26 2 0.25 0.64 0.14 0.45 3 0.06 0.51 0.07 0.40 4 0.12 0.27 0.16 0.24 5 0.13 0.26 0.13 0.17 6 0.24 0.40 0.1 4 0.28 Mean 0.16 0.40 0.14 0.30 Predictedb 0.16 0.26 0.18 0.33
a Gray matter regions were chosen in deep gray nuclei to obtain homoge- nous absolute flow.
Assuming SNR = 10, exponential residue function, gray and white matter flow rates of 60 and 20 rnVl00 ml/min, respectively, and a gray:white CBV ratio of 2.0.
representative of our findings and indicates that disper- sion is not a major concern along major arteries. This example, for illustration, shows the shapes obtained by choosing only three pixels at the artery. The definition of the arterial input curve can be improved through the use of a larger number of pixels.
We further investigated systematic differences in tracer arrival time at different parts of the brain supplied by different vascular territories. This was done by visual inspection of concentration time curves from regions supplied by different vascular territories. We generally found no significant differences among areas supplied by the internal carotid arteries. In some patients and normal volunteers, we detected some difference in arrival time at the areas supplied by the posterior cerebral artery (PCA) relative to the rest of the brain. Figure 4 shows a case where the bolus arrived in the cerebellum 1.5 s later than in the rest of the brain. Figure 2 illustrates how these delays affect the calculated maps of rCBF. The normal volunteer in this study had a slightly smaller (1 s) delay of the tracer arrival in the occipital region relative to the rest of the brain. Note that the occipital cortical flow values seem slightly underestimated using the model- independent regularization approach and the model-de- pendent exponential residue model, whereas the effect is less pronounced when using the SVD (model-indepen- dent) approach (Fig. 2). The FFT approach yielded flows independent of delays. This is due to delays being rep- resented as phase shifts rather than delays in the actual, deconvolved residue function.
In the following paragraphs, we will describe our pre- liminary experience in clinical patient studies using our technique. We focused on pathologies with disturbed hemodynamics to explore the potential of the technique to yield new information of these diseases.
Brain tumors are known to have very heterogeneous flow and vascular volume patterns, due to a mixture of tissue with neovascularization (5), active tumor growth, and necrosis. Figure 5A shows the rCBV map of a patient with a low-grade tumor in the right temporal lobe. Note that the CBV is moderately elevated over an extensive area. For comparision with our contrast-based CBF maps, Fig. 5B shows a flow-weighted map determined by using a noncontrast, T , flow technique in the same slice (16). This noncontrast flow-weighted image was generated by subtracting a flow-insensitive image (obtained by a non-

CBF Measurement II 731
a
1
- c - A - - e - . B
3 0.8 - - D i? E p 0.6 Q
- t - E .- c 2
c,
C
C 0 c,
c, c a2 0 c 0 V
.-
.- e 0.4
0.2
0
0 10 20 30 40 50 60 70 Time in seconds
b
FIG. 3. (a) Images showing susceptibility effects around the inter- nal carotid artery (A), the MCA (B), the posterior cerebral artery (C) and along peripheral branches of the MCA (D) within an edema region and in the contralateral side (E) in the same patient. (b) Time course of arterial tracer level at the points shown in (a). Curve peaks were normalized to 1 for comparison of the bolus shape.
0.35 -
0.3 -
0.25 -
0.2 -
0.15 -
0.1 -
0.05 -
-Cerebellum
-12 , , , , , , , , , , ,
1 0 15 20 25 30 3 5 40
Time in seconds
FIG. 4. Time course of tissue tracer concentration in four regions after bolus injection of 0.2 mmol/kg Gd-based contrast agent. This was obtained from the same patient as in Fig. 3A. Note the tracer arrival delay in regions supplied by the posterior circulation. N o arrival time differences can be detected between hemispheres or top/bottom of the skull.
selective inversion pulse) from a flow-sensitive image (obtained by a slice-selective inversion pulse) (16). Note how there are two distinct areas with very high flow within the more general region of elevated CBV. Figures 5C and 5D show the calculated CBF maps that use model- dependent deconvolution with an exponential residue model and SVD deconvolution, respectively, determined from the same data set used to calculate the CBV map of Fig. 5A. Note that these same two areas with high flow are seen at the same locations as in the noncontrast flow-weighted image shown in Fig. 5B. These regions are not distinctly visible on the contrast-based CBV map, however. The SVD approach seems to yield a slightly better definition of the area. Figure 5E shows the calcu- lated CBF map for the Gaussian residue function. Note that the focal regions with high flow are not well repro- duced in this image, resulting in a map that appears more closely to reflect the CBV (Fig. 5A). In this patient, both the model-dependent approach with an exponential res- idue and the model-independent SVD approach gave results i n good qualitative agreement with the indepen- dent, TI flow technique.
The application of our technique in a case of abnormal vascular structure clearly demonstrates that model-de- pendent approaches may fail to reproduce correct rela- tive flow maps in cerebral pathologies. Our previous Monte Carlo simulation results (1) indicated that the model-independent SVD deconvolution approach is rel- atively robust even under changes in tissue hemodynam- ics. Based on our patient studies and these simulation results, we consequently only applied the SVD deconvo- lution technique in the following.
Figure 6 shows the anatomical and functional maps of CBF, CBV, and MTT obtained from a 53-year-old male

732 0sterganrd et al.
FIG. 5. Calculated CBV map displaying tumor localized to the right temporal lobe (A). Also shown is a CBF-weighted image acquired with an independent, noncontrast T1 flow-sensitive technique (B) (1 6). Calculated CBF map using model-dependent (exponential residue model) (C) and SVD (D) deconvolution, both display areas of high flow shown by the T1 technique (see arrows). This regional heterogeneity was not clearly demonstrated by the accompanying CBV map (A). A flow map was also generated by using a Gaussian residue model (E). Note that the area with high flow is not qualitatively displayed. The chi-square of the fit to the concentration time curve was increased in the same area. Also, note that gray:white matter flow ratio is noticeably lower in the Gaussian fit as was found in the normal volunteers. Symmetric areas of high flow around the brainstem and corresponding to t h e course of the MCA are artifacts due to susceptibility effects around large vessels.
who 3 h earlier suffered a stroke and presented with acute left hemiplegia. Figure 6A shows the initial T,- weighted FSE MRI, displaying minimal sulcal efface- ment. The isotropic diffusion-weighted image (Fig. 6B) shows a large abnormal area in the right hemisphere, suggesting decreased water mobility consistent with acute stroke (17). This region correlates well with the infarcted area seen on the 3-day follow-up CT (Fig. 6C). On the initial CBV map (Fig. 6D), an area of decreased blood volume is seen, roughly corresponding to the area that later showed infarct. The initial CBF map (Fig. 6E), obtained by using the SVD technique, shows a large drop in flow corresponding to the area with low CBV. In addition to this, an adjacent area, with normal CBV, is shown to also have low flow. In the map of MTT, this area of pronounced mismatch of flow and volume is clearly displayed. The CBF mapping technique thus dis- played hemodynamic changes not delineated by conven- tional CBV mapping. Note that this region did not go on to infarction at Day 3, suggesting that this zone of flow/ voliime mismatch might be identifying a region of isch- emic tissue with preserved hemodynamic autoregula- tion. The definition and description of hemodynamic disturbances immediately after acute stroke is of great importance in the understanding and potential treatment of cerebrovascular disease.
Analysis of the tissue time course data in the region with long MTT in Fig. 6 showed no significant delays of
tracer arrival. We further addressed the question of dis- persion in the vessels supplying the area as a possible alternative explanation of our findings. We found three small arterial branches in the periphery of the area of low CBF and high MTT (Fig. 7a). Figure 7b shows the time course of these small branches relative to the tracer levels obtained from the MCA in a lower slice. Note that no significant changes in the bolus shape has taken place, indicating that dispersion was minimal in the small ar- terial branches adjacent to the area. Next, we investigated the shape of the determined residue functions in the area that showed prolonged MTT. Interestingly, the residue function changed its shape when moving from the pe- riphery of the region toward the center. Figure 7 c shows the averaged residue function for the outer 2/3 and the inner 1/3 of this region, respectively. The curves are displayed along with the corresponding residue shape for normal, contralateral white matter. The outer region showed the expected, decreasing shape of a residue func- tion with an abnormal, long MTT compared with con- tralateral white matter. When combined with the analy- sis of the arterial curves near the periphery, this suggests that the flow in this region (containing approximately equal amounts of gray and white matter) was truly low with long MTT. The central region, however, showed a residue function that displayed a slight rise before it again decreased after about 5 s. There was only a slight delay of the tracer arrival in this area, indicating that the

CBF Measurement I1 733
arterial input was subject to dispersion when passing to the central region of the area, possibly by passing through multiple paths from the peripheral region. The prolonged MTT in the center of the area thus may partly reflect dispersion due to abnormal arterial blood supply, partly due to a prolonged true MTT. This may have also led to underestimation of flow in this region. Also note that f l o ~ ~ would be further underestimated in the center of the region if the initial point of the fitted residue function had been chosen. These considerations underline the ability of the technique to display several aspects of disturbances in regional hemodynamics, just as they un- derline the importance of considering the shape of the dec:onvolved response function when interpreting the CBF and MTT.
Figure 8 shows CBF (Fig. 8A), CBV (Fig. 8B), and MTT (Fig. 8C) maps obtained (top row) during the pre-head- ache aura phase and in a migraine patient. This aura consisted of a left visual field scotoma. The CBV map shows only subtle changes in the right occipital lobe. The CBF map, however, clearly displays an area with lowered flow within the right visual cortex relative to the con- tralateral cortical gray. The mismatch between volume and flow is again displayed by the MTT map, where the hernodynamic disturbance is seen to include a large por- tion of the occipital lobe. The bottom row shows an interictal control study of the same patient. These data are consistent with the view that the aura before onset of classical migraine headache is the result of vasoconstric- tion and regionally decreased perfusion (18). This is dis- played by the CBF and MTT maps determined by our deconvolution technique.
FIG. 6. Images of a 53-year-old male 3 h post-acute onset of left hemiparesis. T,-weighted FSE (A) shows minimal sulcal effacement in the right hemisphere. The isotropic diffusion-weighted image (B) corre- lates well with the size of the in- farcted area at the follow-up CT scan 3 days later (C). The CBV (D) and SVD CBF (E) maps show a small region with low flow and high volume that survived the stroke (see arrow). The region of flow-vol- ume mismatch is clearly visible in the M l T map (F).
DISCUSSION
The gray-to-white flow ratio determined with an expo- nential model-dependent approach and SVD model-in- dependent deconvolution technique showed very good agreement, whereas the corresponding ratio for the Gaus- sian residue model was somewhat lower. Leenders ef al. (11) reported average white matter flow values using positron emission tomography (PET) of 22.2 f 4.9 ml/ 100 ml/min in 29 subjects. This value was found not to change significantly with age. For gray matter, they found a significant decrease in flow rate with age, the average flow following the relation CBF = 66.5 - 0.26. (agdyears) m1/100 ml/rnin. For our volunteers, this cor- responds to an average gray matter flow of 58.9 m1/100 ml/min or a gray:white flow ratio of 2.65, in excellent agreement with our results for the SVD model-indepen- dent (2.75 i_ 0.11) and nonparametric exponential (2.61 -t 0.18) approaches. (Note that these PET flow values are more recent and thus are corrected for the presence of vascular tracer. The reported flow rates are therefore somewhat lower than earlier rCBF measure- ments with PET.) In a case of abnormal (tumor) vascular structure, results using the bolus passage technique and both the SVD model-independent technique and a mod- el-dependent approach based on an exponential residue agreed well with results obtained with an independent, noncontrast T, flowweighted technique.
The SNR of our calculated CBF maps were comparable for the model-dependent SVD approach and model-de- pendent (exponential residue) approach. Surprisingly, the choice of a simple, exponential residue model thus

734 fastergaard et al.
FIG. 7. (a) Sampling sites for arterial input time course in small arterial branches supplying the region of low perfusion occipital cortex dis- played in Fig. 6D. (b) Time course of arterial tracer levels in the MCA compared with those detected in small arterial branches (a) supplying the area with decreased perfusion in Fig. 6E. Both curves are normalized to 1. No significant dispersion seems too have taken place in the small peripheral branches relative to the MCA. (c) Deconvolved tissue response functions in the periphery and the center of the area with long M l T in Fig. 6 compared with contralateral nor- mal tissue. Note that a combination of dispersion and delay seem to have taken place in the center of the region. Flow is truly low with long M l T in
a the periphery.
10 15 20 25 30 35 40 45 Time in Seconds
b
does not seem to improve the SNR of the parametric maps. Our previous Monte Carlo modeling of the tech- nique allowed us to predict the SNR of the calculated CBF maps. These predictions agreed well with the actual, determined SNR in our human flow maps. Our Monte Carlo modeling showed that flow can indeed be deter- mined by using this approach (11, and the close agree- ment between the SNR of actual calculated CBF maps and these simulations thus yields hope that our measure- ments in humans truly reflects flow.
The comparison between exponential and Gaussian residue models favors the use of exponentials in analyt- ical approaches to determine CBF by deconvolution in normal brain. The exponential residue model also seemed in qualitative agreement with the model-inde- pendent SVD deconvolution approach and a separate, T , flow-sensitive technique in our preliminary clinical studies. In light of the simulations presented in Part I of this report (I), the similarity of the functional map's effective SNR using model-dependent and SVD ap- proaches, and the fact that the residue function may potentially change its shape dramatically in some dis- eases, the model-independent SVD approach seems to be
--t Periphery -+-Center t. Contralateral White
0.05
0 5 10 15
Time in seconds
C
the method of choice among the techniques we evaluated for calculation of CBF.
Our previous simulations emphasized the importance of sampling the arterial input as close to the measured tissue as possible to avoid dispersion and delays. The introduction of the tracer arrival delay as an extra param- eter in the fits generally did not result in satisfactory determination of both MTT and delay at the SNR of pixel-by-pixel deconvolution obtained in this study. In the patients and normal volunteers we examined, tracer arrival differences were minor, except in some cases between areas supplied by the posterior and anterior circulations, respectively. The effects of these delays in actual maps were, however, minor, especially using the SVD technique. Our previous simulations showed that the effects of delays are small in states of low flow, for example in the setting of acute stroke. In some patholo- gies with abnormal cerebral circulation, however, correc- tion for arrival time delays may be necessary.
This work may have significant impact on other tech- niques for blood flow measurement as well. Analytical expressions to describe the vascular retention of tracer in the vasculature are of great importance in the kinetic

CBF Measurement II 735
modeling of diffusible tracers. In PET measurements of CBF using radiolabeled water, intravascular contribution to ihe signal thus introduces large errors in estimated flow values unless corrected for (19). Likewise, in MRI experiments measuring flow with spin-labeled water (16, 20), intravascular contributions to the image intensity are potentially important. Our results indicate that, at least in modeling intravascular contributions to overall signal in :studies with diffusible tracers, the exponential may serve as first approximation to the residue function. To furl her compare our technique to CBF methods that use diffusible tracers, we are presently investigating the role of intravascular tracer in PET measurements of rCBF given the detailed knowledge on the coupling of flow and vascular retention provided by this study in the normal brain as well as pathological tissue.
CONCLUSION
We have introduced a technique to assess cerebral blood flow from dynamic MR imaging of paramagnetic bolus passages. The technique requires no invasive measure- ments of arterial tracer concentrations and can be applied to data recorded in a standard clinical EPI perfusion protocol. The ratios of blood flows between gray and white matter were in excellent agreement with literature values for age-matched normal volunteers. In prelimi- nary clinical testing, the technique shows good potential in demonstrating hemodynamic changes not readily de- teciable with other conventional or functional MR mo- dalities.
ACKNOWLEDGMENTS
The authors thank Nycomed Inc., Princeton, NJ, for spon- soring the volunteer study; Terrence Campbell and Dr.
FIG. 8. Top row: Hemodynamic parameter maps obtained from a migraine patient during a left visual hemifield aura. The CBV map (A) shows only subtle changes. The CBF map (B) shows an area with decreased flow localized to the right occipital lobe. The mismatch be- tween volume and flow, indicating altered vascular tone, is clearly demonstrated by the MTT map (C) and correlates with the patients symptomatology. The maps clearly demonstrate the congruence be- tween left hemifield aura and right occipital hypoperfusion. Bottom row: lnterictal control study. Perfu- sion and MTT maps display no changes in the occipital cortex.
Jim Rabinov for help in acquiring patient studies; and Timothy L. Davis, especially, for the use of his valuable programming tools.
REFERENCES 1.
2.
3.
4.
5.
6.
7.
8.
9.
10.
L. (astergaard, R. M. Weisskoff, D. A. Cheder, C. Gyldensted, B. K. Rosen. High resolution measurement of cerebral hlood flow using intravascular tracer bolus passages. Part I: Mathematical approach and statistical analysis. Magn. Reson. Med. 36, 715-725 (1996). B. R. Rosen, J. W. Belliveau, J. M. Vevea, T. J. Brady, Perfusion imaging with NMR contrast agents. Magn. Res. Med. 14, 249-265
B. R. Rosen, J. W. Belliveau, B. R. Buchbiuder, R. C. McKinstry, L. M. Porkka, D. N. Kennedy, M. S. Neuder, C. R. Fisel, H. J. Aronen, K. K. Kwong, R. M. Weisskoff, M. S. Cohen, T. J. Brady, Contrast agent and cerebral hemodynamics. Magn. Reson. Med. 19, 285-292 (1991). A. G. Sorensen, S. M. Kulke, R. M. Weisskoff, J. L. Boxerman, B. R. Buchbinder, B. R. Rosen, Investigation of cerebral hernodynamics with sprodiamide (Dy-DTPA-BMA) and functional magnetic reso- nance imaging, in “Proc., ASNR, Nashville, 1994,” p. 237. H. J. Aronen I. E. Gazit, D. N. Louis, B. R. Buchbinder, F. S. Pardo, K. M. Weiskoff, G. R. Harsh, G. R. Cosgrove, E. F. Halpern, F. H. Hoch- berg, B. R. Rosen, Cerebral blood volume maps of gliomas: compari- son with tumor grade and histological findings. Radiology 191,41-51 (1994). A. Villringer, B. R. Rosen, J. W. Belliveau, J. L. Ackerman, R. B. Lauffer, R. B. Buxton, Y:S. Chao, V. J. Wedeen, T. J . Brady. Dynamic imaging with lanthanide chelates in normal brain: contrast due to magnetic susceptibility effects. Magn. Reson. Med. 6,164-174 (1988). R. M. Weisskoff, C. S. Zuo, J. L. Boxerman, B. R. Rosen, Microscopic susceptibility variation and transverse relaxation: theory and exper- iment. Magn. Reson. Med. 31, 601-610 (1994). C. R. €:isel, J. L. Ackerman, R. B. Buxton, L. Garrido, J. W. Belliveau, B. R. Kosen, T. J. Brady, MR contrast due to microscopically hetero- geneous magnetic susceptibility: numerical simulations and applica- tions to cerebral physiology. Magn. Reson. Med. 17, 348-356 (1991). L. Porkka, M. Neuder, G. Hunter, R. M. Weisskoff, J. W. Belliveau, B. R. Rosen, Arterial input function measurement with MRI, in “Proc., SMRM, loth Annual Meeting, San Francisco, 1991,” p. 120. A. A. Lammertsniaa, D. J. Brooks, R. P. Beany, D. R. Turton, M. J. Kensett, J. D. Heather, J. Marshall, T. Jones, In vivo measurement of regional cerebral haematocrit using positron emission tomography. I.
(1990).

736 0stergaard et al.
Cereb. Blood Flow Metab. 6, 317-322 (1984). 11. K. L. Leenders, D. Perani, A. A. Lammertsma, J. D. Heather, P. Buck-
ingham, J. R. Healy, J. M. Gibbs, R. J. s. Wise, Y. Hatazawa, s. Herold, R. P. Beany, D. J. Brooks, T. Spinks, C. Rhodes, R. S . J. Frackowiak, T. [ones, Cerebral blood flow, blood volume and oxygen utilization: normal values and effect of age. Brain 113, 27-47 (1990).
12. J. A. Jacquez, in “Compartmental Analysis in Biology and Medicine. Kinetics of distribution of tracer-labeled materials,” pp. 84-101, Elsevier Publishing Company, Amsterdam, 1972.
13. W. H. Press, S. A. Teukolsky, W. T. Vetterling, B. P. Flannery, in “Numerical Recipes in C. The Art of Scientific Computing,” 2nd ed., Cambridge University Press, Cambridge, 1992.
14. S. Van Huffel, J . Vandewalle, M. C. De Roo, J. L. Willems, Reliable and efficient deconvolution technique based on total linear least squares for calculating the renal retention function. Med. B id . Eng. Comput. 25, 26-33 (1987).
15. G. T. Gobbel, J. R. Fike, A deconvolution method for evaluating indicator-dilution curves. Phys. Med. Biol. 39, 1833-1854 (1994).
16. K. K. Kwong, D. A. Chesler, R. M. Weisskoff, K. M. Donahue, T. L. Davis. L. (astergaard, T. A. Campbell, B. R. Rosen, MR perfusion studies with TI-weighted echo planar imaging. Magn. Reson. Med. 34,878-887 (1995).
17. M. E. Moseley, Y. Cohen, J. Mintorovitch, L. Chileuitt, H. Shimizu, J. Kucharczyk, M. F. Wendland, P. R. Weinstein, Early detection of regional cerebral ischemia in cats: comparison of diffusion and T2- weighted MRI and spectroscopy. Magn. Reson. Med. 14, 330-346 (1990).
18. R. P. Woods, M. Iacoboni, J. C. Mazziotta, Bilateral spreading hypo- perfusion during spontaneous migraine headache. N. Engl. J. Med.
19. R. A. Koeppe, G. D. Hutchins, J. M. Rothly, R. I). Hichwa, Examina- tion of assumptions for local cerebral blood flow studies in PET. J. Nucl. Med. 28, 1695-1703 (1987).
20. J. Detre, J. Leigh, D. Williams, A. Koretsky, Perfusion imaging. Magn. Reson. Med. 23, 37-45.
331(25), 1689-1692 (1994).


![Kinetic analysis of the metabotropic glutamate subtype 5 tracer [18F]FPEB in bolus and bolus-plus-constant-infusion studies in humans](https://img.pdfslide.net/doc/110x75/6345f1b338eecfb33a06ca2e/kinetic-analysis-of-the-metabotropic-glutamate-subtype-5-tracer-18ffpeb-in-bolus.jpg)


