Embed Size (px)
Citation preview

ARTICLE IN PRESS
0022-5193/$ - se
doi:10.1016/j.jtb
�Correspond
E-mail addr
Journal of Theoretical Biology 236 (2005) 263–275
www.elsevier.com/locate/yjtbi
High variation in developmental instability under non-normaldevelopmental error: A Bayesian perspective
Stefan Van Dongena,�, Willem Talloenb, Luc Lensc
aGroup of Evolutionary Biology, Department of Biology, University of Antwerp, Groenenborgerlaan 171, B-2020 Antwerp, BelgiumbGroup of Animal Ecology, Department of Biology, University of Antwerp, Universiteitsplein 1, B-2610 Antwerp, Belgium
cTEREC, Department of Biology, University of Ghent, K. L. Ledeganckstraat 35, B-9000 Ghent, Belgium
Received 9 December 2004; received in revised form 7 March 2005; accepted 7 March 2005
Available online 17 May 2005
Communicated by Nick Barton
Abstract
The developmental mechanisms behind developmental instability (DI) are only poorly understood. Nevertheless, fluctuating
asymmetry (FA) is often used a surrogate for DI. Based on statistical arguments it is often assumed that individual levels of FA are
only weakly associated with the underlying DI. Patterns in FA therefore need to be interpreted with caution, and should ideally be
transformed into patterns in DI. In order to be able to achieve that, assumptions about the distribution of developmental errors
must be made. Current models assume that errors during development are additive and independent such that they yield a normal
distribution. The observation that the distribution of FA is often leptokurtic has been interpreted as evidence for between-individual
variation in DI. This approach has led to unrealistically high estimates of between-individual variation in DI, and potentially
incorrect interpretations of patterns in FA, especially at the individual level. Recently, it has been suggested that the high estimates
of variation in DI may be biased upward because either developmental errors are log-normal or gamma distributed and/or low
measurement resolution of FA. A proper estimation of the amount (and shape) of heterogeneity in DI is crucial for the
interpretation of patterns in FA and their transformation into patterns in DI. Yet, incorrect model assumptions may render
misleading inferences. We therefore develop a statistical model to evaluate the sensitivity of results under the normal error model
against the two alternative distributions as well as to investigate the importance of low measurement resolution. An analysis of
simulated and empirical data sets indicated that bias due to misspecification of the developmental error distribution can be
substantial, yet, did not appear to reduce estimates of variation in DI in empirical data sets to a large extent. Effects of low
measurement resolution were neglectable. The importance of these results are discussed in the context of the interpretation of
patterns in FA.
r 2005 Elsevier Ltd. All rights reserved.
Keywords: Developmental instability; Fluctuating asymmetry; Variation; Bayesian statistics
1. Introduction
Fluctuating asymmetry (FA, small directionally ran-dom deviations from perfect symmetry) is oftenconsidered as a measure of developmental instability(DI), the latter being the joint outcome of develop-mental noise and developmental stability (Van Dongen
e front matter r 2005 Elsevier Ltd. All rights reserved.
i.2005.03.010
ing author. Tel.: +323 265 33 36; fax: +32 3 265 34 74.
ess: [email protected] (S. Van Dongen).
and Lens, 2002; Nijhout and Davidowitz, 2003).Although different definitions and views can be foundin the literature (Nijhout and Davidowitz, 2003), weassume in this paper that the development of any trait isdisturbed by random stochastic perturbations along thedevelopmental trajectory (i.e. developmental noise) andthat there may exist processes that buffer trait develop-ment against this disruption (i.e. developmental stabi-lity). The outcome of both processes is that the observedphenotype differs from its expectation, conditional on

ARTICLE IN PRESSS. Van Dongen et al. / Journal of Theoretical Biology 236 (2005) 263–275264
the genotype of the individual and the environmentalconditions during development. When developmentalnoise is strong and/or developmental stability is weak, aphenotype will be more likely to deviate from itsexpected value. This corresponds to a high degree ofDI. Bilaterally symmetric traits are very useful to studyDI because, when both sides can be assumed to developunder identical environmental conditions, the left- andright-hand side have the same expected phenotype. Anydeviation from this perfect symmetry can be viewed as areflection of DI, where the effects of noise and stabilitycannot be separated. The consequence of the lack ofknowledge about the developmental mechanisms of DIis that most studies of FA are phenomenological ratherthan mechanistic and are far removed from thoseunderlying developmental mechanisms (Klingenberg,2003). This approach carries the risk of oversimplifica-tion and misinterpretation of results because it isunknown what the relationship is between the unobser-vable DI and the observed degree of asymmetry.
The application of FA to detect stress of differenttypes and origins has become very widespread, yet still asubject of much debate (reviews in Polak, 2003). Manyhypotheses have been put forward to explain theobserved heterogeneity in FA-stress associations, oneof them being a statistical argument. Since the influentialpaper by Palmer and Strobeck (1986) the statisticalanalysis of FA as a measure of DI has been the subjectof intense research and debate. Methodological studieshave focused on the separation of real asymmetry frommeasurement error (Palmer and Strobeck, 1986; VanDongen et al., 1999a), on the detection of other typesof asymmetry (Palmer and Strobeck, 1986; Van Dongenet al., 1999b), on the analysis of asymmetry in shape(Klingenberg et al., 2002), and on the degree ofassociation between FA and the underlying DI (Whit-lock, 1996; Van Dongen, 1998; Gangestad and Thorn-hill, 1999; Houle, 2000). The latter issue has receivedparticular attention recently because the presumed poorassociation between FA and DI has been invokedas an explanation why patterns like between-traitcorrelations in asymmetry, associations between indivi-dual FA and both fitness and stress, and the heritabilityof FA are often weak and even undetectable unlesssample sizes are enormous (Palmer and Strobeck,2003). Whitlock (1996) and Houle (1997) argued thatFA should be only weakly associated with the under-lying DI. As a consequence, FA estimates DI with alarge degree of error resulting in a downward biasof estimates of associations between FA and othercovariates as well as heritabilities of DI (Whitlock,1996). In order to understand patterns in FA andtheir heterogeneity, it is crucial to correct for thisdownward bias.
Several methods have been developed to estimate howstrongly FA and DI can be expected to be correlated
and to transform patterns in FA in to patterns in DI. Allof them assume that developmental errors can beapproximated by a normal distribution (Whitlock,1998; Van Dongen et al., 1999b; Van Dongen, 1998;Gangestad and Thornhill, 1999). Each trait value isconsidered to be an independent random sample from anormal distribution with mean equal to the expectedtrait value and variance equal to DI. The differencebetween the left and right trait value will then follow anormal distribution with zero mean and variance twicethat of DI. We will further denote this model as the‘normal error model’. Under these assumptions, even ifall individuals experience the same degree of DI, FA willshow a lot of between-individual variation. Thecoefficient of variation (CV) of the unsigned asymmetry(i.e. the absolute value of left minus right, which is oftenused as measure of DI) equals 76% under a normalerror model in absence of any between-individualvariation in DI (Whitlock, 1996). If there is hetero-geneity in the underlying DI, the distribution of FA willbe a mixture of different normal distributions and willbecome leptokurtic and the CV in the unsignedasymmetry will be larger than 76%. The amount ofvariation in the unobservable DI proportional to theobserved variation in asymmetry—the so-called (hy-pothetical) repeatability of FA—can be estimated, basedon CV of the unsigned asymmetry (Whitlock, 1996,1998) as
R ¼2
p�
p� 2
p1
CV 2FA
!. (1)
Other approaches have been developed, all leading tosimilar results (Van Dongen et al., 2003).
Since the development of this normal error model,several studies have estimated the hypothetical repeat-ability of FA as a surrogate measure of between-individual heterogeneity in DI from data in theliterature. Some of these reviews found relatively highvalues (approx. 0.35 on average (Van Dongen and Lens,2000)) while others argued that the repeatability wasrelatively low (approx. 0.07 on average (Gangestad andThornhill, 1999)). Under the normal error model, it canbe shown that values of R above 30% correspond toCV’s in between-individual heterogeneity in DI of over100%, which is much higher than variation observed inany other morphological or fitness traits. This has led tothe conclusion that ‘for those cases, we need either toexplain how the variance in DI can be so high or modifythis standard model of the relationship between DI andFA’ (Houle, 2000).
Two mechanisms which may account for the highpresumed between-individual heterogeneity in DI havebeen put forward. First, levels of asymmetry are oftenvery small compared to levels of measurement resolu-tion, leading to discrete distributions of the signed and

ARTICLE IN PRESSS. Van Dongen et al. / Journal of Theoretical Biology 236 (2005) 263–275 265
unsigned asymmetry, which in turn could result in anoverestimation of R (Gangestad and Thornhill, 2003).Second, a Gaussian distribution of developmentalerror may be unrealistic as it assumes independentadditive errors. Many traits may exhibit a log-normal orgamma error distribution depending on the type ofgrowth (Graham et al., 2003). In actively growingtraits—like leaves, bones and soft tissues in animals,where tissue at time t � 1 actively participates in theproduction of tissue at time t—log-normal distributionsarise naturally. When inert structures—such as nails,feathers and exoskeletons—develop, a gamma distribu-tion may be more appropriate. In both cases, thedistribution of FA is leptokurtic, even in the absence ofbetween-individual variation in DI (Graham et al.,2003). Therefore, estimates of variation in DI assuminga normal error model would be biased upward, althoughthe magnitude of the bias is not known. Still, even if thelog-normal or gamma distribution may be moreappropriate, they are both based on the assumption ofindependent multiplicative (as opposed to additiveunder the normal model) errors which is likely to bean oversimplification of the developmental processes aswell. Since the experimental determination of the actualdistribution is difficult and tedious, we adopt the view ofattempting to approximate the empirical distributionwith a series of alternative options (normal, log-normaland gamma). We then explore the sensitivity ofconclusions to the different distributional assumptions.Still, some modesty with the interpretation of the resultsremains advisable.
Both Gangestad and Thornhill (2003) and Grahamet al. (2003) do not provide methods to correct forthe presumed upward biases. Given the importanceof the association between FA and DI to interpretpatterns in asymmetry, there is a need for generallyapplicable statistical techniques that allow to separateleptokurtosis in the distribution of FA due to non-normality of the error model and due to real hetero-geneity in DI, as well as a correction for the discretenessof the distribution of FA due to low measurementresolution.
In this paper we model developmental error by anormal, log-normal or gamma distribution and correctfor bias due to low measurement resolution. First, weintroduce a general model describing all sources ofobserved phenotypic variation. Second, we estimateall sources of variation of this model in a Bayesianframework. Third, we analyse simulated data sets toconfirm that the method provides unbiased estimatesand to evaluate the robustness of the traditional normalerror model against the two alternative distributions ofdevelopmental error. Fourth, we re-estimate variation inDI of some published data sets under the differentdistributional assumptions to evaluate how strong biasesmay be in these analyses.
2. Model specification
2.1. General model
We assume that the development of a trait can bemodeled statistically by a subsequent sampling from twodistributions, the first representing between-individualvariation in expected trait size, the second reflectingwithin-individual variation due to developmental error(Fig. 1). These two distributions relegate the develop-mental components to two black boxes of the unknowndistributions of DI and between-individual variation.We start from a model where the value of the left- (li)and right-hand (ri) side of a trait of individual i can beassumed to represent a sample from an unknowndistribution z with mean equal to Li and Ri, resp., andvariance equal to s2
DI ;i (middle panel in Fig. 1). Wehereby assume that without any developmental noise(s2
DI ;i ¼ 0), the developmental pathway of a trait of anindividual with a particular set of genes, will lead toexactly the same phenotype under a particular set ofenvironmental conditions. In the absence of directionalasymmetry, (i.e. DA, the tendency for one side to beconsistently larger than the other) Li will be equalto Ri resulting in a perfectly symmetrical phenotype.Increasing developmental disturbance and/or decreasingbuffering capacity will lead to higher values of s2
DI ;i
and thus an increased likelihood that the observedphenotype of individual i will deviate from the expecta-tions Li and Ri, leading to a more asymmetricalphenotype. Note that we assume individual-specificvalues of s2
DI ;i and thus allow that DI varies amongindividuals. We also assume that the development ofboth sides is uncorrelated, i.e. that there is nocompensatory growth. Between-individual variation inthe expected phenotype as a result of differences ingenotype and/or environmental conditions during de-velopment can be assumed to follow an unknowndistribution c (top of Fig. 1). Both sides within anindividual are assumed to be affected by this between-individual phenotypic variation in an identical way. Thismodel can be formally written as
li�zðLi;s2DI ;iÞ,
ri�zðRi; s2DI ;iÞ,
whereLi�cðLþ 0:5 � D; s2
ind:Þ;
Ri�cðL� 0:5 � D;s2ind :Þ;
(ð2Þ
where L represents the average trait size across allsubjects and D reflects the degree of DA. Anymeasurement of a morphological trait is performed witherror and this measurement error can be assumed tofollow a normal distribution with zero mean andvariance equal to s2
ME (Fig. 1).

ARTICLE IN PRESS
. . . . . . . . . . . . . . . . .
........
Fig. 1. Graphical representation of the developmental model used to statistically describe trait development and measurement. Symbols and
distributions refer to the notation used in the text.
S. Van Dongen et al. / Journal of Theoretical Biology 236 (2005) 263–275266
2.2. Statistical estimation
2.2.1. Hierarchical model
To be able to estimate the different aspects of ourmodel, both sides of a bilaterally symmetric traits mustbe measured repeatedly. This has been suggested in the
pioneering work by Palmer and Strobeck (1986) andhas become general practice in the analysis of FA. Westart our model building from a mixed regressionas introduced by Van Dongen et al. (1999a). Giventhat xijk represents the kth measurement from side j onindividual i, the different sources of variation in the

ARTICLE IN PRESSS. Van Dongen et al. / Journal of Theoretical Biology 236 (2005) 263–275 267
measurements can then be modeled statistically by thefollowing hierarchical model:
1. Between indiv. variation in average size:
mi�cðb0;s2ind :Þ,
2. Between indiv. variation in DI: nij�zðmi;s2DI ;iÞ,
3. DA as fixed effect: zij ¼ b1 � sj þ nij ,
4. Measurement error: xijk�Nðzij ; s2MEÞ, ð3Þ
where sj equals �0:5 or 0.5 for measurements on the left-and right-hand side, respectively, b0 is the average traitsize, and b1 is an estimate of DA. At the first level,between individual variation in average or expected traitsize (in the absence of developmental disturbances) isassumed to follow distribution c with mean equal to b0
and variance s2ind :. Each individual expected trait size is
represented by mi. At the second level, within individualvariation between the left- and right-hand side ismodeled assuming that each trait value is a samplefrom distribution z which has a mean equal to mi (asobtained from level 1 of this model) and variance equalto s2
DI ;i, an individual-specific level of DI. This variationin individual DI will be constrained by a gammadistribution, to allow model identifiability (see nextparagraph). At the third level of this hierarchicalmodel, directional asymmetry is modeled as fixed effect,and finally, at level 4, measurement error is assumedto follow a normal distribution. This model is alsorepresented graphically in Fig. 1.
When both c and z are Gaussian, and in the absenceof any heterogeneity in the s2
DI ;i values, this modelcorresponds to a traditional hierarchical mixed regres-sion model as introduced by Van Dongen et al. (1999a)in the area of the analysis of FA. It can be analysed inmost standard statistical software packages. However,we will extend this to include heterogeneity in s2
DI ;i andto allow for non-normal distributions of developmentalerrors (z). The model will also accomodate for non-normal distributions of between-individual variation insize (i.e. c), yet this will not be the focus of this paper(see also below).
Following earlier work, variation in the s2DI ;i values
will be constrained by a gamma distribution (Houle,2000; Van Dongen, 2001). Incorporating this in ananalysis can be achieved in a Bayesian framework (VanDongen, 2001) using a so-called hyperdistribution toparametrize variation in DI in a mixture type ofapproach
s2DI ;i�gðaDI ;bDI Þ. (4)
Since the mean and variance of the g-distribution canbe expressed in terms of the two parameters (Crawley,1993), a dimension-free estimate of the amount of
variation in DI can be readily obtained as
CVDI ¼
ffiffiffiffiffiffiffiffiffiffiffiffiffiffiffiffiffiffiffiffiaDI � b2
DI
qaDI � bDI
. (5)
Fuller and Houle (2003) followed a different ap-proach assuming that variation in the s2
DI ;i valuesfollowed a log-normal distribution. Although we didnot explore this alternative, the g-distribution can beexpected to be flexible enough to show a lot of overlapwith this log-normal alternative.
2.2.2. Choice of distributions z and cWhile the degree of measurement error is usually
assumed to be normal, the shape of z and c in model (3)may be more difficult to select. In this paper we will notfocus on the choice of c, reflecting between-individualvariation in trait size, since its choice did not influencethe outcome with respect to z (data not shown). Forcomputational reasons, we modeled c as a normaldistribution for the normal and gamma error model andas a log-normal distribution for the log-normal errormodel in all the analyses below. The shape of z reflectshow a realized phenotype (li or ri) deviates from itsexpected value (Li or Ri) (see also Fig. 1). Since eachtrait develops only once, the shape of this distributioncannot be observed at the individual level in bilaterallysymmetric traits. We therefore have to make assump-tions and can only explore the sensitivity of obtainedresults against alternative distributions. In organismswith serial parts such as plants, the error distributionshould be observable. Yet, at present we have no suchdata available. Nevertheless, our model can be used toanalyse serial parts as well.
Traditional theoretical and statistical models studyingthe distribution of FA and DI have assumed that z couldbe approximated by the normal model (Palmer andStrobeck, 1986; Whitlock, 1996; Van Dongen et al.,1999a, b; Van Dongen, 1998; Houle, 2000; Fuller andHoule, 2003), the so-called normal error model:nij�Nðmi; s
2DI ;iÞ. However, since models of development
predict that—depending on the mode of growth (seeGraham et al. (2003) for details)—either the log-normalor gamma distribution are more realistic (still likelyoversimplifying) underlying distributions, we extendmodel (3) to these two distributions:
Log-normal error model: Because the natural loga-rithm of a random variable X�log-normalðZ; dÞ followsa normal distribution with mean Z and variance d, log-normality of z could be achieved using a link function,assuming that nij in Eq. (3) satisfied
logðnijÞ�Nðmi; s2DI ;iÞ (6)
Gamma error model: The gamma distribution g hastwo parameters o and k and has a mean of o� k andvariance o� k2. Therefore, the two parameters of a
ARTICLE IN PRESSS. Van Dongen et al. / Journal of Theoretical Biology 236 (2005) 263–275268
g-distribution can also be written in terms of its mean andvariance. It can be shown that nij follows a g-distribution
with mean equal to mi and variance s2DI when
nij�gðoi; kiÞ, (7)
where
oi ¼m2
i
s2DI ;i
;
ki ¼s2
DI ;i
mi
:
8>>>><>>>>:
2.2.3. Incorporating low measurement resolution
A final aspect we want to include in our statisticalmodel is low measurement resolution. As indicatedabove, Gangestad and Thornhill (2003) have shown thatestimates of the hypothetical repeatability (as a surro-gate for between-individual variation in DI) are biasedupward when measurements are made in a crude wayrelative to the degree of asymmetry. This can beincorporated in our modeling approach assuming thepresence of a latent variable TRUE � xi;j;k which reflectsthe true unobserved measurement on a continuous scaleand replacing the Measurement error model in Eq. (3)by
TRUE � xijk�Nðexpij ;s2MEÞ,
xijk ¼ roundðTRUE � xijkÞ. ð8Þ
2.3. Bayesian inference and prior distributions
Obtaining analytical expressions of maximum-like-lihood estimates for the parameters of the above-described statistical models is very cumbersome if notimpossible. On the other hand, simulation techniquesare recently becoming more and more popular incomplex statistical analyses (Gilks et al., 1996). In thispaper, we apply Monte Carlo Markov Chain (MCMC)simulations in a Bayesian framework to analyse ourmodels. We refer to Gelman et al. (1995) for a generalintroduction of Bayesian statistics and to our earlierwork for a more specific application in the area of DI(Van Dongen and Lens, 2002; Van Dongen et al., 2003).
As we have no prior information available, we appliedweak priors so that posterior distributions were onlydetermined by the data (Gelman et al., 1995). Priordistributions of b0 and b1 in Eq. (3) were normal withzero mean and variance 1000. For variances (s2
ME ands2
ind :) we used an inverse-gamma prior with shape andinverse scale equal to 0.001. Finally, hyperpriors for thehyperparameters aDI and bDI in Eq. (4) were truncatednormal distributions with mean equal to 10 and varianceequal to 1000 and zero density for negative values. In allanalyses we ran 5 independent chains with differentinitial values. The first 5000 iterations were ignored toavoid any dependence on the initial values. We then ran
another 5000 iterations to sample the posterior distribu-tions. Convergence was explored by visual inspection ofthe different chains and the use of the Gelman andRubin shrink factor (Gelman et al., 1995; Cowles andCarlin, 1996). No convergence problems were observedunless indicated otherwise.
2.4. Model selection and limitations of the presented
technique
Before applying a new method it is advisable to reflectupon the limitations of the technique. When comparingthe different models developed above, the main aspect ofinterest is the distribution of the developmental error,i.e. the shape of z, and its effect on estimates of variationin DI. Ideally, we should be able to differentiatestatistically whether a normal, log-normal or gammadistribution fits the data best and has led to the observedindividual asymmetries. However, heterogeneity in DIunder a normal error, as well as a log-normal or gammaerror distribution lead to the same characteristics in thedistribution of the signed asymmetry, namely leptokur-tosis (Graham et al., 2003). Thus, asymmetry data onbilaterally symmetrical traits do not contain the requiredinformation to separate different error models. Indeed,at the individual level and on the basis of twodatapoints—the left and right trait value—one can‘only’ estimate a mean and a variance, but not anyhigher moments which would be required to character-ize the shape of the distribution of DI. To be able todifferentiate between the three developmental errormodels, more than two ‘sides’ would be required, likein radial flower asymmetry. Therefore, in all ouranalyses we cannot formally test which of the differentmodels provides the best fit. We can, however, compareestimates of variation in DI among the differentapproaches and evaluate how close they approximatethe true underlying parameter values in the analysis ofthe simulated data. In addition, the technique can beused to explore the robustness of results obtainedpreviously assuming a normal error model. Because ofthe nature of the data—measurements on two sidesonly—the presented method should be viewed as asensitivity analysis, but can be extended to analyses oftraits which develop more than two times. We explorethe performance of the method by analysing a total of 9simulated data sets (each with and without lowmeasurement resolution). In addition, 11 empirical datasets are analysed and estimates of variation in DI arecompared for the three error distributions.
3. Analysis of simulated data sets
In this section, simulated data sets will be analysed toillustrate that our modeling approach appropriately

ARTICLE IN PRESSS. Van Dongen et al. / Journal of Theoretical Biology 236 (2005) 263–275 269
corrects for the two sources of bias in the estimation ofbetween-individual heterogeneity in DI: non-normalerror and low measurement resolution issues.
3.1. Data description
We simulated data sets with different degrees ofheterogeneity in the underlying DI and assuming eithera normal, log-normal or gamma distribution for thedevelopmental errors. Each data set was analysed underthe assumption of the three different developmentalerror models to evaluate how estimates of variation inDI are biased by a different model choice. Secondly, wesimulated low measurement resolution by rounding theobservations in the simulated data sets to the nearestinteger. We then analysed these data sets with andwithout correcting for low measurement resolution.
Normal error: We simulated a data set of 1000individuals where both sides were measured twice.The kth measurement on side j of individual i wasgiven by
xijk ¼ b0½i þ sidej � b1½i þ �ijk, (9)
where
b0½i�Nð1; 0:25Þ;
b1½i�Nð0; 0:5Þ;
�ijk�Nð0; 0:1Þ:
8><>:
In this data set, further called ‘Normal 1’, hetero-geneity in DI was absent. Heterogeneity in DI wasintroduced by modeling b1½i�Nð0;DI ½iÞ and DI ½i�
either gð2; 1Þ (‘Normal 2’) or gð0:5; 1Þ (‘Normal 3’). Theunderlying true CVDI values equaled 0, 0.707 and 1.41,respectively.
Log-normal error: A data set of 1000 individualswas simulated where both sides were measured twice.The kth measurement on side j of individual i wasgiven by
xijk ¼ eb0½iþsidej�b1½i þ �ijk, (10)
where
b0½i�Nð1; 0:25Þ;
b1½i�Nð0; 0:5Þ;
�ijk�Nð0; 0:1Þ:
8><>:
This data set, further called ‘log-normal 1’, showed noheterogeneity in individual DI. A second data set using alog-normal error structure was simulated in a similarway as ‘Log-normal 1’, but including between individualheterogeneity in DI. Data were obtained as in Eq. (10),but where b1½i�Nð0;DI ½iÞ and DI ½i�gð1; 2Þ. As aconsequence, the mean and variance of this distributionof DI equaled 2 and 4, resp., with an expected CV of0.707 (‘Log-normal 2’). Finally, a model whereDI ½i�gð0:5; 1Þ was simulated and analysed (‘log-normal3’). The expected mean and variance of the distributionof variation in DI equaled both 0.5 with a CV of 1.41.
Gamma error: Three data sets were generated with agamma error structure. In a first data set, further called‘gamma 1’, no heterogeneity in individual DI wassimulated. Data were obtained for 1000 individualswhere the kth measurement on side j of individual i wasgiven by
xijk ¼ zij þ �ijk, (11)
where
zij�gðai;biÞ;
ai ¼m2
i
s2DI ;i
;
bi ¼s2
DI ;i
mi
;
mi�Nð5; 0:25Þ;
s2DI ;i ¼ 0:5;
�ijk�Nð0; 0:1Þ:
8>>>>>>>>>>>>>><>>>>>>>>>>>>>>:
In a second data set, ‘gamma 2’, heterogeneity in DIwas simulated by sampling individual levels of DI ass2
DI ;i�gð2; 2Þ, leading to an expected mean and varianceof s2
DI of 4 and 8, resp., and a CV of 0.707. In a thirddata set, ‘gamma 3’, higher levels of heterogeneity in DIwere simulated as s2
DI ;i�gð0:5; 2Þ, leading to an expectedmean and variance of s2
DI of 1 and 2, resp., and a CVof 1.41.
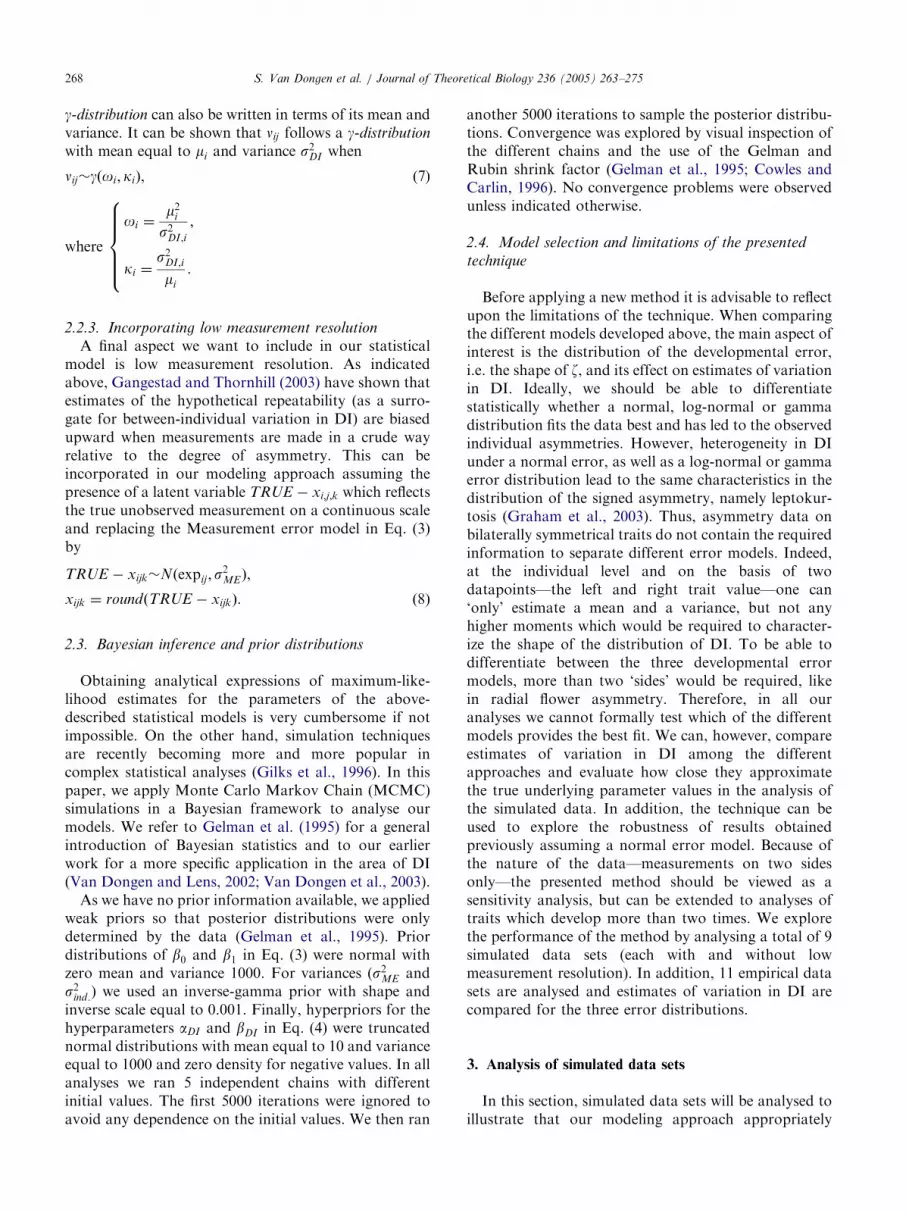
3.2. Results
Estimates of the hypothetical repeatability and theamount of variation in DI (CV) are summarized inTables 1 and 2. Three patterns can be observed. First,estimates of CVDI more closely reflected the trueunderlying values when the real underlying errordistribution was used in the statistical analysis. Theeffect of misspecification of the error distribution wasstrongest when the real error distribution was log-normal. For example, in data set ‘Log-normal 1’ wherethe true value of CVDI equaled zero, its estimate equaled1.04 when the normal error model was employed.Likewise, estimates of the hypothetical repeatabilitywere most strongly overestimated in this situation. Theconsequences of misspecifying the distribution of devel-opmental errors was much smaller in all other cases.More specifically, estimates of R and CV DI under thenormal error model appeared nearly unbiased when thedata was simulated using a g-distribution.
Second, when crude data are generated throughrounding to the nearest integer, the amount of bias inestimates of R and CVDI appeared to be limited. Failingto take this in to account only occasionally led toslightly higher estimates of R and CVDI . Nevertheless,the mean of the unsigned asymmetry was often smallerthan the unit of measurement (i.e. 1), a pre-requisitefor high biases in the simulations by Gangestad
ARTICLE IN PRESS
Table 1
Estimates of variation in developmental instability (CVDI ) and hypothetical repeatability ðRÞ from analyses of the simulated data sets
Data set TRUE CVDI R Posterior means (SE) of CVDI
Normala Log-normala Gammaa
Normal 1b 0 0 0.24 (0.05) 0.37 (0.07) 0.11 (0.04)
Normal 2b 0.707 0.12 0.713 (0.09) 0.74 (0.08) 0.57 (0.05)
Normal 3b 1.41 0.26 1.31 (0.11) 1.25 (0.10) 1.14 (0.09)
Log-normal 1b 0 0.31 1.04 (0.06) 0.09 (0.08) 0.25 (0.07)
Log-normal 2b 0.707 0.57 1.42 (0.05) 0.66 (0.07) 0.61 (0.04)
Log-normal 3b 1.41 0.55 NCc1.43 (0.06) 1.38 (0.07)
Gamma 1b 0 0 0.18 (0.05) 0.21 (0.09) 0.11 (0.03)
Gamma 2b 0.707 0.17 0.719 (0.08) 0.722 (0.08) 0.706 (0.05)
Gamma 3b 1.41 0.40 1.36 (0.06) 1.30 (0.06) 1.40 (0.06)
aUnderlying distribution of the error associated with trait development.bSee text for details. Results from correct models are indicated in bold.cMCMC did not converge.
Table 2
Estimates of variation in developmental instability (CVDI ) and hypothetical repeatability ðRÞ from analyses of the simulated data sets including low
measurement resolution
Data set TRUE CVDI R Mean FA Posterior means (SE) of CVDI
Error distributiona Normal Normal Log-normal Gamma
Low measurement resolution correctionb No Yes Yes Yes
Normal 1c 0 0.13 0.66 0.29 (0.10) 0.19 (0.10) 0.42 (0.09) 0.13 (0.07)
Normal 2c 0.707 0.16 1.06 0.57 (0.10) 0.59 (0.09) 0.57 (0.10) 0.50 (0.07)
Normal 3c 1.41 0.34 0.55 1.26 (0.08) 1.25 (0.09) 1.02 (0.06) 1.14 (0.13)
Error distributiona Normal Log-normal Log-normal Gamma
Low measurement resolution correctionb No Yes Yes Yes
Log-normal 1c 0 0.37 1.65 1.00 (0.07) 0.22 (0.07) 0.10 (0.03) 0.20 (0.08)
Log-normal 2c 0.707 0.58 2.08 1.32 (0.06) 0.61 (0.09) 0.58 (0.09) 0.43 (0.05)
Log-normal 3c 1.41 0.59 1.69 1.72 (0.07) 1.36 (0.06) 1.37 (0.06) 1.44 (0.07)
Error distributiona Normal Log-normal Gamma Gamma
Low measurement resolution correctionb No Yes Yes Yes
Gamma 1c 0 0.07 0.84 0.16 (0.07) 0.25 (0.07) 0.15 (0.06) 0.16 (0.06)
Gamma 2c 0.707 0.18 2.17 0.71 (0.08) 0.67 (0.08) 0.66 (0.06) 0.65 (0.06)
Gamma 3c 1.41 0.40 1.87 1.42 (0.07) 1.32 (0.06) 1.44 (0.06) 1.40 (0.06)
aUnderlying distribution of the error associated with trait development.bModel with or without correction for rounding off errors.cSee text for details. Results from correct models are indicated in bold.
S. Van Dongen et al. / Journal of Theoretical Biology 236 (2005) 263–275270
and Thornhill (2003). Since the effect of failing tocorrect for low measurement resolution appeared to beneglectable, we ignored this aspect for the analyses ofempirical data sets.
Thirdly, estimates of CVDI were always positive, evenwhen the data were simulated without any underlying
variation in DI (true CVDI ¼ 0). This is an inherentproperty of the model. Variation in developmental erroris modeled using a g-distribution which by definition haspositive variance. However, since we cannot evaluatemodel fit (see above) we cannot formally test thestatistical significance of heterogeneity in DI.

ARTICLE IN PRESSS. Van Dongen et al. / Journal of Theoretical Biology 236 (2005) 263–275 271
4. Analysis of empirical data: A sensitivity analysis of the
normal error model
We estimated the amount of between-individualvariation in DI for asymmetry data in six species anda total of 11 traits (Table 3). Estimates of thehypothetical repeatability varied between 0.11 and0.60. In two cases, the estimate of R was highlyinfluenced by a single observation. After removing the
Table 3
Overview of characteristics of empirical data sets
Species Trait # Ind.
Turdus helleri Tarsus length 357
Turdus helleri Eye-patch length 236
Pogonocichla stellata Tarsus length 1248
Pogonocichla stellata Pre-occular feathering length 311
Parus major Tarsus length 430
Carduelis chloris Femur length 457
Carduelis chloris Femur length 456a
Carduelis chloris Carpometacarpus 457
Carduelis chloris Humerus length 457
Carduelis chloris Ischiadic foramen size 457
Operophtera brumata Tibia length 700
Plodia interpunctella Tibia length 432
Plodia interpunctella Tibia length 431a
References. 1—Lens and Van Dongen (1999); 2—Karvonen et al. (2003); 3—aAfter removing one outlier.
Table 4
Bayesian estimates (posterior means (SE)) of coefficients of variation in DI
distributions
Species Trait Ra
Turdus helleri
Tarsus 0.37
Patch 0.45
Pogonocichla stellata
Tarsus 0.48
Feather 0.44
Parus major
Tarsus 0.30
Carduelis chloris
Femur 0.60
Femurc 0.31
Carpometacarpus 0.50
Humerus 0.31
Ischiadic foramen size 0.11
Operophtera brumata
Tibia 0.28
Plodia interpunctella
Tibia 0.58
Tibiac 0.20
aHypothetical repeatability.bUnderlying distribution of the error associated with trait development.cExcluding one outlier.
outliers in these two data sets, the values of R decreasedby at least 50% (Table 4). All data sets (including andexcluding outliers) were analysed under the threedevelopmental error models introduced in this paperand estimates of between-individual variation in DI areprovided in Table 4.
The highest estimate of CV DI assuming a normalerror model was observed for tarsus length in Pogonoci-
chla stellata and equaled 205%. Under the two
# Of repeats Origin References
2 Taita Hills, Kenia 1
2 Taita Hills, Kenia 1
2 Taita Hills, Kenia 1
2 Taita Hills, Kenia 1
3 North Belgium Unpubl.
3 Europe 2
3 Europe 2
3 Europe 2
3 Europe 2
3 Europe 2
2 North Belgium 3
2 Lund 4
2 Lund 4
Van Dongen et al. (2001) and 4—Van Dongen et al. (1999c).
in empirical data sets from models with different developmental error
Normalb Log-normalb Gammab
1.65 (0.13) 1.61 (0.08) 1.43 (0.11)
1.94 (0.15) 1.91 (0.13) 1.88 (0.15)
2.05 (0.07) 1.52 (0.07) 1.72 (0.12)
1.86 (0.12) 1.74 (0.10) 1.54 (0.11)
0.91 (0.10) 0.92 (0.04) 0.89 (0.11)
1.67 (0.07) 1.78 (0.06) 1.56 (0.06)
1.56 (0.05) 1.64 (0.07) 1.45 (0.05)
1.29 (0.06) 1.40 (0.04) 1.09 (0.06)
1.32 (0.05) 1.43 (0.04) 0.99 (0.05)
0.90 (0.07) 0.74 (0.07) 0.57 (0.07)
1.15 (0.05) 1.07 (0.04) 1.36 (0.05)
1.34 (0.07) 1.20 (0.05) 1.06 (0.05)
1.31 (0.06) 1.16 (0.05) 0.98 (0.05)

ARTICLE IN PRESS
.......
.
.
.
.
.
.
.
.
.
.
Fig. 3. Association between the hypothetical repeatability and
coefficient of variation in developmental instability in the empirical
data sets.
S. Van Dongen et al. / Journal of Theoretical Biology 236 (2005) 263–275272
alternative error models, the lowest estimate equaled152% and was obtained when assuming a log-normaldistribution.
For the great tit data set, estimates of variation in DIwere very similar for all three distributions of develop-mental error. The analysis of the greenfinch data showedthat the estimates of CV DI do not always becomesmaller with the log-normal distribution for develop-mental errors compared to the Gaussian distribution. Inboth traits, the estimates were slightly higher. Under theg-distribution error model, estimates of CV DI weresomewhat smaller, yet still larger than 100%. For thewinter moth data, the estimate of CVDI under theg-distribution error model was highest.
In two data sets, exploration of the distribution of theunsigned asymmetries suggested the presence of 1outlying observation which could not be attributed toan exceptionally high degree of ME (see also above).Unsigned femur asymmetries in the greenfinch ranged
........
.
.
.
.
. . . . . .
.
.
.
.
Fig. 2. Posterior distributions of between-individual heterogeneity in
developmental instability for greenfinch femur length (top) and Indian
meal moth tibia length (bottom). For both traits, analyses were
performed on the complete data set (gray bars) and after removing one
presumed outlier (black bars).
between 0 and 0.5, while the outlying asymmetry valueequaled 2.8. For tibia asymmetry in the Indian mealmoth, all but one observations ranged between 0 and0.23, while the outlying asymmetry value equaled 1.28.The effect of them on the estimate of the hypotheticalrepeatability was strong. However, analysing both thecomplete data set and the one after removing the outlierhardly affected the estimates of the amount of variationin DI. Both data sets with an without the outliers inboth species yielded nearly identical distributions ofvariation in DI (Fig. 2). This result suggests that underthe given model conditions, the presumed outlyingasymmetry values hardly affect estimates of variationin DI and have hardly any influence on the estimatedg-distribution which models variation in DI. As aconsequence there is a high discrepancy betweenestimates of R and CVDI (Fig. 3). The r-squared valueof the association between R and CVDI was smaller than40% for each developmental error model. CVDI relatedin a similar way to R under the three error models, buton average the regression line of the normal error modelwas highest, the one from the gamma error model thelowest (Fig. 3).
5. Discussion
The estimation of DI by FS, and how it relates tostress has been the subject of many debates (see forexample several reviews in Polak, 2003). There appearsto be a huge amount of variation in the observedassociations between FA and stress and fitness as well asin estimates of the heritability of FA, while little isknown about its causes. To some extent, this may be dueto our lack of knowledge about the underlying devel-opmental mechanisms that control the stability of a

ARTICLE IN PRESSS. Van Dongen et al. / Journal of Theoretical Biology 236 (2005) 263–275 273
developing trait. Yet, some progress has been made tounderstand and explain the observed patterns throughmathematical/statistical modeling. Based on statisticalarguments, it has been suggested that FA should only beweakly correlated with DI (Whitlock, 1996, 1998;Houle, 2000). These statistical models and variationsupon them (Van Dongen, 1998; Gangestad and Thorn-hill, 1999), assume that developmental error follows aGaussian distribution which may be incorrect and maylead to upward biases in estimates of variation in DI andfalse interpretations of patterns in FA (Graham et al.,2003). The statistical models presented and applied inthis paper, extends earlier work to include the log-normal and g-distribution of developmental errors,providing unbiased estimates of between-individualvariation in DI. In addition, we correct the estimatesof variation in DI for low measurement resolution.
Analysis of simulated data sets indicated that failingto correct for low measurement resolution is unlikely tocause high upward bias of estimates of variation in DI,which is in contrast with earlier results (Gangestad andThornhill, 2003). Our simulations differ from theprevious ones in three ways. First, we simulated datawith repeated measurements on both sides. This can beexpected to have reduced the discreteness of thedistribution of asymmetry and thus the amount ofupward bias. Second, we focus on the estimation ofCVDI . Possibly, it is less sensitive to the discreteness ofthe data relative to R. Third, we assume that between-individual heterogeneity in DI follows a g- instead of aGaussian distribution. The g-distribution has often beenused to model variability in variances (i.e. DI) and is amore realistic candidate distribution having only massfor positive values and being more flexible in shape. Ourresults thus indicate that we can ignore the effects of lowmeasurement resolution and that the estimation ofCVDI is robust against discreteness of the distributionof asymmetry.
Misspecification of the distribution of the develop-mental error on the other hand, could result in verystrong overestimation of variation in DI, especiallywhen the underlying distribution is log-normal while theanalysis is based on the ‘classic’ normal error model.The upward bias of estimates of variation in DI underthe normal error model when the true developmentalerror follows a g-distribution, appeared to be very small.This was not unexpected since both the normal andg-distribution assume additivity of the developmentalerrors (Graham et al., 2003).
Analyses of empirical data sets indicated that the veryhigh amounts of variation in DI, as suggested by theresults from the normal error model, do not diminish toa large extent when the alternative distributions areused. So even if the log-normal- and/or g-distribution
indeed more closely approximate the true underlyingdistribution of developmental errors, our results confirm
that the amount of variation in DI is much larger thanobserved in most other traits (Houle, 2000). Asindicated above, based on two trait sides per individual,it is impossible to statistically explore the fit of thedifferent alternative distributions of developmentalerrors. Traits that develop more than twice within anindividual under exactly the same environmental condi-tions could be of high interest for further study.
Our approach parametrizes between-individual varia-tion in DI through a g-distribution, a method that hasbeen used before and has been shown to be very flexible(Houle, 2000; Van Dongen, 2001). In the simulated datasets, heterogeneity in DI was also generated throughg-distributions so that this model assumption was apriori correct. Nevertheless, the choice of modelingheterogeneity in DI through a g-distribution may havebeen inappropriate for the empirical data sets, and wehave no means of evaluating this choice. This couldinvalidate results for empirical data sets to some extent.One result that could indicate that the g-distributionrelatively closely reflects the underlying biologicalheterogeneity in DI, is that apparent outlying asymme-try values did not strongly influence estimates ofvariation in DI. In two data sets, a single FA valuehad a strong influence on estimates of the hypotheticalrepeatability, yet hardly affected estimates of variationin DI. Nearly identical posterior distributions ofvariation in s2
DI ;i were obtained in analyses with andwithout the outlying FA value. This result also suggeststhat the rare high values of FA that are sometimesobserved correspond to relatively rare high values of DI(variances) which in turn are not unexpected under thehighly skewed g-distributions of variation in DI. Thus,our model can ‘explain’ the occurrence of rare high FAvalues within a single framework. Nevertheless, weshould keep in mind that an agreement of results with abiological explanation does not demonstrate its correct-ness (Palmer and Strobeck, 2003). Statistical models canbe used to explore the effects of particular distributionalassumptions, but cannot replace knowledge about theunderlying developmental mechanisms.
Our model can be extended and explored further inmany different ways:
First, heterogeneity in measurement error can beincorporated in a similar way as introduced in VanDongen et al. (2003). In the presence of heterogeneityin ME, this would lead to better estimates ofindividual asymmetry and thus improved estimatesof variation in DI. Second, estimates of individual DI (s2DI ;i in Eq. (3))can be used to obtain unbiased estimates of associa-tions with other variables reflecting for examplefitness or genetic variation. Van Dongen (2001) haveprovided a Bayesian framework to achieve this.Incorporating this aspect in the model presented here

ARTICLE IN PRESSS. Van Dongen et al. / Journal of Theoretical Biology 236 (2005) 263–275274
would allow to perform a sensitivity analysis of theestimates of associations between DI and othervariables under the different distributions of develop-mental errors.
Third, our modeling approach assumes an underlyingg-distribution to model between-individual variationin DI. Although the g-distribution is very flexible, hasbeen used in this context before, and appears tobehave appropriately here (see above), it might not beadequate for other data sets. Van Dongen and Lens(2002) have introduced an approach to model DI as ajoint process of developmental noise and develop-mental stability. Between-individual variation in DIwas modeled through variation in developmentalstability, which was assumed to follow ab-distribution, which may be more flexible than theg-approach applied in this paper. Nevertheless, bothways of modeling heterogeneity in DI resulted inhighly skewed distribution. Finally, as indicated above, we assumed that traitvalues on left- and right-hand side can be consideredas independent samples from the same distribution z.The sensitivity of our results against the presence ofcorrelated development and compensatory growthmechanisms needs to be explored.6. Concluding remarks
We provide a statistical framework to model threedifferent distributional assumptions of developmentalerrors. Extensive exploration of simulated data setsindicated that the normal error model is relativelyrobust against the g alternative, but that log-normaldistributions of developmental errors could result inhigh bias if not appropriately corrected for. Weconclude that after taking into account possible non-normal distributions of developmental error, estimatesof between-individual variation in DI remain high. It isimportant to stress that our results do not prove thatvariation in DI is exceptionally high in some cases. Yet,it indicates that recently noted mechanisms of upwardbiases are insufficient to explain the high observedestimates. If our model assumptions on the other handare realistic and approximate the underlying phenomenasufficiently well, we have provided and applied astatistical tool that allows flexible and robust evaluationof heterogeneity in DI and to study its importance inexplaining the observed heterogeneity in FA-stressassociations. More specifically, the low evolutionarypotential reported in both the winter moth (Van Dongenet al., 1999c) and the Indian meal moth (Van Dongen etal., 2001) in spite of relative high estimates of thehypothetical repeatability (Table 4), cannot be attrib-uted to non-normality of the distribution of develop-mental errors. The generally high estimates of variability
in the underlying individual DI found here suggests thatrelative strong associations between FA and fitness aswell as relatively high heritabilities can be expected, butcertainly not generally found.
Acknowledgements
We obtained financial support from a Research Grant(G.0440.03) of the Fund for Scientific Research—Flanders (Belgium) (F.W.O. Vlaanderen). This manu-script was prepared with the AAS LATEX macros v5.2.
References
Cowles, M.K., Carlin, B.P., 1996. Markov chain Monte Carlo
convergence diagnostics: a comparative review. J. Am. Statist.
Assoc. 91, 883–904.
Crawley, M.J., 1993. Glim for Ecologists. Blackwell, London.
Fuller, R.C., Houle, D., 2003. Inheritance of developmental instability.
In: Polak, M. (Ed.), Developmental Instability: Causes and
Consequences. Oxford University Press, Oxford.
Gangestad, S.W., Thornhill, R., 1999. Individual differences in
developmental precision and fluctuating asymmetry: a model and
its implications. J. Evol. Biol. 12, 402–416.
Gangestad, S.W., Thornhill, R., 2003. Fluctuating asymmetry,
developmental instability, and fitness: towards model-based inter-
pretation. In: Polak, M. (Ed.), Developmental Instability: Causes
and Consequences. Oxford University Press, Oxford.
Gelman, A., Carlin, J.B., Stern, H.S., Rubin, D.B., 1995. Bayesian
Data Analysis. Chapman & Hall, London.
Gilks, W.R., Richardson, S., Spiegelhalter, D.J., 1996. Markov Chain
Monte Carlo in Practice. Chapman & Hall, London.
Graham, J.H., Shimizu, K., Emlen, J.M., Freeman, D.C., Merkel, J.,
2003. Growth model and the expected distribution of fluctuating
asymmetry. Biol. J. Linn. Soc. 80, 57–65.
Houle, D., 1997. Comment on a meta-analysis of the heritability of
developmental stability by Miller and Thornhill. J. Evol. Biol. 10,
17–20.
Houle, D., 2000. A simple model of the relationship between
asymmetry and developmental stability. J. Evol. Biol. 13, 720–730.
Karvonen, E., Merila, J., Rintamaki, P.T., Van Dongen, S., 2003.
Geography of fluctuating asymmetry in the Greenfinch (Carduelis
chloris). Oikos 100, 507–516.
Klingenberg, C.P., 2003. A developmental perspective on develop-
mental instability: theory, models, and mechanisms. In: Polak, M.
(Ed.), Developmental Instability: Causes and Consequences.
Oxford University Press, Oxford.
Klingenberg, C.P., Barluenga, M., Meyer, A., 2002. Shape analysis of
symmetric structures: quantifying variation among individuals and
asymmetry. Evolution, 55, 2342–2352.
Lens, L., Van Dongen, S., 1999. Evidence for organism-wide
asymmetry in five bird species of a fragmented afrotropical forest.
Proc. R. Soc. B London 266, 1055–1060.
Nijhout, H.F., Davidowitz, G., 2003. Developmental perspectives on
phenotypic variation, canalization, and fluctuating asymmetry. In:
Polak, M. (Ed.), Developmental instability: causes and conse-
quences. Oxford University Press, Oxford.
Palmer, A.R., Strobeck, C., 1986. Fluctuating asymmetry: measure-
ment, analysis, patterns. Annu. Rev. Ecol. Syst. 17, 391–421.
Palmer, A.R., Strobeck, C., 2003. Fluctuating asymmetry analysis
revisited. In: Polak, M. (Ed.), Developmental Instability: Causes
and Consequences. Oxford University Press, Oxford.

ARTICLE IN PRESSS. Van Dongen et al. / Journal of Theoretical Biology 236 (2005) 263–275 275
Polak, M., 2003. Developmental Instability: Causes and Conse-
quences. Oxford University Press, Oxford.
Van Dongen, S., 1998. How repeatable is the estimation of fluc-
tuating asymmetry? Proc. R. Soc. London, Ser. B 265, 1423–1427.
Van Dongen, S., 2001. Modeling developmental instability in relation
to individual fitness: a fully Bayesian latent variable model
approach. J. Evol. Biol. 14, 552–563.
Van Dongen, S., Lens, L., 2000. The evolutionary potential of
developmental instability. J. Evol. Biol. 3, 326–335.
Van Dongen, S., Lens, L., 2002. Modelling developmental in-
stability as the joint action of noise and stability: a Bayesian
approach. BMC Evol. Biol. 2, 11 (available from http://www.
biomedcentral.com/1471-2148/2/11).
Van Dongen, S., Molenberghs, G., Matthysen, E., 1999a. The
statistical analysis of fluctuating asymmetry: REML estimation
of a mixed regression model. J. Evol. Biol. 12, 94–102.
Van Dongen, S., Lens, L., Molenberghs, G., 1999b. Mixture analysis
of asymmetry: modeling directional asymmetry, antisymmetry and
heterogeneity in fluctuating asymmetry. Ecol. Lett. 6, 387–396.
Van Dongen, S., Sprengers, E., Lofstedt, L., Matthysen, E., 1999c.
Heritability of tibia fluctuating asymmetry and developmental
instability in the winter moth (Operophtera brumata L.) (Lepidop-
tera, Geometridae). Heredity 82, 535–542.
Van Dongen, S., Sprengers, E., Lofstedt, C., 2001. Lack of
evolutionary potential of developmental stability in the
Indian meal moth Plodia interpunctella. Belgian J. Zool. 131,
75–82.
Van Dongen, S., Lens, L., Molenberghs, G., 2003. Recent develop-
ments and shortcomings in the analysis of individual asymmetry: a
review and introduction of a Bayesian statistical approach. In:
Polak, M. (Ed.), Developmental Instability: Causes and Conse-
quences. Oxford University Press, Oxford.
Whitlock, M., 1996. The heritability of fluctuating asymmetry and the
genetic control of developmental stability. Proc. R. Soc. London,
Ser. B 263, 849–854.
Whitlock, M., 1998. The repeatability of fluctuating asymmetry:
a revision and extension. Proc. R. Soc. London, Ser. B 265,
1428–1430.